Role of Conventional Chemosensitivity Test and Tissue Biomarker Expression in Predicting Response to Treatment of Peritoneal Carcinomatosis From Colon Cancer Chiara Arienti, 1 Anna Tesei, 1 Giorgio Maria Verdecchia, 2 Massimo Framarini, 2 Salvatore Virzì, 3 Antonio Grassi, 3 Emanuela Scarpi, 1 Livia Turci, 1 Rosella Silvestrini, 1 Dino Amadori, 1 Wainer Zoli 1 Abstract Peritoneal carcinomatosis (PC) is observed in approximately 10% of patients with colorectal cancer at the time of primary cancer resection. Most of these patients receive 5-fluorouracil (5-FU)- or oxaliplatin-contain- ing chemotherapy regimens as first-, second-, or third-line treatment. In the present study, sensitivity and resistance to drugs used to treat PC were better defined by a conventional chemosensitivity test than by biomarker expression. Background: 5-Fluorouracil- or oxaliplatin-based regimens are the treatments of choice in patients with PC from colon cancer. There are currently no useful preclinical evaluations to guide the decision-making process for tailored therapy. The aim of the present study was to compare the advantages and limits of a conventional in vitro chemosensitivity test with those of a panel of biomolecular markers in predicting clinical response to different drugs used to treat colon cancer-derived PC. Patients and Methods: Fresh surgical biopsy specimens were obtained from 28 patients with peritoneal carcinomatosis from colon cancer. TS, TP, DPD, MDR1, MRP-1, MGMT, BRCA1, ERCC1, GSTP1, and XPD gene expression levels were determined by real-time reverse transcription polymerase chain reaction. An in vitro chemosensitivity test was used to define a sensitivity or resistance profile to the drugs used to treat each patient. Results: Expression levels of the genes analyzed were generally poorly related to each other. TS and ERCC1 expression was inversely related to response to 5-FU-and/or oxaliplatin-containing regimens. Significant predictivity in terms of sensitivity but poor predictivity of resistance (56.2%) (P .037) were observed for ERCC1 expression (90%), and high predictivity of resistance (100%) but very low predictivity of sensitivity (40%) (P .014) were registered for TS. The best overall and significant predictivity was observed for chemosensitivity test results (62.5% sensitivity and 89% resistance; P .005). Conclusions: Sensitivity and resistance to drugs used in vivo was better defined by the chemosensitivity test than by biomarker expression. Clinical Colorectal Cancer, Vol. 12, No. 2, 122-7 © 2013 Elsevier Inc. All rights reserved. Keywords: Colon cancer, ERCC1, In vitro chemosensitivity test, Peritoneal carcinomatosis, Response prediction, TS Introduction Colorectal cancer is the second leading cause of cancer death in North America and Western Europe. 1 The advent of new, effective chemotherapeutic agents in clinical practice has increased median survival by up to 20 months in advanced disease. This result, how- ever, is not obtainable in patients with peritoneal carcinomatosis (PC), which despite advances in the early detection of the primary tumor, is still observed in approximately 10% of patients at the time 1 Biosciences Laboratory, IRCCS Istituto Scientifico Romagnolo per lo Studio e la Cura dei Tumori (IRST), Meldola, Italy 2 Department of Surgery and Advanced Cancer Therapies, Morgagni-Pierantoni Hospital, Forlì, Italy 3 Department of Surgery, Bentivoglio Hospital, Bologna, Italy Submitted: Jul 25, 2012; Revised: Oct 2, 2012; Accepted: Nov 26, 2012; Epub: Jan 16, 2013 Address for correspondence: Wainer Zoli, PhD, IRCCS Istituto Scientifico Romagnolo per lo Studio e la Cura dei Tumori (IRST), via Maroncelli 40, 47014 Meldola (FC), Italy Fax: 39-0543-739221; e-mail contact: [email protected] Original Study 122 Clinical Colorectal Cancer June 2013 1533-0028/$ - see frontmatter © 2013 Elsevier Inc. All rights reserved. http://dx.doi.org/10.1016/j.clcc.2012.11.006

Welcome message from author
This document is posted to help you gain knowledge. Please leave a comment to let me know what you think about it! Share it to your friends and learn new things together.
Transcript

C
H
Original Study
122
Role of Conventional Chemosensitivity Test andTissue Biomarker Expression in Predicting
Response to Treatment of PeritonealCarcinomatosis From Colon Cancer
Chiara Arienti,1 Anna Tesei,1 Giorgio Maria Verdecchia,2 Massimo Framarini,2
Salvatore Virzì,3 Antonio Grassi,3 Emanuela Scarpi,1 Livia Turci,1
Rosella Silvestrini,1 Dino Amadori,1 Wainer Zoli1
AbstractPeritoneal carcinomatosis (PC) is observed in approximately 10% of patients with colorectal cancer at thetime of primary cancer resection. Most of these patients receive 5-fluorouracil (5-FU)- or oxaliplatin-contain-ing chemotherapy regimens as first-, second-, or third-line treatment. In the present study, sensitivity andresistance to drugs used to treat PC were better defined by a conventional chemosensitivity test than bybiomarker expression.Background: 5-Fluorouracil- or oxaliplatin-based regimens are the treatments of choice in patients with PC fromcolon cancer. There are currently no useful preclinical evaluations to guide the decision-making process for tailoredtherapy. The aim of the present study was to compare the advantages and limits of a conventional in vitrochemosensitivity test with those of a panel of biomolecular markers in predicting clinical response to different drugsused to treat colon cancer-derived PC. Patients and Methods: Fresh surgical biopsy specimens were obtained from28 patients with peritoneal carcinomatosis from colon cancer. TS, TP, DPD, MDR1, MRP-1, MGMT, BRCA1, ERCC1,GSTP1, and XPD gene expression levels were determined by real-time reverse transcription polymerase chainreaction. An in vitro chemosensitivity test was used to define a sensitivity or resistance profile to the drugs used totreat each patient. Results: Expression levels of the genes analyzed were generally poorly related to each other. TSand ERCC1 expression was inversely related to response to 5-FU-and/or oxaliplatin-containing regimens. Significantpredictivity in terms of sensitivity but poor predictivity of resistance (56.2%) (P � .037) were observed for ERCC1expression (90%), and high predictivity of resistance (100%) but very low predictivity of sensitivity (40%) (P � .014)were registered for TS. The best overall and significant predictivity was observed for chemosensitivity test results(62.5% sensitivity and 89% resistance; P � .005). Conclusions: Sensitivity and resistance to drugs used in vivo wasbetter defined by the chemosensitivity test than by biomarker expression.
Clinical Colorectal Cancer, Vol. 12, No. 2, 122-7 © 2013 Elsevier Inc. All rights reserved.
Keywords: Colon cancer, ERCC1, In vitro chemosensitivity test, Peritoneal carcinomatosis, Response prediction, TSIntroductionColorectal cancer is the second leading cause of cancer death in
North America and Western Europe.1 The advent of new, effectivechemotherapeutic agents in clinical practice has increased median
1Biosciences Laboratory, IRCCS Istituto Scientifico Romagnolo per lo Studio e laura dei Tumori (IRST), Meldola, Italy
2Department of Surgery and Advanced Cancer Therapies, Morgagni-Pierantoniospital, Forlì, Italy
3Department of Surgery, Bentivoglio Hospital, Bologna, Italy
Clinical Colorectal Cancer June 2013
survival by up to 20 months in advanced disease. This result, how-ever, is not obtainable in patients with peritoneal carcinomatosis(PC), which despite advances in the early detection of the primarytumor, is still observed in approximately 10% of patients at the time
Submitted: Jul 25, 2012; Revised: Oct 2, 2012; Accepted: Nov 26, 2012; Epub: Jan16, 2013
Address for correspondence: Wainer Zoli, PhD, IRCCS Istituto Scientifico Romagnoloper lo Studio e la Cura dei Tumori (IRST), via Maroncelli 40, 47014 Meldola (FC), Italy
Fax: �39-0543-739221; e-mail contact: [email protected]1533-0028/$ - see frontmatter © 2013 Elsevier Inc. All rights reserved.http://dx.doi.org/10.1016/j.clcc.2012.11.006

atb(can
tc
so
5
g6wHRo
ieMic
of primary cancer resection.2 In the past, PC was considered a ter-minal disease, with systemic chemotherapy and palliative surgeryused as standard treatment. However, a better understanding of PCbiology and improved surgical techniques have confirmed that, al-though peritoneal dissemination is a late manifestation of cancer, thedisease is largely confined to peritoneal surfaces. In recent years, anew multimodal therapeutic approach has been introduced, combin-ing aggressive cytoreductive surgery to remove macroscopic diseaseand perioperative intraperitoneal chemotherapy immediately aftersurgery under normal or hyperthermic conditions. This type of sur-gery, combined with locoregional chemohyperthermia, has changedthe natural history of carcinomatosis of colorectal origin, resulting in22%-49% of long-term survivors.3,4
The most frequently used drugs for locoregional treatment of PCare mitomycin C and cisplatin, singly or in combination. Otheragents have also been used in a few phase I-II studies: oxaliplatin,doxorubicin, irinotecan, tumor necrosis factor inhibitors, carboplatin,and gemcitabine. Recent clinical protocols have used bidirectional treat-ments comprising simultaneous intraperitoneal and intravenous 5-fluo-rouracil (5-FU) and leukovorin in association with intraperitoneal peri-operative oxaliplatin under hyperthermic conditions.4
In the 1950s a number of chemosensitivity tests were developedfor use in fresh surgical material to assess drug activity in individualtumors and to facilitate the planning of tailored therapy.5 The resultsobtained from different tests have been extensively analyzed and theirreliability has been verified in translational clinical studies.6-9 Thessays are based on clonogenic potential, 3H-thymidine incorpora-ion, or cell viability evaluation (dye exclusion, sulphorhodaminelue, 3-(4,5-dimethylthiazol-2-yl)-2,5-diphenyltetrazolium bromideMTT) assay, and adenosine-5’-triphosphate (ATP) biolumines-ence).10-15 We chose the sulforhodamine B (SRB) assay because it isn efficient and highly cost-effective method for screening a highumber of drugs.16,17
Recently, a number of molecular and genetic markers have beenproposed as prognostic or predictive indicators of sensitivity or resis-tance to conventional and targeted drugs.18,19 In particular, a quan-itative gene expression assay has been shown to predict benefit fromhemotherapy in patients with early stage colorectal cancer.20 Mark-
ers involved in increasing DNA repair and in enhancing drug effluxand/or inactivation pathways are hypothesized to play an importantrole in platinum resistance. These include BRCA1 (component ofmultiple DNA damage repair pathways), ERCC1 and XPD (involvedin the nucleotide excision repair pathway), MGMT (DNA adducts atthe O6-position of guanine repair), GSTP1, MDR, and MRP-1 (in-volved in detoxification and drug-enhanced efflux).21-28 Moreover,everal 5-FU-related metabolic enzymes have been proposed becausef their correlation with sensitivity to 5-FU: TS, TP, and DPD.29-31
The aim of the present study was to compare the advantages andlimitations of a conventional in vitro chemosensitivity test with thoseof a panel of biomolecular markers in predicting clinical response todrugs frequently used to treat colon cancer-induced PC.
Patients and MethodsPatients
Twenty-eight patients with PC from colon cancer were included
in the experimental-clinical study and all underwent surgical resec-tion at Pierantoni Hospital in Forlì or Bentivoglio Hospital in Bolo-gna. Inclusion criteria were histologic confirmation of advanced orrecurrent colon cancer and pre- or postsurgery chemotherapy. Threepatients were treated with 5-FU alone, 2 with oxaliplatin alone, 2with oxaliplatin and mitomycin C, 9 with 5-FU and oxaliplatin, and10 with 5-FU and irinotecan. Informed consent was obtained beforesurgical treatment and patients were required to be accessible forfollow-up. The study protocol was approved by the local ethics com-mittee. In order to evaluate the relation between gene expression orin vitro chemosensitivity test results and clinical response, patientswere subdivided into responders (partial or complete clinical re-sponse and stable disease) or nonresponders (progressive disease).
Sample CollectionTumor specimens were sampled and analyzed (under sterile con-
ditions) by a pathologist immediately after surgical resection to con-firm the tumor representativity of the sample. Part of the biopticmaterial was stored in RNAlater Tissue Collection (Invitrogen,Carlsbad, CA) at 4 °C to preserve messenger RNA (mRNA) integ-rity, and the remainder was immediately processed for the chemo-sensitivity test.
Real-time Reverse Transcription Polymerase ChainReaction Analysis
Total RNA was extracted using TRIzol Reagent within 2 or 3hours of surgery, in accordance with the manufacturer’s instructions(Invitrogen). Reverse transcription (RT) reactions were performed in20 �L of sterile water containing 800 ng of total RNA using iScriptcDNA Synthesis kit (Bio-Rad Laboratories, Hercules, CA) and ana-lyzed by Real Time RT polymerase chain reaction (PCR) (MyiQSystem; Bio-Rad Laboratories) to detect the expression of the follow-ing genes: TS, TP, DPD, MDR1, MRP-1, MGMT, BRCA1, ERCC1,GSTP1, and XPD. Primers for mRNA amplification were designedusing Beacon Designer Software (version 4, Bio-Rad Laboratories)and sequences are listed in Table 1. The standard reaction sample was25 �L containing 2 �L of cDNA template, 1x SYBR Green Mix and
�M of forward and reverse primers. The mixture was subjected tothe following cycling conditions: 95 °C for 1 minute and 30 secondsfollowed by 40 cycles of amplification for 15 seconds at 95 °C and 30seconds at 57 °C (for MDR), 58 °C (for TP), 59 °C (for TS andXPD), 60 °C (for MGMT, BRCA1, ERCC1, GSTP1, �2-micro-lobulin, and hypoxanthine phosphoribosyltransferase [HPRT]), or2 °C (for DPD and MRP-1). The amount of mRNA of each markeras normalized to the endogenous references �2-microglobulin andPRT using Gene Expression Macro Software (version 1.1) (Bio-ad Laboratories). A commercial RNA control derived from a poolf normal colon tissue mRNA was used as calibrator.
The efficiency of amplification, which never exceeded 5% variabil-ty in the different experiments, was used to determine the relativexpression of mRNA and was calculated using Gene Expression
acro Software (version 1.1) (Bio-Rad Laboratories). The reproduc-bility of real-time PCR results was verified in triplicate, and theoefficient of variation, calculated from the 3 Ct values, was always �
1.5%.
Clinical Colorectal Cancer June 2013 123
s
w�
ag
Chemosensitivity Test and Tissue Biomarker Expression
124
In Vitro Chemosensitivity TestA cell suspension was obtained after a 4- to 16-hour enzymatic
digestion of fresh tumor tissue. Cells were counted and plated at a den-sity of 10,000 cells per well in 96-well flat-bottomed microtiter plates(100 �L of cell suspension per well). Experiments were run in octupli-cate. The optical density of treated and untreated cells was determined ata wavelength of 540 nm using a fluorescence plate reader.
Cells were exposed for 72 hours to 1, 10, and 100 �M of 5-FU;0.8, 8, and 80 �M of oxaliplatin; 0.3, 3, and 30 �M of mitomycin C;and 0.014, 0.14, and 1.4 �M of irinotecan. Drug activity was as-essed by SRB assay according to the method of Skehan et al.13 Dose
response curves were created by Excel software (version 2007) and70% inhibiting concentration values were determined to identify thepatients who were sensitive or resistant to all the drugs tested. PC3, atumor cell line known to be sensitive to the anticancer agents used,was used as internal control.
Treatment ResponseClinical response to treatment was monitored by measuring cir-
culating CA19-9 and carcinoembryonic antigen levels before eachtreatment cycle and by tumor imaging every 3 cycles using computedtomography scan. The same clinical evaluations were carried outevery 3 months after the end of treatment.
Statistical AnalysisThe relationship between continuous (gene expression) and di-
chotomous variables was analyzed using a nonparametric rankingstatistic (median test).32 Spearman correlation coefficient was used toinvestigate the correlation between the mRNA expression of differ-ent genes, TS, TP, DPD, MDR1, MRP-1, MGMT, BRCA1, ERCC1,GSTP1, and XPD, considered as continuous variables. Receiver op-erating curve (ROC) analysis was performed for individual markers.We considered an algorithm that renders a single composite scoreusing the linear predictor fitted from a binary regression model. Thisalgorithm was judged optimal under the linearity assumption33,34
that the ROC curve is maximized (ie, best sensitivity) at every thresh-
Table 1 Oligonucleotides Used for Real-Time PCR
Gene Name 5=-3= Forward Primer
TS gcaaagagtgattgacaccatcaa
TP cctgcggacggaatcct
DPD aatgattcgaagagcttttgaagc
MDR1 atatggtggtgggaactttgg
MRP-1 tttggtaaagaactggaagaagg
MGMT tcttcaccatcccgttttcc
BRCA1 gctcgctgagacttcctg
ERCC1 tcagtcaacaaaacggacagtcag
GSTP1 aacatgaggcgggcaag
XPD aagcaggagggcgagaag
HPRT agactttgctttccttggtcagg
�-2-microglobulin cgctactctctctttctggc
old value. The �2 test was used to compare dichotomous variables.
Clinical Colorectal Cancer June 2013
All statistical analyses were performed with SAS Statistical Soft-are (version 9.1, SAS Institute Inc, Cary, NC). Two-sided P values.05 were considered significant.
ResultsTumor material was insufficient in 2 of the 28 patients to perform
in vitro chemosensitivity and gene expression analyses. Median age ofthe 26 evaluable patients was 58 years (range, 25-73). Patients weretreated with different drugs; 10 (38%) received 5-FU and irinotecan,9 (35%) 5-FU and oxaliplatin, 3 (11%) 5-FU alone, 2 (8%) oxalip-latin and mitomycin C, and 2 (8%) oxaliplatin alone (Table 2).
Gene Expression AnalysisGene expression levels differed substantially, ranging from the
lowest median value in the overall series of 0.06 for MDR to thehighest value of 4.75 for ERCC1. Expression levels of the genes an-alyzed were generally poorly related to each other, correlation coef-ficients ranging from 0.60 to �0.33. The only significant correla-
=-3= Reverse Primer Annealing Temperature
gaggaagatcctctggattccaa 59°C
cagcagtttcttactgaga 58°C
tccccggatgattctgg 62 °C
catacctggtcatgtcttc 57 °C
cctcctcattcgcatcc 62 °C
tgcctctcattgctcctc 60 °C
taaatccatttctttctgttcc 60 °C
cttgggttctttcccagagc 60 °C
tgtagtcagcgaaggag 60 °C
tcatagaatcggcagtgg 59 °C
ctggcttatatccaacattcg 60 °C
acacatagcaattcaggaat 60 °C
Table 2 Patients and Treatment
Characteristics n
All Patients 26
Sex
Male 13
Female 13
Median Age, Years (Range) 58 (25-73)
Peritoneal Cancer Index, Mean (range) 10.5 (3-39)
Treatment
5-Fluorouracil 3
5-Fluorouracil/oxaliplatin 9
5-Fluorouracil/irinotecan 10
Oxaliplatin 2
Oxaliplatin/mitomycin C 2
5
ca
tc
gt
gg
ca
at
ga
tc
gt
cc
gt
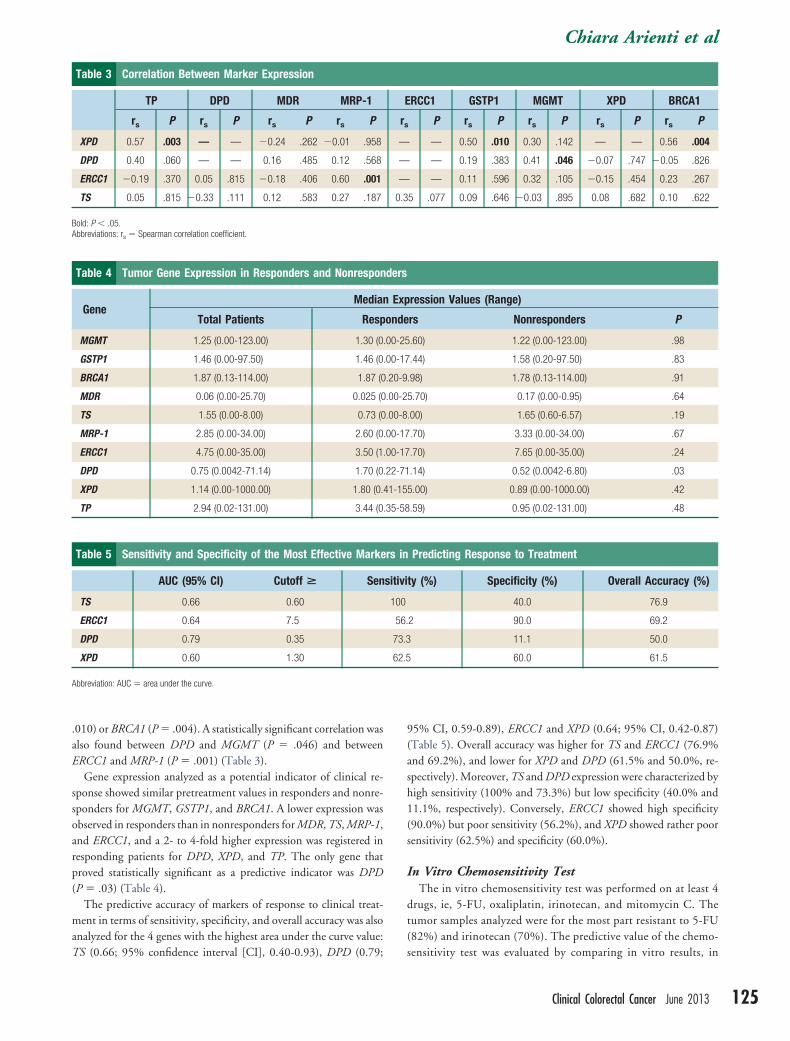
tions were observed between XPD and TP (P � .003), GSTP1 (P �
h1(
.35-58
Chiara Arienti et al
.010) or BRCA1 (P � .004). A statistically significant correlation wasalso found between DPD and MGMT (P � .046) and betweenERCC1 and MRP-1 (P � .001) (Table 3).
Gene expression analyzed as a potential indicator of clinical re-sponse showed similar pretreatment values in responders and nonre-sponders for MGMT, GSTP1, and BRCA1. A lower expression wasobserved in responders than in nonresponders for MDR, TS, MRP-1,and ERCC1, and a 2- to 4-fold higher expression was registered inresponding patients for DPD, XPD, and TP. The only gene thatproved statistically significant as a predictive indicator was DPD(P � .03) (Table 4).
The predictive accuracy of markers of response to clinical treat-ment in terms of sensitivity, specificity, and overall accuracy was alsoanalyzed for the 4 genes with the highest area under the curve value:
Table 3 Correlation Between Marker Expression
TP DPD MDR MRP-1
rs P rs P rs P rs P
XPD 0.57 .003 — — �0.24 .262 �0.01 .958
DPD 0.40 .060 — — 0.16 .485 0.12 .568
ERCC1 �0.19 .370 0.05 .815 �0.18 .406 0.60 .001
TS 0.05 .815 �0.33 .111 0.12 .583 0.27 .187
Bold: P � .05.Abbreviations: rs � Spearman correlation coefficient.
Table 4 Tumor Gene Expression in Responders and Nonrespon
GeneMedian
Total Patients Resp
MGMT 1.25 (0.00-123.00) 1.30 (0
GSTP1 1.46 (0.00-97.50) 1.46 (0
BRCA1 1.87 (0.13-114.00) 1.87 (0
MDR 0.06 (0.00-25.70) 0.025 (0
TS 1.55 (0.00-8.00) 0.73 (0
MRP-1 2.85 (0.00-34.00) 2.60 (0
ERCC1 4.75 (0.00-35.00) 3.50 (1
DPD 0.75 (0.0042-71.14) 1.70 (0
XPD 1.14 (0.00-1000.00) 1.80 (0.
TP 2.94 (0.02-131.00) 3.44 (0
Table 5 Sensitivity and Specificity of the Most Effective Marke
AUC (95% CI) Cutoff > Sen
TS 0.66 0.60
ERCC1 0.64 7.5
DPD 0.79 0.35
XPD 0.60 1.30
Abbreviation: AUC � area under the curve.
TS (0.66; 95% confidence interval [CI], 0.40-0.93), DPD (0.79;
95% CI, 0.59-0.89), ERCC1 and XPD (0.64; 95% CI, 0.42-0.87)(Table 5). Overall accuracy was higher for TS and ERCC1 (76.9%and 69.2%), and lower for XPD and DPD (61.5% and 50.0%, re-spectively). Moreover, TS and DPD expression were characterized by
igh sensitivity (100% and 73.3%) but low specificity (40.0% and1.1%, respectively). Conversely, ERCC1 showed high specificity90.0%) but poor sensitivity (56.2%), and XPD showed rather poor
sensitivity (62.5%) and specificity (60.0%).
In Vitro Chemosensitivity TestThe in vitro chemosensitivity test was performed on at least 4
drugs, ie, 5-FU, oxaliplatin, irinotecan, and mitomycin C. Thetumor samples analyzed were for the most part resistant to 5-FU(82%) and irinotecan (70%). The predictive value of the chemo-
RCC1 GSTP1 MGMT XPD BRCA1
P rs P rs P rs P rs P
— 0.50 .010 0.30 .142 — — 0.56 .004
— 0.19 .383 0.41 .046 �0.07 .747 �0.05 .826
— 0.11 .596 0.32 .105 �0.15 .454 0.23 .267
5 .077 0.09 .646 �0.03 .895 0.08 .682 0.10 .622
ression Values (Range)
rs Nonresponders P
.60) 1.22 (0.00-123.00) .98
.44) 1.58 (0.20-97.50) .83
.98) 1.78 (0.13-114.00) .91
5.70) 0.17 (0.00-0.95) .64
.00) 1.65 (0.60-6.57) .19
.70) 3.33 (0.00-34.00) .67
.70) 7.65 (0.00-35.00) .24
.14) 0.52 (0.0042-6.80) .03
5.00) 0.89 (0.00-1000.00) .42
.59) 0.95 (0.02-131.00) .48
Predicting Response to Treatment
ty (%) Specificity (%) Overall Accuracy (%)
40.0 76.9
2 90.0 69.2
11.1 50.0
60.0 61.5
E
rs
—
—
—
0.3
ders
Exp
onde
.00-25
.00-17
.20-9
.00-2
.00-8
.00-17
.00-17
.22-71
41-15
rs in
sitivi
100
56.
73.3
62.5
sensitivity test was evaluated by comparing in vitro results, in
Clinical Colorectal Cancer June 2013 125
co
tt
Chemosensitivity Test and Tissue Biomarker Expression
126
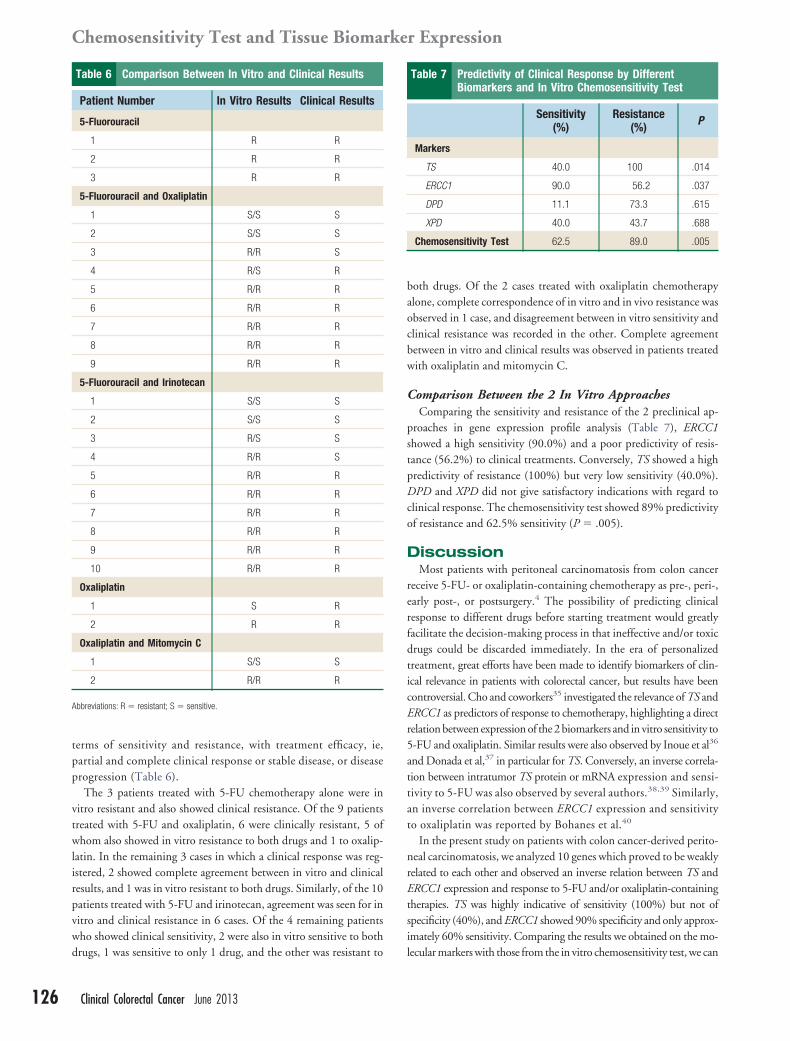
terms of sensitivity and resistance, with treatment efficacy, ie,partial and complete clinical response or stable disease, or diseaseprogression (Table 6).
The 3 patients treated with 5-FU chemotherapy alone were invitro resistant and also showed clinical resistance. Of the 9 patientstreated with 5-FU and oxaliplatin, 6 were clinically resistant, 5 ofwhom also showed in vitro resistance to both drugs and 1 to oxalip-latin. In the remaining 3 cases in which a clinical response was reg-istered, 2 showed complete agreement between in vitro and clinicalresults, and 1 was in vitro resistant to both drugs. Similarly, of the 10patients treated with 5-FU and irinotecan, agreement was seen for invitro and clinical resistance in 6 cases. Of the 4 remaining patientswho showed clinical sensitivity, 2 were also in vitro sensitive to both
Table 6 Comparison Between In Vitro and Clinical Results
Patient Number In Vitro Results Clinical Results
5-Fluorouracil
1 R R
2 R R
3 R R
5-Fluorouracil and Oxaliplatin
1 S/S S
2 S/S S
3 R/R S
4 R/S R
5 R/R R
6 R/R R
7 R/R R
8 R/R R
9 R/R R
5-Fluorouracil and Irinotecan
1 S/S S
2 S/S S
3 R/S S
4 R/R S
5 R/R R
6 R/R R
7 R/R R
8 R/R R
9 R/R R
10 R/R R
Oxaliplatin
1 S R
2 R R
Oxaliplatin and Mitomycin C
1 S/S S
2 R/R R
Abbreviations: R � resistant; S � sensitive.
drugs, 1 was sensitive to only 1 drug, and the other was resistant to
Clinical Colorectal Cancer June 2013
both drugs. Of the 2 cases treated with oxaliplatin chemotherapyalone, complete correspondence of in vitro and in vivo resistance wasobserved in 1 case, and disagreement between in vitro sensitivity andclinical resistance was recorded in the other. Complete agreementbetween in vitro and clinical results was observed in patients treatedwith oxaliplatin and mitomycin C.
Comparison Between the 2 In Vitro ApproachesComparing the sensitivity and resistance of the 2 preclinical ap-
proaches in gene expression profile analysis (Table 7), ERCC1showed a high sensitivity (90.0%) and a poor predictivity of resis-tance (56.2%) to clinical treatments. Conversely, TS showed a highpredictivity of resistance (100%) but very low sensitivity (40.0%).DPD and XPD did not give satisfactory indications with regard tolinical response. The chemosensitivity test showed 89% predictivityf resistance and 62.5% sensitivity (P � .005).
DiscussionMost patients with peritoneal carcinomatosis from colon cancer
receive 5-FU- or oxaliplatin-containing chemotherapy as pre-, peri-,early post-, or postsurgery.4 The possibility of predicting clinicalresponse to different drugs before starting treatment would greatlyfacilitate the decision-making process in that ineffective and/or toxicdrugs could be discarded immediately. In the era of personalizedtreatment, great efforts have been made to identify biomarkers of clin-ical relevance in patients with colorectal cancer, but results have beencontroversial. Cho and coworkers35 investigated the relevance of TS andERCC1 as predictors of response to chemotherapy, highlighting a directrelation between expression of the 2 biomarkers and in vitro sensitivity to5-FU and oxaliplatin. Similar results were also observed by Inoue et al36
and Donada et al,37 in particular for TS. Conversely, an inverse correla-ion between intratumor TS protein or mRNA expression and sensi-ivity to 5-FU was also observed by several authors.38,39 Similarly,
an inverse correlation between ERCC1 expression and sensitivityto oxaliplatin was reported by Bohanes et al.40
In the present study on patients with colon cancer-derived perito-neal carcinomatosis, we analyzed 10 genes which proved to be weaklyrelated to each other and observed an inverse relation between TS andERCC1 expression and response to 5-FU and/or oxaliplatin-containingtherapies. TS was highly indicative of sensitivity (100%) but not ofspecificity (40%), and ERCC1 showed 90% specificity and only approx-imately 60% sensitivity. Comparing the results we obtained on the mo-
Table 7 Predictivity of Clinical Response by DifferentBiomarkers and In Vitro Chemosensitivity Test
Sensitivity(%)
Resistance(%) P
Markers
TS 40.0 100 .014
ERCC1 90.0 56.2 .037
DPD 11.1 73.3 .615
XPD 40.0 43.7 .688
Chemosensitivity Test 62.5 89.0 .005
lecular markers with those from the in vitro chemosensitivity test, we can
2
2
2
2
3
3
33
Chiara Arienti et al
conclude that the latter showed significant predictivity in terms of clin-ical response to 5-FU- and oxaliplatin-based regimens, confirming onceagain results recently published on ovarian cancer.41
Although biomarker and/or gene expression evaluation alsoshowed some predictive relevance, a clear direct or inverse relationbetween gene expression and sensitivity or resistance to drugs did notemerge, indicating that this approach cannot be considered easilytransferable to clinical practice.
ConclusionSensitivity and resistance profiles to drugs used in vivo were better
defined by the chemosensitivity test than by biomarker evaluation.The results from the present study are, however, preliminary, andlarger retrospective or prospective randomized studies are needed toascertain the real predictive value of the chemosensitivity test in eval-uating 5-FU/oxaliplatin response in patients with peritoneal carci-nomatosis from colon cancer.
Clinical Practice Points● Despite progress made in the early detection of primary colorectal
cancer, PC is still observed in approximately 10% of patients at thetime of primary cancer resection.
● Most patients with PC from colon cancer currently receive 5-FU-or oxaliplatin-containing chemotherapy as first-, second-, or third-line treatment.
● The identification of strategies to predict response to therapy inpatients with colon cancer-derived PC remains a high priority.
● We observed that a conventional in vitro chemosensitivity assaymore accurately predicted clinical response than expression levelsof a panel of newly proposed biomarkers.
● It would be interesting to use tumor material from colon carcino-matosis as a model for in vitro phase II studies to explore theantitumor activity of conventional and novel drugs used singly orin combination.
AcknowledgmentsThe authors thank Ursula Elbling for editing the manuscript.
DisclosureThe authors have stated that they have no conflicts of interest.
References1. A, Bray F, Center MM, Ferlay J, et al. Global cancer statistics. CA Cancer J Clin
2011; 61:69-90.2. Confuorto G, Giuliano ME, Grimaldi A, et al. Peritoneal carcinomatosis from
colorectal cancer: HIPEC? Surg Oncol 2007; 16(Suppl 1):S149-52.3. Yan TD, Black D, Savady R, et al. Systematic review on the efficacy of cytoreductive
surgery combined with perioperative intraperitoneal chemotherapy for peritonealcarcinomatosis from colorectal carcinoma. J Clin Oncol 2006; 24:4011-9.
4. Weber T, Roitman M, Link KH. Current status of cytoreductive surgery withhyperthermic intraperitoneal chemotherapy in patients with peritoneal carcinoma-tosis from colorectal cancer. Clin Colorectal Cancer 2012; 11:167-76.
5. Bellamy WT. Prediction of response to drug therapy of cancer. A review of in vitroassays. Drugs 1992; 44:690-708.
6. Von Hoff DD, Clark GM, Stogdill BJ, et al. Prospective clinical trial of a humantumor cloning system. Cancer Res 1983; 43:1926-31.
7. Sondak VK, Bertelsen CA, Tanigawa N, et al. Clinical correlations with chemosen-sitivities measured in a rapid thymidine incorporation assay. Cancer Res 1984; 44:1725-8.
8. Bertelsen CA, Sondak VK, Mann BD, et al. Chemosensitivity testing of humansolid tumors. A review of 1582 assays with 258 clinical correlations. Cancer 1984;53:1240-5.
9. Keepers YP, Pizao PE, Peters GJ, et al. Comparison of the sulforhodamine B protein
and tetrazolium (MTT) assays for in vitro chemosensitivity testing. Eur J Cancer1991; 27:897-900.10. Hamburger AW, Salmon SE. Primary bioassay of human tumor stem cells. Science1977; 197:461-3.
11. Kern DH, Drogemuller CR, Kennedy MC, et al. Development of a miniaturized,improved nucleic acid precursor incorporation assay for chemosensitivity testing ofhuman solid tumors. Cancer Res 1985; 45:5436-41.
12. Weisenthal LM, Marsden JA, Dill PL, et al. A novel dye exclusion method fortesting in vitro chemosensitivity of human tumors. Cancer Res 1983; 43:749-57.
13. Skehan P, Storeng R, Scudiero D, et al. New colorimetric cytotoxicity assay foranticancer-drug screening. J Natl Cancer Inst 1990; 82:1107-12.
14. Carmichael J, DeGraff WG, Gazdar AF, et al. Evaluation of a tetrazolium-basedsemiautomated colorimetric assay: assessment of chemosensitivity testing. CancerRes 1987; 47:936-42.
15. Kangas L, Grönroos M, Nieminen AL. Bioluminescence of cellular ATP: a newmethod for evaluating cytotoxic agents in vitro. Med Biol 1984; 62:338-43.
16. Voigt W. Sulforhodamine B assay and chemosensitivity. Methods Mol Med 2005;110:39-48.
17. Vichai V, Kirtikara K. Sulforhodamine B colorimetric assay for cytotoxicity screen-ing. Nat Protoc 2006; 1:1112-6.
18. Ross JS, Torres-Mora J, Wagle N, et al. Biomarker-based prediction of responseto therapy for colorectal cancer: current perspective. Am J Clin Pathol 2010;134:478-90.
19. Levine EA, Blazer DG 3rd, Kim MK, et al. Gene expression profiling of peritonealmetastases from appendiceal and colon cancer demonstrates unique biologic signa-tures and predicts patient outcomes. J Am Coll Surg 2012; 214:599-606.
20. Gray RG, Quirke P, Handley K, et al. Validation study of a quantitative multigenereverse transcriptase-polymerase chain reaction assay for assessment of recurrencerisk in patients with stage II colon cancer. J Clin Oncol 2011; 29:4611-9.
21. Kelland L. The resurgence of platinum-based cancer chemotherapy. Nat Rev Cancer2007; 7:573-84.
22. Shirota Y, Stoehlmacher J, Brabender J, et al. ERCC1 and thymidylate synthasemRNA levels predict survival for colorectal cancer patients receiving combinationoxaliplatin and fluorouracil chemotherapy. J Clin Oncol 2001; 19:4298-304.
23. Weberpals J, Garbuio K, O’Brien A, et al. The DNA repair proteins BRCA1 andERCC1 as predictive markers in sporadic ovarian cancer. Int J Cancer 2009; 124:806-15.
24. Kaina B, Christmann M, Naumann S, et al. MGMT: key node in the battle againstgenotoxicity, carcinogenicity and apoptosis induced by alkylating agents. DNARepair (Amst) 2007; 6:1079-99.
25. Yarosh DB, Foote RS, Mitra S, et al. Repair of O6-methylguanine in DNA bydemethylation is lacking in Mer- human tumor cell strains. Carcinogenesis 1983;4:199-205.
6. Quinn JE, Carser JE, James CR, et al. BRCA1 and implications for response tochemotherapy in ovarian cancer. Gynecol Oncol 2009; 113:134-42.
7. Lewis AD, Hayes JD, Wolf CR. Glutathione and glutathione-dependent enzymesin ovarian adenocarcinoma cell lines derived from a patient before and after theonset of drug resistance: intrinsic differences and cell cycle effects. Carcinogenesis1988; 9:1283-7.
8. Yang P, Ebbert JO, Sun Z, et al. Role of the glutathione metabolic pathway in lungcancer treatment and prognosis: a review. J Clin Oncol 2006; 24:1761-9.
9. Okumura K, Shiomi H, Mekata E, et al. Correlation between chemosensitivity andmRNA expression level of 5-fluorouracil-related metabolic enzymes during livermetastasis of colorectal cancer. Oncol Rep 2006; 15:875-82.
0. Johnston PG, Lenz HJ, Leichman CG, et al. Thymidylate synthase gene and proteinexpression correlate and are associated with response to 5-fluorouracil in humancolorectal and gastric tumors. Cancer Res 1995; 55:1407-12.
1. Meropol NJ, Gold PJ, Diasio RB, et al. Thymidine phosphorylase expression isassociated with response to capecitabine plus irinotecan in patients with metastaticcolorectal cancer. J Clin Oncol 2006; 24:4069-77.
2. Siegel S. Nonparametric statistics. London: McGraw-Hill, 1956.3. Eguchi S, Copas J. A class of logistic-type discriminant functions. Biometrika 2002;
89:1-22.34. McIntosh MW, Pepe MS. Combining several screening tests: optimality of the risk
score. Biometrics 2002; 58:657-64.35. Cho YB, Chung HJ, Lee WY, et al. Relationship between TYMS and ERCC1
mRNA expression and in vitro chemosensitivity in colorectal cancer. Anticancer Res2011; 31:3843-9.
36. Inoue T, Hibi K, Nakayama G, et al. Expression level of thymidylate synthase is agood predictor of chemosensitivity to 5-fluorouracil in colorectal cancer. J Gastro-enterol 2005; 40:143-7.
37. Donada M, Bonin S, Nardon E, et al. Thymidilate synthase expression predictslonger survival in patients with stage II colon cancer treated with 5-flurouracilindependently of microsatellite instability. J Cancer Res Clin Oncol 2011; 137:201-10.
38. Ciaparrone M, Quirino M, Schinzari G, et al. Predictive role of thymidylate syn-thase, dihydropyrimidine dehydrogenase and thymidine phosphorylase expressionin colorectal cancer patients receiving adjuvant 5-fluorouracil. Oncology 2006; 70:366-77.
39. Tsourouflis G, Theocharis SE, Sampani A, et al. Prognostic and predictive value ofthymidylate synthase expression in colon cancer. Dig Dis Sci 2008; 53:1289-96.
40. Bohanes P, Labonte MJ, Lenz HJ. A review of excision repair cross-complementa-tion group 1 in colorectal cancer. Clin Colorectal Cancer 2011; 10:157-64.
41. Arienti C, Tesei A, Verdecchia GM, et al. Peritoneal carcinomatosis from ovarian
cancer: chemosensitivity test and tissue markers as predictors of response to chemo-therapy. J Transl Med 2011; 20:9:94.Clinical Colorectal Cancer June 2013 127
Related Documents