ROLE OF ACADEMIC PROCRASTINATION, ACADEMIC SELF-EFFICACY BELIEFS, AND PRIOR ACADEMIC SKILLS ON COURSE OUTCOMES FOR COLLEGE STUDENTS IN DEVELOPMENTAL EDUCATION by DEANNA MARIE HILTON JACKSON (Under the Direction of Jay W. Rojewski) ABSTRACT This study examined the relationship between academic self-efficacy beliefs, academic procrastination, and prior academic skills on course outcomes for students who completed a mandatory developmental college course. One hundred twenty three undergraduate students enrolled in a developmental college English course during a single semester participated. A very high academic self-efficacy was identified, even though students were enrolled in a developmental course. These students did not achieve higher grades suggesting an overestimation of academic achievement. A significant negative relationship existed between academic self-efficacy and academic procrastination. Students who had high academic procrastination levels also had lower academic- self-efficacy. Levels of academic procrastination yielded a statistically significant negative relationship to academic achievement. Students who had higher academic procrastination levels did not perform as well on end-of-course grades. Prior academic skills, predicted by the COMPASS Writing Skills Placement Test, produced a statistically significant relationship to

Welcome message from author
This document is posted to help you gain knowledge. Please leave a comment to let me know what you think about it! Share it to your friends and learn new things together.
Transcript
ROLE OF ACADEMIC PROCRASTINATION, ACADEMIC SELF-EFFICACY BELIEFS,
AND PRIOR ACADEMIC SKILLS ON COURSE OUTCOMES FOR COLLEGE STUDENTS
IN DEVELOPMENTAL EDUCATION
by
DEANNA MARIE HILTON JACKSON
(Under the Direction of Jay W. Rojewski)
ABSTRACT
This study examined the relationship between academic self-efficacy beliefs, academic
procrastination, and prior academic skills on course outcomes for students who completed a
mandatory developmental college course. One hundred twenty three undergraduate students
enrolled in a developmental college English course during a single semester participated. A very
high academic self-efficacy was identified, even though students were enrolled in a
developmental course. These students did not achieve higher grades suggesting an
overestimation of academic achievement.
A significant negative relationship existed between academic self-efficacy and academic
procrastination. Students who had high academic procrastination levels also had lower academic-
self-efficacy. Levels of academic procrastination yielded a statistically significant negative
relationship to academic achievement. Students who had higher academic procrastination levels
did not perform as well on end-of-course grades. Prior academic skills, predicted by the
COMPASS Writing Skills Placement Test, produced a statistically significant relationship to

academic achievement. Students with higher COMPASS scores achieved higher end-of-course
grades.
Older students and men had higher levels of academic procrastination. Students were
most likely to procrastinate on studying for exams, weekly reading assignments, and completing
writing assignments. Task aversiveness was the most important reason students gave for
procrastinating. Younger students and men were more task averse. The fear of failure factor was
not as important as task aversiveness as an explanation for academic procrastination. There was
little difference between men and women on the fear of failure factor, which was different from
the original study using the PASS (Solomon & Rothblum, 1984) in which women rated the fear
of failure factor higher. Older students most often attributed fear of failure to academic
procrastination.
INDEX WORDS: ACADEMIC PROCRASTINATION, ACADEMIC SELF-EFFICACY,
DEVELOPMENTAL EDUCATION
ROLE OF ACADEMIC PROCRASTINATION, ACADEMIC SELF-EFFICACY BELIEFS,
AND PRIOR ACADEMIC SKILLS ON COURSE OUTCOMES FOR COLLEGE STUDENTS
IN DEVELOPMENTAL EDUCATION
by
DEANNA MARIE HILTON JACKSON
BSW, The University of Georgia, 1981
M.S., Mercer University, 1997
A Dissertation Submitted to the Graduate Faculty of The University of Georgia in Partial
Fulfillment of the Requirements for the Degree
DOCTOR OF EDUCATION
ATHENS, GEORGIA
2012

© 2012
DeAnna Marie Hilton Jackson
All Rights Reserved

ROLE OF ACADEMIC PROCRASTINATION, ACADEMIC SELF-EFFICACY BELIEFS,
AND PRIOR ACADEMIC SKILLS ON COURSE OUTCOMES FOR COLLEGE STUDENTS
IN DEVELOPMENTAL EDUCATION
by
DEANNA MARIE HILTON JACKSON
Major Professor: Jay W. Rojewski
Committee: Elaine Adams Myra Womble Electronic Version Approved: Maureen Grasso Dean of the Graduate School The University of Georgia August 2012

iv
ACKNOWLEDGEMENTS
I thank my husband, Bill Jackson, for his day-to-day support throughout this process. His
love, devotion, and encouragement are a blessing to me. I also owe a debt of gratitude to my
parents who instilled in me a lifelong love of learning. I will be forever grateful for their support
of my dreams and educational goals. To my daughter Kathleen Jackson, we have shared our
educational journeys and achievements, which makes this day very special. And last but not
least, from the bottom of my heart thank you to all my family for listening, loving, and believing
in me. You all never doubted this day would come. I am blessed to have such a great and loving
family.
To my advisor and major professor Dr. Jay Rojewski, your support and guidance have
been tremendous. Over these years, you have challenged me to be the best scholar and student I
could be. You were a mentor who understood that students must seek knowledge, challenge their
thinking, improve their writing, and come away with a sense of pride. Through your words and
actions you conveyed confidence in me, and I believed that as well. You are a scholar, a valued
teacher, and a wonderful mentor.
To my committee members and professors, Dr. Myra Womble and Dr. Elaine Adams you
encouraged me with many words of personal and scholarly wisdom in completion of my
doctorate. Your valuable insights and points of view guided my thinking, research, and writing,
and I thank you both for your unselfish devotion.
v
TABLE OF CONTENTS
Page
ACKNOWLEDGEMENTS............................................................................................................iv
LIST OF TABLES....................................................................................................................... viii
LIST OF FIGURES ........................................................................................................................ix
CHAPTER
1 INTRODUCTION. ........................................................................................................1
Rationale ..................................................................................................................1
Purpose of Study......................................................................................................6
Theoretical Framework............................................................................................8
Importance of Study ..............................................................................................10
2 REVIEW OF LITERATURE......................................................................................12
Developmental Education......................................................................................12
Students in Developmental Education...................................................................14
Impact of Developmental Education .....................................................................15
The COMPASS Test..............................................................................................19
Procrastination .......................................................................................................20
Theoretical Framework of Procrastination ............................................................23
Academic Procrastination......................................................................................24
Social Cognitive Theory ........................................................................................27
Academic Self-Efficacy.........................................................................................28

vi
Theoretical Framework of Academic Self-Efficacy..............................................29
Academic Achievement.........................................................................................31
3 METHOD ....................................................................................................................34
Purpose of Study....................................................................................................34
Research Questions................................................................................................35
Design ....................................................................................................................35
Participants ............................................................................................................37
Instrumentation ......................................................................................................39
Procedure ...............................................................................................................45
Data Analysis.........................................................................................................46
4 RESULTS....................................................................................................................49
Purpose of Study....................................................................................................49
Analysis of Research Questions ............................................................................50
Multiple Correlation Analysis (MCA)...................................................................58
5 DISCUSSION..............................................................................................................67
Purpose of Study....................................................................................................67
Research Summary ................................................................................................68
Results....................................................................................................................72
Discussion and Implications ..................................................................................76
Recommendations for Future Practice...................................................................83
Recommendations for Further Research ...............................................................86
REFERENCES ..............................................................................................................................87
vii
APPENDICES
A DEMOGRAPHIC QUESTIONNAIRE.....................................................................104
B ACADEMIC SELF-EFFICACY SCALE STUDENTS (ASES) ..............................106
C PROCRASTINATION ASSESSMENT SCALE FOR STUDENTS (PASS) ..........110
D INFORMED CONSENT...........................................................................................116
viii
LIST OF TABLES
Page
Table 1: Demographic Characteristics for Study Participants.......................................................38
Table 2: Data Collection Instruments, Score Ranges, and Indicators ...........................................44
Table 3: Data Analysis for Research Questions ............................................................................48
Table 4: Descriptive Statistics for Criterion and Predictor Variables ...........................................51
Table 5: Academic Self-Efficacy for College Students in a Developmental Course ....................52
Table 6: Prevalence of Academic Procrastination for College Students in a Developmental
Course .............................................................................................................................54
Table 7: Fear of Failure and Task Aversiveness for College Students in a Developmental
Course .............................................................................................................................57
Table 8: Residual Statistics for Criterion Variable Academic Achievement ................................61
Table 9: Correlation Matrix for Academic Achievement..............................................................62
Table 10: Structure Correlations for Academic Achievement ......................................................65
Table 11: Results of the Component Analysis for Academic Achievement .................................66
ix
LIST OF FIGURES
Page
Figure 1: Normal P-P plot of regression standardized residual for academic achievement ..........59
Figure 2: Standardized residual plot for criterion variable academic achievement.......................60

1
CHAPTER 1
INTRODUCTION
Rationale
Many students enter college without essential skills and qualifications required to meet
the rigors of college academics. Only 70% of all students in public high schools graduate, and
only 34% leave high school qualified to attend a 4-year college (Manhattan Institute for Policy
Research, 2003). Fifty percent of students seeking an associate’s degree and 20.7% seeking a
bachelor’s degree require remediation (Complete College America, 2011). The National Center
for Education Statistics (2010a) found that nearly one-third of first year college students require
at least one developmental course in reading, writing, or math. When students do enroll in their
required developmental courses, only 55% complete those courses and only 24.7% earn their
bachelor’s degrees within 6 years (Complete College America, 2011). In the state of Georgia in
fall 2008, 46,500 freshmen were enrolled in public colleges. Of those students, 25% or 11,603
students were required to enroll in a developmental course (University System of Georgia,
2008). Even though students spend one year or less in developmental courses, these statistics
highlight that students’ need for developmental education is strong as the problem of academic
underpreparedness persists in colleges today (McCabe & Day, 1998).
The National Association for Developmental Education (2012) reported that
developmental education enhances academic, personal, and professional achievement for all
learners. Despite the importance and costs of implementing developmental courses, there is little
rigorous research analyzing its effectiveness. The research available is inconclusive on the value

2
of specific developmental program interventions for college students. For example, in a study of
26,000 college students, students who did not receive remediation did just as well as students
who received some type of support in respect to graduation and transfer rates (Bettinger & Long,
2005). In contrast, several studies have shown that students who completed developmental
coursework experienced higher achievement and were just as or even more successful in future
college coursework than students without intervention (Castator & Tollefson, 1996; Crews &
Aragon, 2007).
Much of the literature on developmental education has focused on raising academic
standards and improving instructional methods using the skill and drills approach (Grubb &
Associates, 1999). A more in-depth understanding of all complex factors relating to student
success in college is required. Instruction and support strategies provided to students in
developmental courses should rely on a continued understanding of how students construct
knowledge and interact with the institution. The goal is to have a long-term impact on retention
and graduation, while establishing frameworks for understanding how students learn and develop
(Higbee, Arendale, & Lundell, 2005).
Social cognitive theory (Bandura, 1986), a psychological theory of human learning and
development, provided the theoretical foundation for this study. Social cognitive theory explains
that student learning occurs through an interaction of behavior, cognitive factors, and the
environment. Bandura (1986) believed that as students learn they self-direct or self-regulate their
environment depending on their perception of their capability to deal with current realities or
self-efficacy. Self-efficacy is the “belief in one’s capabilities to organize and execute the courses
of action required, producing given attainments” (Bandura, 1997, p. 3). Students who self-
regulate should be able to monitor or keep track of their own behaviors, evaluate their actions for

3
effectiveness, and respond to their behavior by modifying, rewarding, or discounting it. In
educational environments, students have the ability to choose and direct their own actions. The
ability to self-direct or self-regulate learning depends on motivation set by a student’s internal
standards and self-evaluative reactions to actions (Bandura, 1986). Social cognitive theory
explains that students continuously monitor their learning process and if they require additional
instruction on a skill they will seek out a qualified teacher or alter and adjust their learning
environment to enhance their learning.
One self-regulatory behavior that has been studied extensively in the literature is academic
procrastination and its effect on student achievement. Students who procrastinate may have
thoughts or behaviors that inhibit their ability to self-regulate, for example, false estimates of
time needed to complete a study task and low self-efficacy (Schouwenburg, Lay, Pychyl, &
Ferrari, 2004). Academic procrastination is a multidimensional construct with behavioral,
cognitive, and affective components. Academic procrastination in college students demonstrates
a lack of self-control and, when combined with lower self-efficacy for academics, can lead to
lower academic achievement (Bandura, 1997; Burka & Yuen, 1983; Judge & Bono, 2001).
Academic procrastination is fairly common among college students and may negatively
impact academic achievement (Clark & Hill, 1994; Ellis & Knaus, 2002; Harriott & Ferrari,
1996; Solomon & Rothblum, 1984; Wesley, 1994). Academic procrastination is defined as
failing to perform an academic activity within a desired time frame or postponing until the last
minute activities one needs to complete (Wolters, 2003). Another definition includes the
postponement of academic goals to the point where optimal performance becomes highly
unlikely (Ellis & Knaus, 2002). Most procrastination behaviors in academic situations concern

4
completion of academic assignments such as preparing for exams, doing homework, and writing
papers (Schouwenburg et al., 2004).
There are inconsistencies in the literature about whether or not academic procrastination
leads to lower academic achievement. Several studies have found that academic procrastination
had little effect on academic achievement (Beck, Koons, & Milgram, 2000; Beswick, 1988; Lay,
1986; Pychyl, Morin, & Salmon, 2000; Solomon & Rothblum, 1988). Beck et al. (2000) reported
that students may or may not be able to get away with delaying studying for an exam depending
on their level of ability. In examining test performance as a function of lecture attendance,
behavioral procrastination, and SAT scores, they found that students with low SAT scores
performed poorly on tests regardless of whether they procrastinated or attended class. One area
where information is lacking is the connection between academic procrastination and students in
developmental courses. It is important to develop a greater understanding of students in
developmental education to clarify whether and how procrastination affects their academic
achievement.
Academic procrastination has been linked extensively to self-efficacy (Knaus, 1998).
When students procrastinate, they limit their abilities to develop academic self-efficacy – the
ability to organize, regulate, and direct their actions to achieve a productive outcome (Knaus,
2000). In an academic environment, students’ self-efficacy influences their achievement
behavior through choices of activities, effort expenditure, persistence, and learning. Self-efficacy
for college academics, or academic self-efficacy, seems to have positive effects on academic
achievement. Several studies have found that students with high academic self-efficacy will have
higher grades than students with low academic self-efficacy (e.g., Bong, 2001; Brown, Lent, &

5
Larkin, 1989; Hackett, Betz, Casas, & Rocha-Singh, 1992; Lent, Brown, & Larkin, 1984;
Multon, Brown, & Lent, 1991).
According to social cognitive theory, students who are more academically self-efficacious
also manage their time better, are more persistent, and persevere to seek correct solutions
(Bandura, 1997). Students who demonstrate high academic self-efficacy tend to be self-regulated
learners, and as a result, may procrastinate less (Zimmerman, 1994; Zimmerman & Paulsen,
1995). Students who are self-regulated learners exhibit high academic self-efficacy beliefs and
an orientation toward mastery goals (Pintrich, 2000; Schunk & Ertmer, 2000). While the
literature is extensive about academic self-efficacy and its effect on academic achievement, little
information exists concerning the impact of academic self-efficacy on students taking
developmental courses. Students who are placed into developmental courses may feel
discouraged because they are taking pre-college courses while their peers may be taking courses
for their degrees. Students placed into developmental courses – by the very nature of their
placement – may have lower academic self-efficacy and engage in higher levels of
procrastination (Bandura, 1997; Burka & Yuen, 1983; Judge & Bono, 2001).
Colleges often place great importance on placement testing for students taking
developmental courses. Placement testing determines entering first-year students’ academic
strengths and weaknesses. In developmental education, placement testing is often used to place
students in an appropriate program of study to enhance their chance for success (Farmer &
Barham, 2001). It is important to view placement test scores as they relate to other factors,
including course outcomes and academic achievement for students in developmental education.
Students’ prior academic skills were considered in this study and measured by scores on the
Computer-Adaptive Placement Assessment and Support System (COMPASS; ACT, 2012)
6
Writing Skills Placement Test. The COMPASS placement test is used in colleges today to
evaluate incoming students’ skill levels in many academic areas including reading, writing,
math, and English as a Second Language. To determine academic achievement, the criterion
variable was defined as end-of-course grade in a developmental academic English course.
This study examined the relationship between academic self-efficacy beliefs, academic
procrastination, and prior academic skills for college students taking developmental education
courses. An understanding of the relationships posited in this study may help teachers,
counselors, and advisors better understand aspects of college students’ behavior. Interactions
and relationships between variables like academic procrastination, academic self-efficacy, and
prior academic skills helped identify important factors contributing to the success of students
taking a developmental course. This, in turn, will assist in the development of academic
strategies to decrease the likelihood that students will fail when enrolled in developmental
courses.
Purpose of Study
The purpose of this correlational study was to explore the relationship between academic
self-efficacy beliefs, academic procrastination, and prior academic skills on course outcomes for
students who must take developmental college courses. Self-efficacy refers to individuals' beliefs
about their ability to exercise control over their own functioning and over events that affect their
lives (Bandura, 1993). Academic self-efficacy is an individual’s belief in his or her ability to
successfully achieve an academic goal (Bandura, 1977). Academic self-efficacy beliefs can
affect academic functioning, effort regulation, perseverance, increased persistence in seeking
solutions, and overall academic achievement (Bandura, 1997; Bong, 2001; Brown et al., 1989;
Hackett et al., 1992; Lent et al., 1984; Multon et al., 1991). Students who demonstrate high
7
academic self-efficacy tend to be more self-regulated learners, are skilled in time management,
and, as a result, procrastinate less in the classroom (Zimmerman, 1994; Zimmerman & Paulsen,
1995). The Academic Self-Efficacy scale (ASES; Elias & Loomis, 2000) provided a measure of
students’ perceived academic self-efficacy.
Academic procrastination is common among college students and may have a negative
impact on academic achievement (Beck et al., 2000; Clark & Hill, 1994; Ellis & Knaus, 2002;
Harriott & Ferrari, 1996; Solomon & Rothblum, 1984; Wesley, 1994). Academic procrastination
is defined as failing to perform an academic activity within a desired time frame or postponing
until the last minute activities one needs to complete (Wolters, 2003). In this study, the complex
behavior of student procrastination was examined through social cognitive theory (Bandura,
1986) and self-regulation. Social cognitive theory considers motivational and cognitive factors
together to understand student’s behaviors in academic contexts. Students who procrastinate are
not self-regulated learners (Bandura, 1997; Wolters, 2003) because they fail to monitor and
control important aspects of their learning behavior (Butler & Winne, 1995; Pressley,
Borkowski, & Schneider, 1987). Important traits of self-regulation in a learning environment
include goal directedness, academic time management, meaningful and directed practice,
appropriate use of cognitive and metacognitive strategies, and a sense of self-efficacy
(Zimmerman, 1994; Zimmerman & Paulsen, 1995). This study defined and explored the
relationships of academic procrastination and academic self-efficacy on the level of achievement
of students enrolled in a developmental course. Academic procrastination and procrastination
traits were measured with the Procrastination Assessment Scale-Students (PASS; Solomon &
Rothblum, 1984).
8
Prior academic skills were also considered and measured by scores on the Computer-
Adapted Placement Assessment and Support Services (COMPASS; ACT 2012) Writing Skills
Placement Test. The criterion variable, academic achievement, was defined as end-of-course
grade in a developmental academic English course. The research questions for this study were:
1. What are the academic self-efficacy beliefs, academic procrastination traits, and prior
academic skills of college students in a developmental course?
2. How do task aversiveness and fear of failure factors explain the underlying reasons
developmental education students procrastinate in college as represented by the
Procrastination Assessment Scale-Students (PASS)?
3. What is the relationship between academic self-efficacy, academic procrastination, and
prior academic skills to academic achievement of college students in a developmental
course?
Theoretical Framework
Social cognitive theory (Bandura, 1986), a psychological theory of human learning and
development, provided the theoretical foundation for this study. Social cognitive theory explains
that student learning occurs through an interaction of behavior, cognitive factors, and the
environment. Bandura (1986) believed that as students learn they self-direct or self-regulate their
environment depending on their self-efficacy or perception of their capability to deal with their
current reality. Students who can self-regulate should be able to monitor or keep track of their
own behaviors, evaluate their actions for effectiveness, and respond to their behavior by
modifying, rewarding, or discounting it.
Social cognitive theory assumes that self-regulation is dependent on goals. Students are
able to manage their thoughts and actions in order to reach specific outcomes such as improved

9
academic achievement (Schunk, 2001). Behaviors such as procrastination demonstrate a lack of
self-control or self-regulation and may be related to lower academic self-efficacy and lower
academic achievement. According to social cognitive theory, students who report frequent
procrastination may also have lower levels of academic self-efficacy resulting in lower academic
achievement. Academic self-efficacy is specific to certain environments or situations. In
educational environments, students must adapt self-directed learning processes to specific
domains and feel efficacious about it (Schunk, 2001). Students have the ability to choose and
direct their own actions. In educational environments, the ability to self-direct learning depends
on motivation set by a student’s internal standards and self-evaluative reactions to actions
(Bandura, 1986).
Self-efficacy is the “belief in one’s capabilities to organize and execute the courses of
action required, producing given attainments” (Bandura, 1997, p. 3). Academic self-efficacy is
defined as individuals’ belief in their ability to successfully achieve an academic goal (Bandura,
1977). In an academic environment, academic self-efficacy influences achievement behaviors of
students by choice of activities, effort, expenditure, persistence, and learning. Students who feel
efficacious about learning expend more effort and persist longer (Schunk, 1991, 2001). In turn,
students’ actions modify their self-efficacy. As students work on tasks, they note their progress
toward learning goals. Progress indicates they are performing well and enhances their academic
self-efficacy (Schunk, 2004). Students develop perceptions of their academic self-efficacy in
reference to specific capabilities (Pajares, 1996). Students with high self-efficacy for academics
have been found to have high achievement regardless of ability levels (Collins, 1982).
Social cognitive theory (Bandura, 1986) is particularly well-suited to explain the complex
relationships of academic procrastination, academic self-efficacy, and academic achievement in
10
the context of student learning. Academic procrastination in college students demonstrates a lack
of self-control and, when combined with lower self-efficacy for academics, can lead to lower
academic achievement (Bandura, 1997; Burka & Yuen, 1983; Judge & Bono, 2001).
Academic procrastination is easily identified as a behavior linked to students’ ability to
self direct learning. Social cognitive theory indicates that students with a high sense of academic
self-efficacy make greater use of cognitive strategies, manage their time and learning
environments better, and monitor and regulate learning more closely (Pintrich & Schraubern,
1992). It is likely that students who procrastinate less also possess higher academic self-efficacy
and, ultimately, higher achievement in school.
Importance of Study
Educators, advisors, counselors, and psychologists have all contributed to research and
literature about student behaviors such as academic procrastination. They are challenged within
their areas of practice to apply sound intervention approaches to these complex behaviors
(Schouwenburg et al., 2004). Knowledge from studies conducted since the 1980s has confirmed
that behavioral, cognitive, and emotional components (Ferrari, Johnson, & McCown, 1995), as
well as academic self-efficacy beliefs (Bandura, 1986), contribute to students’ procrastination
tendencies. Educators continue to interpret the multiple causes of academic procrastination and
apply specific intervention techniques such as counseling and workshops for helping students
achieve success. Because there are many causes for academic procrastination, educators must be
aware of the major factors and acknowledge different approaches to support students’ efforts to
change (Shouwenburg et al., 2004).
To date, studies have not closely examined relationships of academic procrastination
tendencies and academic self-efficacy beliefs for students taking developmental courses.

11
Coordinated interventions for students in developmental education have historically focused on
three areas: (a) restructuring curriculum, (b) developing new institutional structures, and (c)
employing specific instructional strategies or technologies that are designed to enhance learning
(Levin & Calcagno, 2008). Trends in education are forcing colleges to take a closer look at
developmental education including (a) large numbers of non-traditional students entering
colleges, (b) institutions voicing moral and financial concerns about retention, and (c) legislators
and taxpayers requiring a higher level of accountability (Shaw, 2000).
Included in the reexamination of developmental education must be academic support
programs and interventions offered by educators, advisors, and counselors who witness specific
negative student behaviors such as procrastination. Findings from this study may contribute to a
deeper understanding of students in developmental education courses by providing useful insight
to develop targeted intervention strategies designed to reduce procrastination behaviors, regulate
learning, and raise academic achievement.

12
CHAPTER 2
REVIEW OF LITERATURE
This chapter provides a review of the literature pertaining to students in developmental
education. The review begins with the background of developmental education, an examination
of students in developmental education, and the impact of developmental education. The use of
the COMPASS test for placement of students in college is also discussed. The impact of the
study’s predictor variables including academic procrastination, academic self-efficacy, and prior
academic skills as reflected by the COMPASS Writing Skills Placement Test follows. Finally, a
discussion of social cognitive theory concludes this review.
Developmental Education
The evolution of developmental education begins with a discussion of the use of the term
remedial education. From the 1860s through the 1960s the term remedial education was used to
describe the developmental education field. The term remedial is an approach to educating
students with specific skill deficits and addresses programs and curriculum that target these
deficits. The term remedial often refers to fixing or correcting a deficit and is often associated
with or compared to medical models in which students are assessed for an academic weakness
and then prescribed a treatment (Clowes, 1980). The term remedial shares its roots with the word
remedy meaning to cure or make whole. Use of the term remedial can be interpreted to describe
students as academically backward or less able, with the focus on bringing them up to an
acceptable skill level or competence (Clowes, 2001). Viewing remedial education in this light
indicates that students repeat academic treatments until they achieve the desired results. The
13
focus of remedial education in this definition is about improving cognitive deficits (Arendale,
2005). Reviews of the literature in developmental education reveal that remedial is a commonly
used term across educational levels to describe student’s weaknesses or deficiencies (Casazza,
1999). Remedial education is also the term most often associated with underprepared students.
The College Reading and Learning Association Taskforce on Professional Language
(Rubin, 1991) defines remedial as “instruction designed to remove a student’s deficiencies in the
basic entry or exit level skills at a prescribed level of proficiency in order to make him/her
competitive with peers” (p. 30). This definition implies that students are required to participate in
academic improvement courses or programs as a condition of entry into college or before taking
college credit courses (Arendale, 2005). The current Glossary of Developmental Education and
Learning Assistance Terms (Arendale, 2007) defines a remedial student as “a student having
potential for college success after completing required academic improvement courses due to
significant underpreparation in one or more academic skill areas” (p. 10). The term remedial has
not changed significantly from its earlier interpretations.
Beginning in the 1970s the term developmental education began to emerge as a term in
the field of education borrowed from the study of college student personnel. This view is based
on the assumption that all students are developmental (Arendale, 2005). The view of
developmental education using this terminology is seen as a more comprehensive model of
education because it focuses on the holistic development of the student in both academic and
affective domains and is rooted in developmental psychology (Boylan, Bonham, & White, 1999).
This perspective assumes that each student has skills or knowledge that can be developed. The
latest definition for developmental education has been revised and expanded by the National
Association for Developmental Education (2012) stating that “developmental education is a field
14
of practice and research with a theoretical foundation in developmental psychology and learning
theory. “Developmental education promotes the cognitive and affective growth of all learners, at
all levels of the learning continuum” (Arendale, 2007, p. 10). A developmental education
student is a student assessed as having potential for college success when appropriate educational
enrichment and support services are provided (Arendale, 2007).
In colleges today there is still confusion about whether or not to use the word remedial or
developmental. Word choice between using remedial and developmental can be significant
representing an approach or basic philosophy emphasizing different educational approaches. In
the field and practice of developmental education, word choice is important and should be
governed by the most appropriate phrase that accurately describes the services, targeted student
population, and purpose of the field (Arendale, 2005). In most instances it is more appropriate to
use the term developmental rather than remedial.
Students in Developmental Education
The National Study of Developmental Education II (Gerlaugh, Thompson, Boylan, &
Davis, 2007) indicates that 28% of entering college students takes at least one developmental
course in reading, writing, or mathematics and 42% of community college students enroll in at
least one developmental course. There is wide variation across states and within each
postsecondary sector. State-level remediation rates at public four-year colleges range from 6% to
50% (Education Commission of the States, 2002).
According to the National Center for Education Statistics National Postsecondary Student
Aid Study (NPAS; 2010a), approximately 36% of first-year undergraduate students reported that
they had ever taken a developmental course. Twenty percent of first-year undergraduates
reported that they had taken at least one developmental course in 2007-2008. The statistical data

15
indicates that more students taking developmental courses are women. In 2007-2008, 39% of
women reported taking a developmental course vs. 33% of men. The number of White first-year
undergraduate students who reported taking a developmental course was 31%, a smaller number
than all other racial/ethnic groups. Higher percentages of Black students (45%), Hispanic
students (43%), and Asian student (38%) reported ever taking a developmental course. The
students 18 years or younger who reported ever taking a developmental course was 29.7% and
the percentage increased for each age group 19-23 (36%), 24-29 (42.5%), 30-39 (43.2%) and 40
years and older (40.8%). However in 2007-2008, most students who took a developmental
course in that one year were 18 years or younger (29.7%), followed by 19-23 year olds (17.9%),
24-29 year olds (16.8%), 30-39 year olds (15.1%), and 40 year olds or older (13.7%). Low
income students are most likely to take a developmental course with those with the lowest 25%
income (41.9%), middle 50% income (38.1%), and the highest 25% income (31.3%). Most
students taking developmental courses also work full time (35 or more hours per week) (40.9%),
followed by part time workers (37.3%), and those who did not work (34.1%) (NPAS; 2010a).
Impact of Developmental Education
Many colleges and universities in the United States provide developmental education
services to students. Developmental education may include a comprehensive range of services
including assessment and placement, advising, developmental courses, supplemental instruction,
and tutoring. The most commonly used intervention described in developmental education
programs is the developmental education course. A structured course provides the most efficient
means of conveying information to a large number of students at the same time (Boylan et al.,
1999).

16
Developmental education courses at most colleges are offered each semester and
numbered usually below the 1000 level. For example, Math 0099, English 0099, and Reading
0099 are courses which indicate levels below the 1000 level of courses. Most colleges have
between one and three levels for developmental courses. The three main subject areas generally
offered in developmental education courses include English, reading, and math. Basic English
composition or basic writing skills courses are designed to develop a student’s ability to write
complete, grammatically correct sentences and to combine them into unified, coherent, complete
paragraphs. An English faculty member or adjunct will teach these courses. Basic Math skills
courses are designed to develop a student’s computational skills through intensive coverage of
arithmetic concepts. Basic Reading skills courses are designed to develop a student’s ability to
read critically in different formats, to expand vocabulary, and to adjust reading rates. Other
courses offered in many institutions include library skills, basic study skills, and personal
development (Farmer & Barham, 2001).
The number of levels of developmental courses has a direct impact on students. Research
conducted by Bailey, Jeong, and Cho (2008) found that students placed in developmental courses
many levels below college curriculum did not complete their courses. Between 40% and 50% of
students who placed into two or three levels below college-level did not complete their first
developmental courses. More than one-third of all students who did not finish the first
developmental course in their sequence did not enroll in a college course in a subsequent
semester within three years. For this reason, research about developmental education that
considers the effectiveness of enrolling students in any developmental course seems to indicate
that doing so has little effect since students are not completing the sequences.

17
Best practices for developmental education programs evolved from over thirty years of
research. Examples of best practices include implementing mandatory assessment and
placement, promoting an institutional commitment to developmental education, encouraging
professional development for those who work with developmental students, engaging in regular
program evaluation, and integrating classroom, learning assistance, and laboratory activities.
Professionals in developmental education assess student needs and recommend the type and
duration of developmental interventions to help students meet their academic goals. The
interventions of professional developmental educators, counselors, and advisors, are usually
comprehensive, combining instructional strategies with diagnostic testing, advising, and
counseling services (Boylan et al., 1999).
Measuring the impact of developmental education in any given state or region has been
problematic for many reasons. Methodological problems in studies comparing developmental
and non-developmental students make it difficult to control for all student characteristics, which
makes the study results unreliable. Few studies address the problem of unmeasured differences
or selection bias in the research. In developmental education literature, three state studies used
longitudinal data sets and quasi-experimental methods to derive causal estimates of the effects of
developmental education (Bailey, 2009). Bettinger and Long (2005) examined data in Ohio from
first-time degree seeking community college students who were eighteen, nineteen, or twenty
years of age and who had taken the ACT assessment test. Positive outcomes were reported for
students placed in math remediation. Those students were found to be 15% more likely to
transfer to a four-year college, and they took approximately ten more credit hours than student
with similar backgrounds who were not required to take developmental courses. Martorell and
McFarlin (2011), examined students in Texas and found that remediation improved grades in the

18
first college-level math course but found no effect on transferring to a four-year college or
completing a degree. Calcagno (2007) and Calcagno and Long (2008) found that students in
Florida who scored just below the cutoff for taking college level math were more likely to persist
to their second year than those who scored just above the cutoff. They also found that
developmental math students accumulated more total credits (Bailey, 2009). These state studies
provide mixed results about the effectiveness of developmental education courses. The Texas
and Florida studies suggested students gained little from developmental education courses, and
the Ohio study showed only marginal positive results. The results of all three longitudinal state
studies were most reliable for students whose placement test results were near the cutoff for
college level course placement. The results do not provide much insight into the effectiveness of
developmental education for students with weaker skills (Bailey, 2009). These studies also
provide an average statewide picture that obscures institutional-level variation.
Institutions that have achieved positive results from developmental education courses or
interventions can provide valuable insight to educators if their programs are continuously
evaluated and reported. It is also likely that some subgroups may benefit more from
developmental programs than others. The Ohio study found positive results for traditional aged
students, and the Calcagno (2007) study found positive results for older students. On average,
studies show that developmental education as it is practiced is not very effective in overcoming
academic weaknesses partly because many students do not finish the sequences to which they are
referred (Bailey, 2009). This has justified a broad based effort to reform and rethink
developmental education and the findings from research. Based on a review of the literature,
Pascarella and Terenzini (1991, 2005) suggested that institutions can aid the academic
adjustment of students in developmental education by providing extensive instruction in

19
academic skills, advising, counseling, and comprehensive support services (Bailey, 2009).
Developmental education will evolve and very likely continue to be a part of education in the
United States. The use of sound, research-based, developmental education practices and
programs must be offered to support the requirements of an increasing number of students taking
developmental courses in college today.
The COMPASS Test
The COMPASS Test is a computer or internet-delivered test that evaluates students’
skills for placement in college. The subject areas measured by the COMPASS placement tests
(ACT, 2012) are mathematics, reading, writing skills, and English as a second language. The
COMPASS placement test is not a pass fail test but is used to measure academic skills. The
COMPASS test is untimed and computer-adaptive, which means that the test adapts itself to test
takers by selecting the next item to be presented based on the basis of performance of the
previous items. Adaptive testing was first recognized in the early days of psychological
measurement before the development of standardized conventional paper-and-pencil test by
Alfred Binet who developed the Binet IQ test (Binet & Simon, 1905). Computer-adaptive testing
(CAT) is the more powerful successor to adaptive testing. When a student answers the questions
on a computer adaptive test, the testing will stop when the test-taker's ability is determined to the
required accuracy.
Using placement tests, students receive numeric scores and course placement is based on
whether or not a score is below a cutoff determined by the institution. Annually more than 1300
postsecondary institutions use COMPASS placement tests. Evidence about placement accuracy
rates for the COMPASS can be found in a meta-analysis by American College Testing Program
(ACT; 2006). Placement accuracy rates generally range between 60% and 80%. As Hughes and
20
Scott-Clayton (2011) indicate, there is limited evidence on placement test accuracy because
much of the evidence on the predictive power of the placement tests comes from the test
developers themselves. Success criterion for the validity of the test is usually defined as
achieving certain minimum grades in the higher-level courses. Because many students may never
enroll in the courses to which they are assigned or drop out before a grade is received, the
evidence can be questionable (Bailey et al., 2008). From state to state there is a high degree of
variation in which tests are used, how COMPASS tests are administered, whether tests are
mandatory or voluntary, and when developmental courses must be completed (Hughes & Scott-
Clayton, 2011). COMPASS tests are intended to be used in placing students into college courses.
The COMPASS tests are considered valid if the tests measure the skills and knowledge students
need to succeed in specific courses. Students who have the skills necessary to succeed are likely
to perform satisfactorily on the COMPASS tests, and students without the skills are not. When
ACT ran a validity check using 68 institutions, it found the median accuracy rate consisting of
the percent of students appropriately placed in either the standard-level or the developmental
English course was 66%. This represented a 19% increase in appropriate placement over using
no placement test (ACT, 2006).
Procrastination
Procrastination occurs when one delays beginning or completing an intended course of
action (Beswick & Mann, 1994; Ferrari, 1993; Lay & Silverman, 1996; Milgram, 1991; Silver &
Sabini, 1981). Most definitions of procrastination have in common a postponing, delaying, or
putting off of a task or decision. Academic procrastination can best be understood as the
expression of procrastination in an academic situation. Academic procrastination is defined as
failing to perform an academic activity within a desired timeframe or postponing until the last
21
minute activities one needs to complete (Wolters, 2003). Most procrastination behaviors in an
academic situation concern the completion of academic assignments such as preparing for
exams, doing homework, and writing papers (Schouwenburg et al., 2004). An alternative
definition includes the postponement of academic goals to the point where optimal performance
becomes highly unlikely (Ellis & Knaus, 2002). Authors of the instrument most widely used to
measure academic procrastination, the Procrastination Assessment Scale-Students (PASS;
Solomon & Rothblum, 1984), defined procrastination as the act of needlessly delaying tasks to
the point of experiencing subjective discomfort. This definition identifies procrastination with
dilatory behavior (procrastination in the strict sense) but also emphasizes needlessly and
subjective discomfort (Ferrari et al., 1995), reflecting that academic procrastinators tend to
experience problematic levels of anxiety associated with their procrastination (Rothblum,
Solomon, & Murakami, 1986).
The Latin origin for the term procrastination includes the word pro meaning forward,
forth, or in favor of and crastinus meaning of tomorrow (Klein, 1971). Procrastination behaviors
have existed throughout history. In Latin texts the term procrastinus was used in reference to
military battles indicating that deferred judgment and waiting out the enemy demonstrated a wise
course of action. The term procrastination continued to be used commonly in the early 1600s as
wisely chosen restraint (Ferrari et al., 1995). By the late 1600s the topic of procrastination began
to emerge in religious sermons as ministers described it as a moral sin and rallied their
congregations against such evil (Steel, 2007). It was not until around 1750 with the onset of the
Industrial Revolution that procrastination took on an even more negative connotation (Ferrari et
al., 1995). The more industrialized a society with its need to adhere to schedules and punctuality,
the more that society casts procrastination negatively (Milgram, 1992). In 1749 Lord
22
Chesterfield wrote, “No idleness, no laziness, no procrastination; never put off till tomorrow
what you can do today” (Steel, 2007, p. 66).
Procrastination is a personality trait (Schouwenburg et al., 2004). There is even support to
indicate that genetic factors may be involved. In a study conducted with 118 sets of identical and
fraternal twins, Arvey, Rotundo, Johnson, and McGue (2003) found that 22% of the variance on
an item concerning procrastinators was associated with genetic factors. An additional study
Elliot (2002) obtained long-term test-retest data for 281 participants who took the Adult
Inventory of Procrastination (AIP; McCown & Johnson, 1989). In the time period of 10 years,
the correlation was .77, an indication that procrastination is stable enough to be a trait. Academic
procrastination occurs because of individual differences factors and is most often related to the
Conscientiousness factor in the Big Five model of personality (Costa & McCrae, 1992). The Big
Five model of personality includes the factors of Extraversion, Agreeableness,
Conscientiousness, Neuroticism, and Openness. The Conscientiousness factor includes the facets
of order, dutifulness, self-discipline, achievement striving, competence, and deliberation.
Causes and correlates of procrastination have been studied extensively. Steel (2007)
reported in a meta-analysis that the causes and correlates for procrastination are divided into four
areas: task characteristics, individual differences, outcomes, and demographics. Research
looking at task characteristics examines procrastination with an understanding that people who
procrastinate voluntarily choose one behavior or task over another. Factors associated with task
characteristics of procrastination (task aversiveness) include timing of rewards and punishments.
Procrastination behaviors relating to demographic factors such as age, gender, and year
(progression of time) have yielded common views. It is believed that people may tend to
procrastinate less as they age and learn to adapt new behaviors because they develop schemes to

23
overcome procrastination (O’Donoghue & Rabin, 1999). People also learn to avoid
procrastination. Ainslie (1992) and Baumeister, Heatherton, and Tice (1994) both found that
people tend to procrastinate less with repeated practice. This belief suggests that self-regulation
and reduction of procrastination can be improved through exercise, just as a person can
strengthen muscles. Self-regulation can be the trump card of personality. If a person’s behavior
reflects a lack of self-control, regular exertions of self-regulation in the form of activities (i.e.,
daily diaries, tracking food eaten, and consciously improving posture, can lead to steady
reduction in these tendencies (Baumeister et al., 1994).
Studies about gender differences in procrastination yield mixed results (Feingold, 1994).
Reviews of the literature and research in a meta-analysis indicate girls score higher on effortful
control than boys and thus may procrastinate less (Else-Quest, Hyde, Goldsmith, & Van Hulle,
2006). There is also a possibility that procrastination may be on the rise similar to other forms of
self-regulatory behavior failure, e.g., obesity, gambling, and excessive debt (Kachgal, Hansen, &
Nutter, 2001; Steel, 2007). Researchers should remain cautious, as with any other self-reported
behavioral tendencies, because a trend could represent an overall greater willingness to admit
procrastination rather than a true change in behavior within society (Steel, 2007).
Theoretical Framework of Procrastination
Psychoanalytic theories formed some of the earliest explanations of psychological
behaviors including procrastination. Freud (1953) believed that anxiety was a warning signal to
the ego of repressed unconsciousness and could result in a variety of defenses including
procrastination. Freud believed that tasks not completed were avoided because they were
threatening to the ego. According to psychoanalytic theories of procrastination, chronic lateness
24
is related to an unconscious fear of death, viewed as an unconscious attempt to delay mortality
by showing contempt for constraints of the clock and calendar (Ferrari et al., 1995).
As views of psychoanalytic theories became less popular, emerging viewpoints about
procrastination relied on psychodynamic theories. Psychodynamic theories emphasized the
symbolic aspects of procrastination as it relates to previous childhood experiences, especially
childhood traumas. It was believed that childhood experiences shaped the cognitive processes of
adults. Procrastination in this view indicates that an adult confronted with a task evaluates his or
her personal worth, resulting in a tendency to procrastinate rather than face the imposed demands
(Van der Kolk, 1987). Ideas about faulty child-rearing also contribute to views about
procrastination (MacIntyre, 1964; Spock, 1971). In these interpretations, a permissive parent is
likely to produce a nervous underachiever, who is too anxious to meet future self-imposed
deadlines. A parent who is too stern may produce an angry child who claims his or her
independence and has a disregard for the authority of time constraints (Ferrari et al., 1995).
Academic Procrastination
Views about academic procrastination in student populations evolved from behavioral
theories (Ferrari et al., 1995). A behavioral interpretation views academic procrastination as a
task specific avoidance behavior. More specifically are Skinner’s (1953) ideas about learning
and reinforcement theories. Reinforcement theories view learning as the “reassortment of
responses in a complex situation” (p. 65). In this view, academic procrastination depends on both
punishments and rewards. Procrastination occurs most frequently in students who have either
been rewarded for it or who have not been punished enough for the behavior (Ferrari et al.,
1995). Students who procrastinate have a history of successful procrastination or at least finding
more reinforcing tasks to do than studying (Bijou, Morris, & Parson, 1976).
25
Over time, ideas about academic procrastination have evolved to include cognitive
components and cognitive-behavioral explanations. The first explanation of procrastination from
a cognitive-behavioral perspective came from Ellis and Knaus (1977), who related
procrastination tendencies to irrational fears and self-criticism (Ferrari et al., 1995). Cognitions
that relate to academic procrastination behaviors in students include false estimates of time
needed to complete a study task, misconceptions about the influence of discounting on study
motivation, and low self-efficacy. These behaviors may be responsible for contributing to
continued procrastination. Counselors who adopt this view believe that interventions aimed at
changing student’s cognitions could break these reinforcing effects (Schouwenburg et al., 2004).
Most academic procrastination intervention methods used in colleges today have a basis in
psychotherapy and rely on a cognitive-behavioral perspective.
Fear of failure and task aversiveness have received considerable support as two general
primary motives for academic procrastination (Blunt & Pychyl, 1998, 2000; Milgram, Batori, &
Mowrer, 1993; Schouwenburg, 1993; Solomon & Rothblum, 1984). Task aversiveness is defined
in terms of how unpleasant or unenjoyable a task is to perform (Blunt & Pychyl, 2000). Factors
associated with fear of failure include anxiety about meeting others’ expectations, concerns
about meeting one’s own standards, and lack of self-confidence (Solomon & Rothblum, 1984).
It seems evident that both the nature of the work tasks and students’ personal attributes interact
to produce a pattern of avoidance in academic procrastination (Schouwenburg, et al., 2004;
Walker, 2004).
Academic procrastination is a behavior that is common among college students. Solomon
and Rothblum (1984) found that 46% of undergraduates participating in their study
procrastinated on writing term papers, 27.6% when studying for exams, and 30.1% when reading
26
weekly assignments. Onwuegbuzie (2004) reported even higher percentages using the
Procrastination Scale-Students (PASS; Solomon & Rothblum, 1984), with 41.7% procrastinating
on term papers, 39.3% when studying for exams, and 60% when reading weekly assignments.
Academic procrastination also has been associated in college students with depression (Solomon
& Rothblum, 1984), guilt (Pychyl, Lee, Thibodeau, & Blunt, 2000), anxiety (Rothblum et al.,
1986), neuroticism (Watson, 2001), irrational thinking (Bridges & Roig, 1997), cheating (Roig &
De Tommaso, 1995), and low self-esteem (Ferrari, 1992, 2000). Much research indicates that
academic procrastination has a negative impact on academic achievement including lower grades
and grade point averages (Beck et al., 2000; Clark & Hill, 1994; Ellis & Knaus, 2002; Harriott &
Ferrari, 1996; Solomon & Rothblum, 1984; Wesley, 1994).
Low self-efficacy is also highly related to academic procrastination (Blunt & Pychyl,
2000; Ferrari, 2004). A current view of academic procrastination examines a pattern in which
frequent delays in tasks is a way of life across settings and situations (Ferrari et al., 1995; Ferrari
& Pychyl, 2000). It is believed that procrastination occurs in a variety of students with a wide
range of characteristics. In short, there may be no typical profile of academic trait procrastinators
to which one might address interventions because the network of psychological variables is so
complex. Instead, there may be classes of typical profiles of procrastinators in academic settings
such as underachiever procrastinators or perfectionist procrastinators (Ferrari, 2004).
More research about academic procrastination is needed to clarify antecedent factors that
predict who will engage in academic procrastination, the role of social systems, and situations
that promote the behavior. Additional development of the theoretical models is needed to explain
why academic procrastination exists and what to do to help students. Since most of the research
on academic procrastination has relied on self-report measures, it will be important in the future
27
to examine academic procrastination using other objective behavioral indexes and outcomes in
the classroom like the time it takes to return class assignments, hours spent working on projects,
cheating, and plagiarism as it relates to student performance (Ferrari, 2004).
Social Cognitive Theory
Social cognitive theory (Bandura, 1986) is a psychological theory of human learning and
development. Originally referred to as social learning theory (Bandura, 1977), it challenged
behavioral theories of the 1950s and 1960s, which emphasized learning by direct reinforcement.
One of the main ideas of social cognitive theory is that learning occurs through observation of
others (observational learning). Through observing and modeling behaviors, people form ideas
about new behaviors, which are coded and used as a guide for action. People use several
capabilities to control their self-development and move toward change including symbolizing,
modeling, self-regulation, and self-reflection (Schunk, 2001).
Underpinning social cognitive theory is the belief that learning occurs within a social
context. Social cognitive theory and its principles are applied extensively in healthcare, media,
and education. A model of human functioning and learning known as triadic reciprocality
explains that behaviors, cognitive factors, and environmental events all operate as influences and
determinants of each other (Bandura, 1977, 1986). Within educational settings social cognitive
theory provides a deeper understanding about how children, adolescents, and adults learn and
develop. Today, this knowledge has expanded to include students in higher education,
particularly relating to two important constructs: self-regulated cognitive development and
perceived self-efficacy.

28
Academic Self-Efficacy
Self-efficacy is a key component of social cognitive theory. Academic self-efficacy is an
individual’s belief in his or her ability to successfully achieve an academic goal (Bandura, 1977).
Bandura (1986) defined self-efficacy as “people’s judgments of their capabilities to organize and
execute courses of action required to attain designated types of performances” (p. 391). Self-
efficacy has been linked to motivational constructs like persistence and goal setting (Multon et
al., 1991; Schunk & Ertmer, 1999), self-regulated learning (Pintrich & DeGroot, 1990),
achievement (Pajares & Miller, 1995), and affective behaviors such as stress, distress, and
anxiety (Finney & Schraw, 2003).
Efficacy beliefs operate with other sociocognitive factors governing human adaptation and
change (Bandura, 1993). Effective functioning requires both skills and efficacy beliefs, meaning
that a person must continuously adapt their subskills to manage ever-changing situations. Self-
efficacy is not viewed as a trait, but as a differentiated set of self-beliefs that link to different
situations. Efficacy beliefs determine a person’s actions in concert with the self-regulation of
thought processes, motivation, and affective and physiological states (Bandura, 1997).
People gain self-knowledge about their efficacy from four sources of information:
performance attainments, vicarious experiences of observing performance of others, verbal
persuasion, and their own physiological state (Bandura, 1986). Actual performance offers the
most valid source for knowledge about self-efficacy. A person may also acquire knowledge
about their own self-efficacy by observing others succeeding. Observing similar others succeed
raises the observer’s self-efficacy and motivates them to try tasks (Schunk, 2004).

29
Theoretical Framework of Academic Self-Efficacy
Social cognitive theory explains that social or environmental factors can affect many
personal variables such as learner’s goals, attributions, self-evaluations of learning progress, and
self-regulatory processes (Schunk, 2004). Internalization of social variables is part of a learner’s
transformation. Learners alter and adjust their social environments to enhance achievement by
increasing skills in a social-to-self transformation process (Schunk, 1999).
Typically, students who perform well have confidence in their learning capabilities and
expect positive outcomes for their efforts. Bandura (1986) believed that self-efficacy exerts a
more substantial impact on academic performance than skill development because it increases
the quality of thinking, increases the student’s acquisition of cognitive skills, and increases the
student’s persistence in their search for solutions. Academic self-efficacy has been linked to
academic grades (Elias & Loomis, 2000; Lent, Brown, & Larkin, 1986), academic major
selection (Betz & Hackett, 1983), academic major persistence (Lent et al., 1984), and academic
motivation (Bandura, 1977).
According to Bandura (1997), academic self-efficacy is a better predictor of intellectual
performance than skills alone. The influence of self-efficacy beliefs in academic functioning has
strengthened Bandura’s claim over time that self-efficacy plays a role in human agency.
Students’ behavior can more often be accurately predicted by self-efficacy beliefs rather than
what they are actually capable of accomplishing. Self-efficacy in educational research has
received much attention especially in studies of academic motivation (Pintrich & Schunk, 1995).
In academics, efficacy can influence the choice of activities that student’s make. Students with
low efficacy for learning may avoid attempting tasks and those with high self-efficacy for
learning may participate more eagerly. Efficacy also effects student effort and persistence.

30
Students who feel efficacious about learning expend greater effort and persist longer than
students who doubt their capabilities, especially when they encounter difficult situations
(Schunk, 2004).
There are three main areas of focus for self-efficacy research in academics. These
include influence on career choices (Hackett, 1995), self-efficacy beliefs of teachers related to
their instructional practices (Tschannen-Moran, Woolfolk-Hoy, & Hoy, 1998), and student’s
self-efficacy beliefs as they have been correlated with other motivational constructs and
academic performance (Pajares, 1996, 1997). Even though efficacy beliefs play a vital role in
social cognitive theory they are not the sole determinant of action because they operate in
concert with other sociocognitive factors (Bandura, 1993). Self-efficacy should not be viewed as
a trait but as a differentiated set of self-beliefs that link to different situations. Efficacy beliefs
influence control over a person’s actions and are combined with the self-regulation of thought
processes, motivation, and affective and physiological states. Effective functioning requires both
skills and high efficacy beliefs, and to achieve continuous effective functioning, a person must
continuously adapt subskills to manage ever-changing situations. Self-influences can affect
social environments for example when learners decide they need more instruction on a skill and
seek out a qualified teacher. Internalization of social variables to self-influences is part of the
learner’s transformation into self-regulatory control. With increased skill acquisition the social-
to-self transformation process becomes a bi-directional interactive process as learners alter and
adjust their social environments to enhance achievement (Schunk, 1999).
Self-efficacy and outcome expectations are not the same thing. Self-efficacy refers to
perceptions of one’s capabilities to produce actions, while outcome expectations refer to beliefs
about the anticipated outcomes of those actions. These concepts are distinct but are often related

31
(Schunk, 2004). The difference in outcome expectations and self-efficacy beliefs is illustrated
with an example. If a student has high self-efficacy for learning they may still expect a low grade
because they think the teacher does not like them. Self-efficacy is also often confused with self-
concept. Academic self concept about content areas focuses on the past and implies that skills are
fixed while academic self-efficacy focuses on the prospective performance and implies that skills
are dynamic, generative capabilities (Lent, Brown, & Gore, 1997).
Academic self-efficacy is a concept that fits well with constructs of school learning and
other achievement situations. As a key component of social cognitive theory, social or
environmental factors may affect many personal variables such as learner’s goals, attributions,
self-evaluations of learning progress, and self-regulatory processes. Typically, students who
perform well have confidence in their learning capabilities and expect positive outcomes for their
efforts.
Academic Achievement
Academic achievement or student achievement is defined by the Student Learning,
Student Achievement Task Force (Rubin, 2011) as “the status of subject-matter knowledge,
understandings, and skills at one point in time” (p. 30). The concept of academic achievement
has changed over time. Post-World War II instruction in American schools was heavily
influenced by the concept of mental ability as an understanding of student functioning.
Thurston’s (1938) development of the Primary Mental Abilities Test was touted as providing the
full measure and range of student abilities. During the 1960s, social and environmental
formulations of achievement rose to prominence. There was less reliance on grading for
promotion, more flexible curricular requirements, and added concern about student’s social
adjustment. Declines in educational standards and declining measures in national achievement

32
brought a new focus on a back to basics approach to learning aimed at raising standards,
including the number of courses required in high schools and colleges, stringency of testing for
school entrance, promotion, and graduation, and the qualifications for hiring teachers
(Zimmerman, 1989).
Academic achievement is typically assessed in one of three ways: school grades,
standardized test scores, or teacher ratings (Pinxten, Fraine, Van Damme, & D’Haenens, 2010).
Teacher ratings are obtained from teachers about their students’ levels of academic achievement,
usually using a Likert scale. An example using teacher ratings is a study by Guay, Marsh, and
Boivin (2003), which asked teachers to rate their students’ achievement as (a) far under the
mean, (b) slightly under the mean, (c) at the mean, (d) slightly above the mean, and (e) far above
the mean. This type of rating is referred to as an indirect teacher rating given that teachers are
not asked to estimate achievement test performance (Pinxten et al., 2010). Ratings may be used
in instances where formal grades are not given, especially for early school years or where
teachers’ grades are idiosyncratic to each teacher (Guay et al., 2003). Ratings are not preserved
in school records, whereas grades are assigned by teachers and are kept as official school
records.
Grades are reflective of achievement in a particular course and in a snapshot of time
(Pinxten et al., 2010). Grades are subjective as they may be influenced by a teacher’s lenience or
harshness and by a teacher’s tendency to grade on a curve (Skaalvik & Hagtver, 1990). School
grades may reflect more than just a student’s course achievement level. Activities that teachers
think should constitute academic achievement and how to handle student efforts varies from
teacher to teacher. In addition grades often try to communicate multiple pieces of information
about students that cannot be contained within a single academic mark (Allen, 2005). Grades

33
create a public record of a student’s academic achievement that can communicate to others the
level of mastery of a subject.
Curriculum-based standardized tests are also used to assess achievement. The most
commonly used measure of student achievement is a standardized test. Standardized assessment
measures are specific to areas of achievement and are best understood as one measure of a subset
of a body of skills or knowledge. Although there are disadvantages to using standardized tests,
this type of achievement indicator has some advantages over teacher ratings and school grades.
Results from standardized tests can be generalized and compared over teachers, classes, and
schools (Pinxten et al., 2010). There is some debate in the literature about whether to use
standardized tests or grades as an indicator of academic achievement.

34
CHAPTER 3
METHOD
This chapter describes the methods and procedures used in this study. Social cognitive
theory (Bandura, 1986), a psychological theory of human learning and development, provided
the theoretical foundation for this study. Social cognitive theory explains that student learning
occurs through an interaction of behavior, cognitive factors, and the environment. Bandura
believed that as students learn they self-direct or self-regulate their environment depending on
their perception of their capability to deal with their current reality or self-efficacy. One self-
regulatory behavior that has been studied extensively is academic procrastination and its effect
on student achievement. Academic procrastination in college students demonstrates a lack of
self-control and, when combined with lower self-efficacy for academics, can lead to lower
academic achievement (Bandura, 1997; Burka & Yuen, 1983; Judge & Bono, 2001).
Purpose of Study
The purpose of this correlational study was to explore the relationship between academic
self-efficacy beliefs, academic procrastination, and prior academic skills on course outcomes for
students who must take developmental college courses. Predictor variables of academic self-
efficacy, academic procrastination, and prior academic skills were analyzed with the criterion
variable academic achievement.
35
Research Questions
1. What are the academic self-efficacy beliefs, academic procrastination traits and prior
academic skills of college students in a developmental course?
2. How do task aversiveness and fear of failure factors explain the underlying reasons
developmental education students procrastinate in college as represented by the
Procrastination Assessment Scale-Students (PASS)?
3. What is the relationship between academic self-efficacy, academic procrastination,
and prior academic skills to academic achievement of college students in a
developmental course?
Design
This correlational study explored relationships between academic achievement for
students in an English developmental course and three predictor variables, including academic
self-efficacy, academic procrastination, and prior academic skills. A correlational design was
appropriate because the relationship between a single criterion variable and multiple predictor
variables was of interest. Correlational designs are often used to study problems in education and
the social sciences because several variables may influence a pattern of behavior (Gall, Gall, &
Borg, 2007). Correlation studies can produce useful findings, but “lines of research and theory
building” (p. 341) are necessary to understand fully the variables and linkages to behavioral
patterns. Correlational designs are best utilized when a set of predictor variables that comprise a
meaningful variable system – one in which the variables share a meaningful construct – are
determined (Huberty & Petoskey, 1999).
Advantages of correlational research designs include the ability to analyze a large number
of variables in a single study, provide information concerning the degree of the relationships

36
between variables being studied (Gall et al., 2007), the ease of administration of data collection,
and ability to be repeated over time. One major weakness of a correlational design is that it is
useful only in establishing relationships and cannot establish causation. When analyzing
correlation studies, researchers must be cautious because extreme observations can strongly
influence both the r-value and regression line. In addition, possible lurking variables, or variables
that have an important effect but are not included among the predictor variables, could explain
observed associations between variables (Moore, 2007).
A convenience sample of students enrolled in developmental college English courses
(English 0099) at a 4-year college in the state of Georgia during a single semester was used for
this study. A convenience sample was selected because the target group was easily accessible
and willing to participate (Gall et al., 2007). The population of students who are enrolled in all
developmental college English courses in the State of Georgia would not be easily identifiable or
accessible. Results from this sample, because it was one of convenience, cannot be generalized.
Students enrolled in the course were asked to complete the Procrastination Assessment Scale-
Students (PASS; Solomon & Rothblum, 1984), the Academic Self-Efficacy Scale (ASES; Elias
& Loomis, 2000), and a short demographic questionnaire.
Students in English 0099 at the college used in this sample are typically first-year
students that do not have SAT or ACT scores high enough to place them into a college-level
English composition course. During the admissions process, college personnel determine
whether the student’s SAT or ACT meets minimum scores for placement into college-level
English or if further testing using the COMPASS placement test is required. Using the
COMPASS Writing Skills Placement Test, students may be placed into either College English

37
1101 or English 0099, the developmental course for English. After placement, students register
for the appropriate level of English course picking preferred times and days.
Participants
The target sample for this study was comprised of all students enrolled in a
developmental college-level English course during a single semester at a 4-year college in the
state of Georgia. This sample was similar to other students in the state of Georgia who take
developmental courses. In the state of Georgia there were 46,500 first-year students enrolled in
public colleges in fall 2008. Of those 46,500 students, 25% or 11,603 were required to take a
developmental course (University System of Georgia, 2008). Participants for this study were
enrolled in a 4-year college which had approximately 7,700 students. In fall 2011, 2% of students
enrolled were joint-enrollment students, 57% freshmen, 17% sophomores, 12% juniors, and 11%
seniors. The college was comprised of 54% women and 46% men with an average age of 23,
many coming directly from high school. The college student population consisted of 45% White
non-Hispanic, 31% Black non-Hispanic, 11% Hispanic/Latino, and 8% Asian. Twenty-five
percent of new students were placed into a developmental course. This figure is comparable to
other colleges in the state of Georgia where 25% of college freshmen in 2008 were required to
take a developmental course. When only 4-year colleges in Georgia are considered, of those
entering 4-year colleges directly from high school, 14% enrolled in developmental courses
increasing to 31.5% for students receiving Pell Grants (Complete College America, 2011).
Instructors in 13 English 0099 classrooms provided permission to visit their classes and conduct
the study. Approximately 15 students were enrolled in each of 13 classes for a total of 195
potential participants. Of the potential 195 participants, 151 completed surveys resulting in a
77% participation rate. Four students withdrew from the course, and an additional 7 students

38
provided either missing or incomplete data resulting in a sample of 140 students. After 17
outliers were removed from the sample, 123 students remained for data analysis.
The final sample was analyzed using SPSS release 19.0 software (IBM, 2010). A sample
size of 123 participants is considered sufficient for a multiple correlation study using Cohen’s
(1992) minimal sample size table. Cohen’s (1992) table is based on four criteria; the significance
criterion, either an estimate or the known population effect size, statistical power, and the
number of predictor variables or predictors. An estimation of a medium effect size of .30, with
an alpha level of .05, power of .80, and 3 predictor variables required a minimum of 76
participants. Sample demographic information is presented in Table 1. A majority of participants
were traditional age college freshmen with over 65% either 18 or 19 years of age. A majority of
the participants were African American and/or women enrolled in only one developmental
education course.
Table 1 Demographic Characteristics for Study Participants (N = 123) Variable N %a
Race/ethnicity American Indian or Alaska Native 3 2.4 Asian 3 2.4 Black or African American 76 61.8 Hispanic or Latino 18 14.6 White or Caucasian 20 16.3 Other 3 2.4
Age 18 27 22.0 19 54 43.9 20 14 11.4 21-25 16 13.10 Over 25 12 .09
Gender Men 45 36.6 Women 78 63.4
Number of developmental courses 1 54 43.9 2 49 39.8 3 20 16.3
Note. aPercent of sample (N = 123).

39
Instrumentation
Students completed two survey instruments (see Table 2), the Procrastination Assessment
Scale-Students (PASS; Solomon & Rothblum, 1984) and the Academic Self-Efficacy Scale
(ASES; Elias & Loomis, 2000). They were also asked to complete a short demographic
questionnaire. Previous research and literature has claimed that self-efficacy beliefs can relate to
or transfer across different performance tasks, especially when they require similar subskills. An
overall academic self-efficacy scale is justified to increase the practical utility for the measure
(Lent & Hackett, 1987; Multon et al., 1991). Self-efficacy should also generalize across
academic domains when commonalities are cognitively structured across activities. When
students realize that extra effort and persistence result in academic progress, they will likely
make similar connections to other subject areas (Pajares, 1996).
Quality measures for academic self-efficacy have evolved from many areas, but mainly
from career decision making self-efficacy literature and scientific and mathematics fields. The
ASES was based on two previously used scales, the Self-Efficacy for Broad Academic
Milestones scale developed by Lent et al. (1997) and the Self-Efficacy ER-S measure developed
by Lent et al. (1986). Scores from the Broad Academic Milestones scale produced a coefficient
alpha of .88. The ER-S scale produced a test-retest correlation over an 8-week period of .89, and
a coefficient alpha used to estimate internal consistency reliability was .89. In the original
development of the ASES, Elias and Loomis (2000) found coefficient alpha scores of .93 for Part
1 and .91 for Part 2.
College students’ academic self-efficacy was measured using the Academic Self-Efficacy
Scale (ASES; Elias & Loomis, 2000). Students were asked to rate their confidence for
completing specific items that related to an academic task using a 10-point Likert scale
40
representing confidence levels from 0 (no confidence at all) to 9 (complete confidence). High
scores indicated high academic self-efficacy. The ASES consists of two parts. The first part
includes 23 items and addresses students’ confidence in their ability to earn a grade of B in
specific individual courses such as physics, psychology, composition, and tennis. The criterion of
earning a letter grade of B was included by ASES authors (Elias & Loomis, 2000) to provide
respondents with a concrete criterion to consider. The second part of the ASES contains 12 items
and addresses academic milestones that students encounter during college. For example,
students indicated how confident they were in their ability to complete 45 semester hours of
upper-division (3000 and above) level courses. Items from the ASES were summed to provide an
overall score for academic self-efficacy.
Academic procrastination levels were measured using the Procrastination Assessment
Scale-Students (PASS; Solomon & Rothblum, 1984). The PASS is the most widely used
measure to explore procrastination on academically-related tasks (Ferrari et al., 1995). It was
developed to include the frequency of both cognitive and behavioral antecedents to academic
procrastination. Studies exist indicating that scores from the PASS possesses adequate reliability
and validity. Onwuegbuzie (2004) reported a coefficient alpha score reliability estimate of PASS
scores of .84 (95% CI = .80, .88) for the procrastination scale. Ferrari (1989) found a coefficient
alpha and test-retest reliability of a 6-week interval yielding .74 for prevalence of procrastination
using the PASS. A Turkish version of the PASS (Ozer, Demir, & Ferrari, 2009) produced a
Cronbach’s alpha for scores produced from the entire PASS of .86.
When the PASS was constructed, there were 13 possible reasons for academic
procrastination including perfectionism, evaluation anxiety, low self-esteem, task aversiveness,
laziness, time management, difficulty making decisions, peer pressure, dependency, lack of
41
assertion, risk taking, fear of success, and rebellion against control. After Solomon and
Rothblum (1984) conducted a factor analysis, they found that the two most often found
antecedents to academic procrastination were fear of failure and task aversiveness. These factors
accounted for most of the variance. Authors of the PASS (Solomon & Rothblum, 1984)
recommended grouping five survey items together to analyze fear of failure. Fear of failure items
on the PASS include reasons for procrastination (e.g., “you were concerned the professor would
not like your work, you were worried you would get a bad grade, you didn’t trust yourself to do a
good job, you were concerned you wouldn’t meet your own expectations, you set very high
standards for yourself and you worried that you wouldn’t be able to meet those standards”).
Three survey items on the PASS were grouped together and are referred to as task aversiveness.
Task aversiveness items include reasons for procrastination (e.g., “you really disliked writing
papers, you didn’t have enough energy to begin the task, and you felt it just takes too long to
write a paper”). The remaining factors consist of two or fewer items and account for low
amounts of variance.
The PASS is a two-part, 44-item scale developed in a study of 342 students measuring
academic procrastination levels in a variety of academic pursuits. The first part of the PASS
assesses the prevalence of procrastination in six academic areas, including (a) completing a
writing assignment, (b) studying for exams, (c) keeping up with weekly reading assignments, (d)
performing academic administrative tasks, (e) attendance tasks, and (f) school activities in
general. This section of the PASS is used to ascertain the frequency of procrastination on tasks
(e.g., "To what degree do you procrastinate on writing a term paper?”). Participants also use a 5-
point Likert scale to rate the degree that procrastination on the task is a problem, and to what
extent they want to decrease their tendency to procrastinate on the task. The PASS items

42
pertaining to (a) the frequency with which respondents procrastinate on tasks, and (b) whether
their procrastination on the task is a problem were summed to provide an overall measure of
academic procrastination, with total scores ranging from 12 to 60. Higher scores indicated
higher levels of academic procrastination. The second part of the PASS describes a
procrastination scenario, delay in completing a writing assignment, and then provides statements
of many possible reasons for procrastinating. Students were asked to think of the last time they
procrastinated on a writing assignment and to indicate how much each of 26 separate reasons
reflected why they procrastinated. Respondents rated each statement on a 5-point Likert scale
depicting the reasons they procrastinated (1 = Not at all reflects why I procrastinated; 5 =
Definitely reflects why I procrastinated).
Student’s prior academic skills were measured using scores on the Computer-Adapted
Placement Assessment and Support Services (COMPASS; ACT, 2012) Writing Skills Placement
Test. The COMPASS placement tests help educators evaluate incoming students’ skill levels in
many academic areas including reading, writing, math, and English as a Second Language. The
criterion variable, academic achievement (end-of-course grade), was recorded as a percentage of
100 in a developmental college English course. The final course grade is an equal measure of
achievement at the end of the course for all students in English 0099.
To address potential validity issues, a pilot study was conducted with a group of 10
college students to determine whether the ASES and PASS survey items possessed content
validity. This process provided an opportunity to ensure that the ASES and PASS survey
instruments were easy to understand and the directions were clear for the intended student
sample. Gall et al. (2007) recommended a thorough pilot test of survey instruments before
conducting research. Over a period of two weeks surveys were administered and reviewed by the

43
student panel. Suggested wording changes were made to items on the instruments after feedback.
In addition, directions for completing the surveys were modified to eliminate confusion. Final
survey packets were assembled and consisted of the demographic questionnaire, the ASES and
PASS instruments, and two copies of the consent form.
Cronbach alpha was calculated for both the PASS and the ASES instruments to
determine inter-item reliability. Because both instruments used Likert scales, the Cronbach alpha
statistic was deemed the most appropriate indicator for inter-item reliability (Gloeckner, Gliner,
Tochterman & Morgan, 2001; Huck, 2004). A Cronbach alpha score of .935 was calculated for
the ASES. For the PASS Cronbach alpha scores of .841 was determined for Part 1 of the PASS
and .788 for Part 2. A high value for internal consistency coefficient alphas indicate good
reliability (Huck, 2004). A reasonable Cronbach alpha statistic above the .70 threshold indicated
a reliable measure for both Academic Self-efficacy (ASES) and Academic Procrastination
(PASS). Table 2 lists the instruments used in this study describing the construct being measured,
the name of the instrument, a description of each instrument, score ranges, and the indicators for
scores.
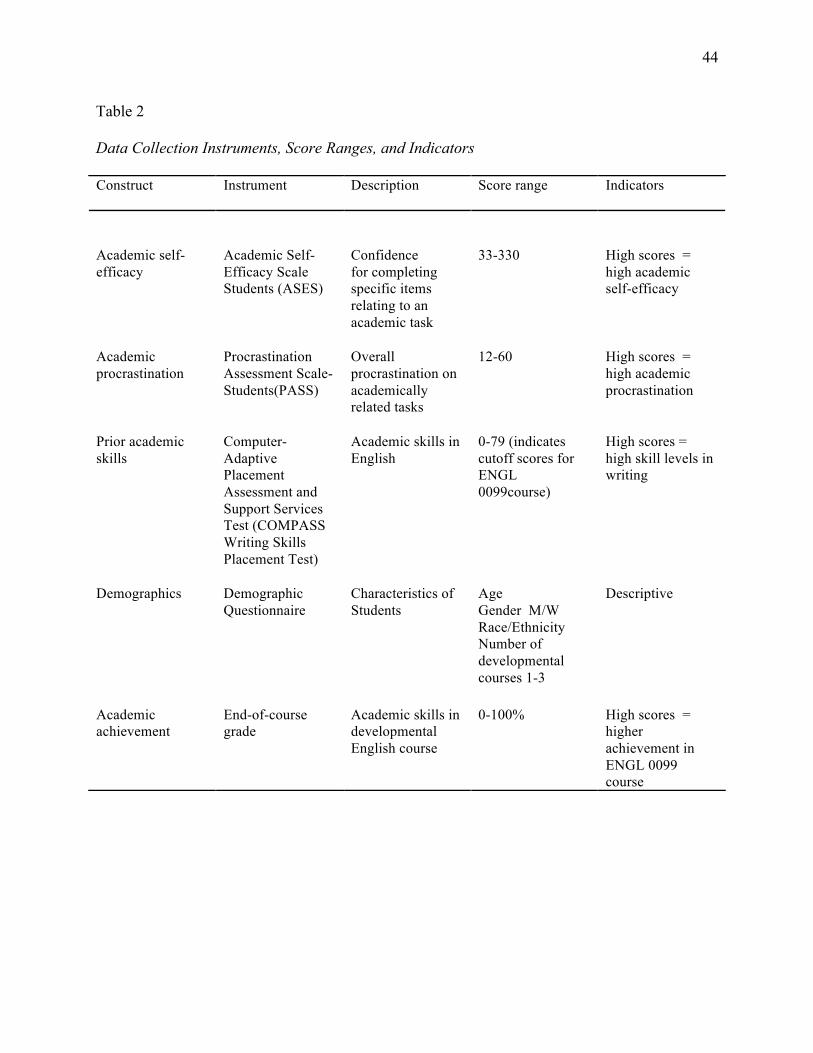
44
Table 2 Data Collection Instruments, Score Ranges, and Indicators Construct Instrument Description Score range Indicators
Academic self-efficacy
Academic Self-Efficacy Scale Students (ASES)
Confidence for completing specific items relating to an academic task
33-330 High scores = high academic self-efficacy
Academic procrastination
Procrastination Assessment Scale-Students(PASS)
Overall procrastination on academically related tasks
12-60 High scores = high academic procrastination
Prior academic skills
Computer-Adaptive Placement Assessment and Support Services Test (COMPASS Writing Skills Placement Test)
Academic skills in English
0-79 (indicates cutoff scores for ENGL 0099course)
High scores = high skill levels in writing
Demographics Demographic Questionnaire
Characteristics of Students
Age Gender M/W Race/Ethnicity Number of developmental courses 1-3
Descriptive
Academic achievement
End-of-course grade
Academic skills in developmental English course
0-100% High scores = higher achievement in ENGL 0099 course

45
Procedure
Permission to conduct this study was obtained by the Human Subjects Office, Office of
the Vice-President for Research at the University of Georgia and the Institutional Review Board
at Georgia Gwinnett College, the college where the study was conducted. Students’ identification
remained confidential throughout the study. Student’s surveys were matched to student records
to determine COMPASS test scores, therefore students needed to be identified on the surveys.
Students’ names were not used for identification purposes. A coding system, reversing the last 4
digits of the student identification number, was used instead to protect confidentiality. A master
list with the student’s code was used to link the student to survey questionnaires. This list was
maintained during the data collection period.
Course instructors were asked during a departmental meeting and through email to allow
access to their classrooms and allocate 20 minutes of class time for students to participate in this
study. If the instructor agreed, a date and time was established for a classroom visit. During each
classroom visit, a verbal script was read aloud providing an explanation of the general purpose of
the study and requesting participation. Students were not offered incentives for their
participation. Students were informed that the survey would take approximately 20 minutes, was
voluntary, and would not affect their course grade. Students agreeing to participate were
distributed a packet of materials including the two survey instruments, the PASS (Solomon &
Rothblum, 1984) and ASES (Elias & Loomis, 2000), a demographic questionnaire, and consent
forms. Surveys were completed while the researcher remained in the classroom, and collected
once students completed them. Students who were late to class did not participate in the research
due to time constraints.
46
Data was collected over a period of two months beginning four weeks into the semester. It
was estimated that four weeks provided enough time for students to acclimate to a new class and
college in general. Once the data collection period ended, data from the surveys was summed to
determine overall levels of academic self-efficacy, academic procrastination, and the mean
scores for fear of failure and task aversivenss. Demographic information was recorded from the
demographic questionnaire. Finally, schools records were accessed to obtain each student’s
scores on the COMPASS Writing Skills Placement Test.
Data Analysis
Data was analyzed using the Statistical Software Package for the Social Sciences (SPSS;
IBM, 2010) release 19.0. A multiple correlation analysis (MCA, Huberty & Petosky, 1999) was
deemed the best approach to examine the relationships between students’ academic achievement
and academic self-efficacy, academic procrastination, and prior academic skills. An MCA is
used to (a) calculate the strength of relationships, (b) conduct a statistical test of the strength of
these relationships, (c) interpret the relationship between a criterion variable and what is
represented by collection of the predictor variables, and (d) determine the relative contribution of
predictor variables to the relationship (Huberty & Petoskey, 1999). Academic achievement, the
criterion variable, was analyzed with student’s academic self-efficacy scores as measured by the
ASES (Elias & Loomis, 2000), procrastination levels identified by the PASS (Solomon &
Rothblum, 1984), and their COMPASS Writing Skills Placement test score obtained by school
records. Pearson-Product-Moment correlation coefficients were used to analyze the relationship
questions in this study. The Pearson r statistic reveals if relationships in a correlation study are
strong or weak, positive or negative. Descriptive statistics were used to describe participants’
academic self-efficacy scores, academic procrastination traits, prior academic skills, and
47
academic achievement (end-of-course grades). Descriptive statistics were also used to identify
which procrastination antecedent, either fear of failure or task aversiveness, was the most
important reason students procrastinated. Demographic and descriptive information was also
collected about each student’s gender, race/ethnicity, age, and number of developmental courses
enrolled.
The criterion variable, academic achievement (end-of-course grade), was analyzed using
a multiple correlation analysis (MCA) to determine relationships pertaining to the predictor
variables including academic self-efficacy, academic procrastination, and prior academic skills.
In an MCA, it is important to understand how the criterion variable is related to the construct
defined by the linear composite of predictor variables. This was addressed by examining the
simple correlations between each of the predictor variables and the linear composite or the
definition of the construct defined by the composite (Huberty & Hussein, 2001). In keeping with
recommendations by Huberty and Petoskey (1999), the estimation of the population product
moment correlation, ρ², was based on R² adjusted, not R², to reduce bias in estimation. To
complete the data analysis, a comparison of the absolute values or squares of the structure r’s
was made to determine the relative contribution of the predictor variables to the definition of the
constructs represented in this study (Huberty & Hussein, 2001). A structure r is the correlation
between each of the items in a construct (meaningful collection of items of interest) and the
linear composite of the construct. A composite construct for the contributions to academic
achievement variables was compiled and listed the variables indicating their importance to the
criterion variable academic achievement. The last step of the MCA required an ordering of the
variables to determine the relative contribution of the predictor variables to the criterion variable.
Huberty and Petoskey’s (1999) method to determine variable importance entails conducting an

48
MCA for each of the determined predictor variables and then deleting each variable, in turn, to
determine the R² adjusted value based on the remaining variables. The variable which, when
deleted, causes the largest drop in R² adjusted value is considered most important. Since an MCA
was conducted, all variables were used as they provided a meaningful collection of variables to
the construct of academic achievement. To analyze the effect size, Huberty and Hussein (2001)
recommended interpreting results using an effect size value to see if results obtained are better
than chance value. The formula to estimate the effect size index value is Esc = R²adj-p/ (N – 1),
where p denotes the number of predictor variables and N denotes sample size. Table 3 details the
overall approach to this study including research questions, predictor variables, the criterion
variable, and statistical methods used.
Table 3 Data Analysis for Research Questions
Research questions Predictor variables Criterion variable Data analysis 1. What are the academic self-efficacy beliefs,
academic procrastination traits, and prior academic skills of college students in a developmental course?
Academic self-efficacy, Academic procrastination, Compass score for Writing Skills Placement Test
Means, standard deviations, percentile
2. How do task aversiveness and fear of failure factors explain the underlying reasons developmental education students procrastinate in college as represented by the Procrastination Assessment Scale-Students (PASS)?
Procrastination antecedents; fear of failure, task aversiveness
Means, standard deviations, percentile
3. What is the relationship between academic self-efficacy, academic procrastination, and prior academic skills to academic achievement of college students in a developmental course?
Academic self-efficacy, Academic procrastination, Compass score for Writing Skills Placement Test
Academic achievement (end-of-course grade) recorded as percentile
Multiple correlation analysis (MCA), Pearson correlation matrix
49
CHAPTER 4
RESULTS
This chapter presents findings of the relationships between academic self-efficacy,
academic procrastination, and prior academic skills on academic achievement for college
students enrolled in a developmental education course. The purpose of the study is restated
followed by descriptive statistics and an analysis of the 123 study participants in response to the
first two research questions. Question three is answered by the results of a multiple correlation
analysis (MCA) examining the 3 predictor variables and 1 criterion variable in this study.
Purpose of Study
The purpose of this correlational study was to explore the relationship between academic
self-efficacy beliefs, academic procrastination, and prior academic skills, on course outcomes for
students who must take developmental college courses. Predictor variables of academic self-
efficacy, academic procrastination, and prior academic skills, were analyzed with the criterion
variable academic achievement. The purpose of the study was to address the following research
questions:
1. What are the academic self-efficacy beliefs, academic procrastination traits, and
prior academic skills of college students in a developmental course?
2. How do task aversiveness and fear of failure factors explain the underlying
reasons developmental education students procrastinate in college as represented
by the Procrastination Assessment Scale-Students (PASS)?
50
3. What is the relationship between academic self-efficacy, academic
procrastination, and prior academic skills to academic achievement of college
students in a developmental course?
Analysis of Research Questions
Two surveys and a demographic questionnaire were administered to students enrolled in
a developmental college English course (ENGL 0099) at a 4-year college in the state of Georgia.
Participants completed the surveys during class visits over a period of two months from January
2012 through February 2012. A total of 151 surveys were collected. The final sample consisted
of 123 participants once 11 surveys with incomplete or missing responses and 17 outliers were
removed. Outliers were removed to reduce error rates of influence and improve accuracy of the
correlation measure (Zimmerman, 1994).
Research Question One
The first research question asked, “What are the academic self-efficacy beliefs, academic
procrastination traits, and prior academic skills of college students in a developmental course?”
Descriptive data are presented in Table 4. Participants’ mean score for academic self-efficacy
was in the high range, representing 78% of the possible total range. Mean scores for academic
procrastination and prior academic skills were in the middle of the possible score range. The age
of the sample was typical of students enrolled in a freshmen course. While some participants’
end-of-course grades were very low (10%) and some very high (96%), the average percentile
grade was 73.80. Most students were enrolled in one developmental course. Details of the
predictor variables academic self-efficacy, academic procrastination, and prior academic skills
are discussed in the following sections.

51
Table 4
Descriptive Statistics for Criterion and Predictor Variables
Variable Minimum Maximum M SD Academic self-efficacy
(score range 33-330) 172 321 258.92 31.65
Academic procrastination
(score range 12-60) 12 54 31.01 7.62
Prior academic skills
(COMPASS Writing Skills Placement Test score range 0-99)
4 97 50.76 18.28
Age 17 47 20.86 5.63 Number of developmental
courses 1 3 1.73 .74
Academic achievementa
(end-of-course grade) 10 96 73.80 17.63
aRange from 0-100 reflecting grade at end of term.
Academic self-efficacy. Academic self-efficacy beliefs are individuals’ beliefs in their
ability to achieve an academic goal (Bandura, 1977). Students enrolled in the developmental
college English course were administered the Academic Self-Efficacy Scale (ASES; Elias &
Loomis, 2000) and asked to rate their confidence for completing specific items relating to an
academic task using a 10-point Likert scale. Possible scores ranged from 33-330, with higher
scores indicating higher academic self-efficacy. Participants’ mean scores ranged from 172 to
321. Participants’ overall mean score was 258.92 on the ASES out of a total possible score of
330. This indicated a very high student perception of academic self-efficacy. Age and gender
differences indicated that men and 21-25 year olds had higher scores for academic self-efficacy.
Asian students had the highest academic self-efficacy and American Indian or Alaska natives the
lowest. Surprisingly, the students enrolled in more developmental courses had higher academic

52
self-efficacy. Table 5 presents students’ academic self-efficacy indicated by means, standard
deviations, and percentiles for age, gender, race/ethnicity, and number of developmental courses.
Table 5
Academic Self-Efficacy for College Students in a Developmental Course
Measure M SD %a
Overall level of academic self-efficacy (range 33-330) 258.92 31.65 100%
Age 18 254.96 34.33 22.0%
19 259.94 31.32 43.9% 20 250.78 30.17 11.4% 21-25 260.89 24.26 13.10%
Over 25 254.70 35.00 9.6% Gender
Men 262.22 32.76 36.6% Women 257.03 31.04 63.4%
Race/ethnicity American Indian or Alaska Native 244.67 46.72 2.4%
Asian 286.00 6.08 2.4% Black or African American 256.76 32.49 61.8% Hispanic or Latino 262.83 23.69 14.6% White 264.90 32.73 16.3% Other 237.67 39.82 2.4%
Number of developmental courses
1 259.68 32.17 43.8% 2 255.65 32.05 39.8% 3 264.90 29.72 16.3%
Note. aPercent of sample (N = 123).
Academic procrastination. Academic procrastination is defined as failing to perform an
academic activity within a desired timeframe or postponing until the last minute activities one
needs to complete (Wolters, 2003). Students were administered the Procrastination Assessment
Scale-Student (PASS; Solomon & Rothblum, 1984) and for the first part of the PASS used a 5-
point Likert scale to indicate the frequency they procrastinate on six academic task areas
including completing a writing assignment, studying for exams, keeping up with weekly reading
53
assignments, performing administrative tasks, attendance tasks, and school activities in general.
Students were also asked to rate the degree that procrastination on these tasks were a problem for
them. These two areas were summed to provide an overall academic procrastination level.
Possible scores ranged from 12-60, with higher scores indicating higher levels of academic
procrastination. Participants’ overall mean score of 31.02 on the PASS was in the middle of
possible scores, neither high nor low. The first part of the PASS revealed procrastination traits of
the six academic areas students were most likely to procrastinate. Using a 5-point Likert scale
students who selected nearly always or always procrastinate on these tasks were counted in the
results. Students in this sample indicated they are most likely to procrastinate on studying for
exams. Solomon and Rothblum (1984) found in the original study using the PASS instrument
that most students in their sample procrastinated on completing a writing assignment (46%),
followed by weekly reading assignment (30%), and 28% on studying for exams. Age and gender
differences indicated that older students and men had higher academic procrastination levels.
Table 6 presents students’ overall level of academic procrastination indicated by the means,
standard deviations, and percentiles for age, gender, race/ethnicity, and number of developmental
courses.

54
Table 6
Prevalence of Academic Procrastination for College Students in a Developmental Course
Measure M SD %a Prevalence of overall academic
procrastination (range 12-60)
31.02 7.62 100%
Age 18 30.00 7.45 22.0% 19 31.92 7.26 43.9% 20 27.28 8.13 11.4% 21-25 30.50 32.60 13.10% Over 25 32.40 8.18 9.6%
Gender Men 32.33 7.56 36.6% Women 30.25 7.60 63.4%
Race/ethnicity American Indian or Alaska Native 35.00 12.53 2.4% Asian 23.00 10.15 2.4% Black or African American 31.16 7.44 61.8% Hispanic or Latino 30.50 6.98 14.6% White 31.40 7.50 16.3% Other 32.00 11.36 2.4%
Number of developmental courses enrolled
One 32.85 7.32 43.8% Two 29.88 7.80 39.8% Three 28.85 7.18 16.3%
Academic procrastination by task Completing a writing assignment 32.1% Studying for exams 44.3% Weekly reading assignment 35.0% Academic administrative tasks 11.4% Attendance tasks 13.6% School activities in general 28.6%
Note. aPercent of sample (N = 123).
COMPASS Writing Skills Placement Test as indicator for success. Students’ scores
on the COMPASS Writing Skills Placement Test were calculated. Possible scores ranged from 0-
99. Participants in this sample scored a wide range between 4 and 97 points. The mean
COMPASS Writing Skills Placement Test score for this sample was 50.76 (SD = 18.28).
According to COMPASS test developers (ACT, 2006), evidence of validity is defined by the

55
success criterion as achieving certain minimum grades in higher-level courses. Evidence of
predictive validity of the COMPASS test is considered reasonably good at predicting whether
students are likely to do well in college-level course work, if the goal is to ensure a minimum
pass rate in college-level classes (ACT, 2006; Hughes & Scott-Clayton, 2011). In this sample,
the students’ mean scores at the time of placement represented the middle of the score range.
Research Question Two
Fear of failure and task aversiveness. Further analysis of the sample provided results to
answer the second research question, how do task aversiveness and fear of failure factors explain
the underlying reasons developmental education students procrastinate in college as represented
by the Procrastination Assessment Scale-Students (PASS; Solomon & Rothblum, 1984). To
gather this data, the second part of the PASS described a procrastination scenario, delay in
completing a writing assignment. Students were asked to indicate which of 26 separate reasons
reflected why they procrastinated using a 5-point Likert scale. The two most often found
antecedents to academic procrastination from the original study using the PASS instrument
(Solomon & Rothblum, 1984) was fear of failure and task aversiveness.
For this study, as in the original PASS, a factor consisting of five survey items were
grouped together and referred to as fear of failure. Factors associated with fear of failure include
anxiety about meeting others’ expectations, concerns about meeting one’s own standards, and
lack of self-confidence (Solomon & Rothblum, 1984). Results of this study indicated that fear of
failure was not as important as task aversiveness as an antecedent to academic procrastination.
Older students (those over 21) most often attributed fear of failure as a reason for their
procrastination. There was little difference between men and women on the fear of failure factor.
Hispanic/Latino students attributed their procrastination to fear of failure more than Whites and

56
African American students. Asian students had the lowest fear of failure factor attributed to
academic procrastination.
Three survey items on the PASS were grouped together and referred to as task
aversiveness. Task aversiveness is defined in terms of how unpleasant or unenjoyable a task is to
perform (Blunt & Pychyl, 2000). Task aversiveness accounted as the most important reasons
that students in this sample procrastinated. Younger students were more task averse than older
students and men were more task averse than women. Race/ethnicity differences indicated that
American Indian or Alaska Native students accounted for higher levels of task aversivenss.
Asian students had the lowest levels of task aversiveness. Mean scores and standard deviations
for fear of failure and task aversiveness are presented in Table 7.

57
Table 7
Fear of Failure and Task Aversiveness for College Students in a Developmental Course
Factor M SD
Fear of failure (PASS items 19, 24, 33, 39, 42) 2.27 .98
Age 18 2.24 1.11 19 2.19 1.02 20 2.29 1.07 21-25 2.46 .56 Over 25 2.40 .14
Gender Men 2.24 1.01 Women 2.27 .97
Race/Ethnicity American Indian or Alaska Native 2.27 1.33 Asian 2.00 .92 African American 2.17 1.02 Hispanic or Latino 2.55 1.14 White 2.27 .97
Number of developmental courses 1 2.34 1.07 2 2.14 .93 3 2.37 .85
Task aversiveness (PASS items 27,34,35) 2.61 1.11 Age
18 2.86 1.16 19 2.60 1.12 20 2.39 1.18 21 -25 2.75 .91 Over 25 2.60 .94
Gender Men 2.80 1.03 Women 2.50 1.15
Number of developmental courses 1 2.83 1.08 2 2.92 1.15 3 2.46 1.03
Race/Ethnicity American Indian or Alaska Native 2.91 1.30
Asian 2.09 .79 African American 2.51 1.13 Hispanic or Latino 2.75 1.30 White 2.72 .93
58
Multiple Correlation Analysis (MCA)
Research Question Three
The third research question asked about the relationship between academic self-efficacy,
academic procrastination, and prior academic skills to academic achievement for college students
in a developmental course. To determine relationships that might exist between these variables, a
multiple correlation analysis (MCA, Huberty & Petosky, 1999) was conducted. An MCA is used
to (a) calculate the strength of relationships, (b) conduct a statistical test of the strength of the
relationship, (c) interpret the relationship between a criterion variable and what is represented by
a collection of predictor variables, and (d) determine the relative contribution of predictor
variables to the relationship (Huberty & Petoskey, 1999).
Before the MCA could be conducted, certain conditions or assumptions about the data
had to be met. The independence of scores was satisfied based on the design of the study using
self-report surveys and through monitoring of the research process. The data set was inspected
for outliers and for the condition of homogeneity of variance and Y-variate normality. Visual
inspection of the data began with a graphical view of the boxplots and stem and leaf plots for the
variables in the study. There appeared to be some outliers which prompted further examination.
To investigate the data for outliers a couple of methods were used. An inspection and removal of
the variables with scores more than three standard deviations from the mean (Grubbs, 1950) was
used resulting in a deletion of 17 cases. In addition, weighted least squares, significant level
testing Cook’s D was used.
Participant data from surveys with missing or incomplete information were deleted and
excluded from the dataset. Students who withdrew from their classes prior to data analysis were
also removed from the sample. By removing outliers with mean scores more than three standard

59
deviations from the mean and any missing or incomplete surveys, a total of 28 cases were
excluded from the original sample, leaving 123 participants. This inspection of the data including
proof of assumption of normality and assumption of equal variance is indicated in two plots.
Figure 1 represents the data in a linear relationship slightly skewed to the left as indicated by the
curve (see Figure 1). Assumption of equal variance (see Figure 2) is indicated by a plot of the
residuals versus the predicted Y. The pattern indicates that the data was spread throughout, and
the residuals are normally distributed at each level of Y and constant in variance across levels of
Y. This inspection of the data including proof of assumption of normality and assumption of
equal variance were satisfied.
Figure 1. Normal P-P plot of regression standardized residual for academic achievement.

60
Figure 2. Standardized residual plot for criterion variable academic achievement.
In addition to visual inspection of the data, Huberty and Petoskey (1999) also
recommended using the studentized deleted residuals, which consists of looking at all deleted
residuals to identify extreme cases. For this step an examination of the estimates of the weights
for the linear composite for the predictor variables was conducted. When reviewing statistics to
discover extreme residuals, Pedhazur (1997) suggested that residuals greater than an absolute
value of 2.00 be examined. Table 8 shows the value for studentized residual, and studentized
deleted residual, along with Cook’s D statistic. The studentized deleted residual value of the
mean score of -.009 indicated that all data points fell within an acceptable range. The Cook’s D

61
statistic resulted in a small value of .011 indicating that there were no significant outliers or bias
of the estimates. These data led to a conclusion that the data was suitable for analysis.
Table 8
Residual Statistics for Criterion Variable Academic Achievementa
Minimum Maximum M SD Predicted value 61.8128 88.4619 73.7967 6.33543 Standardized predicted value -1.892 2.315 .000 1.000 Standard error of predicted value 1.663 5.604 2.900 .786 Adjusted predicted value 61.8382 89.1885 73.8525 6.35999 Residual -65.65502 25.32518 .00000 16.45040 Standardized residual -3.942 1.520 .000 .988 Studentized residual -4.040 1.545 -.002 1.009 Deleted residual -68.95862 26.55006 -.05574 17.16388 Studentized deleted residual -4.331 1.555 -.009 1.035 Mahalanobis distance .224 12.820 2.976 2.279 Cook's distance .000 .292 .011 .036 Centered leverage value .002 .105 .024 .019
aCriterion variable: Academic achievement.
The first step in an MCA is to calculate relationships between predictor and criterion
variables using a correlation matrix. Predictor variables for this study included academic self-
efficacy, academic procrastination, and prior academic skills. The criterion variable was
academic achievement (end-of-course grade).
Simple correlations were analyzed between each of the predictor variables and the
construct defined by the composite (Huberty & Hussein, 2001). The collection of predictor
variables in an MCA should share interrelated attributes and form a composite system. The
results of an MCA should yield an interpretation of the collection of predictor variables or
composite to the criterion variable. This interpretation is made by examining the Pearson
product correlations between each of the predictor variables and the linear composite or
definition of the construct defined by the composite (Huberty & Hussein, 2001). The composite
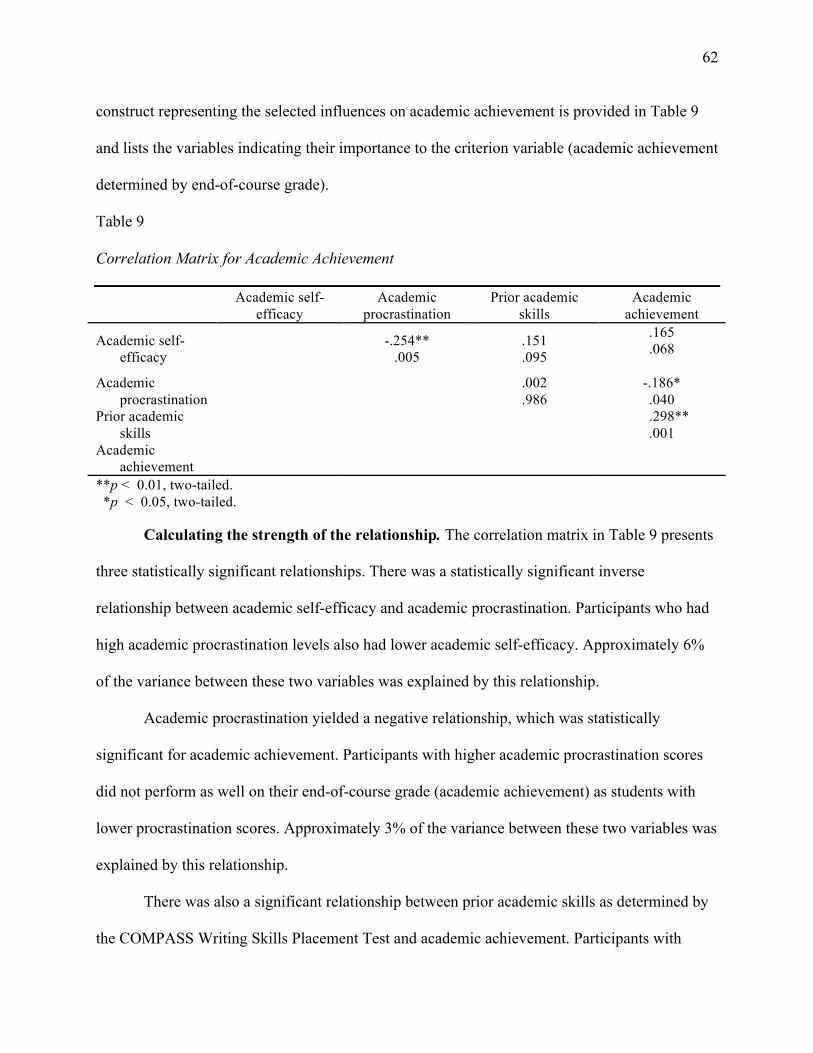
62
construct representing the selected influences on academic achievement is provided in Table 9
and lists the variables indicating their importance to the criterion variable (academic achievement
determined by end-of-course grade).
Table 9 Correlation Matrix for Academic Achievement
Academic self-efficacy
Academic procrastination
Prior academic skills
Academic achievement
Academic self-efficacy -.254**
.005 .151 .095
.165
.068
Academic procrastination .002
.986 -.186* .040
Prior academic skills .298**
.001 Academic
achievement
**p < 0.01, two-tailed. *p < 0.05, two-tailed.
Calculating the strength of the relationship. The correlation matrix in Table 9 presents
three statistically significant relationships. There was a statistically significant inverse
relationship between academic self-efficacy and academic procrastination. Participants who had
high academic procrastination levels also had lower academic self-efficacy. Approximately 6%
of the variance between these two variables was explained by this relationship.
Academic procrastination yielded a negative relationship, which was statistically
significant for academic achievement. Participants with higher academic procrastination scores
did not perform as well on their end-of-course grade (academic achievement) as students with
lower procrastination scores. Approximately 3% of the variance between these two variables was
explained by this relationship.
There was also a significant relationship between prior academic skills as determined by
the COMPASS Writing Skills Placement Test and academic achievement. Participants with
63
higher COMPASS scores also conveyed higher academic achievement (end-of-course grades).
Approximately 8% of the variance between these two variables was explained by this
relationship.
In respect to the criterion variable academic achievement, academic self-efficacy was not
significantly related. Students with higher academic self-efficacy did not achieve higher
academic achievement (end-of-course grades). Only about 2% of the variance between these two
variables was explained by this relationship.
A multiple correlation analysis requires a statistical test of the strength of the relationship
between predictor and criterion variables. Strength of the relationship is determined by
calculating a correlation coefficient, r. The Pearson correlation r is a measure of a linear
relationship between two variables. In regression, the proportion of the variance of the target
variable for regression is given by the square of the Pearson correlation known as r² (Kinnear &
Gray, 2009). Huberty and Petoskey (1999) posited that r² is a biased estimator for the population
counterpart, p². They recommended using an adjusted r² to reduce bias in estimation. The
adjusted r² value used in this study was available using SPSS software and is based on the
formula proposed by M. Ezekeil (1930).
Regression analysis was conducted in this MCA with the composite of predictor variables
including academic self-efficacy, academic procrastination, and prior academic skills in a model
to predict academic achievement. For purposes of comparison with other measures of effect size,
the square of the Pearson correlation —the proportion of the variance of the scores on the
criterion variable accounted for by the regression upon another variable —was used (Kinnear &
Gray, 2009).
64
There was a moderate correlation between the composite construct and academic
achievement, R = .359, R² = .129. The R² adj. of .107 was statistically significant, F = 5.88, p <
.05. The R² adj. of .107 indicates that approximately 11% of the change in academic achievement
can be explained by the linear composite of the three predictor variables: academic self-efficacy,
academic procrastination, and prior academic skills. Huberty and Hussein (2001) also
recommended determining an effect size index to assess the degree that the results are better than
chance values. This is to determine if the obtained percent of shared variance is greater than what
would be expected by chance. Reporting an effect size index value is not common in multiple
correlation studies, so there is no standard cut-off to define high and low effect size index values.
The effect size in this analysis beyond that which may be obtained by chance was .082, meaning
there was approximately an 8% better than chance value that the variance derived explains the
relationship between academic achievement and the linear composite of the 3 variables academic
self-efficacy, academic procrastination, and prior academic skills.
Statistical test of the strength of the relationship. An approach to determining the
relative contribution of the predictor variables to the definition of the construct defined by the
variable composite is to compare the absolute values or squares of the structure r’s. This is to
determine the relative contribution of the predictor variables to the definition of the constructs
represented in this study (Huberty, 2001). The structure r’s are the simple correlations between
each of the three predictor variables and the linear composite of the entire model including all
three of the predictor variables. The predictor variables for which the structure r’s are the highest
are considered to be the most influential variables for the construct.
A composite construct for the contributions to academic achievement variables was
compiled and listed the variables indicating their importance to the construct or criterion variable

65
(academic achievement determined by end-of -course grade). Based on the structure r’s, prior
academic skills (as reflected on the COMPASS Writing Skills Placement Test) and academic
procrastination were the most influential factors for academic achievement. Table 10 indicates
the structure r’s for the composite academic achievement.
Table 10
Structure Correlations for Academic Achievement
Component Structure r Academic achievement component correlation
Academic self-efficacy .45 .165 Academic procrastination .51 -.186 Prior academic skills .83 .298 The last step in conducting an MCA requires ordering of the variables to determine the
relative contribution of each predictor variable. Huberty and Petoskey’s (1999) method to
determine variable importance entails conducting an MCA for each predictor variable and then
deleting each variable in turn to determine the adjusted R² value based on the remaining
variables. Results are used to indicate which predictor variable is more important in establishing
the relationship with the criterion variable. Table 11 presents the component analysis and ranking
based on deleting one variable at a time to discover which variable caused the largest drop in the
R² adjusted value influencing academic achievement. When the variable, academic self-efficacy
is deleted from the linear composite, r2 adjusted value increases to .109 from .107, the original
correlation. Results indicated that prior academic skills were the most important to explain
academic achievement, followed by academic procrastination. Academic self-efficacy was the
least important.
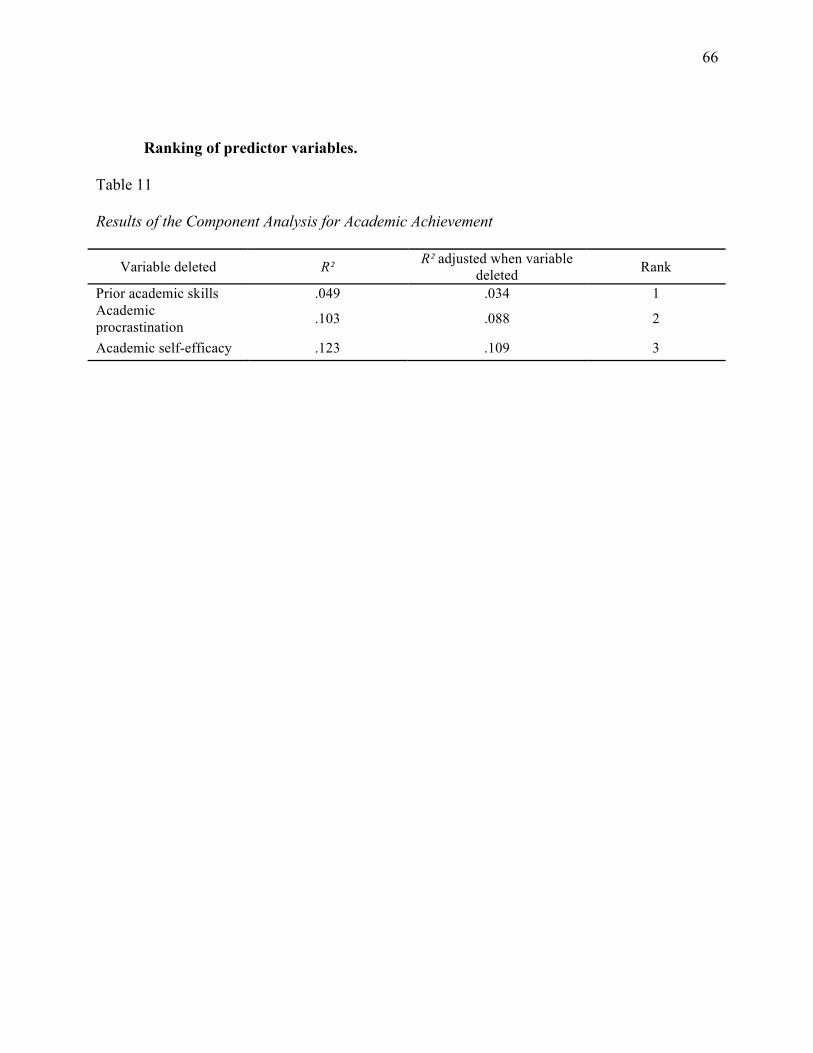
66
Ranking of predictor variables.
Table 11
Results of the Component Analysis for Academic Achievement
Variable deleted R² R² adjusted when variable deleted Rank
Prior academic skills .049 .034 1 Academic procrastination .103 .088 2
Academic self-efficacy .123 .109 3

67
CHAPTER 5
DISCUSSION
This chapter begins with a restatement of the purpose, rationale, and research questions
of the study. A summary of the study and its findings is also included. Results from the data
analysis, discussion and implications of the findings, and recommendations for future practice
and further research regarding students in developmental education are also discussed.
Purpose of Study
The purpose of this correlational study was to explore the relationship between academic
self-efficacy beliefs, academic procrastination, and prior academic skills on course outcomes for
students who must take developmental college courses. The sample for this study was comprised
of students enrolled in a developmental college English course during a single semester at a 4-
year college in the state of Georgia. Predictor variables of academic self-efficacy, academic
procrastination, and prior academic skills were measured using the Academic Self-Efficacy Scale
(ASES; Elias & Loomis, 2000), the Procrastination Assessment Scale-Students (PASS; Solomon
& Rothblum, 1984), and the COMPASS Writing Skills Placement Test (ACT, 2012). The
criterion variable, academic achievement, was defined as the end-of-course grade in a
developmental college English course. Findings from this study may contribute to a deeper
understanding of students in developmental education courses by providing insight about
intervention strategies designed to reduce procrastination behaviors, regulate learning, and raise
academic self-efficacy beliefs. The study addressed the following research questions:

68
1. What are the academic self-efficacy beliefs, academic procrastination traits, and
prior academic skills of college students in a developmental course?
2. How do task aversiveness and fear of failure factors explain the underlying reasons
developmental education students procrastinate in college as represented by the
Procrastination Assessment Scale-Students (PASS)?
3. What is the relationship between academic self-efficacy, academic procrastination,
and prior academic skills to academic achievement of college students in a
developmental course?
Research Summary
A correlational design was appropriate because the relationship between a single criterion
variable and multiple predictor variables was of interest (Gall et al., 2007). Predictor variables of
academic self-efficacy, academic procrastination, and prior academic skills were analyzed with
the criterion variable academic achievement. Data in this study were collected from a survey
using a convenience sample of 123 students enrolled in a developmental college English course
(English 0099) at a 4-year college in the state of Georgia during a single semester. A
convenience sample was selected because the target group was easily accessible and willing to
participate (Gall et al., 2007). The population of students enrolled in all developmental college
English courses in the state of Georgia would not be easily identifiable or accessible. However,
this sample was similar to other students in the state of Georgia who take developmental courses.
Using Cohen’s (1992) guidelines for determining sample size, it was estimated that results would
produce a medium effect size of .30, with an alpha level of .05, power of .80, and 3 predictor
variables requiring a minimum of 76 participants. One hundred fifty-one college students in a
developmental English 0099 course completed surveys. The final sample consisted of 123
69
participants once surveys with incomplete or missing responses and outliers were removed.
Outliers were removed to reduce error rates of influence and improve accuracy of the correlation
measure (Zimmerman, 1994).
Permission was obtained by the Human Subjects Office, Office of the Vice-President for
Research at the University of Georgia, and the Institutional Review Board at Georgia Gwinnett
College. Data collection began January 2012 and concluded in February 2012. Students were
contacted in the classroom after permission was granted from course instructors. During each
classroom visit, a script was read aloud that provided an explanation of the general purpose of
the study and requested participation.
Students were asked to complete the Procrastination Assessment Scale-Students (PASS;
Solomon & Rothblum, 1984), the Academic Self-Efficacy Scale (ASES; Elias & Loomis, 2000),
and a short demographic questionnaire. College students’ academic self-efficacy was measured
using the Academic Self-Efficacy Scale (ASES; Elias & Loomis, 2000). Academic self-efficacy
is an individual’s belief in his or her ability to successfully achieve an academic goal (Bandura,
1977). Students were asked to rate their confidence for completing specific items relating to an
academic task using a 10-point Likert scale representing confidence levels from 0 (no confidence
at all) to 9 (complete confidence). The ASES consists of two parts. The first part includes 23
items and addresses students’ confidence in their ability to earn a grade of B in specific
individual courses such as physics, psychology, composition, and tennis. The criterion of earning
a letter grade of B was included by the ASES authors (Elias & Loomis, 2000) to provide a
concrete criterion to consider.
The second part of the ASES, items 24-35, addresses academic milestones that students
encounter during college. Students indicated how confident they were in their ability to
70
complete 45 semester hours of upper-division (3000 and above) level courses. Items from the
ASES were summed to provide an overall score for academic self-efficacy.
Academic procrastination levels were measured using the Procrastination Assessment
Scale-Students (PASS; Solomon & Rothblum, 1984). Academic procrastination is defined as
failing to perform an academic activity within a desired timeframe or postponing until the last
minute activities one needs to complete (Wolters, 2003). The PASS is the most widely used
measure to explore procrastination on academically-related tasks (Ferrari et al., 1995). It was
developed to include the frequency of both cognitive and behavioral antecedents to academic
procrastination. The PASS is a two-part, 44-item scale developed using a study of 342 students
measuring academic procrastination levels in a variety of academic pursuits. The first part of the
PASS assesses the prevalence of procrastination in six academic areas, including (a) completing
a writing assignment, (b) studying for exams, (c) keeping up with weekly reading assignments,
(d) performing academic administrative tasks, (e) attendance tasks, and (f) school activities in
general. This section of the PASS is used to ascertain the frequency of procrastination on tasks
(e.g., "To what degree do you procrastinate on writing a term paper?”). Participants use a 5-point
Likert scale to rate the degree that procrastination on the task is a problem, and to what extent
they want to decrease their tendency to procrastinate on the task. The PASS items pertaining to
(a) the frequency with which respondents procrastinate on tasks and (b) whether their
procrastination on the task is a problem were summed to provide an overall measure of academic
procrastination, with total scores ranging from 12 to 60. Higher scores indicated higher levels of
academic procrastination.
The second part of the PASS describes a procrastination scenario, delay in completing a
writing assignment, and then provides statements of many possible reasons for procrastinating.

71
Students were asked to think of the last time they procrastinated on a writing assignment and to
indicate how much each of 26 separate reasons reflected the reasons they procrastinated.
Respondents rated each statement on a 5-point Likert scale (1 = Not at all reflects why I
procrastinated; 5 = Definitely reflects why I procrastinated).
Student’s prior academic skills were measured using scores on the Computer-Adapted
Placement Assessment and Support Services (COMPASS; ACT, 2012) Writing Skills Placement
Test. COMPASS placement tests help educators evaluate incoming students’ skill levels in many
academic areas including reading, writing, math, and English as a Second Language. The
criterion variable, academic achievement (end-of-course grade) was recorded as a percentage, 0-
100, in a developmental college English course. Cronbach alpha scores were calculated to show
internal consistency of scores. A value of .935 was determined for the ASES. For the PASS a
Cronbach alpha of .841 was calculated for Part 1 of the PASS and .788 for Part 2. Values greater
than .70 are considered acceptable and indicators of good score reliability (Gall et al., 2007).
Academic achievement, the criterion variable, was analyzed with student’s academic self-
efficacy scores as measured by the ASES (Elias & Loomis, 2000), procrastination levels
identified by the PASS (Solomon & Rothblum, 1984), and COMPASS Writing Skills Placement
test scores obtained by school records. Data was analyzed using SPSS software release 19.0.
Descriptive statistics described academic self-efficacy scores, academic procrastination traits,
prior academic skills, and academic achievement (end-of-course grades). Descriptive statistics
were also used to identify which procrastination antecedent; either fear of failure or task
aversiveness, accounted for the most important reason students procrastinated as represented by
the PASS. Descriptive information was also collected about each student’s gender,
race/ethnicity, age, and number of developmental courses enrolled.
72
As a last step in the analysis the criterion variable, academic achievement, was analyzed
using a multiple correlation analysis (MCA). According to Huberty and Petoskey (1999), an
MCA is best suited for analyzing a relationship between a single criterion variable and multiple
predictor variables. In this study, relationships were explored pertaining to the construct defined
by the predictor variables academic self-efficacy, academic procrastination, prior academic
skills, and the criterion variable academic achievement. The interpretation of the relationships in
the MCA was made by examining the Pearson product correlations between each of the predictor
variables and the linear composite to the criterion variable academic achievement (Huberty &
Hussein, 2001).
Results
The purpose of the first research question was to describe the academic self-efficacy
beliefs, academic procrastination traits, and prior academic skills of college students in a
developmental course. Academic self-efficacy beliefs are an individual’s belief in his or her
ability to achieve an academic goal (Bandura, 1977). Possible scores ranged from 33-330, with
higher scores indicating higher academic self-efficacy. Participants’ mean scores ranged from
172 to 321. Participants’ overall mean score of 258.92 on the ASES indicated very high student
perceptions of academic self-efficacy, especially considering that these students were enrolled in
an academic developmental course. Age and gender differences indicated that men and 21-25
year olds had higher scores for academic self-efficacy. Asian students had the highest academic
self-efficacy and American Indian or Alaska natives the lowest.
Academic procrastination is defined as failing to perform an academic activity within a
desired timeframe or postponing until the last minute activities one needs to complete (Wolters,
2003). Possible scores ranged from 12-60, with higher scores indicating higher levels of
73
academic procrastination. Participants’ overall mean score of 31.02 on the PASS represented
51% of a total possible score of 60. Participants’ overall mean score on the PASS was in the
middle of possible scores, neither high nor low.
The first part of the PASS revealed procrastination traits of the six academic areas
students were most likely to procrastinate. Of the students in this study, 44% nearly always or
always procrastinated on studying for exams, 35% on weekly reading assignments, 32% on
completing a writing assignment, 29% on school activities in general, 14% on attendance tasks,
and 11% on academic administrative tasks. The original research using the PASS (Solomon &
Rothblum, 1984), indicated most students procrastinated on completing a writing assignment
(46%), followed by weekly reading assignments (30.1%), and 27.6% on studying for exams.
Writing Skills Placement test scores were obtained from school records for each student
in the sample. Participants scored a wide range on their placement tests, between 4 and 97 points,
with a mean COMPASS Writing Skills Placement Test score for this sample of 50.76 (SD =
18.28). The students’ overall mean score on the placement test indicated the middle of the
possible score range or 52%.
Question two explored how task aversiveness and fear of failure factors explained the
underlying reasons developmental education students procrastinate in college as represented by
the Procrastination Assessment Scale-Students (PASS; Solomon & Rothblum, 1984). For
purposes of this study, as in the original PASS (Solomon & Rothblum, 1984), a factor consisting
of five survey items were grouped together and referred to as fear of failure. Factors associated
with fear of failure included anxiety about meeting others’ expectations, concerns about meeting
one’s own standards, and lack of self-confidence (Solomon & Rothblum, 1984). The overall
mean score for fear of failure was 2.27 (SD = .98). In this sample, fear of failure was not as

74
important as task aversiveness as an antecedent to academic procrastination. Older students most
often attributed fear of failure as a reason for their procrastination with a mean score of 2.60 (SD
= .56). There was little difference between men and women on the fear of failure factor with a
mean score for men equal to 2.24 and women equal to 2.27. Hispanic/Latino students attributed
their procrastination to fear of failure more than Whites and Black or African American students.
Asian students had the lowest fear of failure factor attributed to academic procrastination.
Three survey items on the PASS were grouped together and referred to as task
aversiveness. Task aversiveness is defined in terms of how unpleasant or unenjoyable a task is to
perform (Blunt & Pychyl, 2000). The overall mean score for task aversiveness was 2.61 (SD =
1.11). Task aversiveness was the most important reason that students in this sample
procrastinated. For the factor of task aversiveness, younger students had a mean score of 2.86
(SD = 1.16) and were more task averse than older students. Men were more task averse than
women. American Indian or Alaska Native students accounted for higher levels of task
aversiveness, and all other races/ethnicities accounted for lower levels. Asian students had the
lowest levels of task aversiveness.
The third research question in this study explored the relationship between academic self-
efficacy, academic procrastination, and prior academic skills to academic achievement for
college students in a developmental course. To determine this relationship, a multiple correlation
analysis (MCA, Huberty & Petosky, 1999) was conducted. Three statistically significant
relationships were discovered. There was a statistically significant inverse relationship between
academic self-efficacy and academic procrastination. Participants who had high academic
procrastination levels also had low academic self-efficacy (R = - .254), which indicated a
75
medium effect size of .06. Approximately 6% of the variance was explained by academic self-
efficacy and academic procrastination.
Levels of academic procrastination also yielded a statistically significant negative
relationship to academic achievement. Participants who had higher academic procrastination
levels did not perform as well on end-of-course grades (R = - .186), which indicated a small
effect size. A study by the authors of the PASS instrument found that self-reported
procrastination was negatively correlated with grade point average for a semester (Rothblum et
al., 1986). Approximately 3% of the variance in academic achievement was explained by
academic procrastination.
There was also a significant relationship for prior academic skills as measured by the
COMPASS Writing Skills Placement Test to academic achievement. Participants with higher
COMPASS scores achieved higher end-of-course grades (R = .298), which indicated a medium
effect size. Approximately 8% of the variance of the relationship between prior academic skills
and academic achievement was explained by these variables.
There was not a significant relationship between academic self-efficacy and academic
achievement. Students who had high academic self-efficacy levels did not achieve higher grades
(R = .165). This is different from the findings in previous studies (e.g., Bong, 2001; Brown, Lent,
& Larkin, 1989; Hackett, Betz, Casas, & Rocha-Singh, 1992; Lent, Brown, & Larkin, 1984;
Multon, Brown, & Lent, 1991), which found academic self-efficacy to be a significant predictor
of academic grades or achievement in college students. The authors of the ASES instrument
found that academic self-efficacy was a significant predictor of grade point average (Elias &
Loomis, 2002). Bong (2001) found a significant relationship between Korean undergraduate
students’ course-specific self-efficacy beliefs and final exam scores. Brown et al. (1989) found

76
that in a sample of college students who had high PSAT scores that their self-efficacy for
academic milestones was a strong predictor of academic outcomes. Their results, and the results
of this study, suggested that academic self-efficacy may improve performance when skills are
adequate, but it would not likely counteract a lack of requisite skills. Approximately 2% of the
variance between academic self-efficacy and academic achievement was explained by these
variables in this study.
Discussion and Implications
Academic Procrastination
According to social cognitive theory (Bandura, 1986), students who report frequent
academic procrastination also report lower levels of academic self-efficacy resulting in decreased
academic motivation and lower academic achievement. This study supports previous research
indicating that academic procrastination has a negative impact on academic achievement (Clark
& Hill, 1994; Ellis & Knaus, 2002; Harriott & Ferrari, 1996; Solomon & Rothblum, 1984;
Wesley, 1994). Findings contradict prior research stating that academic procrastination has little
effect on academic achievement (Beck et al., 2000; 2000; Beswick, 1988; Lay, 1986; Pychyl et
al.).
Overall levels of academic procrastination were significantly related to academic
achievement. The trait of academic procrastination was widely dispersed among this sample of
developmental education students. Those students with higher academic procrastination scores
did have lower academic achievement (end-of-course grades). This supports findings from
Ferrari (2004) who confirmed that there may not be a typical profile of academic procrastinators
and that academic procrastination occurs in a variety of students with a wide range of
characteristics.
77
Older students procrastinated at higher levels than the younger students. This is supported
by additional research on procrastination tendencies of graduate students. Studies have
confirmed that older students report higher rates of procrastination than the younger ones (Jiao &
Onwuegbuzie, 1998; Onwuegbuzie, 2000, & 2004; Onwuegbuzie & Collins, 2001). It could
reflect the complexity of course material and assignments at the graduate level. For example if
students are intimidated by the academic standards and complexity of the material, they may
procrastinate more (Onwuegbuzie, 2004). It could also indicate that graduate students, or older
students, may procrastinate for different reasons such as perfectionists’ tendencies.
Undergraduates may procrastinate more as a result of low academic ability, low self-confidence,
rebelliousness and resentment, or an attempt to protect their self-esteem. (Burka & Yuen 1983;
Ferrari, 1989; Onwuegbuzie, 2004; and Rothblum et al.,1986). A larger proportion of students at
the graduate level than the undergraduate level reported they nearly always or always
procrastinate on studying for exams and on weekly reading assignments (Onwuegbuzie, 2004).
While the findings from this study implies that academic procrastination scores may be
related to a tendency to postpone tasks, especially if they are undesirable, they may also relate to
time demands imposed by economic factors, such as impediments due to students’ lack of
finances or work demands. It was surprising to note that students rated they procrastinated on
school activities, in general, at 29%. The PASS defines school activities as club meetings and
other school functions not associated with a particular classroom related activity. It is possible
that students cannot fit other educationally purposeful activities, which occur outside the
classroom into their college life, even if they wanted to. Students who have limited participation
in school activities may have negative outcomes. Student engagement in educationally
purposeful activities is positively related to both grades and persistence (Pascarella & Terenzini,
78
2005). Grades of lower ability students are positively affected by engagement in educationally
purposeful activities to a greater degree than higher ability students (Kuh, Kinzie, Buckley,
Bridges & Hayck, 2006). Students who procrastinate on school activities in general may be
hindering their ability to be successful, especially if enrolled in a developmental course.
Of the students in this study, 44% nearly always or always procrastinated on studying for
exams, 35% on weekly reading assignments, 32% on completing a writing assignment, 29% on
school activities in general, 14% on attendance tasks, and 11% on academic administrative tasks.
As noted by Solomon and Rothblum (1984), the high frequency of self-reported procrastination
on studying for exams, completing a writing assignment, and keeping up with weekly reading
assignments could indicate that these tasks are valued higher to students. Educators continue to
interpret the multiple causes of academic procrastination and apply targeted specific intervention
models for helping students achieve success. General themes across intervention programs
involve the promotion of habit in working regularly, enhancing feelings of self-efficacy, and
using group influences to support change. These interventions may be accomplished by
introducing self-regulation training, reframing negative or irrational thoughts, and using group
influences or peer models to enhance self-confidence in order to overcome dilatory behavior
(Shouwenburg et al., 2004). Because there are many causes for academic procrastination,
educators must be aware of the major causes and acknowledge different approaches to support
students’ efforts to change.
Task aversiveness, more than fear of failure, in this study was reported to be the primary
motive for academic procrastination. Men were more task averse than women supporting a
previous meta-analysis that indicated that girls scored higher on effortful control than boys (Else-
Quest et al., 2006). Task aversiveness has been correlated positively with measures of
79
procrastination (Blunt & Pychyl, 1998; Lay 1990, 1992). In this study both women and men
expressed similar mean scores relating to fear of failure as a reason for academic procrastination
(women = 2.27, men = 2.24). This finding contradicts the original study using the PASS
(Solomon & Rothblum, 1984) which found that women more often reported fear of failure as a
motive for procrastination than men.
COMPASS Test
Colleges often place great importance on placement testing for students taking
developmental courses. Assessment and placement determines entering first year students’
academic strengths and weaknesses. In developmental education, assessment and placement is
used to place students in an appropriate program of study to enhance their chance for success
(Farmer & Barham, 2001). This study examined placement test scores as they related to other
factors including course outcomes and academic achievement. A significant relationship was
found between prior academic skills (COMPASS Writing Skills Placement Test) and academic
achievement. In this study, the COMPASS test was a dominant predictor variable in students’
academic achievement. This supports the claims by ACT (2006) that their placement tests scores
are a valid indicator of future success in college courses.
Academic Self-Efficacy
The summed scores for overall level of academic self-efficacy in this sample of
developmental education students were considerably higher than anticipated. I hypothesized that
the very nature of a student being placed in a developmental course would lower academic self-
efficacy. However, even though students were placed in a developmental course, they reported
high academic self-efficacy scores. Generally, college students with high academic self-efficacy
beliefs will do better than those with low academic self-efficacy beliefs. Brown et al. (1989)

80
suggested that self-efficacy may improve performance when skills are adequate but is not likely
to counteract a lack of requisite skills. Their findings suggested that overestimates of self-
efficacy could be negative for students with low aptitude because they may attempt activities
beyond their reach leading to failure and distress. The findings from this study indicate that
students’ academic achievement (end-of-course grades) did not relate to their estimation of their
academic self-efficacy. Possible causes for high academic self-efficacy in first year students
could be, unconfirmed and unrealistic perceptions of their academic skills, or previous
experiences with grade inflation.
Findings from this study indicate a need to understand what is defined as effective
functioning of students, especially those in developmental education, which requires both skills
and high efficacy beliefs. Bandura (1986) believed that efficacy judgments that are most
effective are those that slightly exceed what one can do at a given time. To achieve continuous
effective functioning, students must continuously adapt subskills to manage ever-changing
situations. Self-influences can affect social environments, for example, when learners decide
they need more instruction on a skill and seek out a qualified teacher. Students in developmental
courses can learn to self-direct their learning through feedback from teachers about their skills,
self-reflection, and continued practice.
An understanding of social cognitive theory (Bandura, 1986) and self-efficacy is
especially germane to school learning and other achievement situations (Schunk, 2004).
Interventions in academic settings aimed at reducing procrastination and raising academic self-
efficacy are based in a students’ internalization of social variables to self-influences to achieve
self-regulatory control. With increased skill acquisition the unidimensional social-to-self
transformation process becomes a bi directional interactive process as learners alter and adjust

81
their social environments to enhance achievement (Schunk, 1999). As students work on tasks,
they evaluate their learning progress and these perceptions of progress substantiate their self-
efficacy for learning. Observing similar peer models performing a task well can raise observers’
self-efficacy. One way is to use coping models who initially demonstrate the typical fears and
deficiencies of observers but over time improve their performance on the task and gain
confidence in their abilities. Students in this sample may have failed along the way to effectively
monitor their learning process.
Developmental educators can use important learning theories and interventions derived
from social cognitive theory emphasizing modeling, improved academic self-efficacy, and
support structures built into the curriculum to improve self-regulation skills. Learners acquire an
approximation of skills by observing models, applying practice of skills, and using teachers’
corrective feedback. With this type of support, much could be done to improve the success rates
of those students in developmental education. This lends credence to Elias and Loomis’ (2000)
suggestion that “by having instructors increase the amount of opportunities students have to be
successful, they will be aiding in the development and strengthening of those students’ academic
self-efficacy” (p. 453). Any students with lower self-efficacy scores could be helped using a
combination of timely assessment of academic self-efficacy and an instructional focus using
coping models in the classroom. Students with lower academic self-efficacy scores could be
readily identified and paired with students who have higher academic self-efficacy scores and
slightly higher academic skill levels to work on tasks.
Students in developmental education courses may have unrealistic perceptions of their
academic self-efficacy. Teachers can assess academic self-efficacy at different times during a
semester establishing more realistic expectations of academic self-efficacy and setting up

82
realistic goals and appropriate feedback. This study lends support to research reports on
overconfidence in low-achieving students. Hacker, Bol, Horgan, and Rakow (2000) found that
high performing students were much more accurate in predicting their exam scores than lower
performing students. They found that lowest performing students showed gross overconfidence
in predictions of their grades and those judgments of performance were influenced by prior
judgments and not prior performance. The key for developmental education students is to help
them become better self-regulators aligning the realities of their performance so they may better
prepare for tests, work harder, and persist in order to accommodate any knowledge deficits.
Frequent feedback must be provided to students taking developmental courses so their
perceptions of their work can indicate how hard they must prepare when studying for exams and
submitting assignments.
Delimitations of the Study
Grades are reflective of achievement in a particular course and at one point in time
(Pinxten et al., 2010). Grades are subjective as they may be influenced by a teacher’s lenience or
harshness or a tendency to grade on a curve (Skaalvik & Hagtver, 1990). School grades may
reflect more than just a student’s course achievement level. The activities that teachers believe
constitute academic achievement may vary from teacher to teacher. In addition, grades often try
to communicate multiple pieces of information about students that can not be contained within a
single academic mark (Allen, 2005). Grades create a public record of a student’s academic
achievement that can communicate to others the level of mastery of a subject.
Grades for students enrolled in developmental classes have a possibility for grade bias
and inflation. Students who do not achieve at least a C in the class cannot take the exit tests for
moving out of that developmental area. In this study, even though all students had an equal

83
chance of achieving the end-of-course grade in the developmental English course, there was a
possibility of bias in grading or inequities. Teacher training and education was not considered as
a predictor variable, but could yield some differences in student’s grades. Observations from a
visual examination indicated some patterns or differences for higher or lower grades between
teacher’s grades in the 13 course sections for this developmental course.
Much research on procrastination has relied on self-reported measures. It is also
important to measure the academic consequences of procrastination like time used to turn in
assignments, time used to hand in term paper outlines, and hours spent studying or working on
projects. Self-reported procrastination has been validated in prior studies against behavior
measures of academic procrastination (Rothblum, Beswick & Mann, 1988; Rothblum et al.,
1986; and Solomon & Rothblum, 1984). Future studies should consider using behavioral
measures of academic procrastination in addition to the self-reported measures.
Recommendations for Future Practice
Teachers and educators who allow for assessment of academic self-efficacy, goal setting,
modeling inside the classroom, and increased opportunities for students to have feedback and
self-evaluations will help motivate students and insure they do not drop out of developmental
education courses. When procrastinators find the tasks they postpone aversive and they lack self-
efficacy this indicates a motivational problem (Blunt & Pychyl, 2000; Ferrari, J., 2004; Steel,
2003). Recommendation for interventions based on a motivational view are directed at (a)
improving self-regulation setting goals, monitoring progress, and managing time, (b) enhancing
self-efficacy, promoting success experiences, disputing unrealistic beliefs, and (c) protecting
goal behavior from distractions (Schouwenburg, 2004). Counselors in colleges who adopt this
explanation tend to include the context or situation of the behavior involved. They regard this
84
context as a choice situation. It would be interesting to explore these same constructs as they
relate to self-control theory with current expectancy value theory or motivation constructs
(Schouwenburg, 2004; Schouwenburg & Groenewoud, 1997; Steel, 2003).
In order to improve developmental education students’ academic self-efficacy through
interventions discussed in this study, goal setting must be included. Goals enhance self-efficacy,
and Schunk (1983) found that children who received both goals and social comparative
information improved their skill acquisition. Goals enhanced self-efficacy and comparative
information promoted motivation. Self-reactions to goal progress are an important component of
social cognitive theory as self-reactions motivate behavior (Bandura, 1986). For developmental
education students, goal setting and self-evaluations are extremely important, and could possibly
reduce the dropout rate of students. Developmental education students frequently get
discouraged because they are taking non-credit courses, while their peers may be taking courses
for degree credit. Students who realize that developmental education enhances their ability to
improve their foundational academic skills and connect that with both short range and long range
goals, can be motivated to work harder and not give up. Goal progress and attainment raises
learners’ self-efficacy and can lead to adopting new, more difficult goals (Schunk, 1990).
Knowing you may procrastinate and having coping skills to overcome it are two different
things. Students need to feel like there is a solution available to them if they desire to improve
their tendencies for procrastination. Colleges must provide solutions to students who seek them.
Particularly as it relates to students in developmental courses, students’ level of ability may
determine whether or not they can get away with their tendency to procrastinate as indicated by
Beck et al. (2000). There are a number of students who have succeeded in counteracting the
effects of procrastination tendencies when it comes to academic achievement, but the significant

85
relationship found in this study indicates that some students have not. Solomon and Rothblum
(1984) found in their original study using the PASS instrument that one-half of students admitted
that procrastination was a moderate or severe problem. Approximately one-fourth of those
students believed that their procrastination tendencies interfered with their grade point averages
and the quality of their lives. So, while the literature and research studies remain inconsistent
about whether academic procrastination may or may not have a direct impact on grades, this
study suggests that students could improve their course grades through interventions for
academic procrastination. Students are willing and able to self-report that they have a problem
with academic procrastination. They have probably lived with this trait for some time, and have
learned coping skills during their education. The problems for students may occur when they
combine low academic self-efficacy with high procrastination tendencies. This study resulted in
a negative relationship between these variables indicating that low academic self-efficacy and
high procrastination tendencies could limit academic achievement. The risk may be higher for
students with lower cognitive abilities or placement in a developmental education course. An
understanding of student behaviors and an assessment of both procrastination behaviors and
academic self-efficacy beliefs could help students persist longer and work harder in their classes.
To assist students’ efforts to reduce procrastination, educators must learn to develop
techniques that students can adopt to use in a project or task setting. As academic projects are
assigned students may benefit from tools to help them reduce their procrastination tendencies.
Use of daily diaries or logs as recommended in previous studies could move students to this new
behavior (Pychyl, Lee, et al., 2000; Scher & Ferrari, 2000). The PASS instrument may have
applicable use as a diagnostic tool in colleges, especially when used in a pre/post intervention.
Students who build in rewards for not procrastinating sooner would benefit from feedback

86
resulting in a behavioral change, which could improve course outcomes.
Recommendations for Further Research
Academic procrastination and academic self-efficacy may interact with other variables
and with varying levels of ability. It would be suggested to follow this study with an
experimental program to measure academic procrastination and academic self–efficacy, offer
counseling or project based interventions, and then follow up with a post test to see if
improvements were made. It would also be interesting to include teaching training, education,
and attitudes towards students in developmental courses as variables for further research. Finally,
self-reported measures of academic procrastination should be combined with more behavioral
assessments including time used to turn in assignments, time used to hand in term paper outlines,
and hours spent studying or working on projects. Finally, the timing of academic self-efficacy
assessment and skill levels of students should be considered in future research. It would be
interesting to investigate differences in perceptions of academic reality and ability in
developmental education students. Students’ high perception of their academic self-efficacy was
not related to their course achievement. The timing of the survey delivered after 4 weeks into the
semester had an effect on these scores. It would be interesting to investigate how differing
academic self-efficacy scores could be obtained if collected at other points during a semester.

87
REFERENCES
ACT. (2006). COMPASS: ESL: A comprehensive computerized placement and diagnostic
assessment and support system. Reference manual. Iowa City, IA: ACT, Inc.
ACT. (2012). ACT’s COMPASS: Computer-adapted placement assessment and support services
test. Retrieved from http://www.act.org/compass/index.html
Ainslie, G. (1992). Picoeconomics: The strategic interaction of successive motivational states within the
person. Cambridge, England: Cambridge University Press.
Allen, J. (2005). Grades as valid measures of academic achievement of classroom learning. Clearing
House, 78, 218-223. doi:10.3200/TCHS.78.5.218-223
Arendale, D. R. (2005). Terms of endearment: Words that define and guide developmental education.
Journal of College Reading and Learning, 35(2), 66-82.
Arendale, D. R. (2007) A glossary of developmental education and learning assistance terms. The Free
Library. Retrieved from http://www.thefreelibrary.com
Arvey, R. D., Rotundo, M., Johnson, W., & McGue, M. (2003, April). The determinants of leadership:
The role of genetics and personality. Paper presented at the 18th annual conference of the
Society for Industrial and Organizational Psychology, Orlando, FL.
Bailey, T. (2009). Challenge and opportunity: Rethinking the role and function of developmental
education in community college. New Directions for Community Colleges, 145, 11-30.
doi:10.1002/cc.352
Bailey, T., Jeong, D. W., & Cho, S. (2008). Referral, enrollment, and completion in developmental
education sequences in community colleges. New York, NY: Columbia University, Community

88
College Research Center.
Bandura, A. (1977). Social learning theory. Englewood Cliffs, NJ: Prentice Hall.
Bandura, A. (1986). Social foundations of thought and action: A social cognitive theory. Upper Saddle
River, NJ: Prentice Hall.
Bandura, A. (1993). Perceived self-efficacy in cognitive development and functioning.
Educational Psychologist, 28, 117-148. doi:10.1207/s15326985ep2802_3
Bandura, A. (1997). Self-efficacy: The exercise of control. New York, NY: Freeman.
Baumeister, R. F., Heatherton, T. F., & Tice, D. M. (1994). Losing control: How and why people fail at
self-regulation. San Diego, CA: Academic Press.
Beck, B. L., Koons, S. R., & Milgram, D. L. (2000) Correlates and consequences of behavioral
procrastination: the effects of academic procrastination, self-consciousness, self-esteem,
and self-handicapping. Journal of Social Behavior and Personality, 15, 3-13.
Beswick, G., Rothblum, E., & Mann, L. (1988). Psychological antecedents of student
procrastination. Australian Psychologist, 23, 207-217. doi:10.1080/00050068808255605
Beswick, G., & Mann, L. (Eds.). (1994). State orientation and procrastination. Gottiingen, Germany:
Hogrefe & Huber.
Bettinger, E., & Long, B. (2005). Remediation at the community college: Student participation and
outcomes. New Directions for Community Colleges, 129, 17-26. doi:10.1002/cc.182
Betz, N. E., & Hackett, G. (1983). The relationship of mathematics self-efficacy expectations to
perceived career options in college women and men. Journal of Vocational Behavior, 23, 329-
345. doi:10.1016/0001-8791(83)90046-5
Bijou, S., Morris, E., & Parsons, J. (1976). A PSI course in child development with a procedure for
reducing student procrastination. Journal of Personalized Instruction, 1, 36-40.

89
Binet, A., & Simon, T. (1905). Méthode nouvelle pour le diagnostic du niveau intellectuel des
anormaux. L'Année Psychologique, 11, 191-244. doi:10.3406/psy.1904.3675
Blunt, A. K., & Pychyl, T. A. (1998). Volitional action and inaction in the lives of undergraduate
students: State orientation, procrastination, and proneness to boredom. Personality & Individual
Differences, 24, 837-846. doi:10.1016/S0191-8869(98)00018-X
Blunt, A. K., & Pychyl, T. A. (2000). Task aversiveness and procrastination: A multidimensional
approach to task aversiveness across stages of personal projects. Personality & Individual
Differences, 28, 153-167. doi:10.1016/S0191-8869(99)00091-4
Bong, M. (2001). Role of self-efficacy and task-value in predicting college students’ course
performance and future enrollment intentions. Contemporary Educational Psychology 26,
553-570. doi:10.1006/ceps.2000.1048
Boylan, H. R., Bonham, B. S., & White, S. R. (1999). Developmental and remedial education in
postsecondary education. New Directions for Higher Education, 108, 87-101.
doi:10.1002/he.10806
Bridges, K. R., & Roig, M. (1997). Academic procrastination and irrational thinking: A re-examination
with context controlled. Personality and Individual Differences, 22, 941-944.
doi:10.1016/S0191-8869(96)00273-5
Brown, S. D., Lent, R. W., & Larkin, K.C. (1989). Self-efficacy as a moderator of scholastic
aptitude: Academic performance relationships. Journal of Vocational Behavior, 35, 64-
75. doi:10.1016/0001-8791(89)90048-1
Burka, J., & Yuen, L. (1983). Procrastination: Why you do it, what to do about it. Reading, MA:
Addison-Wesley.

90
Butler, D. L., & Winne, P. H. (1995). Feedback and self-regulated learning: A theoretical
synthesis. Review of Educational Research, 65, 245-281.
doi:10.3102/00346543065003245
Calcagno, J. (2007). Evaluating the impact of developmental education in community colleges:
A quasi-experimental regression-discontinuity design. Unpublished doctoral dissertation,
Columbia University, New York.
Calcagno, J., & Long, B. (2008). The impact of postsecondary remediation using a regression
discontinuity approach: Addressing endogenous sorting and noncompliance. New York,
NY: National Center for Postsecondary Research.
Casazza, M. E. (1999). Who are we and where did we come from? Journal of Developmental Education,
23(1), 2-7
Castator, M., & Tollefson, N. (1996). Underprepared students and the college curriculum: Identifying
high-risk courses. Journal of Applied Research in the Community College, 3, 179-200.
Clark, J., & Hill, O. (1994). Academic procrastination among African American college
students. Psychological Reports, 75, 931-36. doi:10.2466/pr0.1994.75.2.931
Clowes, D. A. (1980). More than a definitional problem: Remedial, compensatory, and developmental
education. Journal of Developmental Education, 4(1), 8-10. Retrieved from
http://www.ncde.appstate.edu/publications/
Clowes, D. A. (2001). Program evaluation for remedial, compensatory, and developmental education:
Definitional problems and design decisions. In V. L. Farmer & W. A. Barham (Eds.), Selected
models of developmental education programs in higher education (pp. 341-357). Lanham, MD:
University Press of America.

91
Cohen, J. (1992). A power primer. Psychological Bulletin, 112, 155-159. doi:10.1037/0033-
2909.112.1.155
Collins, J. L. (1982). Self-efficacy and ability in achievement behavior. Paper presented at the
annual meeting of the American Educational Research Association, New York, NY.
Complete College America. (2011). Time is the enemy of graduation. Washington, DC
Costa, P.T., Jr., & McCrae, R. (1992). The NEO personality inventory-revised. Odessa, FL:
Psychological Assessment Resources.
Crews, D. M., & Aragon, S. R. (2007). Developmental education writing: Persistence and goal
attainment among community college students. Community College Journal of Research
& Practice, 31, 637-652. doi:10.1080/10668920600859715
Education Commission of the States. (2002, September). State policies on community college
remedial education: Findings from a national survey. Denver, CO: Boswell & Jenkins.
Elias, S. M., & Loomis, R. J. (2000). Using an academic self-efficacy scale to address university major
persistence. Journal of College Student Development, 41(4), 450-454.
Elias, S. M., & Loomis, R. J. (2002). Utilizing need for cognition and perceived self-efficacy to
predict academic performance. Journal of Applied Social Psychology, 32, 1687-1702.
doi:10.1111/j.1559-1816.2002.tb02770.x
Elliot, R. (2002). A ten-year study of procrastination stability. Unpublished master’s thesis,
University of Louisiana, Monroe.
Ellis, A., & Knaus, W. J. (1977). Overcoming procrastination. New York, NY: Institute for Rational
Living.
Ellis, A. & Knaus, W. J. (2002). Overcoming procrastination (rev. ed.). New York, NY: New
American Library.

92
Else-Quest, N. M., Hyde, J. S., Goldsmith, H. H., & Van Hulle, C. A. (2006). Gender differences in
temperament: A meta-analysis. Psychological Bulletin, 132, 33-72. doi:10.1037/0033-
2909.132.1.33
Ezekiel, M. (1930). Methods of correlation analysis. New York, NY: Wiley.
Farmer, V. L., & Barham, W. A. (2001). An integrated developmental education model: A
comprehensive approach. In V. L. Farmer & W. A. Barham (Eds.), Selected models of
developmental education programs in higher education. Lanham, MD: University Press of
America.
Feingold, A. (1994). Gender differences in personality: A meta-analysis Psychological Bulletin, 116,
429-526. doi:10.1037/0033-2909.116.3.429
Ferrari, J. R. (1989) Reliability of academic and dispositional measures of procrastination.
Psychological Reports, 64, 1057-1058. doi:10.2466/pr0.1989.64.3c.1057
Ferrari, J. R. (1992). Procrastinators and perfect behavior: An exploratory factor analysis of self-
presentation, self-awareness, and self-handicapping components. Journal of Research in
Personality, 26, 75-84. doi:10.1016/0092-6566(92)90060-H
Ferrari, J. (1993). Christmas and procrastination: Explaining lack of diligence at a "real-world" task
deadline. Personality & Individual Differences, 14, 25-33. doi:10.1016/0191-8869(93)90171-X
Ferrari, J. R. (2000). Procrastination and attention: Factor analysis of attention deficit, boredomness,
intelligence, self-esteem and task delay frequencies. Journal of Social Behavior & Personality,
15, 185-196.
Ferrari, J. (2004). Trait procrastination in academic settings: An overview of students who engage in
task delays. In H. Schouwenberg, C. Lay, T. Pychl, & J. Ferrari (Eds.), Counseling the
procrastinator in academic settings. Washington, DC: American Psychological Association.

93
Ferrari, J. R., Johnson, J. L., & McCown, W. G. (1995). Procrastination and task avoidance:
Theory research and treatment. New York, NY: Plenum.
Ferrari, J., & Pychyl, T. (2000). The scientific study of procrastination: Where have we been and
where are we going? Journal of Social Behavior and Personality, 15 (5), 3-13.
Finney, S. J., & Schraw, G. (2003). Self-efficacy beliefs in college statistics courses. Contemporary
Educational Psychology, 28, 161-186. doi:10.1016/S0361-476X(02)00015-2
Freud, S. (1953). The ego and the id and other works. The standard edition of the complete
psychological works of Sigmund Freud, 19, 66.
Gall, M., Gall, J., & Borg, W. (2007). Educational research (8th ed.). Boston, MA: Pearson.
Gerlaugh, K., Thompson, L., Boylan, H. R., & Davis, H. (2007). National study of
developmental education II: Baseline data for community colleges. Research in
Developmental Education, 20(4), 1-4.
Gloeckner, G., Gliner, J., Tochterman, S., & Morgan, G. (2001). Assessing validity and
reliability for data collection instruments. In E.I. Farmer & J.W. Rojewski (Eds.),
Research pathways. Lanham, MD: University Press of America.
Grubb, W. N., & Associates. (1999). Honored but invisible: An inside look at teaching in
community colleges. New York, NY: Routledge.
Grubbs, F. E. (1950). Sample criteria for testing outlying observations. Annals of Mathematical
Statistics, 21, 27-58. doi:10.1214/aoms/1177729885
Guay, F., Marsh, H. W., & Boivin, M. (2003). Academic self-concept and academic achievement:
Developmental perspectives on their causal ordering. Journal of Educational Psychology, 95,
124-136. doi:10.1037/0022-0663.95.1.124
Hacker, D., Bol, L., Horgan, D. & Rakow, E. (2000). Test prediction and performance in a classroom

94
context. Journal of Educational Psychology, 92, 160-170. doi: 10.1037//0022-0663.92.1.160
Hackett, G. (1995). Self-efficacy in career choice and development. In A. Bandura (Ed.), Self-efficacy in
changing societies (pp. 232-258). New York, NY: Cambridge University Press.
Hackett, G., Betz, N. E., Casas, J. M., & Rocha-Singh, I. A. (1992). Gender, ethnicity, and social
cognitive factors predicting the academic achievement of students in engineering.
Journal of Counseling Psychology, 39, 527-538. doi:10.1037/0022-0167.39.4.527
Harriott, J., & Ferrari, J. (1996). Prevalence of procrastination among samples of adults.
Psychological Reports, 78, 611-616. doi:10.2466/pr0.1996.78.2.611
Higbee, J., Arendale, D., & Lundell, D. (2005). Using theory and research to improve access and
retention in developmental education. New Directions for Community Colleges, 129, 5-
15. doi:10.1002/ca.181
Huberty, C. J., & Hussein, M. (2001). Reporting Information in Multiple Correlation and
Multiple Regression Studies. In E. Farmer & J. Rojewski (Eds.), Research pathways (pp.
325-373). Lanham, MD: University Press of America.
Huberty, C. J., & Petoskey, M. (1999). Use of multiple correlation analysis and multiple
regression analysis. Journal of Vocational Education Research, 24, 15-32.
Huck, S. (2004). Reading statistics and research. Boston, MA: Pearson.
Hughes, K. & Scott-Clayton, J. (2011). Assessing developmental assessment in community
colleges. Community College Review, 39, 327-351. doi:10.1177/0091552111426898.
IBM Corporation. (2010). Statistical software package for the social sciences (SPSS). Armonk,
NY: SPSS, Inc.
Jiao, Q., & Onwuegbuzie, A. (1998). Understanding library anxious graduate student. Library
Review, 47, 217-224.

95
Judge, T., & Bono, J. (2001). Relationship of core self-evaluations traits-self-esteem, generalized
self-efficacy, locus of control, and emotional stability-with job satisfaction and job
performance: A meta-analysis. Journal of Applied Psychology, 86, 80-92.
doi:10.1037/0021-9010.86.1.80
Kachgal, M. M., Hansen, L. S., & Nutter, K. J. (2001). Academic procrastination
prevention/intervention: Strategies and recommendations. Journal of Developmental Education,
25, 14-24.
Kinnear, P., & Gray, C. (2009). SPSS 16 made simple. New York, NY: Psychology Press
Klein, E. (1971). A comprehensive etymological dictionary of the English language. New York, NY:
Elsevier.
Knaus, W. J. (1998). Do it now: Break the procrastination habit. New York, NY: Wiley.
Knaus, W. J. (2000). Procrastination, blame, and change. Journal of Social Behavior and
Personality 15, 153-166.
Kuh, G., Kinzie, J., Buckley, J., Bridges, B., Hayek, J. (2006). What matters to student success:
A review of the literature. Commissioned Report for the National Symposium on
Postsecondary Student Success: Spearheading a Dialog on Student Success. Washington,
DC : National Postsecondary Education Cooperative.
Lay, C. H. (1986). At last, my research article on procrastination. Journal of Research in Personality,
20, 474-495. doi:10.1016/0092-6566(86)90127-3
Lay, C. H. (1990). Working to schedule on personal projects: An assessment of person-project
characteristics and trait procrastination. Journal of Social Behavior & Personality, 5, 91-103.
Lay, C. H. (1992). Trait procrastination and the perception of person-task characteristics. Journal of
Social Behavior & Personality, 7, 483-494.
96
Lay, C. H., & Silverman, S. (1996). Trait procrastination, time management, and academic behavior.
Personality and Individual Differences, 21, 61-67. doi:10.1016/0191-8869(96)00038-4
Lent, R. W., Brown, S. D., & Gore, P. A., Jr. (1997). Discriminant and predictive validity of academic
self-concept, academic self-efficacy, and mathematics-specific self-efficacy. Journal of
Counseling Psychology, 44, 307-315. doi:10.1037/0022-0167.44.3.307
Lent, R. W., Brown, S. D., & Larkin, K. C. (1984). Relation of self-efficacy expectations to
academic achievement and persistence. Journal of Counseling Psychology, 31, 356-362.
doi:10.1037//0022-0167.31.3.356
Lent, R. W., Brown, S. D., & Larkin, K. C. (1986). Self-efficacy in the prediction of academic
performance and perceived career options. Journal of Counseling Psychology, 33, 265-269.
doi:10.1037/0022-0167.33.3.265
Lent, R. W., & Hackett, G. (1987). Career self-efficacy: Empirical status and future directions.
Journal of Vocational Behavior, 30, 347-382. doi:10.1016/0001-8791(87)90010-8
Levin, H. M., & Calcagno, J. C. (2008). Remediation in the community college. Community
College Review, 35(3), 181-207. doi:10.1177/0091552107310118
MacIntyre, P. (1964). Dynamics and treatment of passive aggressive underachievers. American Journal
of Psychotherapy, 18, 95-108.
Manhattan Institute for Policy Research. (2003, September). Public high school graduation and
college readiness rates in the United States (Working Paper No. 3). New York, NY:
Greene & Forster.
Martorell, P., & McFarlin, I. (2011). Help or hindrance? The effects of college remediation on
academic and labor market outcomes. Review of Economics and Statistics, 93, 436-454.
doi:10.1162/REST_a_0098

97
Mattson, C. E. (2007). Beyond admission: Understanding precollege variables and the success of
at-risk students. Journal of College Admission, 196, 8-13.
McCabe, R. H., & Day, P. R. (Eds.). (1998). Developmental education: A twenty-first century
social and economic imperative. Mission Viejo, CA: League for Innovation in the
Community College.
McCown, W., & Johnson, J., (1989). Validation of an adult inventory of procrastination. Paper
presented at the Society for Personality Assessment, New York.
Milgram, N. A. (Ed.). (1991). Procrastination (Vol. 6). New York, NY: Academic Press.
Milgram, N. A. (1992). El retraso: Una enfermedad de los tiempos modernos (Procrastination: A malady
of modern time). Boletin de Psicologia, 35, 83-102.
Milgram, N. A., Batori, G., & Mowrer, D. (1993). Correlates of academic procrastination. Journal of
School Psychology, 31, 487-500. doi:10.1016/0022-4405(93)90033-F
Moore, D. (2007). The basic practice of statistics (4th ed.). New York, NY: Freeman.
Multon, K. D., Brown, S. D., & Lent R.W. (1991) Relation of self-efficacy beliefs to academic
outcomes: A meta-analytic investigation. Journal of Counseling Psychology, 38, 30-38.
doi:10.1037//0022-0167.38.1.30
National Association for Developmental Education (NADE). (2012). 2012 fact sheet: Responses to
frequently asked questions about The National Association for Developmental Education.
Retrieved from http://nade.net/2documents/fact_sheet/2012 FactSheet.pdf
National Center for Education Statistics. (2010a). National postsecondary student aid study
(NPSAS:08). Washington, DC: US Department of Education, Postsecondary Studies Division.
National Center for Education Statistics. (2003b). Remedial education at degree granting postsecondary
institutions in fall 2000 (NCES 2004-010). Washington, DC: U.S. Department of Education,
98
Institute of Education Sciences.
O'Donoghue, T., & Rabin, M. (1999). Incentives for procrastinators. Quarterly Journal of
Economics, 114, 769-816. doi:10.1162/003355399556142
Onwuegbuzie, A. J. (2000). Academic procrastination and perfectionistic tendencies among
graduate students. Journal of Social Behavior and Personality, 15, 103-109.
Onwuegbuzie, A. J. (2004). Academic procrastination and statistics anxiety. Assessment &
Evaluation in Higher Education, 29, 3-19. doi:10.1080/0260293042000160384
Onwuegbuzie, A. J., & Collins, K. M. T. (2001). Writing apprehension and academic
procrastination among graduate students. Perceptual and Motor Skills, 92, 560-562.
doi:10.2466/pms.2001.92.2.560
Ozer, B. U., Demir, A., & Ferrari, J. (2009) Exploring academic procrastination among Turkish
students: Possible gender differences in prevalence and reasons. The Journal of Social
Psychology, 149, 241-257. doi:10.3200/SOCP.149.2.241-257
Pajares, F. (1996). Self-efficacy beliefs in academic settings. Review of Educational Research,
66, 543-578. doi:10.2307/1170653
Pajares, F. (1997). Current directions in self-efficacy research. In M. Maehr & P. R. Pintrich (Eds.),
Advances in motivation and achievement (Vol. 10, pp. 1-49). Greenwich, CT: JAI Press.
Pajares, F., & Miller, M. D. (1995). Mathematics self-efficacy and mathematics performances: The
need for specificity of assessment. Journal of Counseling Psychology, 42, 190-198.
doi:10.1037/0022-0167.42.2.190
Pascarella, E., & Terenzini, P. (1991). How college affects students: Findings and insights from twenty
years of research. San Francisco, CA: Jossey-Bass.
Pascarella, E., & Terenzini, P. (2005). How college affects students: A third decade of research. San
99
Francisco, CA: Jossey-Bass.
Pedhazur, E. J. (1997). Multiple regression in behavioral research. Fort Worth, TX: Harcourt
Brace.
Pintrich, P. R. (2000). The role of goal orientation in self-regulated learning. In M. Boekaerts, P.
R. Pintrich, & M. Zeidner (Eds.), Handbook of self-regulation (pp. 451-502). San Diego,
CA: Academic Press.
Pintrich, P. R., & De Groot, E. V. (1990). Motivational and self-regulated learning components of
classroom academic performance. Journal of Educational Psychology, 82, 33-40.
doi:10.1037/0022-0663.82.1.33
Pintrich, P., & Schrauben, B. (1992). Students' motivational beliefs and their cognitive engagement in
classroom academic tasks. In D. H. Schunk & J. L. Meece (Eds.), Student perceptions in the
classroom (pp. 149-183). Hillsdale, NJ: Erlbaum.
Pintrich, P. R., & Schunk, D. H. (1995). Motivation in education: Theory, research, and applications.
Englewood Cliffs, NJ: Prentice Hall.
Pinxten, M., De Fraine, B., Van Damme, J., & D’Haenens, E. (2010). Causal ordering of academic self-
concept and achievement: Effects of type of achievement measure. British Journal of
Educational Psychology, 80, 689-709. doi:10.1348/000709910X493071
Pressley, M., Borkowski, J., & Schneider, W. (1987). Cognitive strategies: Good strategy users
coordinate metacognition and knowledge. Annals of Child Development, 4, 89-129.
Pychyl, T. A., Lee, J. M., Thibodeau, R., & Blunt, A. (2000a). Five days of emotion: An experience
sampling study of undergraduate student procrastination. Journal of Social Behavior and
Personality, 15, 239-254.
100
Pychyl, T. A., Morin, R. W., & Salmon, B. R. (2000b). Procrastination and the planning fallacy:
An examination of the study habits of university students. Journal of Social Behavior and
Personality, 15, 135-150.
Roig, M., & De Tommaso, L. (1995). Are college cheating and plagiarism related to academic
procrastination? Psychological Reports, 77, 691-698. doi:10.2466/pr0.1995.77.2.691
Rothblum, E. D., Solomon, L. J., & Murakami, J. (1986). Affective, cognitive, and behavioral
differences between high and low procrastinators. Journal of Counseling Psychology, 33, 387-
394. doi:10.1037/0022-0167.33.4.387
Rubin, M. (1991). A glossary of developmental education terms compiled by the CRLA Task Force on
Professional Language for College Reading and Learning. Journal of College Reading and
Learning, 23(2), 1-14.
Scher, S. J., & Ferrari., J. R. (2000). The recall of completed and non-completed tasks through daily logs
to measure procrastination. Journal of Social Behavior and Personality, 15, 255-265.
Schouwenburg, H. C. (1993). Procrastination and failure-fearing students in terms of personality-
describing adjectives. Nederlands Tijdschrift voor de Psychologie en Haar Grensgebieden, 48,
43-44.
Schouwenburg, H. C., & Groenewoud, J. (1997). Study planning: A workbook for students. Groningen,
the Netherlands: Wolter-Noordhoff.
Schouwenburg, H.C. (2004). Procrastination in academic settings: General introduction. In H.
Schouwenburg, C. Lay, T. Pychyl, & J.Ferrari (Eds.), Counseling the procrastinator in academic
settings. Washington, DC: American Psychological Association.
Schouwenburg, H. C., Lay, C., Pychyl, T. A., & Ferrari, J. R. (Eds.). (2004). Counseling the
procrastinator in academic settings. Washington, DC: American Psychological Association.
101
Schunk, D. H. (1983). Developing children’s self-efficacy and skills: The roles of social comparative
information and goal setting. Contemporary Educational Psychology, 8, 76-86.
Schunk, D. H. (1990). Goal setting and self-efficacy during self-regulated learning. Educational
Psychologist, 25, 71-86.
Schunk, D. H. (1991). Self-efficacy and academic motivation. Educational Psychologist, 26,
207-231. doi:10.1207/s15326985ep2603&4_2
Schunk, D. H. (1999). Social-self interaction and achievement behavior. Educational
Psychologist, 34, 219-227. doi:10.1207/s15326985ep3404_3
Schunk, D. H. (2001). Social cognitive theory and self-regulated learning. In B. J. Zimmerman
& D. H. Schunk (Eds.), Self-regulated learning and academic achievement: Theoretical
perspectives (2nd ed., pp. 125-151). Mahwah, NJ: Erlbaum.
Schunk, D. H. (2004). Learning theories: An educational perspective (4th ed.). Upper Saddle
River, NJ: Pearson.
Schunk, D. H., & Ertmer, P. A. (1999). Self-regulatory processes during computer skill acquisition:
Goal and self-evaluative influences. Journal of Educational Psychology, 91, 251-260.
doi:10.1037/0022-0663.91.2.251
Schunk, D., & Ertmer, P. (2000). Self-regulation and academic learning: Self-efficacy enhancing
interventions. In M. Boekaerts, P. Pintrich, & M. Zeidner (Eds.), Handbook of self-
regulation (pp. 631-649). San Diego, CA: Academic Press.
Shaw, G. (2000). Professional standards: An emerging face of developmental education. In J.
Higbee & P. Dwinell (Eds.), The many faces of developmental education (pp. 5-7).
Warrenburg, MO: National Association for Developmental Education.
Silver, M., & Sabini, J. (1981). Procrastinating. Journal of the Theory of Social Behavior, 11, 207-221.

102
doi: 10.1111/j.1468-5914.1981.tb00033.x
Skaalvik, E. M., & Hagrvet, K. A. (1990). Academic achievement and self-concept: An analysis of
causal predominance in a developmental perspective. Journal of Personality and Social
Psychology, 58, 292-307. doi: 10.1037/0022-3514.58.2.292
Skinner, B. F. (1953). Science and human behavior. New York, NY: Free Press.
Solomon, L. J., & Rothblum, E. D. (1984). Academic procrastination: Frequency and cognitive-
behavioral correlates. Journal of Counseling Psychology, 31, 503-509.
doi:10.1037/0022-0167.31.4.503
Solomon, L. J., & Rothblum, E. D. (1988). Procrastination Assessment Scale-Students. In M.
Hersen & A. S. Bellack (Eds.), Dictionary of behavioral assessment techniques. New
York, NY: Pergammon.
Spock, B. (1971). Helping the procrastinating child. Redbook, 136, 20.
Steel, P. (2007). The nature of procrastination: A meta-analytic and theoretical review of quintessential
self-regulatory failure. Psychological Bulletin, 133, 65-94. doi:10.1037/0033-2909.133.1.65
Thurston, L. L. (1938). Primary mental abilities. Chicago, IL: University of Chicago Press.
Tschannen-Moran, M., Woolfolk-Hoy, A., & Hoy, W. K. (1998). Teacher efficacy: Its meaning and
measure. Review of Educational Research, 68, 202-248. doi:10.1037/h0044251
University System of Georgia. (2008). Learning support requirements for first time freshmen
(Table). Retrieved from http://www.usg.edu/research/students/ls/ls-reqs/ls_fall08.pdf
Van der Kolk, B. (1987). Psychological trauma. Washington, DC: American Psychiatric Association.
Walker, L. J. S. (2004). Overcoming the patterns of powerlessness that lead to procrastination. In H. C.
Schouwenburg, C. H. Lay, T. A. Pychyl, & J. R. Ferrari (Eds.), Counseling the procrastinator in
academic settings. Washington, DC: American Psychological Association.

103
Watson, D. C. (2001). Procrastination and the five-factor model: A facet level analysis. Personality &
Individual Differences, 30, 149-158. doi:10.1016/S0191-8869(00)00019-2
Wesley, J. (1994). Effects of ability, high school achievement, and procrastinatory behavior on
college performance. Educational and Psychological Measurement, 54, 404–408.
doi:10.1177/0013164494054002014
Wolters, C. (2003). Understanding procrastination from a self-regulated learning perspective.
Journal of Educational Psychology, 95, 179-187. doi:10.1037//0022-0663.95.1.179
Zimmerman, B. J. (1989). Models of self-regulated learning and academic achievement. In B. J.
Zimmerman & D. H. Schunk (Eds.), Self-regulated learning and academic achievement (pp. 1-
25). New York, NY: Springer-Verlag.
Zimmerman, B. J. (1994). Dimensions of academic self-regulation: A conceptual framework for
education. In D. H. Schunk & B. J. Zimmerman (Eds.), Self-regulations of learning and
performance (pp. 3-24). Hillsdale, NJ: Erlbaum.
Zimmerman, B. J., & Paulsen, A. S. (1995). Self-monitoring during collegiate studying: An
invaluable tool for academic self-regulation. In P. R. Pintrich (Ed.), Understanding self-
regulated learning (pp. 13-28). San Francisco, CA: Jossey Bass.
Zimmerman, D. W. (1994). A note on the influence of outliers on parametric and nonparametric
tests. Journal of General Psychology, 121(4), 391-401. doi:10.2466/pms.1994.79.3.1160

104
APPENDIX A
DEMOGRAPHIC QUESTIONNAIRE
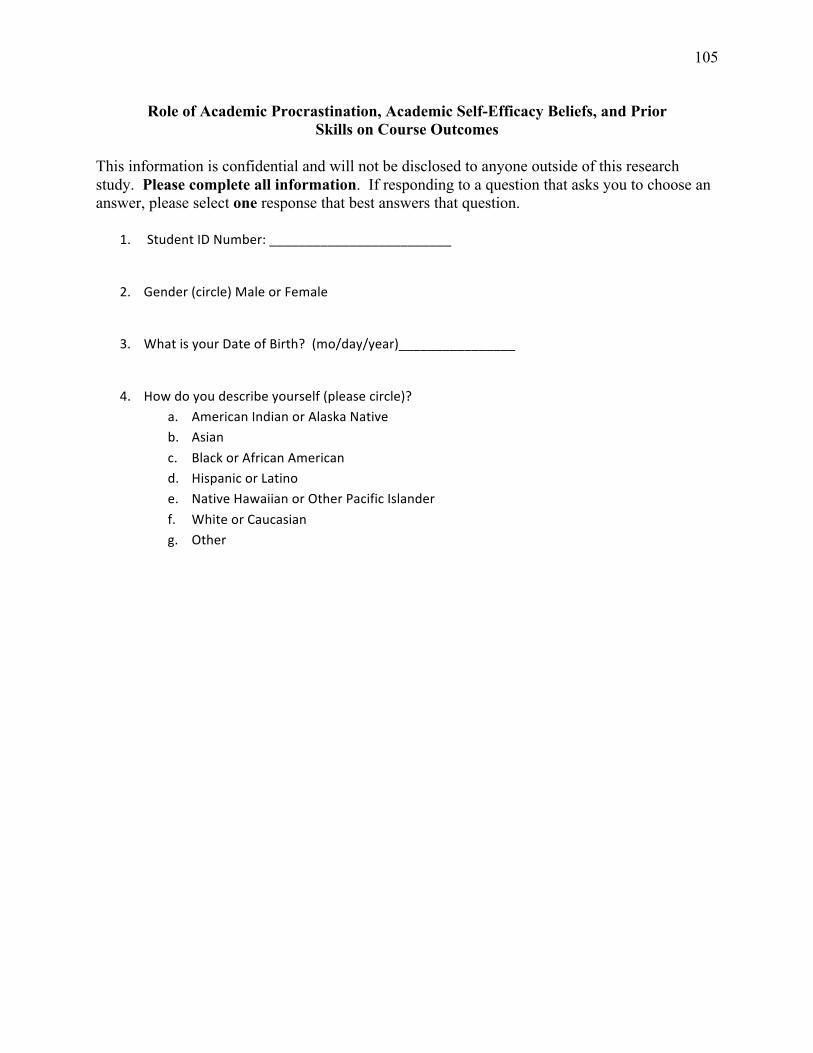
105
Role of Academic Procrastination, Academic Self-Efficacy Beliefs, and Prior Skills on Course Outcomes
This information is confidential and will not be disclosed to anyone outside of this research study. Please complete all information. If responding to a question that asks you to choose an answer, please select one response that best answers that question.
1. StudentIDNumber:_________________________
2. Gender(circle)MaleorFemale
3. WhatisyourDateofBirth?(mo/day/year)________________
4. Howdoyoudescribeyourself(pleasecircle)?
a. AmericanIndianorAlaskaNativeb. Asian
c. BlackorAfricanAmericand. HispanicorLatinoe. NativeHawaiianorOtherPacificIslander
f. WhiteorCaucasiang. Other

106
APPENDIX B
ACADEMIC SELF-EFFICACY SCALE FOR STUDENTS
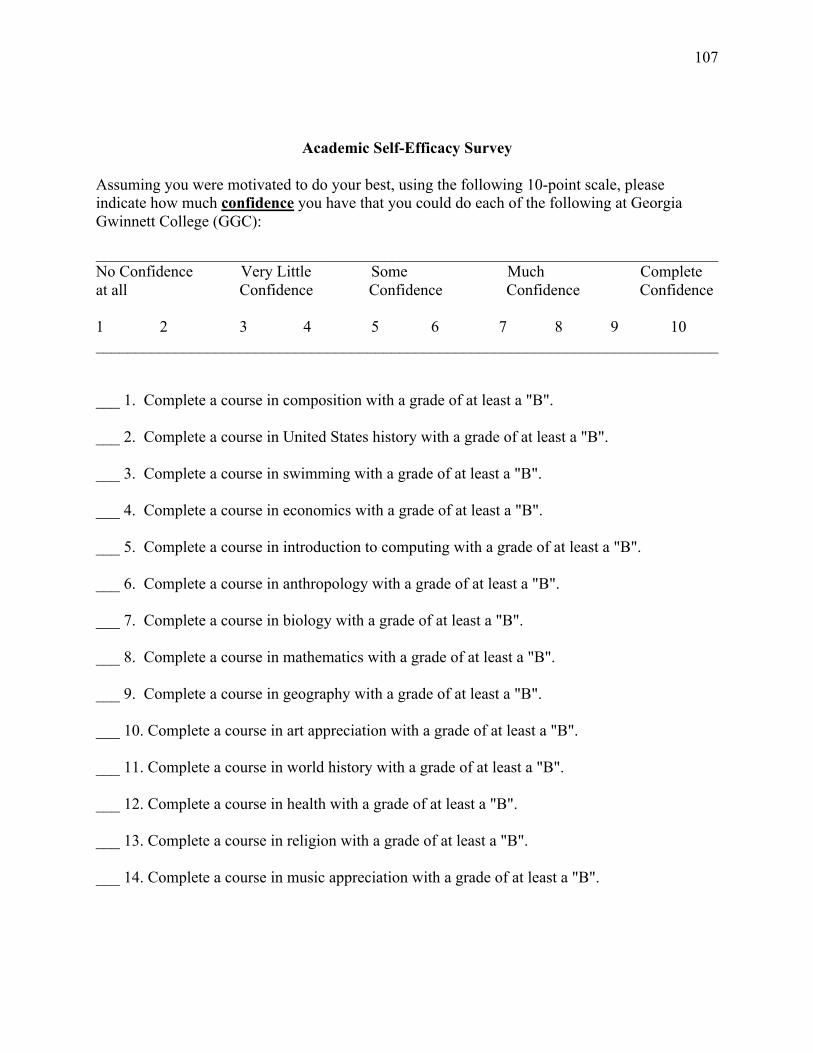
107
Academic Self-Efficacy Survey
Assuming you were motivated to do your best, using the following 10-point scale, please indicate how much confidence you have that you could do each of the following at Georgia Gwinnett College (GGC):
______________________________________________________________________________ No Confidence Very Little Some Much Complete at all Confidence Confidence Confidence Confidence 1 2 3 4 5 6 7 8 9 10 ______________________________________________________________________________ ___ 1. Complete a course in composition with a grade of at least a "B". ___ 2. Complete a course in United States history with a grade of at least a "B". ___ 3. Complete a course in swimming with a grade of at least a "B". ___ 4. Complete a course in economics with a grade of at least a "B". ___ 5. Complete a course in introduction to computing with a grade of at least a "B". ___ 6. Complete a course in anthropology with a grade of at least a "B". ___ 7. Complete a course in biology with a grade of at least a "B". ___ 8. Complete a course in mathematics with a grade of at least a "B". ___ 9. Complete a course in geography with a grade of at least a "B". ___ 10. Complete a course in art appreciation with a grade of at least a "B". ___ 11. Complete a course in world history with a grade of at least a "B". ___ 12. Complete a course in health with a grade of at least a "B". ___ 13. Complete a course in religion with a grade of at least a "B". ___ 14. Complete a course in music appreciation with a grade of at least a "B".

108
REMINDER: This is the scale you are using to indicate how much confidence you have that you could do each of the following at Georgia Gwinnett College (GGC):
______________________________________________________________________________ No Confidence Very Little Some Much Complete at all Confidence Confidence Confidence Confidence 1 2 3 4 5 6 7 8 9 10 ______________________________________________________________________________ ___ 15. Complete a course in English literature with a grade of at least a "B". ___ 16. Complete a course in chemistry with a grade of at least a "B". ___ 17. Complete a course in sociology with a grade of at least a "B". ___ 18. Complete a course in a foreign language with a grade of at least a "B". ___ 19. Complete a course in film with a grade of at least a "B". ___ 20. Complete a course in computer programming with a grade of at least a "B". ___ 21. Complete a course in psychology with a grade of at least a "B". ___ 22. Complete a course in physics with a grade of at least a "B" ___ 23. Earn a cumulative grade point average of at least 2.0 after two years of study (a 2.0 is =
to a C average at GGC). ___ 24. Earn a cumulative grade point average of at least 3.0 after two years of study (a 3.0 is =
to a B average at GGC). ___ 25. Earn a cumulative grade point average of at least 2.0 after three years of study (a 2.0 is
= to a C average at GGC). ___ 26. Earn a cumulative grade point average of at least 3.0 after three years of study (a 3.0 is
= to a B average at GGC). ___ 27. Complete all your junior and senior level courses in your major. ___ 28. Complete the requirements for your academic major with a grade point average of at least a 3.0 (a 3.0 is = to a B average at GGC). ___ 29. Successfully pass all courses enrolled in at GGC over the next two semesters (no W’s,
F’s or IP/In Progress grades).
109
___ 30. Successfully pass all courses enrolled in at GGC over the next three semesters (no W’s, F’s, or IP/In Progress grades).
___ 31. Graduate from GGC with a grade point average of at least 2.0 (a 2.0 is = to a C average at GGC).
___ 32. Graduate from GGC with a grade point average of at least 3.0 (a 3.0 is = to a B average at GGC).
___ 33. Graduate from GGC with a Bachelors Degree.
110
APPENDIX C
PROCRASTINATION ASSESSMENT SCALE STUDENTS (PASS)
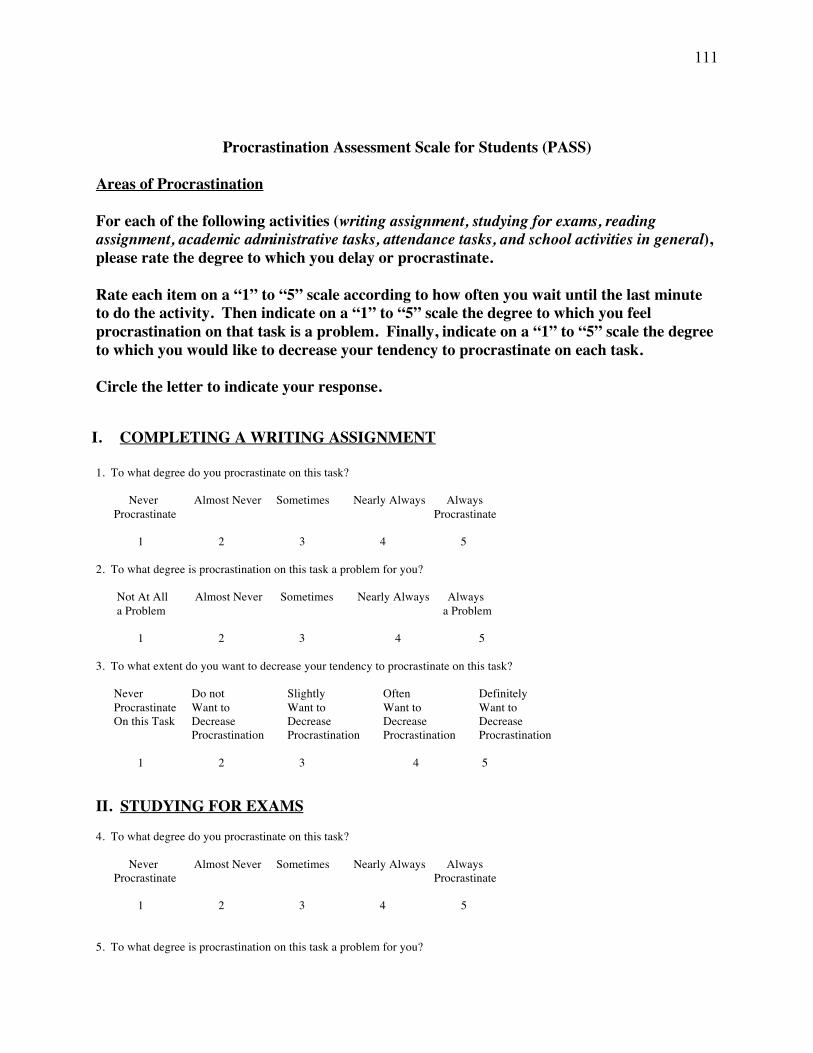
111
Procrastination Assessment Scale for Students (PASS) Areas of Procrastination For each of the following activities (writing assignment, studying for exams, reading assignment, academic administrative tasks, attendance tasks, and school activities in general), please rate the degree to which you delay or procrastinate. Rate each item on a “1” to “5” scale according to how often you wait until the last minute to do the activity. Then indicate on a “1” to “5” scale the degree to which you feel procrastination on that task is a problem. Finally, indicate on a “1” to “5” scale the degree to which you would like to decrease your tendency to procrastinate on each task. Circle the letter to indicate your response.
I. COMPLETING A WRITING ASSIGNMENT
1. To what degree do you procrastinate on this task? Never Almost Never Sometimes Nearly Always Always Procrastinate Procrastinate 1 2 3 4 5 2. To what degree is procrastination on this task a problem for you? Not At All Almost Never Sometimes Nearly Always Always a Problem a Problem 1 2 3 4 5 3. To what extent do you want to decrease your tendency to procrastinate on this task?
Never Do not Slightly Often Definitely Procrastinate Want to Want to Want to Want to On this Task Decrease Decrease Decrease Decrease
Procrastination Procrastination Procrastination Procrastination
1 2 3 4 5 II. STUDYING FOR EXAMS 4. To what degree do you procrastinate on this task? Never Almost Never Sometimes Nearly Always Always Procrastinate Procrastinate 1 2 3 4 5 5. To what degree is procrastination on this task a problem for you?
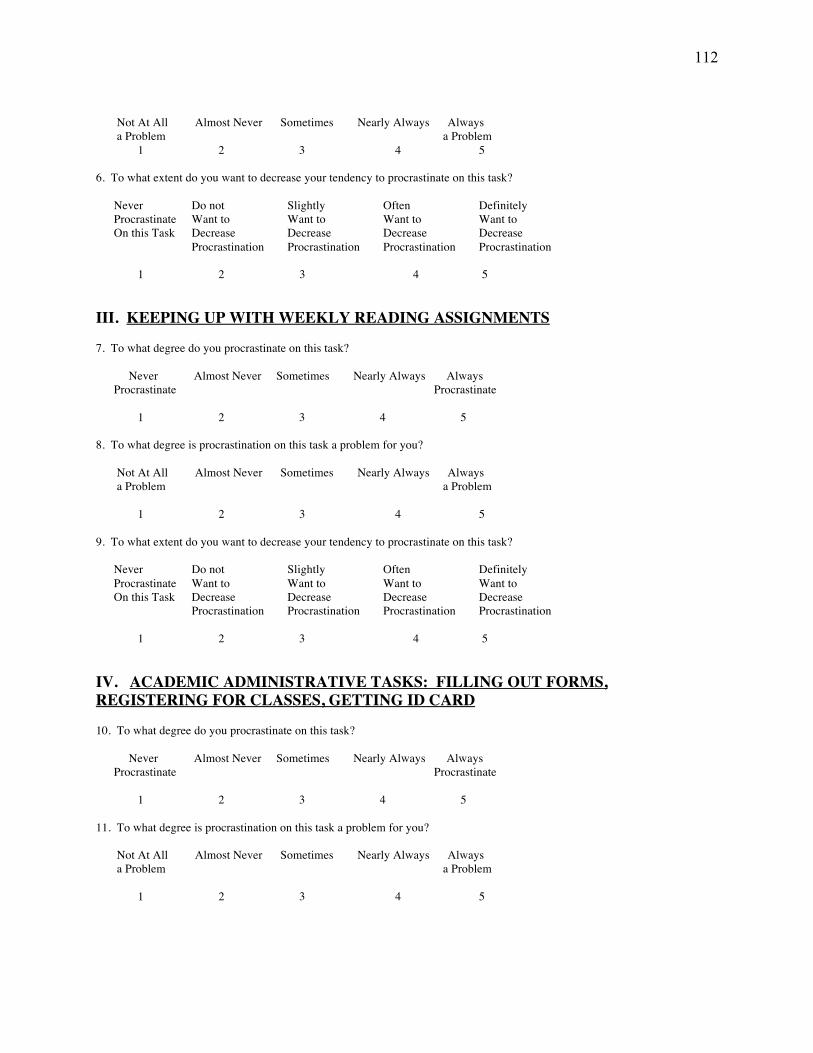
112
Not At All Almost Never Sometimes Nearly Always Always a Problem a Problem 1 2 3 4 5 6. To what extent do you want to decrease your tendency to procrastinate on this task?
Never Do not Slightly Often Definitely Procrastinate Want to Want to Want to Want to On this Task Decrease Decrease Decrease Decrease
Procrastination Procrastination Procrastination Procrastination
1 2 3 4 5 III. KEEPING UP WITH WEEKLY READING ASSIGNMENTS 7. To what degree do you procrastinate on this task? Never Almost Never Sometimes Nearly Always Always Procrastinate Procrastinate 1 2 3 4 5 8. To what degree is procrastination on this task a problem for you? Not At All Almost Never Sometimes Nearly Always Always a Problem a Problem 1 2 3 4 5 9. To what extent do you want to decrease your tendency to procrastinate on this task?
Never Do not Slightly Often Definitely Procrastinate Want to Want to Want to Want to On this Task Decrease Decrease Decrease Decrease
Procrastination Procrastination Procrastination Procrastination
1 2 3 4 5 IV. ACADEMIC ADMINISTRATIVE TASKS: FILLING OUT FORMS, REGISTERING FOR CLASSES, GETTING ID CARD 10. To what degree do you procrastinate on this task? Never Almost Never Sometimes Nearly Always Always Procrastinate Procrastinate 1 2 3 4 5 11. To what degree is procrastination on this task a problem for you? Not At All Almost Never Sometimes Nearly Always Always a Problem a Problem 1 2 3 4 5

113
12. To what extent do you want to decrease your tendency to procrastinate on this task?
Never Do not Slightly Often Definitely Procrastinate Want to Want to Want to Want to On this Task Decrease Decrease Decrease Decrease
Procrastination Procrastination Procrastination Procrastination
1 2 3 4 5 V. ATTENDANCE TASKS: CLASSROOM ATTENDANCE, MEETING WITH YOUR ADVISOR, MAKING AN APPOINTMENT WITH A PROFESSOR 13. To what degree do you procrastinate on this task? Never Almost Never Sometimes Nearly Always Always Procrastinate Procrastinate 1 2 3 4 5 14. To what degree is procrastination on this task a problem for you? Not At All Almost Never Sometimes Nearly Always Always a Problem a Problem 1 2 3 4 5 15. To what extent do you want to decrease your tendency to procrastinate on this task?
Never Do not Slightly Often Definitely Procrastinate Want to Want to Want to Want to On this Task Decrease Decrease Decrease Decrease
Procrastination Procrastination Procrastination Procrastination
1 2 3 4 5 VI. SCHOOL ACTIVITIES IN GENERAL: CLUB MEETINGS, OTHER SCHOOL FUNCTIONS NOT CLASSROOM RELATED 16. To what degree do you procrastinate on this task? Never Almost Never Sometimes Nearly Always Always Procrastinate Procrastinate 1 2 3 4 5 17. To what degree is procrastination on this task a problem for you? Not At All Almost Never Sometimes Nearly Always Always a Problem a Problem 1 2 3 4 5 18. To what extent do you want to decrease your tendency to procrastinate on this task?
Never Do not Slightly Often Definitely Procrastinate Want to Want to Want to Want to On this Task Decrease Decrease Decrease Decrease
Procrastination Procrastination Procrastination Procrastination

114
1 2 3 4 5 Reasons for Procrastination Think of the last time the following situation occurred. It's near the end of the semester. A paper you were assigned at the beginning of the semester is due very soon. You have not begun work on this assignment. There are reasons why you have been procrastinating on this task. Rate each of the following reasons on a 5-point scale according to how much it reflects why you procrastinated at the time. Indicate your response (number 1-5) on the line next to the statement Use the scale: Not At All Reflects Somewhat Definitely Reflects Why I Procrastinated Reflects Why I Procrastinated 1 2 3 4 5 ____19. You were concerned the professor wouldn't like your work.
____20. You waited until a classmate did his or hers, so that he/she could give you some advice. ____21. You had a hard time knowing what to include and what not to include in your paper. ____22. You had too many other things to do. ____23. There's some information you needed to ask the professor, but you felt uncomfortable approaching him/her. ____24. You were worried you would get a bad grade. ____25. You resented having to do things assigned by others. ____26. You didn't think you knew enough to write the paper. ____27. You really disliked writing papers. ____28. You felt overwhelmed by the task. ____29. You had difficulty requesting information from other people. ____30. You looked forward to the excitement of doing this task at the last minute. ____31. You couldn't choose among all the topics. ____32. You were concerned that if you did well, your classmates would resent you. ____33. You didn't trust yourself to do a good job. ____34. You didn't have enough energy to begin the task. ____35. You felt it just takes too long to write a paper. ____36. You liked the challenge of waiting until the deadline. ____37. You knew that your classmates hadn't started the paper either. ____38. You resented people setting deadlines for you. ____39. You were concerned you wouldn't meet your own expectations. ____40. You were concerned that if you got a good grade, people would have higher expectations of you in the future. ____41. You waited to see if the professor would give you some more information about the paper.

115
____42. You set very high standards for yourself and you worried that you wouldn't be able to meet those standards. ____43. You just felt too lazy to write the paper. ____44. Your friends were pressuring you to do other things.

116
APPENDIX D
INFORMED CONSENT

117
Consent Form
I, _________________________________, agree to participate in a research study titled "ROLE OF ACADEMIC PROCRASTINATION, ACADEMIC SELF-EFFICACY BELIEFS AND PRIOR SKILLS ON COURSE OUTCOMES FOR COLLEGE STUDENTS IN DEVELOPMENTAL EDUCATION" conducted by DeAnna Jackson Doctoral Candidate from the Department Workforce Education, Leadership, and Social Foundations at the University of Georgia (404-697-5371) under the direction of Dr. Jay W. Rojewski, Department of Workforce Education, Leadership, and Social Foundations, University of Georgia (542-4461). I understand that my participation is voluntary. I can refuse to participate or stop taking part at anytime without giving any reason, and without penalty or loss of benefits to which I am otherwise entitled. I can ask to have all of the information about me returned to me, removed from the research records, or destroyed. There are no known risks associated with participating in this research except a slight risk of breach of confidentiality, which remains despite steps that will be taken to protect my privacy. The reason for this study is to explore how student procrastination, confidence for completing academic tasks, and scores on the COMPASS Writing Skills Placement Test affects end-of-course grades. I will receive no direct benefit from my participation in this study. My participation however may provide an understanding of student behaviors to assist in the development of programs to decrease academic procrastination and increase student’s self-confidence for college. My participation will involve completing 2 surveys a) The Procrastination Assessment Scale-Students and b) The Academic Self-Efficacy Scale. This should only take about twenty minutes. The researcher will also be requesting from my teacher my final ENGL 0099 course grade and accessing my COMPASS Writing Skills Placement Test score in the Banner Student Information System at the end of the semester. The results of the research study may be published, but identifying information about me will not be used. The published results will be presented in summary form only. My identity will not be associated with my responses in any published format, and at no point in time will my course instructor know who did or did not participate in the study. When the researcher receives my surveys/questionnaires, my student identification number will be removed and replaced with a new non identifying student code. The master list or key to the student codes will be kept only by the researcher in a separate and locked file drawer from the survey questionnaires. This master list will be destroyed after 1 year. The investigator will answer any further questions about the research, now or during the course of the project.
€ I agree that DeAnna Jackson, the individual conducting this research, has permission to access my final course grades and my COMPASS Writing Skills Placement Test score.
€ I agree to take part in this research project. I will receive a signed copy of this consent form for my
records. _________________________ _______________________ __________ Name of Researcher Signature Date Telephone: ________________ Email: ____________________________ _________________________ _______________________ __________ Name of Participant Signature Date
Please sign both copies, keep one and return one to the researcher.

118
Additional questions or problems regarding your rights as a research participant should be addressed to The Chairperson, Institutional Review Board, University of Georgia, 629 Boyd Graduate Studies Research Center, Athens, Georgia 30602; Telephone (706) 542-3199; E-Mail Address [email protected].
Related Documents