ROBUST SIGNAL REPRESENTATIONS FOR AUTOMATIC SPEECH RECOGNITION Richard Stern Department of Electrical and Computer Engineering and School of Computer Science Carnegie Mellon University Pittsburgh, Pennsylvania 15213 Telephone: (412) 268-2535; FAX: (412) 268-3890 Email: [email protected]; http://www.ece.cmu.edu/~rms Institute for Mathematics and its Applications University of Minnesota September 19, 2000

ROBUST SIGNAL REPRESENTATIONS FOR AUTOMATIC SPEECH RECOGNITION Richard Stern Department of Electrical and Computer Engineering and School of Computer.
Dec 16, 2015
Welcome message from author
This document is posted to help you gain knowledge. Please leave a comment to let me know what you think about it! Share it to your friends and learn new things together.
Transcript

ROBUST SIGNAL REPRESENTATIONSFOR AUTOMATIC SPEECH RECOGNITION
Richard Stern
Department of Electrical and Computer Engineeringand School of Computer Science
Carnegie Mellon UniversityPittsburgh, Pennsylvania 15213
Telephone: (412) 268-2535; FAX: (412) 268-3890Email: [email protected]; http://www.ece.cmu.edu/~rms
Institute for Mathematics and its ApplicationsUniversity of Minnesota
September 19, 2000

CarnegieMellon Slide 2 ECE and SCS Robust Speech Group
Introduction
As speech recognition is transferred from the laboratory to the marketplace robust recognition is becoming increasingly important
“Robustness” in 1985:
– Recognition in a quiet room using desktop microphones
Robustness in 2000:
– Recognition
» over a cell phone
» in a car
» with the windows down
» and the radio playing
» at highway speeds

CarnegieMellon Slide 3 ECE and SCS Robust Speech Group
What I’ll talk about today ...
Why we use cepstral-like representations
Some “classical” approaches to robustness
Some “modern” approaches to robustness
Some alternate representations
Some remaining open issues

CarnegieMellon Slide 4 ECE and SCS Robust Speech Group
The source-filter model of speech
A useful model for representing the generation of speech sounds:
Pitch
Pulse train source
Noise source
Vocal tract model
Amplitude
p[n]
CarnegieMellon Slide 5 ECE and SCS Robust Speech Group
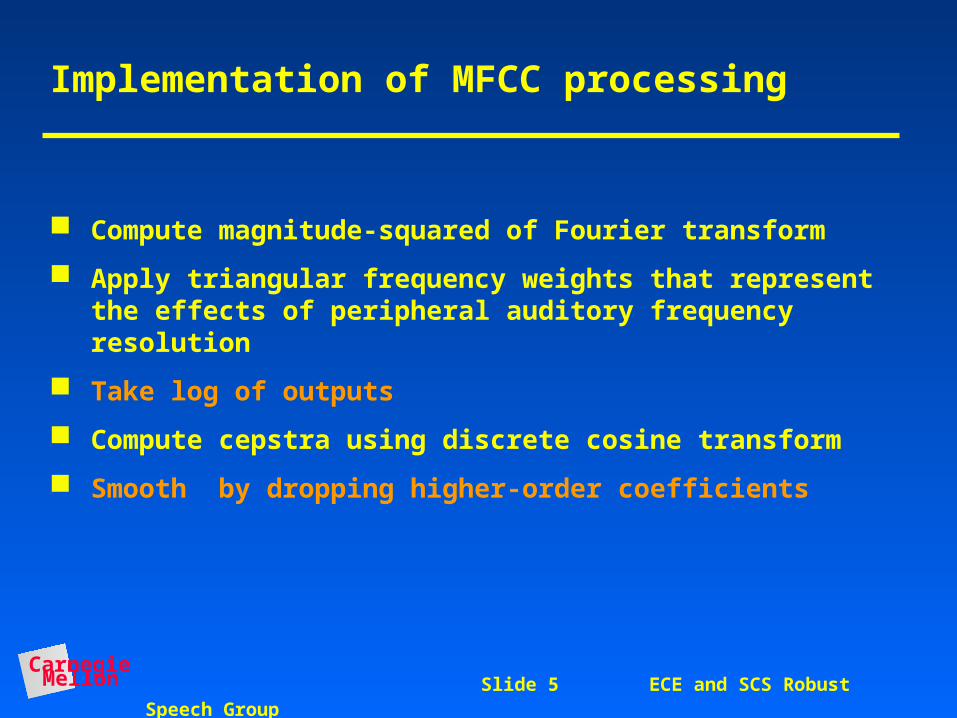
Implementation of MFCC processing
Compute magnitude-squared of Fourier transform
Apply triangular frequency weights that represent the effects of peripheral auditory frequency resolution
Take log of outputs
Compute cepstra using discrete cosine transform
Smooth by dropping higher-order coefficients
CarnegieMellon Slide 6 ECE and SCS Robust Speech Group
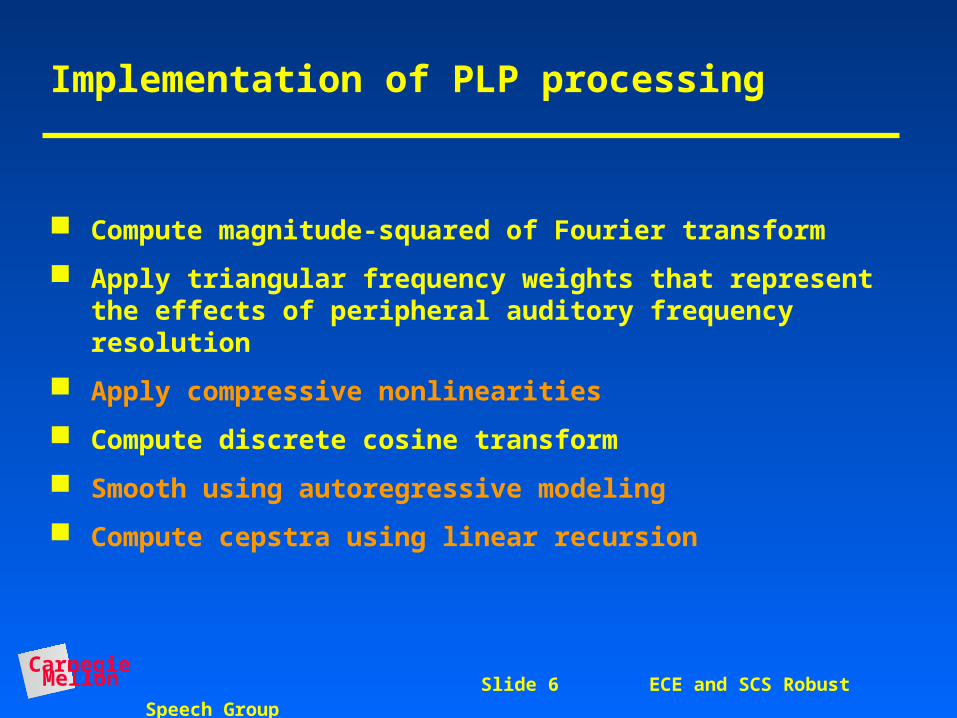
Implementation of PLP processing
Compute magnitude-squared of Fourier transform
Apply triangular frequency weights that represent the effects of peripheral auditory frequency resolution
Apply compressive nonlinearities
Compute discrete cosine transform
Smooth using autoregressive modeling
Compute cepstra using linear recursion

CarnegieMellon Slide 7 ECE and SCS Robust Speech Group
Rationale for cepstral-like parameters
The cepstrum is the inverse transform of the log of the magnitude of the spectrum
Useful for separating convolved signals (like the source and filter in the speech production model)
– “Homomorphic filtering”
Alternatively, cepstral processing be thought of as the Fourier series expansion of the magnitude of the Fourier transform
CarnegieMellon Slide 11 ECE and SCS Robust Speech Group
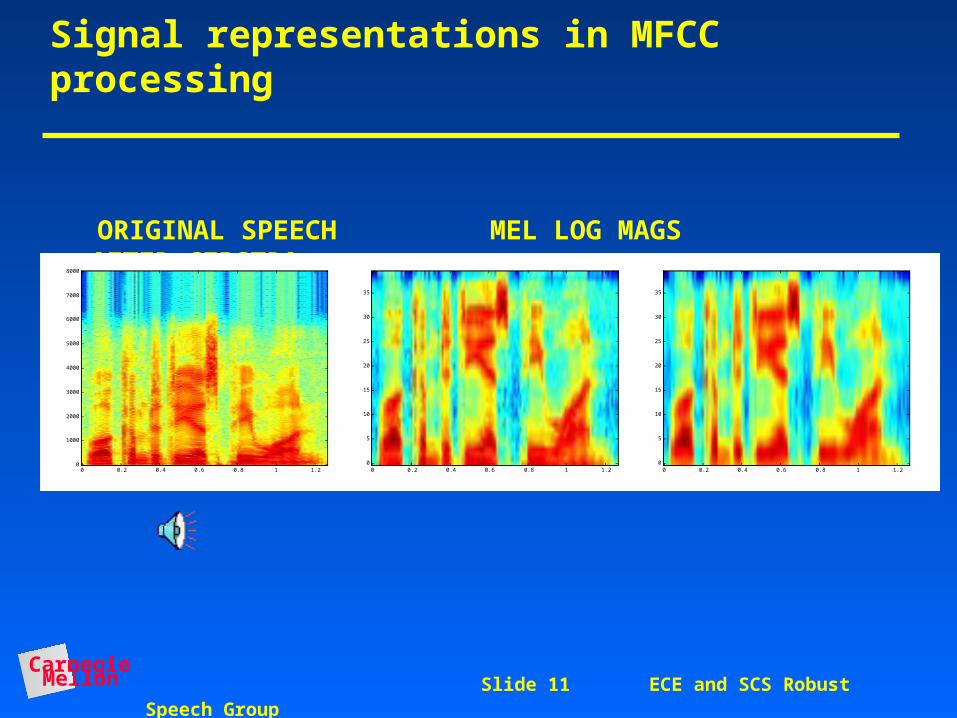
Signal representations in MFCC processing
ORIGINAL SPEECH MEL LOG MAGS AFTER CEPSTRA
0 0.2 0.4 0.6 0.8 1 1.20
1000
2000
3000
4000
5000
6000
7000
8000
0 0.2 0.4 0.6 0.8 1 1.20
5
10
15
20
25
30
35
0 0.2 0.4 0.6 0.8 1 1.20
5
10
15
20
25
30
35

CarnegieMellon Slide 12 ECE and SCS Robust Speech Group
Additional parameters typically used
Delta cepstra and delta-delta cepstra
Power and delta power
Comment: These features restore (some) temporal dependencies … more heroic approaches exist as well (e.g. Alwan, Hermansky)

CarnegieMellon Slide 13 ECE and SCS Robust Speech Group
Challenges in robust recognition
“Classical” problems:
– Additive noise
– Linear filtering
“Modern” problems:
– Transient degradations
– Very low SNR
“Difficult” problems:
– Highly spontaneous speech
– Speech masked by other speech

CarnegieMellon Slide 14 ECE and SCS Robust Speech Group
“Classical” robust recognition: A model of the environment
“Clean” speech
x[m]h[m]
Linear Filtering
n[m]Additive Noise
+ z[m]
Degraded speech

CarnegieMellon Slide 15 ECE and SCS Robust Speech Group
AVERAGED FREQUENCY RESPONSE FOR SPEECH AND NOISE
Close-talking microphone:
Desktop microphone:

CarnegieMellon Slide 16 ECE and SCS Robust Speech Group
Power spectra:
Effect of noise and filtering on cepstral or log spectral features:
or
where is referred to as the “environment function”
Representation of environmental effects in cepstral domain
x[m]h[m]
n[m]
+ z[m]
z=x+q+log(1+en−x−q)
PZ(ω) =PX(ω)H(ω)2 +PN(ω)
z=x+q+r(x,n,q)=x+f(x,n,q)
f(x,n,q)

CarnegieMellon Slide 17 ECE and SCS Robust Speech Group
Another look at environmental distortions: Additive environmental compensation vectors
Environment functions for the PCC-160 cardiod desktop mic:
Comment: Functions depend on SNR and phoneme identity

CarnegieMellon Slide 18 ECE and SCS Robust Speech Group
Highpass filtering of cepstral features
Examples: CMN (CMU et al., RASTA, J-RASTA (OGI/ICSI/IDIAP et al.), multi-level CMN (Microsoft, et al.)
Comments:
– Application to cepstral features compensates for linear filtering; application to spectral features compensates for additive noise
– “Great value for the money”
z x̂
Highpass filter

CarnegieMellon Slide 19 ECE and SCS Robust Speech Group
Two common cepstral highpass filters
CMN (Cepstral Mean Normalization):
RASTA (Relative Spectral Processing, 1994 version):
cˆ x [m]=cz[m]−1N
cz[l]l=1
N∑
cˆ x [m]=.1cz[m]+.1cz[m−1]−.1cz[m−3]−.2cz[m−4]+.98cˆ x [m−1]

CarnegieMellon Slide 20 ECE and SCS Robust Speech Group
“Frequency response” of CMN and RASTA filters
Comment: Both RASTA and CMN have zero DC response

CarnegieMellon Slide 21 ECE and SCS Robust Speech Group
Principles of model-based environmental compensation
Attempt to estimate parameters characterizing unknown filter and noise that when applied in inverse fashion will maximize the likelihood of the observations
x[m]h[m]
n[m]
+ z[m]

CarnegieMellon Slide 22 ECE and SCS Robust Speech Group
Model-based compensation for noise and filtering: The VTS algorithm
The VTS algorithm (Moreno, Raj, Stern, 1996):
– Approximate f(x,n,q) by the first several terms of its Taylor series expansion, assuming that n and q are known
– The effects of f(x,n,q) on the statistics of the speech features then can be obtained analytically
– The EM algorithm is used to find the values of n and q that maximize the likelihood of the observations
– The statistics of the incoming cepstral vectors are re-estimated using MMSE techniques
z=x+q+log(1+en−x−q)=x+f(x,n,q)

CarnegieMellon Slide 23 ECE and SCS Robust Speech Group
JJJJ
J
J
J0
20
40
60
80
100
0 5 10 15 20 25 30SNR (dB)
VTS (1997)
CDCN
CMN (baseline)
CompleteRetraining
The good news: VTS improves recognition accuracy in “stationary” noise
Comment: More accurate modeling of VTS improves recognition accuracy at all SNRs compared to CDCN and CMN
(1990)

CarnegieMellon Slide 24 ECE and SCS Robust Speech Group
But the bad news: Model-based compensation doesn’t work very well in transient noise
CDCN does not improve speech recognition errors in music very much
BBBBBB
J
JJ
J
JJ
0
10
20
30
40
50
0 5 10 15 20 25SNR (dB)
H4 Music
White Noise

CarnegieMellon Slide 25 ECE and SCS Robust Speech Group
So what can we do about transient noises?
Two major approaches:
– Sub-band recognition (e.g. Bourlard, Morgan, Hermansky et al.)
– Missing-feature recognition (e.g. Cooke, Green, Lippmann et al.)
At CMU we’ve been working on a variant of the missing-feature approach
CarnegieMellon Slide 26 ECE and SCS Robust Speech Group
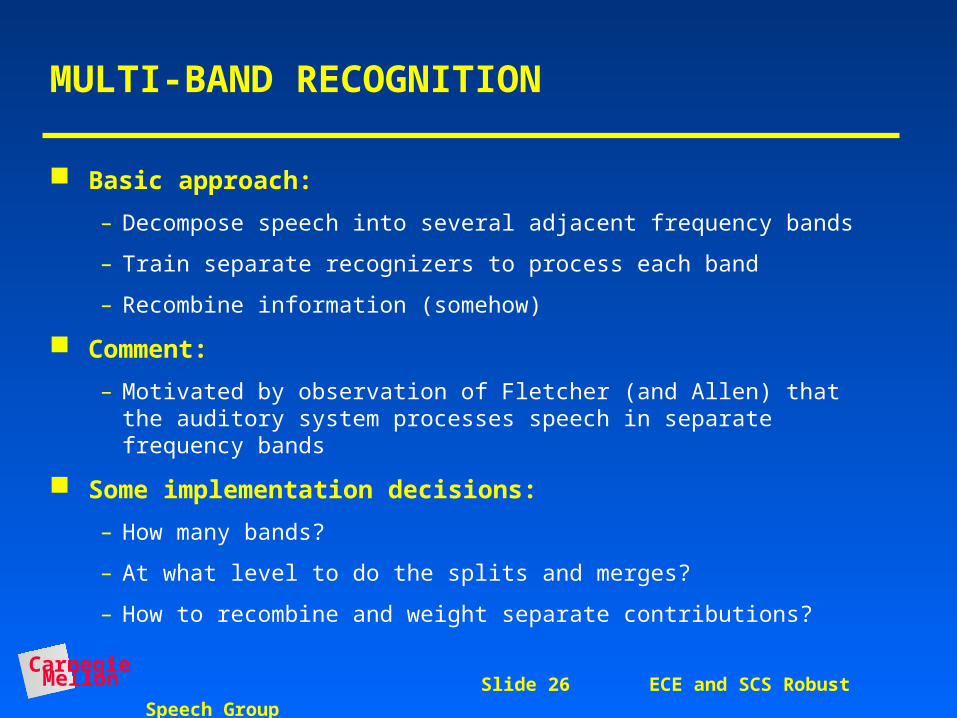
MULTI-BAND RECOGNITION
Basic approach:
– Decompose speech into several adjacent frequency bands
– Train separate recognizers to process each band
– Recombine information (somehow)
Comment:
– Motivated by observation of Fletcher (and Allen) that the auditory system processes speech in separate frequency bands
Some implementation decisions:
– How many bands?
– At what level to do the splits and merges?
– How to recombine and weight separate contributions?
CarnegieMellon Slide 27 ECE and SCS Robust Speech Group
MISSING-FEATURE RECOGNITION
General approach:
– Determine which cells of a spectrogram-like display are unreliable (or “missing”)
– Ignore missing features or make best guess about their values based on data that are present
CarnegieMellon Slide 28 ECE and SCS Robust Speech Group
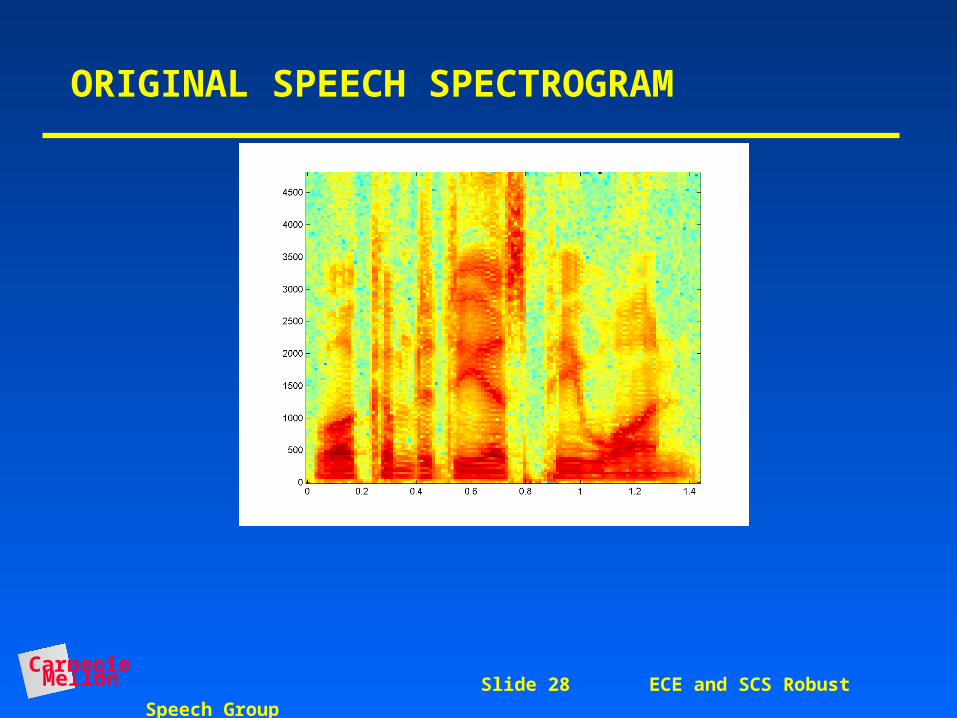
ORIGINAL SPEECH SPECTROGRAM

CarnegieMellon Slide 29 ECE and SCS Robust Speech Group
SPECTROGRAM CORRUPTED BY WHITE NOISE AT SNR 15 dB
Some regions are affected far more than others
CarnegieMellon Slide 30 ECE and SCS Robust Speech Group
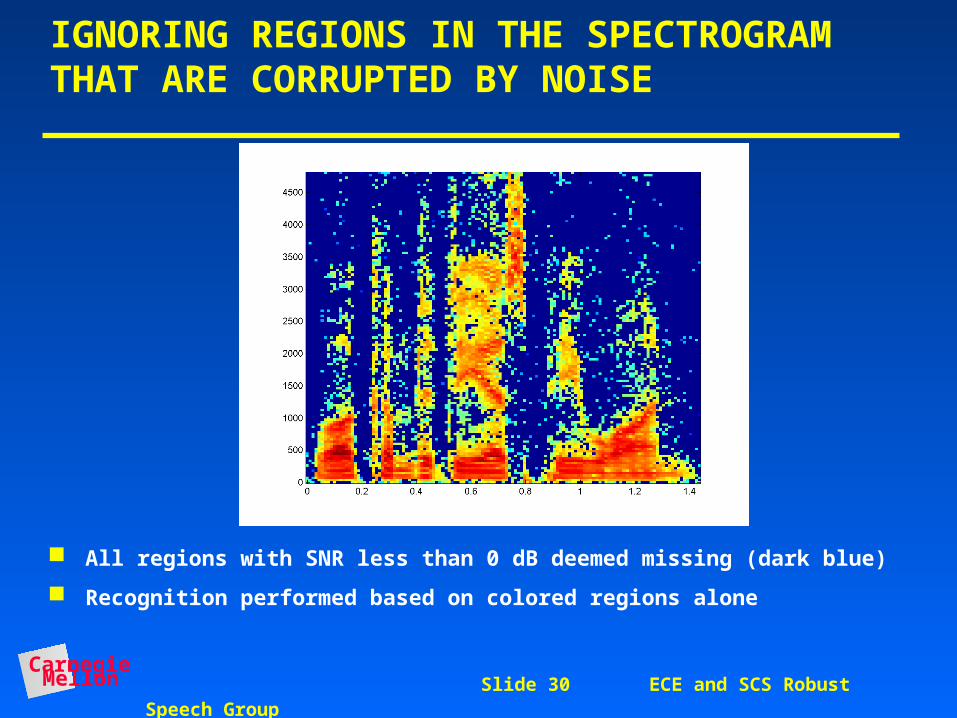
IGNORING REGIONS IN THE SPECTROGRAM THAT ARE CORRUPTED BY NOISE
All regions with SNR less than 0 dB deemed missing (dark blue)
Recognition performed based on colored regions alone

CarnegieMellon Slide 31 ECE and SCS Robust Speech Group
Filling in missing features at CMU (Raj)
We modify the incoming features rather than the internal models (which is what has been done at Sheffield)
Why modify the incoming features?
– More flexible feature set (can use cepstral rather than log spectral features)
– Simpler processing
– No need to modify recognizer
CarnegieMellon Slide 32 ECE and SCS Robust Speech Group
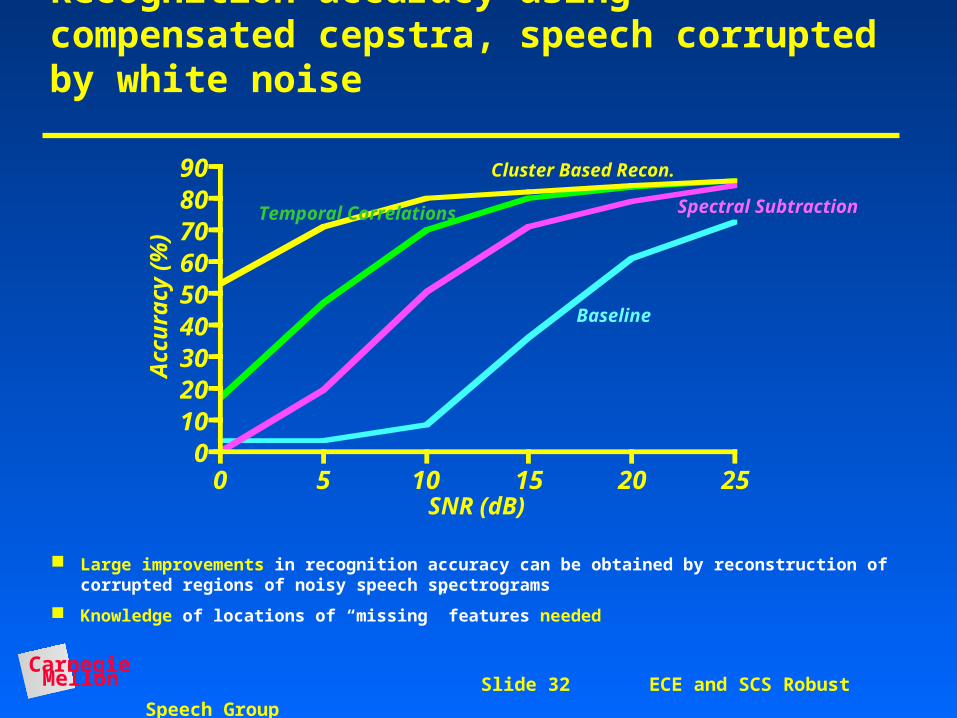
Recognition accuracy using compensated cepstra, speech corrupted by white noise
Large improvements in recognition accuracy can be obtained by reconstruction of corrupted regions of noisy speech spectrograms
Knowledge of locations of “missing” features needed
0 5 10 15 20 250
102030405060708090
SNR (dB)
Acc
ura
cy (
%)Cluster Based Recon.
Temporal Correlations Spectral Subtraction
Baseline
CarnegieMellon Slide 33 ECE and SCS Robust Speech Group
0 5 10 15 20 250
102030405060708090
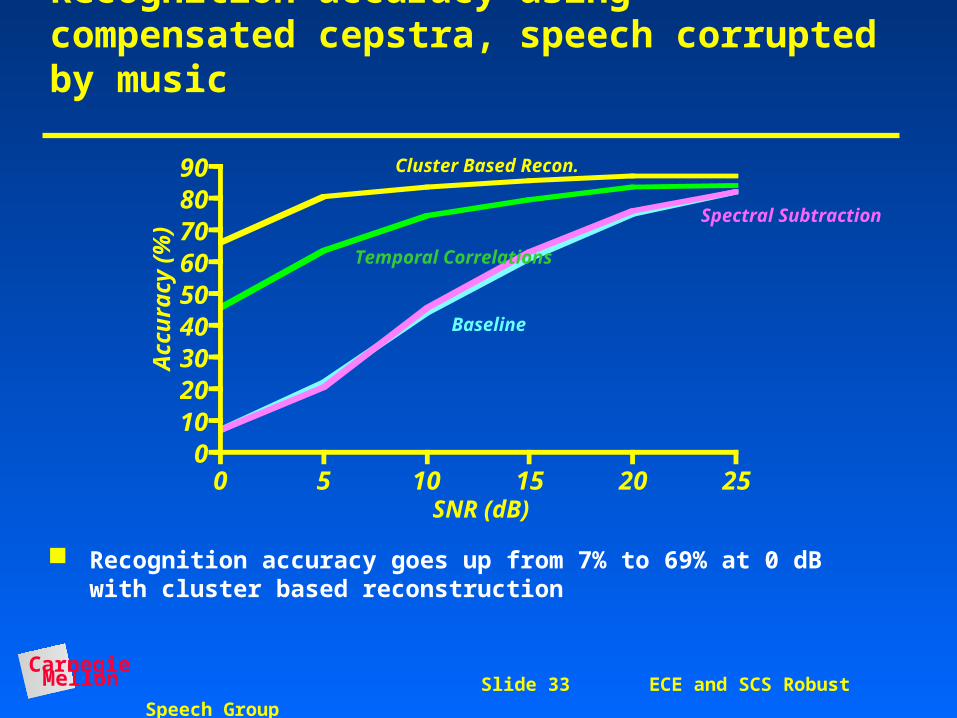
Recognition accuracy using compensated cepstra, speech corrupted by music
Recognition accuracy goes up from 7% to 69% at 0 dB with cluster based reconstruction
SNR (dB)
Acc
ura
cy (
%)
Cluster Based Recon.
Temporal Correlations
Spectral Subtraction
Baseline

CarnegieMellon Slide 34 ECE and SCS Robust Speech Group
So how can we detect “missing” regions?
Current approach:
– Pitch detection to comb out harmonics in voiced segments
– Multivariate Bayesian classifiers using several features such as
» Ratio of power at harmonics relative to neighboring frequencies
» Extent of temporal synchrony to fundamental frequency
How well we’re doing now with blind identification:
– About half way between baseline results and results using perfect knowledge of which data are missing
– About 25% of possible improvement for background music
CarnegieMellon Slide 35 ECE and SCS Robust Speech Group
Missing features versus multi-band recognition
Multi-band approaches are typically implemented with a relatively small number of channels while ….
…. with missing feature approaches, every time-frequency point can be considered or ignored
The full-combination method for multi-band recognition considers every possible combination of present or missing bands, eliminating the need for blind identification of optimal combination of inputs
Nevertheless, missing-feature approaches may provide superior recognition accuracy because they enable a finer partitioning of the observation space if we could solve the identification problem
CarnegieMellon Slide 36 ECE and SCS Robust Speech Group
Some other types of representations
Physiologically-motivated representations (“ear models”)
– Seneff, Ghitza, Lyon/Slaney, Patterson, etc.
Feature extraction using “smart” nonlinear transformations
– Hermansky et al.

CarnegieMellon Slide 37 ECE and SCS Robust Speech Group
Physiologically-motivated speech processing
In recent years signal processing motivated by knoweldge of human auditory perception has become more popular
– Abilities of human audition form a powerful existence proof
CarnegieMellon Slide 38 ECE and SCS Robust Speech Group
Some auditory principles that system developers consider
Structure of auditory periphery:
– Linear bandpass filtering
– Nonlinear rectification with saturation/gain control
– Further analysis
Dependence of bandwidth of peripheral filters on center frequency
Nonlinear phenomena:
– Saturation
– Lateral suppression
Temporal response:
– Synchrony and phase locking at low frequencies

CarnegieMellon Slide 39 ECE and SCS Robust Speech Group
An example: The Seneff model

CarnegieMellon Slide 40 ECE and SCS Robust Speech Group
Timing information in the Seneff model
Seneff model includes the effects of synchrony at low frequencies
Synchrony detector in Seneff model records extent to which response in a frequency band is phase-locked with the channel’s center frequency
Local synchrony has been shown to represent vowels more robustly in the peripheral auditory system in the presence of additive noise (e.g. Young and Sachs)
Related work by Ghitza, DeMori, and others shows improvements in recognition accuracy relative to features based on mean rate, but at the expense of much more computation

CarnegieMellon Slide 41 ECE and SCS Robust Speech Group
COMPUTATIONAL COMPLEXITY OF AUDITORY MODELS
Number of multiplications per ms of speech:
Comment: auditory computation is extremely expensive
CarnegieMellon Slide 42 ECE and SCS Robust Speech Group
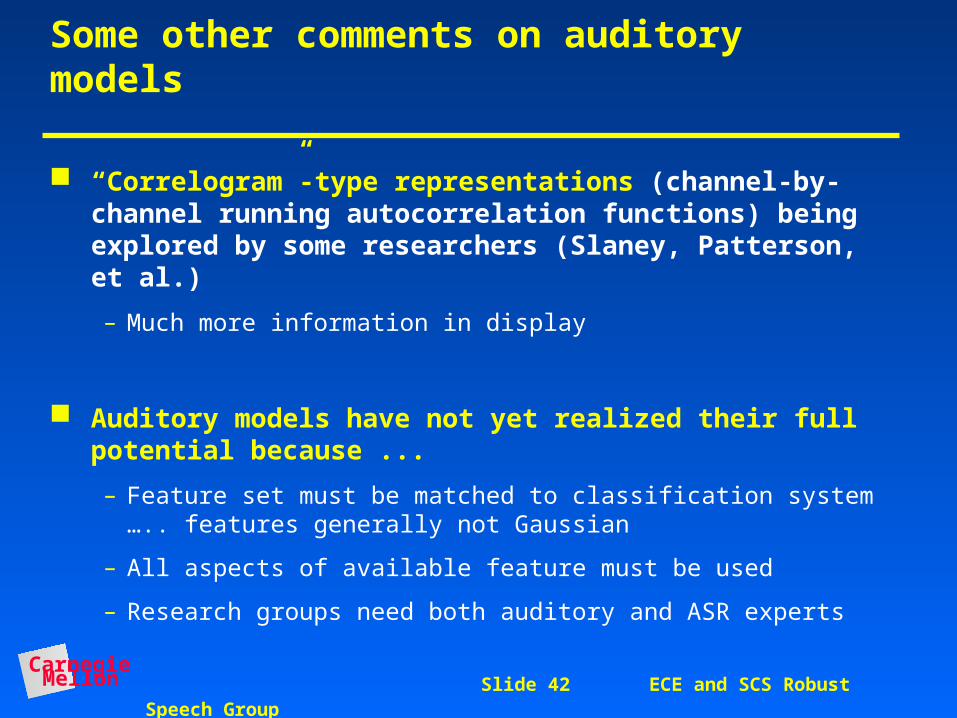
Some other comments on auditory models
“Correlogram”-type representations (channel-by-channel running autocorrelation functions) being explored by some researchers (Slaney, Patterson, et al.)
– Much more information in display
Auditory models have not yet realized their full potential because ...
– Feature set must be matched to classification system ….. features generally not Gaussian
– All aspects of available feature must be used
– Research groups need both auditory and ASR experts
CarnegieMellon Slide 43 ECE and SCS Robust Speech Group
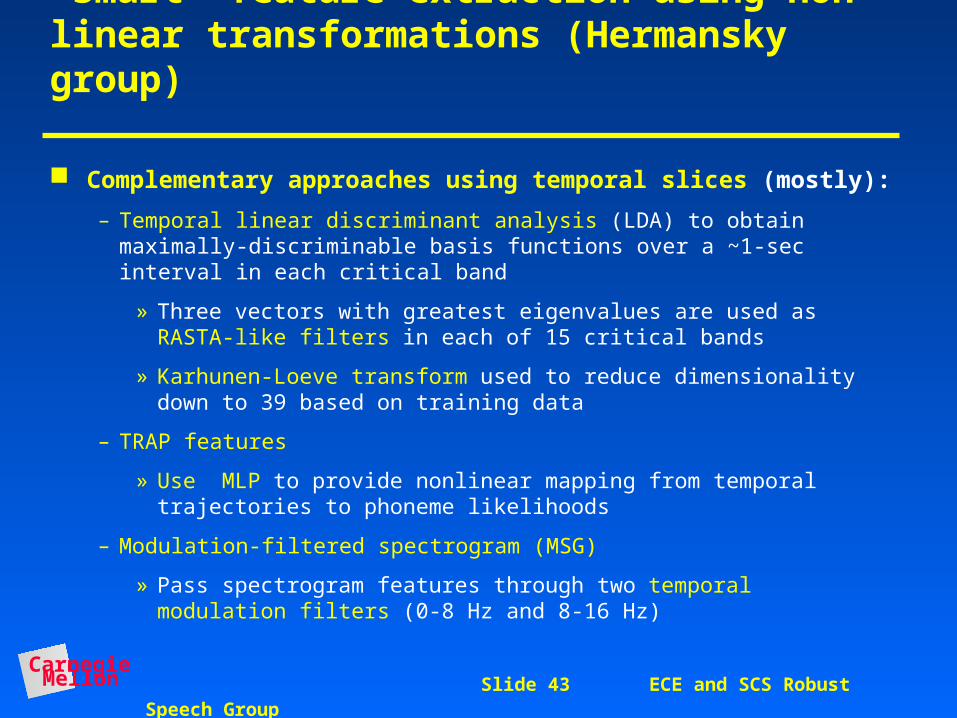
“Smart” feature extraction using non-linear transformations (Hermansky group)
Complementary approaches using temporal slices (mostly):
– Temporal linear discriminant analysis (LDA) to obtain maximally-discriminable basis functions over a ~1-sec interval in each critical band
» Three vectors with greatest eigenvalues are used as RASTA-like filters in each of 15 critical bands
» Karhunen-Loeve transform used to reduce dimensionality down to 39 based on training data
– TRAP features
» Use MLP to provide nonlinear mapping from temporal trajectories to phoneme likelihoods
– Modulation-filtered spectrogram (MSG)
» Pass spectrogram features through two temporal modulation filters (0-8 Hz and 8-16 Hz)
CarnegieMellon Slide 44 ECE and SCS Robust Speech Group
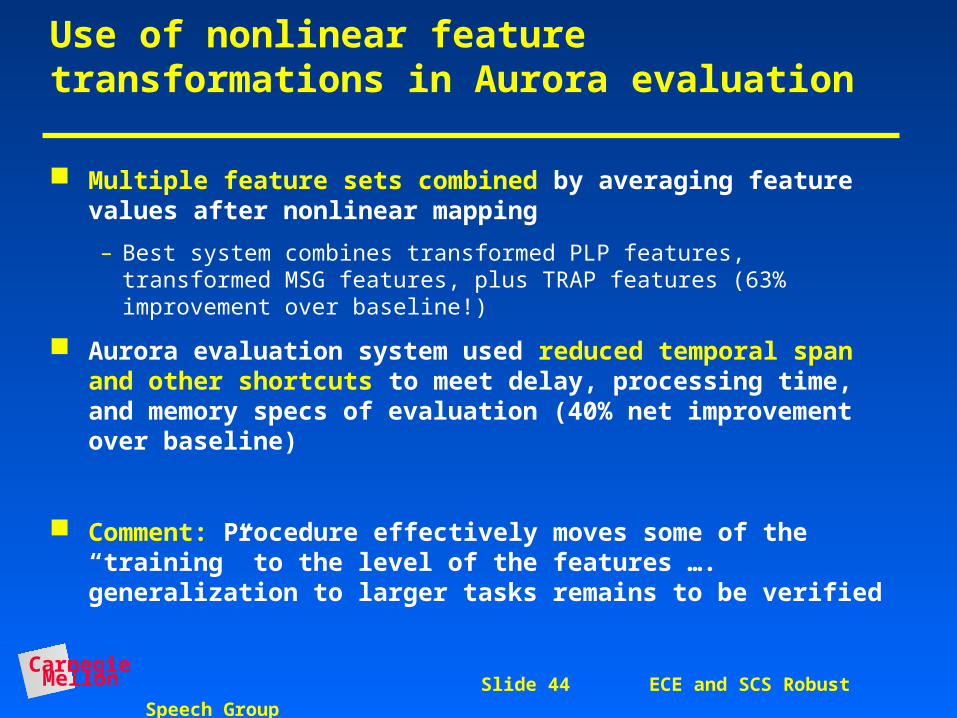
Use of nonlinear feature transformations in Aurora evaluation
Multiple feature sets combined by averaging feature values after nonlinear mapping
– Best system combines transformed PLP features, transformed MSG features, plus TRAP features (63% improvement over baseline!)
Aurora evaluation system used reduced temporal span and other shortcuts to meet delay, processing time, and memory specs of evaluation (40% net improvement over baseline)
Comment: Procedure effectively moves some of the “training” to the level of the features …. generalization to larger tasks remains to be verified

CarnegieMellon Slide 45 ECE and SCS Robust Speech Group
Sound BoothSound Booth
Arcon Communicability Exercise (ACE)
VoiceCoder
VoiceCoder
Channel
TapeRecording
Feature combination versus compensation combination: The CMU SPINE System

CarnegieMellon Slide 46 ECE and SCS Robust Speech Group
Communicator A Communicator B
Environ A Handset A Environ B Handset B Channel
DoD Quiet STU- III Office STU- IIIPOTS with STU- III
modem errormodel
Navy Aircraft CarrierCIC
TA840 Office STU- III HF
Army HMMWV H250 Quiet STU- III Satellite Delay(half duplex)
Air Force E3A AWACS R215 MCE EV M87 JTIDS
SPINE evaluation conditions
CarnegieMellon Slide 47 ECE and SCS Robust Speech Group
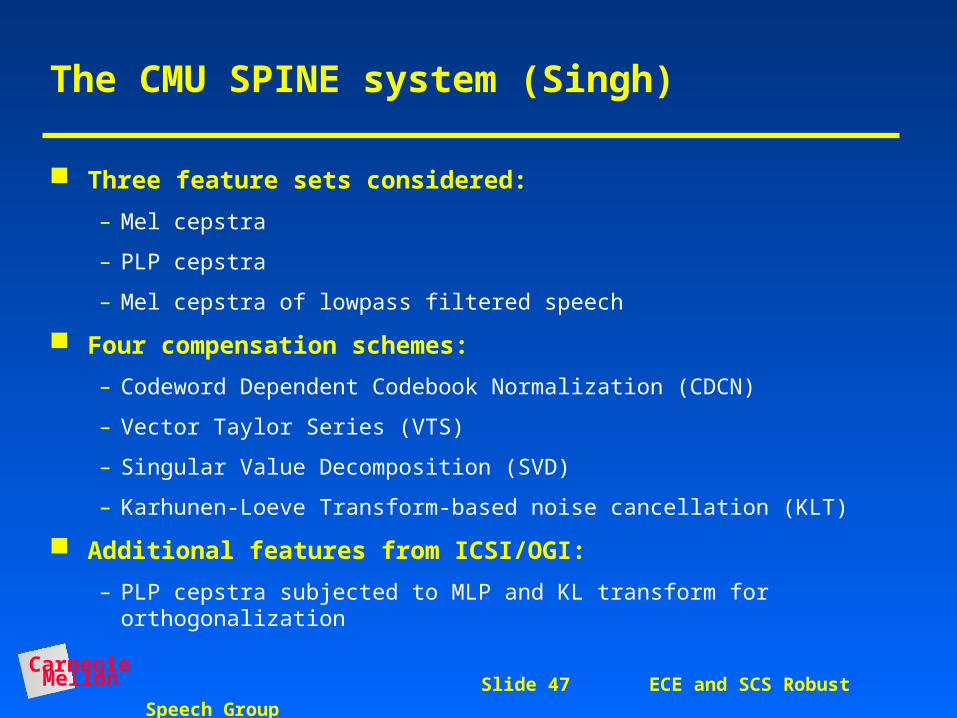
The CMU SPINE system (Singh)
Three feature sets considered:
– Mel cepstra
– PLP cepstra
– Mel cepstra of lowpass filtered speech
Four compensation schemes:
– Codeword Dependent Codebook Normalization (CDCN)
– Vector Taylor Series (VTS)
– Singular Value Decomposition (SVD)
– Karhunen-Loeve Transform-based noise cancellation (KLT)
Additional features from ICSI/OGI:
– PLP cepstra subjected to MLP and KL transform for orthogonalization

CarnegieMellon Slide 48 ECE and SCS Robust Speech Group
Summary of CMU and CMU-ICSI-OGI SPINE results
(MFCC)ICSI/OGI
4 Comp.3 Feat.
4 Feat.

CarnegieMellon Slide 49 ECE and SCS Robust Speech Group
Comments
Some techniques we haven’t discussed:
– VTLN
– Microphone arrays
– Time-frequency representations (e.g. wavelets)
– Robustness to Lombard speech, speaking style, etc.
– Many others
Some hard problems not addressed:
– Very low SNR ASR
– Highly spontaneous speech (!)
» A representation or pronunciation modeling issue?
CarnegieMellon Slide 50 ECE and SCS Robust Speech Group
Summary
Despite many shortcomings, cepstral-based features are well motivated, typically augmented by cepstral highpass filtering
“Classical” model-based robustness techniques work reasonably well in combating quasi-stationary degradations
“Modern” multiband and missing-feature techniques show great promise in coping with transient interference , etc.
Auditory models remain appealing, although their potential has not yet been realized
“Smart” features can provide dramatic improvements, at least in small tasks
Feature combination will be key component of future systems

Related Documents