RESEARCH Open Access Robust pathway-based multi-omics data integration using directed random walks for survival prediction in multiple cancer studies So Yeon Kim 1 , Hyun-Hwan Jeong 2,3 , Jaesik Kim 1 , Jeong-Hyeon Moon 1 and Kyung-Ah Sohn 1* Abstract Background: Integrating the rich information from multi-omics data has been a popular approach to survival prediction and bio-marker identification for several cancer studies. To facilitate the integrative analysis of multiple genomic profiles, several studies have suggested utilizing pathway information rather than using individual genomic profiles. Methods: We have recently proposed an integrative directed random walk-based method utilizing pathway information (iDRW) for more robust and effective genomic feature extraction. In this study, we applied iDRW to multiple genomic profiles for two different cancers, and designed a directed gene-gene graph which reflects the interaction between gene expression and copy number data. In the experiments, the performances of the iDRW method and four state-of-the-art pathway-based methods were compared using a survival prediction model which classifies samples into two survival groups. Results: The results show that the integrative analysis guided by pathway information not only improves prediction performance, but also provides better biological insights into the top pathways and genes prioritized by the model in both the neuroblastoma and the breast cancer datasets. The pathways and genes selected by the iDRW method were shown to be related to the corresponding cancers. Conclusions: In this study, we demonstrated the effectiveness of a directed random walk-based multi-omics data integration method applied to gene expression and copy number data for both breast cancer and neuroblastoma datasets. We revamped a directed gene-gene graph considering the impact of copy number variation on gene expression and redefined the weight initialization and gene-scoring method. The benchmark result for iDRW with four pathway-based methods demonstrated that the iDRW method improved survival prediction performance and jointly identified cancer-related pathways and genes for two different cancer datasets. Reviewers: This article was reviewed by Helena Molina-Abril and Marta Hidalgo. Keywords: Multi-omics, Integrative analysis, Random walk, Pathway-based analysis, Breast cancer, Neuroblastoma © The Author(s). 2019 Open Access This article is distributed under the terms of the Creative Commons Attribution 4.0 International License (http://creativecommons.org/licenses/by/4.0/), which permits unrestricted use, distribution, and reproduction in any medium, provided you give appropriate credit to the original author(s) and the source, provide a link to the Creative Commons license, and indicate if changes were made. The Creative Commons Public Domain Dedication waiver (http://creativecommons.org/publicdomain/zero/1.0/) applies to the data made available in this article, unless otherwise stated. * Correspondence: [email protected] 1 Department of Computer Engineering, Ajou University, Suwon 16499, South Korea Full list of author information is available at the end of the article Kim et al. Biology Direct (2019) 14:8 https://doi.org/10.1186/s13062-019-0239-8

Welcome message from author
This document is posted to help you gain knowledge. Please leave a comment to let me know what you think about it! Share it to your friends and learn new things together.
Transcript

RESEARCH Open Access
Robust pathway-based multi-omics dataintegration using directed random walksfor survival prediction in multiple cancerstudiesSo Yeon Kim1, Hyun-Hwan Jeong2,3, Jaesik Kim1, Jeong-Hyeon Moon1 and Kyung-Ah Sohn1*
Abstract
Background: Integrating the rich information from multi-omics data has been a popular approach to survivalprediction and bio-marker identification for several cancer studies. To facilitate the integrative analysis of multiplegenomic profiles, several studies have suggested utilizing pathway information rather than using individualgenomic profiles.
Methods: We have recently proposed an integrative directed random walk-based method utilizing pathwayinformation (iDRW) for more robust and effective genomic feature extraction. In this study, we applied iDRWto multiple genomic profiles for two different cancers, and designed a directed gene-gene graph whichreflects the interaction between gene expression and copy number data. In the experiments, the performances of theiDRW method and four state-of-the-art pathway-based methods were compared using a survival prediction modelwhich classifies samples into two survival groups.
Results: The results show that the integrative analysis guided by pathway information not only improves predictionperformance, but also provides better biological insights into the top pathways and genes prioritized by the model inboth the neuroblastoma and the breast cancer datasets. The pathways and genes selected by the iDRW method wereshown to be related to the corresponding cancers.
Conclusions: In this study, we demonstrated the effectiveness of a directed random walk-based multi-omics dataintegration method applied to gene expression and copy number data for both breast cancer and neuroblastomadatasets. We revamped a directed gene-gene graph considering the impact of copy number variation on geneexpression and redefined the weight initialization and gene-scoring method. The benchmark result for iDRW with fourpathway-based methods demonstrated that the iDRW method improved survival prediction performance and jointlyidentified cancer-related pathways and genes for two different cancer datasets.
Reviewers: This article was reviewed by Helena Molina-Abril and Marta Hidalgo.
Keywords: Multi-omics, Integrative analysis, Random walk, Pathway-based analysis, Breast cancer, Neuroblastoma
© The Author(s). 2019 Open Access This article is distributed under the terms of the Creative Commons Attribution 4.0International License (http://creativecommons.org/licenses/by/4.0/), which permits unrestricted use, distribution, andreproduction in any medium, provided you give appropriate credit to the original author(s) and the source, provide a link tothe Creative Commons license, and indicate if changes were made. The Creative Commons Public Domain Dedication waiver(http://creativecommons.org/publicdomain/zero/1.0/) applies to the data made available in this article, unless otherwise stated.
* Correspondence: [email protected] of Computer Engineering, Ajou University, Suwon 16499, SouthKoreaFull list of author information is available at the end of the article
Kim et al. Biology Direct (2019) 14:8 https://doi.org/10.1186/s13062-019-0239-8

BackgroundFor a better understanding of the biological basis of cancerand precise prediction of survival for cancer patients, inte-grative analysis of multi-omics data has been addressed inmany studies [1–3]. Most integrative approaches used incancer studies have focused on integrating multiple typesof genomic data rather than using single omics profile.The use of multi-omics data has been valuable in its appli-cation to many different cancer types and it is necessaryto reveal the underlying complex nature of biologicalmechanisms by analyzing human genomes at multiplegenomic levels. To effectively combine different levels ofomics data, several studies have led to the development ofnovel multi-omics data integration algorithms in order topredict phenotypic outcomes precisely and to discoverbiologically meaningful information [4–11]. Among re-cently proposed data integration methods, we focused pri-marily on network-based methods which can incorporateinteractions between genes. Most network-based methodshave focused on incorporating pathway or subtype infor-mation rather than using individual genomic features indifferent types of cancer datasets [9–18]. In this respect,pathway-based methods have been proposed for the iden-tification of important genes within pathways.To incorporate pathway information, Guo et al. [16]
computed two summary measures to capture the path-way activity: the arithmetic mean and the median ofthe gene expression values of pathway member genes.They achieved better cancer classification performanceand improved biological interpretability. Lee et al. [12]proposed a disease classification method based on path-way activities inferred for each patient. For each path-way, these authors summarized activity levels withcondition-responsive genes (the pathway member geneswhose combined expression show optimal discriminativepower for the disease phenotype) by combining normal-ized z-transformed scores of genes (z-score method). Apathway level analysis of gene expression (PLAGE)measures the pathway activity profiles of a set of genesin each pathway, which are derived from a vector ofthe singular value decomposition of the given gene set[14]. PLAGE identified several biologically meaningfulpathways using gene expression data from a study oftype 2 diabetes and the effects of smoking on airwayepithelia. Other pathway activity inference approacheshave been proposed based on probabilistic inference forbetter cancer classification [13, 15, 17, 18]. PLAGE andthe z-score method incorporate pathway informationand transformed single genomic profiles into pathwayprofiles. However, they simply consider a pathway as aset of genes, and interactions between genes are notconsidered. Some pathway-based methods utilizing genesignatures or topological information utilizing gene in-teractions on a gene-gene graph have been studied.
A denoising algorithm based on relevance networktopology (DART) integrates existing pathways with geneexpression data by deriving perturbation signatureswhich reflect gene contributions in each pathway to ob-tain reliable molecular pathway activity predictions [10].This work also showed that the encoded hub genes inexpression correlation networks represent reliablemarkers of pathway activity in clinical tumor specimens.To consider the topological importance of the genes inthe pathways that can be highly associated with diseases,Liu et al. [9, 11] proposed a directed random walk(DRW)-based pathway inference method to identifytopologically important genes and pathways by weight-ing the genes in a gene-gene network. Although theDRW method only used gene expression data, this ap-proach has also been applied to the integration of geneexpression and metabolite data on a gene-metabolitegraph, guided by pathway information [9]. However,those existing pathway-based methods, including DARTand DRW, have limitations in that they only target a sin-gle genomic profile, generally obtained from geneexpression data. In order to reflect the combined effectof different types of genomic profiles, we have previouslyproposed an integrative pathway-based method as an ex-tension of the DRW method for multi-omics data(iDRW) [6]. In our previous research, we constructed anintegrated gene-gene graph using gene expression andmethylation profiles, and showed that the proposedmethod improved the survival prediction performancefor breast cancer patients. We also showed that jointanalysis of the methylation features and gene expressionprofiles can identify breast cancer-specific pathways.One limitation of the iDRW method lies in the lack of
analysis of other types of genomic profiles for differentcancer studies. In the iDRW method, the gene expres-sion and methylation data of breast cancer patients werestudied. As copy number variants (CNVs) have shown asignificant impact on gene expression [19], an under-standing of the influence of CNVs on gene expressionand clinical phenotypes in humans can contribute to abetter understanding of disease. In this study, we investi-gated the impact of CNVs on gene expression for twodifferent cancer types: breast cancer and neuroblastoma,utilizing the iDRW method.The main contributions of this study are as follows.
First, we revamped a directed gene-gene interactiongraph which reflects the interaction between gene ex-pression and copy number alteration. Considering differ-ent data distributions of gene expression and copynumber data, we defined the weight initialization andscoring of genes for each genomic profile. We then per-formed benchmarking of iDRW with four state-of-th-e-art pathway-based approaches (PLAGE, z-score,DART and DRW) by integrating gene expression and
Kim et al. Biology Direct (2019) 14:8 Page 2 of 13

copy number alteration data and using a single genomicprofile as a baseline for two different cancers. We showthat the proposed method contributes to an improvedsurvival prediction performance for both breast cancerand neuroblastoma datasets, despite heterogeneity in thedata., We also jointly analyze multiple genomic profilesfor two different cancer types in the integratedgene-gene graph by visualizing the gene-gene interactionnetwork and identifying biologically meaningful path-ways and genes. The overall process of the proposedframework is illustrated in Fig. 1.
MethodsDatasetmRNA expression data and copy number alterationsdata of breast cancer patients were obtained from theMETABRIC dataset [20]. mRNA expression data wereobtained as Illumina Human v3 microarrays withlog-intensity levels. DNA copy number alterations wereobtained and calls are made after normal contaminationcorrection and copy number variation removal usingthresholds. These values were: − 2 = homozygous dele-tion; − 1 = hemizygous deletion; 0 = neutral / no change;1 = gain; and 2 = high level amplification. 24,368 and22,544 genes of the gene expression data and the puta-tive copy number alterations from the overlapping 1904samples were used. 313 missing values of gene expres-sion profiles and copy numbers data were imputed asthe median of the corresponding patients’ data. The pa-tients were categorized as having good (> 10 years) orpoor (≤ 10 years) group with respect to their survivaldays. The cutoff of 10 years was arrived as being the me-dian survival days of 1904 samples. We excluded 256samples in which the survival was less than 10 years andreported as living. In total, 908 samples of the good and740 samples of the poor group were used out of 1648samples. We normalized the expression values of themRNA gene expression data so that the mean was 0 andstandard deviation was 1.In the Neuroblastoma dataset, gene expression profile
and copy number data were obtained from GSE49711[21–23] from the GEO database [24]. Gene expressionprofiles of RNA sequencing for 60,586 genes and copynumber data for 22,692 genes were obtained from theoverlapping 144 samples. Raw microarray data fromMicroarray-based Comparative Genomic Hybridization(aCGH) were preprocessed using the rCGH R/Biocon-ductor package [25] with default parameter settings,using the circular binary segmentation algorithm (CBS)[26] and then converting into DNA copy number tableover genes. The missing values for each profile were im-puted using the median value of the corresponding pa-tients’ data, and we excluded 331 genes which had morethan half of the missing values. Finally, we divided 144
patients: 38 samples into the good group and 105 sam-ples into the poor group, according to the predefinedbinary class label for overall survival days as provided byGSE62564 [27].
Pathway-based integrated gene-gene graph constructionTo integrate pathway information on multiple genomicprofiles, we utilized an integrative directed randomwalk-based pathway activity inference method (iDRW)for two different types of omics data. To apply theiDRW method, we redesigned a directed gene-genegraph for gene expression and copy number data. Wefirst collected the whole set of human pathways and thecorresponding gene sets from the KEGG database [28].Interactions between genes were defined in thegene-gene graph guided by the pathway informationusing the R KEGGgraph package [29]. Finally, an inte-grated directed gene-gene graph was constructed, con-sisting of 7390 nodes and 58,426 edges from 327 humanpathways. Details about the construction method of theglobal directed graph are provided in [11]. To integrategene expression and copy number alterations data onthe graph, we included all edges within each gene ex-pression profile. To consider the impact of copy numberalteration on gene expression [30], we only assigned dir-ectional edges to the overlapping genes from copy num-ber to gene expression data, and all edges between genesof copy number data were excluded. As two or morecopies can be occurred in genes, directed edges can beassigned between genes in copy number alteration dataand multiple genes in gene expression data in the inte-grated graph.
Integrative directed random walk-based method (iDRW)We applied the iDRW method to the pathway-basedgene-gene interaction graph constructed from geneexpression and copy number data. In the algorithm arandom walk is performed on the integratedgene-gene graph for each cancer dataset. For eachprofile, the initial weight vector of the genes W0 wasassigned as:
W 0 ¼ − log wg þ ϵ� �
Wtþ1 ¼ 1−rð ÞMTWt þ rW 0
where wg is the weight of the gene g in the integratedgene-gene graph, and ϵ = 2.2e−16. As the iDRW methodis specifically designed for gene expression profiles andmethylation features, the weight initialization schemewas modified to reflect the distribution of each profile.For the breast cancer dataset, the weight of the gene isthe p-value from either a two-tailed t-test for the mRNAexpression profile or a χ2-test of independence for copynumber genes. The χ2-test of independence was used as
Kim et al. Biology Direct (2019) 14:8 Page 3 of 13

the copy numbers are discrete values. A χ2-test of inde-pendence is a nonparametric statistical test used to de-termine if the two or more classifications of the samplesare independent or not, and can be applied only todiscrete data [31]. In the neuroblastoma data, thep-value of RNA-Seq genes were measured by DESeq2,which is a state-of-the-art technique for the differentialanalysis of gene expression based on a negative binomialdistribution for RNA-Seq data [32]. The weight vectorfor each gene is normalized to be between 0 and 1, andW0 is L1-normalized to a unit vector.A random walker starts on a source node s and tran-
sits to a randomly selected neighbor or returns to thesource node s with a restart probability r at each timestep t. The weight vector Wt is iteratively updated attime step t and is guaranteed to converge to a steadystate W∞ when ∣Wt + 1 −Wt ∣ < 10−10, as shown in theDRW method [11]. M is a row-normalized adjacencymatrix of the integrated gene-gene graph. We set the re-start probability r to 0.7, which is default value of theDRW method, as it was previously shown that the per-formance of the DRW method is not sensitive to varia-tions in r [11].For a j-th pathway Pj containing nj differential genes ð
g1; g2;…; gn jÞ whose p-value (wg) is < 0.05, the pathway
activity is defined as:
a P j� � ¼
Xn j
i¼1
W∞ gi� � � score gi
� � � z gi� �
ffiffiffiffiffiffiffiffiffiffiffiffiffiffiffiffiffiffiffiffiffiffiffiffiffiffiffiffiffiffiXn j
i¼1
W∞ gi� �� �2s
where W∞(gi) is the weight of gene gi from the DRWmethod, z(gi) is the normalized expression vector of giacross overall samples, and score(gi) is either a log2 foldchange from the DESeq2 analysis for a RNA-Seq gene,or a sign(tscore(gi)) where tscore(gi) is a t-value fromtwo-tailed t-test statistics for a mRNA expression gene.The sign of a t-value indicates the direction of thesignificant difference in sample group means. For copynumber data, we scored each gene by mean(CNA(gi)-poor) −mean(CNA(gi)good) where CNA(gi)poor and CNA(-gi)good are the copy numbers of genes in the samples forthe poor or good groups, reflecting the mean differencebetween the two groups. The score(gi) represents howmuch the values of gene gi have changed betweengroups of samples. More details of the DRW methodand the pathway activity inference method are providedin [9]. For each pathway, the pathway activity is com-puted from the gene expression and copy number valuesfor each sample, which corresponds to a pathway profile.
Pathway feature selection and survival predictionTo select important pathway features, 327 human path-ways were ranked by their p-values from the t-test ofpathway activities across samples. The top-k pathwayfeatures across samples were used as an input to a classi-fication model. For each model, the hyper-parameter kwas empirically set to the optimal one which shows thebest classification performance with varying k between 5and 50 in increments of five.For the final survival prediction, a logistic regression
model was applied. The regression model classifies thesamples into either the good or the poor groups. Theclassification performances are measured using accuracy,precision, recall, and F-1 scores. Accuracy is a ratio ofcorrectly predicted observation to the total observations.Precision is the ratio of correctly predicted positive ob-servations to the total predicted positive observations.Recall (Sensitivity) is the ratio of correctly predictedpositive observations to the all observations in actualclass. F-1 Score is the weighted average of precision andrecall. While accuracy intuitively measures how correctlythe model classifies the samples into two survivalgroups, precision or recall takes the costs of false posi-tives and false negatives into account. When class distri-bution is uneven, the performance of classificationmodel should be measured with precision and recall. Inour experiments, we used accuracy as a performancemeasure, and we also validated with precision, recall andF1-score for further experiments.
Performance evaluationIn breast cancer data, we evaluated the classification per-formance with 5-fold cross-validation. We divided thewhole samples into five folds. The classification modelwas trained using four folds and validated using theremaining fold. The entire process was repeated 50times and then we assessed the accuracy, precision, re-call and F-1 score after the entire 250 iterations, usingthe selected top-k pathway features as a final classifica-tion performance. As the number of samples in neuro-blastoma data is imbalanced and not enough to perform5-fold cross-validation, we evaluated the classificationperformance using a leave-one-out cross-validation,which leaves one sample as a validation set and trains aclassification model with remaining samples for eachiteration.To investigate the utility of the iDRW method using
breast cancer and neuroblastoma datasets, we comparediDRW with four state-of-the-art pathway-basedmethods: PLAGE, z-score, DART, and DRW. PLAGEand the z-score method were implemented using the RGSVA package with default settings [33]. In the experi-ments, the pathway activity scores across samples wereobtained from the gene expression data using the four
Kim et al. Biology Direct (2019) 14:8 Page 4 of 13

pathway-based methods. In order to ensure a fair com-parison, the top-k pathway features selection and theclassification performance evaluation of the fourpathway-based methods and the iDRW method wereconducted as stated above. As a baseline, we evaluatedthe classification performance with single gene expres-sion profile. The top-k genes which are ranked by wg
which are their p-values from a statistical test were usedto train the classification model.To demonstrate the robustness of the proposed model,
the models are tested with different hyper-parametervalue settings for k. We also assessed classification per-formances for varying training data size. In this experi-ment, the parameter k is set to the optimal one for eachmethod.
ResultsiDRW improves survival prediction performancecompared to other pathway-based approachesWe assessed the survival prediction performances usingfour pathway-based methods with a single gene expres-sion profile and the iDRW method on the gene expres-sion profile and copy number data both in breast cancerand neuroblastoma patients. Figure 2a shows the predic-tion performances after 50 repeats of 5-foldcross-validation. Performances were measured using ac-curacy and F-1 score. We note that the classificationperformances of neuroblastoma data were evaluated
with leave-one-out cross-validation since the sample sizeis extremely small, as shown in Fig. 2b. We comparedthe classification performances of the iDRW methodwith four state-of-the-art pathway-based approaches:PLAGE, z-score, DART and the DRW method. The fourpathway-based approaches are implemented using geneexpression profiles only, and the iDRW method is per-formed on the combined gene expression and copynumber data. As a baseline, the classification perform-ance of a single gene expression profile is shown as adotted horizontal line. We used the top-k pathway fea-tures across samples as an input to the classificationmodel, and the optimal value of k is set to that whichshows the best classification accuracy for each method.The optimal parameter k for each model is denoted atx-axis label. When single gene expression profile wasused, the top-50 gene features in breast cancer data ortop-10 genes in neuroblastoma data were used.Although the performances of the z-score and PLAGE
were worse than those of the gene expression profile, theperformances were improved when DART, DRW andiDRW utilizing the pathway information were used. Inparticular, DRW-based methods contribute to an enhanceclassification performance in both cancer datasets investi-gated. This research demonstrates that DRW-based ap-proaches which utilizes topological information of geneson a pathway-based integrated graph is a more effectiveway of inferring pathway activities than other methods.
Fig. 1 Overview of the proposed pathway-based multi-omics integration method for survival prediction
Kim et al. Biology Direct (2019) 14:8 Page 5 of 13

The iDRW method on the combined feature data per-formed the best amongst all of the other methods useddespite the heterogeneity in gene expression and copynumber data. These results demonstrate that the iDRWmethod successfully represented the combined effects ofmultiple genomic profiles on a pathway-based integratedgraph both in breast cancer and neuroblastoma data.We evaluated the classification performances with
top-k pathway features for each model with values of kvarying from 5 to 50 in increments of five with respectto precision, recall and F-1 score for breast cancer data(Fig. 3a) and for neuroblastoma data (Fig. 3b). In breastcancer data, we observe that DRW-based approachesshow higher accuracy and more stable performance withrespect to the change in k. DART infers pathway activ-ities using genes encoding hubs in expression correlationnetworks and shows better performances than otherbenchmark pathway-based approaches. As z-score andPLAGE measure pathway activity profiles by summariz-ing scores of gene sets for each pathway, prediction
performances tend to increase with more number of fea-tures. When taking both precision and recall into ac-count, the results revealed that DRW-based pathwayactivity profiles lead to a more stable performance andless sensitive result to the number of features comparedto other pathway-based approaches. It indicates thattop-ranked 10 to 25 pathways and corresponding signifi-cant genes obtained from DRW-based pathway activityprofiles represent meaningful markers enough to trainthe classification model. In case of neuroblastoma data-set (Fig. 3b), the performances of the all the methods aremore sensitive to the change of k. This appears to be be-cause the neuroblastoma dataset is relatively small andhence it becomes more critical to choose the optimalhyper-parameter value. It is observed that around theoptimal values of k, the performances of DRW-basedmethods are substantially better than the others.Figure 4 shows the performance behavior with respect
to the data size variation by using 70 to 100% of the en-tire samples in the experiments. For example, when 70%
0.4
0.5
0.6
0.7
z−sc
ore(
exp)
PLAGE(e
xp)
DART(exp
)
DRW(e
xp)
iDRW
Model
Acc
urac
y
0.4
0.5
0.6
0.7
z−sc
ore(
exp)
PLAGE(e
xp)
DART(exp
)
DRW(e
xp)
iDRW
Model
F−
1 sc
ore
0.6
0.7
0.8
0.9
1.0
z−sc
ore(
exp)
DART(exp
)
PLAGE(e
xp)
DRW(e
xp)
iDRW
Model
Acc
urac
y
0.6
0.7
0.8
0.9
1.0
z−sc
ore(
exp)
DART(exp
)
PLAGE(e
xp)
DRW(e
xp)
iDRW
Model
F−
1 sc
ore
A B
Fig. 2 Survival prediction performance comparison between pathway profiles of four pathway-based methods on the gene expression data andthose of the iDRW method on the gene expression and copy number data in breast cancer (a) and in neuroblastoma data (b). Performance ismeasured with accuracies and F-1 scores after 50 repeats of five-fold cross-validation with top-k pathways (a). In the neuroblastoma data, performances aremeasured using leave-one-out cross-validation due to the sample size (b). The value of k is empirically set to the optimal one for each method. Theperformance of the gene expression profile is shown as a dotted horizontal line
Kim et al. Biology Direct (2019) 14:8 Page 6 of 13
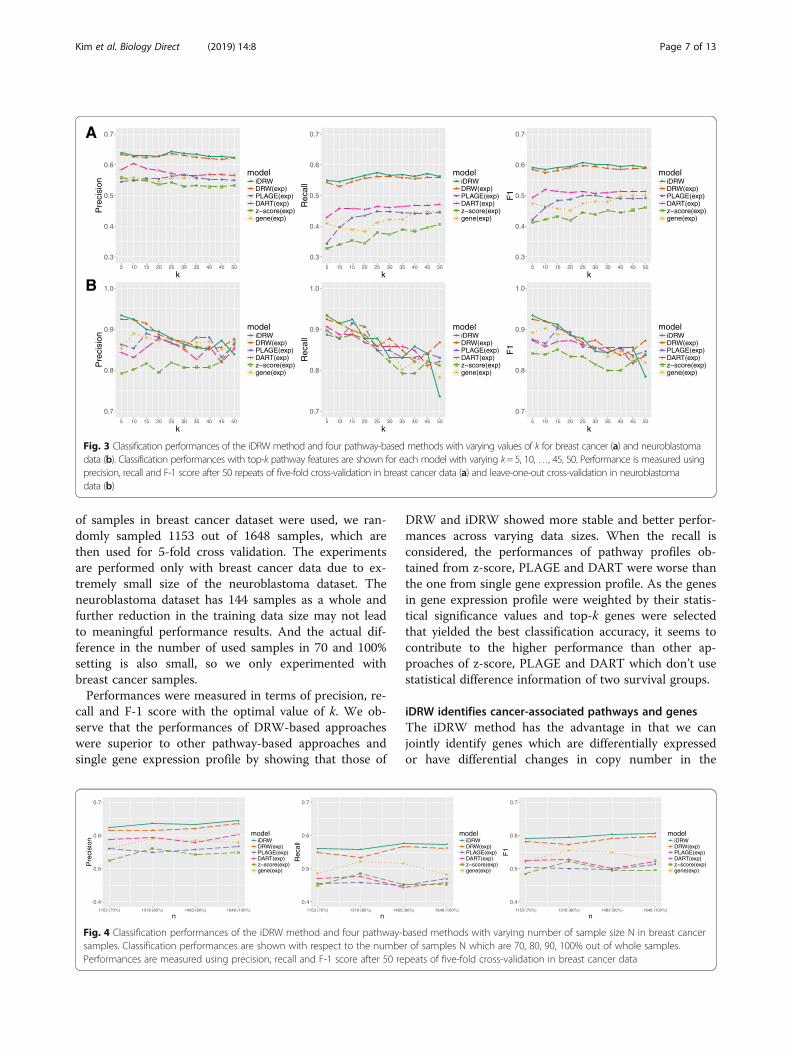
of samples in breast cancer dataset were used, we ran-domly sampled 1153 out of 1648 samples, which arethen used for 5-fold cross validation. The experimentsare performed only with breast cancer data due to ex-tremely small size of the neuroblastoma dataset. Theneuroblastoma dataset has 144 samples as a whole andfurther reduction in the training data size may not leadto meaningful performance results. And the actual dif-ference in the number of used samples in 70 and 100%setting is also small, so we only experimented withbreast cancer samples.Performances were measured in terms of precision, re-
call and F-1 score with the optimal value of k. We ob-serve that the performances of DRW-based approacheswere superior to other pathway-based approaches andsingle gene expression profile by showing that those of
DRW and iDRW showed more stable and better perfor-mances across varying data sizes. When the recall isconsidered, the performances of pathway profiles ob-tained from z-score, PLAGE and DART were worse thanthe one from single gene expression profile. As the genesin gene expression profile were weighted by their statis-tical significance values and top-k genes were selectedthat yielded the best classification accuracy, it seems tocontribute to the higher performance than other ap-proaches of z-score, PLAGE and DART which don’t usestatistical difference information of two survival groups.
iDRW identifies cancer-associated pathways and genesThe iDRW method has the advantage in that we canjointly identify genes which are differentially expressedor have differential changes in copy number in the
0.3
0.4
0.5
0.6
0.7
5 10 15 20 25 30 35 40 45 50
k
Pre
cisi
on
modeliDRWDRW(exp)PLAGE(exp)DART(exp)z−score(exp)gene(exp)
0.3
0.4
0.5
0.6
0.7
5 10 15 20 25 30 35 40 45 50
k
Rec
all
modeliDRWDRW(exp)PLAGE(exp)DART(exp)z−score(exp)gene(exp)
0.3
0.4
0.5
0.6
0.7
5 10 15 20 25 30 35 40 45 50
k
F1
modeliDRWDRW(exp)PLAGE(exp)DART(exp)z−score(exp)gene(exp)
0.7
0.8
0.9
1.0
5 10 15 20 25 30 35 40 45 50
k
Pre
cisi
on
modeliDRWDRW(exp)PLAGE(exp)DART(exp)z−score(exp)gene(exp)
0.7
0.8
0.9
1.0
5 10 15 20 25 30 35 40 45 50
k
Rec
all
modeliDRWDRW(exp)PLAGE(exp)DART(exp)z−score(exp)gene(exp)
0.7
0.8
0.9
1.0
5 10 15 20 25 30 35 40 45 50
k
F1
modeliDRWDRW(exp)PLAGE(exp)DART(exp)z−score(exp)gene(exp)
A
B
Fig. 3 Classification performances of the iDRW method and four pathway-based methods with varying values of k for breast cancer (a) and neuroblastomadata (b). Classification performances with top-k pathway features are shown for each model with varying k= 5, 10,…, 45, 50. Performance is measured usingprecision, recall and F-1 score after 50 repeats of five-fold cross-validation in breast cancer data (a) and leave-one-out cross-validation in neuroblastomadata (b)
0.4
0.5
0.6
0.7
1153 (70%) 1318 (80%) 1483 (90%) 1648 (100%)
n
Pre
cisi
on
modeliDRWDRW(exp)PLAGE(exp)DART(exp)z−score(exp)gene(exp)
0.4
0.5
0.6
0.7
1153 (70%) 1318 (80%) 1483 (90%) 1648 (100%)
n
Rec
all
modeliDRWDRW(exp)PLAGE(exp)DART(exp)z−score(exp)gene(exp)
0.4
0.5
0.6
0.7
1153 (70%) 1318 (80%) 1483 (90%) 1648 (100%)
n
F1
modeliDRWDRW(exp)PLAGE(exp)DART(exp)z−score(exp)gene(exp)
Fig. 4 Classification performances of the iDRW method and four pathway-based methods with varying number of sample size N in breast cancersamples. Classification performances are shown with respect to the number of samples N which are 70, 80, 90, 100% out of whole samples.Performances are measured using precision, recall and F-1 score after 50 repeats of five-fold cross-validation in breast cancer data
Kim et al. Biology Direct (2019) 14:8 Page 7 of 13

top-ranked pathway features. Table 1 shows the selectedtop-k pathways and corresponding gene sets ranked bythe iDRW method from gene expression and copy num-ber data in breast cancer (k = 25) and neuroblastomadata (k = 5). The total number of genes and significantgenes from the gene expression and copy number dataare shown for each pathway. The significant genes fromthe gene expression and copy number data are thosegenes whose p-value of a significant test is lower than0.05.Hanahan and Weinberg have established six biological
capabilities which are acquired during tumor generation:sustaining proliferative signaling; evading growth sup-pressors; activating invasion and metastasis; enabling
replicative immortality; inducing angiogenesis; andresisting cell death [34]. We found that some of thetop-25 ranked pathways in breast cancer data are relatedto at least one of six functions, such as the Ras signalingpathway (KEGG ID: hsa04740), Necroptosis (KEGG ID:hsa04217), Regulation of actin cytoskeleton (KEGG ID:hsa04810), and the PI3K-Akt signaling pathway (KEGGID: hsa04151) [34]. Olfactory receptors are known to acton cell migration, proliferation, and secretion in a varietyof human tissues, and function as biomarkers for breastcancer [35], which indicates a relationship between thetop-ranked pathway, the olfactory transduction pathway(KEGG ID: hsa04740) and breast cancer. In particular,the expression of Olfactory Receptor Family 2 Subfamily
Table 1 Top-k pathways ranked by the iDRW method in breast cancer (k = 25) and neuroblastoma data (k = 5). For each pathway,total number of genes, significant genes from gene expression (EXP) and copy number data (CNA) are shown (p-value of t-test /DESeq2 or χ2-test < 0.05)
Dataset Pathway ID Pathway name Total genes EXP CNA
Breast cancer hsa04740 Olfactory transduction 419 54 268
hsa04014 Ras signaling pathway 232 68 164
hsa04015 Rap1 signaling pathway 206 64 142
hsa04916 Melanogenesis 101 37 73
hsa04722 Neurotrophin signaling pathway 119 38 84
hsa05200 Pathways in cancer 526 166 359
hsa04933 AGE-RAGE signaling pathway in diabetic complications 99 37 67
hsa04530 Tight junction 170 53 107
hsa04510 Focal adhesion 199 76 125
hsa04080 Neuroactive ligand-receptor interaction 278 64 193
hsa05225 Hepatocellular carcinoma 168 56 112
hsa04020 Calcium signaling pathway 182 59 136
hsa04024 cAMP signaling pathway 198 58 139
hsa04217 Necroptosis 164 49 97
hsa04060 Cytokine-cytokine receptor interaction 270 70 192
hsa05152 Tuberculosis 179 58 112
hsa05165 Human papillomavirus infection 319 103 210
hsa04810 Regulation of actin cytoskeleton 208 64 132
hsa04151 PI3K-Akt signaling pathway 352 119 241
hsa04022 cGMP-PKG signaling pathway 163 58 109
hsa04630 Jak-STAT signaling pathway 162 43 112
hsa05167 Kaposi’s sarcoma-associated herpesvirus infection 186 61 114
hsa04010 MAPK signaling pathway 295 87 209
hsa04371 Apelin signaling pathway 137 46 99
hsa04390 Hippo signaling pathway 154 58 100
Neuroblastoma hsa04976 Bile secretion 71 13 5
hsa05034 Alcoholism 180 22 7
hsa01100 Metabolic pathways 1273 43 93
hsa04080 Neuroactive ligand-receptor interaction 278 21 24
hsa04151 PI3K-Akt signaling pathway 352 19 31
Kim et al. Biology Direct (2019) 14:8 Page 8 of 13

B Member 6 (OR2B6), which is a differentially expressedgene, was detected in most breast carcinoma tissues[36]. The development of cancer is closely linked to viralinfection, and breast cancer is known to be associatedwith viruses of the herpesvirus, polyomavirus, and retro-virus families [37]. This information indicates that Hu-man papillomavirus infection (KEGG ID: hsa05165) andKaposi’s sarcoma-associated herpesvirus infection(KEGG ID: hsa05167) are related to breast cancer [38].Thus, we assume that the top-ranked pathways can playa crucial role on breast cancer mechanism and differen-tiate survival groups of patients.The top five pathways involved in neuroblastoma were
identified using the iDRW method. Several previous stud-ies suggested that top five pathways in Table 1 are relevantto neuroblastoma. For example, an in vitro research pro-ject suggested a mechanism underlying a potent and se-lective anti-tumor effect of lithocholic bile acid inneuroblastoma cells [39], which shows the relation be-tween the bile secretion pathway (KEGG ID: hsa04976)and the neuroblastoma. Alcoholism pathway (KEGG ID:
hsa05034) includes the reaction to ethanol in a dopamin-ergic neuron [40]. Several studies have shown that thelevel of Urinary catecholamine metabolites includingvanillylmandelic acid (VMA), homovanillic acid (HVA)and dopamine are elevated in neuroblastoma patients [41,42]. Furthermore, the neuroactive ligand-receptor inter-action pathway (KEGG ID: hsa04080) and metabolic path-ways (KEGG ID: hsa01100) are associated withneuroblastoma, since neuroblastoma occurs in nerve tis-sue and changes in metabolism are common phenomenain cancer [34]. We found some evidences that thePI3K-Akt signaling pathway (KEGG ID: hsa04151) aids inthe pro-survival of neuroblastoma [43–45]. Based on thesefindings, we hypothesized that the top five pathways canbe associated with neuroblastoma and can be crucial fea-tures for distinguishing between two survival groups.
The pathways and genes are jointly analyzed in the gene-gene networkThe interactions between significant genes in the top-25pathways in the breast cancer dataset (Table 1) are
CHRM1
ADCY1
ADCY9
ADCY7ADCY5
ADCY3
ADCY4
PTGER4GNAS
ERBB2
NTRK2
TEKSOS1
BDNF
NFKB1
PMAIP1
CASP3
CREB3
BCL2
AMH
AGER
STK3FSHB
LATS2
ADRB1
YAP1
WWTR1
GNAI3
VIPR2
HTR6
AMOT
INSRKIT PDGFRA
FLT3 FGFR4
GRB2SHC2 IGF1R IGF1
GNG12
GNAL
MAP2K1FTL
RAF1
MAPK8
KRAS
HRAS
GYS1
MAP3K6
PIK3R1
MAPK14
VCL
PIP4K2C
PIP4K2A
GSK3BIRS1
MAP2K3
CCR3 PLAT JAK2 GABARAPCXCR4 PRKCD
SMAD4
SMAD2
THBS1BIRC5
LEF1 ID1
TNFSF9EIF4EBP1
ARHGEF6
PAK4
TNFRSF9 LEPRDVL2EIF4E2
FZD10 LEP
PLCD3
ATP1A1
ORAI3
ITPR1
ITPR3 ATP1A4
STIM2
ORAI1
FXYD1
AKT3
AKT1
VEGFA
PGF
STAT1 PDPK1
CXCL12 CCL8 ATG3IL6STSERPINE1 PLCG1
Fig. 5 Pathway-based gene-gene interaction network between gene expression profile and copy number data in breast cancer samples. Thegenes in the top-25 pathways ranked by the iDRW method in the breast cancer data are shown. The hub genes whose degree is equal to orgreater than three in the gene expression profile (blue ellipses) and genes in copy number data (pink diamonds) are emphasized in the network
Kim et al. Biology Direct (2019) 14:8 Page 9 of 13

visualized in the gene-gene network shown in Fig. 5.The gene-gene network of neuroblastoma is not shown,as the number of edges between genes in the top fivepathways were few. The hub genes whose degree in thenetwork is equal or greater than three play a crucial rolein pathways selected by the iDRW method. Several stud-ies have identified relationships between the survival ofbreast cancer patients and the hub genes in the network:specifically the GNAS complex locus (GNAS), growthfactor receptor bound protein 2 (GRB2), follicle stimu-lating Hormone Subunit Beta (FSHB), Cholinergic Re-ceptor Muscarinic 1 (CHRM1), SOS Ras/Rac GuanineNucleotide Exchange Factor 1 (SOS1), Nuclear FactorKappa B Subunit 1 (NFKB1), and the BCL2 ApoptosisRegulator (BCL2). It has been reported that the amplifi-cation of GNAS may contribute to the pathogenesis ofbreast cancer and is associated with the survival of pa-tients with invasive breast carcinoma [46, 47]. Inaddition, GRB2 and SOS1 have been reported to beoverexpressed in breast cancer tissues compared withnormal tissues [48, 49].
DiscussionsIn this study, we demonstrated the effectiveness ofDRW-based approaches and the interaction effects be-tween multiple genomic profiles on the integrated graph.However, the results in neuroblastoma samples showed adifferent tendency and didn’t confirm clear performanceimprovement of DRW-based approaches with increasingk. We found that statistically significant expressed genesin neuroblastoma data are relatively small compared to incopy number alterations data and those in breast cancerdata as shown in Table 1. iDRW performed random walkprocess on the integrated graph which reflects the impactof copy number genes on gene expression and DRWreflected interactions between genes from gene expressiondata. Other pathway-based approaches: z-score, PLAGEand DART were implemented using gene expression pro-file. Therefore, there is a possibility that the effect of geneexpression profile and the impact of copy number alter-ations on gene expression on the graph can be under-mined. As the clear tendency was not shown due to theextremely small sample size in neuroblastoma data, wecan reduce the limitations when more samples were ob-tained or other genomic profiles can be utilized as well asgene expression and copy number alterations data. In fu-ture works, the clear criteria of dividing two survivalgroups are needed or it can be extended to the survivalanalysis by training regression model which predicts theactual survival days of patient samples.
ConclusionsIn this study, the effectiveness of a directed randomwalk-based multi-omics data integration method was
investigated and analyzed using datasets incorporatinggene expression and copy number alterations for twodifferent cancer datasets. To integrate the gene expres-sion and copy number alteration data, we first con-structed a directed gene-gene graph representing theimpact of copy number variants on gene expression bydefining weight initializations and gene scoring measuresfor each genomic profile. To demonstrate the utility ofthe iDRW method, the performances of fourstate-of-the-art pathway-based methods: PLAGE,z-score, DART and DRW were compared with the sur-vival prediction model which classifies samples into twosurvival groups. The results demonstrate that the iDRWmethod, which utilizes the interactions between geneson an integrated gene-gene graph, produced the bestclassification performance for both breast cancer andneuroblastoma data. It shows that the integratedgene-gene graph successfully reflected the combined ef-fect of gene expression and copy number alterationsdata, guided by pathway information for both cancerdatasets. From a joint analysis of multiple genomic pro-files, the iDRW method can identify biologically mean-ingful pathways and genes highly related to the cancerunder investigation. We also visualized the gene-gene in-teractions between gene expression, and copy numberalterations data in the integrated gene-gene graph forboth the breast cancer and neuroblastoma datasets.
Reviewers’ commentsReviewer’s report 1: Helena Molina-AbrilReviewer summaryIn this paper the authors apply their previously devel-
oped method iDRW on multiple genomic profiles fortwo different cancers and redesign a directed gene genegraph which reflects the interaction between gene ex-pression and copy number data. They also compare theiDRW method with other pathway-based methods for asurvival prediction model which classifies samples intotwo survival groups.Reviewer recommendations to authorsIn my opinion the paper needs some language correc-
tions (english quality) as well as some methodologicalcorrections before being published.Author’s response: We have carefully proofread our
manuscript and revised grammatical errors and unclearsentences.Further explanations of some concrete points need to
be addressed. Data sources as well as preprocessing istoo briefly explained. For instance, mRNA datanormalization and the imputation method for the neuro-blastoma dataset is not mentioned.Author’s response: We have added a more detailed
description of METABRIC breast cancer dataset andneuroblastoma dataset in the GEO database provided by
Kim et al. Biology Direct (2019) 14:8 Page 10 of 13

CAMDA 2018 data integration challenge in “Dataset”section of “Methods”. Explanations of data preprocessingsuch as mRNA data normalization, aCGH microarrayraw data processing, and median imputation method forthe neuroblastoma data are also included.The generation of an integrated directed gene-gene
graph is vaguely described as well as the KEGG pathwayselection (327?). Authors should give a clearer explan-ation of this process.Author’s response: We have added a new sub-section
“Pathway-based integrated gene-gene graph construction”in “Methods” to provide a more detailed and clearer ex-planation of how the integrated graph is constructed toreflect the interactions between gene expression and copynumber alterations. As the total number of human path-ways we obtained in KEGG database is 327, we also re-vised the description of how the pathways andcorresponding gene sets were collected more clearly.The use of t-test of chisquared test values for initial
weights is not sufficiently reasoned.Author’s response: We used two tailed t-test for
mRNA expression data, chi-squared test of independencefor copy number data, and DESeq2 measure forRNA-Seq data to consider the different data distribu-tions. We added clear explanations of each statistical testand weight initialization of genes with equations in sec-tion “Integrative directed random walk-based method(iDRW)” in “Methods”. We also added more explanationsof gene scoring measures for each genomic profile whenpathway activity inference is performed.Accuracy is not an appropriate performance measure
for imbalanced data sets. Please change that.Author’s response: Considering the reviewer’s valu-
able suggestion, we evaluated the performance with pre-cision, recall and F-1 score in addition to accuracy, andadded a description of each performance measure in sec-tion “Pathway feature selection and survival prediction”of “Methods”. In Fig. 2, the classification performanceswere evaluated in terms of accuracy and F-1 score forboth cancer datasets. In addition, we performed add-itional experiments to investigate the performance behav-ior with respect to changes in the parameter k (Fig. 3)and the number of samples (Fig. 4) using precision, recalland F-1 score.I’m also concerned about the logistic regression model.
No testing data has been used for validation, and there-fore classification results might be too optimistic.Author’s response: To evaluate the classification per-
formance in breast cancer data as an example, we haveperformed 5-fold cross-validation which divided thewhole samples into five folds and used four folds astraining data and the remaining fold as validation data.We repeated the entire 5-fold cross-validation process 50times and obtained the average performance of 250
iterations as a final classification performance. The de-scriptions of cross-validation process are described in thefirst paragraph of section “classification performanceevaluation” in “Methods”.Feature selection, does not seem to be included within
the learning process, which may lead to biased results.Author’s response: For feature selection, we first
ranked pathway features using their statistical signifi-cance and then determined the optimal number of top-kranked feature set which yields the best cross validationaccuracy. For a clear explanation of this process, we re-vised the first paragraph of section “Pathway feature se-lection and survival prediction” and “Performanceevaluation” in “Methods”.In general, the paper is based on a previously pub-
lished method, but applied to a new dataset. It is notsufficiently clear what is its substantial contribution andnovelty.Author’s response: We clarified the main contribu-
tions of this study to differentiate our method from thepreviously published method in the last paragraph of“Background” and in “Conclusions”. In the current paper,we proposed an integrated gene-gene graph constructionmethod reflecting interactions between copy number al-terations and gene expression data for two different can-cer types. We also demonstrated improved predictionperformance by a comparative analysis of iDRW withfour state-of-the-art pathway-based approaches. By visu-alizing the gene-gene interaction network on the com-bined profiles, we could jointly analyze multiple genomicprofiles on the integrated gene-gene graph, and we couldalso identify biologically meaningful pathways and genes.Abbreviations should be first mentioned with its corre-
sponding name (see for instance Array comparative gen-omic hybridization (aCGH)Author’s response: We added the full name of all ab-
breviations including aCGH throughout the entire manu-script and we also listed them in “List of abbreviations”.
Reviewer’s report 2: Marta HidalgoReviewer summaryIntegration of different types of genomic data is a
major open problem. This paper presents a new methodfor survival prediction through the integration of geneexpression and copy number data in a pathway model. Italso presents the comparison of the performance of thedescribed model with other 4 pathways methods interms of prediction of survival groups. In general thepaper is well written, although some paragraphs andsentences are somehow not clear enough. In particular,it should be explained with more detail how the integra-tion is performed. Also some language improvementsshould be addressed before publication.Reviewer recommendations to authors
Kim et al. Biology Direct (2019) 14:8 Page 11 of 13

MINOR RECOMMENDATIONS: The major concernthat I find is that although integration is one of the keypoints of the method, called iDRW, and the one newfeature with respect to the DRW method on which it isbased, the explanation of how this integration is per-formed is not clear enough.Author’s response: As the reviewer pointed out, the
integration method of gene expression copy number databased on a gene-gene graph guided by the pathway infor-mation is one of the main contributions. We have in-cluded a detailed and clearer explanation of how theintegrated graph is constructed to reflect the interactionsbetween gene expression and copy number alterationsdata in a new sub-section “Pathway-based integratedgene-gene graph construction” in “Methods”.Also, I would appreciate a mention to the kind of data
used by the other methods: are they also accepting bothgene expression and copy number data? If not, then anexplanation of why these methods are appropriate to becompared with iDRW should be given.Author’s response: The existing pathway activity in-
ference methods focused on how to effectively incorpor-ate pathway information into genomic analysis andthey were implemented to handle only single genomicprofile. In this respect, the iDRW method has beenproposed for combining multiple genomic profiles onan integrated gene-gene graph constructed by pathwayinformation. Therefore, we used gene expression profilefor four pathway-based methods: z-score, PLAGE,DART and DRW method, and gene expression andcopy number data for iDRW method in this study. Weadded further explanations of each pathway-basedmethod and iDRW method in “Background”. Westated that only iDRW method were implemented byincorporating gene expression and copy number datain section “iDRW improves survival prediction per-formance compared to other pathway-based ap-proaches” in “Results”.Sentences to be revised:- Fourth sentence in the last paragraph of
“Background”.- Second sentence in first paragraph of section “Results
and discussion”, subsection “Integrative analysis...”.- First sentence in first paragraph of section “Results
and discussion”, subsection “iDRW identifies...”.Spelling typos:- When defining the initial weights, after W_0 should
say “are”.- In sign (tscore(g_i)), should it be sign (score(g_i))?- Before “More details of the DRW method...” should
be a “.”.- First sentence in first paragraph of section “Results
and discussion”, subsection “iDRW identifies...”, “differ-ential” should be “differentially”.
- Second sentence of second paragraph in the samesection, “some of top-25” should be “some of thetop-25”.- Last sentence in the same paragraph, “crucial role of
breast cancer” should be “crucial role on breast cancer”.- Fifth sentence in next paragraph, “and dopamine ele-
vated” should be “and dopamine are elevated”.Author’s response: We revised all the unclear sen-
tences as the reviewer suggested and thoroughly proof-read the entire manuscript. We appreciate the reviewer’skind corrections and suggestions.
AbbreviationsaCGH: Microarray-based comparative genomic hybridization; CBS: Circularbinary segmentation algorithm; CNVs: Copy number variants; DRW: Directedrandom walk
AcknowledgementsWe gratefully acknowledge the CAMDA organizers for all the support for theCAMDA 2018 challenge and providing datasets available.
FundingThis research was supported by Basic Science Research Program [NRF-2016R1D1A1B03933875] and under the framework of internationalcooperation program [NRF-2018K2A9A1A01090545] managed by theNational Research Foundation of Korea.
Availability of data and materialsAll the datasets used in this study are provided from the CAMDA 2018Challenge (http://camda.info/).
Authors’ contributionsSK, HJ, JK, JM and KS designed the study. SK, HJ, JK and JM implemented theidea and performed the experiments. SK, HJ, JK, JM and KS developed theidea and performed the analysis. SK, HJ, JK, JM and KS wrote the paper. Allauthors read and approved the final manuscript.
Ethics approval and consent to participateNot applicable.
Consent for publicationNot applicable.
Competing interestsThe authors declare that they have no competing interests.
Publisher’s NoteSpringer Nature remains neutral with regard to jurisdictional claims inpublished maps and institutional affiliations.
Author details1Department of Computer Engineering, Ajou University, Suwon 16499, SouthKorea. 2Department of Molecular and Human Genetics, Baylor College ofMedicine, Houston, TX 77030, USA. 3Jan and Dan Duncan NeurologicalResearch Institute, Texas Children’s Hospital, Houston, TX 77030, USA.
Received: 16 October 2018 Accepted: 10 April 2019
References1. Huang S, Chaudhary K, Garmire LX. More is better: recent progress in multi-
omics data integration methods. Front Genet. 2017;8:84.2. Xie B, Yuan Z, Yang Y, Sun Z, Zhou S, Fang X. MOBCdb: a comprehensive
database integrating multi-omics data on breast cancer for precisionmedicine. Breast Cancer Res Treat. 2018;169(3):625–32.
3. Lin E, Lane H-Y. Machine learning and systems genomics approaches formulti-omics data. Biomarker Res. 2017;5(1):2.
Kim et al. Biology Direct (2019) 14:8 Page 12 of 13
4. Jeong H-h, Leem S, Wee K, Sohn K-A. Integrative network analysis forsurvival-associated gene-gene interactions across multiple genomic profilesin ovarian cancer. J Ovarian Res. 2015;8(1):42.
5. Kim D, Shin H, Sohn KA, Verma A, Ritchie MD, Kim JH. Incorporating inter-relationships between different levels of genomic data into cancer clinicaloutcome prediction. Methods. 2014;67(3):344–53.
6. Kim SY, Kim TR, Jeong H-H, Sohn K-A. Integrative pathway-based survivalprediction utilizing the interaction between gene expression and DNAmethylation in breast cancer. BMC Med Genet. 2018;11:68.
7. Vangimalla RR, Jeong HH, Sohn KA. Integrative regression network forgenomic association study. BMC Med Genet. 2016;9(Suppl 1):31.
8. Wang S, Jeong H-h, Kim D, Wee K, Park H-S, Kim S-H, Sohn K-A. Integrativeinformation theoretic network analysis for genome-wide association studyof aspirin exacerbated respiratory disease in Korean population. BMC MedGenet. 2017;10(1):31.
9. Liu W, Bai X, Liu Y, Wang W, Han J, Wang Q, Xu Y, Zhang C, Zhang S, Li X,et al. Topologically inferring pathway activity toward precise cancerclassification via integrating genomic and metabolomic data: prostatecancer as a case. Sci Rep. 2015;5:13192.
10. Jiao Y, Lawler K, Patel GS, Purushotham A, Jones AF, Grigoriadis A, Tutt A,Ng T, Teschendorff AE. DART: Denoising algorithm based on relevancenetwork topology improves molecular pathway activity inference. BMCBioinformatics. 2011;12:403.
11. Liu W, Li C, Xu Y, Yang H, Yao Q, Han J, Shang D, Zhang C, Su F, Li X, et al.Topologically inferring risk-active pathways toward precise cancerclassification by directed random walk. Bioinformatics. 2013;29(17):2169–77.
12. Lee E, Chuang HY, Kim JW, Ideker T, Lee D. Inferring pathway activitytoward precise disease classification. PLoS Comput Biol. 2008;4(11):e1000217.
13. Su J, Yoon BJ, Dougherty ER. Accurate and reliable cancer classification basedon probabilistic inference of pathway activity. PLoS One. 2009;4(12):e8161.
14. Tomfohr J, Lu J, Kepler TB. Pathway level analysis of gene expression usingsingular value decomposition. BMC Bioinformatics. 2005;6:225.
15. Vaske CJ, Benz SC, Sanborn JZ, Earl D, Szeto C, Zhu J, Haussler D, Stuart JM.Inference of patient-specific pathway activities from multi-dimensionalcancer genomics data using PARADIGM. Bioinformatics. 2010;26(12):i237–45.
16. Guo Z, Zhang T, Li X, Wang Q, Xu J, Yu H, Zhu J, Wang H, Wang C, Topol EJ,et al. Towards precise classification of cancers based on robust genefunctional expression profiles. BMC Bioinformatics. 2005;6:58.
17. Efroni S, Schaefer CF, Buetow KH. Identification of key processes underlyingCancer phenotypes using biologic pathway analysis. PLoS One. 2007;2(5):e425.
18. Khunlertgit N, Yoon B-J. Identification of robust pathway markers for Cancerthrough rank-based pathway activity inference. Adv Bioinforma. 2013;2013:8.
19. van Nas A, Ingram-Drake L, Wang S, Orozco LD, Lusis AJ, Pellegrini M,Cokus SJ, Ghazalpour A, Araujo JA, Che N. Copy number variationinfluences gene expression and metabolic traits in mice. Hum MolGenet. 2009;18(21):4118–29.
20. Pereira B, Chin SF, Rueda OM, Vollan HK, Provenzano E, Bardwell HA, PughM, Jones L, Russell R, Sammut SJ, et al. The somatic mutation profiles of2,433 breast cancers refines their genomic and transcriptomic landscapes.Nat Commun. 2016;7:11479.
21. Consortium SM-I. A comprehensive assessment of RNA-seq accuracy,reproducibility and information content by the sequencing quality controlconsortium. Nat Biotechnol. 2014;32(9):903–14.
22. Munro SA, Lund SP, Pine PS, Binder H, Clevert DA, Conesa A, Dopazo J,Fasold M, Hochreiter S, Hong H, et al. Assessing technical performance indifferential gene expression experiments with external spike-in RNA controlratio mixtures. Nat Commun. 2014;5:5125.
23. Wang C, Gong B, Bushel PR, Thierry-Mieg J, Thierry-Mieg D, Xu J, Fang H,Hong H, Shen J, Su Z, et al. The concordance between RNA-seq andmicroarray data depends on chemical treatment and transcript abundance.Nat Biotechnol. 2014;32(9):926–32.
24. Edgar R, Domrachev M, Lash AE. Gene expression omnibus: NCBI geneexpression and hybridization array data repository. Nucleic Acids Res. 2002;30(1):207–10.
25. Commo F, Guinney J, Ferte C, Bot B, Lefebvre C, Soria JC, Andre F. rCGH: acomprehensive array-based genomic profile platform for precisionmedicine. Bioinformatics. 2016;32(9):1402–4.
26. Olshen AB, Venkatraman ES, Lucito R, Wigler M. Circular binarysegmentation for the analysis of array-based DNA copy number data.Biostatistics. 2004;5(4):557–72.
27. Su Z, Fang H, Hong H, Shi L, Zhang W, Zhang W, Zhang Y, Dong Z,Lancashire LJ, Bessarabova M, et al. An investigation of biomarkers derivedfrom legacy microarray data for their utility in the RNA-seq era. GenomeBiol. 2014;15(12):523.
28. Kanehisa M, Goto S. KEGG: Kyoto encyclopedia of genes and genomes.Nucleic Acids Res. 2000;28(1):27–30.
29. Zhang JD, Wiemann S. KEGGgraph: a graph approach to KEGG PATHWAY inR and bioconductor. Bioinformatics. 2009;25(11):1470–1.
30. Gamazon ER, Stranger BE. The impact of human copy number variation ongene expression. Brief Funct Genomics. 2015;14(5):352–7.
31. Maxwell AE. Analysing qualitative data. London: Chapman and Hall; 1961.32. Love MI, Huber W, Anders S. Moderated estimation of fold change and
dispersion for RNA-seq data with DESeq2. Genome Biol. 2014;15(12):550.33. Hänzelmann S, Castelo R, Guinney J. GSVA: gene set variation analysis for
microarray and RNA-Seq data. BMC Bioinformatics. 2013;14(1):7.34. Hanahan D, Weinberg RA. Hallmarks of cancer: the next generation. Cell.
2011;144(5):646–74.35. Sanz G, Leray I, Dewaele A, Sobilo J, Lerondel S, Bouet S, Grebert D,
Monnerie R, Pajot-Augy E, Mir LM. Promotion of cancer cell invasivenessand metastasis emergence caused by olfactory receptor stimulation. PLoSOne. 2014;9(1):e85110.
36. Weber L, Massberg D, Becker C, Altmuller J, Ubrig B, Bonatz G, Wolk G,Philippou S, Tannapfel A, Hatt H, et al. Olfactory receptors as biomarkers inhuman breast carcinoma tissues. Front Oncol. 2018;8:33.
37. Alibek K, Kakpenova A, Mussabekova A, Sypabekova M, Karatayeva N. Role ofviruses in the development of breast cancer. Infect Agent Cancer. 2013;8:32.
38. Wang T, Chang P, Wang L, Yao Q, Guo W, Chen J, Yan T, Cao C. The role ofhuman papillomavirus infection in breast cancer. Med Oncol. 2012;29(1):48–55.
39. Goldberg AA, Beach A, Davies GF, Harkness TA, Leblanc A, Titorenko VI.Lithocholic bile acid selectively kills neuroblastoma cells, while sparingnormal neuronal cells. Oncotarget. 2011;2(10):761–82.
40. Spanagel R. Alcoholism: a systems approach from molecular physiology toaddictive behavior. Physiol Rev. 2009;89(2):649–705.
41. Verly IRN, van Kuilenburg ABP, Abeling NGGM, Goorden SMI, Fiocco M, VazFM, van Noesel MM, Zwaan CM, Kaspers GL, Merks JHM, et al.Catecholamines profiles at diagnosis: increased diagnostic sensitivity andcorrelation with biological and clinical features in neuroblastoma patients.Eur J Cancer. 2017;72:235–43.
42. Strenger V, Kerbl R, Dornbusch HJ, Ladenstein R, Ambros PF, Ambros IM,Urban C. Diagnostic and prognostic impact of urinary catecholamines inneuroblastoma patients. Pediatr Blood Cancer. 2007;48(5):504–9.
43. Fulda S. The PI3K/Akt/mTOR pathway as therapeutic target inneuroblastoma. Curr Cancer Drug Targets. 2009;9(6):729–37.
44. Gomez-Villafuertes R, Garcia-Huerta P, Diaz-Hernandez JI, Miras-Portugal MT.PI3K/Akt signaling pathway triggers P2X7 receptor expression as a pro-survival factor of neuroblastoma cells under limiting growth conditions. SciRep. 2015;5:18417.
45. Tian X, Zhou D, Chen L, Tian Y, Zhong B, Cao Y, Dong Q, Zhou M, Yan J, WangY, et al. Polo-like kinase 4 mediates epithelial-mesenchymal transition inneuroblastoma via PI3K/Akt signaling pathway. Cell Death Dis. 2018;9(2):54.
46. Garcia-Murillas I, Sharpe R, Pearson A, Campbell J, Natrajan R, Ashworth A,Turner NC. An siRNA screen identifies the GNAS locus as a driver in 20qamplified breast cancer. Oncogene. 2013;33:2478.
47. Otterbach F, Callies R, Frey UH, Schmitz KJ, Wreczycki C, Kimmig R, Siffert W,Schmid KW. The T393C polymorphism in the gene GNAS1 of G protein isassociated with survival of patients with invasive breast carcinoma. BreastCancer Res Treat. 2007;105(3):311–7.
48. Zhang Y, Xu G, Liu G, Ye Y, Zhang C, Fan C, Wang H, Cai H, Xiao R, HuangZ, et al. miR-411-5p inhibits proliferation and metastasis of breast cancer cellvia targeting GRB2. Biochem Biophys Res Commun. 2016;476(4):607–13.
49. Pandey P, Kharbanda S, Kufe D. Association of the DF3/MUC1 breast Cancerantigen with Grb2 and the Sos. Ras Exchange Protein. 1995;55(18):4000–3.
Kim et al. Biology Direct (2019) 14:8 Page 13 of 13
Related Documents