IEEE TRANSACTIONS ON MULTIMEDIA 1 Robust and Transparent Color Modulation for Text Data Hiding Paulo Vinicius Koerich Borges, Student Member, IEEE, Joceli Mayer, Member, IEEE, Ebroul Izquierdo, Senior Member, IEEE Abstract— This paper improves the use of text color modula- tion (TCM) as a reliable text document data hiding method. Using TCM, the characters in a document have their color components modified (possibly unperceptually) according to a side message to be embedded. This work presents a detection metric and an analysis determining the detection error rate in TCM, considering an assumed print and scan (PS) channel model. In addition, a perceptual impact model is employed to evaluate the perceptual difference between a modified and a non-modified character. Combining this perceptual model and the results from the detection error analysis it is possible to determine the optimum color modulation values. The proposed detection metric also exploits the orientation characteristics of color halftoning to reduce the error rate. In particular, because color halftoning algorithms use different screen orientation angles for each color channel, this is used as an effective feature to detect the embedded message. Experiments illustrate the validity of the analysis and the applicability of the method. Index Terms— Color modulation, print and scan, hardcopy watermarking. I. I NTRODUCTION Telephony, video and Internet based communications have increased remarkably in the last few years. However, com- munication over paper still remains an essential mean of conveying information. Very often, important paper copies of documents are exchanged between companies and people. As a consequence, several methods have been proposed aiming at reliably authenticating hardcopy documents. This paper investigates the use of TCM as an efficient text document data hiding method. Using TCM, each individual character has its color modulated from the standard black to a different color in the color space. This modulation is per- formed, possibly unperceptually to the human eye, according to a side message to be embedded in the document. Detection is performed with the use of a scanner. The idea of TCM as a text data hiding method is discussed in [1] and [2], where the authors point out that using color as the modified feature is one among several alternatives. Other options include modulating the character size, shape, position, or luminance, for example, also generalized in [2]. Based on the analyses and experiments performed in this paper, it can be noticed that TCM has some interesting This work was supported by CNPq, Proc. No. 202288/2006-4. Paulo Borges and Joceli Mayer are with the LPDS, Dept. of Electrical Engineering - Federal University of Santa Catarina, Florian´ opolis, Brazil, 88.040-900. Tel: +55 48 3721-7627, Fax: +55 48 3721-9280. Ebroul Izquierdo is with the Multimedia and Vision Lab - Dept. of Electronic Engineering - Queen Mary University of London, Mile End Road, London E1 4NS, UK. Tel: +44 20 7882 5354, Fax: +44 20 7882 7997. advantages over other modulation alternatives, mainly due to low detection error rate combined with a low perceptual impact. These issues are discussed in depth in Section II. Based on the TCM approach, this work provides the fol- lowing contributions: (i) Motivation and the benefits of TCM over other text modulation methods are explained. (ii) Considering a PS channel model, a detection metric for TCM is proposed, which combines information of different color channels. For this metric, an analysis to estimate the theoretical error rate is presented. The Bhattacharyya bound [7] is used to determine the error probability when the infor- mation from the blue and red channels are combined. (iii) Using the perceptual CIE L*a*b* color space [8], a color perceptual difference function is used to determine the perceptual impact of the modulation in each color channel, considering the modulation in only one channel or combining the channels. (iv) Using the results from the error analysis and from the perceptual impact, optimum modulation levels are found, con- sidering a tradeoff between error rate and perceptual impact. (v) In this work, it is assumed that color printing is performed using halftoning. In color printing using halftoning, each color channel is printed in a given orientation angle to minimize the interference between color channels [9]. This is exploited in this paper, as the detection of the dominant angle in each character is also used to help identifying the type of color modulation employed, reducing the detection error rate. This paper is organized as follows. Section II explains TCM and its related methods, such as text luminance modulation (TLM) and text halftone modulation (THM). Section III de- scribes the halftoning process and a PS channel, which is used in the error rate analysis. Section IV proposes the detection metric to extract the embedded symbol from the character, providing an analysis to determine the error rate for the metric. Section V discusses the perceptual impact caused by TCM. Section VI determines the optimum modulation levels for a given detection error probability. Section VII presents a metric to determine the dominant halftone orientation angle. Section VIII presents several experiments, validating the analysis and illustrating the applicability of the method. The paper closes with relevant conclusions in Section IX. II. OVERVIEW OF TCM Using TCM, the characters in a document have their color components modified according to a side message to be em- bedded, as illustrated in Fig. 1. Consider a spatial coordinate

Welcome message from author
This document is posted to help you gain knowledge. Please leave a comment to let me know what you think about it! Share it to your friends and learn new things together.
Transcript
IEEE TRANSACTIONS ON MULTIMEDIA 1
Robust and Transparent Color Modulation for TextData Hiding
Paulo Vinicius Koerich Borges,Student Member, IEEE,Joceli Mayer,Member, IEEE,Ebroul Izquierdo,SeniorMember, IEEE
Abstract— This paper improves the use of text color modula-tion (TCM) as a reliable text document data hiding method.Using TCM, the characters in a document have their colorcomponents modified (possibly unperceptually) according to aside message to be embedded. This work presents a detectionmetric and an analysis determining the detection error ratein TCM, considering an assumed print and scan (PS) channelmodel. In addition, a perceptual impact model is employed toevaluate the perceptual difference between a modified and anon-modified character. Combining this perceptual model andthe results from the detection error analysis it is possibletodetermine the optimum color modulation values. The proposeddetection metric also exploits the orientation characteristics ofcolor halftoning to reduce the error rate. In particular, be causecolor halftoning algorithms use different screen orientation anglesfor each color channel, this is used as an effective feature to detectthe embedded message. Experiments illustrate the validityof theanalysis and the applicability of the method.
Index Terms— Color modulation, print and scan, hardcopywatermarking.
I. I NTRODUCTION
Telephony, video and Internet based communications haveincreased remarkably in the last few years. However, com-munication over paper still remains an essential mean ofconveying information. Very often, important paper copiesofdocuments are exchanged between companies and people. Asa consequence, several methods have been proposed aiming atreliably authenticating hardcopy documents.
This paper investigates the use of TCM as an efficient textdocument data hiding method. Using TCM, each individualcharacter has its color modulated from the standard black toa different color in the color space. This modulation is per-formed, possibly unperceptually to the human eye, accordingto a side message to be embedded in the document. Detectionis performed with the use of a scanner.
The idea of TCM as a text data hiding method is discussedin [1] and [2], where the authors point out that using color asthe modified feature is one among several alternatives. Otheroptions include modulating the character size, shape, position,or luminance, for example, also generalized in [2].
Based on the analyses and experiments performed in thispaper, it can be noticed that TCM has some interesting
This work was supported by CNPq, Proc. No. 202288/2006-4.Paulo Borges and Joceli Mayer are with the LPDS, Dept. of Electrical
Engineering - Federal University of Santa Catarina, Florianopolis, Brazil,88.040-900. Tel: +55 48 3721-7627, Fax: +55 48 3721-9280. Ebroul Izquierdois with the Multimedia and Vision Lab - Dept. of Electronic Engineering -Queen Mary University of London, Mile End Road, London E1 4NS, UK.Tel: +44 20 7882 5354, Fax: +44 20 7882 7997.
advantages over other modulation alternatives, mainly dueto low detection error rate combined with a low perceptualimpact. These issues are discussed in depth in Section II.
Based on the TCM approach, this work provides the fol-lowing contributions:
(i) Motivation and the benefits of TCM over other textmodulation methods are explained.
(ii) Considering a PS channel model, a detection metric forTCM is proposed, which combines information of differentcolor channels. For this metric, an analysis to estimate thetheoretical error rate is presented. The Bhattacharyya bound[7] is used to determine the error probability when the infor-mation from the blue and red channels are combined.
(iii) Using the perceptual CIE L*a*b* color space [8], acolor perceptual difference function is used to determine theperceptual impact of the modulation in each color channel,considering the modulation in only one channel or combiningthe channels.
(iv) Using the results from the error analysis and from theperceptual impact, optimum modulation levels are found, con-sidering a tradeoff between error rate and perceptual impact.
(v) In this work, it is assumed that color printing isperformed using halftoning. In color printing using halftoning,each color channel is printed in a given orientation angle tominimize the interference between color channels [9]. Thisisexploited in this paper, as the detection of the dominant anglein each character is also used to help identifying the type ofcolor modulation employed, reducing the detection error rate.
This paper is organized as follows. Section II explains TCMand its related methods, such as text luminance modulation(TLM) and text halftone modulation (THM). Section III de-scribes the halftoning process and a PS channel, which is usedin the error rate analysis. Section IV proposes the detectionmetric to extract the embedded symbol from the character,providing an analysis to determine the error rate for the metric.Section V discusses the perceptual impact caused by TCM.Section VI determines the optimum modulation levels for agiven detection error probability. Section VII presents a metricto determine the dominant halftone orientation angle. SectionVIII presents several experiments, validating the analysis andillustrating the applicability of the method. The paper closeswith relevant conclusions in Section IX.
II. OVERVIEW OF TCM
Using TCM, the characters in a document have their colorcomponents modified according to a side message to be em-bedded, as illustrated in Fig. 1. Consider a spatial coordinate

IEEE TRANSACTIONS ON MULTIMEDIA 2
system for each character, indexed by coordinates(m,n). Inaddition, consider that the RGB standard is used, where eachcolor channel is represented byC, C ∈ R,G,B (whereR,G andB stand for red, green and blue channels, respectively).The modulation is performed according to the function
sCi(m,n) = wCicCi(m,n) (1)
wherec is the original character,w is the modulation strength,and s is the output character. The indexi represents theposition of the character in the document, such that eachcharacter in the original digital document is labeled asci,i = 1, 2, . . . ,K, whereK is the total number of characters.The characters are labeled from left to right, and from topto bottom. This modification can be set to cause a very lowperceptual impact while remaining detectable after printingand scanning.
Therefore, in TCM the information is embedded by indi-vidually altering the color ofcCi from black to any valuein the real-valued discrete alphabetΩ = ω1, ω2, . . . , ωSof cardinalityS, so that each symbol conveys log2S bits ofinformation per color channel.cCi(m,n) is modulated by thegain wCi, wCi ∈ Ω. Assuming thatcCi(m,n) ∈ 0, 1 andwCi ∈ [0, 1], the modified luminance pixels are in the range[0, 1], from white (level 0) to black (level 1). In Fig. 1 theprocess is illustrated forS = 2, where the intensity changeshave been augmented to make them visible to illustrate theunderlying process.
Fig. 1: Example of text watermarking through TCM.
TCM can be interpreted as a generalization of TLM [2], [3],[10], which performs only luminance modifications in the graylevel range. A related method, THM [2], [11], observes the fre-quency response of the pixels in the modified character, whichis different from that of a non-modified character because ofthe quantization caused by halftoning in the printing process.Because color printing also uses halftoning, this approachcanbe extended to the color case and combined with TCM.
Performance analysis and implementation details of TLMare provided in [3]. In [4], detection metrics based on higherorder statistics are proposed to improve the detection inTLM. Because of the quantization noise due to the halftoningprocess in printing, statistical characteristics change as wellas the average luminance detection metric, according to theluminance modulation level. In [4] the authors show that thevariance, the skewness and the kurtosis of a printed characterare efficient detection metrics for this application. Again, notethat, because halftoning is also present in color printing,thesemethods can also be extended to the color case, providingadditional reduction in the error rate.
An obvious additional requirement of TCM in comparison
to TLM and THM, is that a color printing device is necessary.However, several applications require the use of color printing,such as banking documents, legal notes, identification cards,among others, opening a wide range of applications for TCM.
Several advantages regarding the performance of the systemalso motivate the use of TCM. In comparison to TLM, forexample, TCM presents a lower detection error rate, givena perceptual impact. This occurs because the information ofdifferent color channels can be combined, reducing the errorrate. Moreover, although both the luminance and chrominancefrequency responses of the human vision system (HVS) havelow pass characteristics, the spatial sensitivity of the humaneye to variations in chrominance fall off faster as a function ofincreasing spatial frequency than does the response to spatialvariations in luminance [9]. This means that the chrominancechannel has a narrower bandwidth than the luminance channel.This is relevant because printing uses halftoning [9], and there-fore more chromatic error than luminance error is allowed.Aiming at designing a low perceptual error halftoning algo-rithm, the possibility of increasing the perceived smoothnessof halftone textures by trading errors in the luminance channelfor errors in the chrominance channel was first pointed out in[12].
Notice that other document text data hiding methods suchas line spacing modulation and character position [5], [6] canbe used in parallel with TCM. A discussion of the advantagesand drawbacks of these methods in comparisons to the TCMimplementation can be found in reference [3].
III. T HE COLOR PRINT AND SCAN CHANNEL
A. Some Comments on Color Printing
The most common digital color standard combine threecolor channels - red, green, and blue (RGB) - to representcolors [14]. However, because printing is usually performedon a white surface, it is necessary to invert each of theseseparations. When a negative image of the red component isproduced, the resulting image represents the cyan componentof the image. Likewise, negatives of the green and blue com-ponents produce magenta and yellow separations, respectively.
When CMY are combined in the printing process, theresult should be a perceptually acceptable reproduction oftheoriginal image. However, in practice, due to limitations intheink pigments, the darker colors usually present a muddiedappearance. To reduce this effect, a black separation is alsocreated, which improves the shadow and contrast of the image.Numerous techniques exist to derive this black separation fromthe original image; these include gray component replacement,under color removal, and under color addition [15]. Thisprinting technique is referred to as cyan, magenta, yellow andblack (CMYK), where K is short for key, which in this caseis black.
Although CMYK is used in the printing process, after theimage is scanned, a conversion back to RGB is possible,ideally resembling the original RGB representation prior toprinting.
IEEE TRANSACTIONS ON MULTIMEDIA 3
B. The Halftoning Process
This section describes the halftoning process, which occursprior to printing. This description is focused on ordereddithering halftoning [9].
Let s be a digital image of sizeM ×N with L+1 levels inthe range [0,1], where0 represents whiteand 1 representsblack. A halftoned image (binary)b is generated froms, usingthe ordered dithering halftoning algorithm. The output of thismethod depends on the size and on the coefficients of thedithering matrixDH of size J × J , where each coefficientrepresents a threshold level and the coefficient values inD are approximately uniformly distributed. Each coefficienttakes a value from the set0, 1/L, 2/L, . . . , 1. The binaryoutput imageb is given by an element-by-element thresholdingoperation between the pixels ins and the coefficients inDH .In general,J ≪ M andJ ≪ N . The input-output relationshipof ordered dithering can be mathematically described by:
b(m,n) =
0 if s(m,n) < DH(m modJ, n modJ)
1 otherwise(2)
where the output ‘0’ represents a white pixel (do not print adot), and ‘1’ represents a black pixel (or color pixel, such asC, M, or Y), indicating ‘print a dot.’ Clearly, the coefficients inDH have a direct effect on the quality of the halftone image.
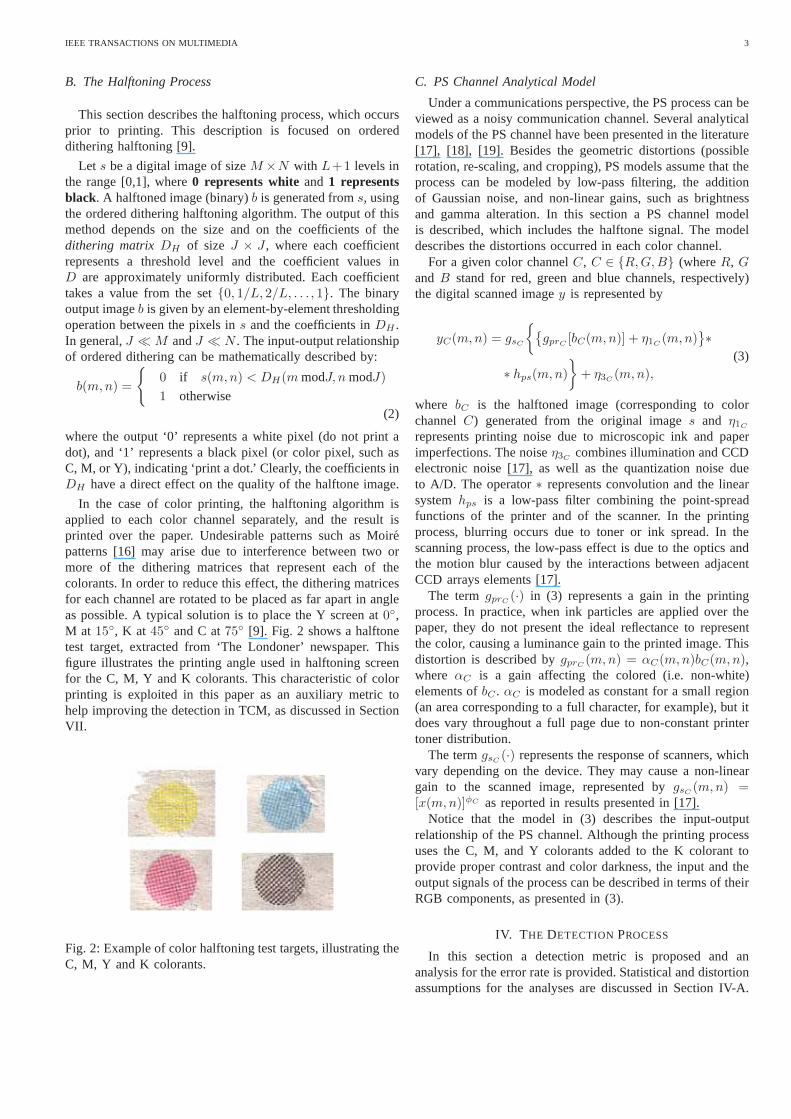
In the case of color printing, the halftoning algorithm isapplied to each color channel separately, and the result isprinted over the paper. Undesirable patterns such as Moirepatterns [16] may arise due to interference between two ormore of the dithering matrices that represent each of thecolorants. In order to reduce this effect, the dithering matricesfor each channel are rotated to be placed as far apart in angleas possible. A typical solution is to place the Y screen at0,M at 15, K at 45 and C at75 [9]. Fig. 2 shows a halftonetest target, extracted from ‘The Londoner’ newspaper. Thisfigure illustrates the printing angle used in halftoning screenfor the C, M, Y and K colorants. This characteristic of colorprinting is exploited in this paper as an auxiliary metric tohelp improving the detection in TCM, as discussed in SectionVII.
Fig. 2: Example of color halftoning test targets, illustrating theC, M, Y and K colorants.
C. PS Channel Analytical Model
Under a communications perspective, the PS process can beviewed as a noisy communication channel. Several analyticalmodels of the PS channel have been presented in the literature[17], [18], [19]. Besides the geometric distortions (possiblerotation, re-scaling, and cropping), PS models assume thattheprocess can be modeled by low-pass filtering, the additionof Gaussian noise, and non-linear gains, such as brightnessand gamma alteration. In this section a PS channel modelis described, which includes the halftone signal. The modeldescribes the distortions occurred in each color channel.
For a given color channelC, C ∈ R,G,B (whereR, GandB stand for red, green and blue channels, respectively)the digital scanned imagey is represented by
yC(m,n) = gsC
gprC [bC(m,n)] + η1C (m,n)
∗
∗ hps(m,n)
+ η3C (m,n),
(3)
where bC is the halftoned image (corresponding to colorchannelC) generated from the original images and η1Crepresents printing noise due to microscopic ink and paperimperfections. The noiseη3C combines illumination and CCDelectronic noise [17], as well as the quantization noise dueto A/D. The operator∗ represents convolution and the linearsystemhps is a low-pass filter combining the point-spreadfunctions of the printer and of the scanner. In the printingprocess, blurring occurs due to toner or ink spread. In thescanning process, the low-pass effect is due to the optics andthe motion blur caused by the interactions between adjacentCCD arrays elements [17].
The termgprC (·) in (3) represents a gain in the printingprocess. In practice, when ink particles are applied over thepaper, they do not present the ideal reflectance to representthe color, causing a luminance gain to the printed image. Thisdistortion is described bygprC (m,n) = αC(m,n)bC(m,n),where αC is a gain affecting the colored (i.e. non-white)elements ofbC . αC is modeled as constant for a small region(an area corresponding to a full character, for example), but itdoes vary throughout a full page due to non-constant printertoner distribution.
The termgsC (·) represents the response of scanners, whichvary depending on the device. They may cause a non-lineargain to the scanned image, represented bygsC (m,n) =[x(m,n)]φC as reported in results presented in [17].
Notice that the model in (3) describes the input-outputrelationship of the PS channel. Although the printing processuses the C, M, and Y colorants added to the K colorant toprovide proper contrast and color darkness, the input and theoutput signals of the process can be described in terms of theirRGB components, as presented in (3).
IV. T HE DETECTION PROCESS
In this section a detection metric is proposed and ananalysis for the error rate is provided. Statistical and distortionassumptions for the analyses are discussed in Section IV-A.
IEEE TRANSACTIONS ON MULTIMEDIA 4
For simplicity, the(m,n) coordinate system is mapped to aone dimensional notation, and the indexi is dropped fromciand its derivations.
A. Statistical and Distortion Assumptions
In the model in (3), it is possible to decomposebC into aconstant termbC plus a noise termη2C , such thatbC(n) =bC + η2C (n), where η2C (n) is the quantization noise. Thevariance of the quantization noise depends on the average levelbC . It is given by
σ2η2C
= bC − (bC)2. (4)
A proof of this equality and a complete characterization of thenoiseη2C is given in [3].
Considering a low perceptual impact requirement in themodulation process, the detector operates in a small rangeof the luminance range[0, 1] of each color channel. For thisreason,gsC in (3) can be approximated to a linear model [17]andφC in gsC is approximated to 1 for simplicity. Assumingthat bC is generated from a constant color region, that is,bC(n) = b0C = bC , whereb0C is the average color of themodulated character prior to printing, (3) can be written as(using an one-dimension notation)
yC(n) =
αC [b0C + η2C (n)] + η1C (n)
∗ hps(n) + η3C (n),(5)
The termαC represents a gain (seegprC in (3)) that variesslightly throughout a full page due to non-uniform printer tonerdistribution. Due to its slow rate of change,αC is modeled asconstant inn but it varies with each realizationi satisfyingαC ∼ N (µαC , σ
2αC
), wherei represents thei−th character inTCM watermarking.
Due to the nature of the noise (discussed in Section III-C) and based on experimental observations,η1C and η3Ccan be generally modeled as zero-mean mutually independentGaussian noise [17], [18].
B. Detection Metric
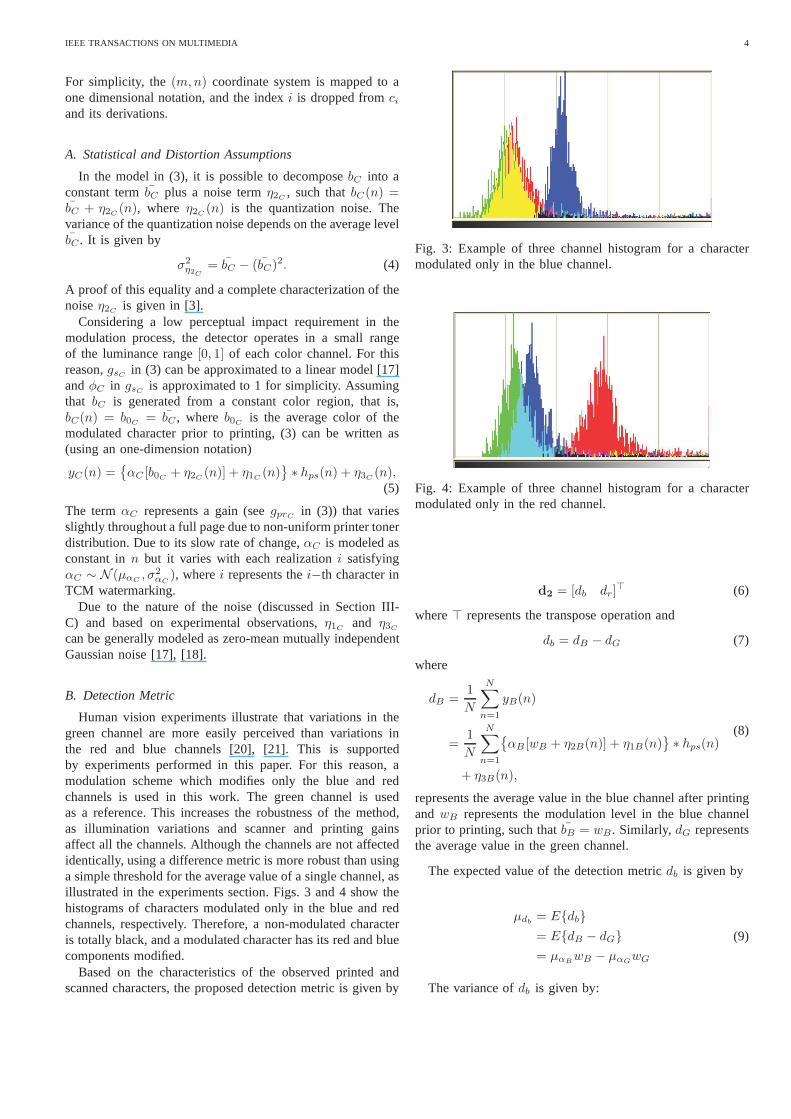
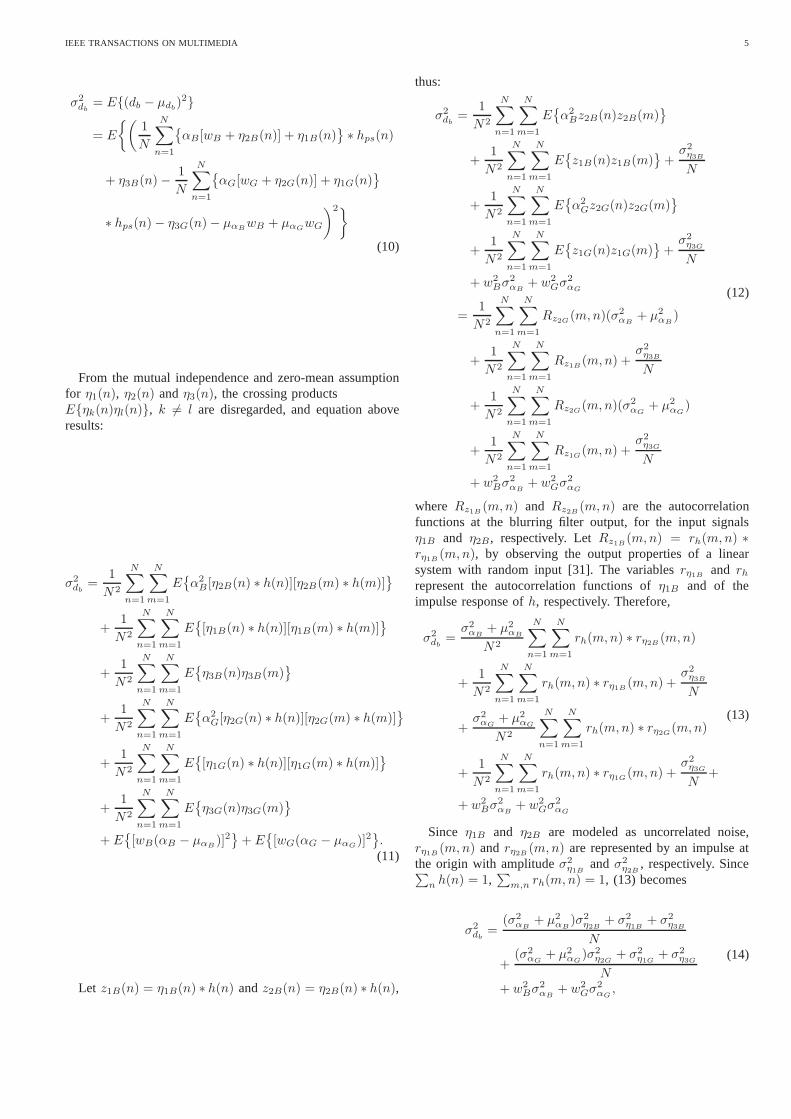
Human vision experiments illustrate that variations in thegreen channel are more easily perceived than variations inthe red and blue channels [20], [21]. This is supportedby experiments performed in this paper. For this reason, amodulation scheme which modifies only the blue and redchannels is used in this work. The green channel is usedas a reference. This increases the robustness of the method,as illumination variations and scanner and printing gainsaffect all the channels. Although the channels are not affectedidentically, using a difference metric is more robust than usinga simple threshold for the average value of a single channel,asillustrated in the experiments section. Figs. 3 and 4 show thehistograms of characters modulated only in the blue and redchannels, respectively. Therefore, a non-modulated characteris totally black, and a modulated character has its red and bluecomponents modified.
Based on the characteristics of the observed printed andscanned characters, the proposed detection metric is givenby
Fig. 3: Example of three channel histogram for a charactermodulated only in the blue channel.
Fig. 4: Example of three channel histogram for a charactermodulated only in the red channel.
d2 = [db dr]⊤ (6)
where⊤ represents the transpose operation and
db = dB − dG (7)
where
dB =1
N
N∑
n=1
yB(n)
=1
N
N∑
n=1
αB [wB + η2B(n)] + η1B(n)
∗ hps(n)
+ η3B(n),
(8)
represents the average value in the blue channel after printingandwB represents the modulation level in the blue channelprior to printing, such thatbB = wB. Similarly, dG representsthe average value in the green channel.
The expected value of the detection metricdb is given by
µdb= Edb
= EdB − dG
= µαBwB − µαGwG
(9)
The variance ofdb is given by:
IEEE TRANSACTIONS ON MULTIMEDIA 5
σ2db
= E(db − µdb)2
= E
(
1
N
N∑
n=1
αB[wB + η2B(n)] + η1B(n)
∗ hps(n)
+ η3B(n)−1
N
N∑
n=1
αG[wG + η2G(n)] + η1G(n)
∗ hps(n)− η3G(n)− µαBwB + µαGwG
)2
(10)
From the mutual independence and zero-mean assumptionfor η1(n), η2(n) andη3(n), the crossing productsEηk(n)ηl(n), k 6= l are disregarded, and equation aboveresults:
σ2db
=1
N2
N∑
n=1
N∑
m=1
E
α2B [η2B(n) ∗ h(n)][η2B(m) ∗ h(m)]
+1
N2
N∑
n=1
N∑
m=1
E
[η1B(n) ∗ h(n)][η1B(m) ∗ h(m)]
+1
N2
N∑
n=1
N∑
m=1
E
η3B(n)η3B(m)
+1
N2
N∑
n=1
N∑
m=1
E
α2G[η2G(n) ∗ h(n)][η2G(m) ∗ h(m)]
+1
N2
N∑
n=1
N∑
m=1
E
[η1G(n) ∗ h(n)][η1G(m) ∗ h(m)]
+1
N2
N∑
n=1
N∑
m=1
E
η3G(n)η3G(m)
+ E
[wB(αB − µαB )]2
+ E
[wG(αG − µαG)]2
.(11)
Let z1B(n) = η1B(n) ∗ h(n) andz2B(n) = η2B(n) ∗ h(n),
thus:
σ2db
=1
N2
N∑
n=1
N∑
m=1
E
α2Bz2B(n)z2B(m)
+1
N2
N∑
n=1
N∑
m=1
E
z1B(n)z1B(m)
+σ2η3B
N
+1
N2
N∑
n=1
N∑
m=1
E
α2Gz2G(n)z2G(m)
+1
N2
N∑
n=1
N∑
m=1
E
z1G(n)z1G(m)
+σ2η3G
N
+ w2Bσ
2αB
+ w2Gσ
2αG
=1
N2
N∑
n=1
N∑
m=1
Rz2G(m,n)(σ2αB
+ µ2αB
)
+1
N2
N∑
n=1
N∑
m=1
Rz1B (m,n) +σ2η3B
N
+1
N2
N∑
n=1
N∑
m=1
Rz2G(m,n)(σ2αG
+ µ2αG
)
+1
N2
N∑
n=1
N∑
m=1
Rz1G(m,n) +σ2η3G
N
+ w2Bσ
2αB
+ w2Gσ
2αG
(12)
where Rz1B (m,n) and Rz2B (m,n) are the autocorrelationfunctions at the blurring filter output, for the input signalsη1B and η2B, respectively. LetRz1B (m,n) = rh(m,n) ∗rη1B (m,n), by observing the output properties of a linearsystem with random input [31]. The variablesrη1B and rhrepresent the autocorrelation functions ofη1B and of theimpulse response ofh, respectively. Therefore,
σ2db
=σ2αB
+ µ2αB
N2
N∑
n=1
N∑
m=1
rh(m,n) ∗ rη2B (m,n)
+1
N2
N∑
n=1
N∑
m=1
rh(m,n) ∗ rη1B (m,n) +σ2η3B
N
+σ2αG
+ µ2αG
N2
N∑
n=1
N∑
m=1
rh(m,n) ∗ rη2G(m,n)
+1
N2
N∑
n=1
N∑
m=1
rh(m,n) ∗ rη1G(m,n) +σ2η3G
N+
+ w2Bσ
2αB
+ w2Gσ
2αG
(13)
Since η1B and η2B are modeled as uncorrelated noise,rη1B (m,n) and rη2B (m,n) are represented by an impulse atthe origin with amplitudeσ2
η1Bandσ2
η2B, respectively. Since
∑
n h(n) = 1,∑
m,n rh(m,n) = 1, (13) becomes
σ2db
=(σ2
αB+ µ2
αB)σ2
η2B+ σ2
η1B+ σ2
η3B
N
+(σ2
αG+ µ2
αG)σ2
η2G+ σ2
η1G+ σ2
η3G
N+ w2
Bσ2αB
+ w2Gσ
2αG
,
(14)
IEEE TRANSACTIONS ON MULTIMEDIA 6
whereσ2η2B
= (wB − w2B).
First, assume that the detection is performed using onlythe blue channel, for example. Considering theS = 2 (or1 bit) case, for example, the conditional error probabilityp01 of receiving a bit0 given that bit1 was transmitted isdescribed byp01 = Pr(db > λB|bit = 1), whereλb is adecision threshold. Defining the complementary error function
erfc(x) = 2√π
∫∞x
e−t2dt, p01 = 12erfc
(
λb−µdb/1√
2σ2
db/1
)
, where
µdb/1 andσ2db/1
are respectively the mean and the variance ofdb for bit 1. Equivalently, if bit 0 is transmitted, the conditional
error probability is given byp10 = 12erfc
(
µdb/0−λb
√
2σ2
db/0
)
, where
µdb/0 andσ2db/0
are respectively the mean and the variance ofdb for bit 0. Finally, the average error probability is expressedby
Pedb= P0p10 + P1p01 (15)
whereP0 andP1 are the probabilities of occurrence of bits0 and 1, respectively. A similar approach is valid for the redchannel.
C. Bhattacharyya Bound on the Error Rate
To reduce the error rate, the metricdb and dr of theblue and red channels described in (6) are combined intoa single metric. For this task, the Bayes decision rule isemployed in this work. Because the metrics are assumednormally distributed, the Bayes decision rule guarantees thelowest average error rate [7].
Although it is straightforward to determine the error rateusing the metrics separately (as given in (15)), the error ratefor the Gaussian case when the metrics are combined with theBayes classifier are not easily computable, specially in highdimensions. However, in the two-category (S = 2) case, anupper bound on the error rate is given by the Bhattacharyyabound for Gaussian variables [7]. A closer bound is given bythe Chernoff bound [7], however the Bhattacharyya bound isused in this work to avoid determination ofβ, (required forChernoff), as discussed in [7].
Therefore, the classification error probability is:
Ped =√
P0P1e−k (16)
wherek is given by
k =1
8(µd/1 − µd/0)
T
(
Σ/0 +Σ/1
2
)−1
(µd/1 − µd/0)
+1
2ln
|Σ/0+Σ/1
2 |√
|Σ/0||Σ/1|(17)
whereΣ/0 andΣ/1 represent the covariance matrices corre-sponding to bit 0 and bit 1, respectively.
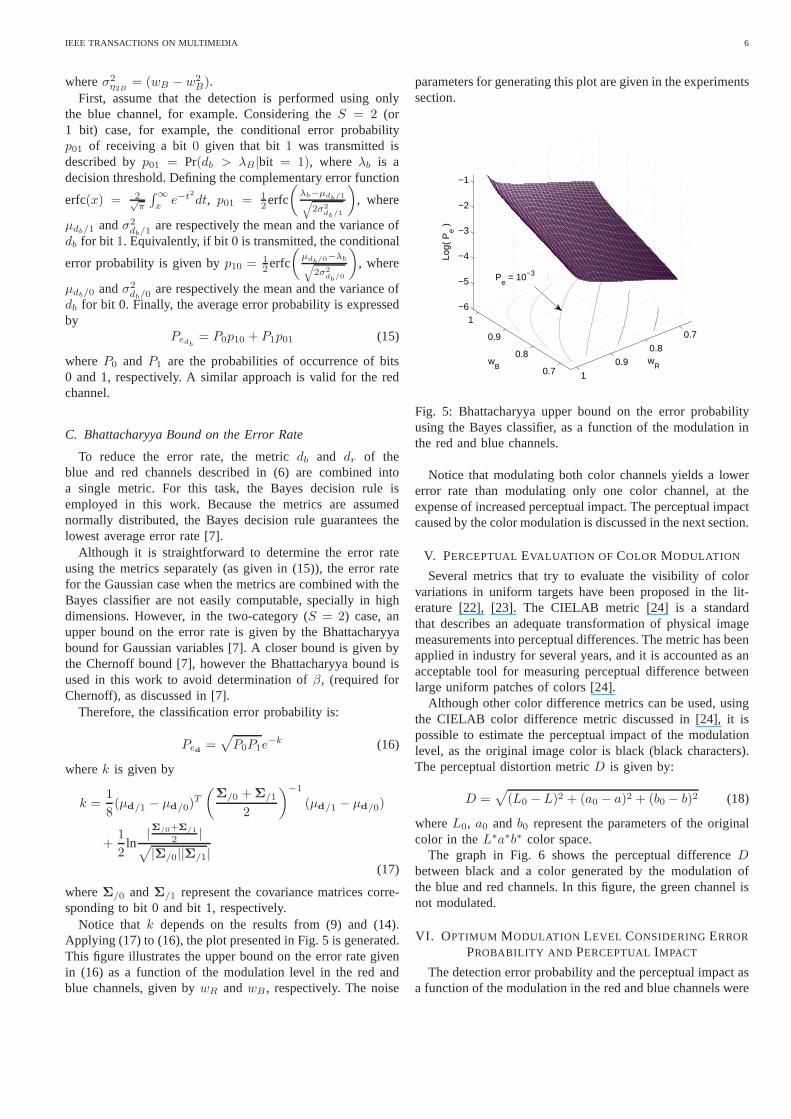
Notice thatk depends on the results from (9) and (14).Applying (17) to (16), the plot presented in Fig. 5 is generated.This figure illustrates the upper bound on the error rate givenin (16) as a function of the modulation level in the red andblue channels, given bywR andwB , respectively. The noise
parameters for generating this plot are given in the experimentssection.
0.7
0.8
0.9
1
0.7
0.8
0.9
1
−6
−5
−4
−3
−2
−1
wRw
B
Log(
Pe )
Pe = 10−3
Fig. 5: Bhattacharyya upper bound on the error probabilityusing the Bayes classifier, as a function of the modulation inthe red and blue channels.
Notice that modulating both color channels yields a lowererror rate than modulating only one color channel, at theexpense of increased perceptual impact. The perceptual impactcaused by the color modulation is discussed in the next section.
V. PERCEPTUAL EVALUATION OF COLOR MODULATION
Several metrics that try to evaluate the visibility of colorvariations in uniform targets have been proposed in the lit-erature [22], [23]. The CIELAB metric [24] is a standardthat describes an adequate transformation of physical imagemeasurements into perceptual differences. The metric has beenapplied in industry for several years, and it is accounted asanacceptable tool for measuring perceptual difference betweenlarge uniform patches of colors [24].
Although other color difference metrics can be used, usingthe CIELAB color difference metric discussed in [24], it ispossible to estimate the perceptual impact of the modulationlevel, as the original image color is black (black characters).The perceptual distortion metricD is given by:
D =√
(L0 − L)2 + (a0 − a)2 + (b0 − b)2 (18)
whereL0, a0 and b0 represent the parameters of the originalcolor in theL∗a∗b∗ color space.
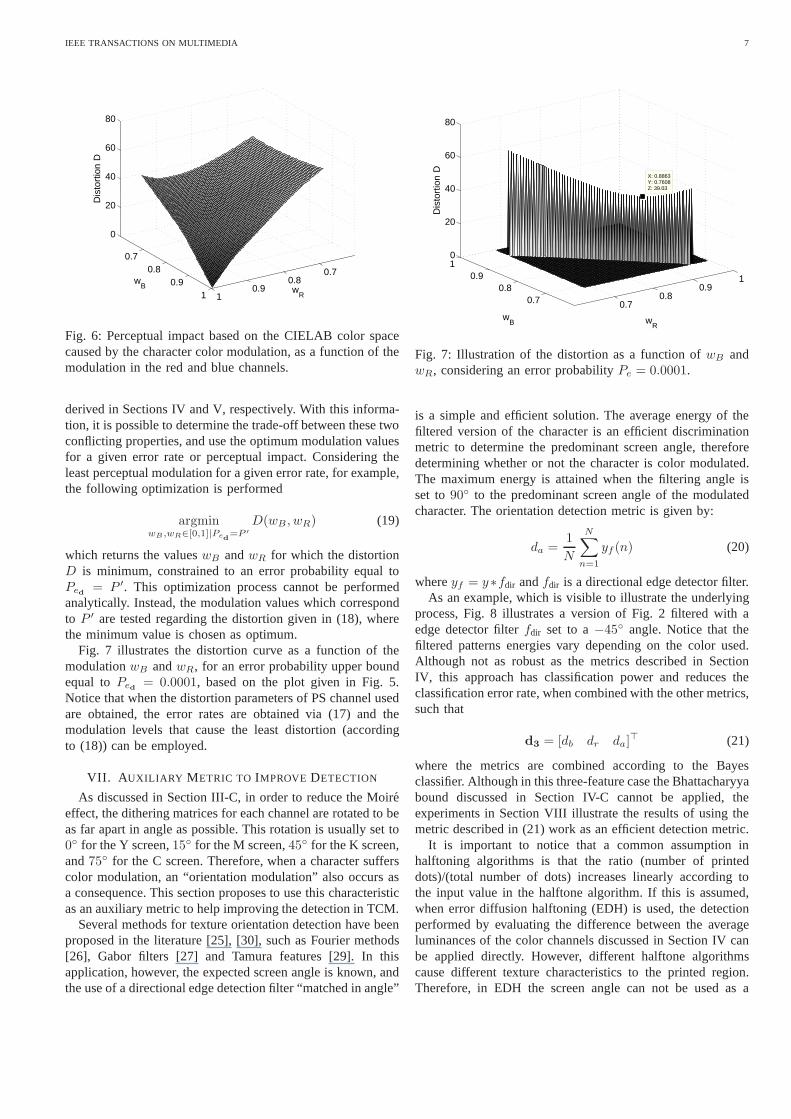
The graph in Fig. 6 shows the perceptual differenceDbetween black and a color generated by the modulation ofthe blue and red channels. In this figure, the green channel isnot modulated.
VI. OPTIMUM MODULATION LEVEL CONSIDERINGERROR
PROBABILITY AND PERCEPTUAL IMPACT
The detection error probability and the perceptual impact asa function of the modulation in the red and blue channels were
IEEE TRANSACTIONS ON MULTIMEDIA 7
0.70.8
0.91
0.70.8
0.91
0
20
40
60
80
wR
wB
Dis
tort
ion
D
Fig. 6: Perceptual impact based on the CIELAB color spacecaused by the character color modulation, as a function of themodulation in the red and blue channels.
derived in Sections IV and V, respectively. With this informa-tion, it is possible to determine the trade-off between these twoconflicting properties, and use the optimum modulation valuesfor a given error rate or perceptual impact. Considering theleast perceptual modulation for a given error rate, for example,the following optimization is performed
argminwB ,wR∈[0,1]|Pe
d=P ′
D(wB , wR) (19)
which returns the valueswB andwR for which the distortionD is minimum, constrained to an error probability equal toPed = P ′. This optimization process cannot be performedanalytically. Instead, the modulation values which correspondto P ′ are tested regarding the distortion given in (18), wherethe minimum value is chosen as optimum.
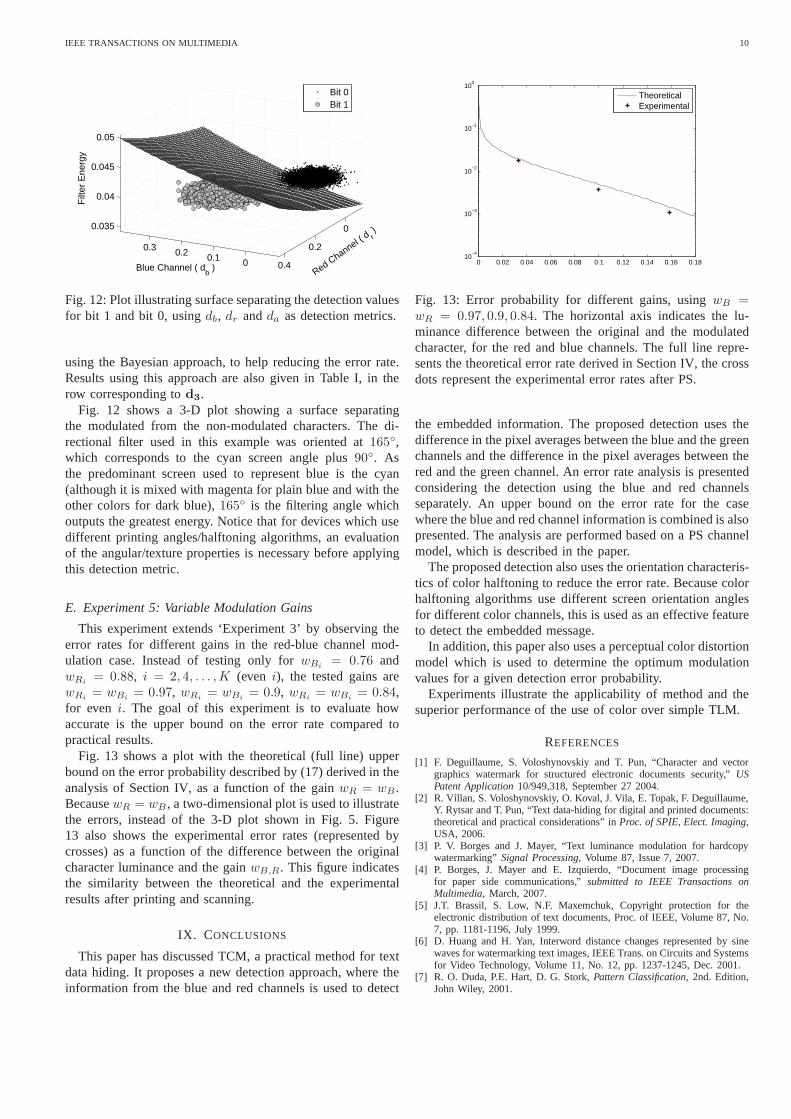
Fig. 7 illustrates the distortion curve as a function of themodulationwB andwR, for an error probability upper boundequal toPed = 0.0001, based on the plot given in Fig. 5.Notice that when the distortion parameters of PS channel usedare obtained, the error rates are obtained via (17) and themodulation levels that cause the least distortion (accordingto (18)) can be employed.
VII. A UXILIARY METRIC TO IMPROVE DETECTION
As discussed in Section III-C, in order to reduce the Moireeffect, the dithering matrices for each channel are rotatedto beas far apart in angle as possible. This rotation is usually set to0 for the Y screen,15 for the M screen,45 for the K screen,and75 for the C screen. Therefore, when a character sufferscolor modulation, an “orientation modulation” also occursasa consequence. This section proposes to use this characteristicas an auxiliary metric to help improving the detection in TCM.
Several methods for texture orientation detection have beenproposed in the literature [25], [30], such as Fourier methods[26], Gabor filters [27] and Tamura features [29]. In thisapplication, however, the expected screen angle is known, andthe use of a directional edge detection filter “matched in angle”
0.70.8
0.91
0.70.8
0.910
20
40
60
80
X: 0.8863Y: 0.7608Z: 39.03
wR
wB
Dis
tort
ion
D
Fig. 7: Illustration of the distortion as a function ofwB andwR, considering an error probabilityPe = 0.0001.
is a simple and efficient solution. The average energy of thefiltered version of the character is an efficient discriminationmetric to determine the predominant screen angle, thereforedetermining whether or not the character is color modulated.The maximum energy is attained when the filtering angle isset to90 to the predominant screen angle of the modulatedcharacter. The orientation detection metric is given by:
da =1
N
N∑
n=1
yf (n) (20)
whereyf = y∗fdir andfdir is a directional edge detector filter.As an example, which is visible to illustrate the underlying
process, Fig. 8 illustrates a version of Fig. 2 filtered with aedge detector filterfdir set to a−45 angle. Notice that thefiltered patterns energies vary depending on the color used.Although not as robust as the metrics described in SectionIV, this approach has classification power and reduces theclassification error rate, when combined with the other metrics,such that
d3 = [db dr da]⊤ (21)
where the metrics are combined according to the Bayesclassifier. Although in this three-feature case the Bhattacharyyabound discussed in Section IV-C cannot be applied, theexperiments in Section VIII illustrate the results of usingthemetric described in (21) work as an efficient detection metric.
It is important to notice that a common assumption inhalftoning algorithms is that the ratio (number of printeddots)/(total number of dots) increases linearly accordingtothe input value in the halftone algorithm. If this is assumed,when error diffusion halftoning (EDH) is used, the detectionperformed by evaluating the difference between the averageluminances of the color channels discussed in Section IV canbe applied directly. However, different halftone algorithmscause different texture characteristics to the printed region.Therefore, in EDH the screen angle can not be used as a

IEEE TRANSACTIONS ON MULTIMEDIA 8
Fig. 8: Halftone color patterns filtered with−45 directionaledge filter.
detection metric as presented in this section, and it is necessaryto evaluate the type of texture caused by this algorithm. Forthis reason, in the experiments related to (20) in Section VIII-D printers that use EDH are not used.
VIII. E XPERIMENTS
This section presents Monte Carlo simulations to illustratethe applicability of TCM and the reduced error rate when usingthe Bayes classifier to combine the color channels. It alsopresents experiments to validate the error rate analyses derivedin Section IV, in addition to comparative results between TLMand TCM.
As expected, it was noticed that the distortion parametersand the noise in the PS channel vary according to the colorchannel and the printing and scanning devices used. The print-ing and scanning resolutions were set to 600 and 300 dots/inchand pixels/inch, respectively. The experiments were conductedwith printers HP IJ-855C and Ricoh aficio 2238c, and scannersHP SJ-5P and Canon CanoScan LiDE 20. Typical values forthe parameters in (3) areση1R = 0.015, ση3R = 0.012,µαR = 0.83, σαR = 0.04, for the red channel,ση1G = 0.02,ση3G = 0.01, µαG = 0.85, σαG = 0.03, for the green channel,andση1B = 0.015, ση3B = 0.01, µαB = 0.82, σαB = 0.03,for the blue channel.
The remaining noise termsσ2η2R
andσ2η2B
are level depen-dent and are given byσ2
η2B= wB−w2
B andσ2η2R
= wR−w2R,
as presented in (4), in Section IV-A.These values were estimated using test targets of different
colors, analyzing only the corresponding color channel. If
different PS devices are used, a new parameter estimation isnecessary if the user wishes to determine the theoretical errorrate using (15).
To model the low-pass effect of the PS channel representedby hps in (3), the filter described in [19] is used in thispaper, which is a Butterworth filter of order 1 and cut-offfrequency equal to 0.17. Using the noise, gain and blurringfilter parameters described above, a character distorted withthe proposed PS model is perceptually similar to an actualprinted and scanned character.
A. Experiment 1: Blue Channel Modulation
Consider the 1 bit/element case (S = 2). A large sequenceof K = 30360 characters (as in‘abcdef...’ ) is printed, withfont type ‘Arial’, size 12 points. In the experiments small textelements such as commas and dots are not watermarked. Dueto the small number of pixels in these elements, they are moresusceptible to segmentation and detection errors.
Prior to printing, the blue channel of the character sequencewas modulated with a gainwBi = 1 (no color alteration) foroddi, i = 1, 3, . . . ,K−1, and with a gainwBi = 0.81 for eveni, i = 2, 4, . . . ,K. Using these values, empirical tests indicatethat it is hard for a human observer to distinguish betweena modulated and a non-modulated character. In this case,according to the perceptual distortion metric described in(18),the distortion is given byD = 34.67. In fact, the empiricaltests performed with human observers have illustrated thatD < 40 are usually not perceivable by the human eye.
The elements with no color alteration (wBi = 1) carry bit0, and the elements modulated withwBi = 0.81 carry bit 1.The task is to classify each printed character as having a bit0 or bit 1 embedded into it. In this example, the differencedb = dB − dG is used as a detection metric, as given in (7).
To retrieve the embedded information, the document isscanned and the text is segmented from the background usingsimple thresholding. Segmentation errors are not observedinthis set of tests, however it is clear that they may causesynchronization detection errors. The use of channel codingis an efficient option to reduce the bit errors caused by wrongsegmentation [28].
The histogram of the detection results are presented in Fig.9. The error rates for this experiment are presented in TableI, in the row corresponding todb. The results in this tablerepresent the average error rate among the devices tested.Although all the results obtained were similar for all the testedscanners, printer Ricoh aficio 2238c led to, on average, a25%lower error rate than HP IJ-855C. It can be argued that thisis an expectable result since the Ricoh printer is a higherresolution laser device, causing less ink spreading than theHP printer.
For comparison, this table also presents error rates usingsimple TLM, where the three channels are modulated with thesame gain, simulating a single-channel gray level modificationonly. With the same equipment and resolutions, the modulationgains for TLM was0.81, which causesD = 39.59, alsomaking the modulation hard to perceive. The modulation levelusing TLM was evaluated using only the average luminance

IEEE TRANSACTIONS ON MULTIMEDIA 9
−0.1 0 0.1 0.2 0.3Blue Channel ( d
b )
Bit 1Bit 0
Fig. 9: Histogram of the detection metricdB, for the bluechannel.
TABLE I: Experimental error rates for TCM and TLM.Detection Number Error
Type of Errors RateTLM 139 4.6× 10⁻³
Blue Modulation (db) 35 1.2× 10⁻³
Red Modulation (dr) 53 1.7× 10⁻³
Red-Blue Modulation (d2) 6 1.96× 10⁻⁴
Orientation (da) 1040 3.39× 10⁻²
Red-Blue-Orientation (d3) 2 6.59× 10⁻⁵
as a detection metric. Although additional metrics can be usedin TLM (variance and higher order statistics, as discussed in[13]), these additional metrics can also be applied in TCM.Notice that color modulation presents a lower error rate incomparison with simple luminance modulation.
For additional TLM comparison, the reader is referred to[2], where TLM results are presented considering differentmodulation levels. In that article, however, apart from thefactthat different devices are tested, the authors use a smallerfontsize (10 pt), causing a slightly higher error rate (about30%)than TLM in Table I.
B. Experiment 2: Red Channel Modulation
This experiment is similar to Experiment 1, however thered channel is modulated, with a gainwRi = 0.85 fori = 2, 4, . . . ,K. This gain value was modified such that thedistortionD remained the same as in Experiment 1, that is,D = 34.67. In this example, the differencedr = dR − dG isused as a detection metric, as described in (7). The histogramof the detection results and the error rates for this experimentare given in Fig. 10 and Table I, respectively. Notice that whenno modulation is performed (bit 0), no difference betweenthe averages of the red and green channels is expected, inagreement with the experimental results.
C. Experiment 3: Combined Blue-Red Channel Modulation
In this experiment, the blue and the red channels aremodulated in charactersci, i = 2, 4, . . . ,K. The modulationgain is given bywB = 0.76 and wR = 0.88, which are
−0.2 −0.1 0 0.1 0.2 0.3 0.4Red Channel ( d
r )
Bit 1Bit 0
Fig. 10: Histogram of the detection metricdR, for the redchannel.
−0.2 0 0.2 0.4 0.6−0.2
0
0.2
0.4
Red Channel (dr )
Blu
e C
hann
el (
d b )
Bit 0Bit 1
Fig. 11: Scatter plot illustrating curve separating the detectionvalues for bit 1 and bit 0.
the modulation values that yield the minimum distortion foran error probability equal to0.0001, according to the resultpresented in Figure 7. In this case, the distortion of themodulated characters is given byD = 39.03.
In the detection, the information from the blue and redchannels are combined according to the Bayes classifier, asdescribed in Section IV-C. Fig. 11 shows a scattered plot withthe decision function obtained for this set of tests.
The experimental error rates combining the two channelswith the Bayes classifier is given in Table I, in the rowcorresponding tod2. This illustrates that the detection usingtwo color channels is more efficient than single channeldetection, at the expense of a slight increase in the distortion.However, this distortion is still hardly perceived by a humanobserver.
D. Experiment 4: Auxiliary Angular Detection
This experiment presents the improved performance usingthe approach described in Section VII, where the averageenergyda of the output of the directional filterfdir is usedas a detection metric. The experiments illustrate that whenda is used alone, it does not bring an error rate as low asthe metricsdb anddr, as shown in Table I. However,da canbe combined withdb and dr used in Experiments 1 and 2
IEEE TRANSACTIONS ON MULTIMEDIA 10
00.10.20.3
0
0.2
0.4
0.035
0.04
0.045
0.05
Red Channel (
d r )
Blue Channel ( db )
Filt
er E
nerg
yBit 0Bit 1
Fig. 12: Plot illustrating surface separating the detection valuesfor bit 1 and bit 0, usingdb, dr andda as detection metrics.
using the Bayesian approach, to help reducing the error rate.Results using this approach are also given in Table I, in therow corresponding tod3.
Fig. 12 shows a 3-D plot showing a surface separatingthe modulated from the non-modulated characters. The di-rectional filter used in this example was oriented at165,which corresponds to the cyan screen angle plus90. Asthe predominant screen used to represent blue is the cyan(although it is mixed with magenta for plain blue and with theother colors for dark blue),165 is the filtering angle whichoutputs the greatest energy. Notice that for devices which usedifferent printing angles/halftoning algorithms, an evaluationof the angular/texture properties is necessary before applyingthis detection metric.
E. Experiment 5: Variable Modulation Gains
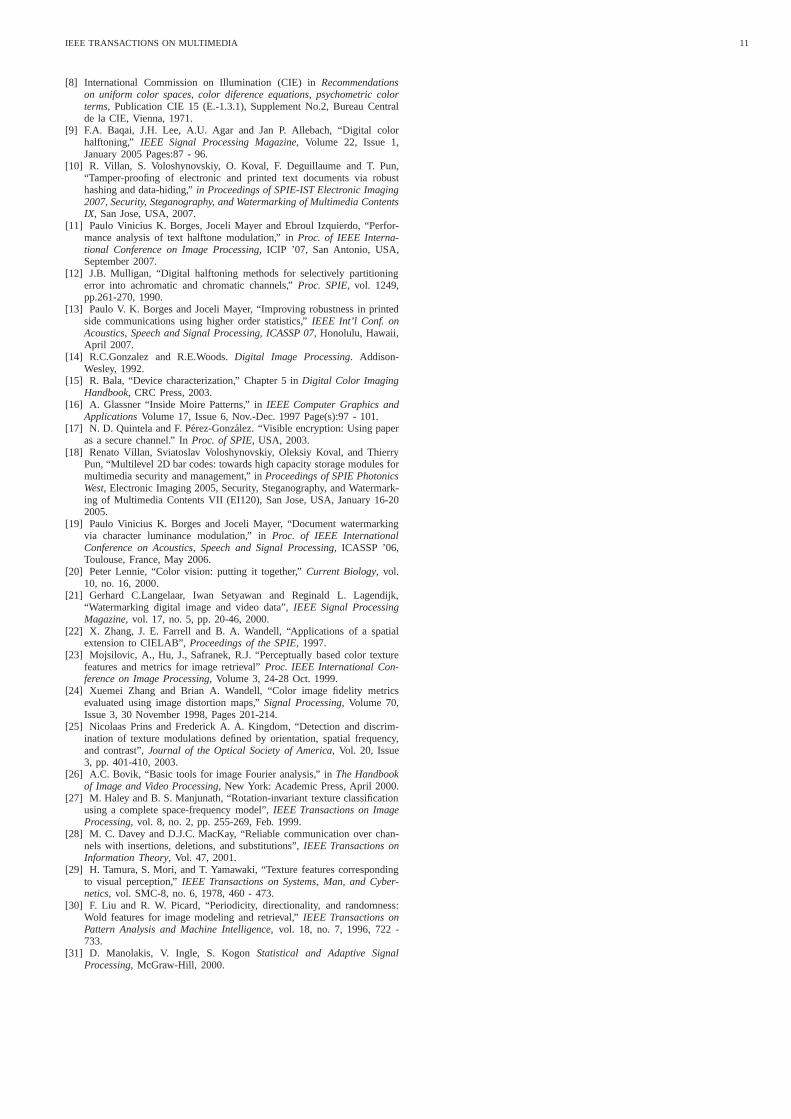
This experiment extends ‘Experiment 3’ by observing theerror rates for different gains in the red-blue channel mod-ulation case. Instead of testing only forwBi = 0.76 andwRi = 0.88, i = 2, 4, . . . ,K (even i), the tested gains arewRi = wBi = 0.97, wRi = wBi = 0.9, wRi = wBi = 0.84,for even i. The goal of this experiment is to evaluate howaccurate is the upper bound on the error rate compared topractical results.
Fig. 13 shows a plot with the theoretical (full line) upperbound on the error probability described by (17) derived in theanalysis of Section IV, as a function of the gainwR = wB.BecausewR = wB , a two-dimensional plot is used to illustratethe errors, instead of the 3-D plot shown in Fig. 5. Figure13 also shows the experimental error rates (represented bycrosses) as a function of the difference between the originalcharacter luminance and the gainwB,R. This figure indicatesthe similarity between the theoretical and the experimentalresults after printing and scanning.
IX. CONCLUSIONS
This paper has discussed TCM, a practical method for textdata hiding. It proposes a new detection approach, where theinformation from the blue and red channels is used to detect
0 0.02 0.04 0.06 0.08 0.1 0.12 0.14 0.16 0.1810
−4
10−3
10−2
10−1
100
TheoreticalExperimental
Fig. 13: Error probability for different gains, usingwB =wR = 0.97, 0.9, 0.84. The horizontal axis indicates the lu-minance difference between the original and the modulatedcharacter, for the red and blue channels. The full line repre-sents the theoretical error rate derived in Section IV, the crossdots represent the experimental error rates after PS.
the embedded information. The proposed detection uses thedifference in the pixel averages between the blue and the greenchannels and the difference in the pixel averages between thered and the green channel. An error rate analysis is presentedconsidering the detection using the blue and red channelsseparately. An upper bound on the error rate for the casewhere the blue and red channel information is combined is alsopresented. The analysis are performed based on a PS channelmodel, which is described in the paper.
The proposed detection also uses the orientation characteris-tics of color halftoning to reduce the error rate. Because colorhalftoning algorithms use different screen orientation anglesfor different color channels, this is used as an effective featureto detect the embedded message.
In addition, this paper also uses a perceptual color distortionmodel which is used to determine the optimum modulationvalues for a given detection error probability.
Experiments illustrate the applicability of method and thesuperior performance of the use of color over simple TLM.
REFERENCES
[1] F. Deguillaume, S. Voloshynovskiy and T. Pun, “Character and vectorgraphics watermark for structured electronic documents security,” USPatent Application10/949,318, September 27 2004.
[2] R. Vıllan, S. Voloshynovskiy, O. Koval, J. Vila, E. Topak, F. Deguillaume,Y. Rytsar and T. Pun, “Text data-hiding for digital and printed documents:theoretical and practical considerations” inProc. of SPIE, Elect. Imaging,USA, 2006.
[3] P. V. Borges and J. Mayer, “Text luminance modulation forhardcopywatermarking”Signal Processing, Volume 87, Issue 7, 2007.
[4] P. Borges, J. Mayer and E. Izquierdo, “Document image processingfor paper side communications,”submitted to IEEE Transactions onMultimedia, March, 2007.
[5] J.T. Brassil, S. Low, N.F. Maxemchuk, Copyright protection for theelectronic distribution of text documents, Proc. of IEEE, Volume 87, No.7, pp. 1181-1196, July 1999.
[6] D. Huang and H. Yan, Interword distance changes represented by sinewaves for watermarking text images, IEEE Trans. on Circuitsand Systemsfor Video Technology, Volume 11, No. 12, pp. 1237-1245, Dec.2001.
[7] R. O. Duda, P.E. Hart, D. G. Stork,Pattern Classification, 2nd. Edition,John Wiley, 2001.
IEEE TRANSACTIONS ON MULTIMEDIA 11
[8] International Commission on Illumination (CIE) inRecommendationson uniform color spaces, color diference equations, psychometric colorterms,Publication CIE 15 (E.-1.3.1), Supplement No.2, Bureau Centralde la CIE, Vienna, 1971.
[9] F.A. Baqai, J.H. Lee, A.U. Agar and Jan P. Allebach, “Digital colorhalftoning,” IEEE Signal Processing Magazine, Volume 22, Issue 1,January 2005 Pages:87 - 96.
[10] R. Villan, S. Voloshynovskiy, O. Koval, F. Deguillaumeand T. Pun,“Tamper-proofing of electronic and printed text documents via robusthashing and data-hiding,”in Proceedings of SPIE-IST Electronic Imaging2007, Security, Steganography, and Watermarking of Multimedia ContentsIX, San Jose, USA, 2007.
[11] Paulo Vinicius K. Borges, Joceli Mayer and Ebroul Izquierdo, “Perfor-mance analysis of text halftone modulation,” inProc. of IEEE Interna-tional Conference on Image Processing, ICIP ’07, San Antonio, USA,September 2007.
[12] J.B. Mulligan, “Digital halftoning methods for selectively partitioningerror into achromatic and chromatic channels,”Proc. SPIE, vol. 1249,pp.261-270, 1990.
[13] Paulo V. K. Borges and Joceli Mayer, “Improving robustness in printedside communications using higher order statistics,”IEEE Int’l Conf. onAcoustics, Speech and Signal Processing, ICASSP 07, Honolulu, Hawaii,April 2007.
[14] R.C.Gonzalez and R.E.Woods.Digital Image Processing. Addison-Wesley, 1992.
[15] R. Bala, “Device characterization,” Chapter 5 inDigital Color ImagingHandbook, CRC Press, 2003.
[16] A. Glassner “Inside Moire Patterns,” inIEEE Computer Graphics andApplicationsVolume 17, Issue 6, Nov.-Dec. 1997 Page(s):97 - 101.
[17] N. D. Quintela and F. Perez-Gonzalez. “Visible encryption: Using paperas a secure channel.” InProc. of SPIE, USA, 2003.
[18] Renato Vıllan, Sviatoslav Voloshynovskiy, Oleksiy Koval, and ThierryPun, “Multilevel 2D bar codes: towards high capacity storage modules formultimedia security and management,” inProceedings of SPIE PhotonicsWest, Electronic Imaging 2005, Security, Steganography, and Watermark-ing of Multimedia Contents VII (EI120), San Jose, USA, January 16-202005.
[19] Paulo Vinicius K. Borges and Joceli Mayer, “Document watermarkingvia character luminance modulation,” inProc. of IEEE InternationalConference on Acoustics, Speech and Signal Processing, ICASSP ’06,Toulouse, France, May 2006.
[20] Peter Lennie, “Color vision: putting it together,”Current Biology, vol.10, no. 16, 2000.
[21] Gerhard C.Langelaar, Iwan Setyawan and Reginald L. Lagendijk,“Watermarking digital image and video data”,IEEE Signal ProcessingMagazine, vol. 17, no. 5, pp. 20-46, 2000.
[22] X. Zhang, J. E. Farrell and B. A. Wandell, “Applicationsof a spatialextension to CIELAB”,Proceedings of the SPIE, 1997.
[23] Mojsilovic, A., Hu, J., Safranek, R.J. “Perceptually based color texturefeatures and metrics for image retrieval”Proc. IEEE International Con-ference on Image Processing, Volume 3, 24-28 Oct. 1999.
[24] Xuemei Zhang and Brian A. Wandell, “Color image fidelitymetricsevaluated using image distortion maps,”Signal Processing, Volume 70,Issue 3, 30 November 1998, Pages 201-214.
[25] Nicolaas Prins and Frederick A. A. Kingdom, “Detectionand discrim-ination of texture modulations defined by orientation, spatial frequency,and contrast”,Journal of the Optical Society of America, Vol. 20, Issue3, pp. 401-410, 2003.
[26] A.C. Bovik, “Basic tools for image Fourier analysis,” in The Handbookof Image and Video Processing, New York: Academic Press, April 2000.
[27] M. Haley and B. S. Manjunath, “Rotation-invariant texture classificationusing a complete space-frequency model”,IEEE Transactions on ImageProcessing, vol. 8, no. 2, pp. 255-269, Feb. 1999.
[28] M. C. Davey and D.J.C. MacKay, “Reliable communicationover chan-nels with insertions, deletions, and substitutions”,IEEE Transactions onInformation Theory, Vol. 47, 2001.
[29] H. Tamura, S. Mori, and T. Yamawaki, “Texture features correspondingto visual perception,”IEEE Transactions on Systems, Man, and Cyber-netics, vol. SMC-8, no. 6, 1978, 460 - 473.
[30] F. Liu and R. W. Picard, “Periodicity, directionality,and randomness:Wold features for image modeling and retrieval,”IEEE Transactions onPattern Analysis and Machine Intelligence, vol. 18, no. 7, 1996, 722 -733.
[31] D. Manolakis, V. Ingle, S. KogonStatistical and Adaptive SignalProcessing, McGraw-Hill, 2000.
Related Documents