295 Ecological Monographs, 75(3), 2005, pp. 295–315 q 2005 by the Ecological Society of America LANDSCAPE PALEOECOLOGY AND MEGAFAUNAL EXTINCTION IN SOUTHEASTERN NEW YORK STATE GUY S. ROBINSON, 1,4 LIDA PIGOTT BURNEY, 2 AND DAVID A. BURNEY 3 1 Department of Natural Sciences, Fordham College at Lincoln Center, 113 West 60th Street, New York, New York 10023 USA 2 The Louis Calder Biological Station, Fordham University, P.O. Box K, Armonk, New York 10504 USA 3 Department of Biological Sciences, Fordham University, 441 East Fordham Road, Bronx, New York 10458 USA Abstract. Stratigraphic palynological analyses of four late Quaternary deposits com- prise a landscape-level study of the patterns and processes of megafaunal extinction in southeastern New York State. Distinctive spores of the dung fungus Sporormiella are used as a proxy for megafaunal biomass, and charcoal particle analysis as a proxy for fire history. A decline in spore values at all sites is closely followed by a stratigraphic charcoal rise. It is inferred that the regional collapse of a megaherbivory regime was followed by landscape transformation by humans. Correlation with the pollen stratigraphy indicates these devel- opments began many centuries in advance of the Younger Dryas climatic reversal at the end of the Pleistocene. However, throughout the region, the latest bone collagen dates for Mammut are considerably later, suggesting that megaherbivores lasted until the beginning of the Younger Dryas, well after initial population collapse. This evidence is consistent with the interpretation that rapid overkill on the part of humans initiated the extinction process. Landscape transformation and climate change then may have contributed to a cascade of effects that culminated in the demise of all the largest members of North America’s mammal fauna. Key words: dung fungi; extinctions; fire history; human impacts; mastodons; megafauna; mi- croscopic charcoal; paleoecology; palynology; pollen; Sporormiella; Younger Dryas. INTRODUCTION Disagreement prevails over what drove the late Pleis- tocene extinctions in North America (Martin and Stead- man 1999, Grayson and Meltzer 2003). In spite of clear associations between an expanding paleolithic (Clovis) culture and the extinct mammal fauna, more conclusive evidence for overkill is lacking. Although the geo- chemical record indicates that both developments co- incide with rapid climate swings, particularly in the North Atlantic at ca. 11 000 radiocarbon years before present ( 14 C yr BP) (Alley et al. 2003), the order of events has been blurred by fluctuating levels of at- mospheric 14 C. The latter resulted in ‘‘plateaus’’ and ‘‘cliffs’’ in the radiocarbon calibration curve (Fiedel 1999). However, the North American episode is but one of several pulses of extinction worldwide, first taking large vertebrates (megafauna) on continental land- masses late in the Pleistocene and proceeding with is- land losses for the next 10 millennia. This later phase encompasses historic time, now affecting medium and small vertebrates. Each of these episodes of extinction has occurred in step with initial dispersal of anatomi- Manuscript received 21 July 2003; revised 28 September 2004; accepted 18 October 2005; final version received 7 January 2005. Corresponding Editor: C. C. Labandeira. 4 E-mail: [email protected] cally modern humans out of Africa (Martin and Stead- man 1999). Absolute dates at least broadly constrain the above North American timeline, which may be resolved by analyzing microfossil stratigraphies at a landscape lev- el. On a local scale, rates and geographic patterns of faunal extirpation and cultural activity then can be con- sidered in light of proposed causes of megafaunal ex- tinction, as outlined in Table 1 (also see Appendix). Simpson (1953) noted that when a novel invader rapidly drives another species to extinction by com- petition, chances are against finding the two forms at the same stratigraphic level. Furthermore, rare taxa tend to ‘‘disappear’’ from the fossil record before the time of actual extinction (Signor and Lipps 1982). Con- versely, human remains and artifacts, which similarly may be rare initially, would not be expected to ‘‘ap- pear’’ until some time after actual human arrival. We have used, therefore, proxy measures that may be more sensitive to these factors than the conventional fossil and archaeological record alone. As well as contributing to a reconstruction of veg- etational and environmental patterns, stratigraphic pol- len studies here include spore counts of the dung fun- gus, Sporormiella as a measure of large herbivore bio- mass. Sporormiella spore percentages have been found to rise following the introduction of grazing animals in historic times. Spores are usually abundant in Pleis- tocene sediments but scarce or absent for most Holo-

Welcome message from author
This document is posted to help you gain knowledge. Please leave a comment to let me know what you think about it! Share it to your friends and learn new things together.
Transcript
295
Ecological Monographs, 75(3), 2005, pp. 295–315q 2005 by the Ecological Society of America
LANDSCAPE PALEOECOLOGY AND MEGAFAUNAL EXTINCTION INSOUTHEASTERN NEW YORK STATE
GUY S. ROBINSON,1,4 LIDA PIGOTT BURNEY,2 AND DAVID A. BURNEY3
1Department of Natural Sciences, Fordham College at Lincoln Center, 113 West 60th Street, New York,New York 10023 USA
2The Louis Calder Biological Station, Fordham University, P.O. Box K, Armonk, New York 10504 USA3Department of Biological Sciences, Fordham University, 441 East Fordham Road, Bronx, New York 10458 USA
Abstract. Stratigraphic palynological analyses of four late Quaternary deposits com-prise a landscape-level study of the patterns and processes of megafaunal extinction insoutheastern New York State. Distinctive spores of the dung fungus Sporormiella are usedas a proxy for megafaunal biomass, and charcoal particle analysis as a proxy for fire history.A decline in spore values at all sites is closely followed by a stratigraphic charcoal rise.It is inferred that the regional collapse of a megaherbivory regime was followed by landscapetransformation by humans. Correlation with the pollen stratigraphy indicates these devel-opments began many centuries in advance of the Younger Dryas climatic reversal at theend of the Pleistocene. However, throughout the region, the latest bone collagen dates forMammut are considerably later, suggesting that megaherbivores lasted until the beginningof the Younger Dryas, well after initial population collapse. This evidence is consistentwith the interpretation that rapid overkill on the part of humans initiated the extinctionprocess. Landscape transformation and climate change then may have contributed to acascade of effects that culminated in the demise of all the largest members of NorthAmerica’s mammal fauna.
Key words: dung fungi; extinctions; fire history; human impacts; mastodons; megafauna; mi-croscopic charcoal; paleoecology; palynology; pollen; Sporormiella; Younger Dryas.
INTRODUCTION
Disagreement prevails over what drove the late Pleis-tocene extinctions in North America (Martin and Stead-man 1999, Grayson and Meltzer 2003). In spite of clearassociations between an expanding paleolithic (Clovis)culture and the extinct mammal fauna, more conclusiveevidence for overkill is lacking. Although the geo-chemical record indicates that both developments co-incide with rapid climate swings, particularly in theNorth Atlantic at ca. 11 000 radiocarbon years beforepresent (14C yr BP) (Alley et al. 2003), the order ofevents has been blurred by fluctuating levels of at-mospheric 14C. The latter resulted in ‘‘plateaus’’ and‘‘cliffs’’ in the radiocarbon calibration curve (Fiedel1999).
However, the North American episode is but one ofseveral pulses of extinction worldwide, first takinglarge vertebrates (megafauna) on continental land-masses late in the Pleistocene and proceeding with is-land losses for the next 10 millennia. This later phaseencompasses historic time, now affecting medium andsmall vertebrates. Each of these episodes of extinctionhas occurred in step with initial dispersal of anatomi-
Manuscript received 21 July 2003; revised 28 September2004; accepted 18 October 2005; final version received 7 January2005. Corresponding Editor: C. C. Labandeira.
4 E-mail: [email protected]
cally modern humans out of Africa (Martin and Stead-man 1999).
Absolute dates at least broadly constrain the aboveNorth American timeline, which may be resolved byanalyzing microfossil stratigraphies at a landscape lev-el. On a local scale, rates and geographic patterns offaunal extirpation and cultural activity then can be con-sidered in light of proposed causes of megafaunal ex-tinction, as outlined in Table 1 (also see Appendix).
Simpson (1953) noted that when a novel invaderrapidly drives another species to extinction by com-petition, chances are against finding the two forms atthe same stratigraphic level. Furthermore, rare taxatend to ‘‘disappear’’ from the fossil record before thetime of actual extinction (Signor and Lipps 1982). Con-versely, human remains and artifacts, which similarlymay be rare initially, would not be expected to ‘‘ap-pear’’ until some time after actual human arrival. Wehave used, therefore, proxy measures that may be moresensitive to these factors than the conventional fossiland archaeological record alone.
As well as contributing to a reconstruction of veg-etational and environmental patterns, stratigraphic pol-len studies here include spore counts of the dung fun-gus, Sporormiella as a measure of large herbivore bio-mass. Sporormiella spore percentages have been foundto rise following the introduction of grazing animalsin historic times. Spores are usually abundant in Pleis-tocene sediments but scarce or absent for most Holo-
296 GUY S. ROBINSON ET AL. Ecological MonographsVol. 75, No. 3
TABLE 1. Proposed causes of megafaunal extinction in North America.
Hypoth-esis Type Source Rate Pattern Process Comments
H1 climate change Graham andLundelius(1984), Guth-rie (1984)
slow? A mosaic vegetationpattern becomeszonal; extinctionsfollow climategradient.
Climate changeleads to lesshospitable en-vironments forcertain largespecies thatfail to adapt.
H2 environmentalinsularity
King and Saun-ders (1984)
slow? Extinction followsas boreal forestrecedes north-wards.
Rapid expansionof deciduousforest reducesavailable habi-tat.
Applies only toextinction ofAmerican mas-todon
H3 rapid climatechange: theYounger Dryas
Berger (1991) rapid Follows YoungerDryas onset at ea.11 000 14C yr BP
As H1, butchange is moredrastic and de-velops rapidly.
H4 blitzkrieg, orrapid overkill
Martin (1984) rapid A wave proceedsthrough a region.
Naıve fauna rap-idly hunted toextinction.
H5 protracted over-kill
Whittington andDyke (1984),Fisher (1997)
slow Slow wave, or mo-saic pattern ofmegafaunal col-lapse
Initially naıvefauna; overex-ploitationeventuallycauses col-lapse.
H6 predator pit Janzen (1983) rapid Wave through a re-gion
Humans and na-tive predatorseach contrib-ute to col-lapse.
H7 second-orderpredation
Whitney-Smith(2001)
moder-atelyrapid
Pulsed Interactions be-tween humans,carnivores,herbivores,and vegeta-tion.
H8 three-stage over-kill
Alroy (2001) rapid Pulsed Overkill suffi-cient to ex-plain pattern.
H9 clovis agedrought
Haynes (1991) rapid Severe but tempo-rary vegetationchange followinghuman arrival, atea. 11 000 14C yrBP
Aridification,rapidly ampli-fying preda-tion by hu-mans.
H10 hypervirulentdisease
MacPhee andMarx (1997)
very rapid Panzootic diseasepattern
Infectious dis-ease withtrans-genericvirulence.
H11 keystone mega-herbivores
Owen-Smith(1987), Zimovet al. (1995),Schule (1990)
not speci-fied
Landscape transfor-mation and firefollow megafau-nal collapse.
Megaherbivores,which main-tain open for-est, are re-moved by hu-mans or dis-ease.
Fire regimechanges asforests closeand fuel loadsrise (Schule1990)
H12 great fire Humbert (1927),Miller et al.(1999)
rapid Simultaneousthroughout largeregions
Landscape trans-formation byanthropogenicfire. Extirpa-tion followsloss of forage.
Proposed forMadagascar;applicable toNorth America
H13 synergy Burney (1993a,b, 1999), Dia-mond (1984)
slow Mosaic pattern ofextinctions
Human and natu-ral causes in-teract.
August 2005 297MEGAFAUNAL EXTINCTION IN NEW YORK
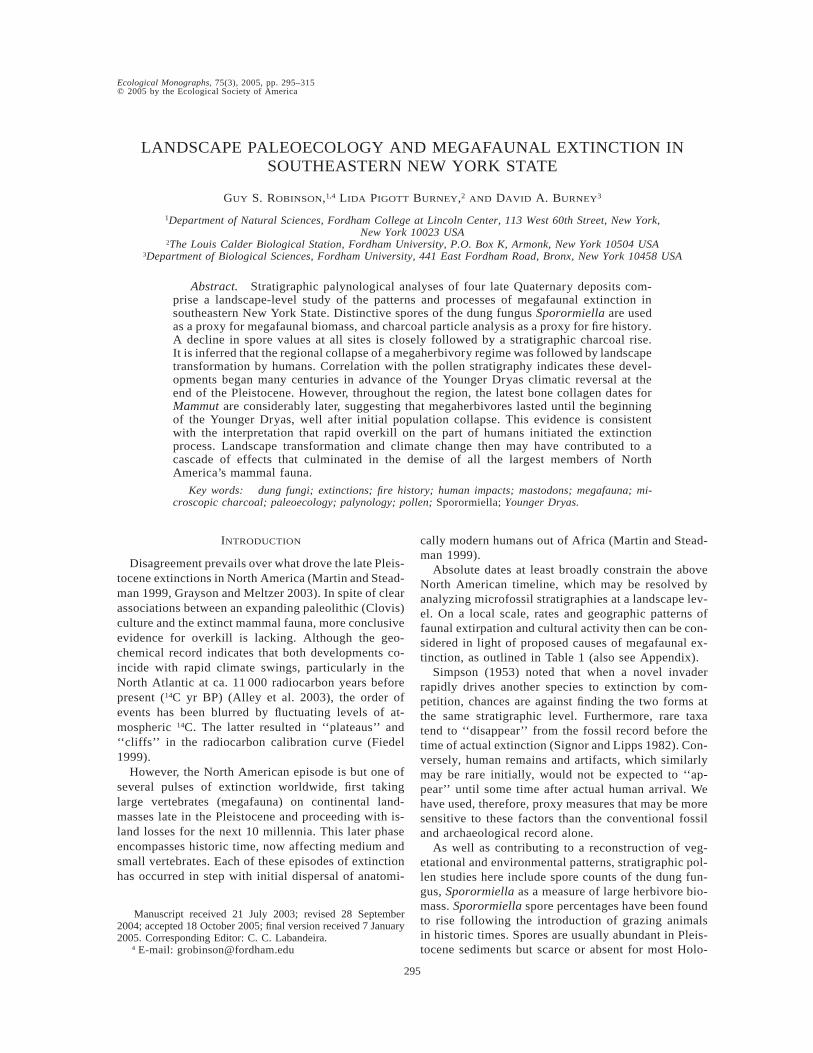
FIG. 1. Location of sites in southeastern New York State,USA.
cene samples (Davis 1975, 1987, Davis and Shafer2002). High percentages of Sporormiella on mammothdung have tied this coprophilous fungus to the extinctmegafauna (Davis et al. 1984), and although sporesmay be found on the dung of rabbits and small rodents,elevated values in modern sediments appear to be ex-clusively associated with a high density of large her-bivores (Davis 1987, Burney et al. 2003).
Stratigraphic charcoal studies as a measure of re-gional fire occurrence may also detect the onset of cul-tural activity in a variety of geographic contexts (Bur-ney 1997). Such work has traced early landscape trans-formation by humans on landmasses bordering thenorth Atlantic, northern Europe, Australia, SouthAmerica, Madagascar, and oceanic islands of the Pa-cific and Caribbean (Singh et al. 1981, Burney 1987,Burney et al. 1994, 1995, Athens 1997, and referencesin Grayson 2001). The onset of anthropogenic confla-gration often can be distinguished from natural trendsin burning: a sharp peak in microscopic charcoal valuesof at least an order of magnitude is typically followedby one to two millennia of lower concentrations thatare nevertheless considerably above background levels.For reasons outlined above, such palynological markerstend to put human activity centuries or sometimes mil-lennia earlier than direct archaeological evidence.
This study examines fossil records from the upperWallkill Valley and the Hudson Lowlands of southernNew York State (Fig. 1), an area covered by the Lau-rentide ice sheet at Last Glacial Maximum. Sedimentdates from near the terminal moraine, at least 45 kmfurther south, suggest that deglaciation was well un-derway by 18 750 14C yr BP (Muller and Calkin 1993).Terrestrial and meltwater drainage northward becameimpounded by the retreating glacier, forming a suc-cession of periglacial lakes in the Wallkill Valley of upto 90 km2 in area, eventually draining into Glacial LakeAlbany (Connally et al. 1989), which would have in-undated the Hudson Lowlands during its earliest stages(Dineen 1986). It has been estimated that the glacialmargin receded into the upper Hudson Valley by 13 00014C yr BP, (Connally and Sirkin 1973) but a review ofavailable age data suggests the deglacial chronology inNew York is still not tightly constrained (Muller andCalkin 1993). Isostatic rebound eventually led to thesouthward drainage of Lake Albany into the Atlantic,but the Wallkill River continues to flow north and muchof its upper reaches are surrounded by extensive muck-lands. Proximity to the melting glacier has meant thatsedimentary basins of this region had a high rate ofsediment accumulation encompassing the presumed‘‘extinction window.’’
METHODS
Fossils of extinct Pleistocene megafauna were re-covered from well-stratified subphreatic sites at Otis-ville, Hyde Park, and Pawelski Farm (Fig. 1 and Table2). A medium-sized lake, Binnewater Pond, while not
known to be a megafaunal site, has a long sedimentaryrecord with good temporal resolution.
Each of the megafaunal sites was examined throughcores and worked as an open excavation (Table 2). Acone of depression in the water table was maintainedwith a gasoline-powered pump while work was under-way (Burney et al. 2001). Sediment sequences weredescribed and samples removed directly from a cleanedvertical face of the excavation trench. An open-sidedbucket auger sampled below the level of open exca-vation, allowing for descriptions of sediments and sub-sampling in the field. Lake sediments were recoveredwith a 5 cm diameter modified Livingstone piston corer.
In the laboratory, separate subsamples were takenfor pollen/charcoal processing, loss-on-ignition (LOI)determinations using the Dean method (Dean 1974),and 14C dating. Pollen/charcoal subsamples were storedin vials under refrigeration; 14C samples were oven-dried and stored in airtight containers at room tem-perature.
Pollen processing followed standard methods (Faegriet al. 1989); digests were suspended in glycerol forpermanent liquid slide mounts. At least 400 grains oftree and shrub pollen were counted per sample using

298 GUY S. ROBINSON ET AL. Ecological MonographsVol. 75, No. 3
TABLE 2. Characteristics of New York State sites.
Site General locationLatitude,longitude
Elevation(m)
Type offeature
Megafaunalremains
Samplingmethod
Pawelski Farm Wallkill Valley‘‘Black Dirt’’
418209020 N,748259450 W
122 large wetland Cervalcesscotti
excavationand bucketauger
Binnewater Pond Wallkill Valley 418249360 N,748339070 W
256 lake piston core
Otisville Wallkill Valley 418289230 N,748319100 W
230 small wetland Mammutamerican-um
excavationand bucketauger
Hyde Park Mid-Hudson Val-ley: HudsonLowlands
418469480 N,738539380 W
74 wetland Mammutamerican-um
excavationand bucketauger
4003 magnification; a 10003 (oil immersion) lens wasemployed for difficult determinations.
Unless otherwise noted, pollen zones have been as-signed using stratigraphically constrained cluster anal-ysis (CONISS) on the square-root transformed data,using Edwards and Cavalli-Sforza’s chord distance.Only taxa comprising at least 5% of the upland pollensum in at least one sample have been included in thecluster analysis. Sporormiella spore counts are pre-sented as a percentage of the combined aquatic andupland pollen sum.
Samples for charcoal analysis were treated using amodification of the Winkler nitric acid process (Wink-ler 1985) to remove pyrite. Resulting digests werewashed through 250-mm sieves to remove macrofossilsand macroscopic charcoal before hydrogen fluoridetreatment. Calibrated tablets of Lycopodium sporeswere added before the final residues and were sus-pended in glycerine jelly for permanent slide mounts.
Charcoal residues were counted at 4003 magnifi-cation using an eyepiece reticule so as to measure thetwo-dimensional projected area of individual frag-ments, reported as mm2/cm3. Morphology and textureof microscopic charcoal fragments are reported here aseither graminoid (derived from cuticles of grasses andsedges) or amorphous (from woody and broadleaf planttypes; Goldberg 1986, Burney 1987). Particles whosesmallest dimension exceeded 250 mm are recorded asnumber of particles/cm3.
Absolute dates
To construct a chronology of latest occurrences, ra-diocarbon dates have been obtained on megafaunal re-mains excavated from these sites (Table 2) or alter-natively from museum specimens of the same region.Plant macrofossils or sediment samples were dated tohelp establish the stratigraphic chronology in cores andexcavations.
RESULTS
Binnewater pond
Sediment description.—A dark greenish-gray humicsilty clay (Munsell color 10Y 4/1) forming the lower
unit contains abundant algal and humic material. Agradual contact at about 11.2 m forms the lower bound-ary of a nearly uniform black gyttja (Munsell color 5Y2.5/2) that continues to the sediment-water interface.The subsampled face of the core revealed close lami-nations in the lower unit that were most apparent inthe samples dried for 14C dating. Plant macrofossils arevery sparse, but pollen is abundant, with excellent pres-ervation throughout the sequence.
Pollen stratigraphy.—
1. Zone I.—Pinus (pine) and Picea (spruce), in thatorder, dominate the pollen spectrum (Fig. 2). Pollen ofbroadleaf taxa is less important, but Alnus (alder) risesto 8%, while Salix (willow) and Quercus (oak) eachattain 5%. Cyperaceae (sedges) are relatively abundant,up to 15% of the total. Artemisia (sage), Thalictrum(meadow rue), and Poaceae (grasses) each attain almost5%. The date of 22 850 6 90 14C yr BP (all values arereported as mean 6 SD) is on sediment which is not abasal sample and thus does not necessarily mark thelower strata of Zone I.
2. Zone II.—A steady rise and peak in Picea replacesPinus as the dominant taxon just before the middle ofthis interval. However, by the upper boundary, Pinussteadily recovered, once again outnumbering Picea,whose values dropped below 10%. Abies (fir) and Betula(birch) rise rapidly to peak at over 10% and 13% re-spectively. Quercus shows a rise and decline, peakingmid-zone at 15%. Herbaceous taxa become less impor-tant toward the upper part of the zone. Five internallyconsistent radiocarbon dates within Zone II range from13 210 6 90 to 11 494 6 91 (Table 3 and Fig. 2).
3. Zone III.—Pinus shows a decrease, while P. stro-bus (white pine) appears fairly abruptly at the bottomof the zone, beginning a continuous regional presencelasting for thousands of years. Picea recovers and re-mains at about 15% before declining sharply to zeroat the top. Abies peaks and also drops to zero at thetop while Quercus declines to below 5%. Alnus andBetula rise rapidly to 25% and .30% respectivelyacross Zone III before declining abruptly at the top.

August 2005 299MEGAFAUNAL EXTINCTION IN NEW YORK
FIG. 2. Diagram showing percentage of the total pollen and spores at each depth for major pollen and spore types forBinnewater Pond, New York, USA. Cluster analysis used is constrained incremental sum of squares (CONISS).
4. Zone IVa.—A sediment date of 8900 6 50 14C yrBP marks the bottom of this unit. Zone IVa thus ischaracterized by the rapid rise of thermophilous spe-cies, particularly Quercus which jumps to .60%, alevel maintained more or less until the present. Betulaand Alnus remain at low levels through the entire zone.Pinus remains ,10%, dropping ,5% at the top. Ulmus(elm) appears, maintaining a steady 3–4% through thelate Holocene. A slight rise in Pinus strobus pollenoccurs at the top of Zone III.
5. Zone IVb.—first Fagus (beech) and then Carya(hickory) become important.Tsuga (hemlock) declinesto less than 1%.
6. Zone IVc.—Tsuga remains at ,1% throughout,and appears to be replaced principally by Pinus strobus.Castanea (chestnut), occasionally present in low num-bers since Zones I and II, becomes an important com-ponent of the assemblage toward the top of Zone IVc.Cyperaceae (sedges) reach values not seen since thelate Pleistocene.
300 GUY S. ROBINSON ET AL. Ecological MonographsVol. 75, No. 3
TABLE 3. Radiometric dates.
Lab no.Site/
source14C yr
BP 6 SD†
Calibratedcalendarage at 2s Material Pretreatments Method d13C
Stratigraphicprovenance
(cm)
b 71069 Otisville 11 640 6 60 13 850–13 420 wood(stems)
acid andalkali
AMS‡ 227.8 75–85
b 71070 Otisville 12 340 6 70 15 410–14 100 wood(stems)
acid andalkali
b-decay 226 115–125
b 71071 Otisville 11 970 6 70 15 100–13 650 wood(stems)
acid andalkali
b-decay 227.2 135–145
b 153148 Otisville 14 300 6 50 17 480–16 800 sediment acid andalkali
AMS 226.5 461–501
b 157491 BinnewaterPond
8900 6 50 10 190–9880 sediment acid andalkali
AMS 230 1004.5–1005.5
AA45688 BinnewaterPond
11 494 6 91 13 830–13 150 sediment acid andalkali
AMS 228.6 1073.5–1074.5
AA45687 BinnewaterPond
11 654 6 83 14 000–13 330 sediment acid andalkali
AMS 228.5 1085.5–1086.5
AA45685 BinnewaterPond
12 283 6 83 15 390–13 860 sediment acid andalkali
AMS 229 1095–1096
AA45686 BinnewaterPond
12 526 6 94 15 560–14 150 sediment acid andalkali
AMS 229.6 1105–1106
b 157492 BinnewaterPond
13 210 6 90 16 380–15 370 sediment acid andalkali
AMS 229.4 1125–1126
b 153148 BinnewaterPond
22 870 6 90 NA§ sediment acid andalkali
AMS 226 1255–1256
b 141061 PawelskiFarm
12 180 6 60 15 285–13 845 bone (pha-lanx)
collagenextractionwith alkali
AMS 220.0 160–200
AA45690 PawelskiFarm
11 212 6 79 13 450–12 990 sediment acid andalkali
AMS 223.5 129.5–130.5
AA45689 PawelskiFarm
13 083 6 86 16 210–15 080 sediment acid andalkali
AMS 223.2 154.5–155.5
b 135234 Hyde Park 11 480 6 60 13 805–13 165 toothenamel(tusk)
collagenextractionwith alkali
AMS 222.7
AA46612 Hyde Park 12 484 6 64 15 490–14 150 sediment acid andalkali
AMS 226.6 9.5–10.5
AA46613 Hyde Park 13 280 6 75 16 430–15 540 sediment acid andalkali
AMS 226.5 34.5–35.5
NZA12584 Temple Hill(NY StateMuseum# V100)
11 000 6 80 13 173–12 661 bone(scapu-la)
collagenextractionand gelati-nization
AMS 221.3
† Radiocarbon years before present (where present is 1950), corrected for isotopic fractionation.‡ Accelerator mass spectrometry.§ Not applicable because the date is beyond the range for calibration to calendar years.
7. Zone IVd.—Tsuga makes a gradual recovery toearly Holocene levels by mid-zone, but is not as strong-ly represented as in the mid-Holocene. Castanea con-tinues to rise, along with Fagus and Betula, all of whichpeak at ;12% in the lower part of this zone, partiallyreplacing Quercus, which falls to 30% for the first timesince the late glacial. By mid-zone, Quercus has re-turned to .40%.
8. Zone V.—A rapid rise in Poaceae from near zeroto 10% and the first appearance of ruderal species suchas Plantago (plantain) mark the lower boundary of thiszone. Monolete spores also show a steep rise, as doesAmbrosia (ragweed). The percentage of all tree pollendeclined relative to upper Zone IVd. Quercus drops to20% and is paralleled by decreases in Fagus, Carya,Tsuga, and Pinus strobus. The only tree species to ex-hibit an increase from Zone IVd is Betula.
Sporormiella.—Spores of the dung fungus Sporor-miella spp. maintain high values, at 3–5% (Davis 1987)throughout Zone I (Fig. 3). A steep decline begins atthe bottom of Zone II, dropping to less than 0.5% bythe middle and reaching 0% at the top of this unit.Above this horizon, Sporormiella is mostly absent, oc-casionally reaching 0.5% until the late Holocene, wherein upper Zone IVd and lower Zone V, it climbs to 1%for the first time since the late Pleistocene.
Charcoal.—Throughout Zone I, graminoid charcoalis either absent or at a very low level, while othermicroscopic charcoal concentrations average below 23 106 mm2/cm 3 (see Fig. 3). Graminoid charcoal in-creases to 5 3 106 mm2/cm3 at the bottom of Zone II,amorphous charcoal to 15 3 106 mm2/cm3 and totalcharcoal reaches 20 3 106 mm2/cm3, an order of mag-nitude rise overall. The subsequent pattern of charcoal

August 2005 301MEGAFAUNAL EXTINCTION IN NEW YORK
FIG. 3. Sporormiella and charcoal for Binnewater Pond. Spore values are expressed as a percentage of pollen sum (uplandplus aquatic). Microscopic charcoal is expressed as projected area on slide per volume of sediment. Macroscopic charcoal(.250 mm) is expressed as number of particles (n) per volume of sediment.
concentrations is erratic for the lower half of Zone II,averaging 10 3 106 mm2/cm3 until mid-zone, when itrises abruptly again to 75 3 106 mm2/cm3. Amorphouscharcoal rises earliest, followed closely by graminoidcharcoal. By the upper part of Zone II and throughoutZone III, total charcoal settles to a steady level of about10 3 106 mm2/cm3, with the graminoid fraction con-
tributing somewhat less than 50%. The lower boundaryof Zone IVa is marked by a rise of total microscopiccharcoal to .20 3 106 mm2/cm3, a pattern that char-acterizes the remainder of Zone IV, with graminoidcharcoal often contributing .50% of the total. In ZoneV, total charcoal falls to values not recorded since ZoneI and lower Zone II.
302 GUY S. ROBINSON ET AL. Ecological MonographsVol. 75, No. 3
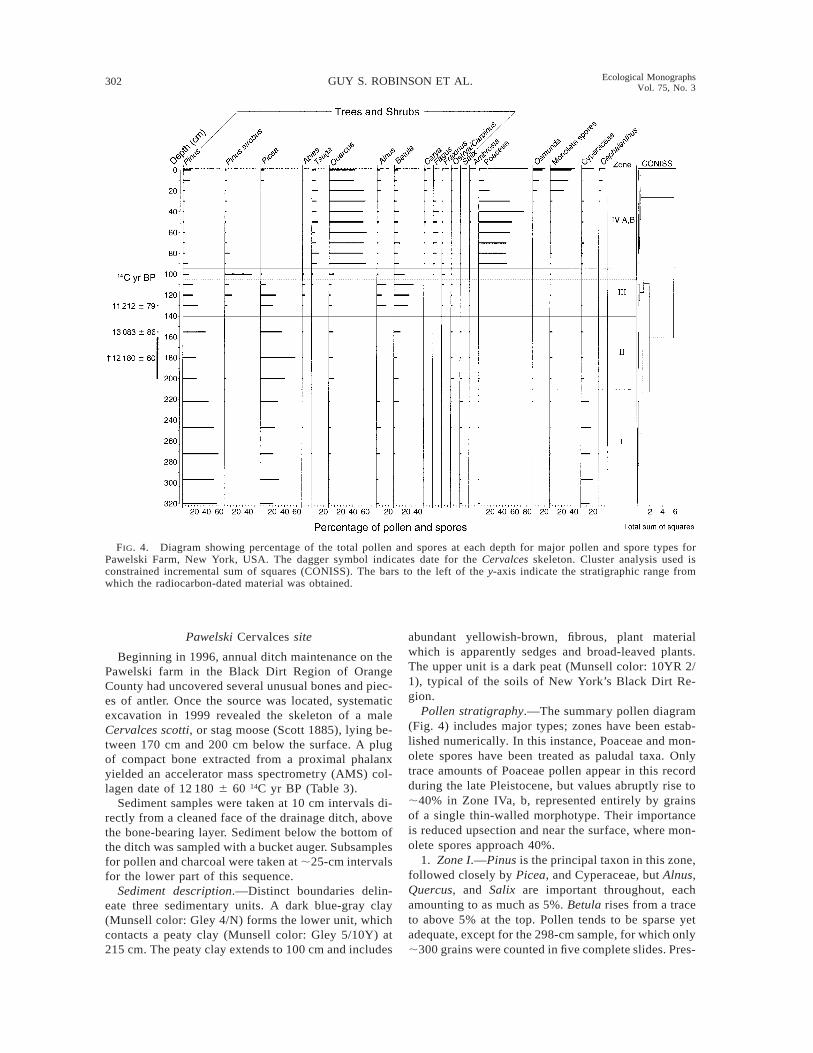
FIG. 4. Diagram showing percentage of the total pollen and spores at each depth for major pollen and spore types forPawelski Farm, New York, USA. The dagger symbol indicates date for the Cervalces skeleton. Cluster analysis used isconstrained incremental sum of squares (CONISS). The bars to the left of the y-axis indicate the stratigraphic range fromwhich the radiocarbon-dated material was obtained.
Pawelski Cervalces site
Beginning in 1996, annual ditch maintenance on thePawelski farm in the Black Dirt Region of OrangeCounty had uncovered several unusual bones and piec-es of antler. Once the source was located, systematicexcavation in 1999 revealed the skeleton of a maleCervalces scotti, or stag moose (Scott 1885), lying be-tween 170 cm and 200 cm below the surface. A plugof compact bone extracted from a proximal phalanxyielded an accelerator mass spectrometry (AMS) col-lagen date of 12 180 6 60 14C yr BP (Table 3).
Sediment samples were taken at 10 cm intervals di-rectly from a cleaned face of the drainage ditch, abovethe bone-bearing layer. Sediment below the bottom ofthe ditch was sampled with a bucket auger. Subsamplesfor pollen and charcoal were taken at ;25-cm intervalsfor the lower part of this sequence.
Sediment description.—Distinct boundaries delin-eate three sedimentary units. A dark blue-gray clay(Munsell color: Gley 4/N) forms the lower unit, whichcontacts a peaty clay (Munsell color: Gley 5/10Y) at215 cm. The peaty clay extends to 100 cm and includes
abundant yellowish-brown, fibrous, plant materialwhich is apparently sedges and broad-leaved plants.The upper unit is a dark peat (Munsell color: 10YR 2/1), typical of the soils of New York’s Black Dirt Re-gion.
Pollen stratigraphy.—The summary pollen diagram(Fig. 4) includes major types; zones have been estab-lished numerically. In this instance, Poaceae and mon-olete spores have been treated as paludal taxa. Onlytrace amounts of Poaceae pollen appear in this recordduring the late Pleistocene, but values abruptly rise to;40% in Zone IVa, b, represented entirely by grainsof a single thin-walled morphotype. Their importanceis reduced upsection and near the surface, where mon-olete spores approach 40%.
1. Zone I.—Pinus is the principal taxon in this zone,followed closely by Picea, and Cyperaceae, but Alnus,Quercus, and Salix are important throughout, eachamounting to as much as 5%. Betula rises from a traceto above 5% at the top. Pollen tends to be sparse yetadequate, except for the 298-cm sample, for which only;300 grains were counted in five complete slides. Pres-
August 2005 303MEGAFAUNAL EXTINCTION IN NEW YORK
ervation is generally good, with grains intact but fre-quently crumpled, apparently from being supported ina clay matrix.
2. Zone II.—Picea rises steadily to 55%, dominatingthe middle of this zone, but Pinus recovers toward thetop. Sedges decline to low levels early in the section;Betula and Quercus rise to ;10%. Ostrya/Carpinus(hop hornbeam and hornbeam) and monolete sporesdisplay a low but significant presence throughout. Salixhas a lesser presence than earlier, but keeps a steadysignal to the top of Zone II. A sediment date of 13 0836 86 14C yr BP came from near the top of the zone.The Cervalces skeleton was found within the bound-aries of Zone II.
3. Zone III.—Picea rises to ;25% mid-zone, butdrops to ;10%, delineating a final decline. Pinus (un-differentiated) follows the opposite pattern, decreasingsomewhat mid-zone and peaking at the top. Pinus stro-bus appears and exceeds 10% at this time, while Quer-cus declines. Alnus and Betula both rise and fall acrossthis zone and Tsuga appears in low numbers at the top.Sediment from the bottom of Zone III dates to 11 2126 79 14C yr BP.
4. Zone IVa, IVb.—Picea disappears and Quercusjumps to 60%. Tsuga rises early within the zone andremains a steady presence of ;10–12%, while Carya,Fagus, and Acer become a significant part of the spec-trum. Poaceae rises rapidly from trace amounts to;60% of the upland and aquatic total, but is replacedin the course of the upper 60 cm by monolete andOsmunda fern spores, and to a lesser degree by pollenof Cephalanthus (buttonbush), a paludal shrub. Pinusdrops below 5% by mid-zone but recovers to exceed10% within 10 cm of the surface. Pinus strobus ispresent at less than 2% throughout Zone IV, with theexception of the 80 cm sample, where it barely ex-ceeded 5%. Absent from most of Zone IV, Picea reach-es ;5% in the top two samples. Betula, which beginsto decline in Zone III, now maintains a presence ofbetween ;5% and 10% throughout Zone IV. Alnusstarts Zone IV at ;2% and does not exceed this lowlevel until the top 30 cm, where it surpasses 5%.
Sporormiella.—These spores are present throughoutZone I, reaching 3–4% of the upland and aquatic pollensum (Fig. 5). In a single sample, for which pollen wasalso sparse (see remarks on 298 cm sample, above),Sporormiella is below 1%, but otherwise is high forthe rest of this zone (;3–4%). At the boundary withZone II, spore values drop to low numbers (;0.5%)for the remainder of Zone II before disappearing at thetop. With the exception of some trace amounts ob-served at two levels toward the center of Zone IV,Sporormiella is essentially absent from the rest of thesequence.
Charcoal.—Total microscopic charcoal concentra-tions in Zone I and most of Zone II scarcely exceed 23 106 mm2/cm3. At the top of Zone II, in the 155-cmsample (sediment date:13 083 6 86 14C yr BP), a
change in the fire history is marked by a charcoal con-centration rise to over 25 3 106 m2/cm3. Above this,values then decline before rising in the middle of ZoneIII to ;8 3 106 mm2/cm3, where graminoid fragmentscontribute a little over 50%; some macroscopic char-coal also is present. Low levels then persist until thelower portion of Zone IV, where microscopic charcoalrises to 10 3 106 mm2/cm3. Very low levels mark mostof the Holocene record here before rising significantlyat 20 cm from the present surface.
Otisville
Bones of an American mastodon (Mammut ameri-canum) were uncovered in 1872 by peat diggers in asmall bog at the foot of the eastern slope of the Shaw-angunk Mountains. The Otisville mastodon skeletonnow resides at the Peabody Museum in New Haven,Connecticut. Contemporary newspaper accounts andlocal inquiries helped relocate the site east of the townof Otisville, New York (Table 2). The profile of thebasin was initially traced by transecting the bog witha series of exploratory bucket auger cores so that anappropriately deep section for excavation could be lo-cated, avoiding the area disturbed by peat mining. Sed-iment samples and plant macrofossils were collectedbased on their stratigraphic provenance. Below 1.6 mdepth, sediment sampling continued by using a bucketauger down to 5.12 m, where the auger bottomed outin a gravelly layer, presumably consisting of glacialdrift.
Sediment description.—An AMS sediment date setsa minimum time of 14 300 6 50 14C yr BP (Table 3),for onset of sedimentation at the Otisville site. A clayeybasal gravel contacts an olive gray clay unit (Munsellcolor 5Y 4/1–4/2) at 465 cm, which becomes a bitdarker and more humic as it continues upsection to 320cm (Munsell color 5Y 3/1–3/2), becoming a humic,silty clay (Munsell color 5Y 4/1–4/2) up to ;90 cm.From this level, peat forms the upper unit, and is darkgray, with clay from ;90 to 75 cm (Munsell color 2.5Y3/2). Above this, the peat becomes darker up to 45 cm(Munsell color 2.5Y 4/1–4/2). It includes more woodymaterial and less clay. From 45 cm upwards, the unitbecomes darker and less woody (Munsell color 2.5 Y2/0), changing to a dark gray woody peat (Munsellcolor 10YR 3/1) at ;25 cm below the surface.
A surface sediment sample was taken, but much ofthe upper 25 cm of the peat unit was disturbed by amass of roots and so the next sample was taken at 30cm, and at 10-cm intervals thereafter, to the bottom ofthe excavated pit. Sampling proceeded below this levelby bucket auger.
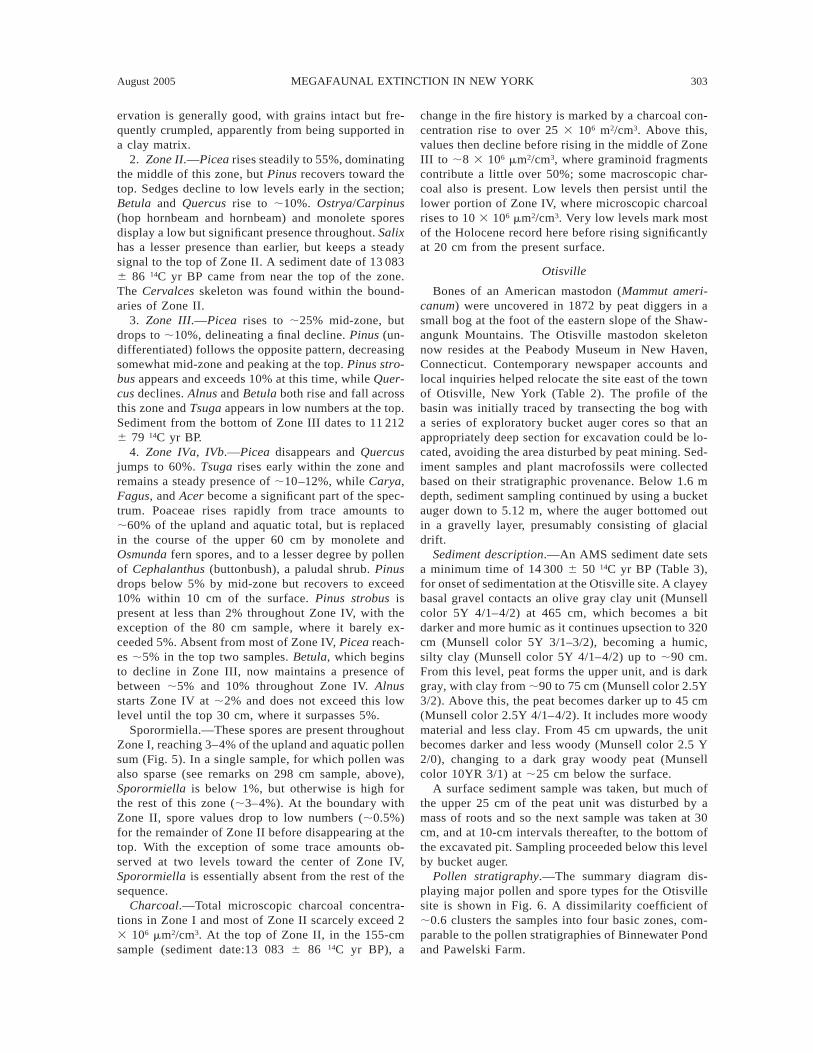
Pollen stratigraphy.—The summary diagram dis-playing major pollen and spore types for the Otisvillesite is shown in Fig. 6. A dissimilarity coefficient of;0.6 clusters the samples into four basic zones, com-parable to the pollen stratigraphies of Binnewater Pondand Pawelski Farm.

304 GUY S. ROBINSON ET AL. Ecological MonographsVol. 75, No. 3
FIG. 5. Sporormiella and charcoal for Pawelski Farm. Spore values are expressed as a percentage of pollen sum (uplandplus aquatic). Microscopic charcoal is expressed as projected area on slide per volume of sediment. Macroscopic charcoal(.250 mm) is expressed as number of particles (n) per volume of sediment. The dagger symbol indicates date for the Cervalcesskeleton. The bars to the left of the y-axis indicate the stratigraphic range from which the radiocarbon-dated material wasobtained.
In addition to the aquatic and paludal taxa that arenormally excluded from the upland pollen sum, Alnusalso is excluded from the Otisville spectra. Aldershrubs are growing abundantly on the bog surface todayand polyads of more than 60 Alnus grains are found infossil samples. Monolete spores also are excluded forsimilar reasons.
1. Zone I.—Pinus and Picea, in that order, dominatethese late-glacial pollen spectra. Toward the top, Picearises at the expense of Pinus. Broadleaf taxa includeBetula, which exceeds ;15% in the upper part of thezone. Quercus, Salix, and Poaceae each attain 8–10%.Cyperaceae often exceeds 20%. Thalictrum reaches5%, forming part of a tundra community along withArtemisia and other Asteraceae. An AMS date on a
plant macrofossil of 11 970 6 70 14C yr BP marks thetop of Zone I.
2. Zone II.—Picea continues its rise, surpassing Pi-nus. Betula rises and peaks before mid-zone, and Alnusdeclines steadily, as noted at the Binnewater and Paw-elski sites. Quercus and Poaceae form a steady ;5–8%. Salix has a similar value, but is somewhat higherat mid-zone. Abies and Pinus strobus appear. Artemisiaand Thalictrum drop to lower levels, but Poaceae andAsteraceae (high echinate types) have a presence com-parable to that of Zone I.
3. Zone III.—Pinus now dominates the assemblage,followed by Picea, which drops out abruptly at the topof this zone. Alnus reaches almost 10% and Betula,15%. Tsuga appears for the first time and Quercus re-
August 2005 305MEGAFAUNAL EXTINCTION IN NEW YORK
FIG. 6. Diagram showing percentage of the total pollen and spores at each depth for major pollen and spore types forOtisville, New York, USA. Dagger symbols indicate plant macrofossil dates. Cluster analysis used is constrained incrementalsum of squares (CONISS). The bars to the left of the y-axis indicate the stratigraphic range from which the radiocarbon-dated material was obtained.
mains at ;8%. A plant macrofossil AMS dated at11 640 6 60 14C yr BP originated from the lower sam-ple. As in Binnewater Pond and Pawelski Farm, thelast appearance of Picea may be seen as defining thetop of this zone.
4. Zone IV.—Pinus continues to dominate at 40%,and at the bottom of this zone Picea is absent. Pinusstrobus, although registering a trace presence earlier,exceeds 10% in the 60-cm sample that forms the bottomof the zone. Above this point Pinus falls to 15% andP. strobus below 2%. Quercus climbs rapidly to 40%,Betula drops below 5%, and Tsuga rises to 15%. Caryaand Castanea appear midzone and each exceed 5%;monolete spores become abundant.
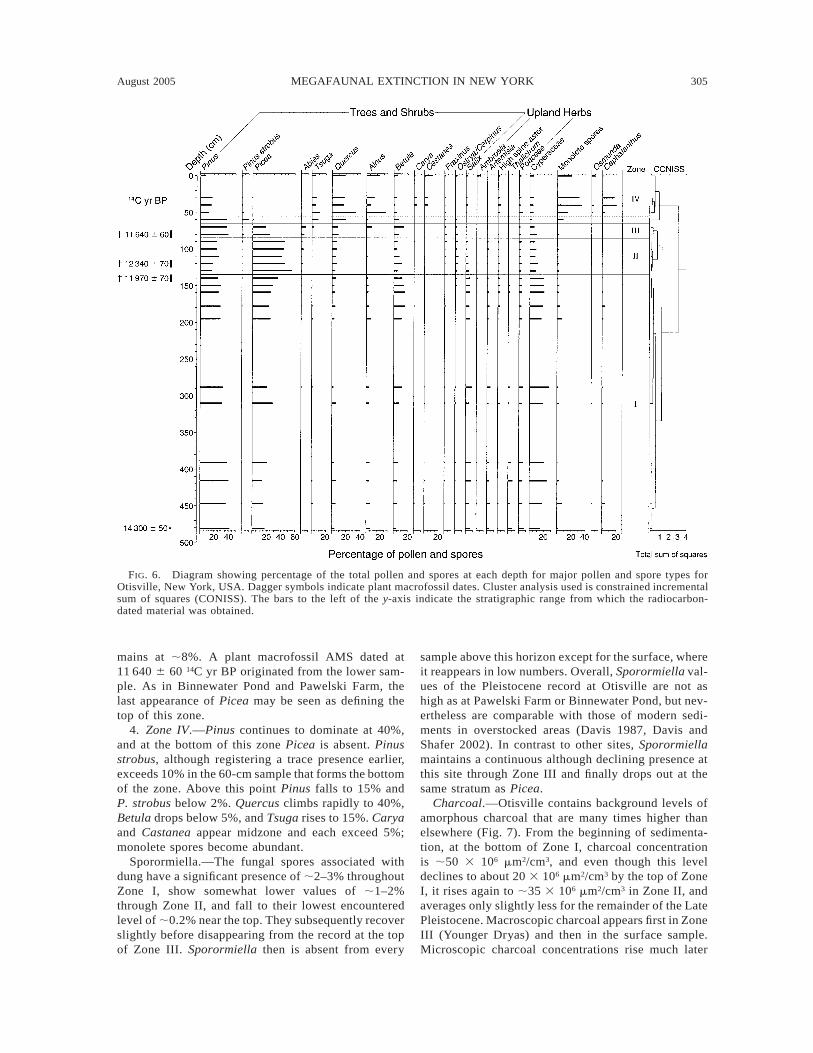
Sporormiella.—The fungal spores associated withdung have a significant presence of ;2–3% throughoutZone I, show somewhat lower values of ;1–2%through Zone II, and fall to their lowest encounteredlevel of ;0.2% near the top. They subsequently recoverslightly before disappearing from the record at the topof Zone III. Sporormiella then is absent from every
sample above this horizon except for the surface, whereit reappears in low numbers. Overall, Sporormiella val-ues of the Pleistocene record at Otisville are not ashigh as at Pawelski Farm or Binnewater Pond, but nev-ertheless are comparable with those of modern sedi-ments in overstocked areas (Davis 1987, Davis andShafer 2002). In contrast to other sites, Sporormiellamaintains a continuous although declining presence atthis site through Zone III and finally drops out at thesame stratum as Picea.
Charcoal.—Otisville contains background levels ofamorphous charcoal that are many times higher thanelsewhere (Fig. 7). From the beginning of sedimenta-tion, at the bottom of Zone I, charcoal concentrationis ;50 3 106 mm2/cm3, and even though this leveldeclines to about 20 3 106 mm2/cm3 by the top of ZoneI, it rises again to ;35 3 106 mm2/cm3 in Zone II, andaverages only slightly less for the remainder of the LatePleistocene. Macroscopic charcoal appears first in ZoneIII (Younger Dryas) and then in the surface sample.Microscopic charcoal concentrations rise much later
306 GUY S. ROBINSON ET AL. Ecological MonographsVol. 75, No. 3
FIG. 7. Sporormiella and charcoal for Otisville. Spore values are expressed as a percentage of pollen sum (upland plusaquatic). Microscopic charcoal is expressed as projected area on slide per volume of sediment. Macroscopic charcoal (.250mm) is expressed as number of particles (n) per volume of sediment. Dagger symbols indicate plant macrofossil dates. Thebars to the left of the y-axis indicate the stratigraphic range from which the radiocarbon-dated material was obtained.
than at all other sites, beginning at 50 cm from thesurface and coinciding with the Quercus peak in ZoneIV.
Hyde Park
During late summer of 1999, a backhoe deepened anartificial pond in a wetland area of suburban Hyde Park,Dutchess County, New York, and encountered the limbbones of a probiscidian. A fragment of tusk recoveredfrom the spoil heap at the site yielded an AMS collagendate of 11 480 6 60 14C yr BP (Table 3). Work stopped
until the following year when arrangements were madeto excavate below the water table, permitting more con-trolled removal of matrix sediments (D. A. Burney andG. S. Robinson, unpublished manuscript), which re-vealed a nearly complete skeleton of an adult maleMammut americanum. The thoracic spinal vertebrae,pelvis, and sacrum were substantially articulated anda fully articulated foot was positioned plantar sidedown in the sediments.
Inspection of a cleaned vertical face of the pitshowed that while the backhoe may have removed
August 2005 307MEGAFAUNAL EXTINCTION IN NEW YORK
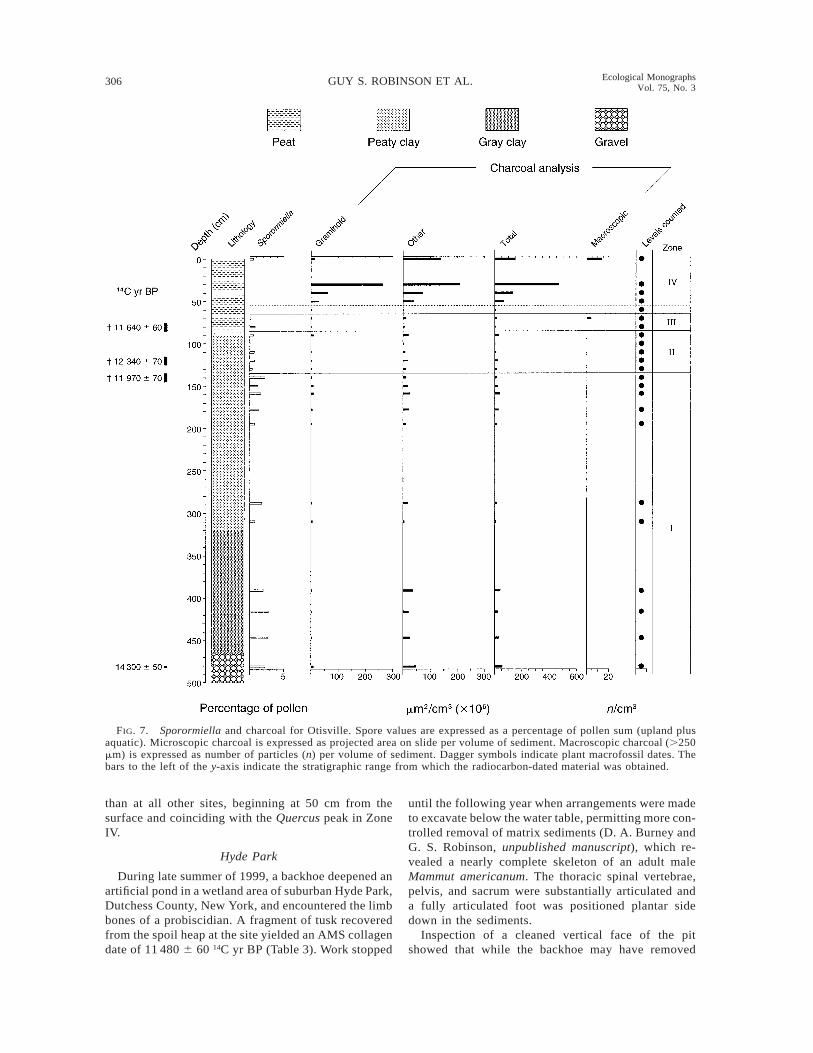
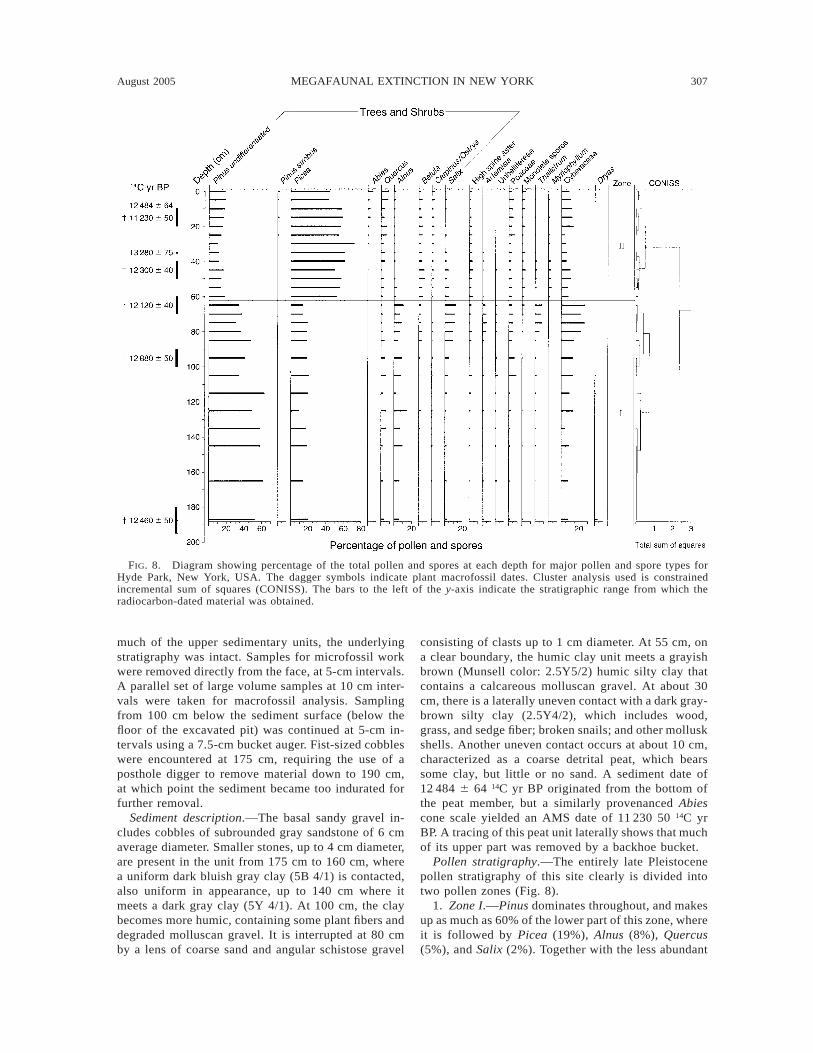
FIG. 8. Diagram showing percentage of the total pollen and spores at each depth for major pollen and spore types forHyde Park, New York, USA. The dagger symbols indicate plant macrofossil dates. Cluster analysis used is constrainedincremental sum of squares (CONISS). The bars to the left of the y-axis indicate the stratigraphic range from which theradiocarbon-dated material was obtained.
much of the upper sedimentary units, the underlyingstratigraphy was intact. Samples for microfossil workwere removed directly from the face, at 5-cm intervals.A parallel set of large volume samples at 10 cm inter-vals were taken for macrofossil analysis. Samplingfrom 100 cm below the sediment surface (below thefloor of the excavated pit) was continued at 5-cm in-tervals using a 7.5-cm bucket auger. Fist-sized cobbleswere encountered at 175 cm, requiring the use of aposthole digger to remove material down to 190 cm,at which point the sediment became too indurated forfurther removal.
Sediment description.—The basal sandy gravel in-cludes cobbles of subrounded gray sandstone of 6 cmaverage diameter. Smaller stones, up to 4 cm diameter,are present in the unit from 175 cm to 160 cm, wherea uniform dark bluish gray clay (5B 4/1) is contacted,also uniform in appearance, up to 140 cm where itmeets a dark gray clay (5Y 4/1). At 100 cm, the claybecomes more humic, containing some plant fibers anddegraded molluscan gravel. It is interrupted at 80 cmby a lens of coarse sand and angular schistose gravel
consisting of clasts up to 1 cm diameter. At 55 cm, ona clear boundary, the humic clay unit meets a grayishbrown (Munsell color: 2.5Y5/2) humic silty clay thatcontains a calcareous molluscan gravel. At about 30cm, there is a laterally uneven contact with a dark gray-brown silty clay (2.5Y4/2), which includes wood,grass, and sedge fiber; broken snails; and other molluskshells. Another uneven contact occurs at about 10 cm,characterized as a coarse detrital peat, which bearssome clay, but little or no sand. A sediment date of12 484 6 64 14C yr BP originated from the bottom ofthe peat member, but a similarly provenanced Abiescone scale yielded an AMS date of 11 230 50 14C yrBP. A tracing of this peat unit laterally shows that muchof its upper part was removed by a backhoe bucket.
Pollen stratigraphy.—The entirely late Pleistocenepollen stratigraphy of this site clearly is divided intotwo pollen zones (Fig. 8).
1. Zone I.—Pinus dominates throughout, and makesup as much as 60% of the lower part of this zone, whereit is followed by Picea (19%), Alnus (8%), Quercus(5%), and Salix (2%). Together with the less abundant
308 GUY S. ROBINSON ET AL. Ecological MonographsVol. 75, No. 3
Poaceae and Artemisia, these latter taxa begin to con-stitute a larger share in the upper part of the zone.Trilete spores are present earlier; monolete spores andLycopodium sporadically occur throughout the profile.Cyperaceae rise steadily from 10% to 25%. The pres-ence of Dryas is entirely within Zone I; it comprises;3% of the lowest sample and trace amounts are foundthroughout the zone.
2. Zone II.—Picea rises abruptly to 55% and ex-ceeds 70% at mid-zone, declining to about 40% to-wards the top. Pinus spp. is less than 20% of the sum,although the occurrence of Pinus strobus (haploxylon)is a consistent, if low, presence from the mid-zone onup. Abies appears slightly earlier, and exceeds 5% atthe top. Quercus rises steadily to about 18%. Betulaand Carpinus/Ostrya rise and maintain a level of ;5%and 2%, respectively. Alnus and Salix decline early onbut do not disappear. High echinate Asteraceae andPoaceae are present throughout the interval, as in ZoneI; Artemisia declines but remains in the profile. Mon-olete spores are present throughout, averaging less than5%. Cyperaceae is less than 10% at the bottom of ZoneII but increases to ;15% upsection. Myriophyllum (wa-ter milfoil) appears at the bottom, rises ca. 4%, declinesat midzone, but is still present at the top.
The sediment date of 13 280 6 75 14C yr BP wastaken at 35 cm depth, in the lower half of this zone,but an AMS age on Picea needles located ;10 cmbelow this was 12 300 6 40 14C yr BP (N. G. Miller,unpublished manuscript). The following observationssuggest that Zone III is missing, along with a portionof Zone II and much of the peat unit of the sedimentarystrata. Although Picea shows a slight decline near thetop the Zone II, Quercus has risen to 18% and displaysno sign of decline; Tsuga remains absent. There is nopronounced rise in Betula as in the other described sitesthat would be expected to mark Zone III. Alnus, whichhas fallen from its strong presence in Zone I, showsno recovery by the top of the sequence.
A particularly rich record of plant macrofossils re-ported elsewhere (N. G. Miller, unpublished manu-script), is in close agreement with the pollen stratig-raphy described here.
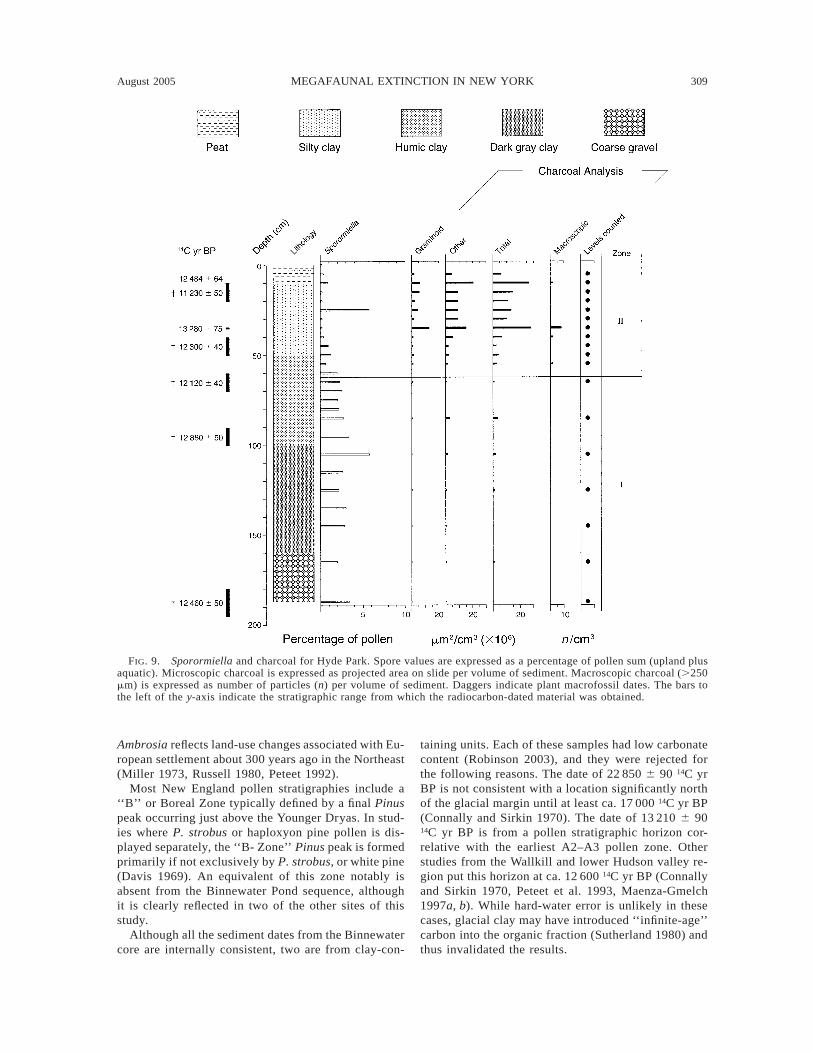
Sporormiella.—In common with the other sites, atHyde Park, Sporormiella has a strong presencethroughout Zone I, even exceeding 6% (Fig. 9) at somehorizons. At the bottom of Zone II, the spores begin asteady decline, and while never quite reaching zero,values are very low by the top of Zone II, as at Bin-newater Pond and Pawelski Farm. Following the initialdecline in the middle of Zone II, spores briefly returnto 6% in a single sample (25 cm) then drop to a lessthan 0.5% average for the remainder of the sequence.
Charcoal.—Throughout Zone I (Fig. 9), all charcoalis below 1 3 106 mm2/cm3 and graminoid charcoal isat trace levels. In the lower part of Zone II, an orderof magnitude rise occurs. Total microscopic charcoal
concentration at 45 cm is 2.6 3 106 mm2/cm3, subse-quently rising to 28 3 106 mm2/cm3 at 35 cm, withgraminoid and amorphous types at approximately sub-equal contributions. Charcoal values decline abovethis, but remain at five to 10 times the average foundin Zone I. Macroscopic charcoal first appears at thebottom of Zone II, then rises at 35 cm.
Temple Hill mastodon
One of many mastodons found in Orange County,the Temple Hill specimen was excavated in 1921, afterit was encountered during trenching in mucklandsabout 4 miles (6.4 km) west of Newburgh, New York(Hartnagel and Bishop 1922). The largely completeskeleton is now at the State Museum of New York inAlbany. A plug of compact bone removed from thesubscapular fossa yielded an AMS age of 11 000 6 8014C yr BP (Table 3).
DISCUSSION
Biostratigraphy
The sedimentary histories of each site display keyfeatures of the late-glacial pollen stratigraphy of south-ern New England (Deevey 1939, 1943, Leopold 1956,Davis 1969). This correspondence is most complete forBinnewater Pond, which singly received uninterruptedsedimentation during the late Holocene. Nevertheless,all sites incorporate a microfossil stratigraphy thatbrackets the extinction window.
Zone I at Binnewater Pond is equivalent to pollenzone A1 of the southern New England sequence. Sim-ilarly, Zone II corresponds to zones A2–A3, reflectingthe late-glacial rapid warming of the Bolling/AllerodInterval (Peteet 1992); Zone III is equivalent to A4,now recognized as a vegetational response to the Youn-ger Dryas cooling event in the northeastern UnitedStates (Leopold 1956, Peteet et al. 1990, Peteet 1992).In particular, Zone III pollen spectra display a char-acteristic rise then fall of Alnus, that marks the begin-ning and end of the Younger Dryas across regions fromNew Jersey to the Atlantic Provinces of Canada (Mayleet al. 1993). Zone IVa matches the C1 pollen zone, aresponse to the onset of Holocene warming.
Other key points of correspondence that occur in theremainder of the postglacial sequence include the Tsu-ga decline, an event recorded in pollen diagrams fromsites throughout the range of Tsuga canadensis. Datingto ca. 4800 14C yr BP, this ‘‘hemlock decline’’ has beenattributed to a forest pathogen outbreak, (Davis 1981,Allison et al. 1986), and is a useful stratigraphic markerfor correlating sequences across eastern North Amer-ica.
The Ambrosia horizon, marking the boundary ofZone V, is prevalent throughout the Northeast and muchof the Midwest and is understood to be a cultural ratherthan climatic signal for the late Holocene pollen record.Together with other palynological markers, the rise of
August 2005 309MEGAFAUNAL EXTINCTION IN NEW YORK
FIG. 9. Sporormiella and charcoal for Hyde Park. Spore values are expressed as a percentage of pollen sum (upland plusaquatic). Microscopic charcoal is expressed as projected area on slide per volume of sediment. Macroscopic charcoal (.250mm) is expressed as number of particles (n) per volume of sediment. Daggers indicate plant macrofossil dates. The bars tothe left of the y-axis indicate the stratigraphic range from which the radiocarbon-dated material was obtained.
Ambrosia reflects land-use changes associated with Eu-ropean settlement about 300 years ago in the Northeast(Miller 1973, Russell 1980, Peteet 1992).
Most New England pollen stratigraphies include a‘‘B’’ or Boreal Zone typically defined by a final Pinuspeak occurring just above the Younger Dryas. In stud-ies where P. strobus or haploxyon pine pollen is dis-played separately, the ‘‘B- Zone’’ Pinus peak is formedprimarily if not exclusively by P. strobus, or white pine(Davis 1969). An equivalent of this zone notably isabsent from the Binnewater Pond sequence, althoughit is clearly reflected in two of the other sites of thisstudy.
Although all the sediment dates from the Binnewatercore are internally consistent, two are from clay-con-
taining units. Each of these samples had low carbonatecontent (Robinson 2003), and they were rejected forthe following reasons. The date of 22 850 6 90 14C yrBP is not consistent with a location significantly northof the glacial margin until at least ca. 17 000 14C yr BP(Connally and Sirkin 1970). The date of 13 210 6 9014C yr BP is from a pollen stratigraphic horizon cor-relative with the earliest A2–A3 pollen zone. Otherstudies from the Wallkill and lower Hudson valley re-gion put this horizon at ca. 12 600 14C yr BP (Connallyand Sirkin 1970, Peteet et al. 1993, Maenza-Gmelch1997a, b). While hard-water error is unlikely in thesecases, glacial clay may have introduced ‘‘infinite-age’’carbon into the organic fraction (Sutherland 1980) andthus invalidated the results.

310 GUY S. ROBINSON ET AL. Ecological MonographsVol. 75, No. 3
Sporormiella declined at Binnewater Pond at the bot-tom of Zone II, suggesting an abrupt drop in the densityof large herbivores around this site during the earlystage of the Bolling/Allerod late-glacial warming. Nearthe boundary of Zones IV and V, presumably at aroundthe time of European settlement, Sporormiella valuessurpass any samples since the late Pleistocene. Thereare two maxima: the first possibly caused by relaxedpredation pressure on game animals when native Amer-ican populations were decimated by epidemics follow-ing first European contact. The second peak may markthe subsequent introduction of domestic ungulates (cf.Davis 1975).
Immediately preceding the Late Pleistocene drop inSporormiella, there is an order-of-magnitude rise inboth graminoid and other microscopic charcoal. Thisrise occurs at the boundary of Zones I and II, and maybe the first sign of human activity in the region (thesecond being Sporormiella decline). The largest in-crease in fire frequency appears later, about 60 cm high-er, above the middle of Zone II in the Binnewater se-quence, at 12 283 6 83 14C BP, on AMS dated sedi-ments, and may be a result of litter accumulation fol-lowing the depletion of large herbivores. By Zone V,the charcoal data indicate that fire is now reduced inimportance to a level not seen for ca. 13 millennia.
At Pawelski Farm, the low concentration of pollenin the lower unit may be due to rapid deposition ofclay from glacial melt. The pollen profile of Zone IIIis indicative of the Younger Dryas chronozone, partic-ularly the unprecedented rise and then fall in Alnuspollen spanning the unit. The late glacial and earlyHolocene pollen stratigraphy correlates well with thatof Binnewater Pond, although inspection of Fig. 4shows that, based on a dissimilarity coefficient of ;0.8chosen in this case to establish pollen stratigraphiczones, the single sample at 100 cm depth would alsoqualify as a zone in its own right. By correlation withNew England pollen stratigraphy, (Davis 1969), this isthe ‘‘B-Zone’’ that is apparently missing or obscuredby other taxa in the Binnewater Pond pollen profile.As in New England, it is defined here by a rapid riseof Pinus strobus to ;45%. This ‘‘boreal’’ zone is un-derstood to postdate the Younger Dryas chronozone(Peteet et al. 1993), and is demarcated here by a brokenline toward the top of Zone III in Fig. 4 and Fig. 5.The striking rise of Poaceae pollen and later of mon-olete spores is accompanied by aquatics suggesting lo-cal changes in the wetland plant community. Quercusdominance signals the onset of Holocene warming, fol-lowed by other thermophilous species. Today, the top;30 cm of the peat unit is disk plowed and plantedwith onions, and yet the uppermost pollen spectra haveremained well stratified, suggesting that such distur-bance does not significantly mix the sediments verti-cally. Furthermore, the pollen spectrum at the surfaceis not modern: the mid-Holocene Tsuga decline andthe Ambrosia horizon are missing. Much of the surface
sediment has been burned off and is regularly deflatedby winds, exposing layers laid down at least 5000 yearsago. Because of artificial drainage, the surface is dryfor much of the year, which explains why it does notsequester a modern pollen rain.
The sediment date marking the Zone II charcoal peakis not consistent with the pollen stratigraphy, which isclearly younger. However, the Cervalces skeleton wasrecovered from 200 cm depth and AMS dated to 12 1806 60 14C yr BP. Although it is possible that the bonessank into the sediments, the collagen date is consistentwith the pollen spectrum of its matrix. Accordingly,the date marks the interval between Sporormiella de-cline at the Zone I–Zone II boundary, and the charcoalpeak that occurs ;60 cm above it.
The pollen spectrum of Otisville’s Zone II correlateswith the Bolling/Allerod warming, an interpretationsupported by the radiometric date of 12 340 6 70 14Cyr BP on a plant macrofossil. However, because ofradiocarbon anomalies that characterize this time pe-riod (Fiedel 1999), the stratigraphic reversal of this datewith the later one from Zone I is more apparent thanreal. When calibrated at 2 sigma the two dates in ques-tion overlap by a thousand years (Table 3). Otisville’sZone III is represented by two samples showing a peakin Betula and Alnus, and establishes the Younger Dryaschronozone.
Otisville’s pollen stratigraphy shows a clear Pinusstrobus spike, equivalent to the boreal or ‘‘B Zone’’ ofthe New England pollen stratigraphy. It appears at 60cm depth and cluster analysis (dendrogram, Fig. 6) rec-ognizes it as a zone in its own right from a dissimilaritycoefficient of ;0.9. However, at a larger dissimilaritycoefficient it clusters with Zone IV, to which we haveassigned it here, with a broken line indicating its upperlimit.
As elsewhere, the early Holocene warming is markedby a significant rise in Quercus, but sedimentation hasslowed above this, so the later Holocene is poorly rep-resented. However, all taxa present at 30 cm also appearin the surface sample in roughly the same percentages,the principal exception being Ambrosia, constituting;8% at the surface but barely present at 30 cm. Thisprovides some assurance that root disturbance has notintroduced late Holocene material into the lower por-tion of Zone IV. The abundance of Ambrosia and Cas-tanea at the surface suggest that it is late Holocene andlikely of post-European contact time. Thus, it mighthave been assigned to Zone V, but as a single samplethat did not cluster by the chosen dissimilarity coef-ficient, we have grouped it with Zone IV.
Otisville’s charcoal record indicates that fire was animportant element of the local ecology by the time theearliest sediments began to accumulate. When micro-scopic charcoal concentrations rise, they reach levelsnot seen at other sites: 210 and 260 3 106 mm2/cm3 foramorphous and graminoid types respectively. As asmall sedimentary basin, this site would be expected

August 2005 311MEGAFAUNAL EXTINCTION IN NEW YORK
to receive a strong local signal in its charcoal record.Nevertheless, that record is not one of sporadic andoccasional fires that might be over-represented, but offrequent natural fires that are a consistent feature ofthe local ecology. The first macroscopic charcoal frag-ments appear somewhat earlier, in upper Zone III, in-dicating burning close to the site (Patterson et al. 1987).Sporormiella remains moderately high (over 1%) dur-ing most of late Pleistocene time, up into lower ZoneIII, before falling to zero at the same time as Picea. Areappearance of the spores and Ambrosia at the surfacesuggests introduced livestock and European agricul-ture. Dairy cattle (of the Mitchell farm) occupied thesite at least from the 19th century (H. R. Decker, per-sonal communication).
Zone II at Hyde Park encompasses the spruce max-imum or A2–A3 zones of the regional pollen stratig-raphy (Peteet et al. 1993, Davis 1969, Maenza-Gmelch1997a, b) as well as of northern New Jersey (Peteet etal. 1990), reflecting the Bolling/Allerod warming (Pe-teet 1992). However, this is not followed by an Alnusmaximum, indicating that the Younger Dryas is notrepresented. Pollen and macrofossils of rooted aquatictaxa such as Myriophyllum suggest the formation of ashallow pond (N. G. Miller, unpublished manuscript).
Microscopic charcoal particles of Hyde Park Zone Iare of small size classes, mostly between 50 to 500mm2 (Robinson 2003). This continues through lowerZone II, suggesting a time of not only less frequentfire, but that charcoal originated from more distantsources (Clark 1988). Larger size classes and macro-scopic charcoal of at least 250 mm (Fig. 5) take a greatershare at 50 cm depth, a pattern indicating local fires(Clark 1988). However, concentrations remain lowoverall, and consequently by this time fire was not afrequent occurrence. A macrofossil date suggests thatafter 12 300 6 40 14C yr BP, fire abruptly became fre-quent; an increase in average particle sizes also sug-gests that both local and regional fire contributed tothe rise in charcoal concentration. Graminoid (grassand sedge) charcoal accounts for most of the largestsize classes. Charcoal rise at Hyde Park stratigraphi-cally follows closely upon Sporormiella spore declinein the same manner as observed in the records of Bin-newater Pond, Pawelski Farm, and Otisville.
Plant macrofossil dates suggest that Sporormiella de-cline at Hyde Park cannot be much earlier than 12 30014C yr BP (Fig. 9 and N. G. Miller, unpublished man-uscript). Similar dates from southern New Englandconstrain the corresponding pollen horizon at ca.12 590 6 430 14C yr BP (Peteet et al. 1992). The ter-restrial record from northwestern Europe places theonset of the Bolling at ca. 13 000 14C yr BP (Watts1980). The significance of an apparently later Sporor-miella decline at Otisville is addressed below.
An anomaly in the Sporormiella record at Hyde Parkoccurs at 20 cm, where, following initial decline, sporevalues briefly return to a maximum. Just above this
horizon, an Abies cone scale is AMS dated only slightlyyounger than the mastodon itself (Fig. 9). Althoughthis could suggest a brief return of megafauna to thisarea, a simpler explanation is that the brief influx ofSporormiella migrated from the gut of the mastodonthat collapsed and died at about this time only ca. 1 maway. In a small sedimentary basin, a high density ofspores may have had little opportunity to extensivelydisperse.
Hypotheses for extinction
If climate change was the sufficient cause of extinc-tion (H1 in Table 1; see Appendix) we should expectSporormiella to decline at all sites simultaneously.Even at this spatial scale, spore decline is not simul-taneous, whether measured by pollen chronostratigra-phy or by absolute dates. Of the two sites that haveplant macrofossil dates, Hyde Park and Otisville, oneshows a Sporormiella decline at least a millenniumearlier than the other. Most sites record this event ear-lier or later in pollen Zone II, but at Otisville, Spo-rormiella persists through Zone III, only to disappearat the same time as Picea pollen. There is no suggestionat this stage of the formation of a uniform or zonalvegetation pattern (Guthrie 1984). Such a developmentoccurs yet in the future, at ca. 9000 14C yr BP, whenQuercus rapidly dominates regional pollen spectra,suggesting the formation of closed-canopy forest at thebeginning of the Holocene
Sporormiella data from three of the four sites indi-cate that large herbivores were in decline at the verytime that Picea (spruce) was either rising or alreadydominating regional pollen spectra. This tends to con-tradict H2, which holds that the American mastodonbecame so dependent on spruce that it died out as hard-wood forests expanded.
At least a millennium elapsed between the earliestlocal megafaunal collapse (Sporormiella decline) anddates for extinct megafauna reported here (Table 3).Recently obtained AMS collagen dates from NewYork’s Fingerlake region are 11 630 6 80 14C yr BPand 10 840 6 60 14C yr BP for mastodon, and 10 8906 50 14C yr BP for mammoth (P. Nester, personal com-munication). Even if megaherbivores declined rapidlyat individual sites, a rapid wave did not sweep throughthe entire region. These observations weaken all hy-potheses predicting a rapid extirpation of megafaunaon the regional scale, specifically H3, H4, H6, H9, H10,and H12 of Table 1. A further difficulty for H3 and H9
is that megafaunal populations appear to have gone intosteep decline well before the Younger Dryas climatereversal. Even if large animals were eliminated fromwide areas, pockets apparently remained, suggesting amosaic pattern of extirpation, as expected from H5 andH13.
The overkill model of H8 calls for a tripartite pulsedextinction over a period of ca. 1640 years, but the gen-erally unimodal drop in Sporormiella values presented

312 GUY S. ROBINSON ET AL. Ecological MonographsVol. 75, No. 3
here reflects only one of the two major pulses predicted.The most abundant late occurrences in the northeastregion are mastodon, a member of the megaherbivoreguild, predicted by this model to disappear in the mid-dle round.
The ‘‘second order predation’’ overkill model cannotaccount for the repeated conjunction of a terminal Spo-rormiella decline followed by a charcoal rise. H7 pre-dicts that initial overkill of megaherbivores (and pos-sibly carnivores) would be followed by population out-breaks of smaller herbivores that then rapidly exhaustavailable vegetation. If it was a more regional phe-nomenon, the spore anomaly at Hyde Park might sup-port H7 and H8.
None of the single-causal hypotheses are of muchhelp in explaining why a drop in Sporormiella is fol-lowed by a rise in stratigraphic charcoal concentrations.However, H11 proposes that large herbivores roamingcontinental landscapes would have kept fuel loads lowby consuming vast quantities of biomass (Schule 1990).If such animals were removed by some novel factorsuch as human activities or introduced disease, frequentand intense fires might result.
Synergy (H13) incorporates the above view of her-bivory and fire but extends the hypothesis to a rangeof human activities. These activities include huntingand landscape fires that constitute an extinction processthat initially would be expected to be relatively slow,but later cumulative and may then be compounded by‘‘natural’’ environmental shifts. Binnewater Pond, thehighest resolution sequence, records a brief, 10-foldrise in charcoal that immediately precedes Sporor-miella decline. This possibly is the first sign of earliesthuman settlers locally, who then overexploited avail-able game, undercutting an established herbivory re-gime, and completing a first stage of landscape trans-formation. In the second phase, according to charcoaldata, accumulating fuel loads develop a potential formore pervasive and frequent fires that appear later. Asecond well-known prehistoric activity, the deliberateuse of fire to clear underbrush and encourage a renewedflush of growth attractive to game (Patterson and Sas-saman 1988), could have amplified the earlier devel-opments. Although major environmental shifts marklate-glacial time in the Northeast, a subsequent eventcould have a multiplied effect for a system alreadyunder a sustained assault. We propose that this is whyterminal dates of most extinct taxa cluster around theonset of the Younger Dryas chronozone, apparently amillennium or more after people have entered the re-gion. Paleolithic activities may be the underlying andsufficient cause of the observed landscape transfor-mation, but such effects would be compounded by theinevitable climate changes.
It is useful to compare these New York records toLate Holocene deposits in Madagascar, which track en-vironmental and other changes leading up to and fol-lowing human arrival (Burney et al. 2003). A series of
cores from across the island display a diachronous Spo-rormiella decline, commencing in the arid southwest,ca. 2000 years ago. At each site, spore decline is fol-lowed by a sharp rise in stratigraphic charcoal, suc-ceeded by the last occurrences of large herbivore taxa.This occurred in a background of climatic aridificationthat was already well underway prior to the advent ofhumans.
The Madagascar records also assist resolution of un-certainty regarding the significance of the Zone II char-coal rise at Hyde Park, Pawelski, and Binnewater, whenspruce is either dominant or on the decline. The sprucepollen rise, found throughout formerly glaciated partsof the Northeast is considered to mark the transitionfrom periglacial tundra to open conifer woodland(Watts 1983). This development may seem sufficientfor fire to become an important factor on the locallandscape. In Madagascar, however, a very differentset of environmental changes were present, yet a char-coal rise appears linked to spore decline near the timeof human arrival.
Stratigraphic charcoal records from the HudsonHighlands that overlook the eastern Wallkill Valley alsosuggest that environmental changes alone do not ac-count for all the available data. These upland siteswould be more prone to lightning strikes, but show alater onset of fire than most of the lowland areas ofthis study. It took until the early Holocene for fire toplay a significant role at Sutherland Pond, at 380 melevation (Maenza-Gmelch 1997a). By contrast,Spruce Pond at 223 m elevation, incipiently recordsfrequent fire in Younger Dryas time (Maenza-Gmelch1997b). Together with Otisville, these records begin tooutline a regional fire history that was not trackingclimate changes in any simple fashion, but rather sug-gest a mosaic pattern of change that might be elucidatedwith further Sporormiella studies.
Dates on organic material associated with the earliestfluted point tradition, ca. 11 500 14C yr BP, are still themost widely accepted interval for human arrival in theAmericas south of the ice sheets (Haynes 1969, Fiedel1999). Generally accepted dates for the settlement ofeastern North America remain no earlier than ca. 11 00014C yr BP (Dincauze 1993).
The Dutchess Quarry Caves are located in the Wall-kill Valley ;8 km northeast of the Pawelski farm and;13 km southeast of Binnewater Pond. Formed in adolomitic limestone outcrop, the caves have yieldedPaleo-Indian projectile points and remains of the ex-tinct giant beaver, flat-headed peccary, caribou, andother extant vertebrate taxa (Funk 1976, Funk andSteadman 1994). Several AMS 14C ages range from13 840 6 80 to 11 670 6 70 14C yr BP, on purifiedcollagen from caribou bones recovered from or abovestratigraphic units bearing fluted projectile points(Steadman et al. 1997). However, there is no clear as-sociation between the cultural material and extinctmegafaunal species. Questions remain about the integ-
August 2005 313MEGAFAUNAL EXTINCTION IN NEW YORK
rity of the Dutchess Quarry Cave stratigraphy. Al-though the proxy data of this study indicates otherwise,no direct evidence has emerged to place settlement inthe region before 11 000 14C yr BP.
SUMMARY AND CONCLUSIONS
Stratigraphic pollen, spore, and microscopic char-coal records from four sites in southeastern New Yorkput a regional focus on the mass extinction of largemammals in North America. The proxy data from fourlocalities show a substantial agreement regardingchanges in herbivory and fire regimes that unfoldedduring the late Pleistocene. A region-wide drop in Spo-rormiella values during the late glacial is associatedeverywhere with a subsequent rise in stratigraphiccharcoal.
Correlation of these data with pollen stratigraphyimplies that human alteration of the landscape andmegafaunal collapse began significantly before themonumental changes in vegetation that mark the Ho-locene boundary. Microfossil stratigraphy is supportedby the radiocarbon chronology presented here to showthat regional fire and herbivory regimes were trans-formed in advance of the Younger Dryas climatic re-versal.
Bone collagen dates on extinct megafauna as late as11 000 6 80 14C yr BP are seen as the terminal stageof a process in which ecological collapse followed hu-man arrival, leaving severely reduced populations ofmegafauna that survived to the end of the Pleistocene.
The preceding observations may be used to evaluatethe proposed causes of megafaunal extinction in NorthAmerica (Table 1). Hypotheses that call for an extinc-tion process driven by environmental or climate chang-es are weakened by the observed chronology. Specif-ically, H1, H2, and H3, although not soundly refuted,are nevertheless severely weakened by evidence of keyenvironmental changes that postdate the initial mega-faunal collapse. By specifically invoking a droughtclose to Younger Dryas time, H9 also suffers, but thesuggestion of a human/climate interaction could applyin a more general sense. In addition, all hypothesesinsisting on a rapid rate of extinction, particularly H4,H6, H9, H10, H12, and to some degree H7, are not sup-ported by evidence presented here. The apparently pro-tracted nature of the extinction process is consistentwith H5, H8, H11, and H13. The data further suggest amosaic pattern of landscape transformation and ex-tinction at the regional level, which is most consistentwith H13.
Based on these data, it is tentatively concluded thathuman activities indeed drove an extinction processthat took at least a millennium to complete. Such areconstruction is now supported by a similar fossilchronology from late Holocene Madagascar, which alsois associated with human arrival (Burney et al. 2003).Nevertheless, such inferences should not preclude arole for a number of forces that have been discounted
here as primary causes. Once human activities werebrought to bear on the system, the effects of ‘‘natural’’stresses could then have been amplified (Burney1993a, b, 1999). The spore data in particular, suggestan initial blitzkrieg (Martin 1984) as a crippling butnot fatal blow. Human use of fire may have amplifiedthe ecological response to a severely reduced herbiv-ory. Climate change appears to have compounded theseeffects, culminating in the disappearance of all the larg-est members of the North American mammalian fauna.
ACKNOWLEDGMENTS
Costs of radiocarbon dating were underwritten by the NewYork State Museum at Albany and the NSF Arizona AMSFacility of University of Arizona. In this regard, we thankTim Jull and Mitzi de Martino. Other costs were borne byNSF grants to D. A. B.’s Laboratory at Fordham University,the Ludwig and Paula Altman Fund, the Fordham GraduateStudent Association and an Alumni Dissertation Fellowshipawarded by the Graduate School of Arts and Sciences ofFordham University. Paul Martin actively encouraged thework and commented on early drafts. Thanks also go toDorothy Peteet, George Dale, Craig Frank, James Lewis,and Berish Rubin. Robin Andersen, Gordon Connally, TomDaniels, and Mary Kay O’Rourke have each made valuablecomments. The manuscript benefited from suggestions byOwen Davis and two anonymous reviewers. Access to fieldsites or museum specimens was made possible with the as-sistance of Ray Decker, Brian Pawelski, Vivian Kagan,Larry and Sherry Lozier, Gay Malin, Don Cadwell, and thelate Bob Funk. The officers and staff of the PaleontologicalResearch Institution, particularly Peter Nester, Jim Sherpa,Robert Ross, and Warren Allmon were responsible for man-aging the excavation at Hyde Park. Norton Miller kindlygranted permission to cite plant macrofossil dates beforepublication.
LITERATURE CITED
Alley, R. B., J. Marotzke, W. D. Nordhaus, J. T. Overpeck,D. M. Peteet, R. A. Pielke, Jr., R. T. Pierrehumbert, P. B.Rhines, T. F. Stocker, L. D. Talley, and J. M. Wallace. 2003.Abrupt climate change. Science 299:2005–2010.
Allison, T. D., R. E. Moeller, and M. B. Davis. 1986. Pollenin laminated sediments provides evidence for a mid-Ho-locene forest pathogen outbreak. Ecology 67:1101–1105.
Alroy, J. 2001. A multspecies overkill simulation of the end-Pleistocene megafaunal mass extinction. Science 292:1893–1897.
Athens, J. S. 1997. Hawaiian native lowland vegetation inprehistory. Pages 248–164 in P. V. Kirch and T. L. Hunt,editors. Historical ecology in the Pacific Islands. Yale Uni-versity Press, New Haven, Connecticut, USA.
Berger, W. H. 1991. On the extinction of the mammoth: sci-ence and myth. Pages 115–132 in D. Muller, J. A. Mc-Kenzie, and H. Weissert, editors. Controversies in moderngeology. Academic Press, London, UK.
Burney, D. A. 1987. Late Quaternary stratigraphic charcoalrecords from Madagascar. Quaternary Research 28:274–280.
Burney, D. A. 1993a. Recent animal extinctions: recipes fordisaster. American Scientist 81:530–541.
Burney, D. A. 1993b. Late Holocene environmental changesin arid southwestern Madagascar. Quaternary Research 40:98–106.
Burney, D. A. 1997. Tropical islands as paleoecological lab-oratories: gauging the consequences of human arrival. Hu-man Ecology 25:437–457.
Burney, D. A. 1999. Rates, patterns and processes of land-scape transformation and extinction in Madagascar. Pages
314 GUY S. ROBINSON ET AL. Ecological MonographsVol. 75, No. 3
145–164 in R. D. E. MacPhee, editor. Extinctions in neartime. Plenum Publishers, New York, New York, USA.
Burney, D. A., L. P. Burney, and R. D. E. MacPhee. 1994.Holocene charcoal stratigraphy from Laguna Tortuguera,Puerto Rico and the timing of human arrival. Journal ofArchaeological Science 21:273–281.
Burney, D. A., R. V. DeCandido, L. P. Burney, F. N. Kostel-Hughes, T. W. Stafford, Jr., and H. F. James. 1995. A Ho-locene record of climate change, fire ecology and humanactivity from montane Flat Top Bog, Maui. Journal of Pa-leolimnology 13:209–217.
Burney, D. A., et al. 2001. Fossil evidence for a diversebiota from Kauai and its transformation since human ar-rival. Ecological Monographs 71:615–641.
Burney, D. A., G. S. Robinson, and L. P. Burney. 2003. Spo-rormiella and the late Holocene extinctions in Madagascar.Proceedings of the National Academy of Sciences (USA)100:10 800–10 805.
Clark, J. S. 1988. Particle motion and the theory of charcoalanalysis: source area, transport, deposition, and sampling.Quaternary Research 30:67–80.
Connally, G. G., and L. A. Sirkin. 1970. Late glacial historyof the upper Wallkill Valley, New York. Geological Societyof America Bulletin 81:3297–3306.
Connally, G. G., and L. A. Sirkin. 1973. Wisconsian historyof the Hudson-Champlain lobe. Memoir 136. GeologicalSociety of America, Boulder, Colorado, USA.
Connally, G. G., L. A. Sirkin, and D. H. Cadwell. 1989.Deglacial history and environments of the upper WallkillValley. New York State Geological Association Field TripGuidebook 61:205–229.
Davis, M. B. 1969. Climatic changes in Southern Connecticutrecorded by pollen deposition at Rogers Lake. Ecology 50:409–422.
Davis, M. B. 1981. Outbreaks of forest pathogens in Qua-ternary history. Pages 216–222 in Proceedings of the IVthInternational Palynological Conference. Birbal Sahni In-stitute of Paleobotany, Lucknow, India.
Davis, O. K. 1975. Pollen analysis of Wildcat Lake, WhitmanCounty, Washington: the introduction of grazing. Thesis.Washington State University, Pullman, Washington, USA.
Davis, O. K. 1987. Spores of the dung fungus Sporormiella:increased abundance in historic sediments and before Pleis-tocene megafaunal extinction. Quaternary Research 28:290–294.
Davis, O. K., L. Agenbroad, P. S. Martin, and J. I. Mead.1984. The Pleistocene dung blanket of Bechan Cave, Utah.Special Publications of the Carnegie Museum of NaturalHistory 8:267–282.
Davis, O. K., and D. S. Shafer. 2002. Sporormiella fungalspores, a palynological means of detecting herbivore den-sity. Proceedings of the ‘‘Faeces Facies Symposium.’’ Heldat the Joint Meeting of AASP, BMS and NAMS, September,11–13, 2002. University College, London, UK.
Dean, W. E. 1974. Determination of carbonate and organicmatter in calcareous sediments and sedimentary rocks byloss on ignition: comparison with other methods. Journalof Sedimentary Petrology 44:242–248.
Deevey, E. S., Jr. 1939. Studies on Connecticut lake sedi-ments I. A postglacial climate chronology for southern NewEngland. American Journal of Science 237:691–724.
Deevey, E. S., Jr. 1943. Additional pollen analyses fromsouthern New England. American Journal of Science 241:717–752.
Diamond, J. M. 1984. Historical extinctions: a Rosetta stonefor understanding prehistoric extinctions. Pages 824–862in P. S. Martin and R. G. Klein, editors. Quaternary ex-tinctions: a prehistoric revolution. University of ArizonaPress, Tucson, Arizona, USA.
Dincauze, D. F. 1993. Fluted points in the eastern forests.Pages 279–293 in O. Soffer and N. D. Praslov, editors.From Kostenki to Clovis: Upper Paleolithic-paleo-indianadaptations. Plenum Press, New York, New York, USA.
Dineen, R. J. 1986. Deglaciation of the Hudson Valley be-tween Hyde Park and Albany, NY. Pages 89–108 in D. H.Cadwell, editor. The Wisconsin stage of the first geologicaldistrict. New York State Museum Bulletin 455. New YorkState Museum, Albany, New York, USA.
Faegri, K., P. E. Kaland, and K. Krzywinski. 1989. Textbookof pollen analysis. John Wiley and Sons, New York, NewYork, USA.
Fiedel, S. J. 1999. Older than we thought: implications ofcorrected dates for Paleoindians. American Antiquity 64:95–115.
Fisher, D. C. 1997. Extinction of probiscideans in NorthAmerica. Pages 296–432 in J. Shoshani and P. Tassy, ed-itors. The Probiscidea: evolution and paleoecology of el-ephants and their relatives. Oxford University Press, NewYork, New York, USA.
Funk, R. E. 1976. Contributions to Hudson Valley prehistory.Memoir 22. New York State Museum, University of theState of New York, Albany, New York, USA.
Funk, R. E., and D. W. Steadman. 1994. Archaeological andpaleoenvironmental investigations in the Dutchess Quarrycaves, Orange County, New York. Persimmon Press, Buf-falo, New York, USA.
Goldberg, E. D. 1986. Black carbon in the environment:properties and distribution. Wiley, New York, New York,USA.
Graham, R. W., and E. L. Lundelius. 1984. Pages 223–249in P. S. Martin and R. G. Klein, editors. Quaternary ex-tinctions: a prehistoric revolution. University of ArizonaPress, Tucson, Arizona, USA.
Grayson, D. K. 2001. The archaeological record of humanimpacts on animal populations. Journal of World Prehistory15:2–68.
Grayson, D. K., and D. J. Meltzer. 2003. A requiem for NorthAmerican overkill. Journal of Archaeological Science 30:585–593.
Guthrie, R. D. 1984. Mosaics, allelochemicals and nutrients:an ecological theory of Late Pleistocene megafaunal ex-tinctions. Pages 259–298 in P. S. Martin and R. G. Klein,editors. Quaternary extinctions: a prehistoric revolution.University of Arizona Press, Tucson, Arizona, USA.
Hartnagel, C. A., and S. C. Bishop. 1922. The mastodons,mammoths and other Pleistocene mammals of New YorkState. New York State Museum Bulletin, Numbers 241–242. New York State Museaum, Albany, New York, USA.
Haynes, C. V. 1969. The earliest Americans. Science 166:709–715.
Haynes, C. V. 1991. Geoarchaological and paleohydrologicalevidence for a Clovis-age drought in North America andits bearing on extinction. Quaternary Research 35:438–450.
Humbert, H. 1927. La destruction d’une flore insulare par lefeu. Principaux aspects de la vegetation a Madagascar. Me-moires de L’Academie Malgache 5:1–80.
Janzen, D. H. 1983. The Pleistocene hunters had help. Amer-ican Naturalist 121:598–599.
King, J. E., and J. J. Saunders. 1984. Environmental insu-larity and the extinction of the American mastodon. Pages315–339 in P. S. Martin and R. G. Klein, editors. Quater-nary extinctions: a prehistoric revolution. University of Ar-izona Press, Tucson, Arizona, USA.
Leopold, E. B. 1956. Two late-glacial deposits in southernConnecticut. Proceedings of the National Academy of Sci-ences (USA) 42:863–867.
MacPhee, R. D. E., and P. A. Marx. 1997. The 40 000-yearplague. Pages 169–217 in S. Goodman and B. Patterson,

August 2005 315MEGAFAUNAL EXTINCTION IN NEW YORK
editors. Natural change and human impact in Madagascar.Smithsonian Institution Press, Washington, D.C., USA.
Maenza-Gmelch, T. E. 1997a. Late glacial-early Holocenevegetation, climate, and fire at Sutherland Pond, HudsonHighlands, New York, USA. Canadian Journal of Botany75:431–439.
Maenza-Gmelch, T. E. 1997b. Vegetation, climate, and fireduring the late glacial- Holocene transition at Spruce Pond,Hudson Highlands, southeastern New York, USA. Journalof Quaternary Science 12:15–24.
Martin, P. S. 1984. Prehistoric overkill: the global model.Pages 354–403 in P. S. Martin and R. G. Klein, editors.Quaternary extinctions: a prehistoric revolution. Universityof Arizona Press, Tucson, Arizona, USA.
Martin, P. S., and D. W. Steadman. 1999. Prehistoric extinc-tions on islands and continents. Pages 17–55 in R. D. E.MacPhee, editor. Extinctions in near time. Plenum Pub-lishers, New York, New York, USA.
Mayle, F. E., A. J. Levesque, and L. C. Cwynar. 1993. Alnusas an indicator taxon of the Younger Dryas cooling in east-ern North America. Quaternary Science Reviews 12:295–305.
Miller, G. H., J. W. Magee, B. J. Johnson, M. L. Fogel, N.A. Spooner, M. T. McCulloch, and L. K. Ayliffe. 1999.Pleistocene extinction of Genyornis newtoni: human impacton Australian megafauna. Science 283:205–208.
Miller, N. G. 1973. Late-glacial and postglacial vegetationchange in southwestern New York State. Bulletin 420. NewYork State Museum and Science Service, Albany, NewYork, USA.
Muller, E. H., and P. E. Calkin. 1993. Timing of Pleistoceneglacial events in New York State. Canadian Journal of EarthScience 30:1829–1845.
Owen-Smith, N. 1987. Pleistocene extinctions: the pivotalrole of megaherbivores. Paleobiology 13:351–362.
Patterson, W. A., III, K. J. Edwards, and D. J. Maguire. 1987.Microscopic charcoal as a fossil indicator of fire. Quater-nary Science Reviews 6:3–23.
Patterson, W. A., and K. E. Sassaman. 1988. Indian fires inthe prehistory of New England. Pages 107–135 in G. P.Nicholas, editor. Holocene human ecology in northeasternNorth America. Plenum Press, New York, New York, USA.
Peteet, D. M. 1992. Major contributions of radiocarbon dat-ing to palynology: past and future. Pages 454–472 in R.E. Taylor, A. Long, and R. S. Kra, editors. Radiocarbonafter four decades. Springer-Verlag, New York, New York,USA.
Peteet, D. M., R. A. Daniels, L. E. Heusser, J. S. Vogel, J.R. Southon, and D. E. Nelson. 1993. Late-glacial pollen,macrofossils and fish remains in northeastern USA—theYounger Dryas oscillation. Quaternary Science Reviews12:597–612.
Peteet, D. M., J. S. Vogel, D. E. Nelson, J. R. Southon, R.J. Nickmann, and L. E. Heusser. 1990. Younger Dryasclimatic reversal in northeastern USA? AMS ages for anold problem. Quaternary Research 33:219–230.
Robinson, G. S. 2003. Landscape paleoecology and LateQuaternary extinctions in the Hudson Valley. Dissertation.Fordham University, Bronx, New York, USA.
Russell, E. B. W. 1980. Vegetational change in northern NewJersey from precolonization to the present: a palynologicalinterpretation. Bulletin of the Torrey Botanical Club 107:432–446.
Schule, W. 1990. Landscapes and climate in prehistory: in-teractions of wildlife, man and fire. Pages 273–318 in J.G. Goldammer, editor. Fire in the tropical biota. Springer-Verlag, Berlin, Germany.
Scott, W. B. 1885. Cervalces Americanus, a fossil moose, orelk, from the Quaternary of New Jersey. Proceedings ofthe Academy of Natural Sciences of Philadelphia 1885:181–202.
Signor, P. W., and J. H. Lipps. 1982. Sampling bias, gradualextinction and catastrophes in the fossil record. GeologicalSociety of America Special Paper 190:190–296.
Simpson, G. G. 1953. The major features of evolution. Co-lumbia University Press, New York, New York, USA.
Singh, G., A. P. Kershaw, and R. Clark. 1981. Quaternaryvegetation and fire history in Australia. Pages 23–54 in A.M. Gill, R. A. Groves, and I. R. Noble, editors. Fire andthe Australian biota. Australian Academy of Sciences, Can-berra, Australia.
Steadman, D. W., T. W. Stafford, and R. E. Funk. 1997. Non-association of Paleoindians with AMS-dated late Pleisto-cene mammals from the Dutchess Quarry Caves, NewYork. Quaternary Research 47:105–116.
Sutherland, D. G. 1980. Problems of radiocarbon dating de-posits from newly deglaciated terrain: examples from theScottish late glacial. Pages 139–149 in J. J. Lowe, J. M.Gray, and J. E. Robinson, editors. Studies in the late glacialof north-west Europe. Pergamon Press, Oxford, UK.
Watts, W. A. 1980. Regional variation in the response ofvegetation of late-glacial climatic events in Europe. Pages1–22 in J. J. Lowe, J. M. Gray, and J. E. Robinson, editors.Studies in the late glacial of north-west Europe. PergamonPress, Oxford, UK.
Watts, W. A. 1983. Vegetational history of the eastern UnitedStates 25 000 to 10 000 years ago. Pages 294–310 in S.C. Porter, editor. Late Quaternary environments of the Unit-ed States. Volume 1. University of Minnesota Press, Min-neapolis, Minnesota, USA.
Whitney-Smith, E. 2001. Second order predation and Pleis-tocene extinctions: a system dynamics model. Dissertation.George Washington University, Washington, D.C., USA.
Whittington, S. L., and B. Dyke. 1984. Simulating overkill:experiments with the Mosimann and Martin model. Pages451–465 in P. S. Martin and R. G. Klein, editors. Quater-nary extinctions: a prehistoric revolution. University of Ar-izona Press, Tucson, Arizona, USA.
Winkler, M. G. 1985. Charcoal analysis for paleoenviron-mental interpretation: a chemical assay. Quaternary Re-search 23:313–326.
Zimov, S. A., V. I. Chuprynin, A. P. Oreshko, F. S. Chapin,J. F. Reynolds, and M. C. Chapin. 1995. Steppe–tundratransition: a herbivore-driven biome shift at the end of thePleistocene. American Naturalist 146:765–794.
APPENDIX
A review of the proposed causes of the Late Pleistocene extinctions in North America is presented in ESA’s ElectronicData Archive: Ecological Archives M075-011-A1.
Related Documents