1 Risk Factors for Children in the U.S., States, and Metropolitan Areas: Data from the 2007 American Community Survey Robert Kominski, U.S. Census Bureau Diana B. Elliott, U.S. Census Bureau Molly Clever, University of Maryland Session 186: ACS in Applied Demography PAA – 2009 Annual Meeting Detroit, Michigan

Robert Kominski, U.S. Census Bureau Diana B. Elliott, U.S. Census Bureau
Jan 02, 2016
Risk Factors for Children in the U.S., States, and Metropolitan Areas: Data from the 2007 American Community Survey. Robert Kominski, U.S. Census Bureau Diana B. Elliott, U.S. Census Bureau Molly Clever, University of Maryland Session 186: ACS in Applied Demography PAA – 2009 Annual Meeting - PowerPoint PPT Presentation
Welcome message from author
This document is posted to help you gain knowledge. Please leave a comment to let me know what you think about it! Share it to your friends and learn new things together.
Transcript

1
Risk Factors for Children in the U.S., States, and Metropolitan Areas: Data from the 2007
American Community Survey
Robert Kominski, U.S. Census Bureau
Diana B. Elliott, U.S. Census Bureau
Molly Clever, University of Maryland
Session 186: ACS in Applied Demography
PAA – 2009 Annual Meeting
Detroit, Michigan

2
Estimating Child Well-Being
• Lots of research efforts • Annie E. Casey, Child Trends, Federal
Interagency Forum• Foundation for Child Development/Ken Land• Many data sources – some integrated, some not
3
What is the goal?
• Portraying the status of children• Use indicators – link to “domains”• Some summarize scores (102.5), others do
not • See variability over groups, time and space• Geography is a problem – US is often the
best we can do
4
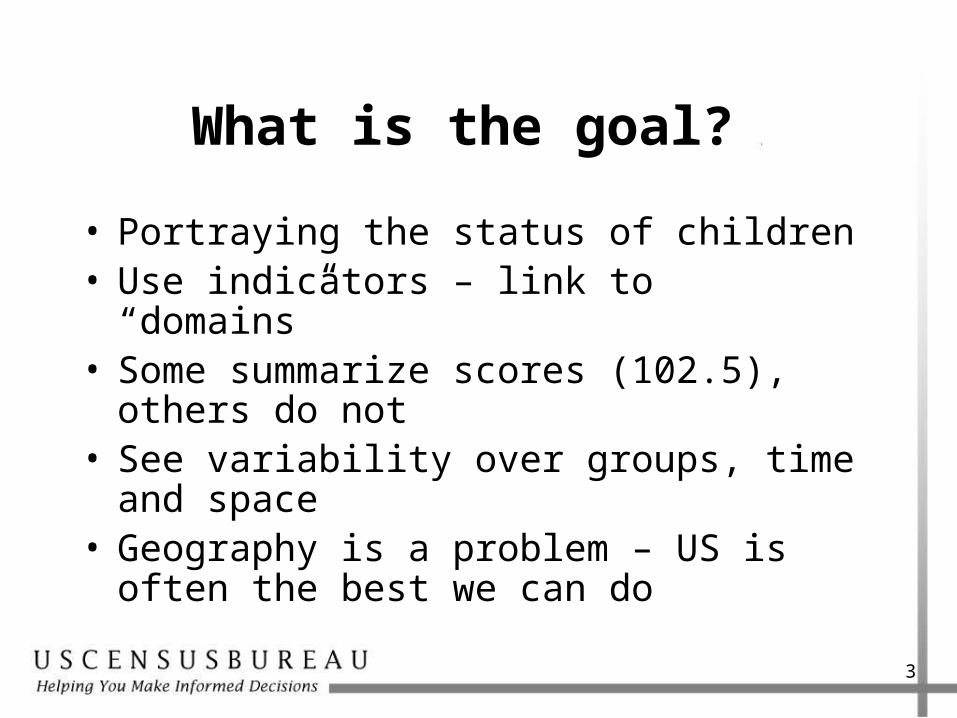
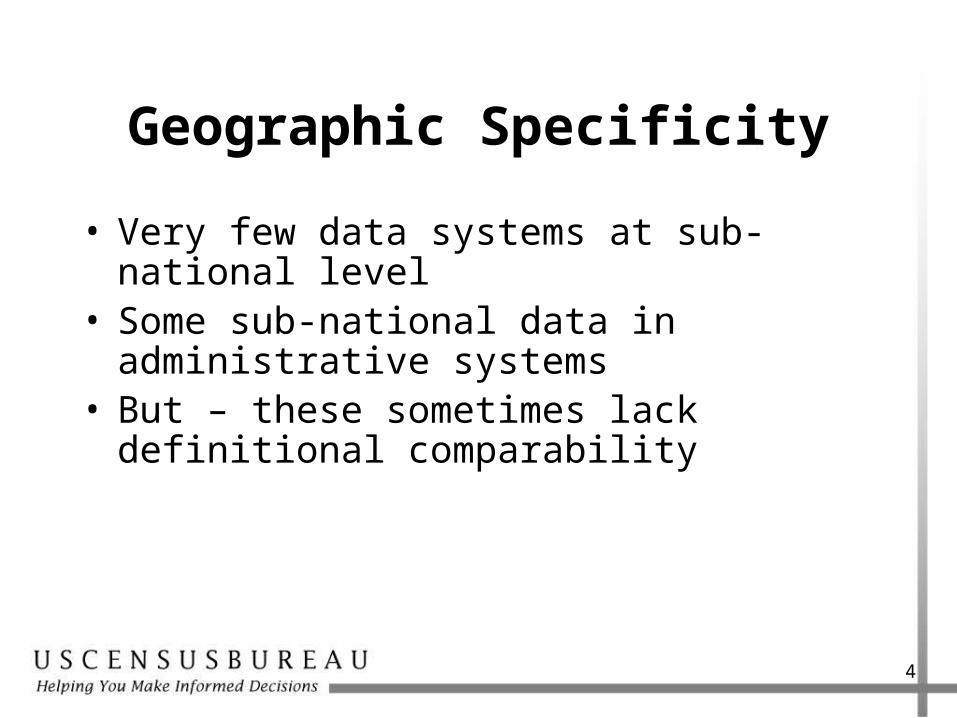
Geographic Specificity
• Very few data systems at sub-national level • Some sub-national data in administrative
systems • But – these sometimes lack definitional
comparability

5
Solution? • Consistent data source • Wide variety of measures • Collected routinely • For various subgroups • Across various levels of geography
American Community Survey (ACS)?
6
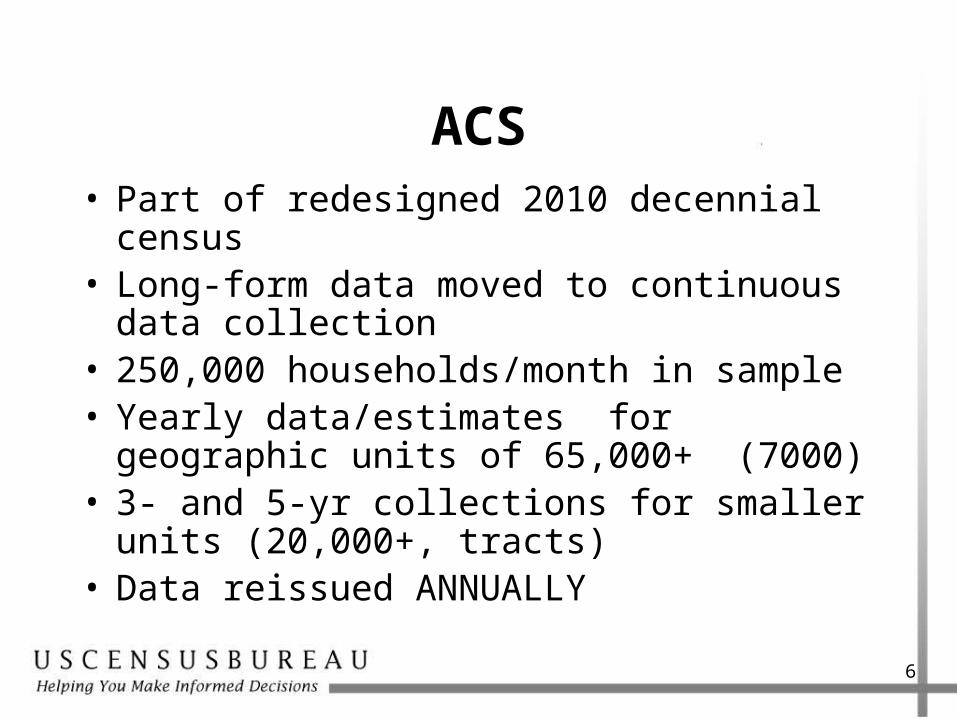
ACS• Part of redesigned 2010 decennial census • Long-form data moved to continuous data
collection • 250,000 households/month in sample • Yearly data/estimates for geographic units of
65,000+ (7000)• 3- and 5-yr collections for smaller units
(20,000+, tracts)• Data reissued ANNUALLY
7
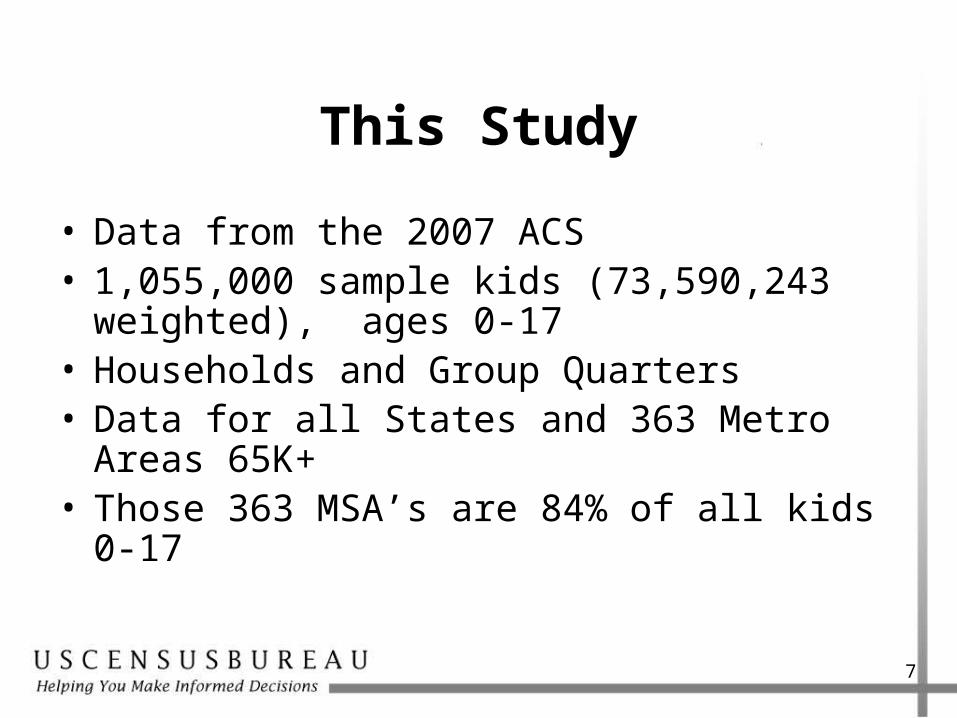
This Study
• Data from the 2007 ACS • 1,055,000 sample kids (73,590,243 weighted),
ages 0-17 • Households and Group Quarters • Data for all States and 363 Metro Areas 65K+• Those 363 MSA’s are 84% of all kids 0-17

8
Indicators
• No data set is fully complete • Identified 22 items in ACS data • Focus on ‘risk’ – conditions that might
negatively affect children• Four domains: Individual; Familial/Household;
Economic; Physical Environment• Some subjectivity and redundancy

9
22 Risk FactorsIndividual Familial and
HouseholdEconomic Physical
Environment
Presence of disability Single parent household Receives food stamps Overcrowded household
Presence of multiple disabilities
Linguistically isolated household
Household receives public assistance
Household lacks complete kitchen
Not enrolled in school – not HS grad
Non-English speaking household
Household below poverty
Household lacks complete plumbing
Speaks English less than very well
Parent(s) foreign born; in U.S. 5 years or less
No employed parent in household
Rented home
Child is foreign born; in U.S. 5 years or less
Parent(s) has less than high school education
Chronic unemployment in household
Not a single family home
Cared for by grandparent
Cared for by grandparent for 3 or more years

10
1.2 0.6 0.2 0.1 0 0 0 0
14.2
9.7
64.7
3.5
23.2
7.9
2.3
0
5
10
15
20
25
0 1 2 3 4 5 6 7 8 9 10 11 12 13 14 15
Figure 1: Number of Children by Number of Risk Factors (2007), in millions
Source: U.S. Census Bureau, American Community Survey, 2007
Number of Risk Factors
Nu
mb
er
of
Ch
ildre
n, i
n
mill
ion
s

11
Figure 2: Percentage of Children with Each Risk Factor (2007)
24.034.0
0.40.4
14.8
3.18.1
17.64.6
15.8
0.14.7
17.72.9
20.56.7
31.4
2.025.1
10.11.5
6.3
0 5 10 15 20 25 30 35
Presence of disability
Presence of mult disabilities
Not enrolled in school
Speaks Eng < very well
Child for. born, in US <=5 yrs
Single parent hh
Linguistically isolated hh
Non-English speaking hh
Parent(s) for. born, in US <=5 yrs
Parent(s) has < H.S. educ.
Cared for by gpnt
Cared for by gpnt for 3+ yrs
Receives food stamps
HH receives public assist.
HH below poverty
No empl. parent in hh
Chronic unempl. in hh
Overcrowded hh
HH lacks complete kitchen
HH lacks complete plumbing
Rented home
Not a single family home
Source: U.S. Census Bureau, American Community Survey, 2007
Ind
ivid
ual
Fam
ilia
l/H
HE
con
om
icP
hys
E
nvi
ron
.

12
Figure 3: Mean Risk Factors for Children by Selected Social Characteristics (2007)
0 1 2 3 4 5
3.75 - Hispanic
U.S. Mean: 2.18
1.77 - Not Hispanic
4.03 – Other race2.29 – Two or more races
3.08 – Nat. Hawaiian/Pac. Isl.2.54 - Asian
3.25 – Amer. Ind./Alaska Nat.3.24 – Black
1.68 - White
2.37 – 0 to 4 year olds
2.27 – 5 to 9 year olds2.06 - 10 to 13 year olds1.96 - 14 to 17 year olds
2.18 - Boys
2.18 - Girls
Source: U.S. Census Bureau, American Community Survey, 2007
Rac
eH
isp
anic
Ag
e G
rou
pS
ex

13
Figure 4: Percentage of Children with No Risk Factors by Selected Social Characteristics (2007)
0 10 20 30 40 50
9.1% - Hispanic
U.S.: 31.5%
37.4% - Not Hispanic
6.5% – Other race 25.7% – Two or more races
9.8% – Nat. Hawaiian/Pac. Isl.19.2% - Asian
12.3% – Amer. Ind./Alaska Nat.
13.1% – Black40.0% - White
28.0% - 0 to 4 year olds
31.9% - 5 to 9 year olds33.7% - 10 to 13 year olds
33.3% - 14 to 17 year olds
31.4% - Boys31.7% - Girls
Source: U.S. Census Bureau, American Community Survey, 2007
Rac
eH
isp
anic
Ag
e G
rou
pS
ex
14
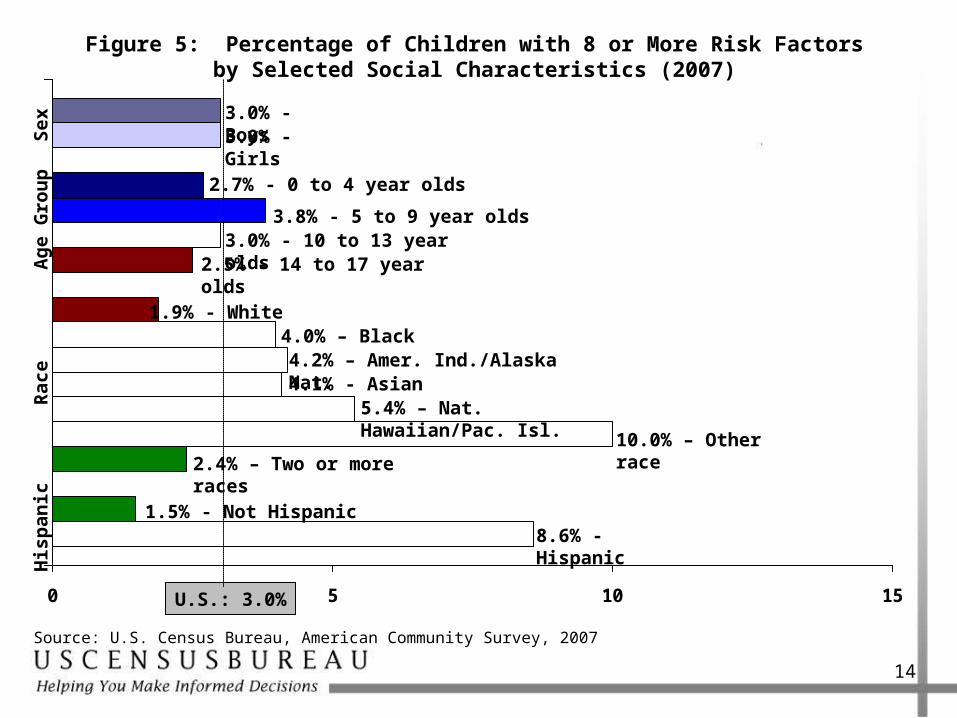
Figure 5: Percentage of Children with 8 or More Risk Factors by Selected Social Characteristics (2007)
0 5 10 15
8.6% - Hispanic
U.S.: 3.0%
1.5% - Not Hispanic
10.0% – Other race2.4% – Two or more races
5.4% – Nat. Hawaiian/Pac. Isl.4.1% - Asian4.2% – Amer. Ind./Alaska Nat.
4.0% – Black1.9% - White
2.7% - 0 to 4 year olds
3.8% - 5 to 9 year olds3.0% - 10 to 13 year olds
2.5% - 14 to 17 year olds
3.0% - Boys3.0% - Girls
Source: U.S. Census Bureau, American Community Survey, 2007
Rac
eH
isp
anic
Ag
e G
rou
pS
ex

15
Mean risk factors: States and Metros
Metros
Source: U.S. Census Bureau, American Community Survey, 2007
States
U.S. Mean:
2.2
0 to 1.9
2.0 to 2.9
3.0 to 3.9
0 to 0.9
1 to 1.9
2 to 2.9
3 to 3.9
4 or more
Outside Metro Area

16
No risk factors: States and Metros
Metros
Source: U.S. Census Bureau, American Community Survey, 2007
States
U.S. Average:
31.5%
Less than 10%
10 to 19.9%
20 to 29.9%
30 to 39.9%
40 to 49.9%
50% or more
Outside Metro Area
Less than 20%
20 to 29.9%
30 to 39.9%
40% or more
17
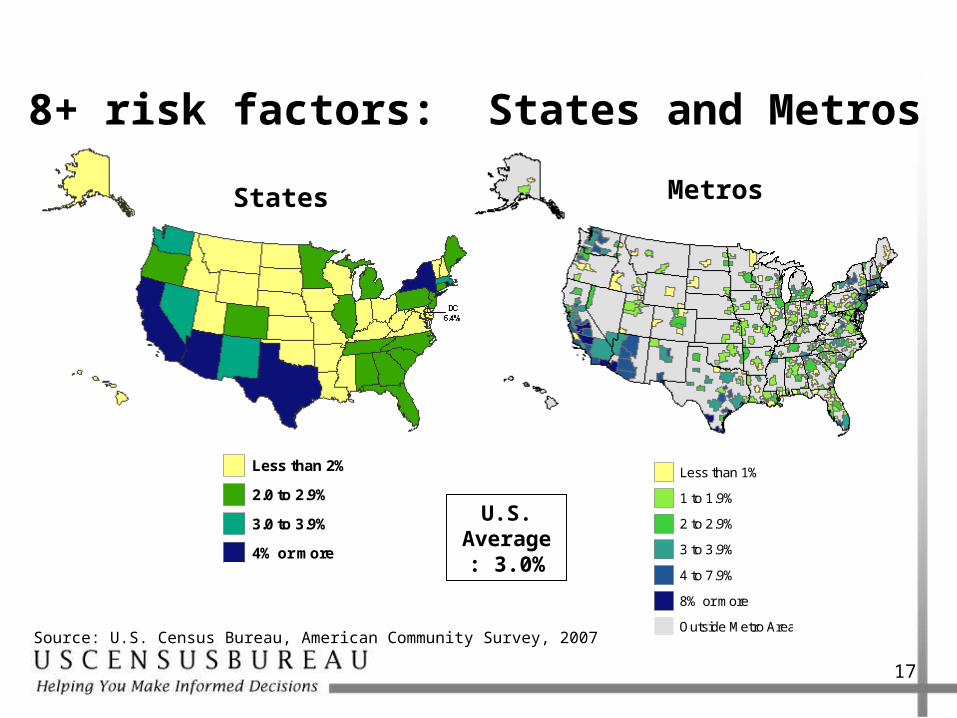
8+ risk factors: States and Metros
Metros
Source: U.S. Census Bureau, American Community Survey, 2007
States
U.S. Average:
3.0%
Less than 2%
2.0 to 2.9%
3.0 to 3.9%
4% or more
Less than 1%
1 to 1.9%
2 to 2.9%
3 to 3.9%
4 to 7.9%
8% or more
Outside Metro Area
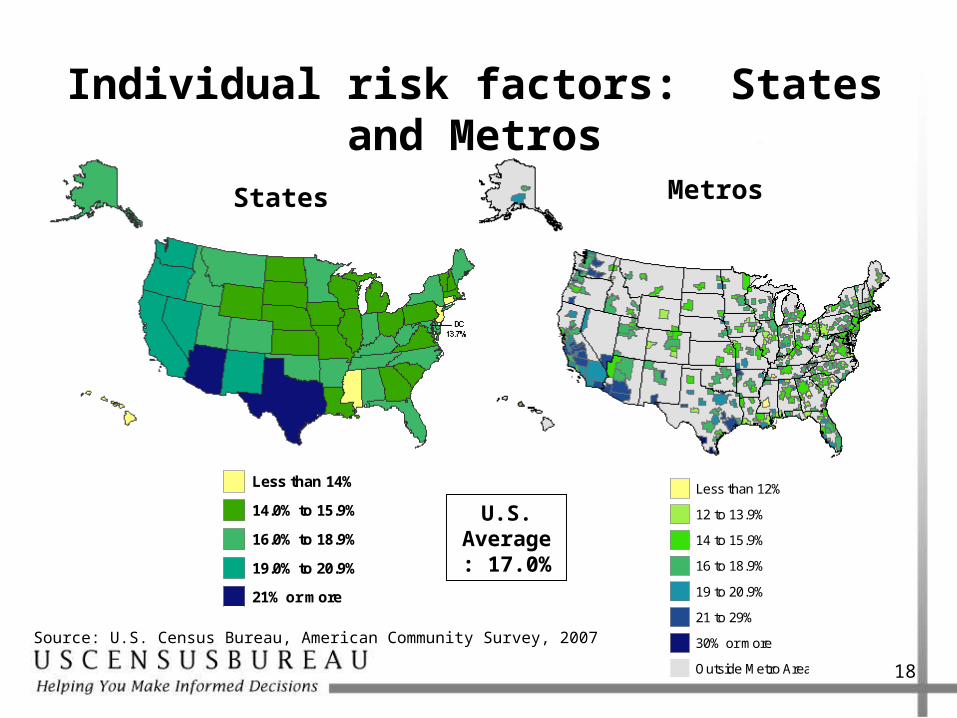
18
Individual risk factors: States and Metros
Metros
Source: U.S. Census Bureau, American Community Survey, 2007
States
Less than 14%
14.0% to 15.9%
16.0% to 18.9%
19.0% to 20.9%
21% or more
Less than 12%
12 to 13.9%
14 to 15.9%
16 to 18.9%
19 to 20.9%
21 to 29%
30% or more
Outside Metro Area
U.S. Average:
17.0%

19
Familial and household risk factors: States and Metros
Metros
Source: U.S. Census Bureau, American Community Survey, 2007
States
U.S. Average:
52.0%
Less than 40%
40.0 to 49.9%
50.0 to 59.9%
60.0 to 69.9%
70% or more
Less than 30%
30 to 39%
40 to 49%
50 to 59%
60 to 69%
70 to 79%
80% or more
Outside Metro Area

20
Economic risk factors: States and Metros
Metros
Source: U.S. Census Bureau, American Community Survey, 2007
States
U.S. Average:
27.1%
Less than 20%
20.0 to 24.9%
25.0 to 29.9%
30.0 to 34.9%
35% or more
Less than 15%
15 to 19.9%
20 to 24.9%
25 to 29.9%
30 to 34.9%
35 to 44.9%
45% or more
Outside Metro Area
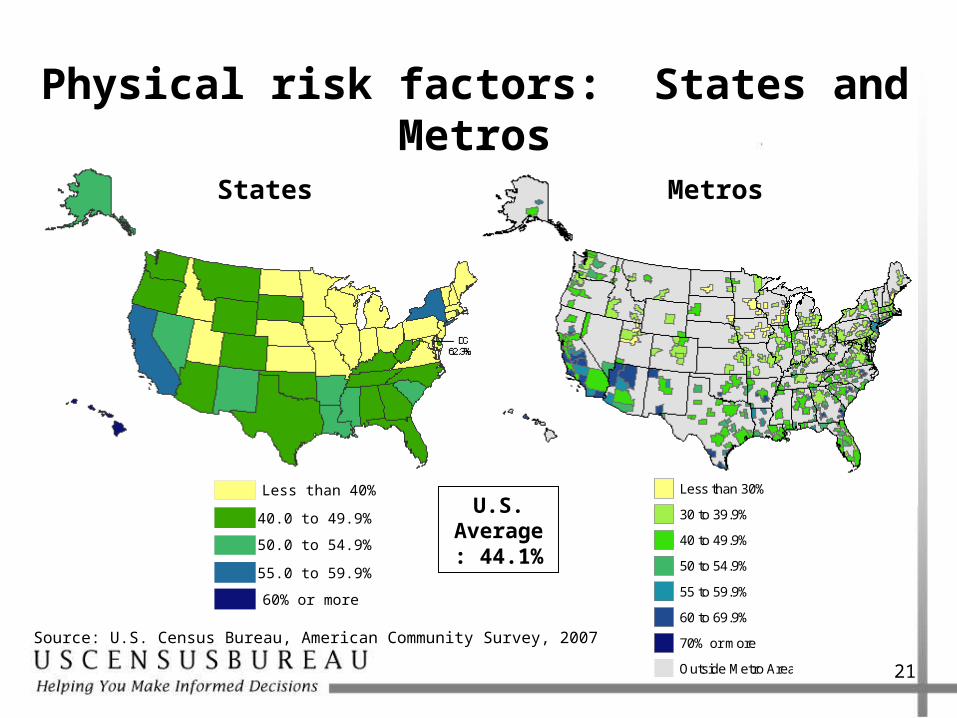
21
Physical risk factors: States and Metros
States Metros
Source: U.S. Census Bureau, American Community Survey, 2007
Less than 40%
40.0 to 49.9%
50.0 to 54.9%
55.0 to 59.9%
60% or more
Less than 30%
30 to 39.9%
40 to 49.9%
50 to 54.9%
55 to 59.9%
60 to 69.9%
70% or more
Outside Metro Area
U.S. Average:
44.1%
22
Summary
• Analysis shows risk is not evenly distributed across groups or space
• High geography (state) hides variability at lower levels (metros)
• While the ACS is not perfect, content comparability, geographic specificity and temporal regularity are BIG plusses

23
Contact Information
U.S. Census BureauHousing and Household Economic Statistics
Division
Robert [email protected]
Diana B. [email protected]
Related Documents