THE MODIFYlNG EFFECT OF AGNG AND TRACKING ON RISK FACTORS FOR ISCHEMIC HEART DISEASE IN THE MANITOBA FOLLOW-UP STUDY ROBERT BRUCE TATE A Thesis Submitted to the Faculty of Graduate Studies in Partial Fulfillment of the Requirements for the Degree of DOCTOR OF PHILOSOPHY Deparûnent of Community Health Sciences University of Manitoba Winnipeg, Manitoba O CopHght by Robert Bruce Tate, November 1999

Welcome message from author
This document is posted to help you gain knowledge. Please leave a comment to let me know what you think about it! Share it to your friends and learn new things together.
Transcript
THE MODIFYlNG EFFECT OF AGNG AND TRACKING ON RISK FACTORS FOR
ISCHEMIC HEART DISEASE IN THE MANITOBA FOLLOW-UP STUDY
ROBERT BRUCE TATE
A Thesis Submitted to the Faculty of Graduate Studies
in Partial Fulfillment of the Requirements for the Degree of
DOCTOR OF PHILOSOPHY
Deparûnent of Community Health Sciences University of Manitoba
Winnipeg, Manitoba
O CopHght by Robert Bruce Tate, November 1999

National Library Biblioth$ue nationale du Cana a
Acquisitions and Acquisitions et Bibliognphic Services services bibliographiques
The author has granted a non- exclusive licence dowing the National Library of Canada to reproduce, loan, distribute or sel1 copies of this thesis in microfonn, papa or electronic formats.
The author retains ownership of the copyright in this thesis. Neither the thesis nor substantial extracts fiom it may be printed or otherwise reproduced without the author's permission.
L'auteur a accordé une licence non exclusive permettant à la Bibliothèque nationale du Canada de reproduire, prêter, distribuer ou vendre des copies de cette thèse sous la forme de microfiche/film, de reproduction sur papier ou sur format électronique.
L'auteur conserve la propriété du droit d'auteur qui protège cette thèse. Ni la thèse ni des extraits substantiels de celle-ci ne doivent être imprimes ou autrement reproduits sans son autorisation.

THE UNIVERSITY OF MANITOBA
FACULTY OF GRADUATE STUDIES **+*+
COPYRIGHT PERMISSION PAGE
The Modimg Effeet of Aging and Trieking oa Risk Faeton for Iwhemle Heart Distase in the Manitoba Foilow-up Study
Robert Bmce Tate
A TherlrlRaelleum submitteà to the Facuity of Graduate Studlcr of The Univertity
of Manitoba in partial hilflllment of the rcqrlnments of the degrte
of
Robert Bmce Tat&1999
Peds8ion hm ken p n t d to the Libnry of The Udvernlty of Manitoba to lend or HU copia of thia tbcdJpmCticum, to tbe N i t k d Ubnry of Cam& to microfilm thi8 theais and to lend or di copiea of the Nm, and to Disaertation~ Abstracts ïntetzutiomI to pubiish i n 8-a of thb thcddpriletic~m,
The author reaewea 0th- prblkrtion righh and neither tus thddpncticom mr estendve extrreti from it nry k pdated or othtrwîrc reproduced withoat the autllrat'r written permi1slo0.

TABLE OF CONTENTS
. . ................................................................................................................... ABSTRACT v11
...................................................................................... DEDICATION ix
ACKNOWLEDGEMENT. ............................................................................................. x
......................................................................................................... LIST OF FIGURES xi
LIST OF TABLES. ......................................................................................................... xii
......................................................................................... LIST OF ABBREVIATIONS xv
1 INTRODUCTION.m ~ . m ~ ~ o ~ ~ . ~ . . ~ ~ ~ m ~ . o ~ m . . * . . s ~ ~ ~ * . ~ . m ~ . m a m m m o o I
1.5 SPECIFIC OBJECTIVES ......................................................................................... 9
............................... 2 A HISTORY OF THE MANITOBA FOLLOW-UP STUDY 12
2 . I ABOUT DR . F.A.L. MATHEWSON (1 905-1 994) ................................................ 12
2.3 DATA COLLECTION AND MANAGEMENT ........................................................ 14 2.3.1 Annuaicontactandmonitoringofvital status .......................................... 14 2.3.2 Medical examinations ..................................... .................................... 15 2.3.3 Survey questionnaires .......................................................................... 16
2.4 FUNDING. .................... ... .................................................................................. 17
2.5 DATA ANALYSIS AND PUBLICATION ............................................................ 17
3 LITERATURE REVIE W ....................................................................................... ..19 3.1 A GLOBAL PERSPECTIVE OF CARDlOVASCULM DISEASE .................................. 20
3 . 3 THE PATHOLOGICGL BASIS FOR ISCHEMIC HEART DISEASE ....................... , ..... 22
3 . 4 WSK FACTORS FOR CARDlOVASCULAR DISEASE ............................................ 26 3.4.1 Highbloodpressure ............................................................................ 2 6

4.2.2.1 Angina Pectoris .......................................................................................... 63 4.2.2.2 Myocardial Infmtion .................................................................................. 63 4.2.2*3 Sudden Death ................................................................................................ 64
........................................................................... 4.2.3 Definition of risk factors 64 .......................................................................... 4.2.4 Follow-up of the whort 66
........................................................ 4.2.5 Mortality experience of the cohort 6 7 ..................................................... 4.2.6 Selection of examinations for analysis 70
5.1 DEFINITION OF CARDIOVASCULAR DlSEASE OUTCOMES ................................ 75
5.2 DEFMITION OF RISK FACTORS FOR CARDIOVASCULAR DISEASE ........................ 76
..................................... 5.3 TIME OF OCCURRENCE OF CARD~OVASCULAR DISEASE 77
5.4 STATISTICAL CONSIDERATIONS CONCERNING THE ASSOCIATION BETWEEN RlSK ............................ ...................... FACTORS AND CARDIOVASCULAR DlSEASE .. 81
5.4.1 Kaplan-Meier estimate of the survival curve and the log rank and ........................................................................................... Wilcoxon tests 82
................................................................................................ 5 .4.2 ûâds ratios 84 ............................................................... 5.4.3 Mantel-Haenszel chi-square test 85
....................................................................... 5.6 MODELMG B NARY OUTCOMES 87 .......................................................................... 5 6 . 1 Linear Probability Mode1 87 ....................................................................... 5.6.2 Logistic Regression Mode1 88
.............................................................................. 5.7 MODELM TIME TO EVENT 91 ................................................................ 5.7.1 The Poisson Regression Mode1 9 1
........................................................ 5.7.2 The Cox Proportional Hazard Mode1 92 ..................................................................... 5.7.3 Parametnc S u ~ v a l Models 9 5
......................................... 5.9 STATISTICAL METHODS FOR SPECIFIC OBJECTIVES 9 8 ...... . 5.9.1 Methodology for Objective 1 Incidence of Ischemic Heart Disease 98
5.9.2 Methodology for Objective 2 . Patterns of risk factors by age and time .. 99 5.9.2.1 Detmnination of age-specific percentiles of risk factors ............................. 99
....... 5.9.2.2 Distribution of nsk factors at 5-year birth anniversaries ... ............. 100 ...... 5.9.3 Methodology for Objective 3 - Tracking of continuous nsk factors 100
5.9.4 Methodology for Objective 4 . Modeling nsk factors for Ischemic Heart ................................................................ .............................. Disease .. 102
5 9.4.1 Trends in incidence of Ischemic Hem Disease within categories of nsk ......................................................................................................... factors 102
........................................... 5 M . 2 Age specific Cox proportional hazard models 103 iii
5.9.4.3 Testing the proportionality assumption of the Cox proportional hazard mode1 .................................................................................................................... 104
5.9.4.4 Testing the varying effect of risk factors with age ..................................... 105 5.9.4.5 Multivariate Cox proportional hazard modeling of Ischemic Heart Disease
.................................................................................................................... 105 5.9.5 Methodology for Objective 5 - Contribution of tracking to models of
........................................................................... Ischemic Heart Disease 106 5.9.5.1 Charactmisation of individual risk factor patterns over tirne ..................... 106 5.9.5.2 Level, trend and variability of risk factors over time and Ischemic hem
........................................................................................................ Diseasc 108
6.1 INCIDENCE OF ISCHEMIC HEART DISEASE AND ITS MANIFESTATIONS ............. 109 6.1.1 Age-specific incidence of lschernic Heart Disease ................................. 109 6.1.2 Age-specific incidence of Angina Pectoris. Myocardial Infarction and
.......................................................................................... Sudden Deah 1 1 1 6.1.3 Summary of incidence of Ischernic Heart Disease ................................. 112
6.2 DISTRIBUTION OF RISK FACTORS FOR ISCHEMM: HEART DISEASE ................... 112 6.2.1 Percentile distribution of Systolic Blood Pressure .................................. 114 6.2.2 Age and period effects on Systolic Blood Pressure ................................ 115 6.2.3 Percentile distribution of Diastolic Blood Pressure ................................ 116 6.2.4 Age and perioâ effects on Diastolic Blood Pressure .............. .. ........... 117 6.2.5 Percentile distribution of Body Mass Index ............................................ 118
.......................................... 6.2.6 Age and period effects on Body Mass Index 119 ............................................................. 6.2.7 Prevalence of Diabetes Mellitus 121
........................................................................... 6.2.8 Prevalence of Smoking 122 .......................... .................................. 6.2.9 Summary of risk factor profiles .. 122
.......................................................................... 6.3 TRtWUNG OF RISK FACTORS 123 6.3.1 Serial correlation of repeated measurernents over time by age ............... 125
........................................................... 6.3. I . 1 Systolic Blood Pressure. comlation 125 ......................................................... 6.3.1.2 Diastolic Blood Pressure. correlation 125
..................................................................... 6.3.1.3 Body Mass Index. correlation 126 ............................ 6.3.1.4 Summary of correlation between measurements by age 128
................................................ 6.3.2 Relative likelihd methods for tracking 128 ........................................................................ 6.3.2.1 Tracking in the top quintile 128
6.3.2.2 Tracking in the bottom quintile .................................................................. 132 .......................................................... 6.3.3 Summary of evidence for tracking 134
6.4 EFFECT OF AGiNG ON THE RELATIONSHIP BETWEEN RiSK FACTORS AND ...................................................... INCIDENCE OF ISCHEMIC HEART DISEASE 135
6.4.1 Risk factors and patterns of incidence of Ischemic Heart Disease ......... 135 6.4.1 . 1 Summaiy of risk factors and patterns of incidence of Ischemic Heart Disease
6.4.2 Risk factors and patterns of incidence of Angina Pectoris. Myocardial Infmtion and Sudden Death ................................................................... 143
6.4.3 Cox proportional hazard models of risk factors for Ischemic Heart Disease ................................................................................................................. 147
6.4.3.1 Models of Systolic Blood Pressure and Ischemic Heart Disease ............... 148 6.4.3.2 Models of Diastolic Blood Pressure and Ischemic Heart Disease ............. 152
......................... 6.4.3.3 Models of Body Mass index and Ischemic Heart Disease 155 6.4.3.4 Models of Diabetes Mellitus and Ischemic Heart Disease ......................... 158 6.4.3.5 Models of Smoking and Ischernic Heart Disease ....................................... 160 6.4.3.6 Testing the proportionality assurnption for risk factors in Cox proportional
............................................................................................. hazard rnodels 163 6.4.3.7 Summary of modeling aging effects on risk factors for Ischemic Heart
........................................................................................................ Disease 165 6.4.4 Multivariate Cox proportional hazard modeling of risk factors for
........................................................................... Ischemic Heart Disease 167 6.4.4.1 Age specific multivariate models for Ischemic Heart Disease .................. 167
............... ......... 6.4.4.2 Age specific multivariate modeis for Angina Pectoris .... 169 6.4.4.3 Age specific multivariate for Myocardial Infarction ................................. 171 6.4.4.4 Age specific multivariate models for Sudden Death .................................. 173 6.4.4.5 Summary of multivariate modeling of risk factors for Ischernic Heart
Disease ........................................................................................................ 175
6.5 TRACKING RlSK FACTORS M INDIVIDUALS AND MCIDENCE ISCHEMIC HEART DISEASE ......................................................................................................... 177
6.5.1 Level. trend and variability of continuous risk factors ........................... 177 6.5.2 The relationship of Systolic Blood Pressure tracking to incidence of
.......................................................................... Ischernic Heart Disease 181 ..................... 6.5.3 Modeling aspects of tracking and Ischemic Hem Disease 182
........................................................................................................... 7 DISCUSSION 185
............. 7.2 THE DESIGN AND CONDUCT OF THE MANITOBA FOLLOW-UP STUDY 188 7.2.1 Unique aspects of the Manitoba Follow-up Study .................................. 189 7.2.2 Strengths. weaknesses and generalizability of the Manitoba Follow-up
Study ...................................................................................................... 192
.... ..................................... 7.3 COMPARISON OF RESULTS TO OTHER STUDIES ..... 197 ...................................................... 7.3.1 Incidence of Ischernic Heart Disease 197
.......................................................................... 7.3.2 Risk factor distributions 201 ................................. 7.3.3 Tracking of Blood Pressure and Body Mass Index 203
....................................... 7.3.4 Risk factor effects for Ischemic Heart Disease 207 7.3.4.1 Declinhg effect of risk factors with age ................................................... 207 7.3.4.2 Varying effect of nsk factors for diffamt manifestations of Ischemic Hem
Disease ........................................................................................................ 211 7.3.5 The value of risk factor tracking in models of Ischemic Heart Disease . 2 14
v
7.4 EFFEC~ MODIFICATION OF RKK FACTORS FOR ISCHEMIC HEART DISEASE ..... 2 1 7 7.4.1 Statistical considerations . . ... . . . . . . . . . . . . . . . . . . . . . . . . . . . . . . . . . . . . . . . . . . . . . . . . . . . . . . . . . . . . . . . . . . . . 2 1 7 7.4.2 Interpretation of the changing effect of risk factors for Ischemic Heart
Disease .,.., ...................... ............................................ ............................. 220
7.5 CONCLUSIONS AND IMPLICATIONS OF FINDINGS ........ ..................................... 223
9.1 APPENDLY 1 : LETTER FROM THE FACULTY COMMI'ITEE ON THE USE OF HUMAN SUBJECTS M RESEARCH, UNIVERSITY OF MANITOBA. OCTOBER 10,1996 ... 247
9.2 APPENDIX 2: PEER REVIEWED PUBLICATlONS FROM THE MANITOBA FOLLOW- UP STUDY ...................................................................................................... 248
ABSTRACT
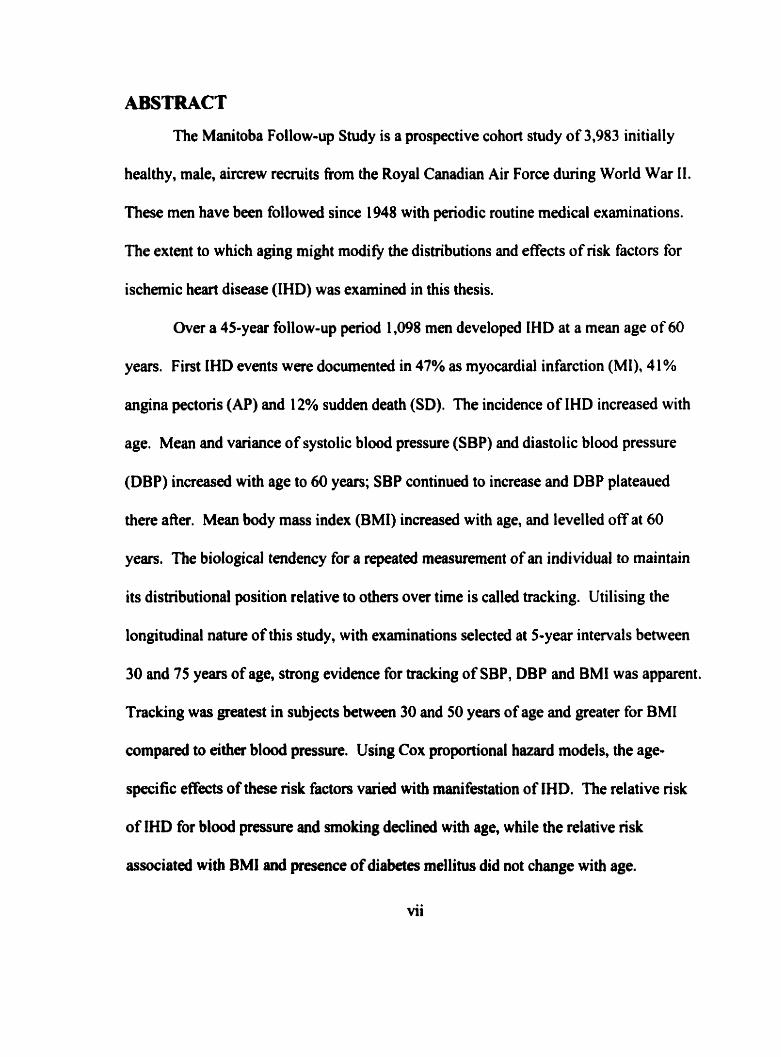
The Manitoba Follow-up Study is a prospective cohort study of 3,983 initially
healthy, male, aircrew remiits fiom the Royal Canadian Air Force during World War II.
These men have been followed since 1948 with periodic routine medical examinations.
The extent to which aging might modify the distributions and eflects of risk factors for
ischernic heart disease (IHD) was exarnined in this thesis.
Over a 45-year follow-up period 1,098 men developed IHD at a mean age of 60
years. First IHD events were documented in 47% as myocardial infarction (MI), 4 1 %
angina pectoris (AP) and 1 2% sudden death (SD). The incidence of IHD increased with
age. Mean and variance of systolic blood pressure (SBP) and diastolic blood pressure
(DBP) increased with age to 60 years; SBP continued to increase and DBP plateaued
there afier. Mean body mass index (BMI) increased with age, and levelled off at 60
years. The biological tendency for a repeated measwement of an individual to maintain
its distributional position relative to others over time is called tracking. Utilising the
longitudinal nature of this study, with exarninations selected at 5-year intervals between
30 and 75 years of age, strong evidence for tracking of SBP, DBP and BMI was apparent.
Tracking was Fatest in subjects between 30 and 50 years of age and greater for BMI
compand to eithcr blood pressure. Using Cox proportional hazard models, the age-
specific effects of these risk factors varied with manifestation of IHD. The relative risk
of IHD for blood pressure and smoking declineû with age, while the relative risk
associated with BMI and presence of diabetes mellinis did not change with age.
vii
Individual characterisations of tracking based on the regression of percentiles of SBP,
DBP and BMI on age contributed to models of IHD at age 50,60 and 70 years, in
addition to risk factor measurements at those ages.
The dynamic relationship between age and risk factors for IHD, with respect to
distributions, magnitude of effect, relative importance and patterns evolving €rom
repeated measurement should be important considerations when planning primary
preventive strategies for IHD.
viii

DEDICATION
This thesis i s dedicated to
the mernory of Dr. F. A. L. Mathewson
and
the 3,983 members of
The Manitoba Follow-up Study
ACKNOWLEDGEMENT
While this thesis is dedicated to the memory of Dr. F. A. L. Mathewson, it i s with
sincere admiration that 1 M e r acknowledge his foresight in the design and his
detemination in the execution leading to the success of the Manitoba Follow-up Study.
My thanks goes to Dn. T.K. Young and T.H. Hassard, the members of my
advisory cornmittee fiom the Department of Cornmunity Health Sciences for their
guidance. During the early years of the Study, my extemal advisor, Dr. T.E. Cuddy, then
a young medical student, was employed by Dr. Mathewson. Dr. Cuddy returned forty
y e m later to succeed Dr. Mathewson as the Medical Director of the Study. His
mentorship in cardiology and insight in cardiovascular research throughout my student
life was invaluable. At every step of my doctoral research, Dr. Jure ManMa, my
advisor, has challengeâ me with his critical review. A b many hours of thinking and
rethinking his cornments, I believe a better product has emergeù. Thank you, Jure.
Brenda, and our sons, Andy and Kevin, permittecl me the time and oppominity to
pursue this doctoral program. Without their love and unwavering support over the past
five years, 1 would not have succeeded. Thank you all, fiom the boaom of my heart.
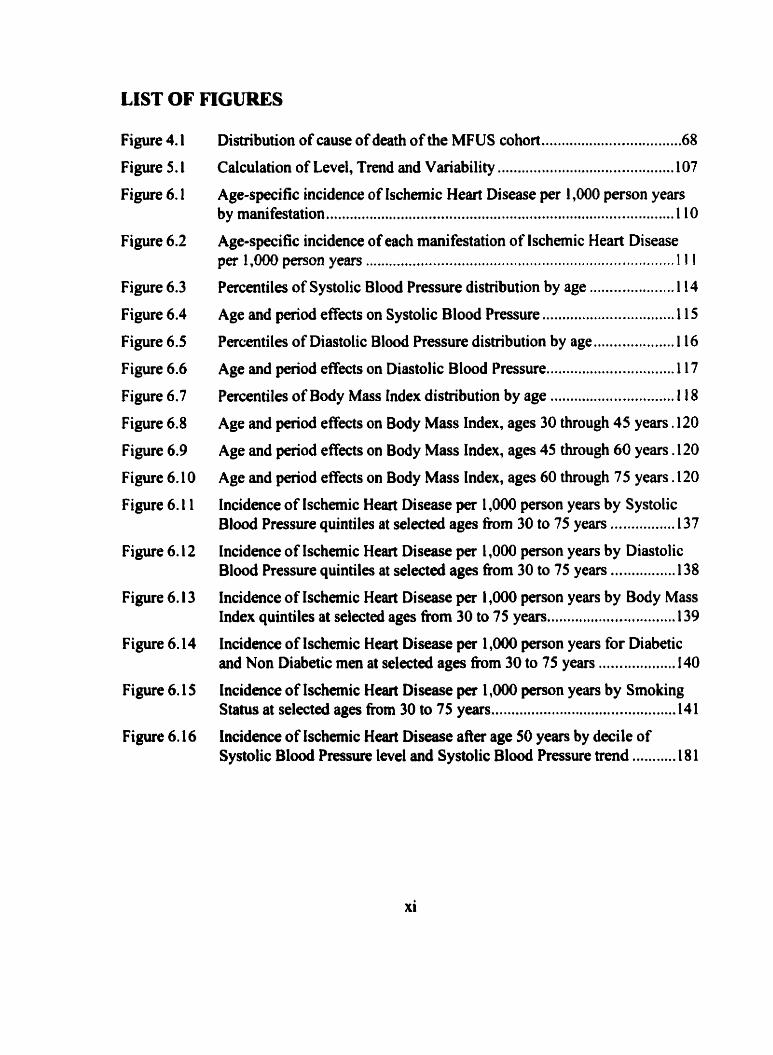
LIST OF FIGURES
Figure 4.1
Figure 5.1
Figure 6.1
Figure 6.2
Figure 6.3
Figure 6.4
Figure 6.5
Figure 6.6
Figure 6.7
Figure 6.8
Figure 6.9
Figure 6.10
Figure 6.1 1
Figure 6.12
Figure 6.13
Figure 6.14
Figure 6.15
Figure 6.16
Distribution of cause of death of the MFUS cohort ................................... 68
Calculation of Level, Trend and Variability ................................... ......... 107
Age-specific incidence of Ischemic Heart Disease per 1,000 person years by manifestation ......... .. .. ....... .. .. .. . . . . . . . . . . . . . . . . . . . . . . . . . . . . . . . . . 1 10
Age-specific incidence of each manifestation of Ischemic Heart Disease per 1,000 person y e m . .. .. . . . . . . . . . . . . . . . . . . . . . . . . . . . . . . . . . . . . . . . . . . . . . . . . . . . . . . . . . . . . . . . . . . . . . . . . 1 I I
Percentiles of Systolic Blood Pressure distribution by age ..................... 1 14
Age and period effects on Systolic Blood Pressure .................... .... ......... 1 15
Percentiles of Diastolic Blood Pressure distribution by age .................... 1 16
Age and period effects on Diastolic Blood Pressure ................................ 1 17
Percentiles of Body Mass Index distribution by age ............................... 1 18
Age and period effects on Body Mass Index, ages 30 through 45 years ,120
Age and period effects on Body Mass Index, ages 45 through 60 years ,120
Age and pdod effects on Body Mass Index, ages 60 through 75 years .l20
Incidence of Ischemic Heart Disease per 1,000 person years by Systolic Blood Pressure quintiles at selected ages h m 30 to 75 years ................ 137
Incidence of lschemic Heart Disease per 1,000 person years by Diastolic Blood Pressure quintiles at selected ages fiom 30 to 75 years ................ 138
Incidence of Ischemic Heart Disease per 1,000 person years by Body Mass Index quintiles at selected ages h m 30 to 75 years.. . . . . . .. . . . . . . . . .. ... .. . .. . .. . .139
Incidence of lschemic Heart Disease per 1,000 person years for Diabetic and Non Diabetic men at selected ages from 30 to 75 years ................... 140
Incidence of Ischemic Heart Disease per 1,000 person y e m by Smoking Stahis at selected aga fiom 30 to 75 years ........................................ 141
Incidence of Ischemic Heart Disease afier age 50 years by decile of Systolic Blood Pressure level and Systolic Blood Pressure trend . .... . ... . . 1 8 1
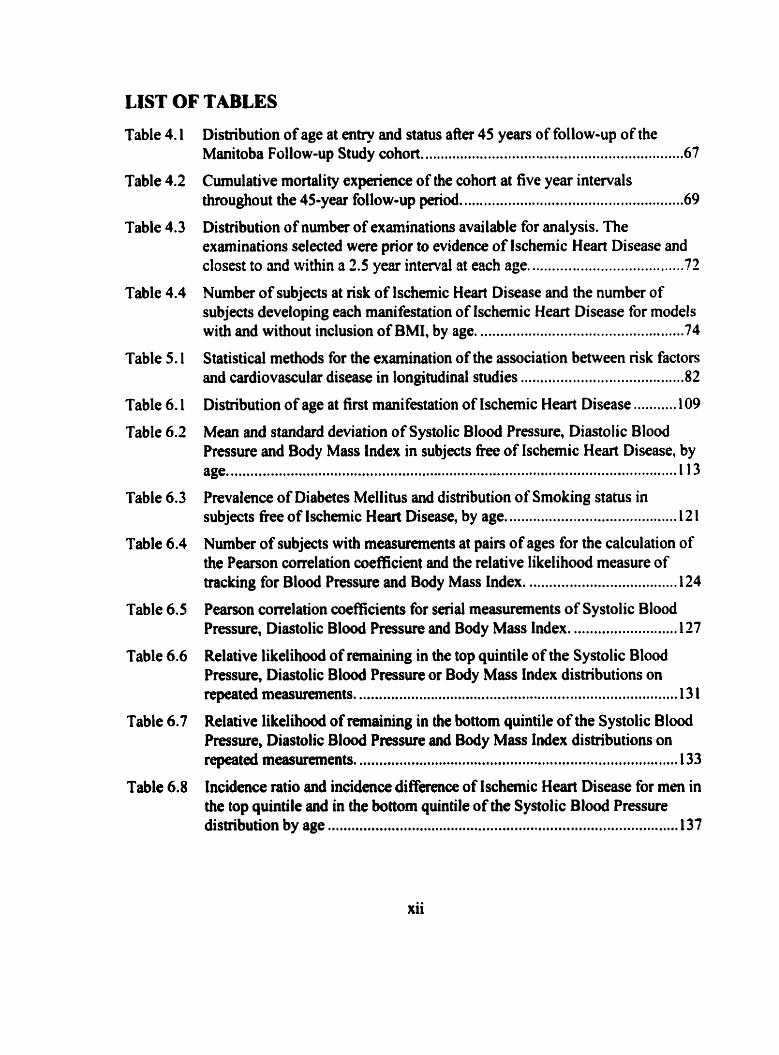
LIST OF TABLES
Table 4.1
Table 4.2
Table 4.3
Table 4.4
Table 5.1
Table 6.1
Table 6.2
Table 6.3
Table 6.4
Table 6.5
Table 6.6
Table 6.7
Table 6.8
Distribution of age at entry and status after 45 years of follow-up of the ................................................................ Manitoba Follow-up Study cohort. -67
Cumulative mortality experimce of the cohort at five year intervals .................... throughout the 45-year follow-up period. .. ............................. .69
Distribution of number of examinations available for analysis. The examinations selected were prior to evidence of lschemic Heart Disease and closest to and within a 3.5 year interval at each age. ...................................... 72
Number of subjects at risk of Ischemic Heart Disease and the number of subjects developing each manifestation of Ischemic Heart Disease for models with and without inclusion of BMI, by age. ................................................... 74
Stritistical methods for the examination of the association between nsk factors and cardiovascular disease in longitudinal studies ........................................ -82
........... Distribution of age at first manifestation of Ischernic Heart Disease 109
Mean and standard deviation of Systolic Blood Pressure, Diastolic Blood Pressure and Body Mass Index in subjects fiee of Ischemic Heart Disease, by age ................................................................................................................. 113
Prevalence of Diabetes Mellihis and distribution of Smoking status in ......................................... subjects fke of lschemic Heart Disease, by age. 12 1
Number of subjects with measurements at pain of ages for the calculation of the Pearson correlation coefficient and the relative likelihood mesure of tracking for Blood Pressure and Body Mass Index. .................................... .124 Pearson correlation coefficients for serial measurements of S ystolic Blood Pressure, Diastolic Blood Pressure and Body Mass Index. .......................... 127
Relative likelihood of remaining in the top quintile of the Systolic Blood Pressure, Diastolic B l d Pressure or Body Mass Index distributions on repeated measurements. ............................................................................... .13 1 Relative likelihood of remaining in the bottom quintile of the Systolic Blood Pressure, Diastolic Blood Pressure and Body Mass Index distributions on
................................................................................ repeated measumnents. 133
Incidence ratio and incidence difference of Ischemic Heart Disease for mm in the top quintile and in the bottom quintile of the Systolic Blood Pressure disaibution by age ........................................................................................ 137
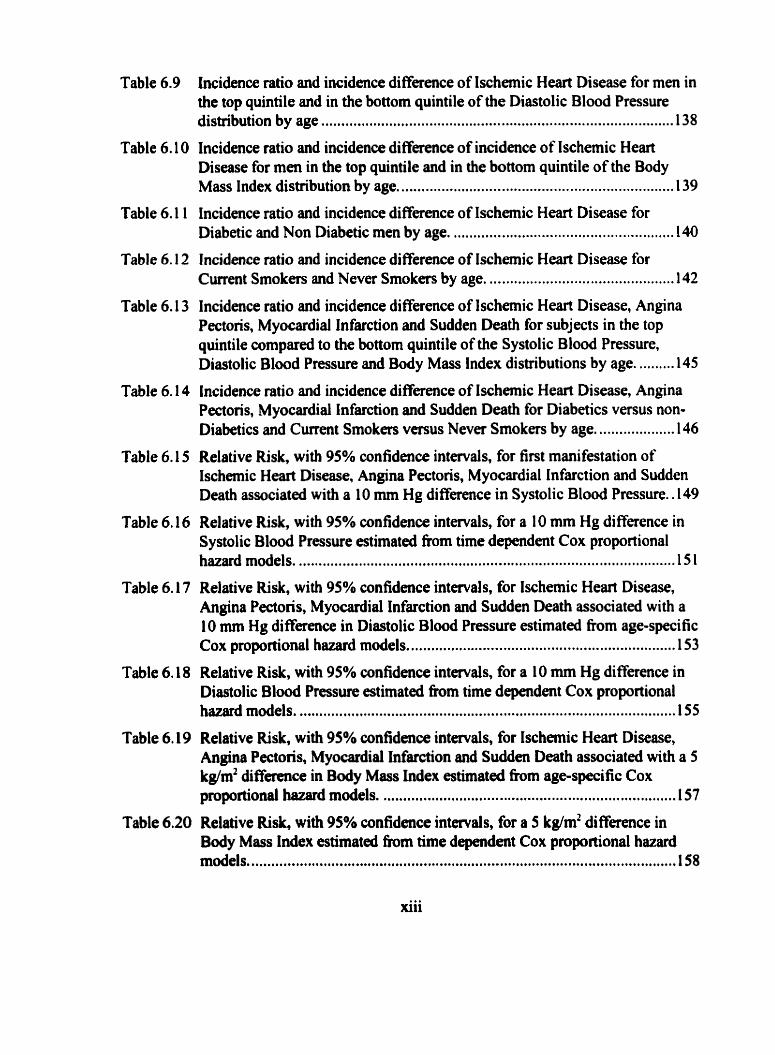
Table 6.9 Incidence ratio and incidence difference of Ischemic Heart Disease for men in the top quintile and in the bottom quintile of the Diastolic Blood Pressure
....................................................................................... distribution by age 1 38
Table 6.10 Incidence ratio and incidence difference of incidence of Ischemic Heart Disease for men in the top quintile and in the bottom quintile of the Body
................................................................... Mass Index distribution by age. 1 39
Table 6.1 1 Incidence ratio and incidence diffmence of Ischernic Heart Disease for Diabetic and Non Diabetic men by age. ..................................................... 140
Table 6.12 Incidence ratio and incidence difference of Ischemic Heart Disease for .............................................. Current Smokers and Never Smokers by age. 142
Table 6.1 3 Incidence ratio and incidence difference of lschemic Heart Disease, Angina Pectoris, Myocardial Infarction and Sudden Death for subjects in the top quintile compared to the bottom quintile of the Systolic Blood Pressure, Diastolic Blood Pressure and Body Mass index distributions by age. ........ .145
Table 6.14 Incidence ratio and incidence difference of Ischemic Heart Disease, Angina Pectoris, Myocardial lnfwction and Sudden Death for Diabetics versus non- Diabetics and Current Smokers versus Never Smokers by age. ................... 146
Table 6.15 Relative Risk, with 95% confidence intervals, for fint manifestation of Ischemic Heart Disease, Angina Pectoris, Myocardial Infarction and Sudden Death associated with a 10 mm Hg diffetence in Systolic Blood Pressure. .l49
Table 6.16 Relative Risk, with 95% confidence intervals, for a 10 mm Hg difference in Systolic Blood Pressure estimated fiom time dependent Cox proportional hazard models. .............................................................................................. 1 5 1
Table 6.17 Relative Risk, with 95% confidence intervals, for Ischemic Heart Disease, Angina Pectoris, Myocardial Infarction and Sudden Death associated with a 10 mm Hg difference in Diastolic Blood Pressure estimated from age-specific
................................................................. Cox proportional hazard models. 1 5 3
Table 6.18 Relative Risk, with 95% confidence intervals, for a 10 mm Hg difference in Diastolic Blood Pressure estimated h m time dependent Cox proportional h~~81.d models. .............................................................................................. 155
Table 6.19 Relative Risk, with 95% confidence intnvals, for Ischemic Heart Disease, Angina Pectoris, Myocardial Infarction and Suddm Death associated with a 5 kg/m2 difference in Body Mass Index estimateâ h m age-specific Cox proportional hazard models. ......................................................................... 1 57
Table 6.20 Relative Risk, with 95% confidence intervals, for a 5 kg/m2 difference in Body Mass Index estimated h m time dependent Cox proportional hazard models .......................... ... ................................................................... 1 5 8
xiii
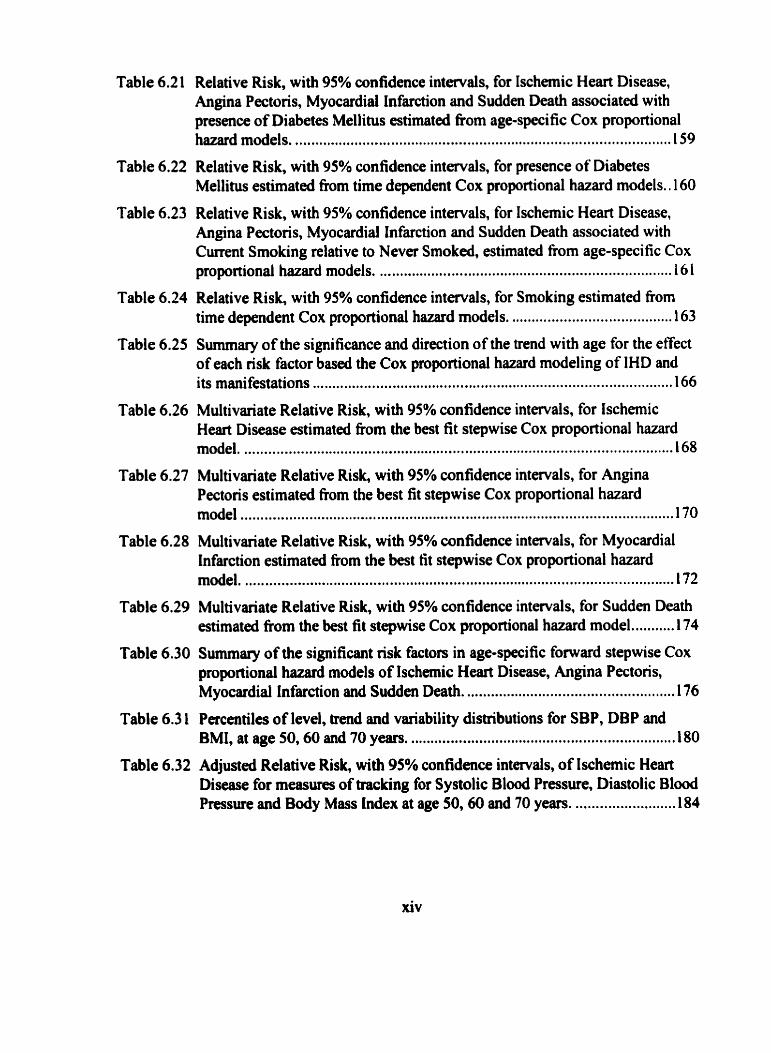
Table 6.2 1 Relative Risk, with 95% confidence intervals, for Ischemic Heart Disease, Angina Pectons, Myocardial infmction and Sudden Death associated with presence of Diabetes Mellitus estimated fiom age-specific Cox proportional hazard models. ................................................................................ 1 5 9
Table 6.22 Relative Risk, with 95% confidence intervals, for presence of Diabetes Mellitus estirnated from time dependent Cox proportional hazard models.. 160
Table 6.23 Relative Risk, with 95% confidence intervals, for Ischemic Heart Disease, Angina Pectoris, Myocardial infarction and Sudden Death associated with Current Smoking relative to Never Smokd, estimated fiom age-specific Cox
......................................................................... proportional hazard models. 16 1
Table 6.24 Relative Risk, with 95% confidence intenals, for Smoking estimated from ........................................ time dependent Cox proportional hazard models. 163
Table 6.25 Surnmary of the significance and direction of the trend with age for the eflect of each risk factor based the Cox proportional hazard modeling of IHD and
......................................................................................... its manifestations 166
Table 6.26 Multivariate Relative Risk, with 95% confidence intervals, for Ischemic Heart Disease estimated fiom the best fit stepwise Cox proportional hazard model. ........................................................................................................... 168
Table 6.27 Multivariate Relative Risk, with 95% confidence intervals, for Angina Pectoris estimated fiom the best fit stepwise Cox proportional hazard
......................................................................................................... mode1 1 70
Table 6.28 Multivariate Relative Risk, with 95% confidence intervals, for Myocardial Infarction estimated fiom the best fit stepwise Cox proportional hazard
........................................................................................................... model. 172
Table 6.29 Multivariate Relative Risk, with 95% confidence intervals, for Sudden Death ......... estimated from the best fit stepwise Cox proportional hazard model.. 1 74
Table 6.30 Summary of the sipificant risk factors in age-specific foward stepwise Cox proportional hazard models of Ischemic Heart Disease, Angina Pectons,
................................................... Myocardial Infarction and Sudden Death. 176
Table 6.3 1 Percentiles of level, trend and variability distributions for SBP, DBP and ............................................................... BMI, at age 50, 60 and 70 years. 1 80
Table 6.32 Adjusted Relative Risk, with 95% confidence intervals, of Ischemic Heart Disease for measures of tracking for Systolic B l d Pressun, Diastolic Blood Pressure and Body Mass index at age 50, 60 and 70 years. ......................... 184
xiv
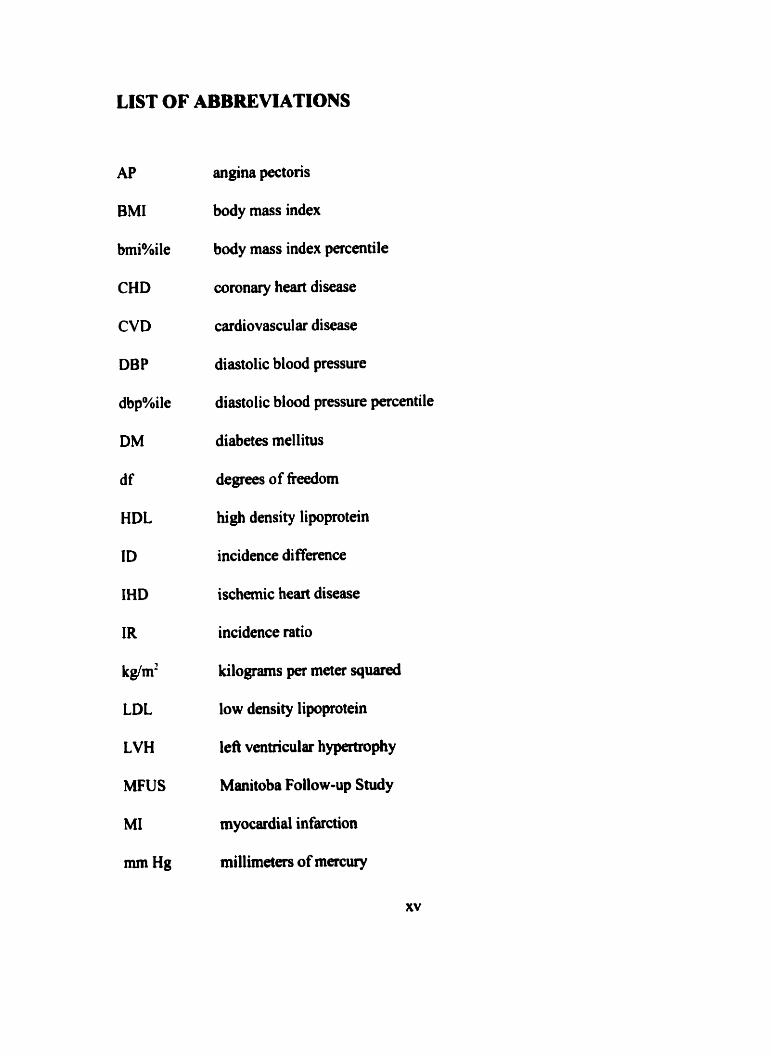
LIST OF ABBREMATIONS
AP
BMI
bmi%ile
CHD
CVD
DBP
dbp%ile
DM
d f
HDL
ID
IHD
IR
kglm'
LDL
LVH
MFUS
MI
mn Hg
angina pectoris
body mass index
body mass index percentile
coronary heart disease
cardiovascular disease
diastolic blood pressure
diastolic blood pressure percentile
diabetes mellitus
degrees of fieedom
high density lipoprotein
incidence di fference
ischemic heart disease
incidence ratio
kilograms per meter squared
low density lipoprotein
left v d c u l a r hypertrophy
Manitoba Follow-up Study
myocardial infarction
millimeters of mercury
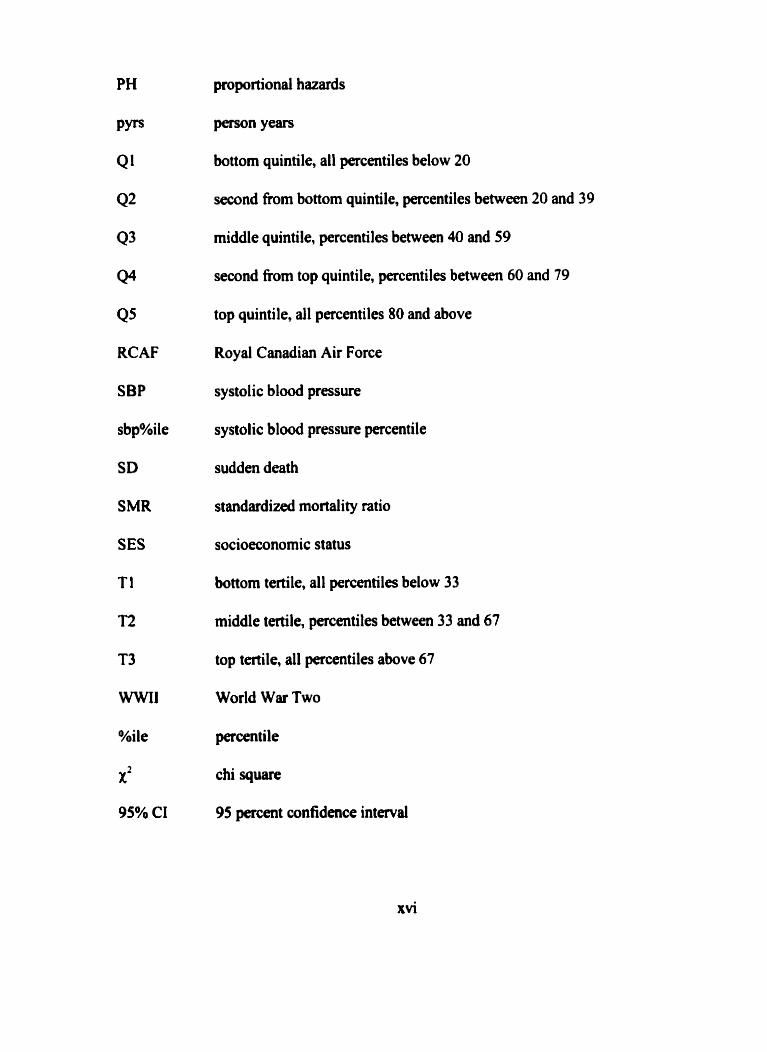
PH
Pyrs
Q l
42
Q3
44
QS
RCAF
SBP
sbp%ile
SD
SMR
SES
Tl
T2
T3
wwI1
%ile
x2
proportional hazards
person years
bottom quintile, al1 percentiles below 20
second fiom bottom quintile, percentiles between 20 and 39
middle quintile, percentiles between 40 and 59
second fiom top quintile, percentiles between 60 and 79
top quintile, d l percentiles 80 and above
Royal Canadian Air Force
systolic b l d pressure
systolic blood pressure percentile
sudden death
standardized mortality ratio
socioeconomic status
bottom tertile, al1 percentiles below 33
middle tertile, percentiles between 33 and 67
top tertile, al1 percentiles above 67
World War Two
percentile
chi square
95 percent confidence intmal
1 INTRODUCTION
Since the end of World War Two (WWI), the precursors and prognosis of
cardiovascular disease have been a major subject of medical investigations. Prospective
population studies have been initiated, risk factors recorded and the development of
disease documented. Although a host of factors have been identified as associated with
heart disease it is generally agreeâ that elevated blood pressure, high serum cholesterol
levels and smoking are the three main responsible, and modifiable, risk factors for
ischernic heart disease. Statistical models have been developed to identify and estimate
the magnitude of effect that individual factors or groups of factors have on the likelihood
of disease. Risk factors have been able to acwunt for a large percent of al1 coronuy heart
disease. Through risk factors, 60% of coronary heart disease can be identified in 20% of
the population (Kannel and Schatzkin 1983, Epstein 1995). Thus, there is considerable
room for improvement in identimng other characteristics for this prediction.
Tenninology for refming to heart disease is not strictly standardized. ln this thesis,
ischemic heart disease (IHD) is defined by evidence of angina pectoris (AP), myocardial
infarction (MI) or sudden death (SD). Coronary heart disease (CHD) refers to disease of
the heart and diseases related to blood supply to the hem, and hence includes IHD as
defined as well as death attributed to IHD (Heaith and Welfare Canada 1995).
Cardiovascular disease (CVD) is defined by the Heart and Stroke Foundation of Canada
to include al1 diseases of the circulatory system defined by ICD-9 codes 390 through 459.
1

These codes include acute myocardiai infaction, ischernic heart disease, valvular heart
disease, peripheral vascular disease, arrhythmias, high blood pressure and stroke. As
such, cardiovascular disease is the widest definition encompassing aspects of diseases of
the heart as well as diseases of the vascular systems. While the objectives of this thesis
will focus on IHD, much of the discussion fiom other studies relates to cardiovascular
disease in general.
1.1 Population Studks of Cardiovagcular Dirase
An era of modem investigation into cardiovascular disease began at the end of
WWII. The World Health Organization's initiatives in 1948 set the stage for the
developrnent of population studies in the next few years. In 1949, the National Heart
lnstitute was established to promote medical research in the United States. In North
America, two long standing prospective cohort studies designed to investigate
cardiovascular disease were initiated in 1948. One was in the USA, the Framingharn
Study (Dawber 1980), and the other in Canada, the Manitoba Follow-up Study
(Mathewson and Varnam 1960). The fornier established a cohort of 5,127 men and
women age 35 to 62 years, al1 residents of Framingham, Massachusetts. The latter
enlisted a cohort of 3,983 healthy young male air crew remiits from the Royal Canadian
Air Force in WWII. During the 1950's these population studies would, for the first time,
follow a fixed cohort of healthy people, with routine measurements and medical tests. As
disease developeû in the subjects of these cohorts, evidence would be documented.
Further, the design of these studies would permit the prospective documentation of
medical events until death. Careful record keeping made possible some of the first
prospective medical reports of disease, particularly cardiovascular disease, as it
developed in aging populations. These two studies both continue today, each having just
celebrated fifty years of existence. They share a distinction of being the longest
continuously ninning cohort studies ever undertaken in the world.
During the 1950's and 1960's research groups in the USA and Europe would add
to a growing base of population studies. Middle aged white American males fiom five
cohorts, the Albany Civil Servant study, the Chicago Peoples study, Chicago Western
Electnc Company, the Tecumseh Comrnunity Study and the Framingham study were
merged for analysis in 1964. This formed one large cohort of 12,38 1 men aged 40 to 59
years with an average of 8 years of follow-up. This endeavor, called The Pooling Project
(The Pooling Project Research Group 1978) was the first major population study to be
able to refine with some degree of assurance, the predictive indices for manifestations of
"major coronary events", defined as nonfatal or fatal myocardial infarction and coronary
deaths . Measwments of serurn cholesterol, blood pressure and cigarette use, recorded at
a single examination of adult American men, (were) shown to be highly indicative of first
heart attack over the next decade (The Pooling Project Research Group 1978). The Seven
Countries Study (Keys 1980) began in 1958 to examine reasons for regional variation in
rates of cardiovascular disease. Within a very short time, by the early 1960's, enough
data had been collected to pennit statements about associations of factors with
atherosclerosis and heart diseasc.
Most cohort studies were designed to prospectively examine cardiovascular
disease mortality and morbidity. Mortality proved easier to monitor through linkages
with existing sources of vital statistics data routinely compiled for administrative
purposes. Morbidity monitoring was more labour intensive for most studies because of
the necessity for contact and reexarnination of cohort subjects to determine evidence of
disease. Studies have repocted on al1 cause mortality, as well as death due to
cardiovascular and non-cardiovascular causes.
1.2 Nsk Factors and cardiovascular disease
In a 1961 report, Dr. William Kannel, director of the Framingham Study, coined
the phrase 'îisk factor" (Kannel et al. 1% 1). The concept of nsk associated with a factor
and its relationship to cardiovascular disease should be defined with consideration for the
saength of the association between the two (statistical significance), the direction of the
association (causality), consistency of the association and societal impact.
Very quickly s e m cholesterol, blood pressure and smoking were reported as risk
factors causally related to coronary hart disease. A 1 98 1 literature review identi fied 246
risk factors for m n a r y heart disease (Hopkins and Williams 198 1). Albeit the criterion
for inclusion of a factor in this report was the finding in one publication of the description
of an association, either positive or negative, with coronary heart disease, this report
highlights the outburst of activity in cardiovascular research over a period of perhaps
thirty years. Risk factors were grouped in categories as demogniphic, environmental
ex posures, li festy ldps ychosocial , phy sical/biomedical, senun measurements,
platelet/coagulaîion factors, coexisting medical conditions, dietaq excesses, dietary
deficiencies, and drug liabilities. Risk factors were classified by evidence for association
and suggested mechanisms as initiators, promoters, potentiators and precipitators for
coronary heart disease. Determination of the most important risk factors, was described
as an "onmus task", but it was concluded that this systematic approach may be helpful
as a starting point.
Cardiovascular risk factors can be broadly grouped as major or minor risk factors
(Stamler 1995). Major risk factors are those that are highly prevalent, causally associated
with high risk of coronery disease and potentially avoidable or revenible. For exarnple,
smoking and hypertension are both highly prevalent in our population and have been
shown to be strongly related to heart disease and can be controlled or stoppeci, hence both
are major nsk factors. Diabetes mellitus (DM) is both controllable and strongly
associated with heart disease in our population, but not as highly prevalent, hence it is not
considered a major risk factor. Although age and male gender are highly associated with
cardiovascular disease, neither is reversible. Hence, age and gender are not considered
major risk factors.
There are three universdl y accepted major risk factors for caniiovascular disease:
high b l d pressure, high blood cholesterol and smoking. Health Canada identifies

sedentary li festyle, ovenveight and diabetes as 0 t h important risk factors (Health and
Welfare Canada 1995). Implicated with these are the roles of many other factors,
including aging, gender, diet and familial history of cardiovascular disease. Other social
and economic factors measured in many populations by income, education or occupation
have been shown to be related to health in general, as well as to some extent with
cardiovascular health (Kaplan and Keil 1993).
1.3 An ovewiew of the Manitoba FoUow-up Shidy
During WWII, Dr. F.A.L. Mathewson was responsible for the examination of
approximately 7,000 male recniits to evaluate their fitness for RCAF air crew training in
Toronto and Edmonton. Examinations included physical measurement of height, body
weight and blood pressure, medical history of past illnesses and the recording of a resting
electrocardiogram. Contact with the pst-war survivors was sought between 1946 and
1948 and each man located was invited to take part in a longitudinal study aimed at the
prospective evaiuation of the prognostic si gni ficance of electrocarâiographic changes as
they would develop in an otherwise healthy male.
Initiated on July 1, 1948, the Manitoba Follow-up Study (MFUS) has become
Canada's longest running prospective investigation of cardiovascular disease. An
examination of dl study members at entry compnsed the baseline examination. Since
thai, the cohort of 3,983 healthy, Young, men has been followed continuously with
m u a l contact and regularly scheduled medical examinations. Routine medical
examinations administered by each study member's personal physician have been
requested at five-year intervals until the mid 1960's and at three-year intervals since.
Medical examinations include a general cardiovascular assessmcnt, blood pressure and
body build measurnent and a resting 1 2 lead electrocardiograrn.
In the early years of the study, a retum postcard was mailed annually to each
study member to maintain contact and confirm addresses. Since 1978, a one page annual
questionnaire has been sent to detennine intercurrent illnesses or hospitalisations and thus
permit a timely follow-up of medical events between routine exarninations. This annual
questionnaire also serves to monitor vital status. Periodically, more extensive mailed
questionnaires have been used to obtain additional information, retrospectively, on
smoking habits, family history of cardiovascular disease, physical activity, occupational
profiles and perceived level of stress during the w u .
AAer 45 years of follow-up, to July 1, 1993, the vital status of 96% of the cohort
was known; only 4?40 of the cohort had been lost to follow-up. Clinical evidence of IHD,
including myocardial infarction, angina pectoris and sudden death has been document4
in 1,098 (27%) subjects. The mean age of the 2,292 men alive was 74 years and the
mean age at death of the 1,69 1 decedents was 64 y m . While the mortality rate of the
MFUS cohort is lower han the mortality experience of the Canadian male population, the
distribution of cause of death of deceased study membeis is similar to that of al1 Canadian
males.
1.4 GcneralObjectives
The epidemiology, Le. frequency, distribution and determinants of IHD in men cm
be best examined with a prospectively compiled longitudinal database. It is proposed in
this thesis to use the MFUS database to examine the extent to which the effects of
recognised risk factors for IHD: elevated blood pressure, smoking, body build and
diabetes rneliitus are modified by aging. Analysis of these risk factors for IHD showcd a
declining effect blood pressure and smoking with age (Tate et al. 1996, Tate et al. 1998).
The prognostic significance and relative importance of these risk factors has been shown
to Vary for manifestations of IHD at different ages (Tate et al. 199%).
When a characteristic of an individual is measured repeatedly over tirne, the
biologic phenornenon for the values of the characteristic to maintain a stable position
relative to others in the population is called tracking. The degree to which blood pressure
and body mass index (BM1) measurernents track with age will be examined in this thesis.
In a recent anal ysis of b l d pressure tracking over a 40 year period of the MFUS cohort,
it was reported that tracking was strong both for subjects in the highest and lowest
quintile of the systolic (SBP) and diastolic blood pressure (DBP) distributions (Tate et al.
1995b). Evidence for tracking was particularly strong between ages 30 and 50 years over
intervals of up to 20 years. It is anticipated that tracking of body mass index may be at
least as strong as reported for b l d pressure.
Tracking indices for a characteristic in a population are defined on the basis of the
predictability of the characteristic over time. Because of the longitudinal nature of
MFUS, it will be possible to identiw men whose blood pressure or body build tracks
from young to middle age, and whether these men subsequently have patterns of
development of IHD in later life that differ from those men whose measurements do not
track. Previous analysis has suggested that those witb SBP that tracked strongly at higher
levels from age 40,45 and 50 years, had a greater risk of IHD morbidity and IHD
mortality compared to those whose blood pressure did not track (Tate et al. 1997a).
At the individual level, using serial measurements, patterns of blood pressure or
body build with age cm be defined in ternis of the s l o p and variability of the regression
of blood pressure or body build on age. It may be that these regression line parameters
define subjects at varying risk of IHD. Fitting models with these characteristics deriveci
fkom the longitudinal observation of risk factors in individuals may providc fbrther
insight into the relationship between tracking of these measurements and IHD risk. Thus,
the importance of the effect of tracking of b l d pressure and body build may have on the
development of al1 IHD as well as on each manifestation of IHD; myocardial infaction,
angina pectoris and sudden death will be exarnined. The additional contribution of
tracking to the prediction of IHD may idcntify high risk individuals at younger ages.
1.S S p i f i e Objectives
IHD is an important health problern in our society and continues to be a major
cause of morbidity and mortality. Consequently, the identification of factors associated
with IHD and quantification of levels of risk is of ongoing interest. The risk factor
profile for IHD as well as the magnitude of effect and relative importance of risk factors
for IHD may be changing with age. This dynamic relationship must be kept in mind
when planning strategies for prevention of cardiovascular disease.
Many recent analyses of the MFUS data base have been directed at the epidemiology
of IHD. Some aspects of that research are proposed as objectives of this thesis. This
doctoral thesis will draw upon the knowledge fkom the earlier research undertaken in this
field of study and bnng together a collective analysis of the modifying effects of aging
and tracking (Tate et al. 199%) on traditional nsk factors for IHD (Tate et al. 1998). It is
proposed in this thesis to anal yze data fiom 45 years of follow-up (between h l y 1 , 1 948
and June 30, 1993) of the MFUS to address the following five specific objectives:
1. To determine the age-specific incidence of ischemic heart disease and each of its
manifestations: myocardial infarction, angina pectoris and sudden death in the MFUS
cohort.
2. To examine the extent to which the distributions of recognised risk factors: systolic
blood pressure, diastolic blood pressure, body mass index, diabetes and smoking are
changing with age.
3. To determine the extmt to which systolic blod pressure, diastolic blood pressure and
body mass index measments track with advancing age.
4. To determine the extent to which the eflects of recognised risk factors, i.e. elevated
blood pressure, body mass index and diabetes mellitus and smoking, for incident
ischemic heart disease and its manifestations are modified by aging.
5. To determine the extent to which tracking of systolic blood pressure, diastolic blood
pressure and body m a s index contribute to models of incident ischemic heart disease
and its manifestations.

2 A HISTORY OF THE MANITOBA FOLLOW-UP STUDY
2.1 About Dr. F.A.L. Mathewson (1905-1994)
The history of the Manitoba Follow-up Study cannot be told without first
providing an introduction to and appreciation for the man responsible for the inception,
motivation and diligent persistence behind it. Francis Alexander Lavens Mathewson was
bom in 1905 in New Westminster BC and moved to Winnipeg with his fmily at a young
age. He attend4 medical school at the University of Manitoba and graduateci with an
M.D. degree in the Class of 193 1 and with a B.Sc. (Medicine) degree in 1 933. Dr.
Mathewson began a private practice in W i ~ i p e g and was appointed to the medical
faculty at the University of Manitoba. As a physician at the Winnipeg General Hospital
from 1935 to 1975, he was director of the electrocardiography department from 1957 to
1975.
Dr. Mathewson served in Royal Canadian Air Force (RCAF) during WWII as the
deputy director of Medical Services (Professional). He also served with the Cornmittee
on Aviation Medical Research and with the war over in 1945, he maintained ties with the
RCAF, but retumed to teaching at the University of Manitoba and to his private practice
with interest in cardiology, and specifically, electrocardiography.
Dr. Mathewson was a founding mernk and serval as President of the Canadian
Cardiovascular Society (1 957- 1958). He also served as President of the Canadian Life
Insurance Medical Officers Association (1 955-1 956) and of the Association of Life
Insurance Medical Directors of America (1 968- 1969).
Throughout his career he maintained other interests apart fiom medicine, as a
Manitoba hisiorian, particularly of the influence of the Hudson Bay Company in Western
Canada. He was a naturalist, enjoying wildlife photography. As a driving force behind
the creation of the Museum of Man and Nature in Winnipeg, the Mathewson Reading
Room was created there in his honour, following his death in 1994.
2.2 Origins of the Manitoba FoUowiip Shidy
During WWII, Dr. Mathewson was in charge of the physical examination of
RCAF recruits to detemine their suitability for air crew training. At initial training
centres in Edmonton and Toronto, the blood pressure, body weight, height, and history of
childhood illness were obtained from 7,000 young Canadian men. In addition to these
measurements, a resting 3 lead electrocardiograrn was recorded, but not used in the
screening process of candidates. During the war these electrocardiograms came up for
discussion on two occasions, with Dr. Hany Ungerleider of the Equitable Life in New
York, and with Sir John Parkinson in London, England. Both stressed the importance of
setting up a long terni study to determine the clinical significance of the
electrocardiograms mrded on apparently healthy young people. (Mathewson et al.
1987). The seed that would flourish over the next fi@ years was planted.

In the early years following WWII, contact was established and an invitation
extended to the RCAF air crew whose electrocardiograms were on record to participate in
a long texm prospective investigation of cardiovascular disease. The stucîy also included
commercial air transport pilots and pilots licensed by the Ministry of Transport at that
time. Although it is not precisely known how many men were drawn from each source, it
is felt that except for differences in age distributions at enûy to the study, these three
groups were similar. On July 1, 1948 the cohort was sealed with agreement to participate
having been obtained from 3,983 men. The mean age of these men was 3 1 years, with
close to 90% between age 20 and 39 years. To my knowledge, a fomal "signed consent"
was never obtained, however it has been recognised that active participation implies
informed consent. A letter to this regard h m the Faculty Cornmittee on the Use of
Human Subjects in Research at the University of Manitoba is included as Appendix 1.
2.3 Data Collection and Management
2 3 1 Annual contact and monitoring of vital rtatus
A medical technician training facility at the University of Manitoba Medical
College was established afler the war by Dr. Mathewson. The personnel "posted" there
provided clwical assistance to develop a record keeping system for MFUS, "in house",
apart b m the RCAF files. Contact dates, current addresses and medicd examination
requests were manudly rrcorded until 1985 when a personal cornputer database system
was adopted. Initially, an annd retum postcard was sent in the fall to each study
14
mernber to ascertain vital status and keep address files current. In 1 978, the postcard was
supplemented with a one page questionnaire, and over the next three years the postcard
was phased out. Three questions are asked; 1) Have you had any new medical problem?
2) Have you had occasion to consult your Doctor? 3) Have you been admitted to
hospital? (if so, where and when?). A "yes" response to any of these questions triggers a
detailed review of existing records and initiates appropriate follow-up, directed to the
study member, his physician or hospital.
Letters returned unopened or non responses to our correspondence were diligently
followed to re-establish contact with study members. A variety of sources were usai
over the years including telephone, telegraph, w-operation of the aviation licensing
board, physicians, next-of-kin and motor vehicle licensing departrnentç. The follow-up
process has been very successful: "During 1963 contact was established with al1 but five
of the 3773 swivors." (Mathewson et al. 1965a); "By June 30, 1988,40 years of follow-
up (145,408 person-years of observation) had been completed, 2459 (62%) of study
members were alive, 1297 (33%) died and the status of 227 (6%) was unknown."
(Manfieda et al. 1992).
2.32 Medicd exrminationi
Initially, medical examinations were requested h m each man at five year
intervals. These requests wcre staggered so that one-fifh of the cohort would be
examined in any one year. Examination requests included measurement of height,
weight, blood pressure, a general cardiovascular assesment, medication listing and a 12
lead electtocardiognun. Examinations were to be carried out by each man's own persona1
physician. In 1963, the protocol was altered to request examinations every three years.
For some men, depmding on age and type of pilot license held, records of more frequent
examinations carried out by the RCAF or Department of Transport have been obtaineâ.
A detailed coding system was developed to describe major and minor clinical
findings in specific areas of interest including ischemic heart disease, cerebral vascular
disease, hypertension, pulmonary vascular and peripheral vascular disease, heart
murmurs, cardiac and non-cardiac surgery, diagnostic procedures as well as associated
non-cardiovascular disease including cancers. Dr. Mathewson produced a coding system
for the identification and classification of electrocardiographic abnormalities at about the
same time as the "Minnesota Code for Coding Electrocardiographic Changes" (Blackburn
et al. 1960) was being developed. The two coding systems are similar. The coding
system ultimately adopted for use at MFUS identifies fi@-six areas of interest fiom each
electrocardiogram.
23.3 Survey questionnaim
In 1974, a self administered mailed questio~aire was used to obtain information
on smoking histories, family history of disease and occupation. A more detailed
questionnaire was sent in 1982 and 1984 to update smoking and occupational
information, to survey areas of physical activity and exercise detailing current activity
and activity ten years pnor both at work and during leisure time, to obtain information
about hobbies, and to obtain place of birth and ethnic origin. The final page of the

questionnaire was a request for a narrative, asking each man to describe the most stressfil
experiences of his wartime experience.
2.4 Funding
MFUS was funded initially by the RCAF and the National Research Council of
Canada. From the mid 1960s tlirough to the early 1980s, the Defence Research Board,
Canadian Life Insurance Officen Association and Health and Welfare Canada provided
funding for operating expenses. The primaxy source for fùnding for the past 16 years,
however, evolved following a 1983 Federal Healtb and Welfare Canada review of the
study. The site review cornmittee recommended termination of funding for primary data
collection with a contingency to "wind-down" the sîudy. The study members,
themselves, said "NO", and banded together forming a cornmittee, MUFUS-2000, to
solicit h d s h m within the membership to continue the study. The study was
established as a charitable organisation, and since 1983, the majority of the annual budget
has been met by donations from the study members primarily received with replies to the
yearly contact questionnaire.
2.5 Data Analysis rad Pubiicatiua
The peer reviewed publications from this sîudy are listed chronologically in
Appendix 2. They have been numbered for ease of reference within this section. In 1960
Dr. Mathewson's first major reports of the background to this study was published
17
(Appendix 2: ref 4 3 , describing the mortality experience and electrocardiographic
findings of the study. Therein, Dr. Mathewson outlined the prime focus of his study:
"Because the suspicion of heart disease, particularly coronary artery disease, may have a
far-reaching effect upon the individual, it is important to identi fy bey ond any reasonable
doubt the clinicai signi ficance of those variants that appear in the electrocardiograrns of
apparently healthy people." In 1965, a two part report detailed the morbidity and
mortality experience, build, blood pressure and electrocardiographic findings during the
first fifteen years of the study (Appendix 2 ref 7,s). A further report of the twenty year
blood pressure patterns (Appendix 2 ref 9) and case series reports followed in the next ten
years (Appendix 2 ref 10,ll).
In the late 19709, increased funding fiom the federal government, expansion in the
number of staff, computerisation of medical data and recent advances in epidemiology
and biostatistics al1 aided productivity. Since then, analyses have been undertaken in
many areas. One set of reports described the relationship of blood pressure and body
build to ischemic heart disease (Appendix 2 ref 12- 1 5,20,23,28,36,38,39) and
cerebrovascular disease morbidity and mortality (Appendix 2 ref 16- 1 8). The
significance of electrocardiographic findings, specifically defects in conduction and
rhythm (Appendix 2 ref 1 9,2 1,22,24-27,29) have been examined. A thirty- five year
"State of the Study" was published (Appendix 2 ref 32). Recently, analyses of the natural
history of diseases have been published (Appendix 2 ref 3 1,33-35,37).
3 LITERATURE REVIEW
Since mortality statistics werc first published in Canada, in 192 1, cardiovascular
disease has been the leading cause of death. In 1988,4 1 % of male and 48% of fernale
deaths were due to cardiovascular causes. For males this included 25% due to ischemic
heart disease, 7% due to strokes, and 9% due to other cardiovascular causes (Heart and
Stroke Foundation of Canada 199 1 ). While many deaths due to ischemic heart disease
occur in hospital, or within a year following an acute myocardial infarction, for 12% of
al1 men who experience ischemic heart disease sudden death is the first and only
manifestation of this disease (Tate et al. 1995a).
It was estimated that in Canada in 1998, as many as 26.4 million physician visits
were due to cardiovascular conditions (Heart and Stroke Foundation of Canada 1999). It
is estimated that total costs to the Canadian economy, including hospital costs, physician
costs, lost wages and productivity, resulting fiom cardiovascular disease is 17 billion
dollars (Wigle et al. 1990). Cardiovascular disease is far reaching and early evidence of
disease has been found in al1 segments of society. Even though incidence of
cardiovascular disease inmeases rapidly with age, it is the leading cause of death in 35 to
64 year old Canadians as well. Large variations in rates of cardiovascular diseases have
been found across strata of the population, both geographically and socially. However, it
has been estimated that as much as 60% of al1 cardiovascular disease can be identified in
20% of the population (Kannel and SchatzLin 1983, Epstein 1995). Hence, it is important

to investigate factors in populations that may aid in the early identification of disease, as
a first step in reducing the impact of cardiovascular disease on society.
3.1 A global perspective of cardiovascular disease
While cardiovascular disease occurs world wide, there is great geographic
variation in rates of disease. Morbidity data is difficult to obtain in a standardized
fashion, and most global cornparisons are based on mortality. In the mid 1980's, there
was a three fold difference in age standardized mortality due to cardiovascular causes in a
cornparison of selected countries fiom around the world. Japan enjoyed the lowest rate,
at 170 per 100,000 with Romania almost 500 per 100,000. Canada was at the lower end
in 1 986 at 264 per 100,000 males (Canadian Centre for Health Information 1 990).
Within this spectrum, it has been observeà that cardiovascular mortality rates in Central
and Eastern European coutries are the higbest. Rates in Britain and Scandinavian
wuntries are a little lower. Highly industrialized, wealthier countries like United States,
Australia and Canada follow next. Mediterranean countries, Greece and France have
lower rates, and then Japan the lowest.
These global trends of high cardiovascular disease rates have not always been the
nom. In the early part of the twentieth century infectious disease was the leading cause
of death worldwide. As mortality due to infectious disease was reduced, this primary
cause of death in most countnes was replaced by death due to chronic diseases, pnmarily
cancer and cardiovascular disease. Developing countnes t d a y tend to have lower rates
of cardiovascular disease than developed countries. As countries develop economically,
so too does the rate of cardiovascular disease increase. There are a number of possible
explanations for this trend, including differences in diet, life style, prevalence of high risk
activity such as smoking and physical inactivity. There is evidence however, for a
decline in rates of disease to coincide with the more stable industrial economies.
While the rates of cardiovascular disease in many parts of Europe continue to nse.
the rates in North America appear to have peaked in the late 1960's or early 1970's.
Since that time there has been a continual decrease in mortality due to cardiovascular
causes in the order of 2 percent per year. This has been a dramatic turn around fiom the
rising rates of cardiovascular disease up until that time. This trend has been observed
both for men and women. Although it was estimated in the United States that between
1980 and 1990,25% of the decline in IHD mortality was due to primary prevention, 29%
due to secondary prevention, and 46% due to improvements in treatment (Hunink 1997).
unresolved issues remain around the reason(s) for this trend of decreasing mortality.
Further, rates of more advancd forms of chronic heart disease, including congestive
heart failure are increasing. While decreasing mortality rates may be attributed to lower
incidence of disease, better management of disease at time of onset, or improving
therapies and surgical interventions following disease diagnosis, with this decrease in
mortality has corne more physician visits, hospitalizations and hence increased cost
associated with cardiovascular disease. Cwmitly 12% of the Canadian population is age
65 years or older. It is projected that this proportion will double by the year 2040 (Heart

and Stmke Foundation 1999). With the increase in the size of the population reaching
more advanced aga, and increase in more odvanced disease and chronic coronary
conditions, severe strains will be placed on the Canadian health care system.
3.2 Variation of cardiovascular disease in Canada
Within Canada, an East-West gradient in rates of cardiovascular disease have
been reported (Health and Wel fare Canada 1 995). In 1 98 8, the highest rates were at the
east Coast, almost 400 per 100,000 men and 270 per 100,000 women down to a low of
323 per 100,ûû men and 195 per 100,OO women in British Columbia.
3.3 The pathologieal basis for ischedc heart dhease
When the arteries supplying blood to the heart tissue are healthy, blood flows
unimpeded. A critical facet of the heaith of arteries is the integrity and function of the
imer arterial wall lining, the endothelium. Under normal functioning, lipids in the blood
penetrate and move back and forth across the endothelium. If highly concentraied in the
blood, lipid may becorne trapped and build up inside the artery between the lining and the
arterial wall. The early deposits are the beginning of a process called atherosclerosis.
Build up of arterial plaque may progress slowly over time and lead to narrowing of
arterial walls. As the blood flow becornes restxicted, less oxygen is able to reach the heart
and the early stages of coronary heart disease has begun.
A restriction of oxygen supply to the heart rnay lead to angina pectoris on
exertion. This nanowing, if severe enough, rnay reduce blood flow to an extent that
blood supply rnay be completely stopped to some areas of the heart (Badimon et al.
1993). The flexibility and elasticity of the arteries that would nomally ease blood flow is
compromiseci and artaies begin to harden with plaque deposits.
Further, as the plaque lesion progms, a fissure or rupture of the lesion rnay occur
resulting in a dislodging of the plaque h m the arteriai wall. The material rnay form a
clot or plug fiirther reducing blood flow and rnay result in an acute coronary syndrome, a
manifest by unstable angina, myocardial infarction or sudden cardiac death. If blood
flow is restncted to the heart, a myocardial infarction will occur, to the brain, a cerebral
infarction or stroke may occw.
Cholesterol is a chemical in al1 body tissue manufactured in the liver. It is
insoluble in blood and is one of a number of fatty substances called lipids attachai to
molecules of protein and fat that is circulated with the blood throughout the body.
Cholesterol is made up of varying lipoproteins, with two basic ones being low density
(LDL) and high density (HDL) lipoprotein. It is considered that higher levels of LDL
rnay be associated with increasing plaque buildup and that the HDL type of cholesterol
rnay in fact enhance a "cleaning" process of build up on the arterial walls. I t is hence, the
mixture of the two types, the ratio of the two, or the ratio of total cholesterol to HDL
cholesterol that rnay be most useful in detemining a measure of the potential for
atherosclerotic ham blood lipid. In addition to the cholesterol produced nomally by the
body aiso receives cholesterol fiom some of the foods we consume, ranging in higher
amounts in faîty animal products to no amount of cholesterol in vegetables. For the most
part, except in individuals with defective regulatory mechanisms, our body is able to
regulate the arnount of cholesterol nonnally produced, in order to compensate for the
amount we consume.
The heart is the circulating pump for distribution of oxygen e ~ c h e d blood,
necessary to sustain life, to al1 parts of the body. On a continuous cycle, oxygen depleted
blood enters the heart, circulates through the lungs to replenish its oxygen supply and is
forced back out of the heart on the next cycle. The efficiency of this cycle is critical to
health and a compromised efficiency of this process can lead to reduced blood supply,
hence reduced oxygen supply, and ultimately the death of cells. The word "ischemia" is
dmived fiom the mots "isch" meaning "to restrict" and "hemo" meaning "blood", hence,
ischemic heart disease, meaning disease resulting from a restriction of blood flow to the
heart .
The consequences of ischemia may take many forms. Arterial narrowing may
result in a restriction of blood flow, which interferes with the usual mechanical
functioning of the heart. This restriction of oxygen supply to the heart may precipitate
chest pain, called angina pectons, relieved by r a t or phmaceutical intervention. More
cri ticai, is m yocardial infarction, 'hi yocardial" meaning "heart" and "infarct" li teral 1 y
meaning "death of cells". Myocardial infmtion may pnsent in a variety of foms,
ranging h m chest pain and incapacity, nsulting in high short term mortality if blood
supply is not restored, to an equally critical but clinically unrecognized fom, labeled
"silent infmtion". A lethal manifestation of ischemic heart disease, sudden death,
defined by the World Health Organization as death within twenty-four hours of
symptoms of ischemia, is for many persons their only manifestation of ischemic heart
disease. Autopsy studies of sudden death victims have reported severe arterial narrowing.
Investigation of atherosclerosis, its progression and its possible links to
cardiovascular disease have been studied since the last century. In laboratory
experiments during the early part of the twentieth century, animals fed high cholesterol
diets produced atherosclerotic lesions in a greater proportion than control animals. This
was found not ody with short term feeding of high cholesterol diets, but also for long
term diet supplemented with lower levels of cholesterol. In the 19307s, populations were
desaibed where diets consisting largely of meat and dairy products were ofien found to
have high levels of atherosclerosis. In contrast, at that time, populations like tbose of
China and Japan, where diets were primarily vegetarian in nature, had low levels of
atherosclerosis. During the depression of the L 930's when many isolated populations
subsisted on low fat primaril y vegetarian diets, people became lean, and levels of
atherosclerosis were low. Autopsy studies of W W l soldiers from European countries
having lived through the depression showed similar findings of low atherosclerotic levels.
This was even more apparent for civilians who had lived with low food supplies.
3.4 Risk factors for cardiovascular diieare
3.4.1 Higb blood pressure
Strong evidence exists that a continuum of increasing risk for cardiovascular
disease is associateci with increasing level of blood pressure (Stamler et al. 1993a,
Labarthe 1998). The role of increased blood pressure leading to cardiovascular disease
may be that the direct force of blod against arterial walls causes damage to the cells of
the arterial wall lining, allowing more entry points for plaque deposit buildups. Further,
the stronger force of blood flow may result in the loss of elasticity of the artenes, and
weaken the endothelium.
Increased risk has been shown whether systolic, diastolic or pulse pressure is
examined (Stamler et al. 1993a). Increased nsk is apparent in most societies and for both
males and fernales. Although optimal levels of b l o d pressure are generally thought of as
systolic pressure below 120 mm Hg and diastolic blood pressure below 80 mm Hg
(Stamler et al. 1993a), clear definitions of "hypertension" are unnecessary from the
perspective of defining nsk. Definition of hypertension is important, however, from the
point of view of antihypeitensive treatrnent, or control of high blood pressure.
Hypertension defined as a diastolic blood pressure qua1 to or greater than 90 mm Hg, or
being treated with medication, a salt-restricted diet or weight reduction program,
identifid 15% of the Canadien population (Health and Welfiire Canada 1995). This
prevalence ranged h m 5% in those aged 18 to 34 years, 2 1 % at ages 35-64 years, and
34% at ages 65 to 74 years. It was estimated that in Canada as many as 25% of adults
with these levels may not know they are hypertensive (Joffies et al. 1992).
Pharmaceutical control of high blood pressure, targeted mainly at elevated diastolic blood
pressure, is available and has been shown to be effective at al1 elevated levels in reducing
blood pressure. Lifmtyle modifications including weight control, limiting alcohol
consumption and salt intake, regular exercise and control of stress are al1
tecornmendations of a recent review of non-pharmaceutical hypertension management
options (Campbell et 61. 1999).
Blood pressure has been shown to increase with age, possibly reflecting higher
arterial resistance resulting fiom loss of arterial wall elasticity common with aging.
Limits defining normal blood pressure levels, or hypertension, may need to be adjusted to
reflect the shifi in the blood pressure distribution with age. In Western populations
(Collins and MacMahon 1994), three-quarters of cardiovascular disease may occur in
"nomotensive" individuals. It has been estimated that lowering DBP by 2 mm Hg in the
population as a whole may be as effective in reducing the rate of CHD than treating
individuals with DBP above 95 mm Hg (Cook et al. 1995). Reduction of blood pressure
in the population as a whole may be the key in reducing the number of cardiovascular
events.
In analysis of published studies of the effect of diff~ences in diastolic blood
pressure on the risk of h m disease and stroke (MacMahon et al. 1 WO), no threshold for
level of blood pressure was determinai. For an average 5 6 mm Hg difference in diastolic
blood pressure, a steeper increase in the risk of stroke was found, compared to increase in
the risk of hart disease. A diffaence of this magnitude (5-6 mm Hg) could account for
avoidance of one third the risk of stroke and one fifth the risk of heart disease. High
blood pressure has been universally reported as the nurnber one risk factor for stroke
(Lassen 1996). lsolated systolic hypertension defined by high levels of systolic blood
pressure with nomal levels of diastolic blood pressure has been shown to be a powerfbl
risk factor for stroke in the elderly (Mmard et ai. 1992). There is a strong association of
SBP with both IHD and stroke in men at younger ages, while DBP is more important as a
risk factor for IHD at older ages, SBP remains the more powerful predictor for stroke
(Rabkin et al. 1978a). Further, increases in SBP in young men (Rabkin et al. 1978b) have
been s h o w to preûict stroke, and also changes increases in SBP just before stroke have
been associated with a poor prognosis (Rabkin et al. 1978a). The Framingham Study has
reported SBP, rather than DBP, to be a more powerful predictor of CHD (Kannel et al.
1970). lncreased variance of repeated SBP measurernents has recently been examined in
relation to CHD (Grove et al. 1997) and show to bc positively associated with increased
risk.
There is a positive gradient with blood pressure and incidence of CHD, but the
association has been described as more "J-shapeâ" pos t m yocardial in farction for re-
infarction (D' Agostino et al. 199 1, MacMahon 199 1). A "U" shaped relationship
between DBP and cardiowscular monality following myocardial infarction, has led to
speculation that low blood pressure and low blood flow may accompany those with
scvere heart disease (D'Agostino et al. 1991).
3A.Z Treatment of bigh b l d pressure
Because hi& blood pressure is a major risk factor for cardiovascular disease,
efforts have been made to evaluate the impact of lowering blood pressure. A recent meta
analysis of 14 randomized control trials exarnined evidence for the effect of
pharmaceutical treatment of hi& blood pressure involving a total of 37,000 individuals,
where it was concluded that the largest efTect of reducing blood pressure on
cardiovascular disease was with the reduction of stroke (Collins et al. 1 WOa, Collins et al.
1990b). Reduction of DBP by 5 to 6 mm Hg over 5 years on the average resulted in an
overall45% decrease in the rate of fatal stroke and 42% in overall strokes. In contrast,
rates of fatal and al1 (fatal and non-fatal) cardiovascular disease were reduced by 1 1 % and
14%, respectively. Overall, there was a reduction by 2 1 % in al1 cardiovascular (including
stroke) deaths, and no difference in deaths due to non-vascular causes.
The treatment of isolated systolic hypertension, (SHEP Cooperative Research
Group 1991) has reported relative risk of 0.75 and 0.74 for stroke and heart disease, with
no difference in total mortality reduction afier five years. Risk factor profile scores for
stroke developed from Frarningharn data in 199 1 (Wolf et al. 1 99 1 a), have been revised
(D' Agostino et al. 1 994) to reflect anti hypertensive treatment.
3.4.3 Big& blood cholesterol
Elevated blood cholesterol is a major risk factor for cardiovascular disease, with
the four components: plasma cholesterol, triglyceride, LDL and HDL have varying
strengths of association with cardiovascular disease. Increasing values of total

cholesterol and increasing values of LDL cholesterol are both positively associateà with
increasing nsk of CHD. Increasing values of HDL cholesterol are associaid with a
lower risk of atherosclerosis and cardiovascular disease. The importance of high HDL
values as a protective factor for CHD has been reporteci to be independent of levels of
total cholesterol and perhaps of stronger value in women thon in men (Neil HAW et al.
1990). A stronger association with steeper gradients of risk was shown when both
elevated total cholesterol and low HDL cholesterol are considered together. Dr. Castelli,
current medical director of the Framingharn Study, stressed this in his address at the 1995
Canadian Cardiovascular Society's kûmuaî Meeting based on a Framingham report
(Castelli et al. 1986) showing the joint effect of the two lipid measures on incidence of
heart disease. With both components being important predictors, a strong relationship
has been found with the ratios of LDLMDL or total cholesterol/HDL to cardiovascular
disease. The triglyceride component appears to have a positive, but somewhat weaker,
association with cardiovascular disease, than do LDL and HDL (Miller 1999). The
predictive value of total cholesterol decreases with advancing age while the ratio values
continue to be associateci with cardiovascular disease at older aga.
Numerous trials have show that elevated blood cholesterol levels cm be reàuced
through the use of phamiaceuticals and in tum that reduced total and LDL cholesterol
levels have resulted in a reàuction of total and cardiovascular mortality. A recent meta-
analysis suggested that a 10 percent duction in cholesterol could translate into a 20 to
25 percent reduction in IHD morbidity (Law et al. 1994). Phamacological treatment has
b e n shown to reduce the risks of both stroke and CHD mortality (The LIPID Study
Group 1998).
Diet is central to the role of cholesterol in the development of cardiovascular
disease. Early animal studies and observational studies of native populations lead to the
association between high rates of cardiovascular and "rich diets". "Rich diet" has been
described (Stamler 1995) as: "habitua1 fare high in animal products and processed animal
products, high in total fat, hydrogenated fat, and separated (visible) fat, high in
cholesterol and saturated fat, high in refined and processed sugars, high in sali, high in
alcohol for many in the population, high in caloric density, in 'empty' calories, and in
ratio of calories to essential nuaients, low in potassium, fiber and often other essential
nutrients, and high in total calories for a low level of energy expenditure in the era of the
automobile, television and mechanized work." This diet produces above optimal levels
of semm cholesterol, blood pressure and body weight, begiming in childhood. Dietary
cholesterol intake, is fortunately one factors an individual can exercise control, however,
modification of high dietary cholesterol has been shown to have only moderate impacts
on blood cholesterol (Hegstd et al. 1993).
3.4.4 Smoking
It was stated in the 1964 US Surgeon General report: "It is also more prudent to
assume that the established association between cigarette smoking and coronary heart
disease has causative meaning than to suspend judgrnent until no uncertainty rernains."
(Surgeon General Report 1 964). The 1983 US Surgeon General's repori on smoking and
cardiovascular disease concluded that due to its prevalence "cigarette smoking should be
considered the most important of the known modifiable risk factors for coronary heart
disease in the United States" (Surgeon General Report 1983). The 1983 report identified
smoking as a major cause of cardiovascular disease for men and women, with smokers
having a 70% greater cardiovascular death rate than non smokers. Smokers have a 2 fold
increased incidence of IHD and heavy smokers a 4 fold increased risk above non-
smokers. These risk ratios are of similar magnitude for men and women.
Smoking rates have been declining frorn a high of three-quarters of adults at the
end of WWII, to 29% of the Canadian population smoking in 1992 (Stachenko et al.
1992). Smoking is a powemil risk factor for cardiovascular disease at every level of
other factors, but is perhaps operating through a mechanism other than the promotion of
atherosclerosis (Surgeon G e n d Report 1983). Mile the specific mechanisms through
which smoking may operate with cardiovascular disease is not certain, smoking has been
show to have a deleterious effect on endothelial functioning. Also, it is thought that as
nicotine fiom tobacco stimulates the heart, an increased heart rate may produce a
temporary nse in blood pressure. Further, the carbon monoxide levels of inhaled
cigarette smoke consequently decrease the available supply of oxygen to the heart.
Smoking incurs an increased risk of IHD for men, primarily through
manifestation of myocardial infarction and sudden death (Tate et al. 1997b). Smoking is
a more powerfbl risk factor in men than in women (Dawber 1980). In the British doctors'

Study (Do11 et al. 1994), the relative risk for smoking and mortality was reported to be 1.6
for ischmic ha r t disease and 1.3 for stroke.
While smoking may be a potent risk factor for cardiovascular disease, it is also
one factor that the individual has almost exclusive personal control over. While the
adverse effects of smoking are far-reaching (Wald and Hackshaw 1996), the benefits of
quitting smoking have been shown to be immeâiate, and substantial, regardless of how
long a person has smoked (Kannel and Schatzkin 1983).
The Oslo Study Group reported a 47% reduction of CHD in an intervention group
targetted with changes in both diet and smoking cessation as compared to a control group
(Hjermann et al. 198 1).
Non-smoking individuals exposed to environmental tobacco smoke, i.e. "second-
hand smoke", have been shown to have a greater progression of atherosclerosis over a 3 -
year p e r d as measured by increase in the intimal-media1 thickness of the carotid artery
(Howard 1998).
Diabetes mellitus is a disease associated with the body's inability to control its
b l d glucose levels. This can result fiom impairecl insulin production or the body's
inability to use insulin properl y. This disease can be controlled to some extent through
phannaceutical intervention and diet (Report of a WHO Study Group 1994).
"Comnary artery diswe by any measure is more common in diabetics than non-
diabetics leaving the diabetic h m two to four times as likely to die from myocardial
infarction or heart failure as the non-diabetic" (Sniderman et al. 1992). Diabetic men and
women have been shown to have two to three fold increasd risks of cardiovascu~ar
disease respectively at any levels of the major nsk factors (United States Department of
Health Diabetes Surveillance 1990). A featue of diabetes as a risk factor for IHD is its
differential effect in men and women, where risk ratios for IHD in women are double
those for men. In the Frarningham study risk ratios of 2.4 for men and 5.1 for women
(Kannel 1985) and in the Rancho Bernardo study risk ratios of 1.8 and 3.3 respectively
(Barrett-Connor et al. 1 99 1 ) were reported. Insulin dependent diabetes is more strongly
related to cardiovascular disease than non-insulin dependent diabetes. Diabetes is
associated with many cardiovascular nsk factors, including high blood pressure,
cholesterol levels and obesity. It may be that it is through these factors that the effect of
diabetes on CHD is most apparent. However, diabetes rernains an independent factor in
most multivariate analyses of cardiovascular disease (Kannel and McGee 1979,
Rosengren et al. 1989, Ford and DeStefano 1991). Multivariate nsk ratios for diabetes
and stroke range h m 2.1 to 3.2 reporied by the Cardiovascular Health Study (Manolio et
al. 1996). Risk ratios for diabetes have also been reported to be greater for stroke
outcomes than for heart disease outcomes (Rudennan and Haudenchild 1 984).
3.4.6 Body buiM, ovemeight and obesity
It is generally agreed that obesity as a measun of excess body fat is associated
with adverse health outcomes and inçteased total mortality. The epiderniology of obesity
has been reportai in extensive detail (Black et al. 1983). The proportion of Canadian
adults with M y mass index above 27 k g h d was reported to be 35% of men and 27% of
women (Reeder et al. 1992). There has not been general agreement, however, about the
role of obesity as an independent cardiovascular risk factor. Other functions of height,
weight and body build including body mass index, skin fold and relative body weight
have been associated with cardiovascular mortality and less so cardiovascular morbidity
(Keys et al. 1972), when adjusted for other risk factors. Relative weight, weight divided
by height, has been used as a measure of build, and found to be significant in men for
heart disease and in women for stroke, as reported by the Framingham study (Hubert et
al. 1983). The Framingham Study has also reported a somewhat "J" shaped relationship
with cardiovascular outcornes (Sorlie et al. 1980). The Nurses Study of fernales, reported
that body mass index was an important factor for cardiovascular disease, but that waist to
hip ratio was a stronger predictor (Manson et al. 1995). Waist hip ratios have been used
in some populations, and more recently interest has focused on measures of central
adiposity suggesting that the distribution rather than the mass of body fat may be the
important factor in assessrnent of cardiovascular risk (Lenfant 1997). It was shown that
waist circumference was highly correlated with SBP, DBP, HDL cholesterol and
triglycerides but not with total or LDL cholesterol (Reeder 1997).
Obesity is associated with high blood pressure, high cholesterol, diabetes and
sedentary lifestyles. It may be that the influence of obesity on cardiovascular disease
operates through association with these factors, and favourable effects on reduction of
levels of these factors has been shown to coincide with weight loss. Both increases and
decreases in weight have been report& to be associated with an increased risk of CHD
(Walker et al. 1999, while stable weight fiom age 50 through 65 years was associated
with better cardiovascular health, than either weight gains or weight losses (Harris 1997).
Fluctuation in body weight has been show to have negative cardiovascular health
outcornes (Lissner 199 1 ). Height alone, has been report4 to be predictive of CHD
(Krahn et al. 1994, Hebert et al. 1993) but not for stroke (Hebert et al. 1993).
3.4.7 Age and gender
There is an increasing incidence of cardiovascular morbidity with age for both
men and women. The age-specific incidence of ischemic heart disease is greater for men
than for women, while the incidence of cerebrovascular disease is similar in males and
fernales (Heart and Stroke Foundation of Canada 1999). Mortality rates of cardiovascular
disease in men are double those of women, for al1 manifestations other than stroke. Pre-
menopausal women with nomal estrogen levels are virtually free of cardiovascular
disease, at older ages the nites of disease become more similar for men and women.
3.4.8 Other risk factors
An individual with a positive family history of CHD is at increased risk of CHD
(Hamby 198 1 ). Further, increased levels of cardiovascular risk factors are found in
individuals with a positive family history of cardiovascular disease (Barntt-Comor and
Khaw 1984). Some evidence for family history of stroke exists, where men whose
mothers died from stroke were at a three-fold increased for stroke, but no increased risk
was infetred if fathm had died h m stroke (Welin et al. 1987). It may be through the
36
increased familial risk of hypertension and diabetes that those with a positive family
history of either CVD are at increased risk themselves. Further a genetic component may
influence risk of cardiovascular disease through inherited characteristics such as height or
stature.
Newly emerging biological risk factors for CHD are being investigated. Elevated
levels of an ameno acid, homocysteine, have been shown to damage the endothelial wall
and be associated with increased CVD mortality (Nygard et al. 1997). Haetnostatic
factors, including fibrinogen, may be strongly linked to smoking, and has been shown to
is a risk factor for CVD (Stone and Thorp 1985, Kannel et al. 1987).
Recently the association between socioeconomic status (SES) and cardiovascular
disease was reviewed (Kaplan and Keil 1993) wherein, a similar association to that
observed between SES and general health has been reporteci. Lower SES was associated
with higher rates of cardiovascular morbidity and mortality. Risk factors for coronary
heart disease, i.e. blood pressure, smoking rates, and body mass index, are al1 higher in
men and women with the lowest incorne or lowest education levels (Luepker et al. 1993).
The INCLEN Multicentre collaborative study (INCLEN Research Group 1 994) has
reported highest risk factor levels in regions and countries with lowest extent of socio-
economic development. Blood pressure and body mass index have been found to be
higher in men with lower-status occupations (Opit et al. 1984). SES indicators, including
occupation, have been shown to be associated with early carotid atherosclerosis (Lynch et
al. 1995). An analysis of the data h m nearly 2,000 males inteniewed in the 1978
Canadian Health Survey found overall weak but not signifiant relationships between
occupations and h d t h , but the "manual labourer" group did have a consistent trend
towards poorer health (Hay 1988). Afkr adjustment for other risk factors, SES indicaton
including occupation have been shown by some to remain statistically associated with
coronary heart disease (Woodward et al. 1992).
The British studies of civil servants, (Marmott et al. 1978, Rose 198 1) show
strong relationships of social class and heart disease mortality, independent of other risk
factors. In Sweden, the Karasek mode1 (Karas& et al. 198 1) has explored job control on
nsk of heart disease and stroke. Low control, high demand occupational situations were
show to be associated with a high risk for heart disease and stmke. It was ftrther
reported that men with low work control, or low work control and low social support had
relative nsks of 1.83 and 2.62 respectively for cardiovascular mortality (Johnson et al.
1 996).
Left ventricular hypertrophy (LVH) is a strong predictor for CVD and stroke.
Aside h m age and obesity, hypertension is a main determinant of LVH (Kannel 199 1).
Further, it has been rcported that control of hypertension, has resulteâ in a decline in
L W (Mosterd 1999). LVH was reported to be "one of the less common but ominous
risk factors for coronary disease, stmke and cardiac failure" (Kannel 1 99 1 ). Atmrial
fibrillation is a strong predictor of both stmke morbidity, stroke mortality and heart
disease mortality (Krahn et al. 1995) where in the Manitoba Follow-up Study multivariate
risk ratios of 2.07,2.48 and 1.41 were reportai, respectively. Relative risk for stroke
were reported to be greatest in the elderly male with relative risks 3 to 4 fold (Wolf et al.
199 1 b). Evidence associated with major electrocardiographic abnomalities, including Q
waves, left axis deviation, T-wave inversion, left bundle branch block and rhythm
disturbances have been reviewed in men (Sox et al. 1989) and been reported to have
increased risks of heart disease mortality and higher risks of heart disease and
cardiovascular mortality (Cedres et al. 1982).
Leisure time physical activity has been examined separately fiom physical activity
"on the job" for risk of heart disease (Salonen et al. 1988). Adjusted for other risk
factors, physical inactivity in leisure time was associated with a significant odds ratio of
1.2, whereas it was 1.3 for sedentary occupations. For CHD, the Framingham Study
repocted a "clear trend" of favourable outcome with increasing level of physical activity
for al1 ages, including the elderly (Kannel et ai. 1986a).
Some perhaps more curious nsk factors have included a report that men may be
more likely to suffer cardiovascular events on Monday compared to other day of the week
(Rabkin et al. 1980), that risk of myowdial infarction increases with degree of baldness
(Lesko et al. 1993, Wilson and Kannel 1993) and that snorers have an increased risk of
stroke in the 30 minute period irnrnediately following waking (Palomaki et al. 1989).
Some of these prompted a title in Time Magazine, "What's a short, bald-headed, pot-
bellied guy to do?' (Lemonick 1993).
3.4.9 Combinations of risk factors
It has been said that cardiovascular disease is a multifactorial disease. Risk
factors for carâiovascular disease tend to be highly correlated. Blood pressure tends to
increase with age, as does cholesterol with age. Smokers have been shown to have higher
blood pressures than non smokers, and in general, males have higher blood pressures than
females. Cardiovascular mortality was greatest in the obese, h d a linear increasing
relationship with BMI in non smokers and a somewhat "U-shaped" relationship with
BMI arnong smokers (Wannamethee and Shaper 1989). Diabetics tend to have higher
risk factor levels, although the effect of diabetes rernains independent in most analyses of
risk (Kannel 1979, Kannel 1985). Many epiderniological models of nsk factors and
cardiovascular disease have repeatedly shown the statistical independence of most
cardiovascular risk factors. Hence, the importance for understanding the multifactorial
nature of cardiovascular disease and these implications are that risk of cardiovascular
disease will increase rapidly with evidence of each risk factor. For example, in men, the
nsk of ischemic heart disease doubles as total cholesterol increases fkom 5.2 to 6.2
mmol/l, with elevated blood pressure it doubles again, and for a smoker, double again
(Stamler et al. 1986). Thus, a man with al1 of these risk factors would be at a risk of IHD
eight times greater than a man without any of the three.
It has been estimated fiom the Framingham data that individual level risk factors,
i.e. high blood pressure, obesity, elevated serum cholesterol, smoking, diabetes and a
sedentary lifestyle, account for about fi@ percent of cases of coronary heart disease
(Kuller 1976). However, many other unhiown risk factors must also contribute to the
incidence of CHD. The relative importance of cardiovascular risk factors was estimated
(Kaplan and Stamler 1983, Stamler et al. 1993b) using standardized logistic regression
coefficients. For both men and women, age 45 through 74 years, over a 20 year follow-
up pend, hypertension was the strongest positive factor, followed by semm cholesterol,
electrocardiographic evidence of left ventricular hypertrophy and cigarette smoking.
These factors had varying levels of risk when examined for di ffdng manifestations of
disease.
3.5 Contributions of the Manitoba FoUow-up Shidy to knowldge of the epidemiology of eardiovucular disease
To date, thirty-nine papers have been published b a s 4 on the findings of the
MFUS. Many hypotheses conceming the relationship between blood pressure and body
build to development of ischemic heart disease and stroke have been examined. Patterns
of these risk factors over time have been described, and some effects of aging on these
risk factors have been reported. Some of these publications and their findings, pertinent
to the objectives of this thesis, will be described.
3.5.1 Blood pressure, body buUd and cardiovascular dhease in tbe Manitoba FoUow-up Shidy
A b 1 5 years of follow-up, to 1963, (Mathewson et al. l96Sb) the first papa
describing build and blood pressure with the development of coronary heart disease was
published. huing this fol10 w-up interval, 2 1 0 men had died and 1 43 had developed
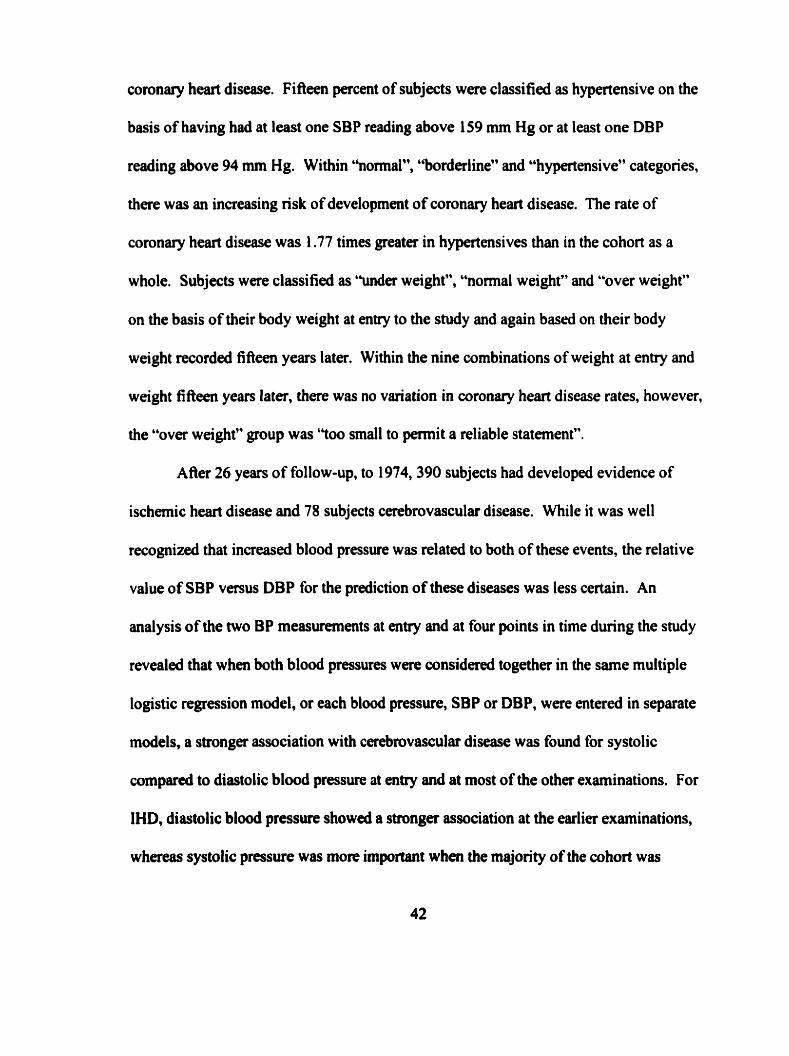
coronary heart disease. Fifieen percent of subjects were classified as hypertensive on the
basis of having had at least one SBP reading above 159 mm Hg or at least one DBP
reading above 94 mm Hg. Within "normal", ''borderline" and "hypertensive" categories,
there was an increasing risk of development of coronary heart disease. The rate of
coronary heart disease was 1.77 times greater in hypertensives than in the cohort as a
whole. Subjects were classified as "under weight", "normal weight" and "over weight"
on the basis of their body weight at entry to the study and again based on their body
weight recorded fifieen years later. Within the nine combinations of weight at entry and
weight fifieen years later, there was no variation in coronary heart disease rates, however,
the "over weight" group was "tm small to permit a reliable statement".
After 26 years of follow-up, to 1974,390 subjects had developed evidence of
ischemic heart disease and 78 subjects cerebrovascular disease. While it was well
recognized that increased blood pressure was related to both of these events, the relative
value of SBP versus DBP for the prediction of these diseases was less certain. An
analysis of the two BP measurements at entry and at four points in time during the study
revealed that when both blood pressures were considered together in the same multiple
logistic regession model, or each blood pressure, SBP or DBP, were entered in separate
models, a stronger association with cerebrovascular disease was found for systolic
compand to diastolic blood pressure at entry and at most of the other examinations. For
IHD, diastolic blood pressure showed a stronger association at the earlier examinations,
whereas systolic pressure was more important when the majority of the cohort was
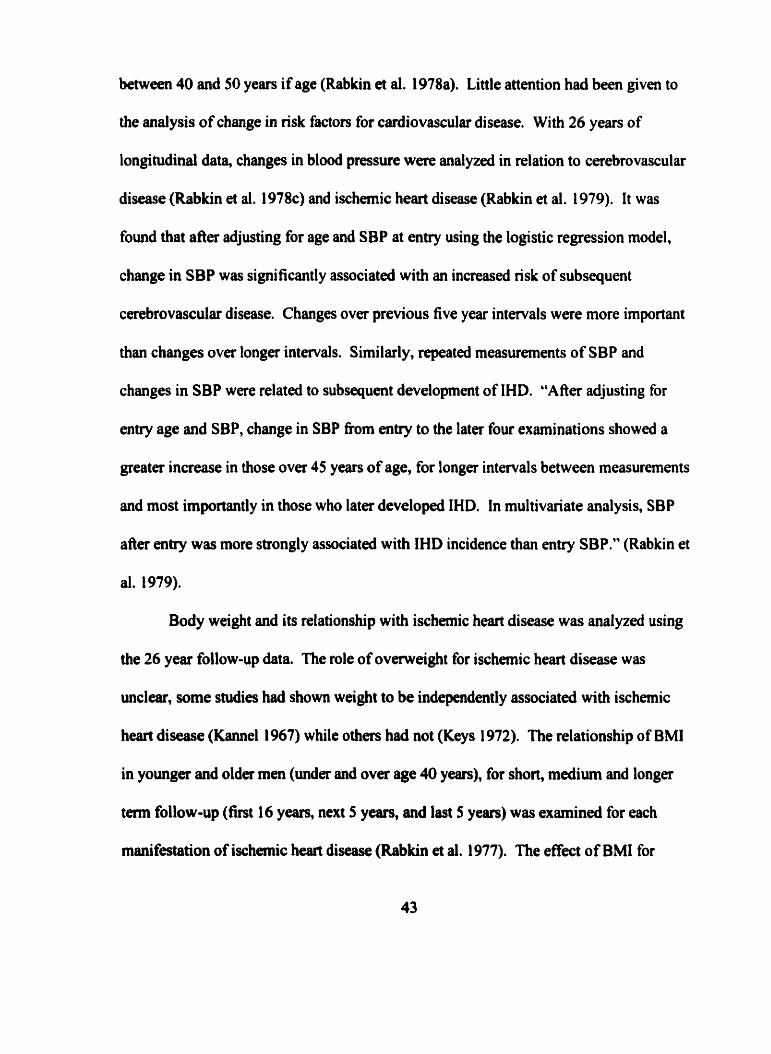
between 40 and 50 years if age (Rabkin et al. 1978a). Little attention had been given to
the analysis of change in nsk factors for cardiovasculardisease. With 26 years of
longitudinal data, changes in blood pressure were analyzed in relation to cerebrovascular
disease (Rabkin et al. 1 978~) and ischemic heart disease (Rabkin et al. 1 979). It was
found that afler adjusting for age and SBP at entry using the logistic regression model,
change in SBP was significantly associated with an increased nsk of subsequent
cerebrovascular disease. Changes over previous five year intervals wete more important
than changes over longer intervals. Similarly, repeated measurements of SBP and
changes in SBP were related to subsequent development of IHD. "After adjusting for
entry age and SBP, change in SBP fkom entry to the later four examinations showed a
greater increase in those over 45 years of age, for longer intervals between measurements
and most irnportantly in those who later developed IHD. In multivariate analysis, SBP
afier entty was more strongly associated with IHD incidence than enûy SBP." (Rabkin et
al. 1979).
Body weight and its relationship with ischemic heart disease was analyzed using
the 26 year follow-up data. The role of ovenweight for ischemic heart disease was
unclear, some snidies had shown weight to be independently associated with ischemic
heart disease ( b e l 1967) while others had not (Keys 1972). The relationship of BMI
in younger and older men (under and over age 40 years), for short, medium and longer
term follow-up (first 16 years, next 5 years, and last 5 years) was examinai for each
manifestation of ischemic heart disease (Rabkin a al. 1977). The effect of BMI for
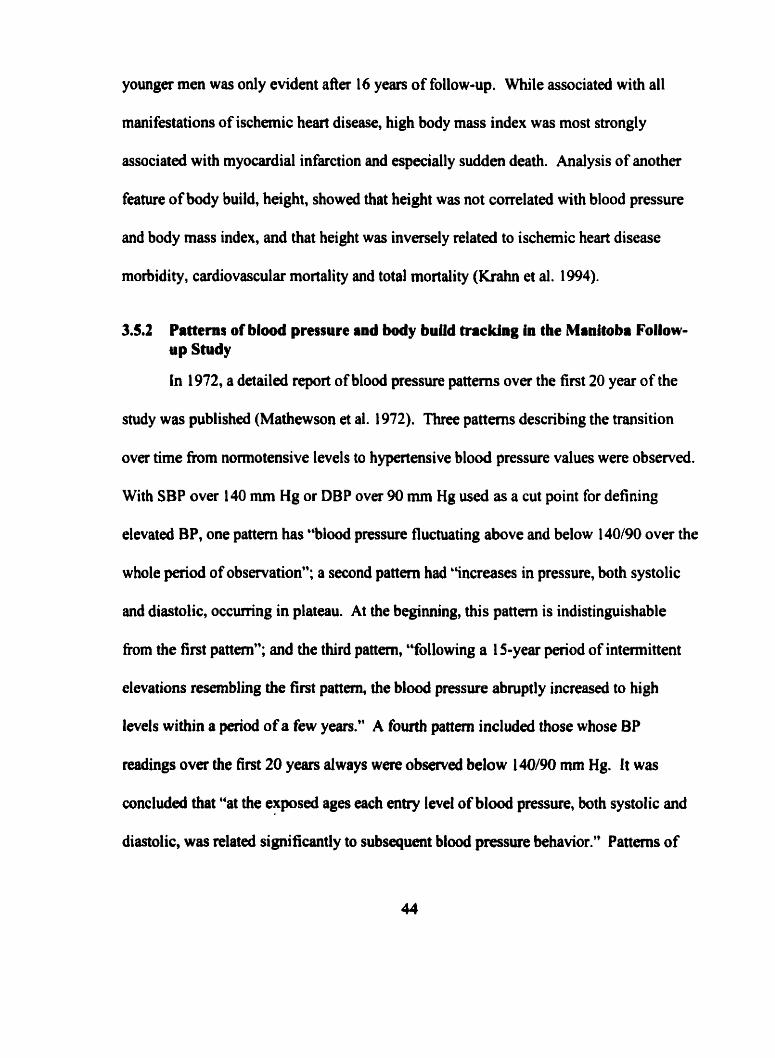
younger men was only evident afier 16 years of follow-up. While associated with al1
manifestations of ischemic heart disease, high body mass index was most strongly
associated with myocardial infarction and especially sudden death. Analysis of another
feature of body build, height, showed that height was not correlated with blood pressure
and body mass index, and that height was inversely related to ischemic heart disease
morbidity, cardiovascular mortality and total mortdity (Krahn et al. 1994).
3.5.2 Patterns of blood pressure and body buiid tracking in the Manitoba Follow- up Study
In 1972, a detailed report of blod pressure patterns over the first 20 year of the
study was published (Mathewson et al. 1972). Three pattems descnbing the transition
over time h m normotensive levels io hypertensive blood pressure values were observed.
With SBP over 140 mm Hg or DBP over 90 mm Hg used as a cut point for defining
elevated BP, one pattern has 'blood pressure fluctuating above and below 140190 over the
whole period of observation"; a second pattern had "increases in pressure, both systolic
and diastolic, occurring in plateau. At the beginning, this pattern is indistinguishable
fiom the first pattern"; and the third pattern, "following a 1 5 - year period of intermittent
elevations resembling the first pattern, the blood pressure abniptly increased to high
levels within a period of a few years." A fourth pattern included those whose BP
readings over the first 20 years always were observed below 140/90 mm Hg. It was
concluded that "at the exposed ages each entry level of blood pressure, both systolic and
diastolic, was related significantly to subsequent blood pressure behavior." Patterns of
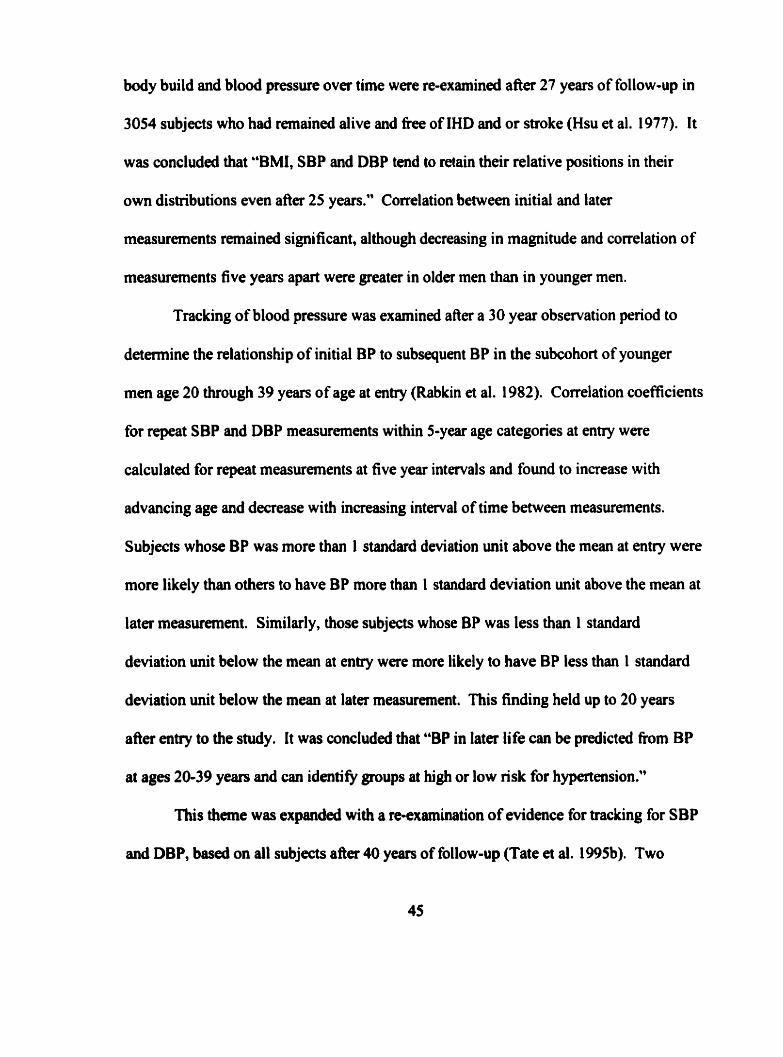
body build and blood pressure over time were re-examined after 27 years of follow-up in
3054 subjects who had remained alive and free of IHD and or stroke (Hsu et al. 1977). It
was concluded that "BMI, SBP and DBP tend to retain their relative positions in their
own distributions even afler 25 years." Correlation between initial and later
measurements remained significant, although decreasing in magnitude and correlation of
measurements five years apart were greater in older men than in younger men.
Tracking of blood pressure was exarnined after a 30 year observation period to
determine the relationship of initial BP to subsequent BP in the subcohort of younger
men age 20 through 39 years of age at enûy (Rabkin et al. 1982). Correlation coefficients
for repeat SBP and DBP measurements within 5-year age categories at entry were
calculated for repeat measurements at five year intervals and found to increase with
advancing age and decrease with increasing interval of time between measurements.
Subjects whose BP was more than 1 standard deviation unit above the mean at entry were
more likely than others to have BP more than 1 standard deviation unit above the mean at
later measurernent. Similarly, those subjects whose BP was less than 1 standard
deviation unit below the mew at entry were more likely to have BP less than 1 standard
deviation unit below the mean at later meamrement. This finding held up to 20 years
afler entry to the study. It was concluded that "BP in later life can be predicted from BP
at ages 20-39 years and can identify groups at hi& or low risk for hypertension."
This theme was expanded with a re-examination of evidence for tracking for SBP
and DBP, basd on al1 subjects afier 40 years of follow-up (Tate et al. 1995b). Two
methodological approaches, corre1ation of repeat measurements and a calculation of the
relative likelihood of remaining in the top or bottom quintile of the BP distribution at
subsequent measumnent confimed signifiant BP tracking. BP tracking was strongest
for middle age men, 45 to 55 y e m of age and decreased with increasing interval of time
between measurements. This analysis provided further evidence that young men at
highest nsk of hypertension in later Me can be identifid, and hence "strategies for
prevention of cardiovascular complications can be targeted in earl y adul thood.
3.53 Aghg and risk faeton in the Manitoba Follow-up Study
While there is little doubt that BP, smoking and BMI are predictors of long terni
coronciry heart disease morbidity and mortality, an analysis over 45 years of follow-up
examined whether the effects of these risk factors on manifestation of ischernic hem
disease were modified with aging (Tate et al. 1998). It was shown that the effects of
SBP, DBP and smoking declined with age to the point that after age 65 years, these three
risk factors were no longer significantly associated with ischernic hearî disease incidence.
The effects of diabetes mellitus and BMI did not significantly change with age. It was
concluded that 'This dynamic relationship must be kept in mind when planning strategies
for prevention of cardiovascular disease."
3.6 Other longitudinal rhidici of cardiovuculu direase
The objectives of this thesis relate to the epiderniology of cardiovascular disease
morbidity. Specificaîly, the incidence of IHD and its manifestations over time and effect
46
of aging on the distribution of risk factors for IHD will be examined. Evidence for
tracking of blood pressure and BM1 will be explored. As well, the potential for tracking
as an additional risk factor for IHD will be assessed. These objectives are important to
the understanding of nsk factors, aging and IHD, but are possible to analyze only with
longitudinal data. Hence, the MFUS is well suited to address these hypotheses. Other
longitudinal studies have been undertalcen around the world with dittérent cohorts for
similar purposes. Some aspects of these studies will be described in the following
sections.
3.6.1 The Chicip Cohorts
The long term impact of cardiovascular risk factors on total and cardiovascular
mortality is being investigated using the combined data of three studies under taken
during the 1950s in Chicago and followed since then. The snidies are as follows: The
Western Electric Company cohort of 1,903 men aged 40-55 years from the fall of 1957,
1,594 men employed by the Peoples Gas Company age 40-59 years fiom January 1958
and 1,605) male employees fiom this company age 25-39 in January 1959 (Starnler et al.
1993b). For some analyses these cohorts have also been mergeà with other cohorts from
the Chicago Heart Association Detection Project in Industry.
3.6.2 The Poolhg Project
By the early 1960s a number of longituàinal studies aimed at CHD were
underway in the US. In 1964, the data h m the men of five studies were pooled. These
five included data h m the Albany civil servant study, Chicago People's Gas Company,
47
Chicago Western Electric Company, and the Framingham and Tecumseh studies (The
Pooling Project 1978). Over the next few years, data fiom an additional eight studies
were involved. In 1978, the final report of this project was published, presenting
distributions of nsk factor profiles, and CHD incidence based on close to 100,000 person
years of observation fiom 12,s 16 men age 40 to 64 years.
3.63 The Framlngham Study
lnitiated in the same year as MFUS, the Framingham Heart Study has been
following the lives of 5,127 residents of Framingham , Massachusetts with biannual
exarninations, primarily aimed at the detection of cardiovascular disease (Dawber 1 980).
The Framingham study continues today, and is recognized as the world's greatest
conaibutor to the knowledge and understanding of the epidemiology of cardiovascular
disease,
3.6.4 Honolulu Heirt Study
The Honolulu Heart Prograrn is a prospective epidemiologic investigation of
coronary hart disease and stroke arnong men of Japanese origin who were bom in the
y e m 1900- 19 19 and living on Oahu in 1965 (Ben fante et al. 1989). At baseline
screening, 59 19 men age 46 through 59 years were free of CHD and stroke and were
subsequently followed for development of new CHD.
3.6.5 The Rancho Bernardo Study
Between 1972 and 1974,82% of the residents living in Ranch Bernardo,
Cali fornia beîween the ages of 40 and 79 years were enrolled in a population based study
of CHD (Cnqui et al. 1978). These 4014 men and women were followed for 9 years for
development of CHD, providing contributions to the literatw on differences in risk
factor effects in men and women.
3.6.6 The Quebec Cardiovascular Study
A cohort of 4576 men aged 35 to 64 years living in seven comrnunities around
Quebec City, Canada, were enrolled in this study in 1974 (Dagenais et al. l99Oa).
Baseline risk factors for cardiovascular disease have been related to development of
cardiovascular disease. Over a 12 year follow-up per-iod to 1986,603 first CHD events
were documented.
3.6.7 Goettingen Risk, Incidence and Prevalence Study (GRIPS)
In order to estimate the "impact, ranking and potentiating power" of
cardiovascular risk factors, a cohort study of 5790 men age 40-59 years were followed
prospectively with a 97.4% response over 10 years to document morbidity and mortality
(rnyocardial in fwction, sudden death and CHD death) (Crerner et al. 1 997).
3.6.8 The Gotheaberg Shidy
At age 50 years, in 1963,88% of eligible men, one third of dl men born in
Gothenburg, Swedeo in 19 13, were enrollcd in a study. The badine examination was
supplemented with a second exarn in 1967, again in 1973 and 1980. Incidence of CHD
and stroke was examined after 18.5 and 25 y e m (Welin et al. 1987, Welin et al. 1993).
3.69 The Copenhagen City Heirt Study
A baseline exam of 14,233 residents was conducted in 1976 through 1978. The
study was design4 to bbevaluate the incidence of and risk factors for cardiovascular
disease" (Nyobe et al. 1989). An average follow-up of 6.5 years up to the end of 1983
provided data for estimation of incidence of CHD and evaluation of risk factor effects.
3.6.10 The Charle9toa Heart Study
A study population in Charleston, South Carolina of just over 2,000 black and
white men and women age 35 years and older in 1960 were enrolld in this study. They
were followed over the next 28 y e m with four recall examinations to determine the
relationship of cholesterol measurements in these four subgroups to total and CHD
mortality (Keil et al. 1992).
3.6.1 1 Alameda County Study
Al1 male state workers in Albany, New York were invited to enter a prospective
study to detect hypertension and CHD over time. Eighty-nine percent of eligible
employees, 19 10 men in total, were recruited during 1953 and 1954 (Hilleboe et al.
1954). Baseline and repeat measurernents of cardiovascular risk factors have been
obtained over a 30 year follow-up period and reiated to CHD morbidity and mortality.
3.6.12 The Bogaluga Study
The Bogalusa Heart Shidy was designed to track cardiovascular risk factors in
childnn (Berenson et al. 1995). This study was designed to provide information on both
males and fernales of different racial origins. A population of approximatel y 5,000
children has been followed since 1974 with repeat examinations. The study aimed
prirnarily at providing information on distribution and prevalence of nsk factor values in
a pediaûic population, whether risk factors track in young populations, and the
intmelationship of coexisting risk factors in the young.
3.6.13 The Muscatine Study
A study designed to examine tracking of blood pressure in children was
undertaken in Muscatine, Iowa where a cohort of 43 13 children age 5 through 14 years of
age were enrolled in 1970 (Clarke et al. 1978). Thtee to six measurements of blood
pressure in these children over a period €rom four to ten years provided data to examine
BP patterns inherent in individuals with repeat measwements over time.
3.6.14 The Amrterdam Growth and Health Study
Longitudinal data involving five repeat measurernents of blood pressure over a 9
year follow-up period of 200 adolescents fiom ages 13 through 2 1 years were collected to
address questions of tracking of values h m teenage years to a d u l t h d (Kemper 1990).
3.6.1 5 Normative Aging Study
This longitudinal study of health and aging was established by the Veterans
Administration in the US. Community residents h m the Boston area were identifiai
51
and 2280 male volunteers age 2 1 to 80 years, were enrolled in 1963 (Cassano et al. 1990).
The study is ongoing, with repeat examinations including BP measured at 5-year intervals
before age 52 years, and every 3 years thereafter. The study is ongoing, and primary
mortality endpoints are being recorded.
3.6.16 Cardiovasciilar Health Study
In 1990, an attempt was made to remit 1250 residents, men and women, age 65
years and older from each of four cornmunities across the US to form the 5000 member
cohort of the Cardiovascular Health Study. Baseline and repeated physical examinations
were planned over time to address the following five objectives of this study: "1. To
quanti@ associations of conventional and hypothesized risk facton with CHD and stroke.
2. To assess the associations of indicaton of subclinical disease, identifid by
noninvasive measures such as cmtid ultrasonography and echocardiography, with the
incidence of CHD and stroke. 3. To quantifi associations of conventional and
hypothesized nsk factors with subclinical disease. 4. To characterize the natural history
of CHD and stroke, and identify facton associated with clinical course. 5. To describe
the prevalence and distributions of nsk factors, subclinical disease, and clinically
diagnosed CHD and stroke"(Fned et al. 1991).
4 STUDY DESIGN, PROCEDURES AND METHODS
In general, epidemiologicd studies are investigative procedures designed to
examine the association between exposure and disease. Longitudinal studies are
characterized by an element of time. Specifically then, in an epidemiological longitudinal
study of disease, the determination of exposures of individuals or the observation of
disease development, or both, are determined at more than one point in time.
Epiderniology has many definitions, but most definitions include an investigation
of some aspects of the frequency, distribution and detminants of disease in a population
(Hemekins and Buring 1987). Longitudinal epidemiologic studies of CVD frequently
focus on the moibidity and mortality of manifestations of CVD. An analysis may include
the frequency or incidence of CVD within populations, or the distribution of CVD in
subgroups of populations, of men and women, by age, or geographic region. The
deteminants of CVD may be investigated by examining the association of predisposing
factors or characteristics of disease free individuals to the subsqwnt manifestation of
CM). Through the examination of healthy individuals before evidence of disease, during
the manifestation of disease, and prognosis of individuals following disease onset a
complete longitudinal investigation of CVD can be perfomed. Hence, longitudinal
epidemiologic studies of CVD, may investigate the "naniral history" of C M .
4.1 Design options for longitudinal studicr of eardiovaacular disease
4.1.1 Clarsifieation of longiîudinal research designs
Because the element of time is present in al1 longitudinal shidies, the possibility
exists for examining the relationship between characteristics (exposure) and outcome
(disease) fiom two directions. The selection of the sarnple for study can be based on
either the outcome or exposure of interest, or some other criteria. Further, the timing of a
study describes the relationship, in calendar tirne, between the collection of data and the
conduct of the shidy. Exposure and outcome for analysis may have both occurred prior to
the conduct of the study or are detemineci concurrently with the conduct of the study, or
some combination of these directions is possible. Studies of relationships from exposure
fomard in time to the development of disease are called cohort studies. Studies looking
back in time examining the prior characteristics of diseased and non diseased individuals
are called case-çontrol studies.
The classification of epidemiologic shidies based on these three considerations
has been suggested in order to present a consistent definition of study designs using
consistently defined t m s (Krama and Boivin 1987). Hence, the directionality of the
study, selection of the sample and timing of the conduct of the study al1 detemine the
type of research design. The MFUS is an example of a cohort study (directionality),
whose participants were recruited (selection) by convenience on the bais of a cornmon
experience, i.e. active participation in aviation, Qther the RCAF dwing WWI or
commercially in the late 19409, with a detennination of exposure and outcome conducteci
concwently (timing) over time.
Both cohort and case-wntrol studies involve an elernent of time and both have
their relative merits and weaknesses. Cohort studies require following a group of
individuals over a period of time to detemine outcomes, and hence the cornmitment of
both individuals and resources is necessary to conduct the study and collect the data
before any analysis of the relationship with exposures of interest can be made (Liddell
1988). On the other hand, case-control studies may be quicker and cheaper to undertake,
as both outcome and exposure data necessary for analysis have already occuned.
However, al1 exposure data rnay not necessarily be available, nor complete, as
completeness and accuracy of information about exposure will rely on existing records
fiom the past. Further, in cohort studies there is no uncertainty about the temporal
relationship between exposures and disease manifestation, as initially disease fiee
individuals will be followed forward in time to onset of disease. The sarne is not true
with case-control studies, where both the exposure and disease onset have already
occurnd when the time study is undertaken, and the temporal relation between the two
rnay be uncertain. Because of these rasons, the study of CVD requiring nsk factor
information before the incident event is rarely feasible to undertake as a case-control
study.

4.1.2 Population kvel versus individual level studicr
Longitudinal studies rnay be undertaken for a variety of reasons (Kalton 1992).
There rnay be interest in the determination at the aggregate or population level of the
change of the burden of illness in a population over time. Change in the distribution of
population characteristics or change in factors associated with disease rnay be important
to adjust strategies for CVD prevention interventions. Aggregate changes over timc in
population characteristics or disease levels rnay be indicative of previous successful
interventions. On the other hand, it rnay be that individual level changes are of interest.
Individuals whose characteristics change over tirne rnay have a different outcome than the
individuals whose characteristics remain stable.
In prospective, longitudinal studies, the same fixed group of individuals rnay be
followed o v a time, often with repeat measurements of characteristics, until the
endpoint(s) of interest are reached. Altematively, a different sample of individuals can be
selected at points in time and exarnined. The collection of data at the individual level,
fiom the same individuals, will permit the analysis of the relationship to endpoints
detmined later in time between both baseline characteristics and changes in individual
characteristics. This has a distinct advantage over the collection of data fiom different
cross sections of the population at points in time, where exposa data at one point in
time is not linked with the individual at enother point in time. Thus, at the population
level, changes in distributions of exposure levels and changes in burden of disease in a
population cm be determineû, but only ecological statements of the relationship between
the two can be made.
4.13 Prospective cohort studies of catdlovascuiir disease
The word "cohort" is derived nom the ancient Roman term, describing military
units or groups of soldiers. In the context of epidemiologic studies, a cohort is any group
of individuals sharing a common set of charactaistics. A cohort may be a group of
individuals who were bom in the same pend of time, or who live in the sarne
community, or who al1 had a comrnon experience at the beginning of a study. In the
epidemiologic investigation of CHD, the Norwegian study of men bom in Oslo in 19 1 3,
the Framingharn Study where the residents of Framingharn, Massachusetts have been
followed with repeat medical examinations since 1948 and the Manitoba Follow-up
Study where a cohort of air crew recruits from the RCAF during WWI have bem
followed for more than 50 years me al1 examples of prospective cohort studies. A
cornmon f m of these snidies is that one group of individuals was assernbled, i.e. the
size of the whort was fixed at entry to the study, and this same group was followed over
time. For reasons of practicality, the thousands of subjects of the MFUS or Frarningham
study could not al1 be emlled to the study on exactly the same day. However a date
sealing the cohort, following which no new subjects are enterai, defines the fixai
membership of the cohort for duration of the study.
Other longitudinal designs may allow for cohorts to accrue over time. For
example, survivors of myocardial infmtion discharged from a hospital may enter a
cohort study where prognosis within different regimens of treatment may be compared.
Here subjects are not entered to the study at one point in time, but rather, qualie for
inclusion over time, as eligible subjects are discharged nom hospital. The progression of
C M , or prognosis following an index CVD event may be most efficiently examined
with a study of this design, referred to as an inception cohort study.
The strengths and weaknesses of the type of cohort are linked to the reasons for
undertaking the study. The natutal history of CVD might be best exarnined with an
initially disease free, fixed size, cohort followed over time. Longitudinal cohort studies,
where the size of the cohort is fixed at the beginning of the study and the course of events
experienced by this cohort of individuals is docwnented over time is called a follow-up
study. Because this type of study requires following a cohort forward in time, it is often
refmed to as a prospective cohort study, or prospective follow-up study.
When a cohort study is being designed to examine the relationship of individual
characteristics or exposure states to the subsequent development of CVD, the issue of
who to include in this study is related specifically to who is available to be invited, who is
at nsk of disease, and what some of the expectations of development of disease would be
in this cohort. For example, the incidence of CVD is greater in men than in women,
increasing with age and greater in some gcographic areas than others. A requirernent for
the validity of a cohort stuây is to obtain complete and accurate information on al1
m e m h of the cohort. Cohorts comprised of individuals fiom a single workplace or
organization may be easier to follow than a sample of individuals h m a Iarger
population. One early example was that of the cohort of British physicians, assembleci to
examine the relationship between tobacco and cancer (Do11 et al. 1994). A more recent
example is that of a cohort of 12 1,700 female nurses who have been followed for over 20
years with questionnaires on lifestyle practices (Colditz et al. 1997). These cohort
choices proved to be powerfùl designs as these studies were cumprised of subjects who
were easy to follow and motivated as to the study objective.
At the beginning of a cohort study of CM) the baseline examination will include
an initial screening as only those f k e of CVD and hence at nsk of development of CVD
will be eligible for inclusion in the cohort. Exposure variables of interest to the study
hypotheses need to be measured. As well, demographic characteristics of the cohort such
as gender and age and perhaps c m t comorbid conditions are generally documented at
enûy to the study.
Critical to the choice of variables to measure in a study is the consideration to
collect information on factors that might effect the relationship between the exposure and
outcome being studied. A factor that is both related to the exposure being studied, but
not a consequence of the exposure, and relateâ to the autcome to be determined might
influence the association between exposure and outcome. This phenornenon is refmed to
as confounding, and the factor in question is called a confounding variable. For example,
in examination of the relationship between hypertension (the exposure variable) and CVD
(the outcome), it is known that hypertension bewmes more common with advancing age,
and CVD is also more common at older aga. Care must be taken to control for age in
any examination of the relationship between hypertension and CVD so that an association
found between hypertension and CVD can not be attributed to differences in age between
h ypertensive and non- hypertensive subj ects.
Some studies, such as the Framingham Study and the Manitoba Follow-up Study,
have included periodic physical examination in their desips to monitor risk factor
profiles and determine disease status. Annuai contact with al1 study memben has been
attempted to monitor vital status and maintain an "upto-date" registry of addresses of
cohort members. This has proven invaluable, both for minimization of subjects lost
duing the follow-up period as well as to ensure accurate documentation and timely
recording of events.
The specific endpoints of interest need to be identified and clear definitions
specified befote the sîudy begins. Depending on the duration of a study, flexibility of
procedures for collection and coding should be considerd to allow for changes in
evolving diagnostic methods and disease coding conventions. A standard coding system
already in use in 0 t h studies of similar design may be preferable to the development of a
new system. This will enhance the possibility of cornparisons between studies.
Furthemore, the use of established valid and reliable instruments to measure
characteristics is prefeiable.
A goal of the follow-up process is to obtain as complete and accurate information
as possible about each subject's health outcornes. Outcome data may be collected over
time as events occur or are determined at a point in the friture h m medical records and
vital statistics. The cost associated with surveillance of a cohort with routine medical
examination or screening for new disease is greater than determination of outcome events
at one point in time at the end of the study, but the accuracy and timeliness of the former
method is greater. For documentation of mortality, vital statistics records may suffice to
determine a subject's status at the end of follow-up. This will only be possible if carefùl
records have been maintained to keep unique identifiers for the linkage to these sources.
The decision as to how long a study should continue and how frequently
participants should be examined is a fùnction of the specific research questions being
addressed. To examine the association of risk factors measured in young adults with
subsequent manifestation of CVD, a long follow-up interval, spanning decades will be
required to accrue enough endpoints to have reasonable statistical power to test an
association between the two. The frequency of re-examination of study participants will
depend on whether changes in risk factors are expected to occur, and how muent
examinations of the cohort are necessary to document outcornes. Because of the long
time spanned by many cohort studies of disease it is crucial to have the necessary
commitment of personnel and finances to support the study to its projected completion.
An investigation of incident CVD may span many decades before completion of the
study .
4.2 Design of the Manitoba FoUow-up Study
The Manitoba Follow-up Study is a prospective cohort study of cardiovascular
disease. A cohort of 3,983 men was sealed on July 1, 1948. This cohort has been
followed with medical examinations at regular intervals to detemine risk factor profiles
and document evidence of IHD. At the present time, this stuûy is in its fi@-first year.
Data used in the analyses undertaken for diis thesis cover the 45-ycar follow-up period to
July 1, 1993.
4.2.1 Contact procedures and examination rquests
Procedures for collection of data including annual contact, medical examination
requests and periodic questionnaires were describeci previously in Chapter 2. To
surnrnarise, annual contact by mail was used to monitor vital status and maintain an
address registry. Medical examinations were requested every five years until 1965, and
every three years since then and administered by each study member's personal physician
or the medical staff of the Department of Transport. Examinations included a resting 12
lead electrocardiogram and measurement of SBP, DBP and body weight in addition to a
general cardiovascular assessment. Since 1978, a one page questionnaire has been
included with the annual contact letter. This questionnaire asks about physician contacts
or hospitalisations occumng between examination requests, to enable timely follow-up
and documentation of new medical information. Details of reported physician contacts or
hospitalisations from the annual questionnaire were verifid by correspondence with
attmding physicians and hospitals. Electrocardiograms and medical reports were

interpreted and d e d independently by two physicians. Diagnoses of cardiovascular and
non-cardiovascular comorbid events were recorded.
4.2.2 Definition of manifmtrtioas of iachemic heart disease
The onset of ischemic heart disease was dehed by the date of the earliest
manifestation of myocardial infarction, angina pectons, or sudden death. The diagnostic
criteria for these three events are as follows.
4.2.2.1 Angina Pectoris
Angina pectoris was identified by one of several manifestations. Typical stable
angina was defined as chest pain of cardiac origin precipitated by effort, motion or
exposure to cold and relieved by rest or nitro-glycerine or both. Variant angina was
defined by episodes of cardiac pain at rest or on recumbency in association with elevated
ST segments. Unstable angina was defined by episodes of chest pain of cardiac origin,
lasting approxirnately 30 minutes, associated with significant ST-T changes without
enzyme elevations or abnormal Q waves; or chest pain typical of c d i a c pain, associated
with either elevated serum enzyme levels of twice normal or development of non-specific
electrocardiographic findings including ST-segment or T-wave changes or ventricular
conduction defects. Patients with positive exercise tests (horizontal or downward sloping
ST depression of at least 1 mm) with chest pain were also included in this definition.
4.2.2.2 Myoeardiil Infarction
Myocardial infarction was diagnosed baseû on fulfilment of any of the following
three criteria: 1 ) Classical acute myocardial infarction including clinical symptoms plus
elevated s m enzyme levels and new non specific electrocardiographic findings of ST-
segment or T-wave changes or ventricular conduction defects; 2) Non-Q myocardial
infarction defined as clinical symptoms consistent with myocardial infarction without
development of new abnormal Q waves with or without elevateû setum enzyme levels;
and 3) Silent myocardial infarction defined by development of new abnormal Q waves
without clinical symptoms.
4.2.2.3 Sudden Death
Based on the World Health Organization's definition, sudden death was defined
as naturai or non-violent death occming immediately or within an estimated period of 24
hours afier the onset of acute objective or subjective symptoms of ischemic heart disease
(WHO Scientific Group). The cause of death for al1 sudden deaths is listed as due to
ischemic heart disease.
4.2.3 Definition of risk factors
Five risk factors: SBP, DBP, BMI, DM and smoking were examined in this thesis.
No blood lipid measurements have been recorded in this study. Age at examination was
calculated to the nearest day using the difference between date of examination and date of
birth.
Resting b l o d pressure, systolic and diastoiic were obtained on routine medical
examination and were recorded as reported by each subject's physician. No specific
directions were given to physicians regarding protocol for measuing b l d pressure or
body weight. If two or more measumnents of blood pressure were reported at the sarne
examination date, the repeat measurements were averaged.
Although body weight and blood pressure were requested to be measured on al1
physicd exarninations, body weight was not reported on some occasions. Body weight
was more frequently not recorded on exarnination in the later years of the study. The
height measurement, recorded to the nearest inch at entry to the snidy, was used to
calculate BMI for each weight recorded. BMI was calculated as body weight in
kilograrns divided by height in meters squared (kg/m2).
A binary variable indicating reported presence of diabetes meIlitus was defined at
each exarnination. Evidence for diabetes mellitus was sufficient if the disease was
reported by the study member or his physician. Blood sugar levels have not been
routinely measured and no details about control of diabetes have been collected.
Smoking histories were obtainad retrospectively, for about 75 percent of the
cohort using mailed questio~aires in 1974 and 1982. For study mernbers who died
before 1974, and for those who did not respond to either questionnaire, a detailed review
of existing records €tom physician reports was conducted to obtain any information
conccming smoking habits. Histories were retrieved where possible from clinical
rewrds, but remain unknown for 14 percent of the cohort. No assumption about smoking
habit was made for these members. Four mutually exclusive categories were detined at
each examination: never smoked, cumnt smoker, former smoker, and unknown smoking
statu. During andysis, where the smoking variable was used, subjects whose smoking
stahis was wiknown were not excluded fiom analysis, but rather were included in the
unknown category.
4.2.4 Foiiow-up of the cohort
On July 1, 1948 the mean age of the 3,983 subjects of the MFUS cohort was 3 1.1
years with a standard deviation of 6.1 years. Most of the subjects, 87 percent, wcre
between age 20 and 39 years at that time. The age distribution at entry to the study is
shown in Table 4.1. By July 1, 1993, after 45 years of follow-up, 169 1 subjects had died,
at a mean age of 63.9. Of the remaining 2292 subjects, 2 159 were known to be alive on
July 1, 1993 and 133 study subjects, 3.3% of the cohort, are assumed to be alivc only to
the date of last contact. Thus, these 133 subjects have less than 45 years of follow-up.
The mean age of those known and assumed to be alive on July 1, 1993 was 74.0 with a
standard deviation of 4.4 years.
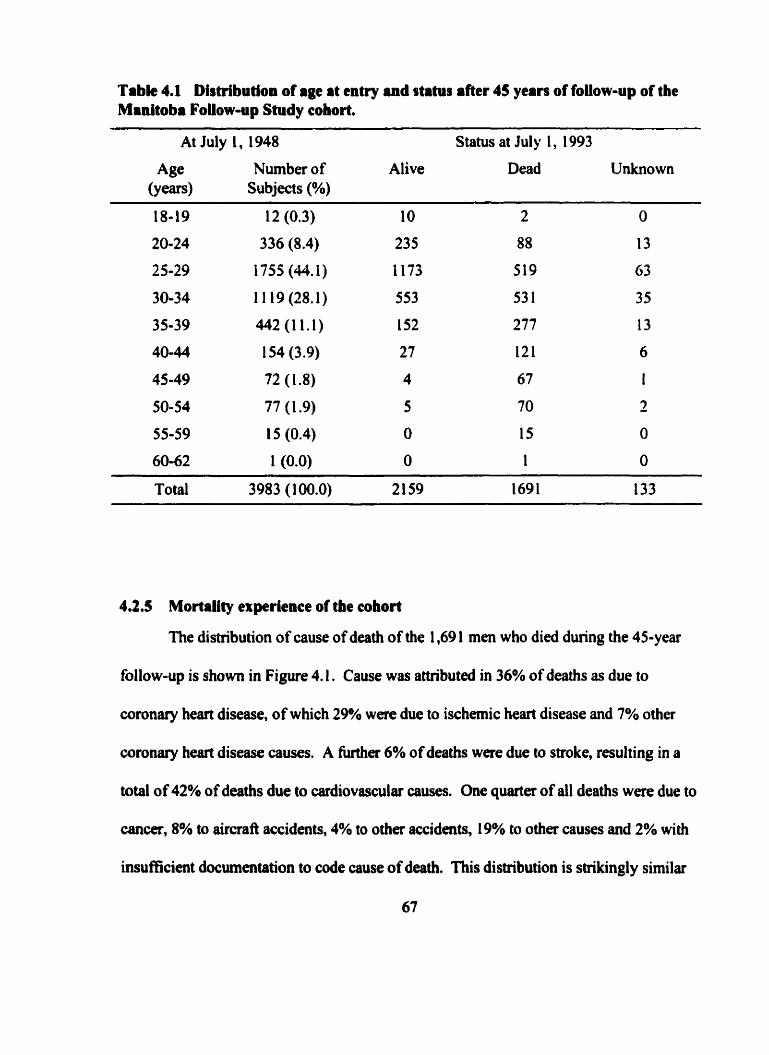
Tabk 4.1 Distribution of age at entry and stahis after 45 years of foliow-up of the Manitoba Foiiow-up Study cohort.
At July 1 , 1948 Status at Jul y 1 , 1 993
Age Number of Alive Dead Unknown (Y~w) Subjects (%)
Total 3983 (1 00.0) 2 159 1691 133
4.2.5 Mortality experience of the cohort
The distribution of cause of death of the 1,69 1 men who died during the 45-year
follow-up is shown in Figure 4.1. Cause was amibuted in 36% of deaths as due to
coronary heart disease, of which 29% were due to ischemic heart disease and 7% other
coronary h a r t disease causes. A fivther 6% of deaths were due to stroke, resulting in a
total of 42% of deaths due to cardiovascular causes. ûne quarfer of al1 deaths were due to
cancer, 8% to aircrafl accidents, 4% to other accidents, 19% to other causes and 2% with
insufficient documentation to code cause of death. This distribution is shikingly similar
67
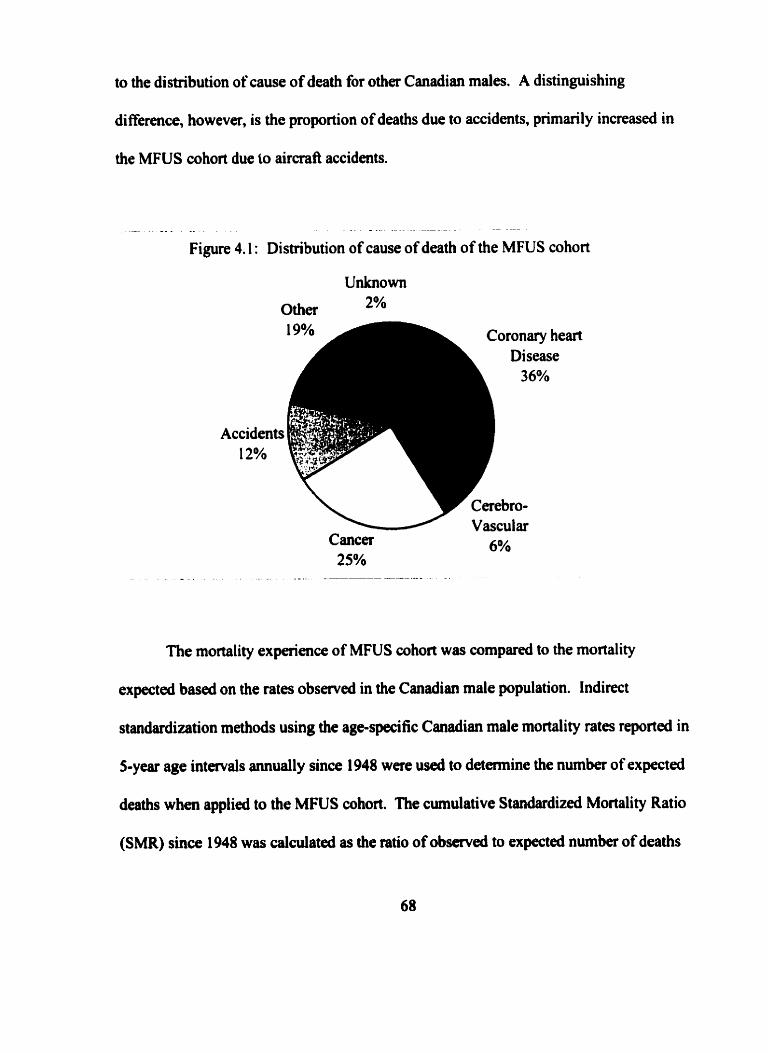
to the distribution of cause of death for other Canadian males. A distinguishing
difference, however, is the proportion of deaths due to accidents, primarily increased in
the MFUS cohort due to aircraft accidents.
- A - . . . . - . - - - - P A - - -
Figure 4.1 : Distribution of cause of death of the MFUS cohort
Accidents 12%
Coronary he L Disease
Cancer 25%
The mortality experience of MFUS cohort was compared to the mortality
expected based on the rates observed in the Canadian male population. Indirect
standardization methods using the age-specific Canadian male mortality rates reportecl in
5-year age intervals annually since 1948 were used to detemine the number of expected
deaths when applied to the MFUS cohort. The cumulative Standardized Mortality Ratio
(SMR) since 1948 was calculated as the ratio of observed to expected number of deaths
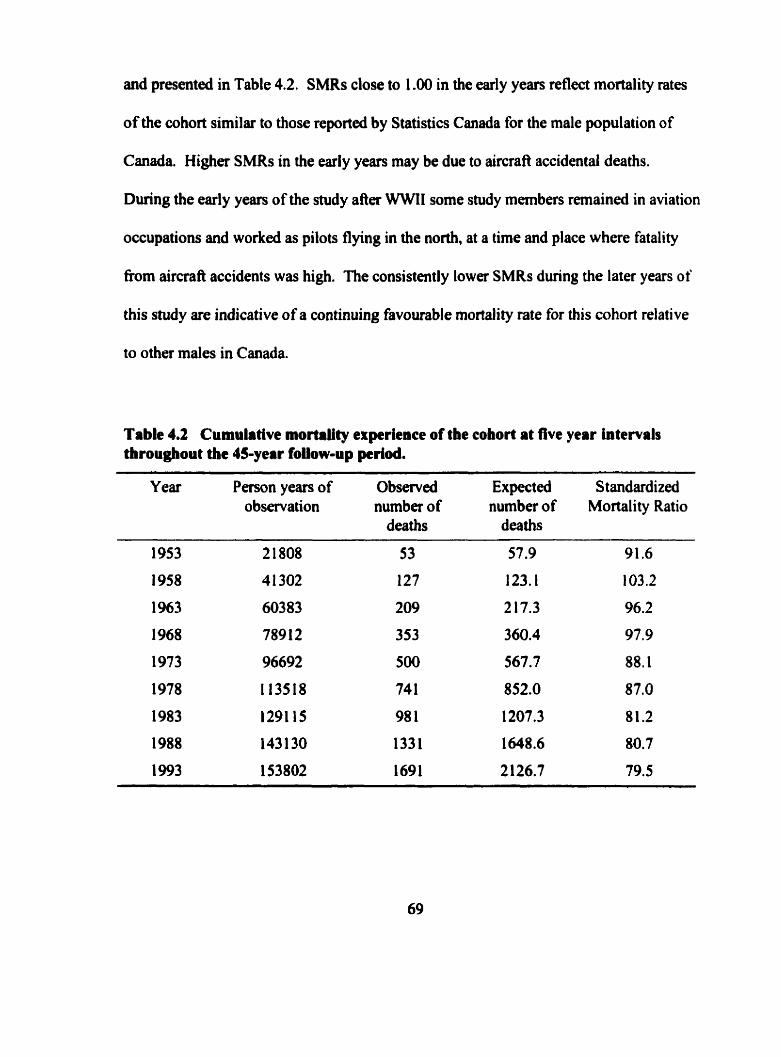
and presented in Table 4.2. SMRs close to 1 .O0 in the early years reflect mortality rates
of the cohort similar to those reported by Statistics Canada for the male population of
Canada. Higher SMRs in the early years may be due to aircraft accidentai deaths.
During the early years of the study after WWIl some study memben remained in aviation
occupations and worked as pilots flying in the north, at a time and place where fatality
from aircraft accidents was hi&. The consistently lower SMRs during the later years of
this study are indicative of a continuing favourable mortality rate for this cohort relative
to other males in Canada.
Table 4.2 Cumulative mortality experience of the cohort at live year intervals throughout the 45-year foiiow-up period.
Y ear Person years of Observed Expected S t andardized observation number of number of Mortality Ratio
deaths deaths
4.2.6 Selection of examinations for anrlysh
There are 92,060 exarninations including blood pressure and or body weight
measurements recorded and stored on file fiom recruitment to the RCAF during the early
l94Os, during WWII, and h m enûy to the study up to July 1, 1993. The examination
designated as the baseline examination for this analysis was the examination recorded
closest to July 1, 1918. Age in years was calculated at cach examination as the number of
days fiom birth to the examination date divided by 365.25. In instances where only
month and year were recorded on a report, the 15th day of the month was assumed for
calculations.
Including the baseline examination, but excluding al1 other examinations recorded
prior to July 1, 1948, a total of 76,509 examinations were identified for analysis during
the 45-year follow-up period to July 1, 1993. This is an average of 19.2 examinations per
study member. Only examinations prior to onset of IHD were retaineà for this analysis.
The examination closest to each five-year birth anniversary, between ages 25 and 75
years, was selected as the index examination for that age. Al1 selected examinations
could be within 2.5 years of only one of the five-year birth anniversaries. Thus, a
selected index examination could only be useû once for a five-year birth anniversary
examination in this anaîysis. A h the exclusion of exarninations recorâed following
onset of IHD, and exclusion of the examinations not closest to a five-year birth
anniversary, 26,643 examinations were selected for analysis, an average of 6.7
examinations per study member.
The number of selected examinations and reasons for missing examinations are
show in Table 4.3. The potential number of examinations at each five-year age between
25 and 75 yem was detemiined based on the age of each subject at entry in 1948 and
their age as it would be in 1993. Men younger than 25 years of age at entry, for example,
would not yet reach their 70' birthday by the end of the 45-year follow-up period, and
hence could not contribute an examination at age 70 or 75 years for this analysis. A
subject rnight not complete an examination and be at risk for IHD at a specific age if he:
1) died before that age, 2) was lost to follow-up before that age, 3) had developed IHD
and was still dive before that age, or 4) if he was temporarily lost to follow-up for a
period of time such that he was not examined within an interval of 2.5 years around the
age. The last column of Table 4.3 contains the nurnber of men with exarninations and at
risk of IHD at each five year age.
For example, the first row of Table 4.3 describes the subjects who could contribute
an examination at age 25 years. Of the 348 men who were younger than 25 years of age at
July 1, 1948, and hence eligible to contribute an examination at this age during the 45-year
follow-up, 322 had an examination recorded within 2.5 years, and 26 did not. The 26
subjects who did not have an eligible examination at age 25 years were not lost to follow-
up, and hence would conüibute to examinations at older ages.
Study members who were lost to follow-up accounted 103 rnissing examinations.
The largest number of missing examinations, 1,7 1 9, were not because of lost to follow-up,
but rather due to subject who had intavals of time Ween examinations exceeding five
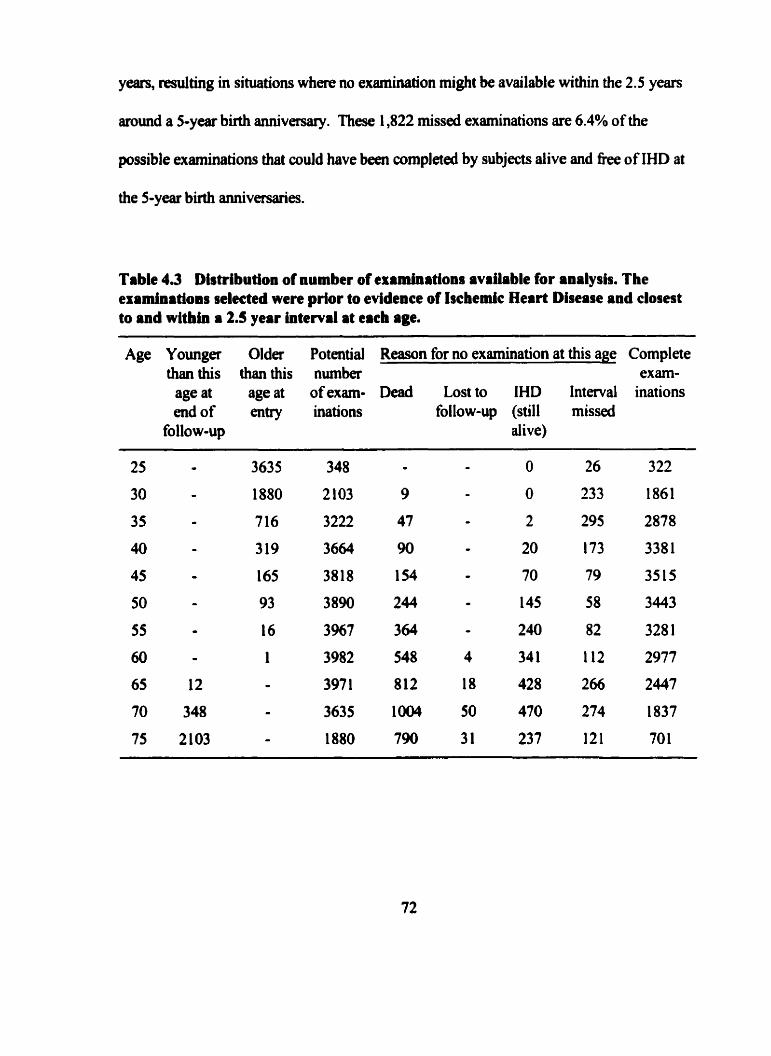
years, resuiting in situations where no examination might be available within the 2.5 years
mund a 5-year birth anniversary. These 1,822 missed examinations are 6.4% of the
possible examinations that could have been completed by subjects dive and f k e of IHD at
the 5-year birth anniv-es.
Table 4.3 Dbtribution of number of examinations avrilable for analysis. The examinations selecteà were prior to evidence of Iscbmic Heart Disease and closest to and within a 2.5 year interval at each age.
Age Younger Older Potential Reason for no examination at this age Complete than this than this number exarn-
age at age at of exarn- Dead Lost to IHD Interval inations end of entry inations follow-up (still missed
follow-up alive)
Risk factors for IHD and each manifestation were modeleci using the data from
the examinations at each five-year age. Al1 examinations selected had blood pressure
recorded, but not al1 examinations had body weight recorded. The number of incident
IHD events following these ages is presented in Table 4.4. The number of examinations
at each age for modeling endpoints, available with and without body mass index included
in a mode1 are presented separately in this Table. Examinations with body weight not
recorded were most prevalent in the later years of the study. At age 5 5 years, 93% of
examinations were complete with BMI. At ages younger than this the percentage of
examinations with BMI was greater. At age 60 examinations with BMI dropped to 88%,
to 79% at age 65,75% at age 70 years and 74% at age 75 years. The proportion of
subjects who developed IHD was similar at al1 ages for models with or without BMI
missing BMI values. Hence, it may be infmed that subjects who did not have BMI
recorded is independent of subsequent IHD status.
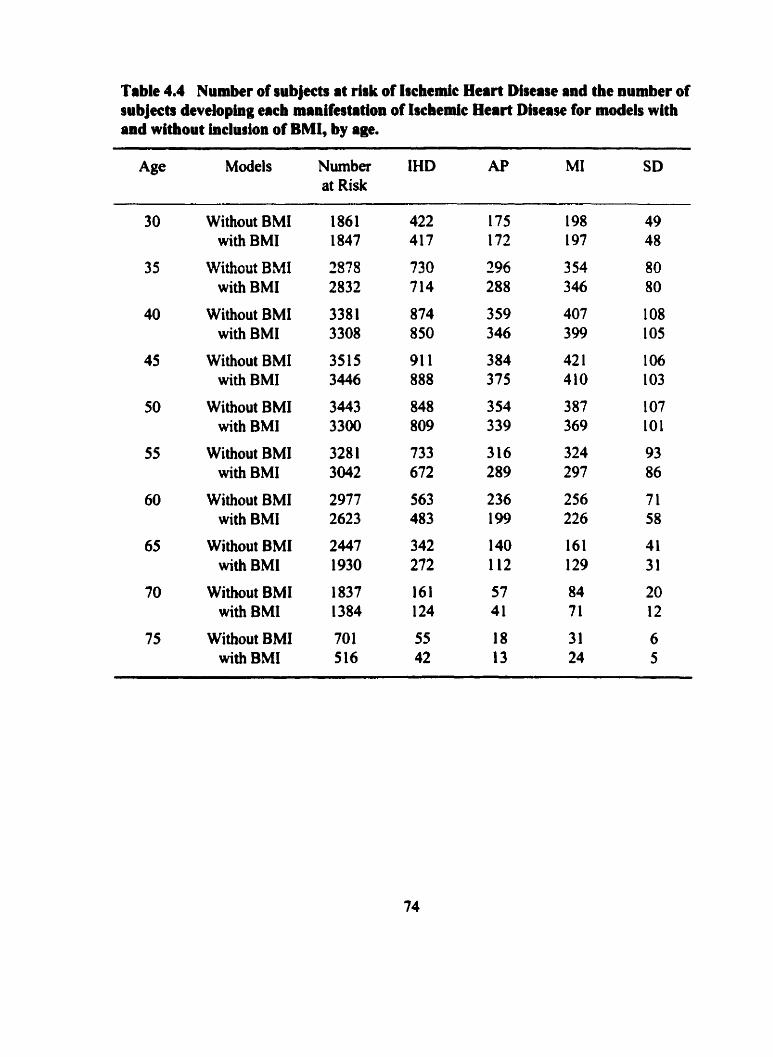
Table 4.4 Number of iubjects at risk of Iichedc Heart Diiease and the number of iubjects developing each manif~tatlon of Ischemic Heart Disease for models with and without inclusion of BMI, by age.
Age Models Number IHD AP MI SD at Risk
Without BMI with BMI
Without BMI with BMI
Without BMI with BMI
Without BMI with BMI
Without BMI with BMI
Without BMI with BMI
Without BMI with BMI
Wi thout BMI with BMI
Without BMI with BMI
Without BMI with BMI
5 STATISTICAL METHODS FOR LONGITUDINAL STUDIES OF CARDIOVASCULAR DISEASE
Longitudinal studies of CVD involve the collection of data from individuals over
time. Data collected in a prospective cohort study includes baseline information at entry
to the study, and data generally recordai at regular or irregular time intervals throughout
the follow-up period. Baseline information will generally include demographic data
including age at entry, gender, and contact residence. Determination and classification of
clinical events, both CVD and comorbid non-cardiovascular conditions as they occur,
time under snidy at each examination or clinical event, time last known to be alive are
recordeci concurrently throughout the study period.
Hence key considerations of any epidemiologic anal ysis of a follow-up study of
CVD will include: 1) definitions of CVD events, 2) risk factor definitions, 3) description
of CVD occurrence tirnes, 4) statistical methods for testing of hypotheses concerning the
association of nsk factors and CVD ( G ~ M 1977).
A definition of each CVD event, or endpoint for analysis, needs to be cleariy
stated prior to analysis. 0th cardiac and non cardiac wronary heart disease events will
be of interest. Endpoints defining CVD morbidity may be restncted to IHD defineâ by
myocardial infarction, angina pectoris and sudden death, or may also include other non-
ischemic coronary heart disease. Studies may accept reports from subjects as sufficient,
or require supporting evidence h m physicians or hospitals. The strength of the evidence
and source should be included in an analysis and a description of varying strengths of
evidence of C M is appropriate. Some follow-up studies of CVD include cardiac surgery
as an endpoint. Al1 cause mortality and deaths due to cardiovascular disease are
recorded. For al1 these events, it is critical to record the date and details of each episode.
5.2 Definition of rirk factors for cardiovasciilrr diserse
Risk factors for CVD are those characteristics of individuals thought to or
hypothesized to be related to an increased Iikelihood of CVD. Risk factors play a crucial
role in understanding the development of CVD, and risk factors for one endpoint of CVD
may not necessarily be associated, nor cany the same strength of association for another
manifestation of CVD. Risk factors in follow-up studies of CVD rnay involve
characteristics or factors that are detennined once and have a fixed value throughout the
follow-up study. Factors measured once and fixed in value for the duration of the snidy,
include gender, genetic characteristics, a preâisposing family history of CVD and
evidence of comorbid conditions at entry to the study. A h , this would include baseline
measutment of b l d pressure or body build or lipid profile that could be related to
subsequent development of CVD. Altematively, characteristics may be measured
repeatedly over time, and hence be "tirnedependent". Typical characteristics measured
over time in follow-up stuâies of CM) have included repeat measurernent blood pressure,
lipid detemiinations, body build, detection of coexisting disease conditions, smoking
habit, abnorrnalities recorded on routine electrocardiograms and activity.
5.3 Time of occurrence of cardiovascular disease
The occurrence of CVD is a dynarnic process documented over time during the
study. A basic concept for the description of time under study is the "person year of
observation" (Breslow 1984). One person year of observation will be accrued and
wntributed to an analysis for each year a study subject is dive and under observation.
Also, for each six months two subjects are observed, one person year of observation is
wntributed. The total person years of observation each subject contributes to an analysis
of CVD is the time (in years) fiom entry to the study (time zero) to the earliest of:
determination of a first CVD event, date of a subject's last contact or date of withdrawal
from the study subject, date of death, or date of termination of the study.
As new CVD events occur, the ratio of the number of new events in a specified
time period, or age category, to the number of subjects alive and under study is the
incidence of CVD. The incidence of CVD is thecefore the rate of development of new
events among those not previously diagnosed. Incidence density of CVD is calculated
per person year of observation during the intaval of follow-up.
The prevalence of CVD is defined at any point in time as the proportion of
subjects dive and known to have CVD divided by the number of subjects known alive
and under observation at that time. Consquently, the prevalence of CVD will change
with time and is influenced both by the incidence of events being documented and the
length of time subjects with known CVD survive.
Hence, the incidence measures rate of new CVD events experienced by the cohort
and the prevalence measures the burden or extent of CVD being experienced by the
cohort under study at a point in time. Rates of CVD can be compared between groups by
calculating incidence or prevalence rates for different subgroups of one cohort. A
problem with the direct cornparison of rates may &se because the groups may have very
different age structures, and hence differences in the rates may just be reflecting these age
differences. Techniques for "standardizing rates" are available so that the adjusted rate
reflects the C M experience to be expected if the groups being compared had the same
age structure (Rothman 1 986).
Variation in CVD rates ova a long follow-up period may be influenced by the
effects of aging, effects due to the period of time rates are detennined or eflects due to
characteristics of individuals bom at different points in time (Kupper et al. 1985, Holford
199 1, Holford 1 992, Wolinsky 1 993). Variation introduced to rates by the aging process
are tenned age effects. Variation due to experiences of individuals at points in time or
secular changes in rates are called period effects. Differences between groups of subjects
who w m bom at different points in time and hence have had different experiences as a
group are called whort effects. There is no way of estimating al1 thtee effects
simultaneously as specification of two effects determines the third. When two of the
three effects are considerrd in an analysis, the third would be redundant (Robertson et al.
1999). Incidence and prevalence of CVD can be described within strata defined by birih
cohorts and within age groups over calendar period of time.
In addition to desaibing the incidence and prevalence of CVD experienced by the
cohort, there is also interest in describing for a subject, the probability of development of
CVD over a defined period of time. Survival analysis encompasses mathematical
techniques used to describe the expdence over time of the cohort (Crowley and Breslow
1984, Prentice and Farewell 1986). For each study member, time fiom entry to the CVD
event or time to end of follow-up is known. This interval of time is called the "survival
time" and in the terminology of survival analysis of CVD is synonymous with "tirne to
CVD event". For each survival time there is also an indication of whether the time is to
an observed CVD event, or the time is to end of follow-up without a CVD event
O bserved.
Time to event data have two unique characteristics. Firstly, the distribution of
observai time to event tends to be skewed to the right and hence does not follow a
normal distribution. Secondly, some events may not occur until aAer the end of the
study, and hence times are not observed during the defined follow-up period. These
event times reflect the follow-up time for a subject who has not experienced CVD by the
end of the subject's time under shidy. Such event times are t m e d censoreà. Ail that
can be said about time to CM) for censored follow-up times is that the time to CVD is
unknown, but would be longer than the follow-up time observed thus far. Hence, the
arithmetic average of observation times for al1 subjects does not equal average time to
CVD in the presence of censoreci observations. However, median survival time is often
calculated and reported (Collett 1994).
There are three mathematical bc t i ons that define the survival characteristics of a
cohort: the probability density fùnction of survival time, the survival function and the
hazard fhction.
Define: T as the random variable representing survival time. T > O
t as the actual s u ~ v a l time of an individual, t > O
Denote the underlying non-negative probability density function of T by: qt).
The distribution function of T is denoted by: F(t)=P(T<t), where "P(T<t)" is read as "the
probability that the random variable T, survival time, is observed to be "t" units of time
or shorter". Thus, S(t)= 1 -F(t) is the probability of surviving at least as long as "t" units
of time. The hezard function, h(t), is the instantaneous probability of an CVD event at
time 'Y, conditional on surviving to that time. The cumulative hazarà function, H(t), is
the integral of h(t) over al1 swival times up to tirne t and represents the accumulated
instantaneous chances of a CVD event up to time "1".
These three fùnctions are related to one another, such that
h(t) = fit) / F(t) and S(t) = exp (-H(t)) and H(t) = ln (-S(t))
M Statistical considerations concernliig the association between risk factors and cardiovrsculrr disease
A m n a r y heart disease nsk factor is any measured variable or characteristic that
preâisposes an effect on the likelihood or risk of CM) (Greenberg and Kleinbaum 1985).
The scale of measutement of a risk factor might be binary (gendet), categorical with no
ordering to the categones (region of residence), categorical with an ordinal scale
(education; less than high school, high school, college) or continuous (age in years). The
outcome variable can be represented simply as a binary indicator of whether CVD
occurred during the follow-up interval, or as the time to detection of CVD, (or time of
follow-up for censored observations). Many statistical techniques are available for
analysis of the association between nsk factors and CVD depending on whether one or
several risk factors are examined; whether confounding variables are known and
measured and hence need to be controlled, whether risk factors are rneasured as binary,
categorical or continuous variables, and whether the CVD outcome is defined as
occurrence of an event or time to an event. Table 5.1 swnmarizes some statistical
approaches for the examination of the association between risk factor(s) and CVD
outcome in longitudinal studies.
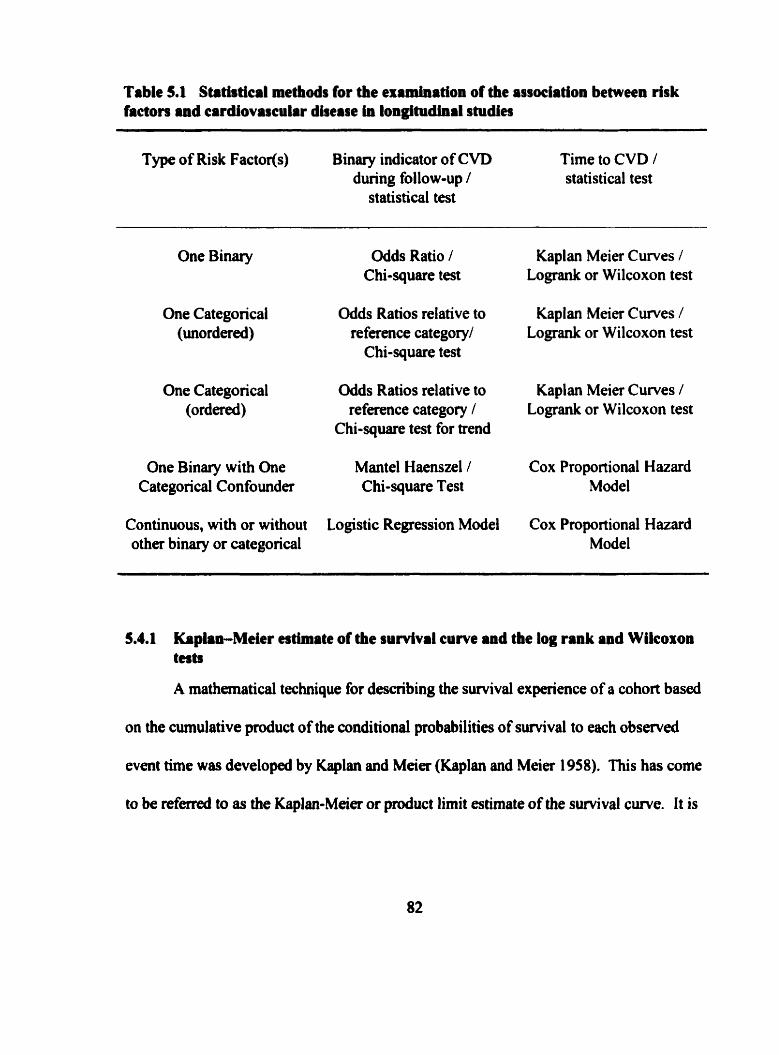
Table 5.1 Strtiatical methds for the examination of the association between risk factors and cardiovascular dherse in longitudinal studies
Type of Risk Factor(s) Binary indicator of CVD Time to CVD 1 during follow-up / statistical test
statistical test
One Binary Odds Ratio 1 Chi-square test
One Categorical Odds Ratios relative to (mrdered) reference categoqd
Chi-square test
One Categoncal Odds Ratios relative to (ordered) reference category 1
Chi-square test for trend
One Binary with One Mantel Haenszel / Categorical Confounder C hi-square Test
Continuous, with or without Logistic Regression Model other binary or categorical
Kaplan Meier Curves / Logrank or Wilcoxon test
Kaplan Meier Curves / Logrank or Wilcoxon test
Kaplan Meier Curves / Logrank or Wilcoxon test
Cox Proportional Hazard Model
Cox Proportional Hazard Model
5.4.1 Kaplan-Mekr estimate of the sunlvd curve and the log rank and WUcoxon tests
A mathematical technique for describing the survival experience of a cohon based
on the cumulative product of the conditional probabilities of survival to each observed
event time was developed by Kaplan and Meier (Kaplan and Meier 1958). This has corne
to be referred to as the KaplamMeier or product lirnit estimate of the sunival curve. It is
a usefbl method to describe the probability of developing CVD, or conversely, remaining
free of CVD, to a point in time during the follow-up interval.
If "k" distinct event times are observed during the follow-up intenal, denote by:
t( 1 ), t(2), t(3), the CVD event times, and
n( 1 ), Wh n(3), the number of subjects at risk of CVD just before an event
occurs, and
d( 1 ), 421, 4 3 ) , the number of events observed at each event time
then d(k)/n(k), the value of the hazard fùnction, is the probability of a CVD event at time
t(k) conditional on suniving to time t(k). The product of al1 the individual conditional
probabilities up to the lt" event time, the cumulative hazard function, is the probability of
surviving to time t(k). This s u ~ v a l function can be plotted against time and takes the
fonn of a %tep function", where its value remains constant between observed events and
then "steps down" to a lower cumulative survival probability as each event is observed.
To compare the sunival distributions of two or more groups of subjects based on
categories of risk factors one approach is to calculate the Kaplan - Meier estimate for
each category and compare the cuwes. The log-rank test is a chi-square test with 1
degree of fieedom used to test for significant differences in survival between the groups.
This test is most appropriate if the hazard functions for the groups are proportional, and
the survival curves for groups do not cross ove. Altematively, the Wilcoxon test for
diffimces in survival distributions can be used. The Wilwxon test is a weightd version
of the log rank test, and gives more weight to diffaences early on between the groups,
when the number of subjects in p u p s are the greatest and di fferences are less subject to
variation due to smaller number of subjects.
5.4.2 Odds ratios
A binary risk factor is ofien an indicator of the presence or absence of a
characteristic. Denote by p, the proportion of subjects with the characteristic who
developed CVD and denote by p, the proportion of subjects without the characteristic
who developed CVD by the end of follow-up. The odds of CVD in subjects with the
characteristic is p, 1 (1 -p,); and the odds of CVD in subjects without the characteristic is
pz 1 ( 1 - pz). The ratio of these two odds, @, ( 1 - p,)) / @, / (1 - p,)), is the odds that a
subject with the characteristic will have developed CVD relative to the odds that a subject
without the characteristic will have developed CVD during the follow-up period.
Confidence intervals can be calculated to provide an estimate of the degree of precision
of the odds ratio, and the statistical significance of the odds ratio can be assesseci with a
chi-square test (Mantel 1963).
When a characteristic is categorical, with k categories (k>2), the concept of the
odds ratio can be easily extended. The odds of CVD for those in category 'Y" is pi / (1 -
pJ. Thus the odds of CM) for those in category "i" relative to a referent category "O", is
(pi - (1 - pi))/@, 1 (1 - po)). The chi-square test with k-1 degrees of fieedom is used to test
for association of the variable with CVD. If the categorical variable is ordinal, the chi-
square test for trend can be used.
5.43 ManteCHaenszel chi-square test
Control for confounding is an important consideration in epidemiologic analysis.
When examining the association between a binary risk factor and CVD, a third
categoncal variable related to each of the other two may influence the estimate of the
odds ratio measunng the effect of the risk factor on CVD. One approach to account for
this potentiai confounding effect is to stratify on the third variable, and estimate thc odds
ratio within each stratum. If the oâds ratios are homogeneous across svata (Breslow and
Day 1980), the Mante1 Haenszel procedure (Mante1 and Haenszel 1959, Mantel 1963,
Mantel 1966, Kuritz et al. 1988) can be used to estimate a summary odds ratio combining
the estimates of the odds ratios ftom each strats and effectively eliminate the confounding
influence of the third variable on the relationship b e ~ e e n the risk factor and CVD.
5.5 The Ceaeral Linear Mode1
A mode1 is a simplified description of reality (Hassard 1991). A statistical model
is a mathematical function describing the link between an outcome and some
explanations for the outcome. The g e n d linear model is the basis for the simplest
modeling approach to data as it describes a linear relationship between the outcome
(dependent variable) and some predictor(s) (independent varisble(s)) thought to influence
the outcome.
The general linear model describing a straight line relationship between two
çontinuous variables is of the fom:

y = a + p x + c
where
x is the independent variable
y is the dependent variable
a is the intercept
p is the change in y for an incrernental unit change in x
E is the m o t terni representing the residual difference between the outcome
observed for an individual and the outcome estimated by the model.
This model c m be easily extended to the multivariate case where "k" variables c m be
modeled to predict an outcome as follows:
y = a + P,x, + P2x2 + ... + Pkxk + E
where y, the outcome variable, a, the intercept and E, the residual term are as above, and
xi is one of "kW independent variables
pi is the change in y for an incmnental unit change in xi i = 1 ,. . .,k
n i e assumptions for the general linear model to be valid are: 1) that "y" be a
continuous scaled variable, 2) with a nonnal distribution, 3) that the relationship of the
predictor variable "x" with "y" be reasonably linear, 4) that the residuals, E, be equally
distributed above and below the fitted line, and 5) that 'y" have a constant variance dong
the range of "f'. Statistical methods have been derived to determine the best estimates of
the parameters of this model ( H a s d 199 1).
5.6 Modebg Blauy Outcornes
While the g e n d linear model is well suited to exploring the relationship among
many CVD risk factors, for example prediction of blood pressure as a function of age or
body weight, it is il1 suited to the epiderniological analysis of survival data.
It may be of interest when analyzing longitudinal data to develop a model, similar
to the general linear modcl, that relates values of independent variable@) measured to a
subject's likelihood or chances of CVD. For the moment, disregard time to CVD, and
denote presence or absence of CVD in the follow-up interval as " 1" for those who
develop disease and "0" for those remaining free of CVD. This defines those who
"definitely develop C V D with probability "1" and those who "definitely do not develop
CVD" as probability "û". With these values for presence or absence of CVD, the
probability of developing CVD could be modeled as a linear function of predictor
variables (Collett 1994).
5.6.1 Linear Probabillty Mode1
If the general linear model is used with "probability of CVD in follow-up period"
modeled as the outcome variable, then
Pr(CVD=l) =y = a + pixi + P2x, + ... + Pkx, + E
is called the linear probability moâel.
While this model could be fit to the data, with O or 1 as the only values of the
outcome variable, there are serious violations of the assumptions required to use the
generai linear model and mneous interpretations would result. It would be possible in
some instances that values predicted h m the model would lie outside the acceptable
range, i.e. for some combinations of risk factors the probability of CVD could be
predicted to be less than zero or greater than one. Further, the outcome variable is not
continuously scded, and does not have a normal distribution, but rather, it has a binomial
distribution (Khan and Sempos 1 989).
5.6.2 Logistic Regregsion Mode1
The logistic regression mode1 has becorne a standard model for the analysis of
binary outcome data in epidemiological studies (Walker and Duncan 1967, Greenland
1979, Green 1988, Hosmer and Lemeshow 1989). The multivariate analysis of CHD data
from the Framingharn Study was first modeled with the logistic regression model in 1967
(Truett et al. 1 967). Prediction models for the occurrence of CHD were developed using
this model in the analysis of the Frarningham data (Gordon 1974, Gordon and Kannei
1982). The motivation for logistic regression coma from the appeal of the linear
probability mode1 and recognition that while there are violations of assumptions, in mid
ranges of probabilities for CM>, a linear fit seemed teasonable, but that the lower and
upper tails of the disûibution, i.e. at particularly low or high levels of risk of CVD, were
not fit well to a linear model. So, rather than a linearly increasing model for probability
of disease, with increasing value of nsk factors, a sigmoidal curve was poshilated that
would flatten out both at the lower end and the upper end, i.e. at lower and higher levels
of risk factors. This was consistent with the notion that an incrernental increase in risk
factor levels in the mid range would have a proportionately larger effect on risk of CVD,
than the same magnitude of change might have at either tail.
The logistic regression model describing the relationship between "p", the
probability of CVD in the follow-up interval, and a set of "kW predictor variables is given
by :
p = P(CVD) = 1 l (1 + exp(-(a + P,x, + P2x2 + ... + Pkx,J))
which is algebraically equivalent to :
ln (p/(l-p)) = a + P,x, + P2x2 + --• + Bkxk
where p/(l -p) is the odds of CVD, and ln(pl(l op)) is the natural logarithm of the odds.
Thmefore, the logistic regression mode1 equates the log of the odds of CVD as a linear
fûnction of a sum of weighted predictor variables. The weights for this model, b, , are
estimates of the parameters, Pi , and are called the logistic regression model coefficients.
The probability of CVD ranges from O to 1. Hence, the odds of CVD ranges from
O to infinity, and the ln(odds of CVD) fiom minus infinity to plus infinity. Risk factors
with a positive association to CVD have positive coefficients, while those inversely
related to CVD have negative coefficients. The weighted sum of the linear function of
predictor variables in the model is called the prognostic score and can range from
negative values through zem to positive values. The larger the prognostic score, the
greater the probability of CVD (Chambless et el. 1990).
The logistic regression model equates the natural logarithm of the odds of CVD to
the prognostic score, S, (Hosmer and Lemeshow 1989). Hence the relationship of these
concepts:
the natural logarithm of the odds of CVD = S
the odds of CVD = exp(S)
the probability of CVD = 1 I (1 + exp(-S))
Denote the prognostic score for one subject with a set of charactenstics in a
Logistic regression model by S 1 and for a second subject with a different set of
characteristics by S2. Thus, the odds of CVD for subject 1 is exp(S 1) and for subject 2 is
exp(S2). The relative odds of CVD, or odds ratio, for subject 1 relative to subject 2 is
exp(S 1 ) / exp(S2) = exp(S 142). If subject 1 and subject 2 di* in only one
characteristic included in the model, Say variable x, a binary indicator coded as " 1" for its
presence in subject 1 and "0" for absence in subject 2; then the prognostic scores of the
two subjects will d i f k only by a the value, "b,", and the relative odds of CVD for subject
1 relative to subject 2 will be exm). Thus, each coefficient in the multiple logistic
regression model represents the contribution of each variable to the prognostic score. The
exponential of the coefficient represents the relative odds of CVD in two subjects who
differ only by one unit in that characteristic, al1 other variables being equal. The
exponential of the regression coefficient h m a model with one binary independent
variable is therefore analogous to the univariate odds ratio calculated h m the *Wo-by-
two" layout describeci earlier and tested with a chi-square statistic. The exponential of a
coefficient from a binary variable in a model including other variable@) as well, is
interpreted as an "adjusted odds ratio", analogous to the adjustment of the Mantel-
Haenszel procedure for combining information fiom a series of b'two-by-two" tables.
nie logistic regression model has been applied in CVD research (McGee et al.
1984, Abbott and Carroll 1984, Abbbott 1985, Harrell and Lee 1985, Hosmer and
Lemeshow 1989) and remains the model of choice to relate "baseline" charactenstics to
CVD in a defined follow-up interval of fixed duration (Wu 1979). The model has been
extended to incorporate inclusion of updated covariate values as information was
obtained fiom subjects over time (Wu and Ware 1980, D' Agostino et al. 1990).
5.7 Modeiing t h e to event
5.7.1 The Poiason Regremion Mode1
Time to event data may be surnmarized and reported at an aggregate level,
perhaps within strata defined by age categories. For the subjects within each strata, the
total numba of CVD events observed over the follow-up pet id represent a numenitor
and the total person years of observation for d l subjects in the strata represent a
denominator. The ratio of these two numbers is an estimate of the CVD rate incurred by
subjects in the strata. If CM) events are asswned to occur independently, that is the
occurrence, or not, of CVD by one subject in a strata in no way influences the occurrence
of CVD by another subject, and the nurnber of CVD events recorded typically is mall,
91
relative to the total number of person years recorded, the assumption of a Poisson
probability model is reasonable (Woodward 1999).
A Poisson regression model may be specified where age categories are
represented by binary indicators. AAer estimation of the parameters and their standard
emrs, the statistical significance of these indicators would provide evidence for varying
rates of CVD by age. It should be noted that the data need not necessarily be specified at
an aggregate level. If follow-up time and a binary indifator for the CVD event at the end
of follow-up is known for each subject, a Poisson regression model can also be fit.
Hence, the Poisson regression model can accommodate continuous or categorical
independent variables measured at the individual level as well.
5.7.2 The Cos Proportional Huard Model
While logistic regression has been widely used to model CVD occurrence in a
follow-up interval, for epidemiological analysis of longitudinal data, this mode1 has
limitations for dealing with varying follow-up time from subject to subject and censoring
of observations (Kaibfleisch and Prentice 1980, Allison 1985). In 1972, Sir David Cox
introduced the proportionai hazards (PH) model to provide a link between the hazard
hction , h(t), or suMval function, S(t), and a set of covariates of individuah (Cox 1972,
Cox 1975).
The PH model relates the hazard hction at time 'T' to a set of "k" covariates
measured in individuais as follows:
h(t) = h,,(t) * exp(p,x, + P,x, + ... +
where h(t) is the hazard fùnction at time t
h,,(t) is the baseline hazard bct ion for a subject with zero values
for al1 covariates
Pi, P2. . . . , PL are the "k" regression coefficients
x,. x, ,..., x, are the values of the "Y' covariates
Hence, h(t) / b(t) = exp(P,x, + Bx, + ... + Pkx,J and
in( ho) 1 Mt) ) = Pi x, + P2x2 + + PLXI
Thus, the PH model equates the naturai logarithrn of the ratio of the hazard
function at time t and the baseline hazard function to the weighted sum of predictor
variables. As before, the weights are regression coefficients obtained by maximum
likelihood estimation from the observed data and are calied Cox PH model regression
coefficients.
This weighted sum is again a prognostic score and differences in prognostic
scores that arise fiom different covariate values for subjects can be interpreted in a similar
fashion to those for logistic regression, however, not as relative odds, but as relative
hazard, or relative risk of CVD (Prentice et al. 1982). In the logistic regression model,
the natural logarithm of the odds of development of CVD is a linear function of covariate
values, and the exponential transformation of the coefficients for a variable in this model
rdects the relative odds of CVD, for a unit change in the independent variable. In the
Cox PH model, the exponential transformation of a coefficient reflects the effect of a unit
change in the independent variable on the relative rate or relative hazard of development
of CVD over the follow-up interval (Cox 1972, Cox 1 975, Breslow 1975, Kay 1 977,
Andersen 199 1, Prentice and Kalbfleisch 1979). An essential difference in the two
models is that in the PH model there is consideration for time to events, adjustment for
varying follow-up petiods and compensation for censoring of observations (Kaibfleisch
and Prentice 1980, Allison 1985). An important assumption concerning censoring is that
the censoring mechanism be independent of CM>. The assumption implies that the
reason for a subject being lost to follow-up was not related to the individual's likelihood
of developing CVD (Collett 1994).
A key assumption of the Cox PH model is that the ratio of hazards be constant, or
proportional, value at al1 points in time. A binary covariate, for exarnple presence or
absence of hypertension, might relate to two fold increased risk of CVD for a
hypertensive subject relative to non-hypeitensive throughout the follow-up period.
Although the hazard, i.e. instantaneous nsk, of CVD may be changing with time, this two
fold increased nsk (for hypertensive relative to non-hypertensive subjects) is assumed to
remain throughout the follow-up interval. This assumption can be verified by graphical
methods or by examining covariates as functions of time under sîudy in the PH model
(Kalbfleisch and Prentice 1980, Collm 1994).
Variations of the PH model have been proposed to compensate for violations of
the proportion hazard assumption. If subsets of a population have different undertying
risks of CVD, perhaps due to regional variation in rates of C M , a stratifieâ PH model
cm be fit where a different hazard fiuiction in each region is specified in the likelihood
function but a common effect within each region for each variable is estimated for a
covariate (Kalbfleisch and Prentice 1980, Collett 1994).
The effects of time dependent covariates can be modeled with the Cox PH model.
Time dependent covariates are variables that represent changing values of covariates
measured at repeat observation of subjects over time (Chang et al. 1990, Andersen 1992),
or they can be binary variables that can change in value over time to reflect presence or
absence of characteristics detected over time. The PH model has become the most widely
used model in analysis of longitudinal studies of CVD due to its ability to accommodate
fixed time and time dependent variables and the appeal of not having to specify an
underlying hazard function.
5.7.3 Parametric Suwival Models
One appealing feature of the Cox PH model, other than the ability to relate
covariates to the relative risk of CVD, is that the underlying hazard function rernains
completely unspecified. The PH model can be used for analysis of survival data fiom
cohort studies with any underlying risk of CM) as long as the proportionality assumption
for covariate effects is reasonable. Because the hazard function is unspecified, but the
relationship between the hazard fùnction and covariates is specified, the PH model is
ofien referred to as a semi-parametric model (Collett 1994). If the distribution of suMval
times does follow a mgnizable fomi, such that the probability density fwction and

hence hazard function is known, then a parametric mode1 can be used. The estimates of
coefficients for the covariates will have smaller standard m r s and inferences conceming
them will be more precise. The simplest example of a parametric model for survival is
one where the hazard function is constant over the . This characterizes the exponential
distribution where a constant hazard implies CVD events are occwing at the same rate
along a tirne axis as the cohort ages. Over short intervals of tirne, for a cohort with a
narrow age range this may be justifiable, but in general this does not seem to fit well with
the natural course of CVD. Perhaps a more realistic assumption is that the hazard
function is increasing with time and that as the cohon aga, the instantaneous risk, or
underlying rate of CVD is increasing. This fom of hazard function is characteristic of
the Weibull distribution and has been used with the Framingham data (Andersen 1 99 1.
Ode11 et al. 1994).
5.8 Other analytk consideratioas for modeling cardiovascular disease
General methodological advances for statistical modeling of epidemiologic data
have been recently reviewed (Gai1 199 1, Cox 1993, Hendefson 1995). The role of the
logstic regression made1 and the Cox PH model are central to this discussion and both
models add to the understanding of risk factor and outcome relationships in well desiped
longitudinal studies of C M .
The lodstic tepession model and the Cox PH model have proven to be very
usehl for modeling data h m longitudinal epidemiologic studies of CM). Unds certain
conditions the two models produce very similar results. If the effect of interest, i.e. the
odds ratio or hazard ratio, is small; if the follow-up period is relatively short so that the
nsk of CVD changes very little over time and the rate of withdrawal of subjects is low;
and the absolute risk of disease in the cohort during the period of follow-up is low, Say
less than ten percent, then the two models will provide similar results (Green and Symons
1983, Abbon 1985, Peduzzi et al. 1987).
How well a general linear model "fits" the data is measured by the proportion of
variation in the dependent variable that is "explained" by the predictor variables (Hassard
199 1). With either the logistic regression model or the PH model, the dependent variable
is a function of the development or not of CVD, and as such the concept of explained
proportion of variability does not apply. Several alternatives for a bbgoodness of fit"
rneasure have been suggested (Lemeshow and Hosmer 1982, Hosmer et al. 199 1, Cox
and Wemuth 1992, Mittlbock and Schemper 1996, Schernper and Stare 1996). The
Hosmer-Lemeshow statistic (Hosmer and Lemeshow 1989) for the logistic regression
model is widely used. Based on the chi-square statistic is a rneasure of the agreement
between the number of CVD events observed to the number expected within deciles of
risk determined fiorn the prognostic scores of each subject. Various "explained
variability" measures for the Cox PH mode1 have been recently described (Schernper and
Stare 1996). These measures are generally related to the value of the likelihood function
in a mode1 with covariates to its value when the nul1 model (with no covariates) is fit.
Some authors allow compensation for the number of parameters estimated.
The time scale used with the PH mode1 is generally referenced to the time of entry
to the study. Thus, the time axis relates to tirne under study and control for age
differences in subjects is obtained by rnodeling age as one of the cuvariates.
Alternatively age can be used as the time-de, so that subjects at different ages at entry
are realigned and are modeled with parameter estimation detemined among subjects at
the same age and not just at the sarne time under snidy (Kom et al. 1997). With this
approach, calendar period and cohort effects can be controlled through stratification.
The power to detect significant effects using logistic regression models has been
recently described (Hsieh 1989). Power is related to both the number of CVD events and
the numba of subjects at risk. If the independent variable is binary, power calculations
are equivalent to those for the cornparison or two proportions. For a continuous variable
and a differnice of one standard deviation unit, in cohort of 4 , O people with an
underlying risk of 25% for CVû during the follow-up period, there would be an 80%
chance of detbcting an odds ratio pa te r than 1.10 at the 5% (one sidad) level of
signi ficance.
5.9 Stitbtical Methds for Specific Objectiva
5.9.1 Metbodology for Objective 1 - Incidence of Iichemlc Aeart Diseise
Incidence of IHD and its manifestations were calculated as number of first events
per 1,000 person years of observation. Person years of observation free of IHD were
calculated as the time under study h m enhy to the earliest of: date of detection of IHD,
98
date of last contact, date of death or June 30, 1993. Person years of obsewation and
number of events were tabulated for 5-year age intervals. The incidence of IHD was
calculated within these 5-year age intervals and tested for a trend with age using Poisson
regression (Koch et al. 1986). Age-specific incidence was also calculated in this manner
for AP, MI and SD. Only the first manifestation of IHD was considered. That is, aber
diagnosis of AP, for example, a first MI was not counteâ in the calculation of incidence
of MI.
5.9.2 Methodology for Objective 2 - Patterns of risk factors by age and tirne
5.9.2.1 Detennination of ige-speclfk percentikr of risk factors
Including the baseline examination, al1 76,509 examinations recorded during the
45-year follow-up period to July 1, 1993 were identified. nie integer value of age ai each
examination was calculated. Only examinations prior to onset of IHD were retained. The
age specific percentile distributions of SBP, DBP and BMI at al1 ages were daermined.
The '9"'' percentile of a distribution was defined as the cut point of the cumulative
distribution of the variable such that at most "p" percent of al1 measurements recorded at
that age were less than or equal to the cut point. Digit preference for recording blood
pressure has been discussed as a potential problem in selection of cut points for
detemination of risk of disease in aome studies (Wen a al. 1993), but this is not an issue
for defining percentiles fiom the BP distributions based on the above definition. The
perçentile points for each age-specific distribution of SBP, DBP and BMI were used to
determine the pemmtile of SBP, DBP and BMI for each measurernent in each subject's
file.
53.2.2 DbMbution of rbk facton i t 5-yeir birth anniversaries
For the analysis of patterns of SBP, DBP and BMI with age, the index
examinations selected at the examinations closest to each 5-year birth anniversary
between ages 25 and 75 years were used. Selection of these 26,643 examination was
described in Section 4.3.6. Furthet, the time period of examination was classified by date
of examination into 5-year intervals fiom July 1, 1948 through to June 30, 1993. The
mean and standard deviation of SBP, DBP and BMI were calculated at each 5-year age
from 25 to 75 years. Mean SBP, DBP and BMI were ploned for subjects of the same age
group across calendar period of examination to discern variation in patterns over time.
The proportion of subjects exarnined at these ages with a history of diabetes
mellitus was calculated. The proportion of subjects at these ages in different smoking
categories was calculated to estimate smoking prevalence.
59.3 Methoddogy for Objective 3 - Tracking of continuour rirk factors
Two measures of tracking were analyscd for the serial measurements of SBP,
DBP and BMI: the Pearson correlation coefficient and the relative likelihood of tracking.
First, the Famon correlation coefficient was calculated to measwe the strength of
the linear association between the measurrments of each risk factor at ditrerent aga.
Correlation coefficients were calculateû for measurements of SBP, DBP and BMI at pairs
of ages selected at the 5-year examinations between 25 and 75 years. The statistical
significance of the comelation coefficient was assessed using the Student's t-test.
Second, quintiles of the distributions of SBP, DBP and BMI at the 5-year age
examinations were cross tabulated throughout the follow-up pend. The proportion of
subjects moving to the top or from the bottom quintiles of the distributions at pairs of
ages were used to quantifi the degree of tracking at the exhemes of the distributions.
This eMdence for tracking in the top SBP quintile between rneasurements at two diffèrent
ages was defined as the proporiion of subjects in the top quintile at the younger age who
remained in the top quintile at the older age divided by the proportion of al1 subjects with
examinations at both ages who were in the top quintile at the older age. T h i s ratio, when
greater than unity, measures the excess of individuals in the top quintile beyond what
would be expected by chance if an individual's SBP level was a random phenornenon and
no relationship existed between initial and subsequent SBP measurements. This ratio is a
masure of tracking, and will be subsequently referred to as relative likel ihood of
tracking. The relative likelihood of tracking in both the top and bottom quintile for SBP,
DBP and BMI was calculated for pairs of measurements at 5-year ages from 25 to 75
years. The statistical significance of the relative likelihood of tracking was assessed
using a chi square statistic with 1 degree of freedom.
53.4 Methodokey for Objective 4 - Modehg rhk factora for Ischemic Heart Dbease
The relationship between risk factors and IHD was examined fiom a number of
perspectives. Incidence of IHD were plotted within risk factor categories at each 5-year
age beîween 30 and 75 years. Risk factors at each 5-year age between 30 and 75 years
were modeled using the Cox proportional hazard model. The proportionality assumption
of the model was tested to detemine whether the effect of a nsk factor changed with time
after measurement. Further, the varying effect of a nsk factor at repeat measurement with
age was examined using a time dependmt covariate in the Cox model. Multivariate
models were detmined using a stepwise variable selection, to assas the importance of
nsk factors at different ages for IHD and each of its manifestations.
5.9.4.1 Trends in incidence of Ischedc Heart Disease within categories of risk factors
Person years of observation were detmined fiom each 5-year age between 30
and 75 years to the earliest of date of IHD, end of follow-up or June 30,1993. The
incidence of IHD per 1,000 person years was calculated within each quintile of the SBP,
DBP and BMI distributions, for diabetics and non-diabetics, and within smoking
categories fiom the selected examinations between 30 and 75 years in order to explore the
impact of aging on the relationship between these risk factors and IHD. For SBP, DBP
and BMI, the incidence ratio was dehed as the incidence of IHD for those in the top
quintile of the distribution divided by the incidence of IHD for those in the bonom
quintile. For smoking or diabetes the incidence ratio is the incidence if MD among
smokers (or diabetics) divided by the incidence of IHD among non-smokers (or non-
diabetics). The incidence difference was defined as the difference in incidence of IHD
beh~een subjects in the appropriate two categories. At each age, the IR, the ID, and
trends of IHD incidence across categories of each risk factor described the effect aging
may have on the relationship of the risk factor with IHD.
Patterns of incidence of IHD, ID and IR were describeâ tor each risk tàctor. For
the five risk factors, ID and IR described changing magnitude of effect with age. Patterns
in incidence of IHD were descnbed across the five quintile categories of SBP, DBP and
BMI as increasing or decreasing without any formal statistical test for trend. The purpose
of the calculation of incidence of IHD within these categones was to illustrate the
patterns of incidence by age and nsk factor category. Statistical testing for the
significance of these risk factors for incidence of IHD both at specific 5-year ages and
whether their effects were changing with age were assessed using the Cox proportional
hazard model.
5.9.4.2 Age specific Cor proportional hrzrrd models
Cox proportional hazard models for the development of IHD in the subsequent
follow-up period were fit using observations at each Eyear examination age. An
observed time to MD was considered censoreci if the subject was still alive and free of
IHD at June 30, 1993 or if the subject was lost to follow-up or died pnor to the detection
of IHD. The Cox model accounts for cetlsoring and the unequal duration of follow-up
that subjects will have due to age differences between subjects at entry to this study.
At each 5-year examination, the effect of each nsk factor was estimated by
including either SBP, DBP, BMI, a binary indicator for diabetes with non-diabetic as the
reference categoty, or three binary indicator variables for smoking status: cument smoker,
former smoker and unknown smoking status with never smokers as the reference
category. Secular trends in the incidence of IHD over the 45-year observation period
were controlled by inclusion of year of examination in every model. The relative nsk of
IHD, with a 95 percent confidence interval, was calculated at each age for each risk
factor. Relative risk was calculated for an increase of 1 O millimeters of mercury (mm
Hg) in SBP, a 10 mm Hg increase in DBP, a 5 kglm2 increase in BMI, for diabetics
versus non diabetics and for smokers and former smokers versus never smokers.
5.9.4.3 Teating the proportionallty rssumption of the Cor proportional buard model
Each variable included in a Cox mode1 is assumed to have a constant effect on the
hazard function, independent of time under study. That is, the relative hazard for subjects
with different covariate values is assumed to remain constant at al1 time points during
follow-up. This proportionality assumption was tested for each risk factor by
detemining the signi ficance of the product term(s) in a model the representing interaction
between each risk factor and the tirne under study. A significant interaction tem would
be indicative of a changing effect of the nsk factor with time under study. The
proportionality assurnption was tested for each of the five risk factors from each 5-year
examination.
5.9.4.4 Teshg the varying cffect of rhk factors with age
The Cox proportional hazard model with time dependent covariates was used to
examine the effect of aging on each risk factor. Al1 5-year interval examinations for each
subject over the 45-year follow-up period were used to fit two models. For each risk
factor, one model of main effects only, included year of examination, age at examination
and the changing value of the risk factor from entry to the end of follow-up. The second
model of main effects and the interaction t m ( s ) of age with a risk factor, included year
of examination, age at examination, the changing value of the risk factor, plus an
interaction terni, a variable qua1 to the product of age and the risk factor. This product
term represents the interaction describing the varying effect of a risk factor with age over
time. The significance of this interaction term was tested using the likelihood ratio chi-
square test based on the difference of the value of the likelihood function of these two
models. A statistically significant age and risk factor interaction terni was considered
evidence of a changing effect of the risk factor on IHD when measured repeatedl y with
age. Five pairs of models were systematically examined with interaction ternis for age
and SBP, age and DBP, age and BMI, age and smoking status and age and DM added to
each model of main effects. This analysis was repeated for the AP, MI and SD endpoints.
Reported p-values for variables in these models are based on two sided hypothesis tests.
Sa9Aa5 Muldvariate Cor proporaoirl L u r d modehg of Ilrchemic Hart Diserse
The joint independent effect of risk factors at each age h m 30 to 75 years were
assessed by fitting multivariate models using a forward stepwise procedure. The best
fitting forward stepwise multivariate Cox proportional hazard models for IHD, AP, MI
and SD were detennined. Estimates of the relative risk of 1HD with 95% confidence
intervals were cdculated for significant parameters. Year of examination was included in
al1 models.
5.9.5 Meihodology for Objective S - Contribution of tracking to models of Iscbemic Heart Diserse
59.5.1 Cbaracterisation of individual rhk factor patterns over time
For each subject, characteristics of the relationships of SBP, DBP and BMI with
age, up to ages 50,60 and 70 years were considered as possible additional risk factors for
IHD. Al1 measurements, not just the measurements selected at 5-year age intervals, for
each subject h m entry to age 50,60 and 70 years, were used to characterize individual
patterns for each continuous tisk factor. The age-specific percentiles of SBP, DBP and
BMI; denoted by SBP%ile, DBP%ile and BMI%iile respectively were used to account for
the changing distributions of these variables with age. As describecl by Lauer (Lauer and
Clarke 1988), parameters of the ordinary least squares regression of SBP%ile, DBP%ile
and BMI%iIe on age were used to describe the pattern of these measurements. This
method is displayed in Figure 5.1.
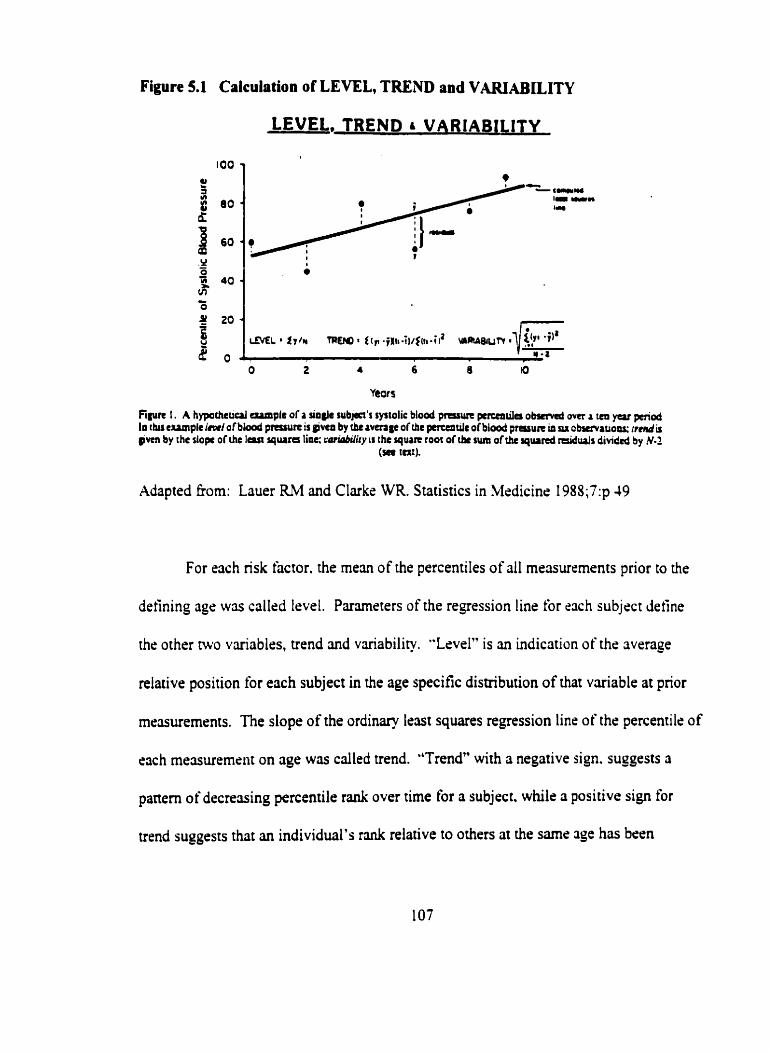
Figure 5.1 Calculation of LEVEL, TREND and VIUUABILITY
LEVEL, TREND VARIABlLlTY
Mapted kom: Lauer RM and Clarke WR. Statistics in Medicine 198S;i':p 49
For each nsk factor. the mean of the percentiles of al1 measurements prior to the
defining agr was callsd level. Parmeters of the regression line for cnch subject define
the other two variables, trend and vuiability. "Lcvel" is an indication of the average
relative position for each subject in the age specific distribution of that variable at prior
measurernents. The siope of the ordinary leut squares regression line of the percentile of
eîch mesurement on age wûs called trend. "Trend" with a negative sign. suggests a
paneni of decreving percentile rank over time for a subject. while a positive sign for
trend suggests that an individual's rank relative to others at the same 3ge bas been
increasing with age. Trends close to zero suggest that a comrnon percentile rank for the
variable had been maintained over time, and did not change with age. A trend close to
zero, thmefore, is indicative of tracking. The root mean square error of the deviations
about a regression line was called variability. High "variability" in the trend, reflected as
a large root mean square error, is indicative of lability or changing, increases and
decreases in BP or BMI. Low variability, indicates greater precision in the estimate of
the slope of the line relating percentile with age.
5.9.5.2 Level, trend and variability of risk factors over time and tschemic heart Diserse
The combination of b e l , trend and variability may characterize subjects with
different patterns of changing risk factors. Varying degrees of tracking may be
characterized these combinations. The percentile distributions of the three measures,
level, trend and variability, were detertnined for each variable and age combination.
Deciles, tertiles and the median of these distributions were calculated.
Cox proportional hazard models for each of the four endpoints, IHD, AP, MI and
SD, fiom age 50,60 and 70 years of age were fit. Each 'base" mode1 included year of
examination, SBP%ile or DBP%ile, BMI%ile, diabetes and smoking. The significance of
tracking was tested by adding the continuous value of "level" and categories for "trend"
and "variability" for each of SBP, DBP, and BMI to the base models. The likelihood
ratio chi-square test was used to detemine the significance of the contribution of tracking
variables to these models.
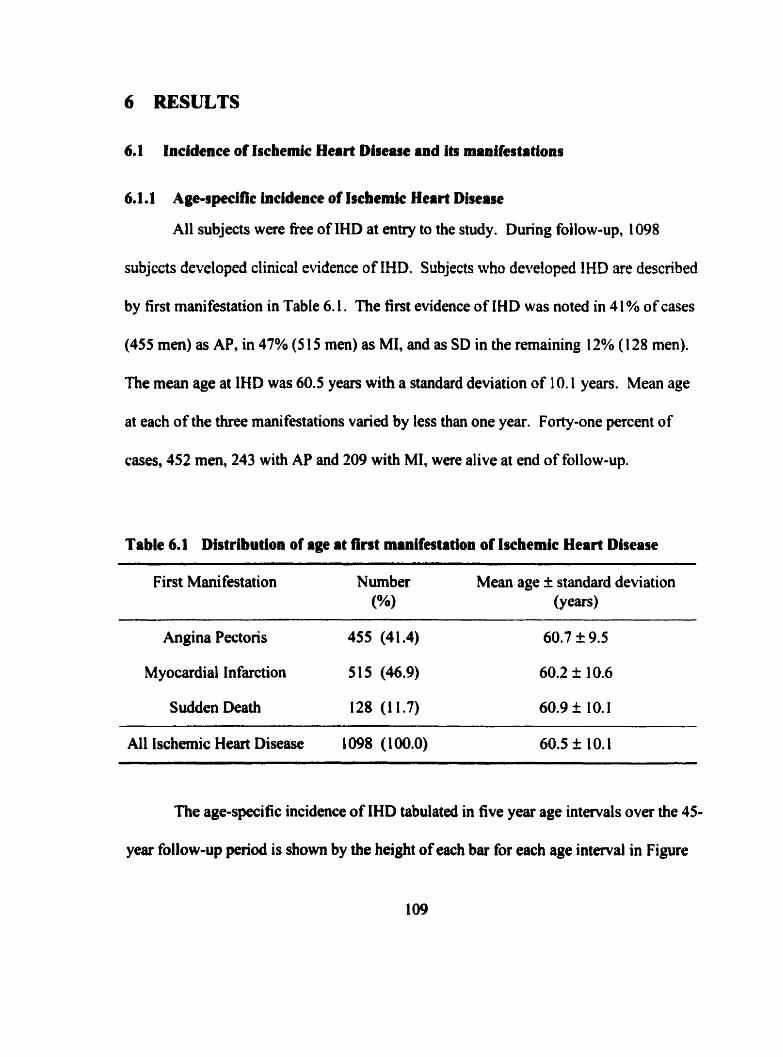
6 RESULTS
6.1 Incidence of Ischemic Heart Disease and i ts manifes ta tions
6.1.1 Age-specific incidence of Ischeinlc Heart Disease
Al1 subjects were free of IHD at entry to the study. During follow-up, 1098
subjccts developed clinical evidence of IHD. Subjects who developed IHD are described
by first manifestation in Table 6.1. The f int evidence of IHD was noted in 4 1% of cases
(455 men) as AP, in 47% ( 5 15 men) as MI, and as SD in the remaining 12% ( 1 28 men).
The mean age at IHD was 60.5 years with a standard deviation of 1 0.1 years. Mean age
at each of the three manifestations varied by less than one year. Forty-one percent of
cases, 452 men, 243 with AP and 209 with MI, were alive at end of follow-up.
Table 6.1 Distribution of age at lrst rnrnlf~tation of Ischemic Heart Disease
First Manifestation Number Mean age f standard deviation (%) (Y cars)
Angina Pectoris 455 (41.4)
Myocardial Infarction 515 (46.9)
Sudden Death 128 (1 1.7)
Al1 Ischernic Hem Disease 1098 (100.0) 60.5 $r 1 O. 1
The age-specific incidence of IHD tabulated in five year age intervals over the 45-
year follow-up period is shown by the height of each bar for each age interval in Figure
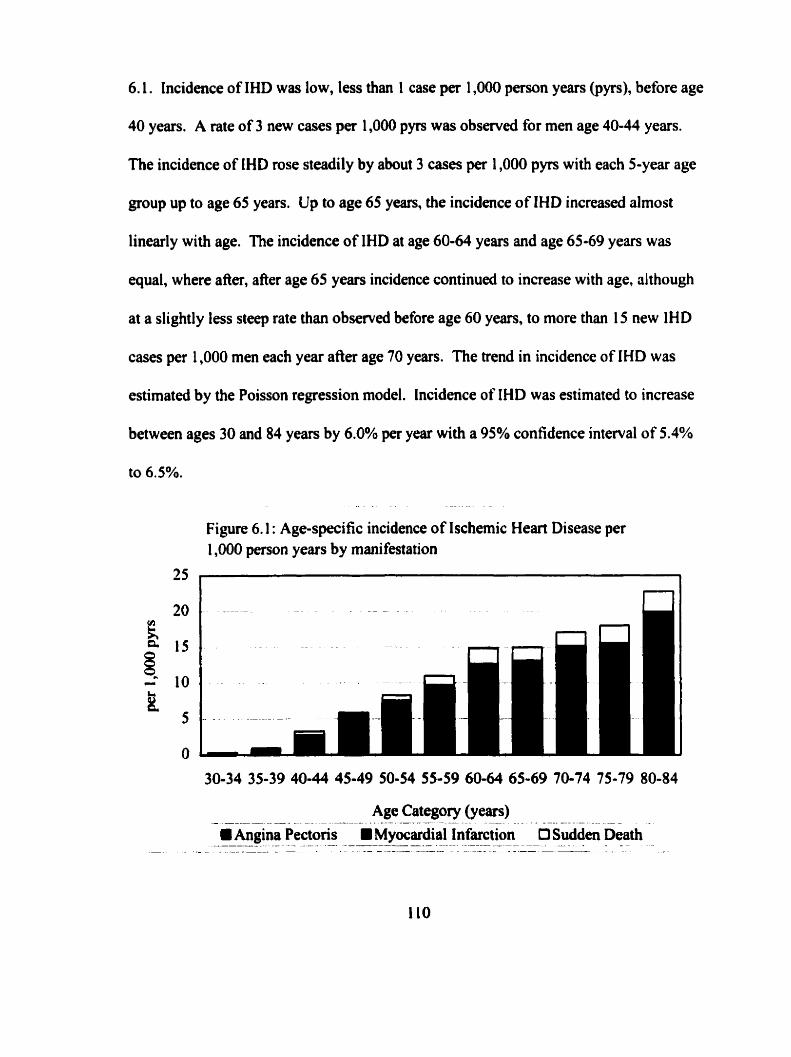
6.1. Incidence of IHD was low, less than 1 case per 1,000 person years (pyrs), before age
40 years. A rate of 3 new cases per 1,000 pyrs was obsewed for men age 40-44 years.
nie incidence of IHD rose steadily by about 3 cases pet 1,000 pyrs with each 5-year age
group up to age 65 years. Up to age 65 years, the incidence of IHD increased almost
linearly with age. The incidence of IHD at age 60-64 years and age 65-69 years was
equal, where after, after age 65 years incidence continued to increase with age, ûlthough
at a slightly less steep rate than observed before age 60 years, to more than 15 new IHD
cases per 1,000 men each year afier age 70 years. The trend in incidence of IHD was
estimated by the Poisson regression model. Incidence of IHD was estimated to increase
between ages 30 and 84 years by 6.0% per year with a 95% confidence interval of 5.4%
Figure 6.1 : Age-specific incidence of Ischemic Heart Disease per 1,000 person years by manifestation
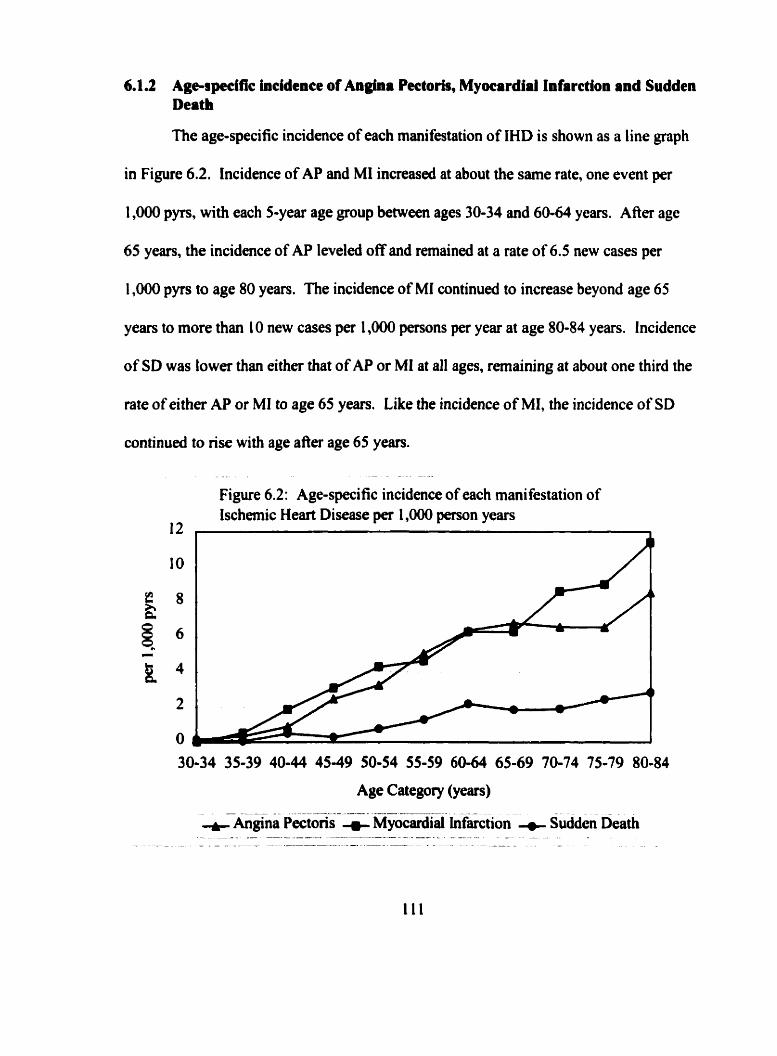
6.1.2 Agcspeclfie incidence of Angîna Peetorir, Myocardial Infarctioa and Sudden Death
The age-specific incidence of each manifestation of IHD is shown as a line graph
in Figure 6.2. Incidence of AP and Ml increased at about the same rate, one event per
1,000 pyrs, with each 5-year age group between ages 30-34 and 60-64 years. After age
65 years, the incidence of AP leveled off and remained at a rate of 6.5 new cases per
1,000 pyrs to age 80 years. The incidence of MI continued to increase beyond age 65
years to more than 10 new cases per 1,000 w o n s per year at age 80-84 years. Incidence
of SD was lower than either that of AP or MI at al1 ages, remaining at about one third the
rate of either AP or MI to age 65 years. Like the incidence of MI, the incidence of SD
continued to rise with age afier age 65 years.
Figure 6.2: Age-specific incidence of each manifestation of Ischemic Heart Disease per 1,000 person years
6.1.3 Summary of incidence of lschemic Heart Disease
There were no prevalent cases of IHD at entry to the study. Al1 1098 IHD cases,
28% of the cohort, were documented as incident events during the 45-year follow-up
period. No IHD events were documented before age 30 years. Incidence rose steadily
with age. The age-specific incidence of AP and MI were similar up to age 65-69 years,
where after, the incidence of SD and MI continued to nse with age. Incidence of .4P
leveled off at about 6 events per 1,000 pyrs afier 60 years of age, and increased again at
age 80 years.
6.2 Distribution of risk factors for lschemic Heart Disease
As shown in Table 6.2, ai examinations selected at 5-year age cross sections
between 25 and 75 years, mean SBP increased fiom 1 20.9 mm Hg to 14 1 .O mm Hg. The
standard deviation of SBP measurements also increased with age. This reflects the
widening range of values of SBP recorded.
Mean DBP increased fiom 74.4 mm Hg at age 25 years to 82.5 mm Hg by age 55
years. After age 55, mean DBP levelled off to age 65 years, and dropped thereafter to
80.0 mm Hg by age 75 years. The increase, plateau and decline of mean DBP is mirrored
by the standard deviation of DBP measurements.
Mean BMI increased fiom 22.7 kg/m2 at age 25 years to 25.6 kg/m2 at age 50
years. Mean BMI remained constant through to age 65 and decreased thereafier. The
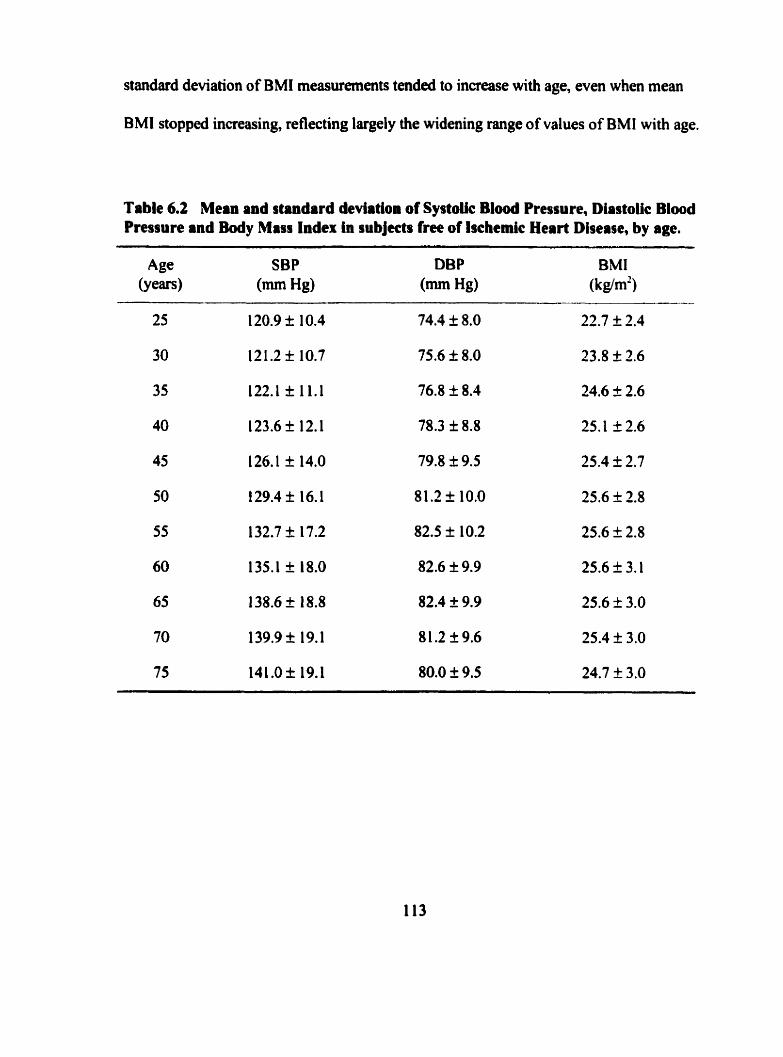
standard deviation of BMI measurements tended to increase with age, even when mean
BMI stopped increasing, reflecting largely the widening range of values of BMI with age.
Table 6.2 Mean and standard deviation of Systoiic B l d Pressure, Diastolic Blood Pressure and Body Miss Index In subjects free of lscbmic Heart Diserte, by age.
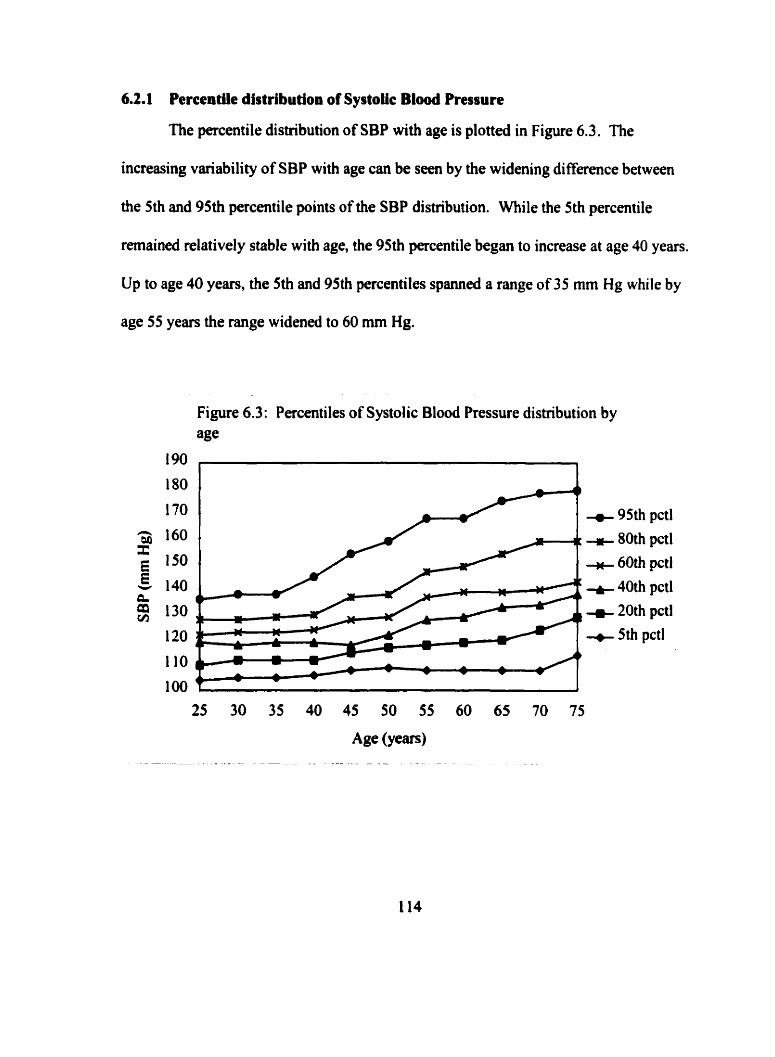
6.2.1 Percentile distribution of Systolic Blood Pressure
The percentile distribution of SBP with age is plotted in Figure 6.3. The
increasing variability of SBP with age can be seen by the widening difference between
the 5th and 95th percentile points of the SBP distribution. Mile the 5th percentile
remaineci relatively stable with age, the 95th percentile began to increase at age 40 years.
Up to age 40 years, the 5th and 95th percentiles spanned a range of 35 mm Hg while by
age 55 years the range widened to 60 mm Hg.
Figure 6.3: Percentiles of Systolic Blood Pressure distribution by age
95th pctl 80th pctl 60th pctl
40th pctl 20th pctl 5th pctl
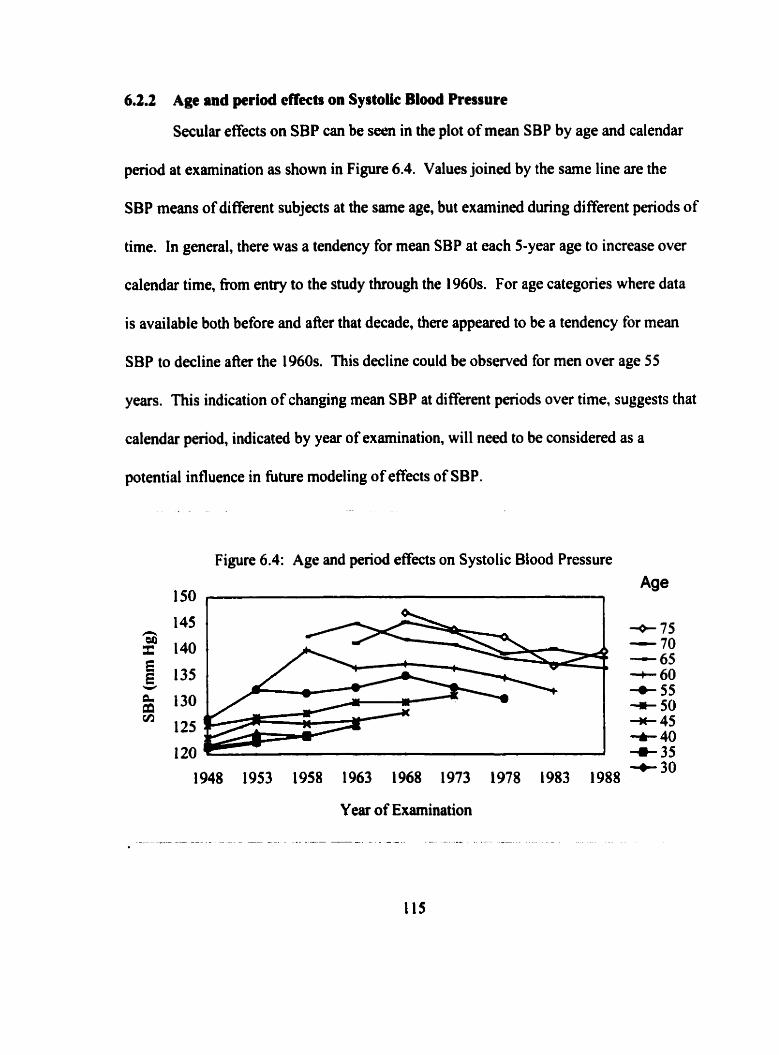
6.2.2 Age and period effects on SystoUc Blood Pmsure
Secular effects on SBP can be seen in the plot of mean SBP by age and calendar
period at examination as shown in Figure 6.4. Values joined by the same line are the
SBP means of different subjects at the same age, but examined during different periods of
time. In general, there was a tendency for mean SBP at each 5-year age to increase over
calendar time, fiom entry to the study through the 1960s. For age categones where data
is available both before and after that decade, there appeared to be a tendency for mean
SBP to decline afler the 1960s. This decline could be observed for men over age 55
years. This indication of changing mean SBP at different periods over time, suggests that
calendar period, indicated by year of examination, will need to be considered as a
potential influence in future modeling of effects of SBP.
Figure 6.4: Age and period effects on Systolic Blood Pressure
150 , Age
Y ear of Examination
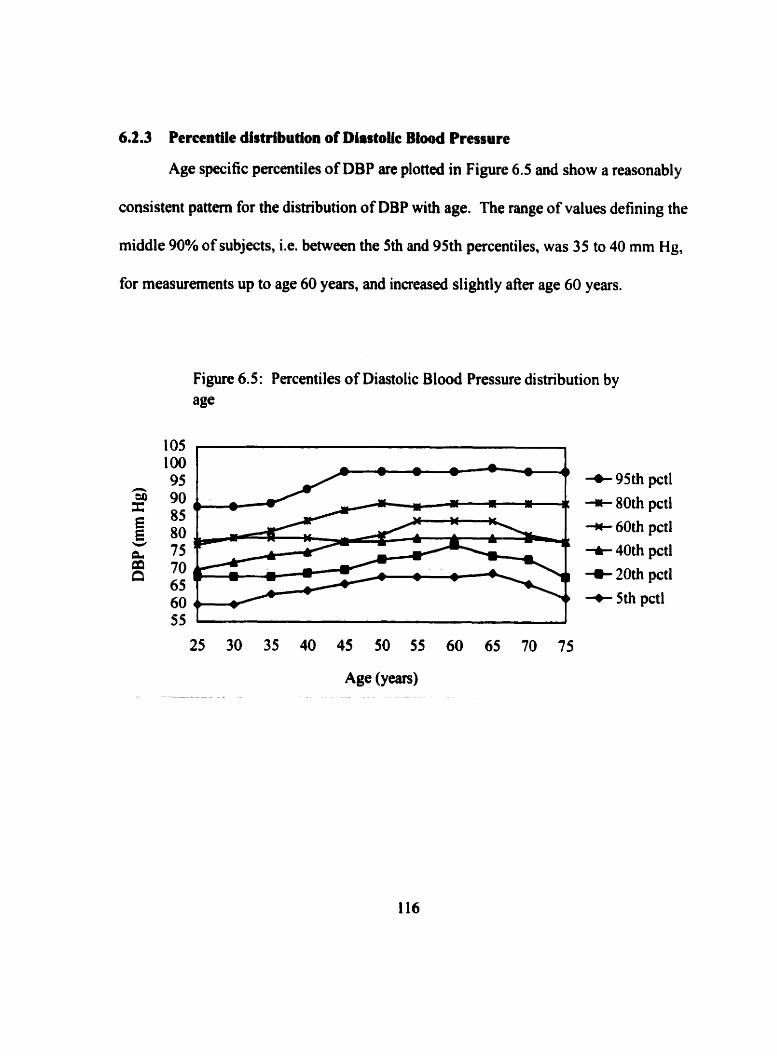
6.2.3 Percentüe distribution of Diastok Blood Pressure
Age specific percentiles of DBP are plotted in Figure 6.5 and show a reasonably
consistent pattern for the distribution of DBP with age. The range of values defining the
middle 90% of subjects, i.e. between the 5th and 95th percentiles, was 35 to 40 mm Hg,
for measurernents up to age 60 yean, and increased slightly afier age 60 years.
Figure 6.5: Percentiles of Diastolic Blood Pressure distribution by age
+ 95th pctl * 80th pctl * 60th pctl t 40th pctl + 20th pctl + 5th pctl
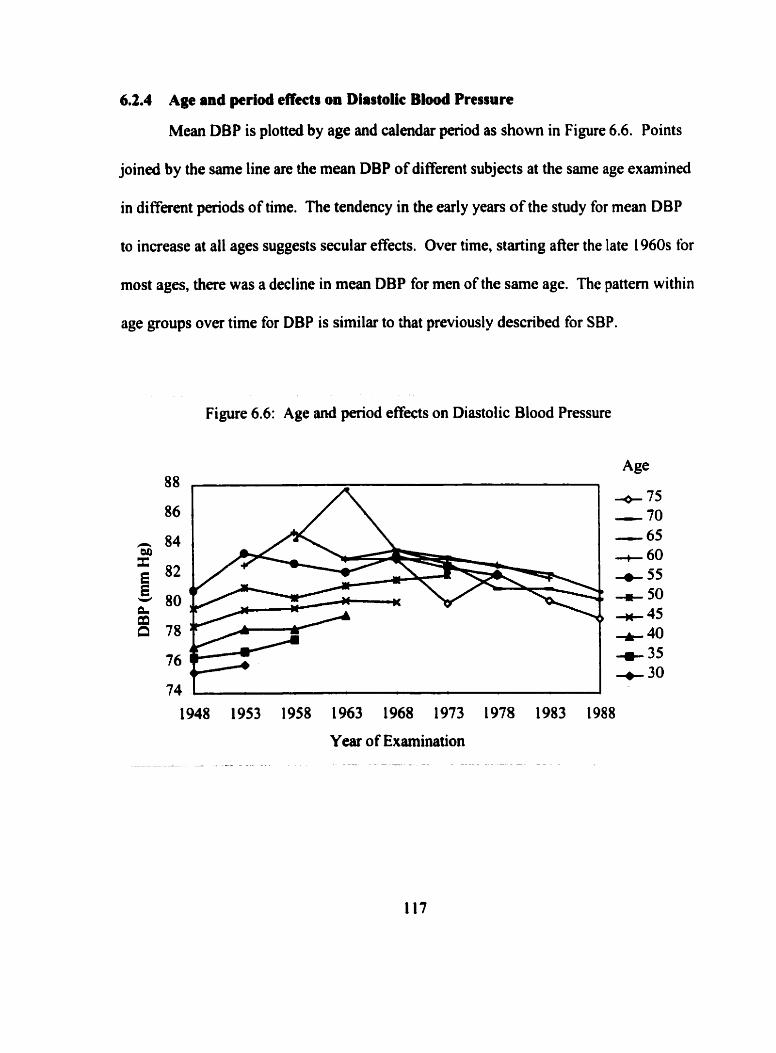
6.2.4 Age and pcriod effects on Diastolic Blood Pressure
Mean DBP is plotted by age and calendar period as show in Figure 6.6. Points
joined by the same line are the mean DBP of different subjects at the same age examined
in different periods of time. The tendency in the early years of the study for mean DBP
to increase at al1 ages suggests secular ef5ects. Over time, starting afier the late 1960s for
most ages, there was a decline in mean DBP for men of the same age. The pattern within
age groups over time for DBP is similar to that previously described for SBP.
Figure 6.6: Age and period effects on Diastolic Blood Pressure
Year of Examination
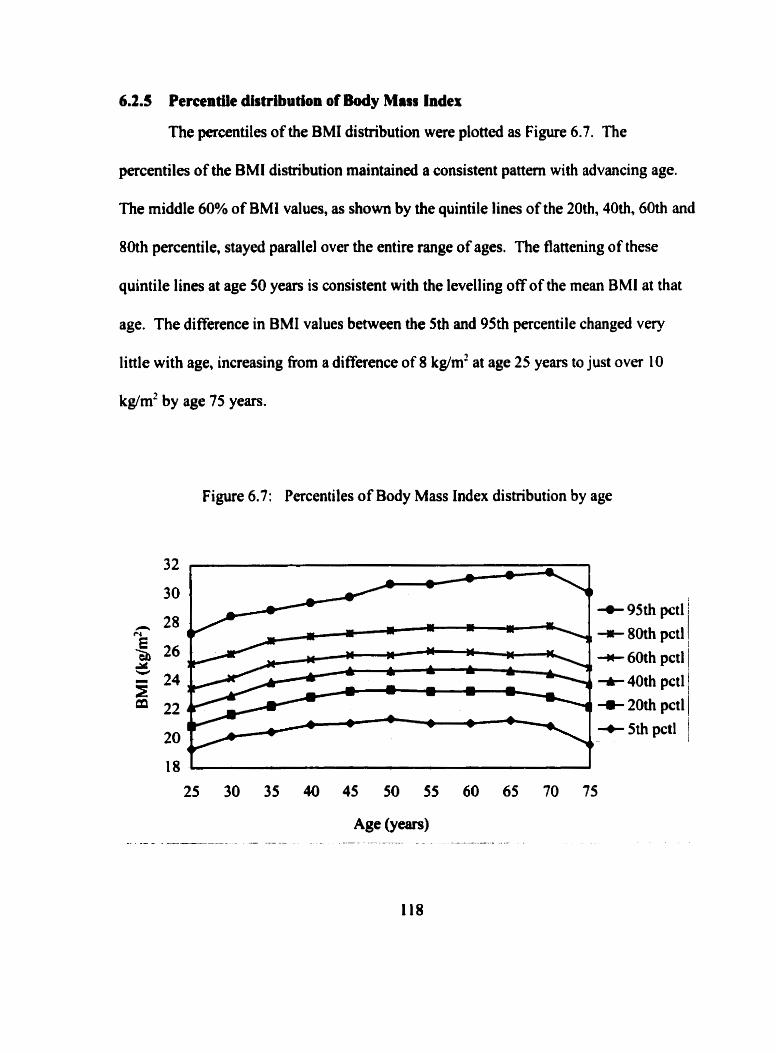
6.2.5 Pemntik distribution of Body Mass Index
The percentiles of the BMI distribution were plotted as Figure 6.7. The
percentiles of the BMI distribution maintained a consistent pattern with advancing age.
The middle 60% of BMI values, as shown by the quintile lines of the 20th, 40th, 60th and
80th percentile, stayed parallel over the entire range of ages. The flattening of these
quintile lines at age 50 years is consistent with the levelling off of the mean BMI at that
age. The difference in BMI values between the 5th and 95th percentile changed very
little with age, increasing From a difference of 8 kg/m2 at age 25 years to just over 10
kglm' by age 75 years.
Figure 6.7: Percentiles of Body Mass Index distribution by age
4- 95th pctl
-rt 80th pctl * 60th pctl t 40th pctl c 20th pctl + 5th pctl
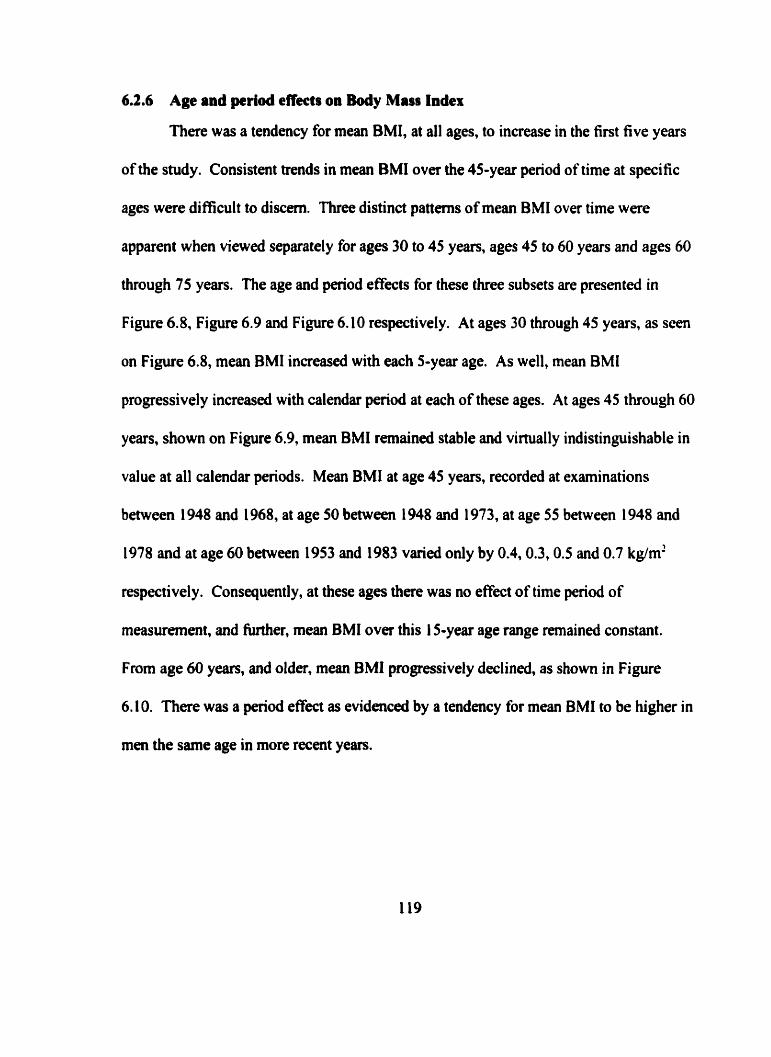
6.2.6 Age and period effects on Body MISS Index
There was a tendency for mean BMI, at al1 ages, to increase in the first five years
of the snidy. Consistent trends in mean BMI ova the 45-year period of time at specific
ages were difficult to discern. Three distinct patterns of mean BMI over time were
apparent when viewed separately for ages 30 to 45 years, ages 45 to 60 years and ages 60
through 75 years. The age and period effects for these three subsets are presented in
Figure 6.8, Figure 6.9 and Figure 6.10 respectively. At ages 30 through 45 years, as seen
on Figure 6.8, mean BMI increased with each 5-year age. As well, mean BMI
progressively increased with calendar pdod at each of these ages. At ages 45 through 60
years, shown on Figure 6.9, mean BMI remained stable and virtually indistinguishable in
value at al1 calendar periods. Mean BMI at age 45 years, recorded at examinations
between 1 948 and 1 968, at age 50 between 1 948 and 1973, at age 55 between 1 948 and
1978 and at age 60 beâween 1953 and 1983 varied only by 0.4,0.3,0.5 and 0.7 kg/m2
respectively. Consequently, at these ages there was no effect of time period of
measurernent, and further, mean BMI over this 1 5-year age range rernained constant.
From age 60 years, and older, mean BMI progressively declined, as show in Figure
6.1 0. There was a period effect as evidenced by a tendency for mean BMI to be higher in
mm the same age in more ment years.
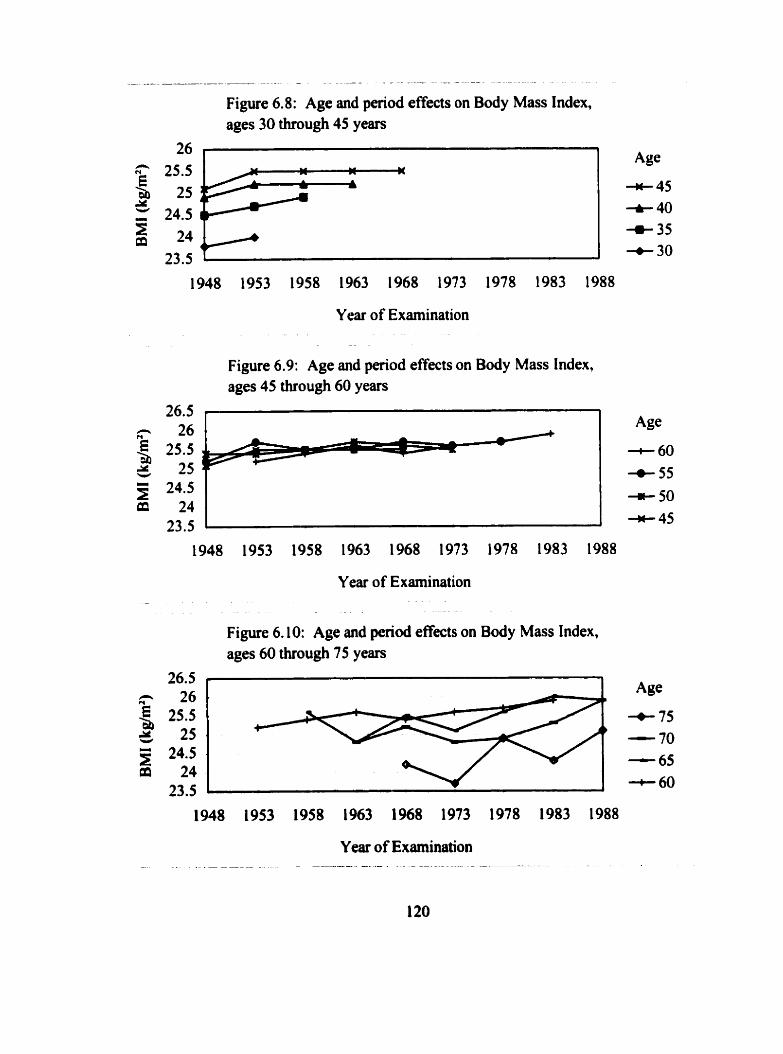
- -- - - - - - -. -- - -- - - - - -
Figure 6.8: Age and period effects on Body Mass Index, ages 30 through 45 years
Year of Examination
Figure 6.9: Age and period effects on Body Mass Index, aga 45 through 60 years
Year of Examination
Figure 6.10: Age and period effects on Body Mass Index, ages 60 through 75 years
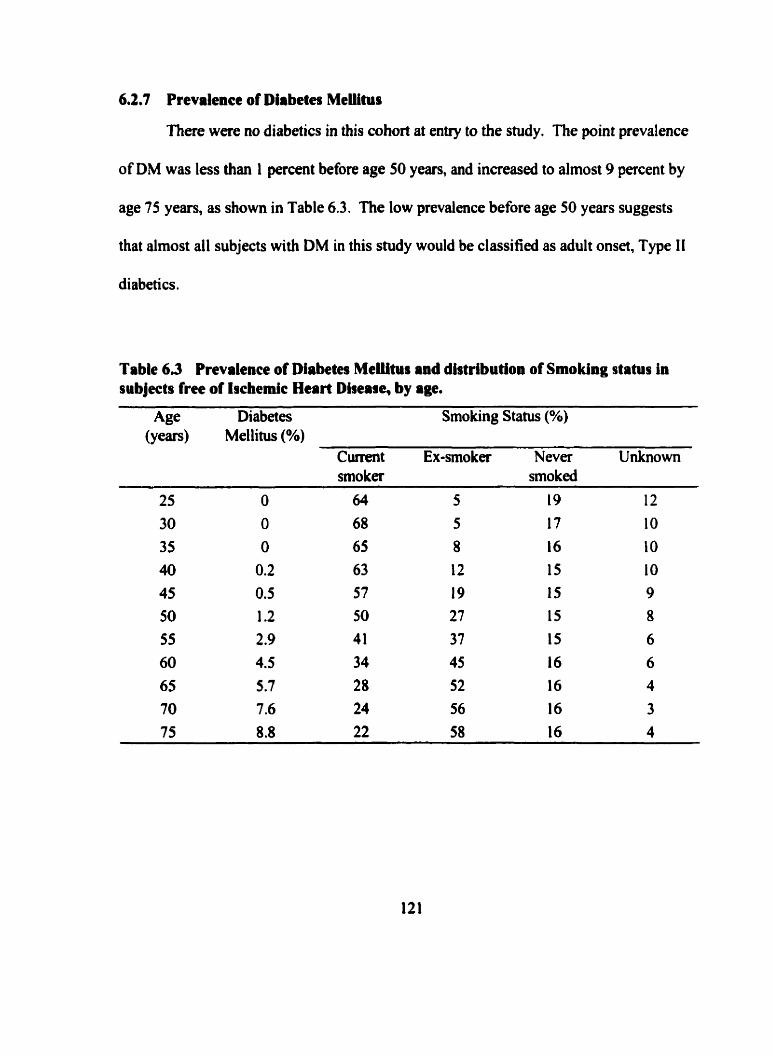
6*2,7 Prevalence of Diabetes Meliitus
There were no diabetics in this cohort at entry to the study. The point prevalence
of DM was less than 1 percent before age 50 years, and increased to almost 9 percent by
age 75 years, as show in Table 6.3. The low prevalence before age 50 years suggests
that almost al1 subjects with DM in this study would be classified as adult onset, Type I I
diabetics.
Table 6 3 Prevalence of Diabetes MeUtur and distribution of Smoking status in subjects free of tocheinic Heart Diseare, by age.
Age Diabetes Smoking Status (%) (years) Met litus (%)
Current Ex-smoker Neva Unknown smoka smo ked
6.2.8 Prevatence of Smoking
As shown in Table 6.3, before age 50 years more than half of the MFUS members
smoked. As the percentage of smokers decr$ased fkom 64 percent at age 25 years io 22
percent at age 75 years, the proportion of ex-smokers correspondingly increased. The
proportion of siudy members who never smoked remained between 15 to 19 percent at al1
ales. Smoking information is missing for about 14 percent of subjects overall. The
proportion with missing smoking information decreaseà from 12 percent at age 25 years
to 4 percent by age 75 years.
6.29 Summary of risk factor profiles
The patterns observed in terms of SBP, DBP, BMI, DM and SM at 5-year age
cross sections over the 45-year follow-up period have been descnbed. The patterns
exhibited tbr mean BP over time, both with SBP and DBP, are similar from younger
ages. lncreases with age were observe- both in the mean and the standard deviation of
BP measurernents. A continuing increase in mean SBP was observed through to age 75
years, while mean DBP declined after age 60 years. Because the pattern of B P with age
appears to depend, to some extent, on the period of time during which BP was recorded,
it will be important to control for calendar period in subsequent analysis.
Following an initial increase in mean BMI h m age 25 through 40 years of age,
the mean BMI remained constant to about 60 years of age, and declined afier that. The
lqes t influence on the increase in the mean of the BMI distribution afier age 40 years
was the inaeased Wuency of high BMI values. This can be seen through the increased
difference between the 80th and 95th percentiles of the BMI distribution with age.
Patterns with BMI by age and time were best described in three age sub-groups. At both
younger ages, age 40 years or less, and older ages, age 60 years or more, age and penod
effects were present. At age 40 thiough age 60 years, mean BMI was almosi constant,
unaffected by either age or period.
Prevalence of diabetes increased with age, from zero before age 50 years in this
cohort. Smoking prevalence decreased with age.
6.3 Tracking of risk factors
Tracking of risk factors was examined for SBP, DBP and BMI using two
methods. Pearson correlation coefficients were calculated for pairs of measurements at 5-
year intervals up to 40 years apart for SBP, DBP and BMI. In addition, the relative
likelihood of remaining in the top or bottom quintile of the distributions of SBP, DBP
and BMI on repeated measurernent was detennined. The number of subjects contributing
observations to the detemination of these backing indicators is presented in Table 6.4.
Al1 subjects who were examined at these ages had SBP and DBP recorded. On some
occasions BMI was not recorded and hence the number of subjects with observations
available for these calculations is fewer than the number of subjects with measurements
for BP calculations. Missing BMI measurements were more h u e n t at older ages than
at younger ages.
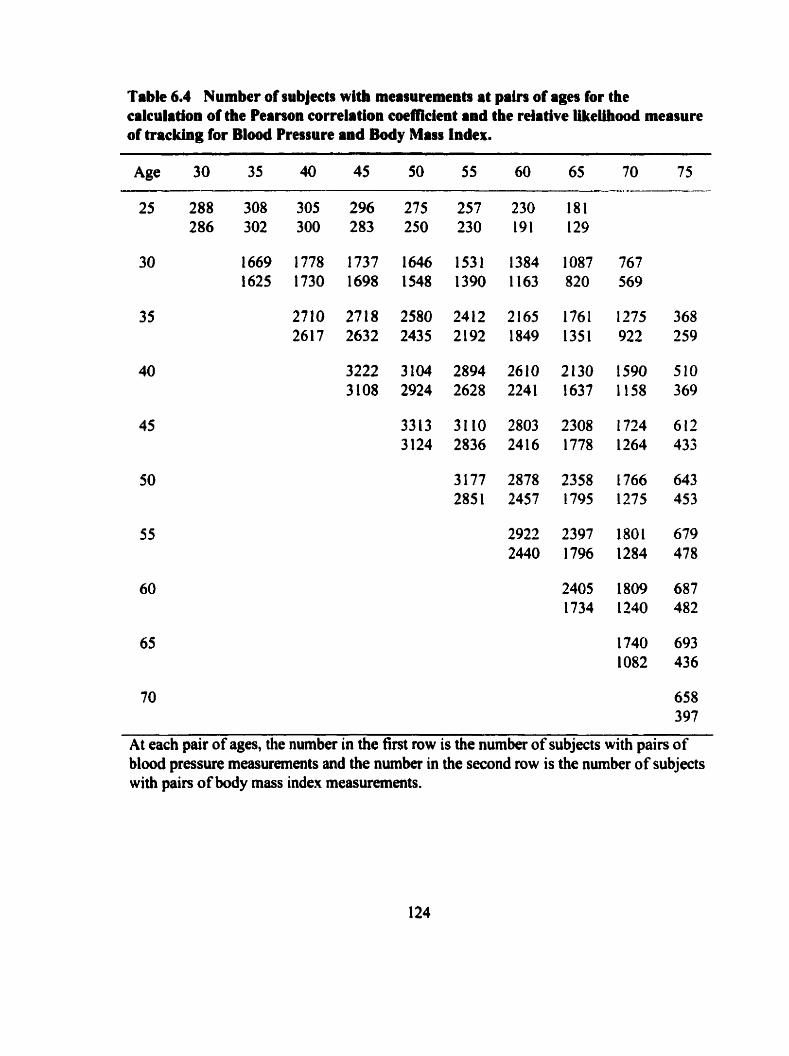
Table 6.4 Number of subjects wlth measurements at pairs of ages for the calculation of the Pearson correlation coefficient and the relative Ukeühood measure of tracking for Blood Pressure and Body Mms Index.
70 658 397
At each pair of ages, the number in the first row is the number of subjects with pairs of blood pressure measurements and the number in the second row is the number of subjects with pain of body mass index measurements.
6.31 Serial correlation o f repeated measurements over time by age
63.1.1 S ystolic Blood Pressure, correlation
The Pearson correlation coefficients for serial measurements of SBP between age
25 and 75 years are shown in the first row of each triplet at pairs of ages in Table 6.5.
The correlation between pairs of SBP measurements were positive and, with the few
exceptions as noted, statistically significant at the p<0.0 1 level. The correlation
coefficients Meweâ diagonally from the top left to the bottom right in this table are the
same time interval apart between different ages. As viewed !tom the top row dong a
diagonal, the magnitude of the correlation coefficient increased for pain of measurements
fiom younger ages to a maximum correlation of 0.50 for pairs of measurernents 5 years
apart between age 45 and 50 years, 0.40 for measurements 10 years apart, 0.32 for
measurements 15 years and 0.3 1 for measurements 20 years apart. This suggests that the
correlation between SBP measwments, from the same age, decreased with increasing
length of time between measurernents.
62.1.2 Diastoiic Blood Pressure, correlation
The Pearson correlation coefficients for serial measurements of DBP recorded
between age 25 and 75 years of age are shown in the second row of each triplet at pain of
ages in Table 6.5. The correlation between pairs of DBP measurements were positive
and, with the few exceptions as noted, statistically significant at the p<O.Ol level. The
magnitude of the correlation coefficient the same time interval apart increased for pain at
younger ages, where at least one measurement was record4 before age 50 years. The
125
strongest correlation was found for measuments at middle ages, with al1 correlation
coefficients, five years apart, between ages 40 and 60 years, being at least 0.40. Ten-year
correlation coefficients at these ages ranged between 0.3 1 and 0.35. The 15-year or 20-
year correlation coefficients for DBP measurements in general ranged between 0.20 and
0.30. Thus, the correlation between DBP measurements fiom the same age decreased
with increasing length of time between measurements.
6Al.3 Body Mars Index, correlation
Serial BMI measurement had high correlation as shown in the last row of each
triplet at pain of ages in Table 6.5. Al1 pain of BMI measurements examined up to 35
years apart, had correlation coefficients at least as large as 0.52. At intervals of 5, 1 O and
1 5 years, at al\ ages between 30 and 75 years correlation coefficients ranged between 0.7 1
and 0.88. Similar to the trends found with BP correlation coefficients, BMI correlation
coefficients decreased with increasing interval of time between measurements.
Correlation coefficients for BMI increased with age for measurements the same interval
of time apart for pairs of measurements up to age 60 years.
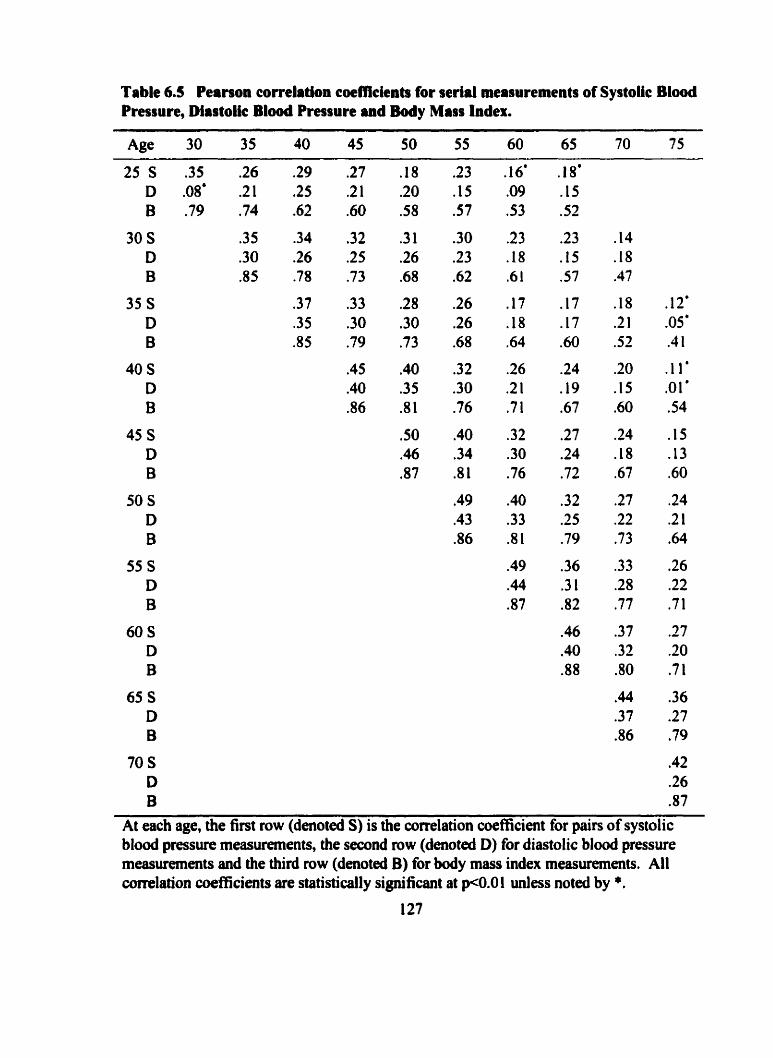
Table 6.5 Pearson correlation coefficients for serial measurements of Systoiie Blood Pressure, Diastolic Blwà Pressure and Body Mars Index.
At each age, the first row (denoted S) is the correlation coefficient for pairs of systolic b l d pressure measurements, the second row (denoted D) for diastolic b l d pressure measurements and the third row (denoted B) for body mass index measufements. Al1 comlation coefficients are statistically significant at ~ 0 . 0 1 unless noteù by *.
6.3.1 A Summary of correlation between measurements by age
In general, similar patterns across age and time intervals were found for the
correlation of SBP measurements and for the correlation of DBP measurements. With
few exceptions, the correlation coefficients were greater for SBP than for DBP
measurements at the same ages. Cornparison of SBP and DBP correlation coetricients
fiom the same age and with the same time interval between measurements showed that
for both BP measurements correlation was the strongest when measured at ages between
40 and 60 years. SBP measurements at 5-year intervals at ages between 40 and 55 years
were in the range of 0.45 to 0.50, while for DBP they were 0.40 to 0.46. In general, the
same pattern for decreasing correlation with increasing interval of time between
measurements was evident for both SBP and DBP. Correlation of BMI 5 years or 10
years apart was affected very little by age at examination. Between age 30 and 75 yean,
al1 5-year correlation coefficients for BMI ranged fiom 0.85 to 0.88, and 10-year
correlation coefficients fiom 0.78 to 0.82. The correlation for pairs of BMI
measurements at 15,20,25 or 30 years between ages 30 through 75 years were al1 ai least
0.60 in magnitude. In al1 instances, the correlation between pairs of BMI measurements
was greater than the correlation for either BP measurernent.
6.3.2 Relative Ukeîîhood methods for trachg
6.3.2.1 Tracking in the top quintile
The relative likelihood of tracking for subjects in the top quintiie of the SBP, DBP
and BMI distributions is shown in Table 6.6. Each number in this table corresponding to
128
a pair of a g a is a ratio of proportions. This ratio, called the relative likelihood, is the
proportion of subjects in the top quintile at the younger age who remained in the top
quintile at the older age, divided by the proportion of al1 subjects with examinations at
both ages who were in the top quintile at the older age. For example, between age 15 and
30,47.8% of the subjects in the top SBP quintile at age 25 remained in the top SBP
quintile at age 30 years, while 24.0% of al1 subjects with measurements at both ages were
in the top SBP quintile at age 30 years. Hence, the likelihood of remaining in the top
SBP quintile fiom age 25 to age 30 years was 47.8/24.0=1.99 times greater than the
overall likelihood of being in the top SBP quintile at age 30 years. Cutpoints defining BP
quintiles that would identify exactly 20% of subjects is highly unlikely, due to the
inherent digit preference in recording of BP values. However, this is not a problem with
the calculation of the relative likelihood statistic, because the same cutpoint of the BP
distribution at the older age is used for both the numerator and denominator.
Atter age 40 years, subjects in the top quintile of the SBP distribution were more
than twice as likely to remain in the top quintile 5 years later than others were to be in the
top quintile. This can be seen by the number in the top row of the triplet ranging from
2.15 to 2.46 along the first diagonal of Table 6.6 at these ages. The strongest evidence
for SBP tracking was found for measurements at pain of ages fiom 40 through to 55
years.
The relative likelihood of tracking for subjects in the top quintile of the DBP
distribution are slightly lower than the relative likelihood tracking measures for SBP, at
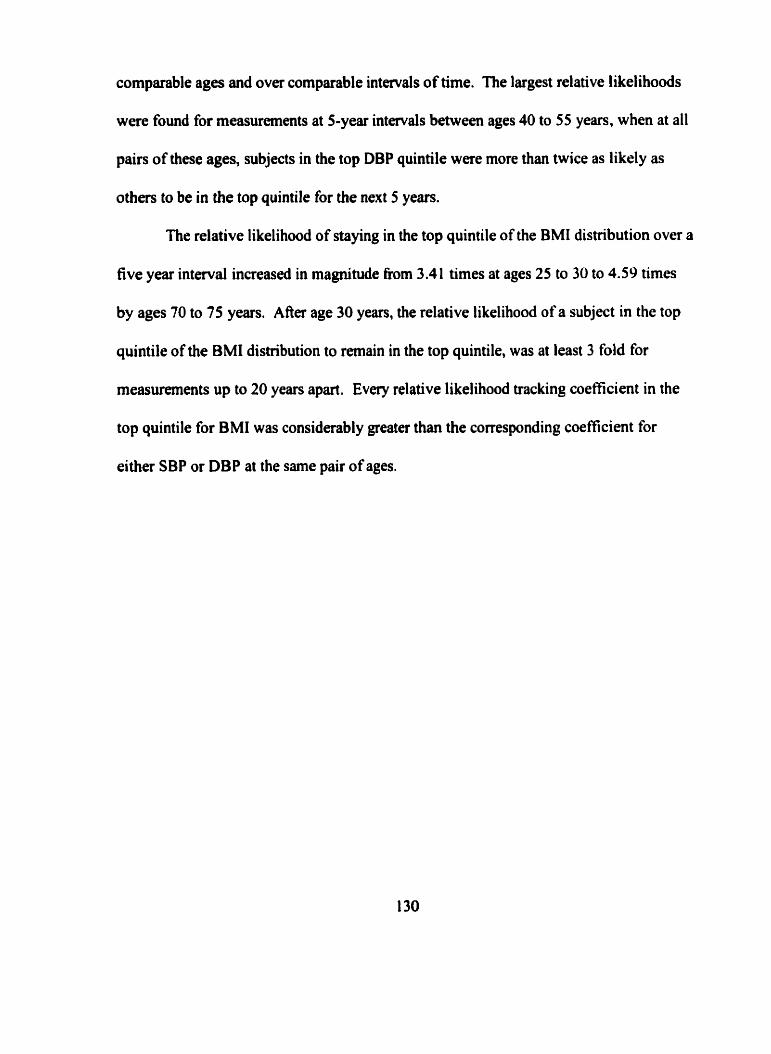
comparable ages and over comparable intervals of time. The largest relative likelihoods
were found for measurements at 5-year intervals between ages 40 to 55 years, when at al1
pairs of these ages, subjects in the top DBP quintile were more than twice as likdy as
others to be in the top quintile for the next 5 years.
The relative likelihood of staying in the top quintile of the BMI distribution over a
five year interval increased in magnitude from 3.41 times at ages 25 to 30 to 4.59 times
by a g a 70 to 75 years. Afkr age 30 years, the relative likelihood of a subject in the top
quintile of the BMI distribution to rernain in the top quintile, was at least 3 fold for
measwments up to 20 years apart. Every relative likelihood tracking coefficient in the
top quintile for BMI was considerably greater than the corresponding coef'fïcient for
either SBP or DBP at the same pair of ages.
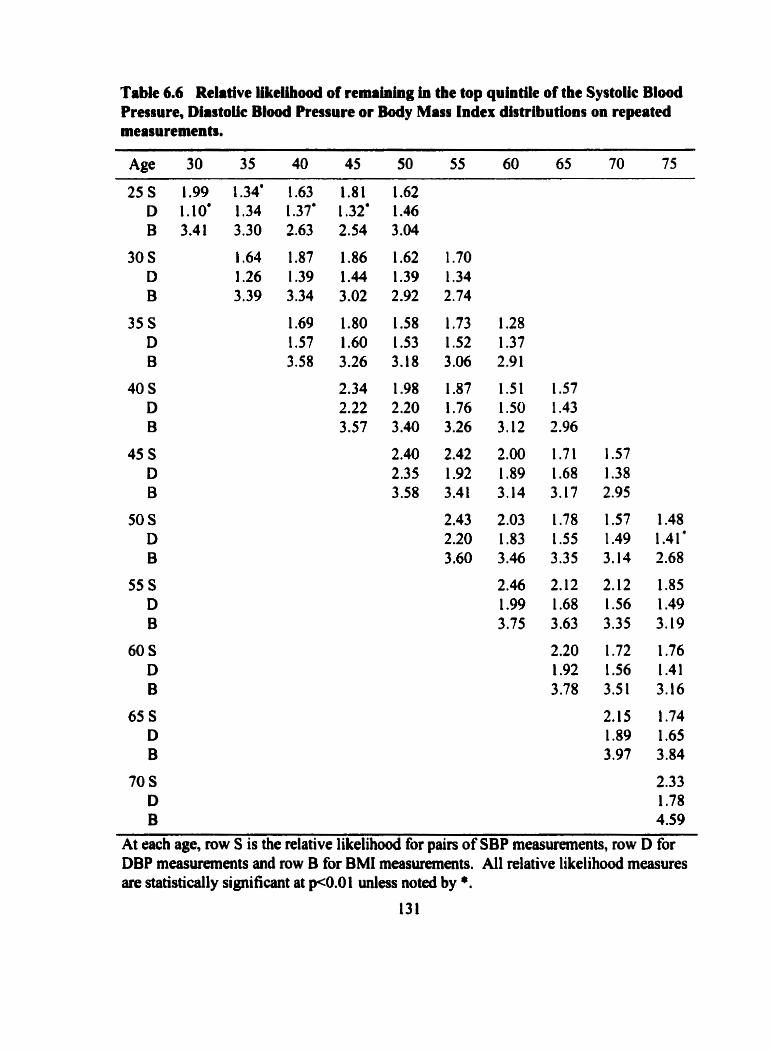
Table 6.6 Relative Ukellliood of nmaining in the top quintiie of the Systok B l o d Pressure, Diastollc Btood Pressure or Body Mass Index distributions on repeated measurements.
Age 30 35 40 45 50 55 60 65 70 75
At each age, row S is the relative likelihood for pairs of SBP measurements, row D for DBP measuremmts and row B for BMI measurernents. Al1 relative likelihood measures are statistically significant at pCO.0 1 unless noted by *.
633.2 Tracking in the bottom quintüe
The relative likelihood of tracking for subjects in the bottom quintile is shown in
Table 6.7. For SBP, subjects afier age 35 years were at least one and a half times more
likely to remain in the lowest quintile than were others to be in the lowest quintile for
measurements at intervals up to 25 years apart. Hence, there is evidence for SBP
tracking, both in the top quintile and the bottom quintile of the distribution.
The tracking coefficients for DBP measurements in the bottom quintile show that
at ages after 30 years over intervals up to 15 years, subjects were at least one and a half
times more likely to remain in the lowest quintile than were others to be in the lowest
quintile.
Significant evidence for tnicking in the bottom quintile of the BMI distribution
was also found. BMI tracking in the bottom quintile was stronger than that for blood
pressure at comparable ages, with relative likelihood coefficients greater than 3 fold for
measurements 5 or 10 years apart, at al1 ages bctween 30 and 65 years. Tracking
coefficients were greater for thosc pairs of measurements doser together in time and
tended to be fairly consistent in magnitude between ages 40 and 65 years.
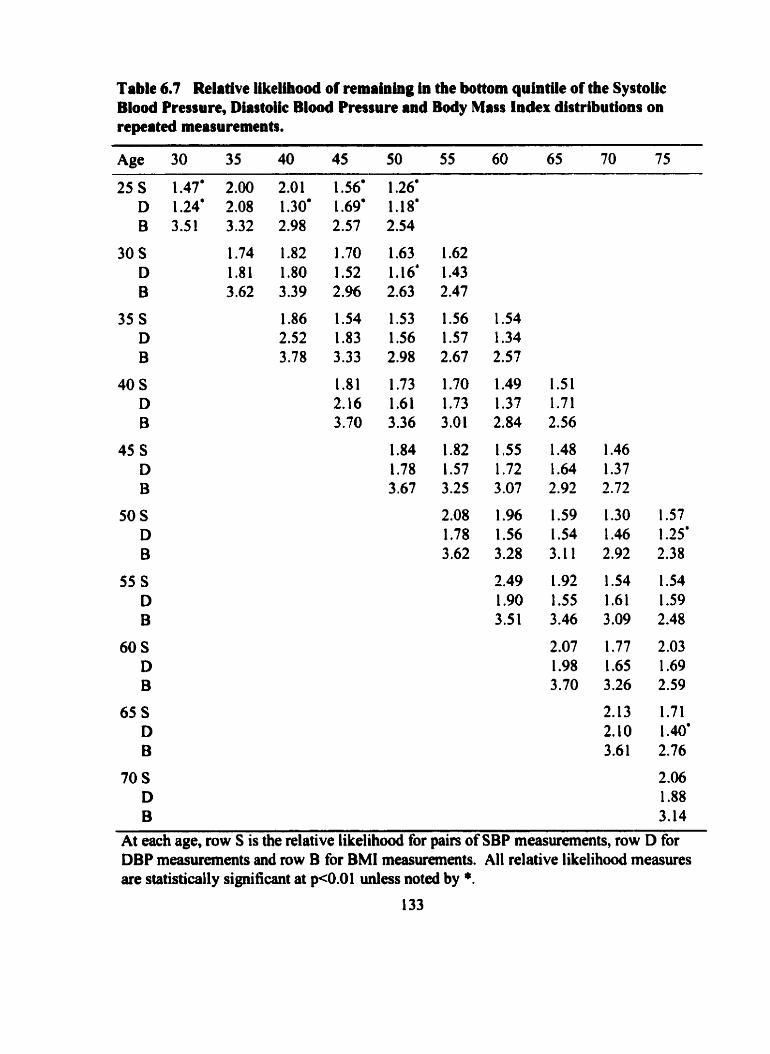
Table 6.7 Relative Weühood of remahlog in the bottom quintile of the SystoUc Blood Pressure, Diastoiic Blood Pressure and Body Mass Index distributions on npeated measurements.
Age 30 35 40 45 50 55 60 65 70 75
At each age, row S is the relative l ike l ihd for pairs of SBP measurements, row D for DBP measurements and row B for BMI measurements. Al1 relative likelihood measures are statistically significant at p<0.01 unless noted by *.
133
63.3 Sunmary of evideace for tracking
Tracking of the continuous risk factors, SBP, DBP and BMI, was examined using
two statistical approaches, correlation analysis and the calculation of the relative
likelihood. The correlation coefficient measures the strength of the linear relationship
between two variables across their entire range of values. The relative likelihood
approach is a measure of the tendency for individuals on repeated measurement to remain
in the top, or bottom, part of the distribution of measurements.
Correlation analysis showed coefficients to be greatest for pairs of measurements
at age 40.45, 50 and 55 years of age. Coefficients were greater for shoner intervals of
time between measurements, and decreased with longer intervals between measurements.
In general, correlation coefficients were greatest for BMI and greater for SBP than for
DBP at the same pair of ages.
The relative likelihood measure was used to assess the magnitude of tracking in
the top and bottom quintiles of the distributions for SBP, DBP and BMI. The relative
iikelihood was of similar magnitude for SBP and DBP and was greater for BMI
measurernents than with either BP at every pair of ages. For the same pair of ages
between 40 and 55 years, over intervals of 5, 1 0 and 1 5 years, the relative li kelihood of
tracking in the top quintile was typically greater than the relative likelihood of tracking in
the bottom quintile for both SBP and DBP. At ages under 40 years, for B P, tracking in
the bottom quintile was typically greater than tracking in the top quintile over 5 and 10
year intervals. BM1 tracking was greater in the top compareù to the bottom quintile at
older ages, and greater in the bottom compared to the top quintile at younger ages.
6.4 Effect of aging on the relationship between risk facton and incidence of Ischemic Heart Disease
6.4.1 Risk factots and patterns of incidence of Ischemic Heart Diwase
Subjects were classifieû within quintiles of the distributions of SBP, DBP and
BMI, as diabetic or non-diabetic, and within smoking categories at select4 ages between
30 and 75 years. The incidence of IHD per 1,000 pyrs from each age was calculated for
subjects within these categories to explore the relationship between these risk facton at
specific ages and the incidence of IHD. For each risk factor, the incidence of IHD was
plotted and the pattern in incidence across categories ai each age was describal. The
incidence ratio was calculated as the incidence of IHD for those in the elevated risk
category divided by the incidence of IHD for those in the lowest risk category. nie
incidence difference was calculated as the difference in incidence of IHD between
subjects in the highest and lowest nsk categories. The highest and lowest risk categories
were defined as the top and bottom quintile, respectively, of the SBP, DBP or BMI
distributions, diabetics and nondiabetics, and current smokers compared to never
smokers. No statistical tests of the incidence of IHD across categories of each nsk factor
dong with the IR and the ID were calculated. Patterns were described at di fferent ages to
assess the effect aging may have on the reiationship of each nsk factor with incidence of
IHD.
Increasing incidence of IHD with increasing SBP quintiles are apparent as shown
in Figure 6.1 1. Although incidence of IHD in the bottom quintile, labeled Q1, was
always lower than the incidence in 42, and the incidence of IHD in the top quintile,
labeleâ QS, was always greater than the incidence in Q4, the gradient across all five
quintiles was rnonotonic only at ages 40 and 55 years. A trend of increasing incidence of
IHD with increasing SBP quintiles, however, was apparent at al1 ages. The IR of 1.46 at
age 30 years, as shown in Table 6.8, means that the incidence of IHD for the subjects in
the top SBP quintile is 46% greater than the incidence of IHD for subjects in the lowest
SBP quintile at this age. The IR ranged fiom a low of 1.41 at age 35 years to a high of
2.07 at age 75 years. There was no consistent pattern of increasing, or decreasing, IR
with age. At the sarne time the ID increased with age. The difference of incidence of
IHD of 2.5 cases per 1,000 pyrs between those in the top and bottom SBP quintiles at age
30, increased to a di fference of about 9 cases per 1,000 pyrs at ages 55 through 70 years.
The increasing ID with age is apparent from the gradient across the five quintile
categories becoming steeper with increasing with age, as show in Figure 6.1 1.
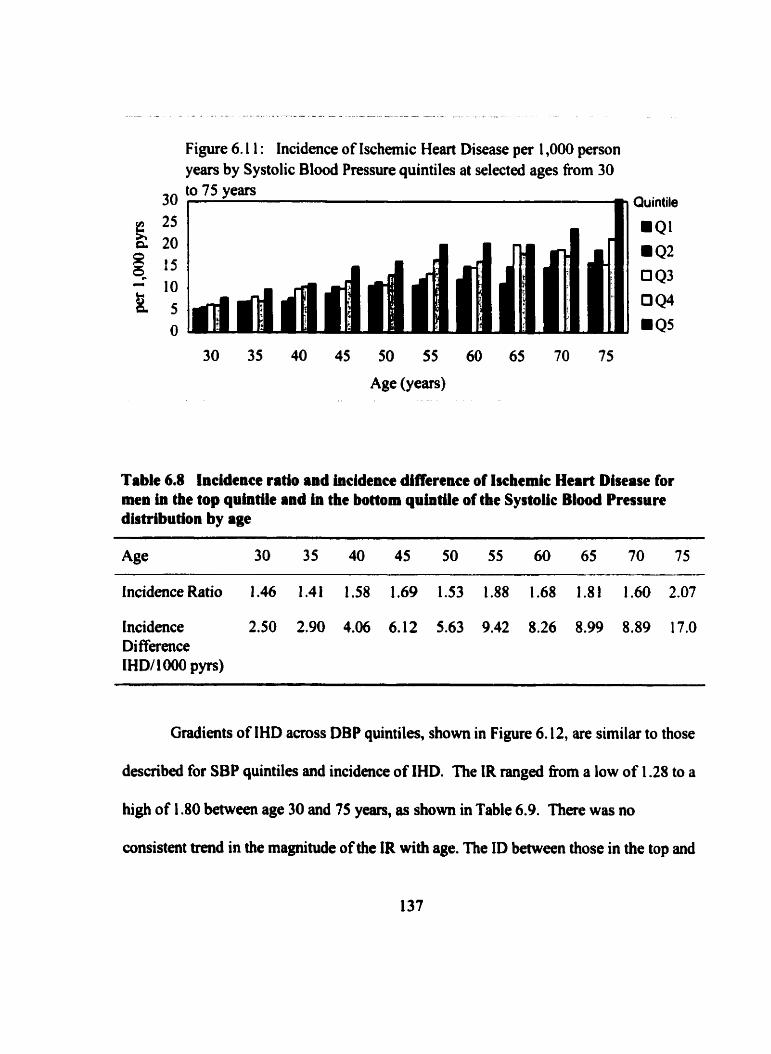
Figure 6.1 1 : Incidence of Ischemic Heart Disease per 1,000 person years by Systolic Blood Pressure quintiles at selected ages fiom 30
30 to 75 years
Table 6.8 Incidence ratio and incidence difference of lschemic Heart Disease for men in the top qrintüe and in the bottom quintile of the Systoiic Biood Pressure distribution by age
Incidence Ratio 1.46 1.41 1.58 1.69 1.53 1.88 1.68 1.8 1 1.60 2.07
Incidence 2.50 2.90 4.06 6.12 5.63 9.42 8.26 8.99 8.89 17.0 Di fference IH Dl 1 O00 pyrs)
Gradients of IHD across DBP quintiles, shown in Figure 6.12, are similar to those
described for SBP quintiles and incidence of IHD. The IR ranged fkom a low of 1.28 to a
high of 1.80 between age 30 and 75 years, as shown in Table 6.9. There was no
consistent trend in the magnitude of the IR with age. The ID between those in the top and
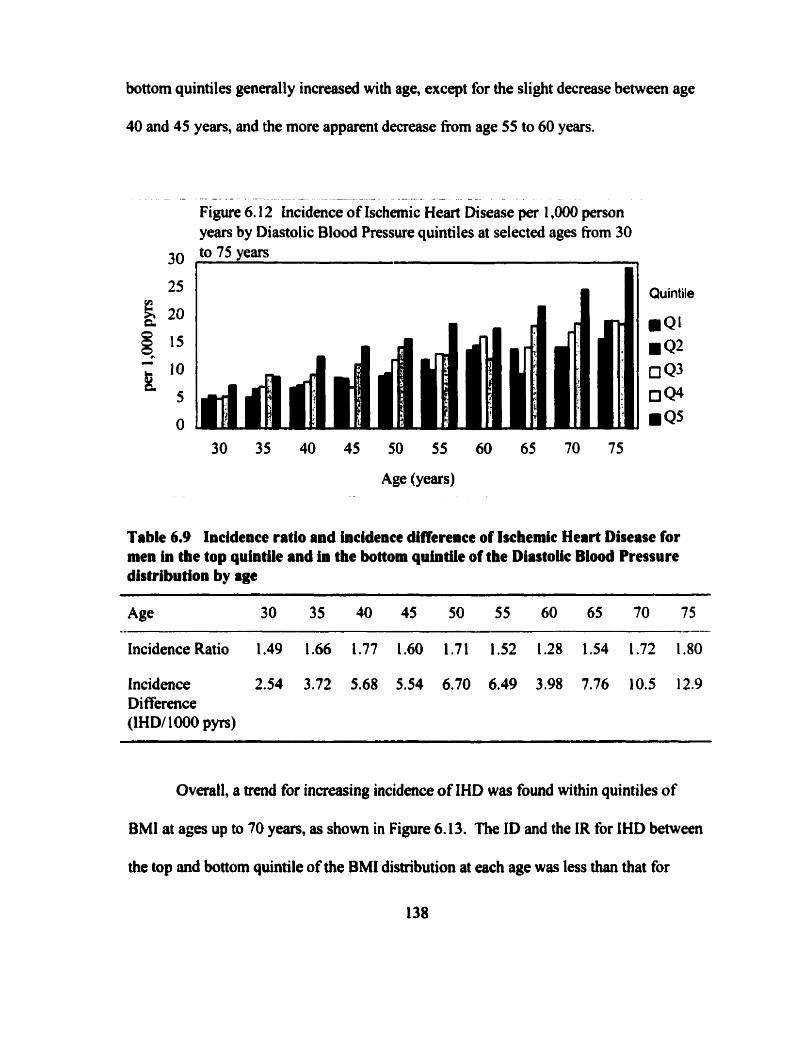
bottom quintiles generall y increased wi th age, except for the slight decrease between age
40 and 45 years, and the more apparent decrease from age 55 to 60 years.
- - - - . - - - - - - -- - - - - - - - - -
F i g w 6.12 Lncidence of Ischemic Heart Disease per 1,000 person years by Diastolic Blood Pressure quintiles at selected ages fiom 30
25
k 20 a
Q l 5 - 10 k 5
O
Table 6.9
30 to 75 years 1
Quintile
i Q ' .Q2 a 4 3 0Qs i QS
Incidence ratio and incidence difference of Ischemic Heart Disease for men in the top quintile and in the bottom quintiie of the Diastoiic Blood Pressure distribution by age
IncidenceRatio 1.49 1.66 1.77 1.60 1.71 1.52 1.28 1.54 1.72 1.80
Incidence 2.54 3.72 5.68 5.54 6.70 6.49 3.98 7.76 10.5 12.9 Di fference (IHDf 1000 p p )
Overall, a trend for inmeasing incidence of IHD was found within quintiles of
BMI at ages up to 70 y-, as shown in Figure 6.13. The ID and the IR for IHD between
the top and bottom quintile of the BMI distribution at each age was less than that for
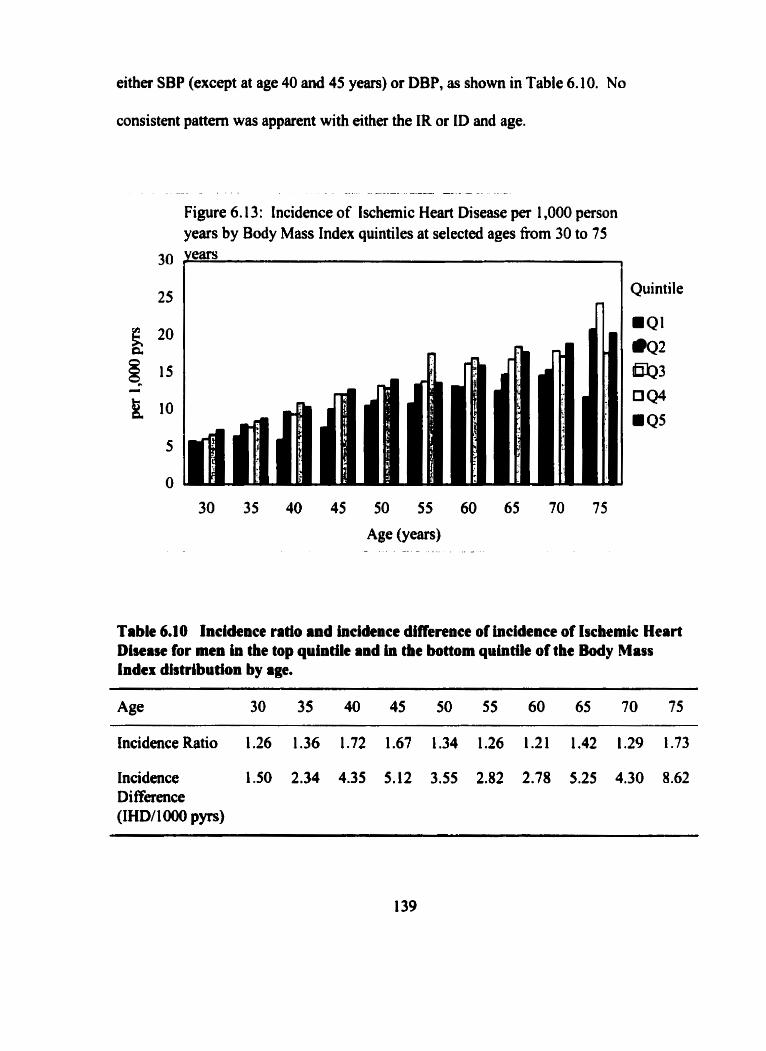
either SBP (except at age 40 and 45 years) or DBP, as shown in Table 6.10. No
consistent pattern was apparent with either the IR or ID and age.
Figure 6.13: Incidence of lschemic Heart Disease per 1,000 person years by Body Mass Index quintiles at selected ages fiom 30 to 75
Quintile
i Q 1
Q2 4 3
0 4 4
Q5
Table 6.10 Incidence ratio and incidence difference of incidence of lschemic Heart Disease for men in the top quintik and in the bottom quintile of the Body Mass Index distribution by age.
Incidence Ratio 1.26 1.36 1.72 1.67 1.34 1.26 1.2 1 1.42 1.29 1.73
Incidence 1.50 2.34 4.35 5.12 3.55 2.82 2.78 5.25 4.30 8.62 Di fference (IHD/ 1 000 pyrs)
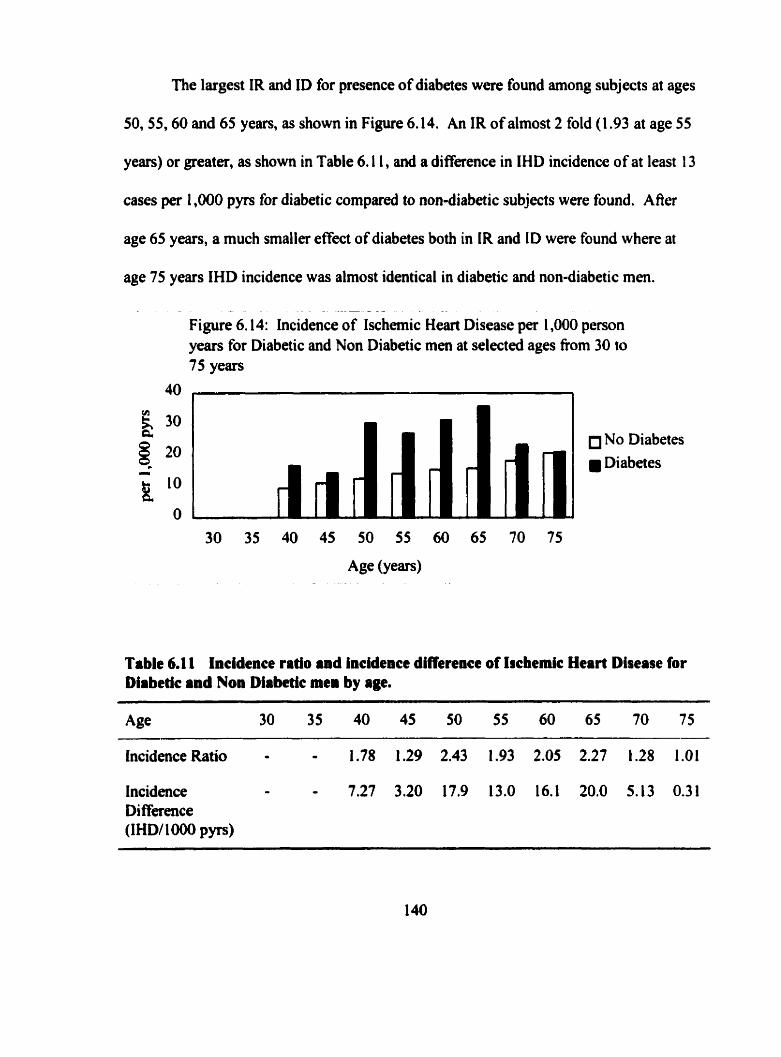
The largest IR and ID for presence of diabetes were found among subjects at ages
50,55,60 and 65 years, as shown in Figure 6.14. An IR of almost 2 fold (1.93 at age 55
years) or greater, as shown in Table 6.1 1, and a difference in IHD incidence of at least 13
cases per 1,000 pyrs for diabetic compared to non-diabetic subjects were found. A fier
age 65 years, a much smalier effect of diabetes both in IR and ID were found where at
age 75 years IHD incidence was almost identical in diabetic and non-diabetic men.
- - - - -
Figure 6.1 4: incidence of Ischemic Heart Disease per 1,000 person years for Diabetic and Non Diabetic men at selected ages fiom 30 to 75 years
No Diabetes Diabetes
Table 6.1 1 Incidence ratio and incidence difference of Ischemic Heart Disease for Diabetic and Non Diabetic men by age.
Incidence Ratio - - 1.78 1.29 2.43 1.93 2.05 2.27 1.28 1.01
Incidence - - 7.27 3.20 17.9 13.0 16.1 20.0 5.13 0.31 Di fference (IHD/lûûû pyn)
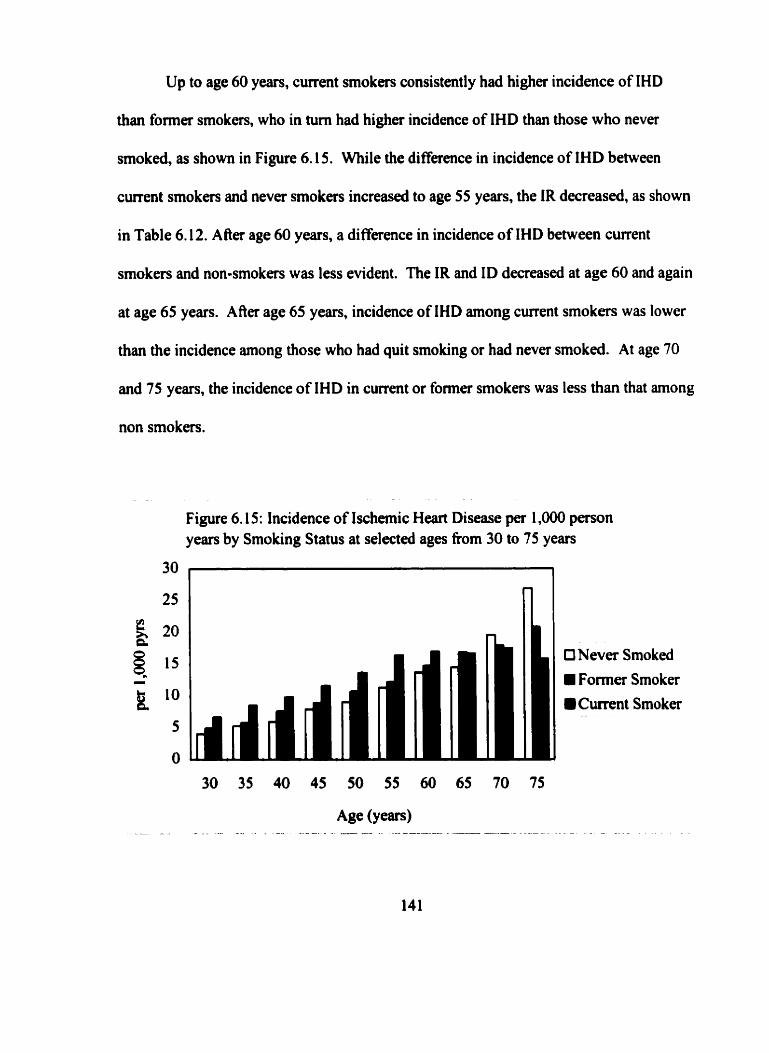
Up to age 60 years, current smokers consistmtly had higher incidence of IHD
than former smokers, who in tum had higher incidence of IHD than those who never
smoked, as shown in Figure 6.15. While the difference in incidence of IHD between
current smokers and never smokers increased to age 55 years, the IR decreased, as shown
in Table 6.1 2. A Aer age 60 years, a di fference in incidence of IHD between current
smokers and non-smokers was less evident. The IR and ID decreased at age 60 and again
at age 65 years. A f k age 65 years, incidence of IHD among current smokers was lower
than the incidence among those who had quit smoking or had never smoked. At age 70
and 75 years, the incidence of IHD in current or former smokers was less than that arnong
non smokers.
Figure 6.1 5: Incidence of Ischemic Heart Disease pet 1,000 person years by Smoking Status at selected aga from 30 to 75 years
t3 Never Smoked
Former Smoker
Cwrent Smoker -- -- -
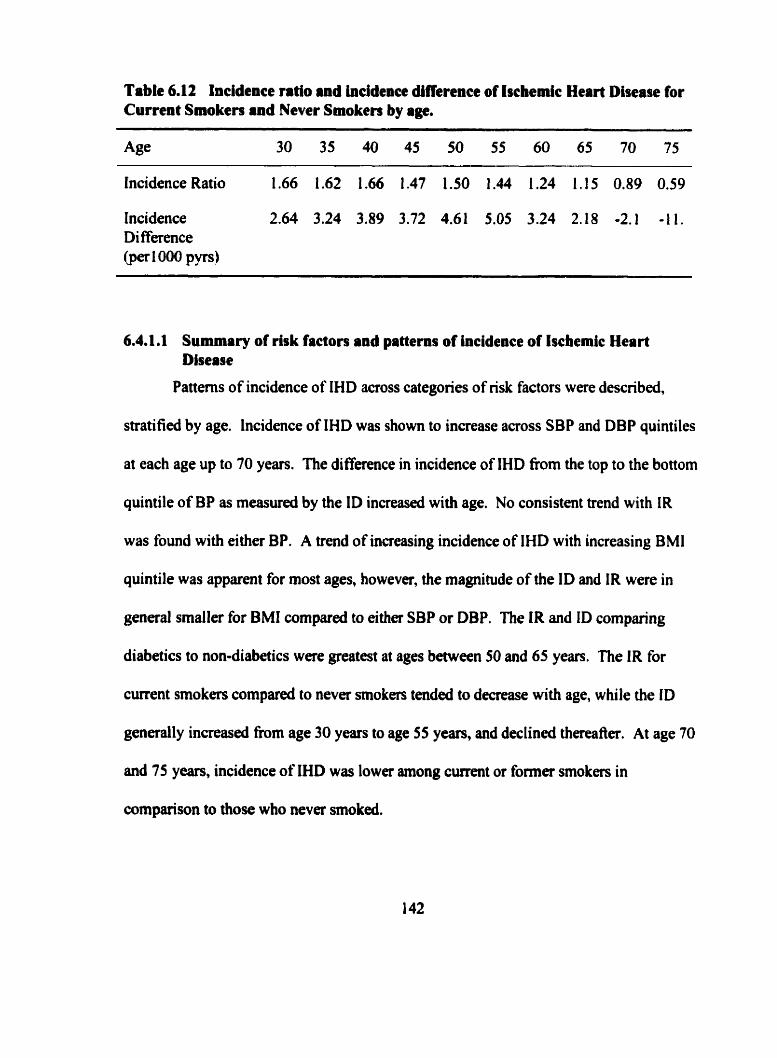
Table 6.12 Incidence ratio and incidence difference of Iscbedc Heart Disease for Current Smoken and Never Smoken by age.
Incidence Ratio 1.66 1.62 1.66 1.47 1.50 1.44 1.24 1.15 0.89 0.59
Incidence 2.64 3.24 3.89 3.72 4.61 5.05 3.24 2.18 -2.1 -I l . Di fference @erIMO pyrs)
6.4.1.1 Summary of risk factors and patterns of incidence of lscbemic Heart Disease
Patterns of incidence of IHD across categories of nsk factors were described,
stratified by age. Incidence of IHD was shown to increase across SBP and DBP quintiles
at each age up to 70 years. The difference in incidence of IHD from the top to the bottom
quintile of BP as measured by the ID increased with age. No consistent trend with IR
was found with either BP. A trend of increasing incidence of IHD with increasing BMl
quintile was apparent for most ages, however, the magnitude of the ID and IR were in
general smaller for BMI compared to either SBP or DBP. The IR and ID comparing
diabetics to non-diabetics were greatest at ages beween 50 and 65 years. The IR for
cunent smokers compareâ to never smokers tended to decrease with age, while the ID
generally increased from age 30 years to age 55 years, and declined thereafier. At age 70
and 75 years, incidence of IHD was Iowa among current or former smokers in
cornparison to those who never smoked.
64.2 Riik factors and patterns of incidence of Angina Pectoris, Myocardial Infarction and Sudden Death
Because IHD manifats as one of three diffcrent types, a different mechanism for
each disease manifestation would be implied if relationships of a risk factor varied with
IHD type. It is therefore important to determine whether the relationships between the
risk factors and IHD manifestations Vary. To explore this, the incidence of AP, MI and
SD fiom selected ages between 30 and 75 y e m was calculated for subjects in age-
specific quintiles of SBP, DBP and BMI, for diabetic and non-diabetic men, and within
smoking categones. Different gradients would reflect the impact aging might have on the
relationship between these risk factors and each manifestation of IHD.
Incidence of AP, MI and SD acmss quintiles and within the categories of the risk
factors were plotted. The age-specific IRs and IDs comparing incidence of each
manifestation of IHD within the top and bottom quintiles for the SBP, DBP and BMI
distributions are presented in Table 6.13. The IRs and IDs for categones of diabetes and
smoking are presented in Table 6.14. The IRs are directly comparable between IHD and
each IHD manifestation because the IR is a unitless measure of the relative incidence
between the subjects in two categones of a risk factor. The magnitude of the IDs are not
comparable among different manifestations of disease. However, it can be noted that the
ID for AP, MI and SD sum to the ID for IHD at each age, in each risk factor category.
The IR for SBP at every age was greater for SD, than for either AP or MI as
show in Table 6.13. The IRs suggests that high SBP could be an important factor for
SD at al1 ages, and a more important risk factor for AP than for MI h m age 50 years
onward. A striking feature of the incidence of SD across SBP quintiles was the
magnitude of the incidence in the top quintile compared to the other four quintiles at ages
40 through 60 years. At these ages SD incidence changed little across the fint four
quintiles, and increased for those in the top quintile.
Incidence of SD across DBP quintiles at ages 30,35 and 40 showed inconsistent
gradients, even though the IR for SD at age 30 and age 40 was greater than that for AP or
MI. This suggests that men wiîh DBP in the top quintile at younger ages are at a risk of
SD greater than the men at any of the other four quintiles. At age 45 years and older, the
IR for AP was consistently higher than that for MI or SD. Gradients with MI incidence
were most apparent at age 65 and 70 years. From age 35 years and older, the greatest
incidence of SD was consistently found for subjects in the highest DBP quintile, although
there was no consistent gradient across the 0 t h four DBP quintiles.
The IR for BMI was greater for SD, than for eithet AP or MI at every age up to 50
years, with al1 IRs for SD greater than 2 up to age 45 years. From age 55 through age 70
years, the IR for BMI was greatest for AP, compared to the IR for either MI or SD.
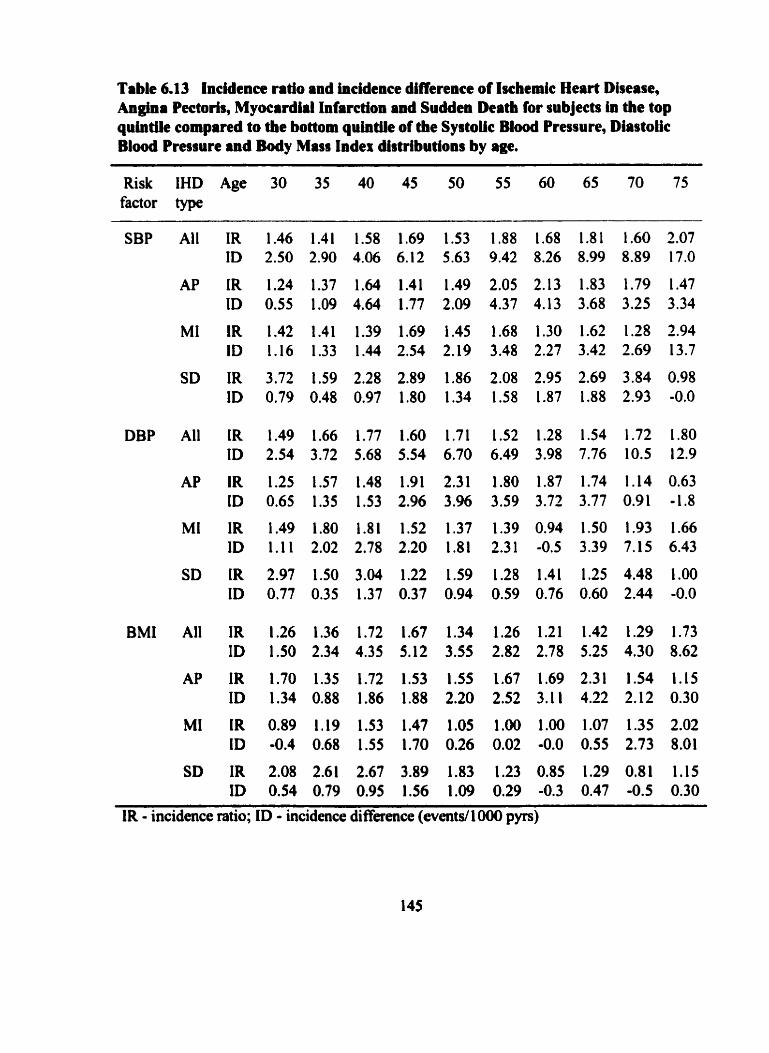
Table 6.13 Incidence ratio and incidence difference of Ischemic Heart Disease, Angina Pectoris, Myocardial Infarction and Sudden Death for subjects in the top quintUe compared to the bottom quintik of the Systoiic B l d Pressure, Diastolic Blood Pressure and Body Miss Index disnibutions by age.
Risk IHD Age 30 35 40 45 50 55 60 65 70 75 factor type
SBP Ail IR 1.46 1.41 1.58 1.69 1.53 1.88 1.68 1.81 1.60 2.07 ID 2.50 2.90 4.06 6.12 5.63 9.42 8.26 8.99 8.89 17.0
DBP Al1 IR 1.49 1.66 1.77 1.60 1.71 1.52 1.28 1.54 1.72 1.80 ID 2.54 3.72 5.68 5.54 6.70 6.49 3.98 7.76 10.5 12.9
BMI Al1 IR 1.26 1.36 1.72 1.67 1.34 1.26 1.21 1.42 1.29 1.73 ID 1.50 2.34 4.35 5.12 3.55 2.82 2.78 5.25 4.30 8.62
SD IR 2.08 2.61 2.67 3.89 1.83 1.23 0.85 1.29 0.81 1.15 ID 0.54 0.79 0.95 1.56 1.09 0.29 -0.3 0.47 -0.5 0.30
IR - incidence ratio; ID - incidence difference (eventd 1000 pyrs)
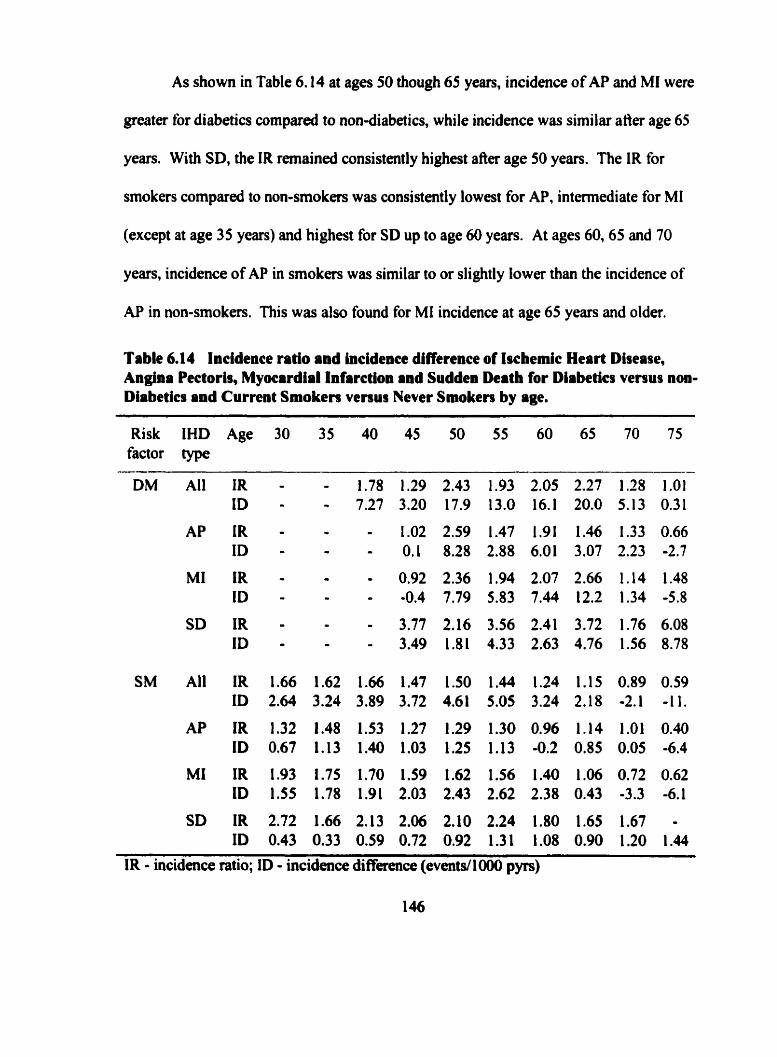
As shown in Table 6.14 at ages 50 though 65 years, incidence of AP and MI were
greater for diabetics c o m p d to non-diabetics, while incidence was similar atter age 65
years. With SD, the IR remaineù consistently highest after age 50 years. The IR for
smokers compared to non-smokers was consistently lowest for AP, intmediate for MI
(except at age 35 years) and highest for SD up to age 60 years. At ages 60,65 and 70
years, incidence of AP in srnokers was similar to or slightly lower than the incidence of
AP in non-smokers. This was also found for MI incidence at age 65 years and older.
Table 6.14 Incidence ratio and incidence difference of Iscbemic Heart Disease, Angina Pectoris, Myocardial Infarction and Suddeo Death for Diabetics versus non- Diabetics and Current Smokers venus Never Smoken by age.
Risk IHD Age 30 35 40 45 50 55 60 65 70 75 factor type
SD IR 2.72 1.66 2.13 2.06 2.10 2.24 1.80 1.65 1.67 - ID 0.43 0.33 0.59 0.72 0.92 1.31 1.08 0.90 1.20 1.44
IR - incidence ratio; ID - incidence difference (eventd1000 pyrs)
6.4.3 Cox proportional hazard modela of risk factors for Ischemic Heart Disease
The patterns observed for incidence of IHD within categories of each risk factor
just descnbed, suggest that the effect of the risk factors rnight be dependent both on age
and the specific manifestation of IHD. This was examined in detail by testing the
statistical significance of continuous values of SBP, DBP and BMI and the categorical
representation of diabetes and smoking at the ages fiom 30 to 75 years using age specific
Cox proportional hazard models. To examine the effects of each of the 5 risk factors, at
each of the IO apes, for the endpoints of IHD, AP, MI and SD, 200 Cox models were fit.
nie relative risks for disease, with 95% confidence intervals, were estimated fiom these
models for each risk factor.
For each risk factor and endpoint combination, two fùrther models were fit. First,
the changing values of an individual's risk factor measured during follow-up were
modeled using a time dependent covariate Cox proportional hazard model. Second, the
effect of aging on each nsk factor, that is, the varying effect of the risk factor with age,
was tested by assessing the significance of the inclusion of an interaction term(s) in the
model defined as the product of the risk factor and age. The likelihood ratio test was used
to test the significance of the interaction effect. The estimate of the relative risk for a
change in each risk factor, with and without interaction with age, for endpoints of IHD,
AP, MI, and SD were calculated.
Every model included the year of examination to adjust both for temporal effects
in the risk factor disîributions over time as well as the changing incidence of IHD.
6.43.1 Models of Systoiic B l d Presture and Ischemk Heart Msease
The relative risk of IHD, AP, MI and SD associated with a 10 mm Hg difference
in SBP at each five year examination age between 30 and 75 years is show in Table
6.15. A 10 mm Hg difference in SBP at age 30 years was significantly associated with a
1.13 times increased risk of IHD (95% CI: 1 .O3,1.23). At this age SBP was not
significantiy associated with AP, but the 10 mm Hg diffmce in SBP in men 30 years of
age increased the risk MI by 16% increased the risk of SD by 30%. For IHD, the
magnitude of the relative risk was 1 .17, 1.16 and 1.1 5 at ages 35,40 and 45 years,
respectively, and decreased to a smaller and non significant effect af?er age 65 years. The
relative risk associated with SBP at every age was greatest for SD, and statistically
significant at ages up to 70 years.
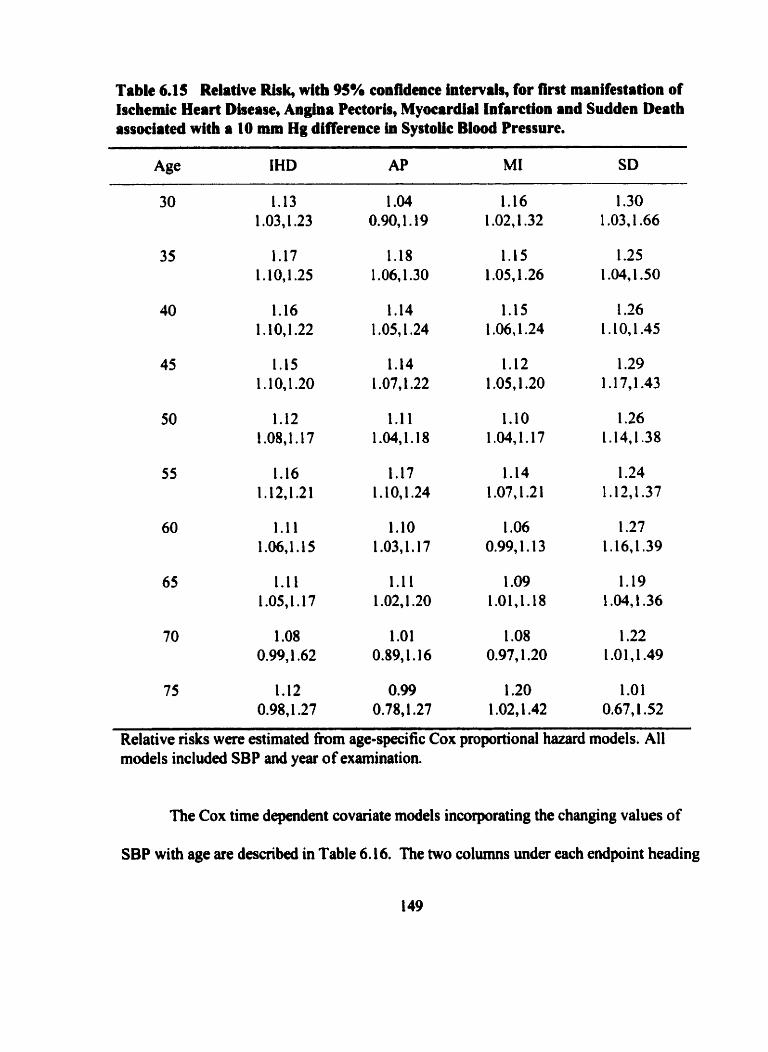
Table 6.15 Relative Risk, wlth 95% confidence Intervals, for fint manifestation of Ischemic Heart Diaeaae, Angina Pectoris, Myocardial Infarction and Sudden Death assoclateà with a 10 mm Hg difference in Systolic Blood Pressure.
Age IHD AP MI SD
Relative risks were estimated from age-specific Cox proportional hazard models. Al1 models included SBP and year of examination.
nie Cox time dependent covariate models incorporating the changing values of
SBP with age are described in Table 6.1 6. The two c o l m s under each endpoint heading
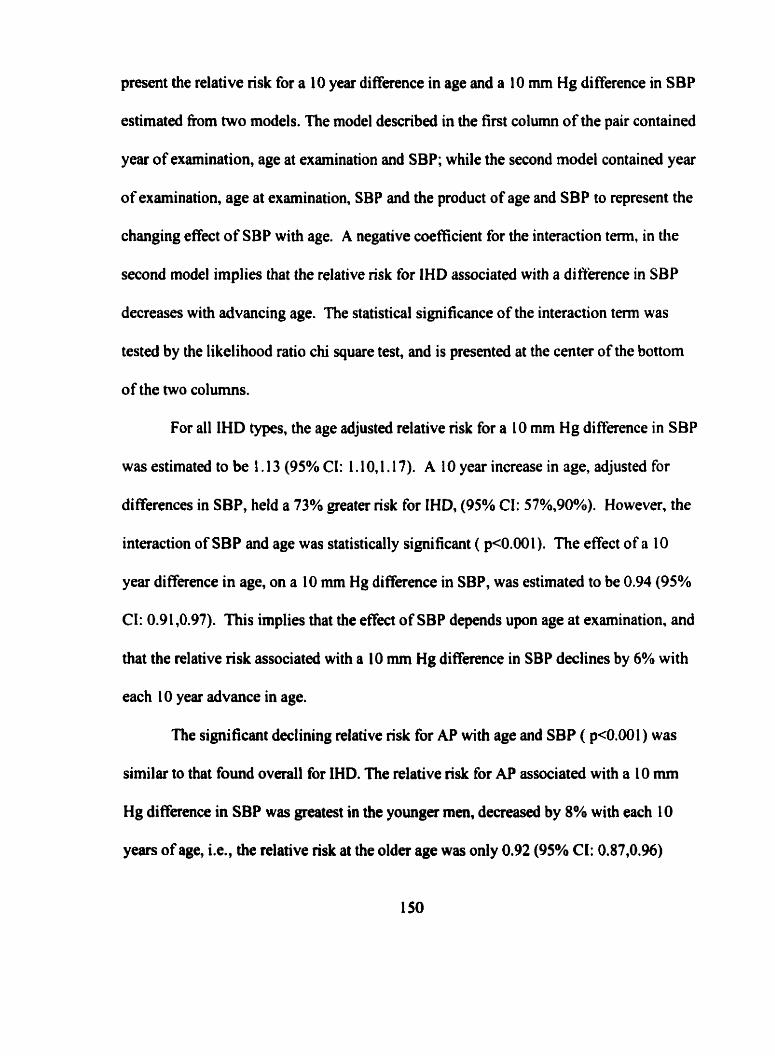
present the relative risk for a 10 year difference in age and a 10 mm Hg difference in SBP
estimated from two models. The model described in the first column of the pair contained
year of examination, age at examination and SBP; while the second model contained year
of examination, age at examination, SBP and the product of age and SBP to represent the
changing effect of SBP with age. A negative coefficient for the interaction terni, in the
second model implies that the relative risk for IHD associated with a difference in SBP
decreases with advancing age. The statistical significance of the interaction tenn was
tested by the likelihood ratio chi square test, and is presented at the center of the bottom
of the two colurnns.
For al1 IHD types, the age adjusted relative risk for a 10 mm Hg difference in SBP
was estimated to be 1.13 (95% CI: 1.10,l. 1 7). A 10 year increase in age, adjusted for
differences in SBP, held a 73% greater risk for IHD, (95% CI: 57%,90%). However, the
interaction of SBP and age was statistically significant ( p<O.OOl). The effect of a IO
year difference in age, on a 10 mm Hg diffemce in SBP, was estimated to be 0.94 (95%
CI: 0.91,0.97). This implies that the efiect of SBP depends upon age at examination, and
that the relative risk associated with a 10 mm Hg difference in SBP declines by 6% with
each 10 year advance in age.
The significant declining relative risk for AP with age and SBP ( p4l.001) was
similar to that found overall for IHD. The relative risk for AP associated with a 10 mm
Hg difference in SBP was greatest in the younger men, decreased by 8% with each I O
years of age, Le., the relative risk at the older age was only 0.92 (95% CI: 0.87,0.96)
times that of the relative risk at an age 10 years younger. This significantly decreasing
relative risk with advancing age ceased to be associated with AP after age 65 years. The
relative risk of MI did not significantly change with age with (pXl.05). A 10 mm Hg
di fference in SBP was associated with a 7% increased risk (95% CI: 2%, 1 2%) of MI.
Similarly, no trend of adjusted relative risk of SD with advancing age was apparent, as
the interaction terni for age and SBP was non-signiticant, @>O. 10). The a g adjusted
relative risk for SD of a 10 mm Hg difference in SBP, was estimated to be 1.24 (95% Cl
l.l4,1.34).
Table 6.16 Relative Risk, with 95% confidence Intervals, for a 10 mm Hg diffennce in Systoiic Blood Presgure estirnitcd from time dependent Cor proportional bazard models.
---
Variable Ischemic Heart Angina Pectoris Myocardial Sudden Death Discase Infarction
Age at 1.73 3.95 1.78 6.16 1.69 3.02 1.70 2.20 examination 1.57,1.90 2.55,6.10 1.54,2.06 3.22J1.8 1.47,1.95 1.55,5.90 1.30.2.23 0.69.6.98 (10 year
difference)
SBP 1.13 1.62 1.16 1.20 1 .O7 1.38 1.24 1.38 (10 mm Hg 1.10,l. 17 1.34J.94 1.11.1.22 1.5 l,2.S8 1.02,l. 12 1.04.1.84 l.M,l.34 O.86,2.2 1 difference)
-2 In L (df) 206.7 (3) 22 1.2 (4) 1 1 1,2 (3) 125.6 (4) 62.7 (3) 65.8 (4) 45.4 (3) 45.6 (4)
Test for interaction
X' (do 14.5 (1) 14.4 (1) 3.1 (1) 0.2 (1) p-value <0.001 <0.00 1 N.05 >o. 10
A main effects mode1 with year, age and SBP and a second mode1 including the age by SBP interaction tenn were fit for IHD, AP, MI and SD endpoints.
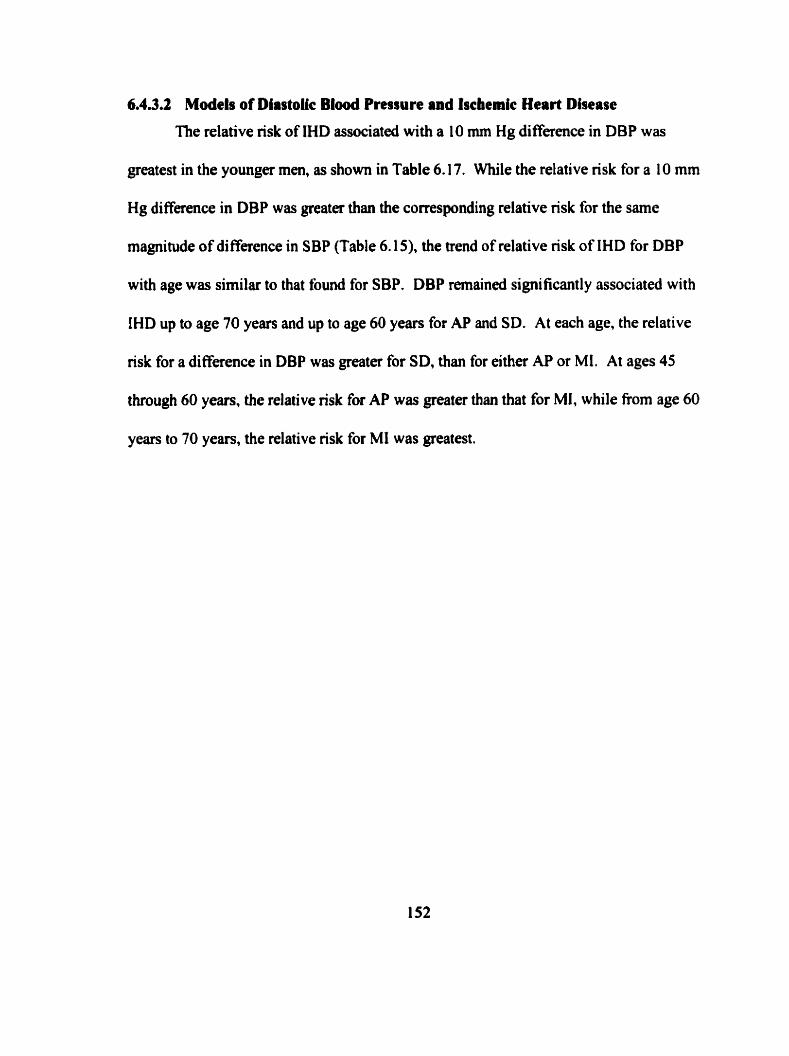
6,4.3,2 Models of Diastolic Blood Pressure and Iscbemic Heart Disease
The relative risk of IHD associated with a 10 mm Hg difference in DBP was
greatest in the younger men, as s h o w in Table 6.17. While the relative risk for a 1 O mm
Hg difference in DBP was greater than the corresponding relative risk for the sarne
magnitude of di &ence in SBP (Table 6.1 5). the trend of relative risk of IHD for DBP
with age was similar to that found for SBP. DBP remained significantly associated with
IHD up to age 70 years and up to age 60 years for AP and SD. At each age, the relative
risk for a difference in DBP was greater for SD, than for either AP or MI. At ages 45
through 60 years, the relative risk for AP was greater than that for MI, while from age 60
years to 70 years, the relative risk for MI was greatest.
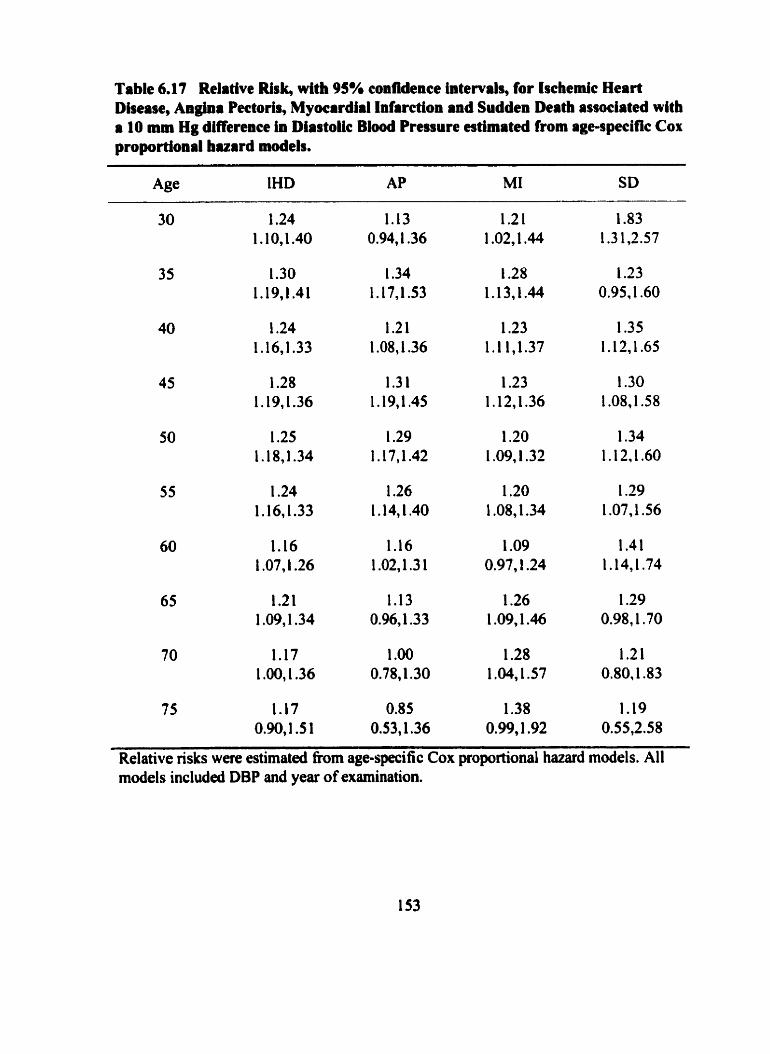
Table 6.17 Relative Risk, with 95% confidence intervals, for Ischemic Heart Dhease, Angha Pectoris, Myocardiil Infarction and Sudden Death associated with a 10 mm Hg differeace in Dlastoiic Bload Pressure estimated from age-specinc Cor proportional buard models.
75 1.17 0.85 1.38 1.19 0.90,l.S 1 0.53,1.36 0.99,1.92 0.55,2.58
Relative nsks were estimated from age-specific Cox proportional hazard models. Al1 models included DBP and year of examination.
A significantly decreasing relative risk of IHD with age was apparent as for DBP,
as show in Table 6.18. The age by DBP interaction was negative and statistically
significant @<0.0 I ), with the effect of a 10 mm Hg difference in DBP on risk of IHD
estimated to decrease by 8% (relative nsk = 0.92,95% CI: 0.87,0.97) with each 1 O years
of age. The relative risk of AP associated with a 10 mm Hg difference in DBP decreased
with advancing age by 9% (relative risk = 0.9 1, 95% CI: 0.84,0.98) with each 10 years of
age. An 1 1% decrease in relative risk of MI associated with a 10 mm Hg difference in
DBP (relative risk = 0.89,95% CI: 0.82,0.97) was found for each I O years of age, in
contrast to a non-significant decreasing relative risk with age for SBP and MI. No
significant trend with age for a changing effect of the relative risk br SD with DBP was
apparent @>O. 10). The relative risk of SD of a 10 mm Hg difference in DBP, over al1
ages, was estimated to be 1.29 (95% CI 1.10,l S2).
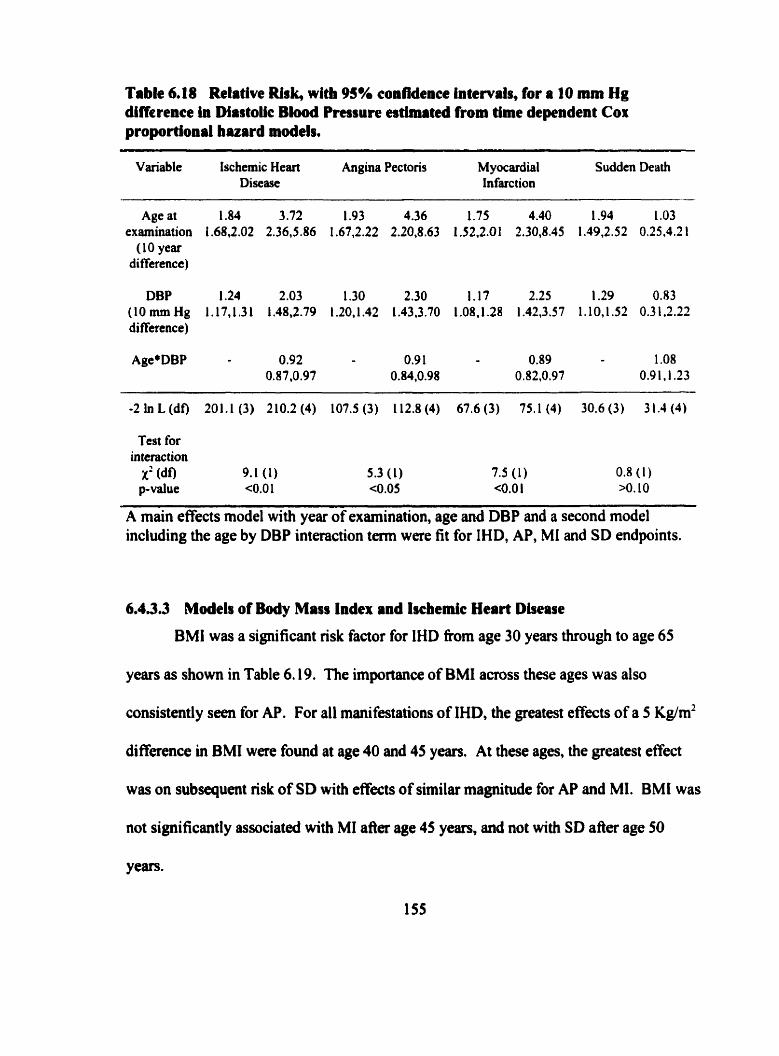
Table 6.18 Relative Rirk, witb 95% confidence intewab, for a 10 mm Hg dlffennce in DiastoL B l d Pressure estirnitcd from time dependent Cor proportional huard models.
Variabt e Ischernic Heart Angina Pectoris M yocdial Sudden Deiith Disease Infarction
Age at 1.84 3.72 1.93 4.36 1-75 4.40 1.94 1 .O3 examination 1.68,2.02 2.36,5.86 1.67,2.22 2.20,8.63 1.52.2.01 S.30,8.45 1.19,2.52 0.2S4.21
( 1 O year difference)
DBP 1.24 2.03 1 .30 2.30 1.17 2.25 1 -29 0.83 (10 mm Hg 1.17,1.31 1.48,2.79 1.2O,l.42 1.43.3.70 1.08.1.28 1.42,3.57 1.10J.52 0.3L2.22 di fference)
Age' DBP 0.92 0.9 1 0.89 1 .O8 0.87,0.97 0.84,0.98 0.82,0.97 0.9 1,1.23
Test for intcrac tion
x2 (df) 9.1 (1) 5.3 (1 ) 7.5 ( 1 ) 0.8 (1) p-value c0.0 1 <O.OS c0.0 1 >o. 10
A main effects model with year of examination, age and DBP and a second model including the age by DBP interaction term were fit for IHD, AP, MI and SD endpoints.
6.43.3 Modeb of Body Maas Index and Ischemlc Heart Disease
BMI was a significant risk factor for IHD h m age 30 years through to age 65
years as shown in Table 6.19. The importance of BM1 across these ages was also
consistently seen for AP. For al1 manifestations of IHD, the greatest effects of a 5 Kg/m2
difference in BMI were found at age 40 and 45 years. At these aga, the greatest effect
was on subsequent risk of SD with effects of similar magnitude for AP and MI. BMI was
not significantly associated with MI a b age 45 years, and not with SD after age 50
years.
There was no evidence of any age effect on the magnitude of the relative risk for
IHD associated with BMI (p>0.90), as shown in Table 6.20. Overall, the effect of a
difference in 5 kg/m2 in BMI carried with it a 26% increased nsk of IHD (95% CI:
14%,40%). There was no evidence of any age effect on the magnitude of the relative nsk
associated with BMI @>O. 1 O) and AP, where a difference in 5 kg/m2 in BMI camed with
it a 30% increased nsk of AP over al1 ages (95% CI: 9%,54%). The effect of BM1 on risk
of MI was significant at younger ages, 40 and 45 years. A 5 kg/m2 di fference in BMI at
age 40 can=ied with it a 34% increased nsk of MI, and a 25% increased risk at age 45
years. There was no evidence of any age effect on the magnitude of the relative risk
associated with BMI (p>0.90). Overall a relative risk of 1.22 (95% CI: 1.04.1.43) was
estimated. The effect of BMI on nsk of SD was significant at young ages, from 35 years
up to 50 years. The relatively constant effect a 5 kg/m2 difference in BMI canied with it
an increased risk of SD estimated to be 1.28 (95% CI 0.93,1.76) with no evidence of any
age effect on the magnitude of the effect of BMI @>O. 10).
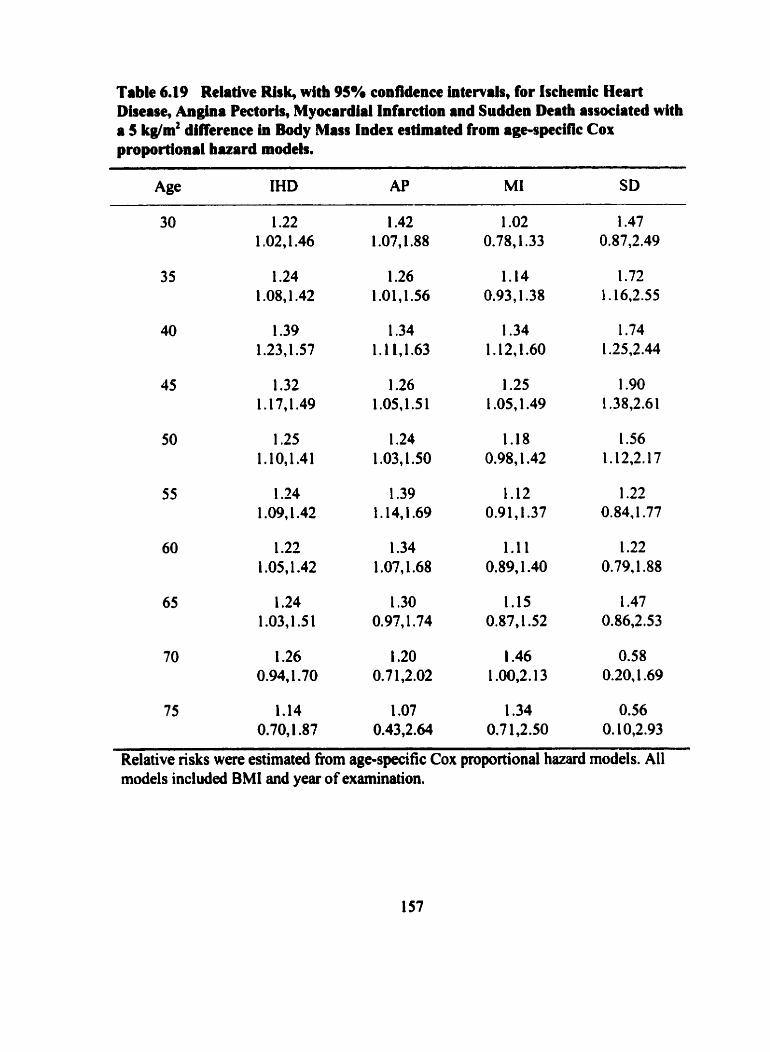
Table 6-19 Relative Rlsk, with 95% confldcnce intervals, for Ischemic Heart Disease, An- Pectoris, Myocardial Infirction and Sudden Death associated with a 5 kglm2 difference in Body Mass Index estimateci from age-speclflc Cox proportional huard models.
Age IHD AP MI SD
Relative risks were estimated fiom age-specific Cox proportional hazard models. Al1 models included BMI and year of examination.
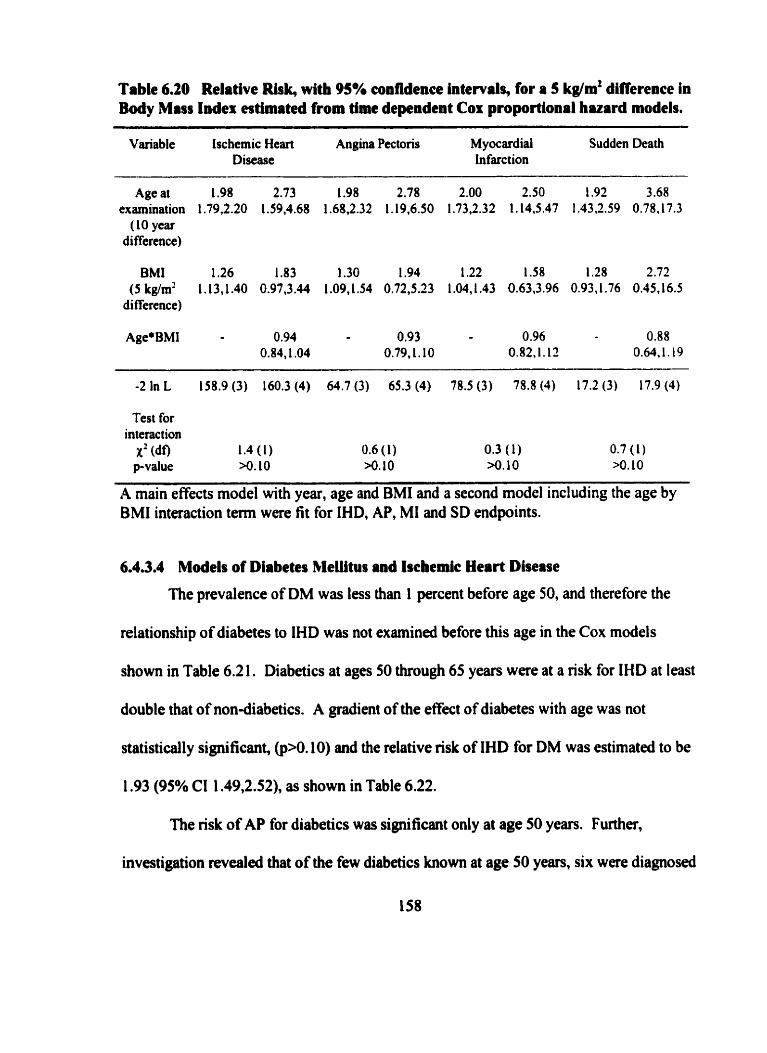
Table 6.20 Relative Risb with 95% confidence intewals, for a S kg/m2 difference in Body Mass Indes estimated from tirne dependent Cor proportional huard models.
Variable Ischemic Heart Angina Pectoris M yocardial Sudden Death Disease Infarction
Age at 1.98 2.73 1.98 2.78 2.00 2.50 1.92 3.68 examination 1.79.2.20 1.59.4.68 1.68J.32 1,19,6.50 1.73,2.32 1.14,5.47 I .J3,2.59 0.78.17.3
( 10 year di fference)
BMI 1.26 1.83 1.30 1.94 1.22 1 .58 1.28 2.72 (5kg/m2 L.13,1.40 0.97,3.44 1.09,1.54 0.72,5.23 1.04,1.43 0.63.3.96 0.91.1.76 0.45.16.5
di fference)
Test for interaction
X' (df) 1.4 ( 1 ) 0.6 ( 1 ) 0.3 ( 1) 0.7 (1) p-value >o. 10 >O. I O >o. 10 >O. 10
A main effects model with year, age and BMI and a second model including the age by BMI interaction t e m were fit for IHD, AP, MI and SD endpoints.
6.4.3.4 Models of Diabetes MeIlitus and Ischemic Heart Disease
The prevalence of DM was less than I percent before age 50, and therefore the
relationship of diabetes to IHD was not examined before this age in the Cox models
show in Table 6.2 1. Diabetics at ages 50 through 65 years were at a risk for IHD at least
double that of non-diabetics. A gradient of the effect of diabetes with age was not
statistically significant, @>O. 10) and the relative risk of IHD for DM was estimated to be
1.93 (95% CI 1.49,2.52), as show in Table 6.22.
The risk of AP for diabetics was significant only at age 50 years. Further,
investigation revealed that of the few diabetics known at age 50 years, six were diagnosed
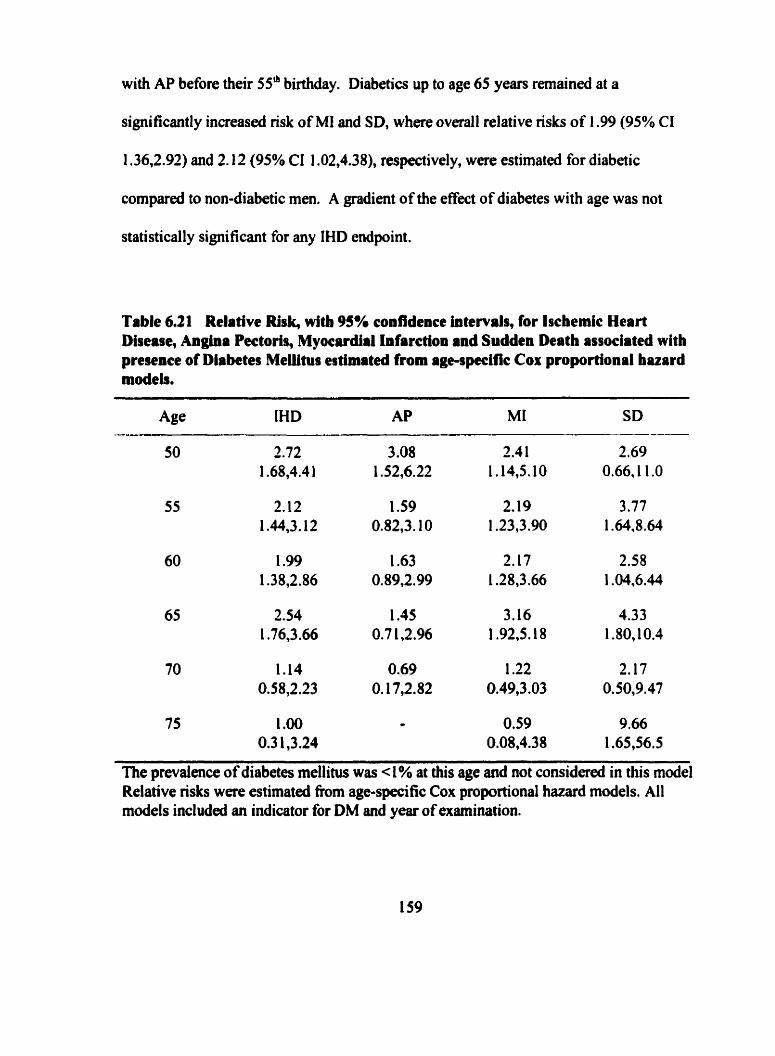
with AP before their 55' birthday. Diabetics up to age 65 years remaineci at a
significantly increased risk of MI and SD, where overall relative risks of 1.99 (95% CI
1.36,2.92) and 2.12 (95% CI 1.02,4.38), respectively, were estimated for diabetic
compared to non-diabetic men. A gradient of the effect of diabetes with age was not
statistically significant for any IHD endpoint.
Table 6.21 Relative Ri&, with 95% confidence intewals, for tschemic Heart Dhease, Angina Pectoris, Myocardirl Infarction and Sudden Death associated with presence of Diabetes MeMtus estimateà from age-specifjc COI( proportional hazard mdeb.
75 1 .O0 - 0.59 9.66 0.3 1,3.24 0.08,4.38 1.65,56.5
The prevalence of diabetes mellitus was -4% at this age and not considered in this mode1 Relative nsks were estimated fiom age-speci fic Cox proportional hazard models. Al1 models included an indicator for DM and year of examination.
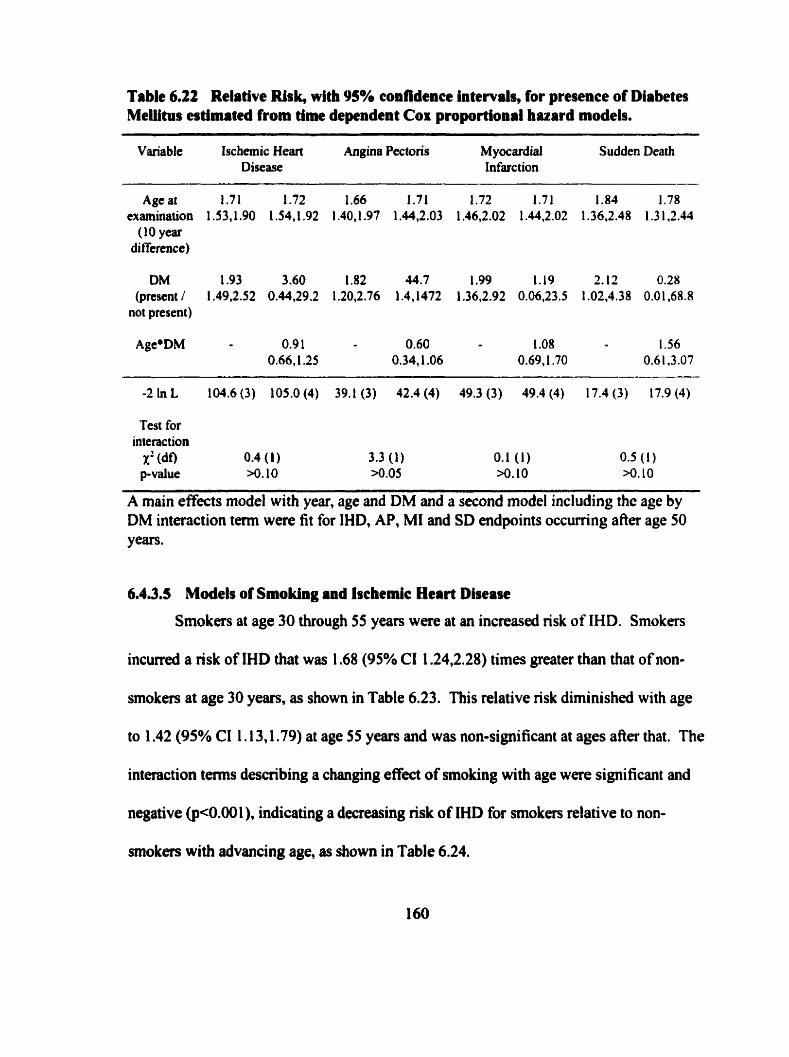
Table 6.22 Relative Risk, with YS% confidence intervals, for presenee of Diabetes Meüitus atimated from time dependent Cox proportional huard models.
Variable Isc hemic Heart Angina Pectons M yocardial Sudden Death Disease Infarction
Age at 1.71 1.72 1.66 1.71 1.72 1.71 1.84 1.78 examination 1 .S3,1.90 1 .54,1.92 1.40,1.97 1.44,2.03 1.46,2.02 1.44,2.02 1.36.2.48 1.3 1.2.44
( 10 year di ffcrence)
DM 1.93 3.60 1.82 44.7 1.99 1.19 2.12 0.28 (prcsent / 1.49.2.52 0.44,29.2 1.20,2.76 1.4,1472 1.36,2.92 0.06,23.5 1.02.4.38 0.01.68.8
not present)
Test for interaction
X' (df) 0.4 (1) 3.3 (1) 0.1 (1) 0.5 ( 1 ) p-value >o. IO *.O5 >O. 10 >o. 10
A main effects model with year, age and DM and a second model including the age by DM interaction tm were fit for IHD, AP, MI and SD endpoints occurting afier age 50 years.
6.4.3.5 Models of Smoking and bchemic Heart Disease
Smokers at age 30 through 55 years were at an increased risk of IHD. Smokers
incwred a risk of IHD that was 1.68 (95% CI 1.24,2.28) times greater than that of non-
smokers at age 30 years, as shown in Table 6.23. This relative nsk diminished with age
to 1.42 (95% CI 1.13,1.79) at age 55 years and was non-significant at ages after that. The
interaction ternis describing a changing effcct of smoking with age were significant and
negative (p<O.ûû l), indicating a decreasing risk of IHD for smokers relative to non-
smokers with advancing age, as shown in Table 6.24.
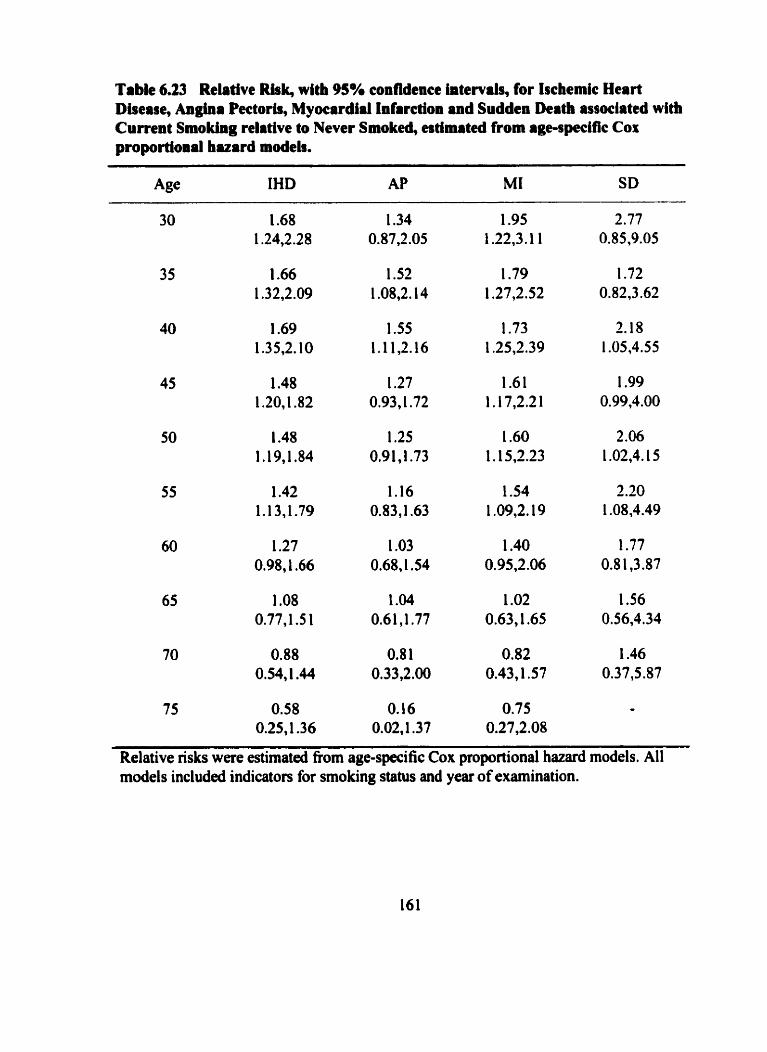
Table 6.23 Relative Ris4 with 95% confidence intervals, for Isckmic Heart Disease, Anglna Pectoris, Myocardial Infrrction and Sudden Deatb associated with Curtent Smoking relative to Never Smoked, estimated from age-specific Cox proportional huard models.
Age IHD AP MI SD
75 0.58 O. 16 0.75 - 0.25,1.36 0.02,1.37 0.27,2.08
Relative risks were estimated fiom age-specific COK proportional hazard models. Al1 models included indicators for smoking status and year of examination.
Smokers at younger ages, age 35 and 40 years, were at a risk of AP about one and
a half times greater than men who had never smoked. The interaction tems for age and
smoking were non-significant @>O. 10). supporting evidence for a constant but non-
significant effmt of smoking on risk of AP with advancing age. Overall, a risk ratio of
1.23 (95% CI 0.90,1.68) was estimated for smoking and AP, but non significant,
suggesting that smoking over al1 ages, specifically from age 50 years or older, was not
significantly associated with an increased risk of AP. Men who smoked up to age 55
years were at an increased risk of MI. Smokers incurred a risk of MI that was almost iwo
fold greater than nsk for non-smokers at age 30 years. This relative risk diminished with
age and was non-significant afier age 55 years. The interaction term for age and smoking
on risk of MI was significant and negative ( ~ ~ 0 . 0 0 1 ), indicating a significantly
decreasing nsk of MI for smokers relative to non-smokers with advancing age. Between
ages 40 and 55 years, smokers were at an increased nsk of SD about 2 times greater than
non-smokers, and greater than the risk associated with any other manifestation of IHD.
This relative risk diminished with age and was non-signi ficant aAer age 55 years. The
interaction tenns for age and smoking were sipificant and negative (pc0.00 1 ), indicating
a significantly decreasing nsk of SD for smokers relative to non-smokers with advancing
age.
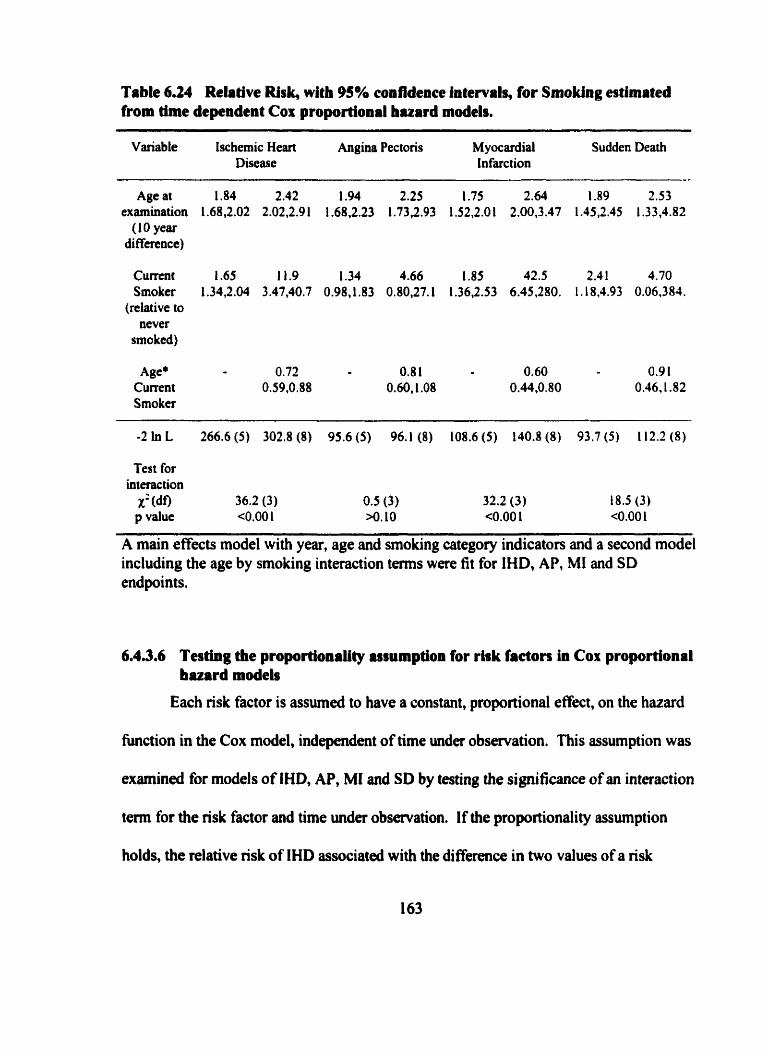
Table 6.24 Relative Risk, witb 95% confidence htervah, for Smoking eatimated from thne dependent Cox proportional huard models.
Variable Ischemic Heart Angina Pectoris M yocardial Sudden Death Disease Infatction
Age at 1.84 2.42 1.94 2.25 1.75 2.64 1.89 2.53 examination 1.68,2.02 2.02,2.91 1.68,2.23 1.73,2.93 1.52,2.01 2.00,3.47 1.45,2.45 1.33,4.82
( 1 O year differcncc)
C u m t 1.65 11.9 1.34 4.66 1.83 42.5 2.4 1 4.70 Smoker 1.34,2.04 3.47,40.7 0.98J.83 0.80,27.1 1.36,2.53 6.45.280. 1.18,4.93 0.06,381.
(relative to never
smoked)
Age* 0.72 0.8 1 0.60 0.9 1 Current 0.59,0.88 0.60,l .O8 0.44,0.80 0.46,1.82 Smoker
Test for interaction
X: (do 36.2 (3) 0.5 (3) 32.2 (3) t 8.5 (3) p value <O,OO 1 >o. 10 ~ 0 . 0 0 1 <O.OO 1
A main effects model with year, age and smoking category indicators and a second model including the age by smoking interaction ternis were fit for IHD, AP, MI and SD endpoints.
6.4.3.6 Testhg the proportionaiity urumption for rhk factors ia Cox proportional bazard models
Each risk factor is assurned to have a constant, proportional effect, on the hazard
h c t i o n in the Cox model, independent of time under observation. This assumption was
examinai for models of IHD, AP, MI and SD by testing the significance of an interaction
term for the risk factor and time under observation. If the proportionality assumption
holds, the relative risk of IHD associateû with the differrnce in two values of a risk
factor, determined at one point in time, will remain constant over the time period
modeled.
With IHD, the proportional hazards assumption for SBP and DBP held at al1 ages
after 40 years, except age 60 years for SBP and 75 years for DBP (p-values at these ages
between 0.01 and 0.05). The interaction with BMI and time was non-significant (al1
p>O.O5) for BMI at exams after age 35 as well as for dl models of DM (except at age 60
years). The proportionality assumption for smoking was significant (p<0.05) at younger
ages, up to age 50 years, suggesting a changing effect of smoking status at younger ages
on risk of IHD. Thus, the relative nsk of IHD estimateà at most older ages for the risk
factors determined at these ages can be assumed to be constant over the entire follow-up
interval.
The tests for the proportionality assumption of the hazard function for AP were
non-significant (al1 pO.05) for BMI at al1 ages except at age 35 years. The proportional
hazards assumption for SBP and DBP held after age 45 years for SBP and DBP. The
proportionality assumption held for smoking effects at al1 aga . Thus, the relative risk of
AP estimated at most older ages for the risk factors examined can be assumed to be
constant over the entire follow-up interval.
The tests for the proportionality assumption of risk factors and MI were
significant (pC0.05) pnor to age 45 for SBP and pnor to age 40 for DBP. The test for the
proportional hazords assumption for smoking and MI was significant @<O.OS) for
smoking at younger ages, up to age 50 years, suggesting that the effects of these facton at
younger ages might be changing with longer follow-up.
The tests for the proportionality assumption of the hazard function for SD were
non-significant (al1 p>0.05) for BMI and DM. The proportional hazards assumption for
SBP and DBP held at al1 ages, except age 50 years for DBP. Thus, the relative risk of SD
estimated at most ages for the risk factors examined can be assumed to be constant over
the entire follow-up interval.
6.4.3.7 Summary of modeling iging effects on risk factors for Iscbcmic Heart Disease
A surnrnary of the results of the age-specific models of the five risk facton for
IHD and its three specific manifestations appear in Table 6.25. Blood pressure, both SBP
and DBP, are significant risk factors for IHD and each of its manifestations. The effect
on IHD and AP of any constant difference, either in SBP or DBP, with advancing age
was significantly declining. The effect SBP and DBP have on risk of SD did not
significantly change with age. Both rernained important risk factors for SD through to
age 65 years. 'T'here was a declining effect with age for DBP and MI, but a constant
effect with age for SBP and MI. The eflect of BMI on risk of IHD did not significantly
change with age. The effect of BMI was most apparent for AP, where a 5 kkg/m2
difference in BMI i n c d a 1.30 increascd nsk. BMI was not statistically significant
over al1 ages for SD. Smoking had a declining efkct with age for IHD. The effect of
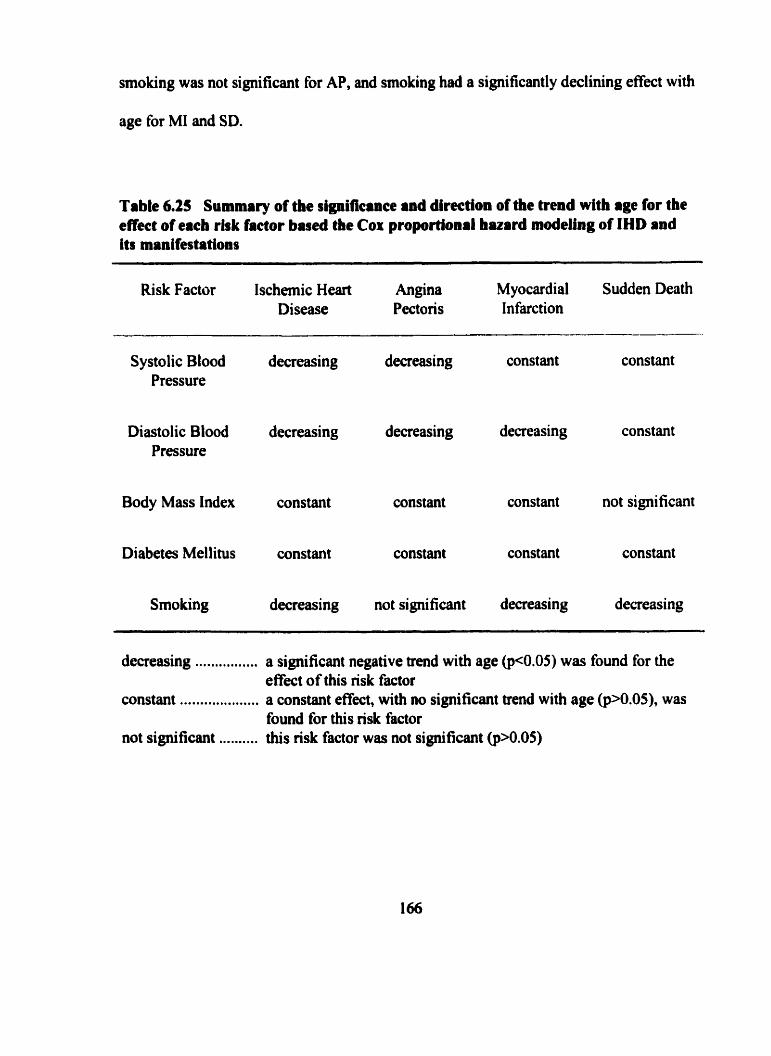
smoking was not significant for AP, and smoking had a significantly declining effect with
age for MI and SD.
Table 6.25 Summary of the signitieinee and direction of the trend with rge for the effcet of eicb risk factor based tbe Cor proportioaal huard modeling of IHD and i t s manifestations
Risk Factor Ischernic Heart Angina Myocardial Sudden Death Disease Pectoris Infarction
Systolic Blood decreasing decreasing constant constant Pressure
Diastolic Blood decreasing decreasing decreasing constant Pressure
Body Mass Index constant constant constant not significant
Diabetes Mellitus constant constant constant constant
Smoùing decreasing not signi ficant decreasing decreasing
decreasing . . . . . . . . . . . . . . . . constant ... . . .. ... .. . .... . . . not significant . . .... . . . .
a significant negative trend with age @<0.05) was found for the effect of this risk factor a constant effect, with no significant trend with age @>0.05), was found for this risk factor this risk factor was not significant (pN.05)
6.4.4 Multivariate Cox proportional huard modeling of risk factors for lschemic Heart Disease
In order to assess the joint independent effect of the nsk factors at each age fiom
30 to 75 years, the best fitting forward stepwise multivariate Cox proportional hazard
models for IHD, AP, MI and SD were deterrnined. Estimates of the relative risk with
95% confidence intervals were calculated for significant parameters. Year of
examination was included in al1 models.
6.4.4.1 Age specilc multivariate models for lschemic Heart Disease
As shown in Table 6.26, DBP was significant in forward stepwise models of IHD
up to a p 50 years, where after SBP was statistically significant to ûge 70 years. Thus,
blood pressure was important in al1 multivariate models up to age 70 years. At younger
ages, 40,45 and 55 years, BMI was significant in the stepwise models of IHD. At ages
50 through 65 years DM contnbuted significantly to these models. Smoking was
statistically significant in models up to age 55 years, with currcnt smokers at a
sipificantly increased nsk of IHD relative to those who never smoked, and former
smokers at no increased risk of IHD relative to those who never smoked.
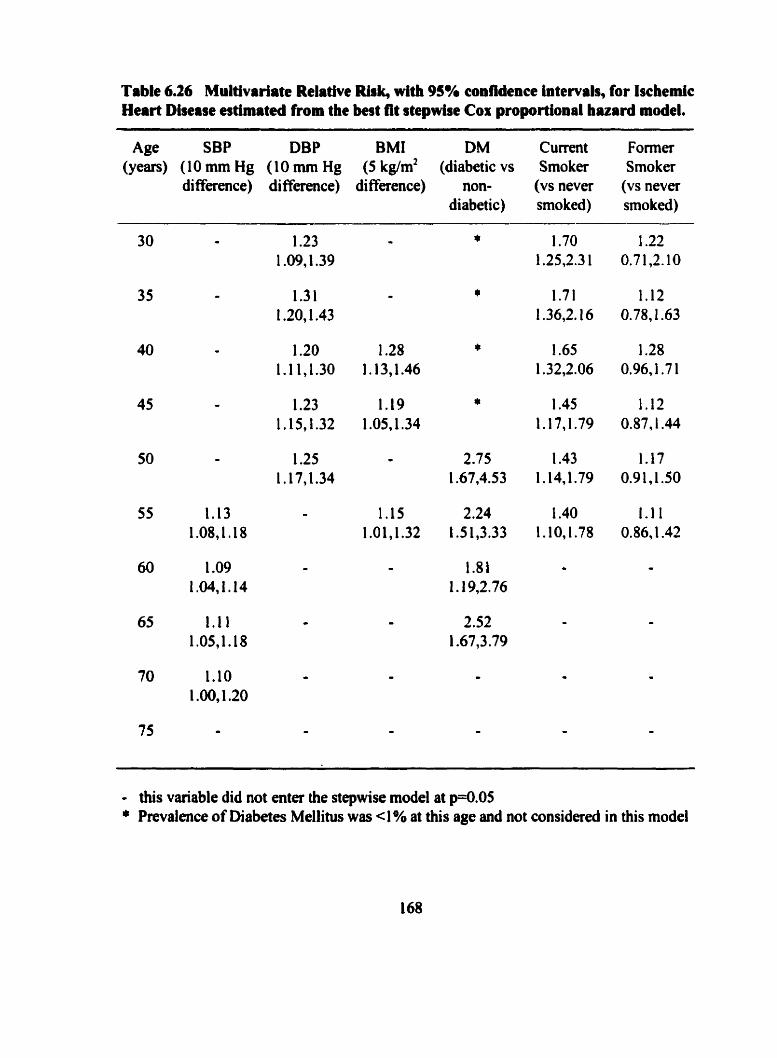
Table 6.26 Multivrriite Relative Risk, with 95% confidence intewak, for lschemic Hart Disease estimateà from the best fit stepwise Cor proportional huard model.
Age SBP DBP BMI DM Current Former (years) (10 mm Hg (10 mm Hg (5 kg/m2 (diabetic vs Smoker Smoker
diffaence) diffaence) difference) non- (VS never (vs never diabetic) smoked) smoked)
- this variable did not enter the stepwise mode1 at p=0.05 + Prwalence of Diabetes Mellitus was cl % at this age and not c o n s i d d in this model
6.4m42 Age spccific multivariate models for Angina Peetoris
In stepwise models for AP, DBP was found to be more important in contrast to
SBP at younger ages, up to age 50 years, with SBP significant in models at age 55 and 65
years, as shown in Table 6.27. AAer age 65 years of age, neither SBP nor DBP added
significantly to the modeling of AP. BMI contributed significantl y to the stepwise
rnodels of AP at younger ages, age 30 and 40 years as well as at later ages, 55 and 60
years. DM was only significant at age 50 years of age. The significance of DM for AP at
this age was highly influenced by 6 diabetics who had an AP diagnosis in their early SOS.
Smoking was statistically significant in rnodels of AP only at age 35 and 40 years, afler
which time the nsk of AP for smokers relative to non-smokers was not statistically
significant. No variables were significant in models at age 70 or 75 yedrs.
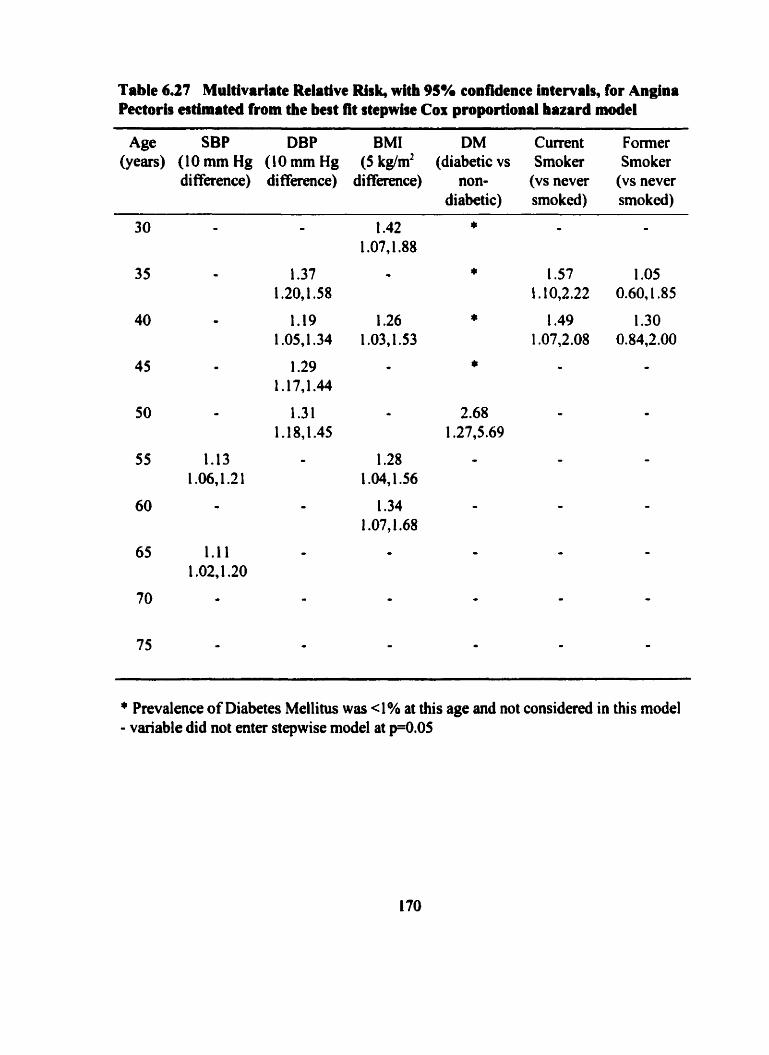
Table 6.27 Multivarlrte Relative Risk, with 95% confidence intervals, for Angina Pectorh estimitecl from the best lit stepwise Cox proportional hazard model
Age SBP DBP BMI DM Current Former (years) (IO mm Hg ( IO mm Hg (5 kglm2 (diabetic vs Smoker Smoker
difference) difference) diffefetlce) non- (vs never (vs never diabetic) smoked) smoked)
* Prevalence of Diabetes Mellitus wos < 1 % at this age and not considerd in thi s model - variable did not enter stepwise model et pO.05
6.4.4.3 Age speeific multivariate for Myocardiil Infarction
As shown in Table 6.28, generally DBP was found to be more important than SBP
in models for MI. BMI was significant only at age 40 years. The significance nt ages 50
through 65 years of DM was most important for MI, with diabetics being at more than
twice the risk of MI compared to non-diabetics. Smoking was statistically significant in
models of MI up to age 50 years of age, with smokers being at at least a 50% greater risk
of MI relative to non-smokers.
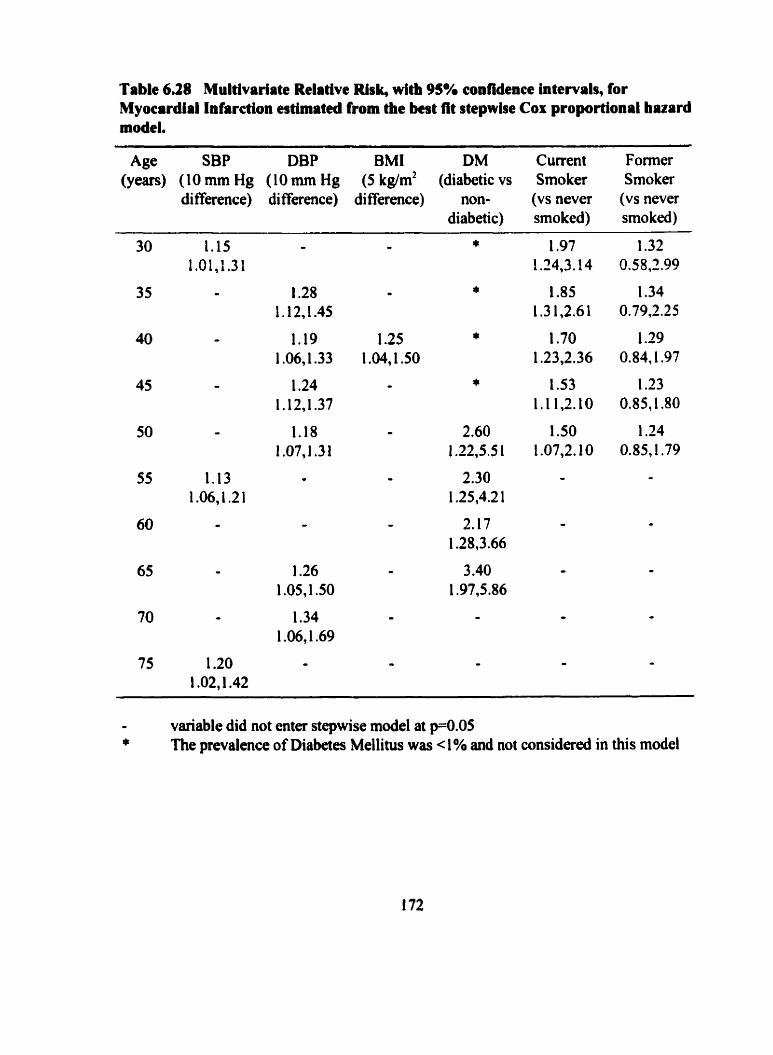
Table 6.28 Multivariate Relative Risk, with 95% confidence intervals, for Myocardial Infarction estimated from the best fit stepwbe Cor proportional hazard model.
Age SBP DBP BMI DM Current Former (years) (IO mm Hg (IO mm Hg (5 kg/m2 (diabetic vs Smoker Srnoker
difference) difference) difference) non- (VS never (vs never diabetic) smoked) smoked)
- variable did not enter stepwise mode1 at p=0.05 * The prevalence of Diabetes Mellitus was < 1% and not considered in this mode1
6.4.4.4 Age speeific multivariate models for Sudden Death
SBP rather than DBP was more strongly associated with SD at ages from 40
through 65 years, as shown in Table 6.29. BMI was signifiant in the stepwise models of
SD up to age 45 years. Diabetics at ages 55 and 65 years were at significantly increased
risk of SD. Current smokers at ages 40 and 55 years were at a greater nsk of SD relative
to non-smokers, while former smokers were at no significantly increased tisk of SD over
those who never smoked. None of the risk factors were significantly associated with SD
at age 70 or 75 years.
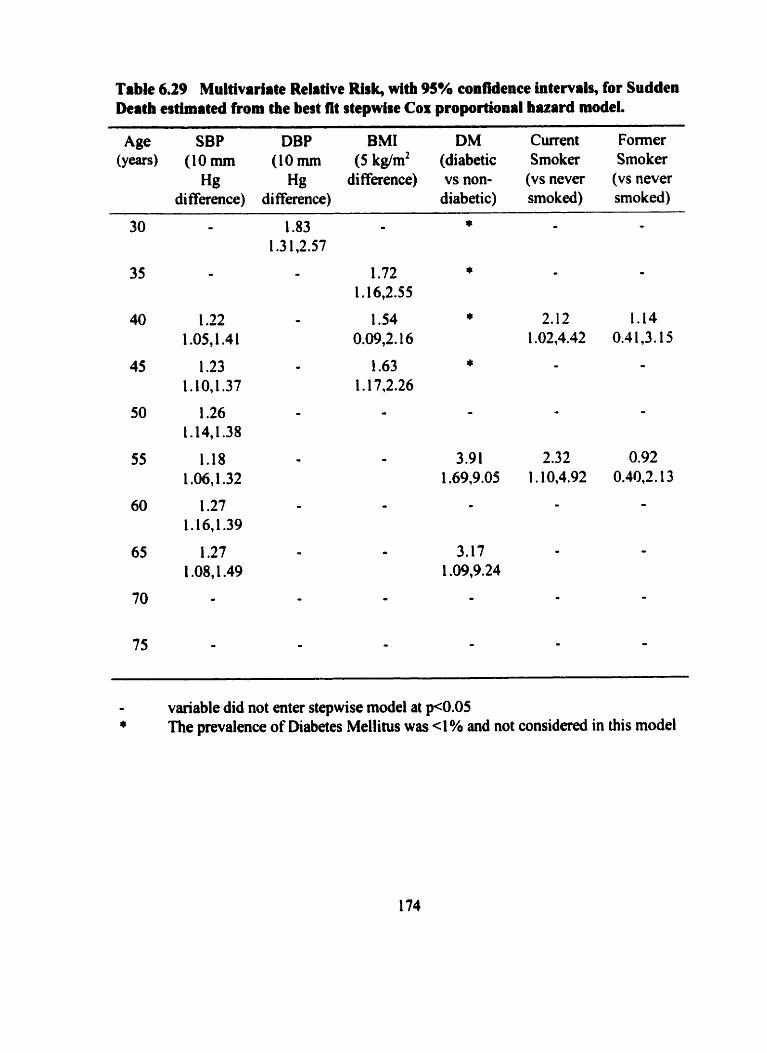
Table 6.29 Multivariate Relative Risk, with 95% confidence intervals, for Sudden Deitb estimated from the begt fit stepwise Cor proportional huard model.
Age SBP DBP BMI DM Current Former (y-) (1Omm (1Omm (5kg/m2 (diabetic Smoker Smoker
Hg Hg difference) vs non- (vs never (vs never diffaence) di fference) diabetic) smoked) smoked)
variable did not enter stepwise model at p<O.O5 * The prevalence of Diabetes Mellitus was 4% and not considered in this mode1
6.4.4.5 Summary of multivariate modeling of risk factors for Ischemic Heart Dlsease
The relative independent importance of these risk factors for IHD and each
manifestation of IHD at the age from 30 to 75 years are sumrnarized in Table 6.30. BP
was an important risk factor in models of IHD up to age 70 years. DBP was the BP to
enter stepwise modeis up to age 50 and SBP became a more powerful BP variable in
models for IHD fiom age 55 through to age 70 years. However, a diminishing effect of
either BP measurement was found with advancing age. While DBP was more important
than SBP in models for AP and MI at younger ages, SBP was the more important of the
two at ages 40 through 65 years for SD.
BMI at younger ages, 35 and 40 years, was found to be significantly associated
with IHD. At age 40 years, BMI significantly contributed to al1 four models of IHD
endpoints. BMI at ages 35,40 and 45 years also was significant in models of SD. Again
at age 55 and 60 years, higher BMI incurred a greater risk of IHD, specifically for AP.
DM in the four age specific models from age 50 through 65 years had a consistent
and significant independent association with MI. Only at age 50 years did DM contribute
to a modcl for AP and at ages 55 and 65 years for SD.
Smoking at age 30 years was significant in models for IHD, MI and SD, and from
age 35 years for AP. By age 60, the effect of smoking had diminished to be no longer
independently statistically significant in models for IHD or any of the manifestations.
The independent contribution of smoking was only significant in models for AP up to age
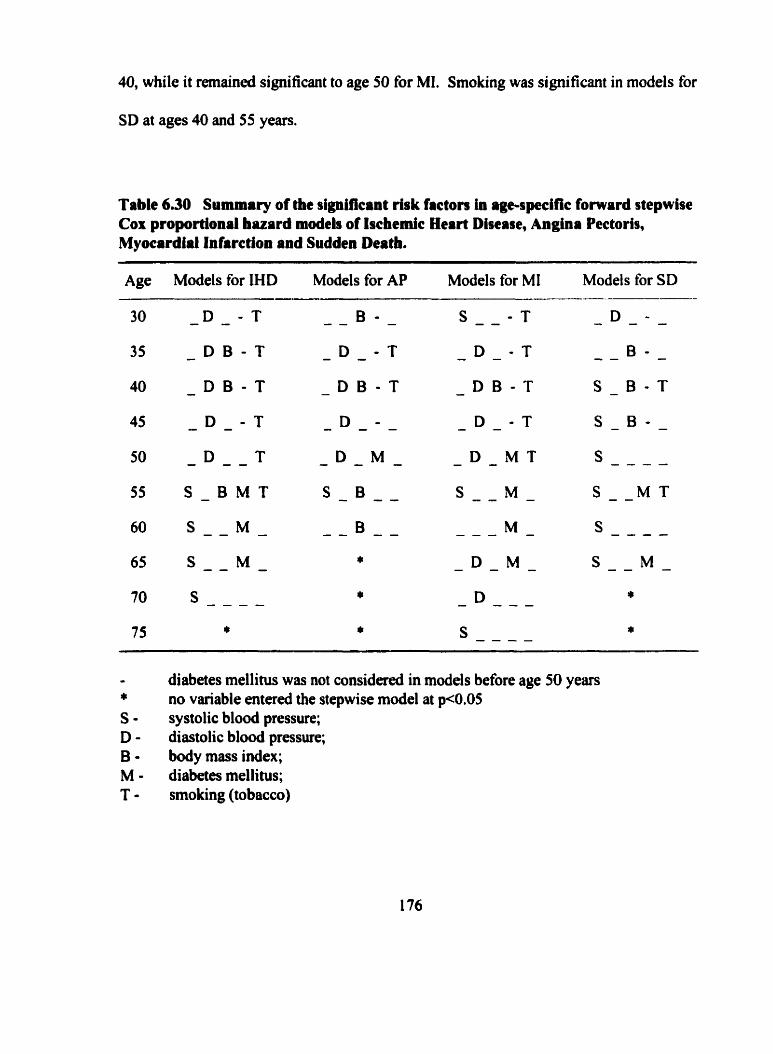
40, while it rernained significant to age 50 for MI. Smoking was significant in models for
SD at ages 40 and 55 years.
Table 6.30 Sunmary of the significant risk factors in age-spific fomard stepwise Cox proportional bazard moâeb of Ischemic Heart Disease, Angina Pectoris, Myocardial Infarction and Sudden Deatb. --- - - -
Age Models for IHD Models for AP Models for MI Models for SD
- D - M T
s - - M -
- - - M -
- K M -
- D - - -
s - - - -
I diabetes mellitus was not considered in models before age 50 years r~ no variable entered the stepwise mode1 at p<0.05 S - systolic blood pressure; D - diastolic blood pressure; 6 - body mass index; M - diabetes mellitus; T - smoking (tobacco)
6.5 Tracking rlsk facton in individuals and incidence Ischemic Heart Disease
6.5.1 Level, trend and variabüîty of continuous risk factoton
It has been earlier described that IHD was detected in cohort members at ages as
young as 30-34 years, and that incidence of IHD increased with age in this cohort at least
until age 80-84 years. Also, it has been shown that some of the traditional risk facton for
IHD, specifically SBP, DBP and smoking have effects that tend to decrease in magnitude
and statistical significance with age. The effect of BMI on incidence of IHD was most
pronounced at younger ages. Evidence for tracking of SBP, DBP and BMI has been
established, both in the lower end and upper end of their distributions, and specifically
from younger ages, before age 50 years. It is therefore of interest to determine whether
aspects of tracking of continuous risk factors from younger ages would significantly
contribute to models of IHD devcloping in later life.
Patterns of SBP, DBP and BMI in individuals that describing the relationship of
repeated measurements over time with age up to 50,60 and 70 years were considered as
indicators of tracking possible additional risk factors for development of IHD after these
ages. The age specific percentile of every measurernent of SBP, DBP and BMI for each
subject was calculated as descnbed in Section 5.9.2.1. For each of these three risk
factors, three statistics were calculated. at 509 60 and 70 years of age. The mean of the
percentiles of al1 measurements from entry to these ages was called level. The dope of
the ordinary least squares regression line of the percentile on age was called trend. The
root mean square error of the deviations about the least squares regression line was called
variability.
The 5' and 95" percentiles, the tertiles and the median of the distributions of
level, trend and variability for SBP, DBP, and BMI measurements prior to 50,60 and 70
years of age are shown in Table 6.3 1. If ''perfect tracking" were present for a variable,
the distribution of "level" would be uniforni. That is, at the S" percentile 5% of subjects
would have an average level of 5.0, the lower tertile at P33 would be 33.3, the median
(P50) would be 50.0 and so on. The trend and variability would be zero.
"Level" for a subject is an indication of the average position maintained relative
to others in the distribution based on his prior measurements. For example. at age 50
years, the average percentile level of prior SBP measurements for one third of the
subjects (P33) was 43.0 or less. That is, one third of the subjects at age 50 years had, on
the average, age-specific SBP percentile levels of their prior measurements at the 43rd
percentile or lower. The average percentile of the lowest 5 percent of the subjects at age
50 years was 2 1.3 or less and 5 percent of subjects had an average level of 85.8 or higher.
The average percentile of al1 previous BMI measurements was more than 64.9 for the top
one third of men at age 50 years. For an individual, a "trend" with a negative sign.
suggests a pattern of decreasing percentile rank with age, while a positive sign for "trend"
suggests that an individual's rank in the distribution relative to others was increasing with
age. A "zero trend" identifies subjects whose percentile rank remained unchanged with
age. Consequmtly, a zero trend if accompanied with low variability indicates strong
evidence for tracking. High "variability" in the trend, measured by the root mean square
error, is indicative of lability of BP or fluctuating, increases and decreases in BMI. These
three statistics, dexived fiom individual regression equations based on the rneasurements
to age 50,60 and 70 years for each subject were calculated for SBP, DBP and BMI.
The distribution of level, trend and variability were similar for SBP and DBP
measurements. A higher degree of tracking for BMI i s reflected in the distribution of
level at each age, where the value of "level" for each percentile are close in value to the
percentile itself. This is consistent with the higher correlation and higher relative
likeiihood measures for BMI compared to those for SBP or DBP.
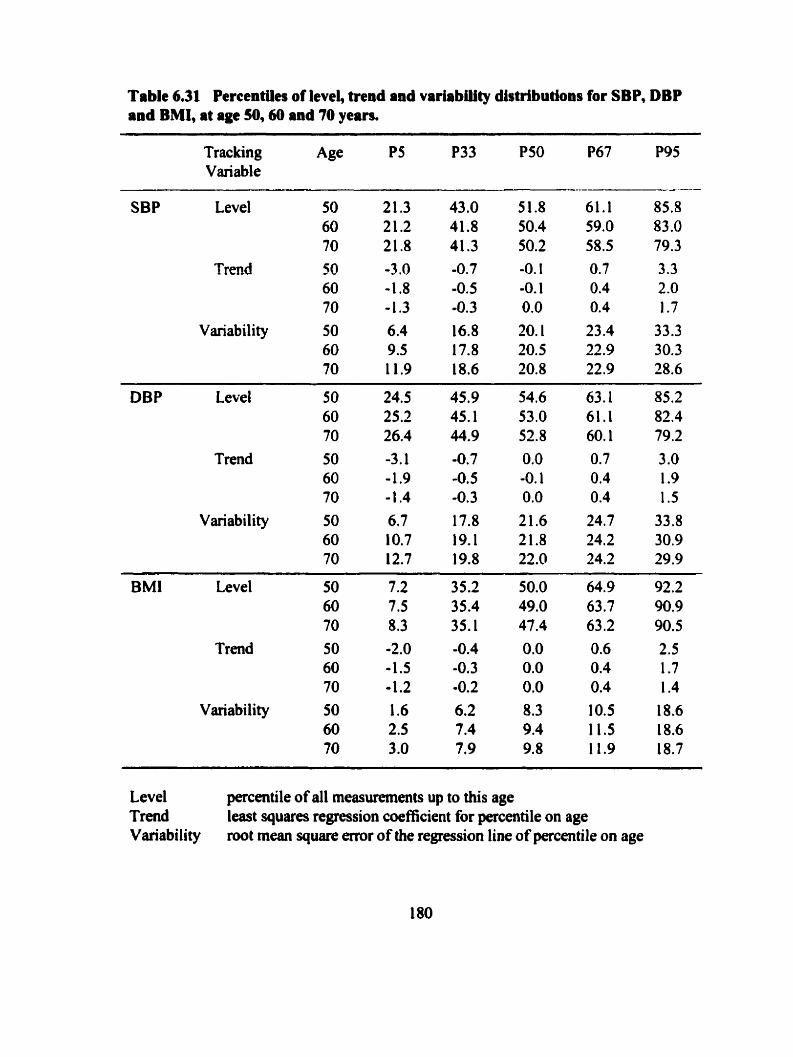
Table 6.31 Percentiles of level, trend and varlabüity distributions for SBP, DBP and BMI, at age 50,450 and 70 yean.
Tracking A S PS P33 P50 P67 P95 Variable
-
SBP Level
Trend
Variability
DBP Level 50 60 70
Trend 50 60 70
Variability 50 60 70
BMI Level 50 60 70
Trend 50 60 70
Variability 50 60 70
Level percentile of al1 rneasurements up to this age Trend least squares regression coefficient for percentile on age Variability rootmeansquaremroftheregressionlineofpercentileonage
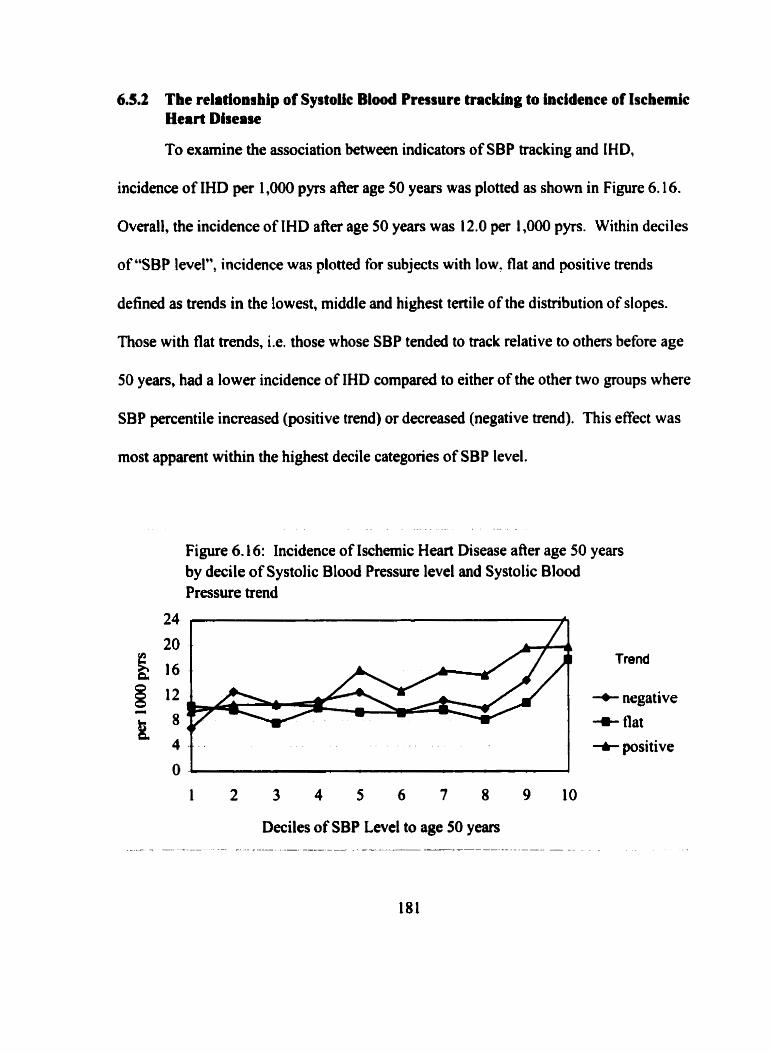
6.5.2 The relationrhip of Systolic Blood Pressure tracking to incidence of Ischemic Heart Disease
To examine the association between indicators of SBP tracking and IHD,
incidence of IHD per 1,000 pyrs afier age 50 years was plotted as show in Figure 6.16.
Overall, the incidence of IHD after age 50 years was 1 2 .O per 1,000 pyrs. Within deciles
of "SBP level", incidence was plotted for subjects with low. flat and positive trends
defined as trends in the lowest. middle and highest tertile of the distribution of dopes.
Those with flat trends. i.e. those whose SBP tended to track relative to others before age
50 years, had a lower incidence of IHD compared to either of the other two groups where
SBP percentile increased (positive trend) or decreased (negative trend). This effect was
most apparent within the highest decile categories of SBP level.
Figure 6.16: Incidence of Ischemic Heart Disease afier age 50 years by decile of Systolic Blood Pressure level and Systolic Blood Pressure trend
20 Trend
+ negative
+ flat
t positive
6.5.3 Modehg aspects of tracking and lschemlc Heart Disease
The three indicators of aspects of tracking, level, trend and vwiability, defining
SBP, DBP and BMI patterns for each subject were modeled as possible additional risk
factors for IHD. Level was modeled as a continuous variable, scaled in units of 10
percentiles. Trend was categorized in tertiles, with the middle tertile, subjects with flat
trends defining the reference category. Variability was dcfined as high or low (reference
category), based on values above or below the median of the distribution of root mean
square error values.
'Ruee Cox proportional hazard models were fit based on measurements at age 50,
60 and 70 years. Each base Cox model included year of examination, smoking, DM,
BMI%ile and the BP percentile (either SBP%ile or DBP%ile) at the examination. Four
variables describing level(1 continuous variable), trend (2 categories and reference) and
variability ( 1 category and reference) for each risk factor were added to base models.
Separate models at each age were fit to examine the contribution of SBP, DBP and BMI
tracking.
As shown in Table 6.32, when added to the Cox proportional hazard model at age
50 years for IHD; SBP level and SBP trend were statistically significant in addition to
SBP%ile at age 50 years that remained significant in the model. A difference in 10 units
in "SBP level", the average percentiles of put SBP measurements, reflected a 9% (95%
CI 4%, 15%) increased risk of IHD. Those in the top tertile of d l slope measurements at
age 50, that is, those with positive slope, relative to those with a flat slope, incurred an
increased risk of IHD of 23% (95% CI 3%,46%). Also, examined separately, DBP level
added significantly to the model at age 50 years, as did BMI level and BMI variability.
The level variable entered the model in addition to, not replacing, the percentile value of
the variable that remained significant in the model. Subjects with high variability in the
slope of BMI measurements with age up to 50 years, i.e. vrviability above the median
value, had a 25% (95% CI 8%,45%) increased risk of IHD, relative to those with
variability in their dope below the median of all values.
At age 60 and 70 years, level of SBP and level of DBP each contributed
significantly to models in addition to the percentile value of these variables in models at
these ages. This indicates the value for pnor BP measurements in addition to the BP
measurement at these ages for models of IHD. BMI level contributed to the model at age
60 years, but not at age 70 years. For dl three risk factors, trend and variabili ty were noi
significant in models at age 60 or 70 years, when considerd with level.
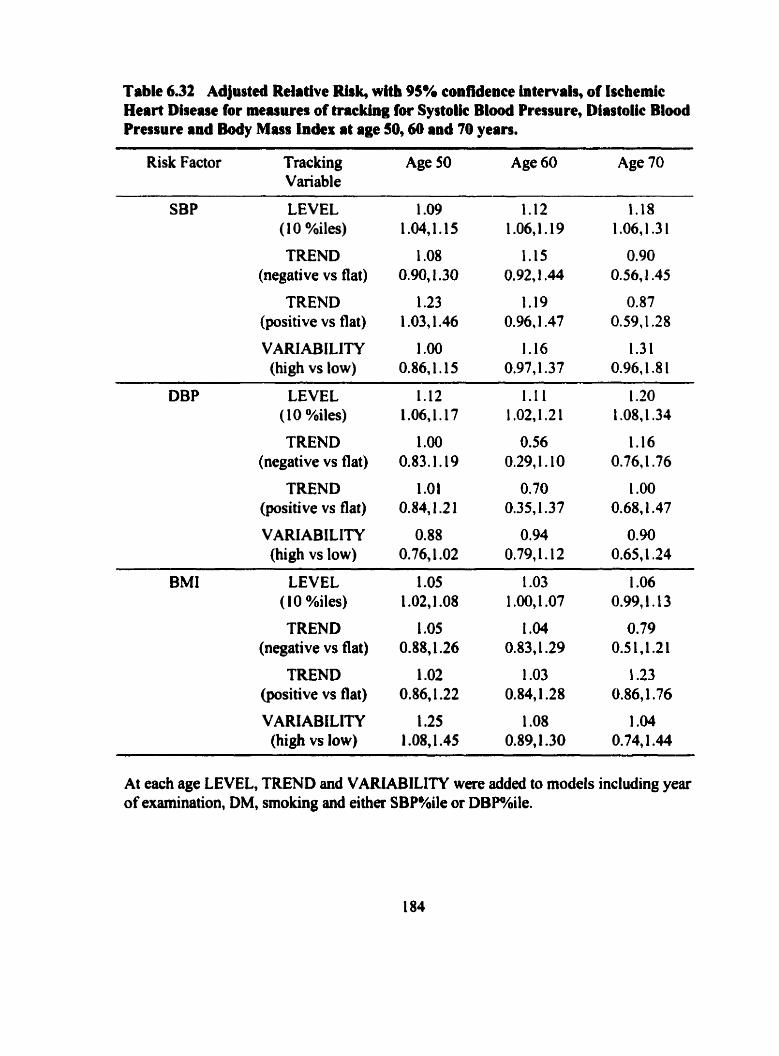
Table 6.32 Adjusted Relative Rirk, with 95% confidence intervais, of Ischemic Heart Disease for masures of tracking for Systoîic Blood Pressure, Diastolic Blood Pressure and Body Mass index at age 50,60 and 70 years.
Risk Factor Trac king Age 50 Age 60 Age 70 Variable
SBP LEVEL (1 0 %iles)
TREND (negative vs flat)
TREND (positive vs flat)
VARIABlLITY (high vs low)
DBP LEVEL 1.12 (1 0 %iles) 1.06,1.17
TREND 1 .O0 (negative vs flat) 0.83.1 .19
TREND 1 .O1 (positive vs flat) O.84,1.2 1
VARIABILITY 0.88 (high vs low) 0.76,l .O2
TREND (negative vs flat)
TREND (positive vs flat)
VARIABiLITY (hi& vs low)
At each age LEVEL, TREND and VARiABILITY were added to models including year of examination, DM, smoking and either SBP%ile or DBP%ile.
7 DISCUSSION
Now in its fifty-first year, the Manitoba Follow-up Study continues as the
prospective cohort sîudy, conceived, designed and executed by Dr. Francis A. L.
Mathewson. His cohort consisted primarily of young men who had been found fit for air
crew training by the RCAF during WWII. These men had served their counhy, survived
the war, and were invite- to participate in a long term investigation of cardiovascular
disease. Since then, throughout theu adult lives, these men have faithfully responded to
annual contact and periodic requests for medical examination. The high rate of completion
of routine examinations and the evolution of a highly successfûl follow-up protocol for
maintaining contact with study members has resulted in the development of database with
medical information spanning the lives of these men before development of disease,
during the process of disease development and following disease onset. The success of
the MFUS reflects the dedication and perseverance of Dr. Mathewson and the outstanding
contribution of the 3,983 men.
7.1 Summary of key resulb
The epidemiology of IHD ova a 45-year observation period in the MFUS cohort
of 3983 men has been described. Incidence of IHD, distribution of risk factors and the
relationship between the two over time were exarnined through five specific objectives in
this thesis. This section provides a summary of the key findings of this analysis.
Twenty eight percent of the cohort, 1098 men, developed evidence of AP, MI or
SD between 1948 to 1993. The incidence of IHD increased with age. Four cases were
diagnosed between 30 and 34 years of age. At that age, the incidence was low, less that 1
pet 1000 pyrs. Incidence increased almost linearly, so that by age 75-79 years 17 first
IHD events per 1,000 pyrs were occhng. The incidence of AP and MI were similar up
to age 65 years, where after MI incidence continued to increase and AP incidence
plateaued. SD incidence increased with age and was lower than the incidence of either
AP or MI at every age.
Systolic and diastolic blood pressure, body mas index, diabetes mellitus and
smoking are recognised IHD risk factors. The distributions of these risk factors over time
were shown to Vary with age and @où of time measured. Levels of SBP and DBP,
tended to increase with age to 60 years, SBP continued to increase and DBP plateaued
there afler. The variability of blood pressure, more so for SBP than DBP, also increased
with age. BMI increased with age, and levelled off at age 60 years with a mean about 1.5
kg/m2 lower than reported for the Canadian male population at comparable ages. More
than 50% of the MFUS cohort smoked during the early years of the study. The
proportion of current smokers declined with age and time to rates comparable to the rest
of the Canadian population (Stachenko 1 992). Prevalence of diabetes increased with age
to about 9 percent by age 75 years. In general, distributions of al1 risk factors were
changing with age.
Utilising the longitudinal nature of repeated routine measurements of subjects, at
5-year intervals, between 30 and 75 years of age, strong evidence for tracking of SBP,
DBP and BMI was established by two methds. Correlation coefficients between serial
measurements of SBP, DBP and BMI and the relative likelihood of a measurement
remaining in the top or bottom quintiles of these distributions on repeat measurement
were calculated. The evidence for blood pressure tracking was greatest at 5-year intervals
in subjects between 30 and 50 years of age. From the sarne age, and over the same
interval of time, with either index of tracking, evidence for tracking of BMl was stronger
than that for either BP.
The significance of the effect of a nsk factor for IHD may Vary for difkent
clinical manifestation of IHD. The possibility of this was explored in this thesis. In
general, in multivariate models, DBP was stronger than SBP for AP and MI. SBP rather
than DBP was more strongly associated with SD. BMI was important in models of AP
and SD, but only significant at age 40 for MI. DM was consistently associated with MI at
ages 50 through 65 years, and at ages 55 and 65 years for SD, but in general not for AP.
The relative risk for smoking in models was significant in multivariate models of MI up
to age 50, at younger ages, 35 and 40 years for AP, and at 40 and 55 years for SD.
As well, the relative risk of IHD and its manifestations for some risk factors
declincd significantly with age. Relative risk for blood pressure declined with age overall
for IHD and for AP. The effect of DBP significantly declined for MI. The effects of
neither SBP nor DBP significantly declined with age for SD. Even though the relative
risk associated with BMI for IHD and its manifestations appeared stronger both in
magnitude and statistical si gni ficance at younger compared to older ages, the effect of
BMI did not significantly change with age, and when its effect was estimated over al1
ages for SD. was not statistically significant. The relative risk of DM for IHD and its
manifestations in models from age 50 years and older did not significantly change with
age. The efiect of smoking declined with age for IHD, MI and SD. Over al1 ages,
smoking was not significant in models for AP.
Evidence for tracking of blood pressure and BMI was established. This lead to a
characterisation of tracking at the individual level, based on a description of the linear
relationship between prior blood pressure and BM1 measurements and age. Level, trend
and variability were used as indicators of individual tracking patterns of risk factors over
time. These indicaton derived fiom prior repeat measurements of blood pressure and
BMI before ages 50,60 and 70 years, significantly contributeci to models of IHD. The
contribution of the tracking indicators to models of IHD was in addition to the
contribution of measurements at that point in time.
7.2 The Design and Conduct of the Manitoba Follow-up Study
The Manitoba Follow-up Study ranks worldwide with few other medical research
projects ever undertaken in scope, duration and detail of the investigation of the natural

history of ischemic heart disease. By design the MFUS has prospective1 y documented the
medicai histones of 3,983 originally healthy, young men for more than 50 years. Most of
these men lefi the RCAF at the end of WWII to ernbark on new careers. Many rernained
involved in aviation, some moved to civilian occupations and othen returned to school.
The emphasis of the MFUS has been on the detection of electrocardiographic
abnonnaiities and routine assessrnent of selected ischemic heart disease nsk factors, to
aid in the prediction of CVD. A medical database has been developed to include
information collected before disease onset, recordeci details at the time of diagnosis of
disease, and documentation of the prognosis of individuals following disease.
7.2.1 Unique aspects of the Manitoba Follow-up Study
The MFUS is unparalleled in Canadian medical research. Many aspects of this
study are tmly unique and merit elabration. Some questions mise with the longevity of
any project, but perhaps even more questions arise with a study of this magnitude. Factors
that are associated with the maintenance of a cohort during a longitudinal study include a
stable and flexible staff that communicates well with the subjects, the development of a
collaborative effort or "subject bond" between the researcher and participants and the
perceived importance of the study by the participants (Mannor et al. 1991).
Reasons for the completeness of the records lie in part with the nature of the
cohort at the beginning of the MFUS as well as with the dedication of Dr. Mathewson
and his staff. An understanding of one study membets perception for his own contribution
to and reasons for UnYItempteâ involvement in the MFUS may M e r enlighten the

reas0n.s behind the success of the follow-up program. It is possible through qualitative
methods, using a life histoiy inteMew with partially directed questions, to obtain some
insight into his perception. To explore this issue, a study member living in Winnipeg,
whom 1 had not previously' met, agreed three years ago to my request to a vida taped
interview to discuss MFUS. Part of that 90 minute inteniew explored the question of
why someone would continue to be part of a study for this long, and why someone would
bother to keep getting exarnined and send back questionnaires? Segments of that interview
are as follows:
About 15 minutes into the interview 1 asked: Y.. by the early 1960's the first reports were
being published. You perhaps weren't aware that these results were being reportecl,
or were you?"
The study mernber responded "We didn't know exactly what the results were being
aquired or exactly how they were king used, but uh, seeing you were dealing with
something with the individual, as long as the individual was healthy it wasn't
making any differenfe in his eyes. (1 said, "That's right") It's the sarne thing with
other body organs and anythuig else, if we cm contribute to other people it's
something we should do in my view and it's obvious that co~ected to the
University it was not a commercial operation and nobody was marketing this in the
ordinary sense of marketing and if advice and statistics were helping other people,
that was good."

I later asked: "Can you tell me why after close to fi@ years, you would still even be
interested in sending anything back to us? Why have you stayed involveù with this
study for this long?"
He responded: "Well uh, 1 think now at this late date it's really a case of stubbomness.
When you've been involved in sumething for a long, long time particularly with
military experience where in a lot of cases suwival is something you have to believe
in, there is just a general interest in the suwival of the group that I'm a part of,
interested in and to see just really how we do in many ways later in life. And the
fact that there is a very strong possibility that it's maybe going to really bear h i t
and help fûture generations, it is something that certainly has my support."
Near the end of the interview 1 said: "Are there any parts of this (Study) that you're a little
more curious about, now that i've talked on and on about sorne ihings."
He replied: "No, the essence of it h m my point of view would be, and 1 think it would be
popular h m the test of the group, is the hope that yod11 hold out for applying this
to younger people. That an electrocardiogram may be recorded down the line
somewhere and through this Study a Doctor will Say: 'Well we think this leads to
this and because of that we are going to do something about it."'
These intetview segments al1 seern to have a common thread linking this study
member's ideas of cornmitment for the bettement of mankind h m his exp&ence during
WWII and hughout his involvement with the MFUS. This stuây member has been

responding to the requests of the study not for his own personal health benefits, but rather,
he has conveyed his very serious and sincere desire to help mankind and future generations
through his participation. Earlï in the interview he told me that his enlistment in the RCAF
came h m a sense of responsibility to protect the citizens of Canada and a sense of perhaps
doing what was necessary and expected, really without any motivation for personal gain or
reward. I see an underlying theme of nationalism, and a sense of unseltish devotion to
madcind fkom his mponses. 1 feel that his involvement with this study continues because
of his belief that MFUS may help prevention of cardiovascular disease in future
generations.
7.2.2 Stnngths, weaknesses and generalizability of the Manitoba Follow-up Study
The young age and n m w age range of the MFUS cohort at entry coupld with
the long duration of follow-up has resulted in the opportunity to document al1 incident
events of cardiovascular disease fiom a mean age of 30 years, up to about 75 years of age.
The documentation of IHD as it developed was possible through the routine examination
of study mernbers with recordings of electrocardiograms to aid diagnosis of some
otherwise undetectable types of MI. The design, data collection protocol and duration of
follow-up are al1 strengths of the MFUS that have enhanceci the documentation of
incident IHD.
The ascertainment of vital status by the end of the 45-year follow-up period was
obtained for 96 percent of the cohort. The fiequency of missing 5-year birth anniversary
examinations was low, 6.4 percent of the possible selecied exarninations. This minimized
problerns al1 longitudinal studies face with interpretation of results based on less
complete follow-up and less complete medical data.
A more selective nature for recniitment of RCAF air crew, compared to both
recruitrnent to other branches of the anned forces and compared to men not recmited to
serve during WWII may have resulted in healthier or more elite subjects entering the
MFUS cohort compared to the genenil population. Air crew recruits were exciuded on
the bais of evidence for clinical disease. This selection process rnay hinder the
generalizability of the study's results to the Canadian male population. Some cohon
members were found not fit for pilot training and were considered for other air crew or
ground ctew training. Pilots may have had better cardiovascular profiles at entry to the
study, compared to those who had served in oiher capacities (Tate, in progress). About
half of study members remained involved with aviation throughout their adult lives, with
about half of these, 25% of the cohort, being career pilots. However, many study
members renimed to civilian occupations at the end of the war.
During the course of follow-up, study rnembers were in al1 strata of society,
although the rnajority or non-aviation occupations were in "white collar" positions. If the
structure of the MFUS cohort is such that the members were somewhat healthier at entry
and in higher social positioned environments lhan the general population then, to some
degree, the potentially confounding effects of socioeconomic characteristics with
cardiovascular disease, ofien difficult to define and ofien more dificult to measure, may

have been controlled to some extent through the more hornogeneous composition of the
CO hort .
The MFUS is a prospective study of disease as it developed in a fiee living
cohort. The majonty of the study members are nuw retired, most live in Canada, but
some are scattered al1 over the world. Within Canada, many study members have found
southeni Ontario or British Columbia favourite retirement communities, as have many
other Canadian seniors. A sizeable number @erhaps the hardy ones), live in Winnipeg,
where the study has been housed since its inception. Each man visits his personal
physician, and consequently some concern may be expressed about the standardization of
measurements, consistency and completeness of reporting. However, with the
geographic diversity of the cohort, a reasonable representation of the Canadilui elderly
male population and the health care they receive across Canada can be inferred.
Details of the frwluency of prescription and cornpliance to phamaceuticals for
treatment of hypertension have not been recorded in this study. Al l that has been
recorded is type of medication and date of prescription. Hence, the ability to address
effects of antihypertentive treatment on level of blood pressure is clearly limitation of this
study. This limitation was addresseci in the previous published analysis of tracking (Tate
1995b) where it was shown that only 3% of the cohort had been prescribed any
antihypertensive medication before age 50 years. Further, it was rnentioned that at age 65
years and older, at least two-thirds of those on treatment were still found in one of the top
two quintiles of the blood pressure distributions. Thus treatrnent of blood pressure may
have only a marginal effect on measures of tracking. In this thesis, the blood pressure
rneasurements in men between 30 and 50 years of age showed strong evidence for
tracking as well a strong predictive value for incidence of IHD. Most of the
measurements through this age range would have been recorded during the first 20 years
of the study. During this period of time extemai effects on nsk factor patterns, such as
antihypertensive treatment on blood pressure levels, would have been small. The effect
of treatment on blood pressure levels has not been addressed in modeling incidence of
IHD,
The mortality experience of the MFUS cohort has remained low relative to the
mortality of the Canadian male population over the same years of observation. This may
in part be a result of the healthier nature of the cohort at entry to the study. Further, the
lower mortality experience may reflect the value of routine exarninations, enhancing the
oppomuiity to detect disease at earlier stages. None the less, the distribution of cause of
death in the MFUS, apart from death due to aircrafl accidents, has been similtv to the
Canadian experience when compared at a midpoint, 1984, of time under shidy.
This is a study of cardiovascular disease in men, only. Cautions have been
expressed, in the pst, concerning the generalisation of the MFUS results to fmale
populations. The age-specific incidence of CHD rnorbidity and CHD mortality are well
mgnised to be greater in men than in women, with CHD mortality rates for women
appmximately equal to the rates of men about 10 years younger (Pagley and Goldberg
1995). Despite the huge geographic variation in CHD rates, this two to three fold age-
specific male to female excess has been reported world wide (Khaw 1992). However, the
effect of main risk factors, blood pressure, smoking and cholesterol have al1 b e n found to
be important in both genders (Meilahn et al. 1999, and with about the same relative
magnitude (Lemer and Kannel 1 986). One exception is the effect of diabetes. While the
reasons for a diffèrential effect is uncertain, the relative nsk of CHD has been reportai to be
much greata for fmales than for males with DM (Barrett-Connor and Wingard 1983). It
would still appear reasonable to speculate that the results of the MFUS analysis relating the
value of nsk factors with age and the extent of tracking of nsk factors could be extended to
fernales.
While electrocardiograms and measurements of blood pressure and B MI are
routinely obtained, other areas of data collection are lacking. Routine medical requests did
not include any collection of blood lipid measments. In the mid 196Os, Dr. Mathewson
approached Health and Welfare Canada with a request for funding to systematically obtain
cholesterol measurements fiom the subjects, but was unsuccessful. Hence, while seium
cholesterol and its components have been studied by others and found to be major risk
factors for CHD, no analysis of this is possible in MFUS. Smoking data is based on reply
to either two questionnaires, frmn 1974 and 1982, and a chart review of the non responders
at that time. Smoking data is unavailable for 14% of subjects, and no smoking data has
been updatd since that time. It is unlikely that rnany non-smokers would have started
smoking afier 1982. However, smokers in 1982 may have later quit, and would be
misclassified as cunent smokers at older ages in this analysis. Diagnosis of diabetes
mellitus is based on self-report by the study member or reported by his physician.
The number of subjects who contnbuted examinations at the 5-year birth
anniversaries between ages 35 and 65 years varied between 2,447 and 3,5 1 5. This
number of subjects ensured a high statistical power to detect significant effects of risk
factors at these ages. At age 70 and 75 years, the number of subjects with examinations
was fewer. Hence, the power to detect significant effects of risk factors was reduced.
The MFUS is ongoing. Data continues to be collected fiom the study members, now at a
mean age close to 80 years. In the future, an analysis of risk factor effects in the very
elderly may be possible.
7.3 Cornparison of results to other studies
7.3J Incidence of Ischemic Heart Dhease
While CHD mortality rates are readily available fiom many sources, there are
very few population reports describing incidence of IHD morbidity. A reason for this lies
with a recognition, understanding and appreciation for the data necessary to calculate
incidence of disease. A cohort of disease ûee people must be assernbled and followed
prospectively with repeated examination to document first evidence of IHD. The cohort
must be followed through age ranges where IHD events are likely to occur. As well, the
cohort must be followed long enough for IHD events to accrue. This is not an easy task.
Issues surrounding unsuccessful attempts to establish an IHD incidence registry in
197
Canada have been reviewed (Wielgosz 1992). Mortality records from vital statistics
offices documenting cause of death are much more easily obtained and consequently
cardiovascular mortality rates from populations are more frequently reponed.
Incidence of IHD in the MFUS increased with age fiom 1 per 1,000 pyrs before
age 40, to 17 per 1,000 pyrs by age 75-79 years. IHD incidence in the United States has
been estimated by the Pooling Project (The Pooling Project Rcsearch Group 1978) on the
basis of the 10-year experience of a total of 12,s 16 rniddle aged men. The incidence of
first major coronary event was similar at ages 40 to 49 years to that estimated in the
MFUS, but higher incidence rates than in the MFUS were reported afier age 50 years.
After 26 years of follow-up, the Framingham study reported 1240 incident CHD events,
between ages 35 and 84 years, in the men and women of their cohort (Lerner and Kannel
1986). Annual incidence of CHD per 1,000 pyrs in age decades for the Framingharn men
was reported to be 4.1 (age 35-44), 1 0.8 (age 45-54), 20.1 (age 55-64), 22.5 (age 65-74)
and 25.2 (age 75-84), a gradient similar, but with rates greater than those in the MFUS
cohort. In the Frarningharn study men, 43% presented with MI, with another 13% as MI
with AP coincident. AP without MI presented in 35% of cases and 10% as SD alone.
AAer 30 years of follow-up (Kannel and Vokonas 1992) the Framingham study reported
that MI was the dominant manifestation of IHD aAer age 65 years, and that the proportion
of subjects with SD as first manifestation of IHD increased with age, to about 20% after
age 75 years. This is similar to the distribution of the three manifestations of IHD in the
MFUS where almost half (47%) of incident IHD events were MI. As in the MFUS
cohort, the Framingham study reported that the incidence of AP leveled off at about 1 O
per 1,000 pyrs afier age 55 years (Kannei and Feinleib 1972). In another Canadian study,
of 4,576 men in nual Quebec (Dagenais et al. 1990b) the reported incidence of AP
increased with age fiom 3 per 1,000 pyrs at age 35-44 to 6 per 1,000 pyrs at age 45-54,
and levelled offat age 55-64 years at about 10 per 1,000 pyrs. Consistent with the
findings in the MFUS, the Quebec study incidence of MI continued to increase with age
afler 65 years. In a Finnish study of over 10,000 rniddle aged men and women, 30-59
years of age at entry, afier a follow-up interval of 5.5 years, the incidence of MI in men
age 30-39 was 2.9 per 1,000 pyrs, at age 40-49 was 7.3 per 1,000 pyrs and at age 50-59
was 14.1 per 1,000 pyrs (Reunanen et al. 1985). The incidence of "new angina*' at the
same ages in men was 3.7, 7.6 and 1 3.1 per 1,000 pyrs, respective1 y. The Copenhagen
City Heart Study (Nyboe et al. 1989) of 5,923 men 40 - 69 years of age followed over an
average of 6.5 years was designed to specifically evaluate the incidence and risk factors
for MI. The Copenhagen Study reported the incidence of MI to increase with age from
0.0 at age 35-39, 1.8 (age 4044), 3.2 (age 45-49), 5.2 (age 50-54), 8.0 (age 55-59), 10.0
(age 60-64), 13.6 (age 65-69), 1 1.1 (age 70-74), and 1 1.7 (age 75-79) per 1000 pyrs. The
Copenhagen Study documented evidence of MI based on self report of syrnptoms
followed for confirmation by contact with physicians. The rates of MI they report are
lower than those of MFUS. Their approach would have underçounted MI by excluding
"silent MI" and possibly overcountlng events by including those with pnor AP and
possibly counting prevalent MI at entry. The relationship of increasing incidence of MI
with age is in keeping with that of the MFUS.
Some researchers have relied on administrative health records and have useà
hospital discharge records to estimate incidence of IHD. While usehl for hospital
planning, this approach is fraught with difficulty as a suitable means of estimating
incidence of disease. For example, only cases reporting to hospital are recorded. It has
been estimated that as many as 25% of MIS may be clinically "silent", and be detected
only with an electrocardiognun (Kannel and Abbon 1984). In MFUS, about 20% of Mls
were clinically "silent". In Canada, a study of mortality statistics and hospital separation
rates for a period from 1976 to 199 1, estimated rates of MI per 1000 population in men to
range fiom 0.3-0.4 at ages under 45 years, 5.6-7.6 for ages 45 to 64 years, and 14.2- 15.2
in men over age 65 years (Brophy 1997). Again, these rates apply only to men with a
diagnosis of MI on a hospital record, and hence, will include re-infarction as well as
incident MI events. As well, this includes men with prior AP. So while reported rates
may be thought to represent incident MI, these rates do not represent incident IHD events.
A Canadian report of trends in morbidity and mortality rates of MI using administrative
data fiom Nova Scotia and Saskatchewan between 1977 and 1985 presented an age
adjusted rate of first MI for men 25 through 74 years of age to range nom 4.4 to 7.0 per
1,000 pyrs (The Nova Scotia-Saskatchewan Cardiovascular Disease Epidemiology Group
1992). nie incidence of "unwmplicated" SD in Framingham males, based on death
within one hour of onset of symptoms in men without prior evidence of CHD, was

report4 as 1.59 per 1,000 pyrs afier 26 years of follow-up (Schatzkin et al. 1984). This
figure is difficult to compare with MFUS because of di fferences in definition of SD.
Because IHD events were documented through the follow-up period by routine
examination of disease free subjects from entry to the study, the MFUS estimate of the
incidence of manifestations of IHD in Canadian males should be considered the most
comprehensive and accurate available.
7.3.2 Risk factor distributions
As part of the Canadian Heart Health Initiative (Health Promotion Directorate
1992), the Canadian Heart Health Survey consistai of a series of cross sectional surveys
of Canadian adults c h e d out in each province in the late 1980s and early 1990s
(MacLean et al. 1992). The age-specific mean and standard deviations of SBP and DBP
in the MFUS cohort were similar to those measured during the personal interview
conducted in 10,110 males as part of that survey (Jofies et ai. 1992). Mean blood
pressure in the MFUS also parallel that reported for US males in the National Health and
Nutrition Examination Suwey (NHANES) where SBP was reported to increase with age
and DBP to increase to age 50-59 years and decrease afier that age (Burt et al. 1995).
Means and standard deviations of age-specific BMI measurements in the MFUS cohort
were wnsistently 1.5 kglm2 lower than those reported in the same cross sectional survey
of the 8,796 males who also attended the laboratory component of the survey (Reeder et
al. 1992). So although mean blood pressure was similar, the lower mean BMI suggests
that MFUS subjects may be somewhat fitîer than their Canadian peers. In a Framingharn
report over a 36 year foilow-up, a 20 mm Hg increase in SBP and a 10 mm Hg increase in
DBP over the ages 30 though 65 years was found (Kannel 1996). Risk factor levels of
Framingham males over age 65 years were reported in 5-year intervals (Larson 1995). A
mean BMI of 26.1 kg/mi at age 65-69 began to decline with age. Similady, mean SBP of
140 mm Hg at this age declined to 134 mm Hg by age 80-84 years, although based on
only 40 men at that age in their cohort.
There were no diabetics in the MFUS cohort at entry. In contrast, 1.92% of the
Framingham cohort had DM at entry to that study (Dawber 1980). The age-specific rates
of DM in the MFUS cohort are similar to rates reported by others in North America.
Between 1980 and 1987 the prevalence of diabetes for United States white males ranges
from 4.3 percent to 6.5 percent in men age 45-64 yeius (United States Department of
Health and Human Services 1990). Prevalence of DM among Canadian community
dwelling elden was 10.2% (age 65-74 years), 9.8% (age 75-84 years) and 7.8% (age 85
years or older), as reported by the Canadian Study of Health and Aging (Rockwood et al.
1998).
Over half of the MFUS members before age 50 years smoked. The percentage of
smokers in this cohort decreased with age to about 25 percent by age 70 years. These
smoking rates were similar to those reported during the same period of time by the
Pooling Project, 44 percent at age 50-54 and 37 percent at age 55-59 (The Pooling Project
Research Group 1978). In the late 1980's the prevalence of smoking in Canada was
estimated to be 40 percent in males age 35-44 years, decreasing to 23 percent by age 65
to 74 years (Stachenko et al. 1992). The MFUS smoking data represent age-specific
prevalence estimates of smoking habits in men over a 45-year period. The majority of
examinations at age 30 through age 50 years would have been recorded dunng the 1950's
and 1960'9, a period of time when Canadian smoking rates were markedly higher than
today .
7.33 Tracking of Blwd Pressure and Body Mass Index
Successive measurements of the same biological parameter in an individual over
time may be predictable to some extent. Tracking describes the extent of predictability or
relative constancy that a measurable continuous scaled characteristic rnay have in a group
of individuals over time with repeated observation. The mathematical and analytical
aspects of tracking have been recently reviewed (Twisk et ai. 1994). There is no single
comprehensive definition of tracking. Based on the repeat measurement of a biological
parameter, evidence for tracking exists if an individual maintains his ranking relative to
others in a population over a specified time period (Foulkes and Davis 198 1 ), or where
the expected value of the relative deviation of an individual's value fiom the population
mean rernains unchanged over time (McMahon 198 l), or when measurernents tiom an
individual over time show systematic change that facilitates prediction of future values
(Ware and Wu 198 1). These definitions require an examination of patterns of individual
measwernents, of al1 subjects, over the entire range of measurement values, over periods
of time.
Two indices of tracking were used in this analysis. The serial correlation
coefficient expresses the strength of a iinear relationship between measurements over
time. In this analysis, the entire ranges of SBP, DBP and BMI were exarnined at 5-year
examinations using correlation analysis. In the relative likelihood approach to tracking,
subjects are classified at repeat measurernent over time using cut points of distributions.
The relative likelihood approach was used to focus on the subjects with measurernents at
the extremes of the SBP, DBP and BMI distributions (Twisk et al. 1994). In this thesis,
an adjusmient was incorporated into the calculation of the relative likelihood measure, to
compensate for the imprecision of the process to determine exactly 20% of observations
in the top or bottom quintile of the distribution of measurernents.
Tracking of blood pressure and cholesterol measurements in children has recently
been reviewed (Labarthe et al. 199 1) and tracking of blood pressure fiom youth to early
adulthood (Nelson et al. 1992, Beckett et al. 1992) has been reporteci. There have been
few reports regarding tracking of blood pressure fiom early adulthood to middle and
older age (Mathewson et al. 1972, Rosner et PI. 1977, Rabkin et al. 1982, Tate et al.
199%). Since the investigation of the degree of tracking of a biological parameter over
varying ages and time intervals requires a large source of longitudinal data, studies like
the MFUS and the Frarningham Study provide excellent oppomuiities to examine
tracking of adult male blood pressure and body build.
Elevated blood pressure in middle age is widely accepted as a major nsk factor for
subsequent cdiovascular complications such as CHD and stroke (Rabkin et al. 1978a,
The Pooling Project Research Oroup 1978, Rabkin et al. 1979, Dawber 1980).
Consequently, identification of young adults who are likely to maintain elevated blood
pressure in later life should be of prime importance in preventive medicine.
Analysis of the MFUS cohort, showed that mean SBP and its v ~ a b i l i t y increased
steadily between age 25 and 75 years. The relationship of blood pressure to subsequent
cardiovascular complications is likely best described as a continuum of risk (MacMahon
et al. 1990) whose effect may change with age. With this premise, it is important to
recognise that there may not be one fixed cut point of blood pressure defining a level
beyond which there is an increased risk applicable to individuals of al1 ages. Because of
this, the concept of tracking blood pressure is important. If men in the upper end of the
blood pressure distribution have the greatest likelihood to remain at high levels relative to
others of the same age, then men at the highest risk of cardiovascular disease in later life
can be identified at a young age, before their blood pressure is sufficiently elevated to
satisQ traditional definitions of hypertension. This analysis provides supporting evidence
that tracking of blood pressure does exist fiom young adulthood. At both the top and
bottom ends of the systolic and diastolic blood pressure distributions subjects tended to
stay in their respective end of the distribution, for intervals up to 30 years.
The strongest evidence of blood pressure tracking, found by both methodological
approaches, was for middle aged men. This is consistent with other reports (Rosner et al.
1977). Weaker tracking of SBP in adults at younger ages in the MFUS d o r t has b e n
previously reporteci (Rabkin et al. 1982). M e r s have reported correlation coefficients
ranging h m 0.3 to 0.4 in young adults up to age 20 years, over a 9-year interval
(Kernper et al. 1990). This group also reporteci the "relative probability" of staying in the
top quartile of the blood pressure distribution over 9 years to be 2.0 for DBP and 3.0 for
SBP. The probability for men in the high-normal range of DBP (85-89 mm Hg) to
develop hypertension was 2.25 times greater than in those with normal DBP (Leitschuh et
al. 199 1). Stronger evidence for tracking was found for shorter, in contrast to longer,
intervals of time between measurements in the MFUS analysis.
Because hypertension is a known and potent risk factor for IHD, elimination of
individuals from analysis afier development of IHD may result in a weaker degree of
tracking of blood pressure at oider aga. With the MFUS data, it is not possible to
evaluate specific medications and cornpliance to antihypertensive treatment. Based on
previous analysis of MFUS data, antihypertensive treatment seems to have had little
effect on the degree of tracking of blood pressure. While antihypertensive treatment may
lower the absolute level of blood pressure, the majority of the men to whom treatment
was prescribed tend to remain in the top quintile (Rabkin et al. 1982. Tate et al. 1995b).
Digit preference in recording SBP and DBP posed some difficulty when
identifjnng quintiles in that it was not aiways possible to identiQ exactly 20% of subjects.
At some ages, many subjects had a blood pressure reading recorded at one value. For
exarnple, at age 45 years, 25 percent of DBP measurements were recorded as 80 mm Hg.
At this age, however, subjects with this DBP reading were not classified into either the
top or bottom quintile. At most ages, close to 20 percent of measwements could be
identifid for both the top and bottom puintiles. This does not hamper the calculation of
the relative likelihood measure, as the method does not require identification of exactly
20 percent of measurements.
There was strong evidence for tracking of BMI in this analysis. Correlation
coefficients for pairs of measurements at al1 ages were greater for BMI than for either
SBP or DBP. Relative iikelihood measures for BMI were also considerably greater than
for either blood pressure measurement, with subjects in the top quintile of distributions at
younger ages being at least three times as likely to remain in the top quintile on later
measurernent. One explanation of the value of obesity as a predictor of CHD is that the
metabolic complications of excess weight may require a long period of time before an
effect can be observed (Williams et al. 1997). This explanation is consistent with strong
evidence for tracking of BMI and its constant effect h m young ages in models of IHD.
Previous analysis of the MFUS reported that overweight young men were at greater risk
over the long terni for IHD (Rabkin et al. 1977).
7.3.4 Risk factor effects for Ischemic Eeart Disease
7.3.4.1 Declinhg effet of risk factors with a p
In the MFUS, IHD was found to develop in men at a young, middle or oider age.
With aging, both the distribution of nsk factors and the incidence of IHD change (Fiîed et
al. 199 1). Hence, the relative risk of IHD associated with a speci fic factor may also Vary
with age (Tate et al. 1998). The MFUS cohort presenteâ a unique oppomuiity to study
the changing effect of risk factors for IHD with age. An objective of this analysis was to
determine the age-specific relationships between nsk factors at ages 30 to 75 years and
incidence of IHD and to detennine the effects of aging on these relationships.
A recent review of nine studies (Komitzer and Goldberg 199 1) concluded that
there is little doubt that serurn cholesterol, blood pressure, cigarette smoking and diabetes
are predictors of long term coronary heart disease incidence and mortality. The question
was raised as to whether the risk factors for IHD identifiai at a young age are still
predictive at older ages. It was emphasised that only with long term studies can questions
conceming the changing effect of risk factors with age be addressed. This question has
been addressed in this thesis. It was found that while the effects of DM and BMI did not
Vary, the relative risk of IHD associated with both smoking and blood pressure decreased
significantly with age.
The MFUS finding with respect to the declining effect of smoking with age on
risk of IHD is consistent with several other studies. In the Frarningharn Study (Kanncl
and Larson 1993) a significant risk for initial CHD events was found for men 35-64 years
but not for men 65-94 years of age. The Pooling Project (The Pooling Project Research
Group 1978) reported that in men between 40 and 64 years, the relative risks for smoking
were higher for younger compared to older men. In a study of 50-year-old Swedish men
(Welin et al. 1993), smoking was significant in the first 15 years, but not the last 10 years
of a 25 year follow-up period. In the Honolulu Heart Program (Benfante et al. 1989.
Benfante et al. 1992), a greater relative nsk for smoking was found for CHD onset pnor
to age 60 years than for onset afier age 60 years. While there is no clear explanation for
the reduction of relative risk in the elderly, it may be that susceptible srnokers have
stopped smoking or that there is an increased mortality among smokers at younger ages.
The United States Surgeon General's report summarised the results of several population
studies of smoking and cardiovascular mortality (United States Departinent of Health and
Human SeMces 1983) and concluded that the relative effect of smoking declined in the
elderly. Rising cardiovascular mortdity rates in non-smokers at more advanced ages may
play a role in the declining relative effect of smoking (United States Department of
Health and Human Services 1983).
Studies are less consistent with respect to blood pressure and aging. In this
MFUS analysis. blood pressure up to age 65 years, either SBP or DBP, was a significant
risk factor for IHD. Also, the age-specific relative risk associated with a 10 mm Hg
di fference in blood pressure declined signi ficantl y with age. Consistent with MFUS, the
Framingham Study reported a significant nsk for initial coronary heart disease events
associated with high blood pressure in each sub-group of younger men, age 35-64 years,
and older men, 65-94 years (Kannel and Larson 1 993) and that the risk ratio for high
blood pressure in the older men had declined. Unlike the findings of MFUS, the Pooling
Project (The Pooling Project Research Group 1978) reported a positive slope of SBP with
incidence of coronary heart disease that did not decrease with age between 40 and 64
years. In the Swedish study of 50 year old men ( W e h et al. 1993), SBP was predictive
of MI or fatal CHD independent of duration of follow-up p e r d . In the Honolulu Heart
Program (Benfante et al. 1989, Benfante et al. 1992), SBP was associated with CHD in
both younger (under age 60 years) and older (over age 60 years) men. In this MFUS
analysis, the absolute risk of IHD, Le. the incidence, increased with age and was highest
in the elderly. The fewer number of subjects ai risk of IHD and the increased variability
of blood pressure measurements at older ages may have influenced the level of
significance of relative risk estimates. Reduced relative risk estimates in our study do not
necessarily imply that blood pressure ievei is unimportant in the elderly. Treaiment of
isolated systolic hypertension in the elderly (SHEP Cooperative Research Croup 1 99 1 )
has been s h o w to be beneficial in reducing the rate of coronary heart disease through the
lowering of high SBP levels.
MFUS results from Cox PH modeling suggested that the risk ratio for a 10 mm
Hg lower blood pressure was smaller in older compared to younger men. Further, the
risk dimence in IHD incidence between men in the top and bottom blood pressure
quintiles continued to widen with advancing age. However, while the nsk ratio was
based on the same constant difference at each age, the difference in blood pressure level
between the top and bottom quintile increased with age.
The diffaence between SBP and DBP is called pulse pressure. The finding of
increased mean levels SBP afier age 60 years while at the same ages mean DBP levelled
off suggests that pulse pressure would be increasing at older ages. Hence, pulse pressure
may be an important variable to consida in the elderl y. Pulse pressure has been
investigated with Framingham data (Franklin et al. 1997) as well as in a large scale
French study of 19,083 men age 40 to 69 years, where wide pulse pressure was predictive
of CHD mortality (Benetos et al. 1997).
The effect of BMI on risk of IHD did not Vary significantly with age and hence
was an important risk factor from age 30 years. This has been previously reported in the
MFUS cohort (Rabkin et al. 1977, Rabkin et al. 1979). In contrast to these findings, the
Pooling Project (The Pooling Project Research Group 1978) reported a greater relative
nsks for relative weight in younger compared to older men. In the Swedish study (Welin
et al. 1993) BMI was not significant in either period, that is, not in the first 15 years nor
the last 10 years of follow-up. In younger men, under age 45 years, ovenveight men,
defined as BM1 above 25.5 kg/m2 had greater mean values of BP, total cholesterol,
triglycerides and glucose, while no difference was reported in men over age 45 yean
(Egan et al. 1991). DM was most strongly associated with risk of IHD in MFUS subjects
between age 50 and 65 years. The Frmingham Study (Kannel and Larsen 1993) reported
a significant risk for initial coronary heart disease events associated with DM at al1 ages.
In the Honolulu Heart Program (Benfante et al. 1989, Benfante et al. 1992), a greater
relative risk for coronary heart disease was associated with serum glucose level at al1 ages
and with BMI in younger men.
7-3-4-2 Varying effect of risk factors for different maaifcrtitions of Ischemic Heart Diaease
Analyses of the effect of risk factors for the specific manifestations of IHD; AP,
MI and SD have been reported infrequently . In the MFUS analysis, blood pressure was
an important independent predictor of AP to age 65 years, with DBP being more
important at ages to 50 years, and SBP significant in models of AP thereafter. BMI was
signifiant in multivariate analysis at most ages to 60 years, and DM only at age 50. A
detailed examination of the subjects with DM prevalent at age 50, showed six men who
developed AP shortly aber that age. This small number of subjects precludes meaningful
interpretation. Smoking was significantly associateci with AP diagnosis only in young
men, to age 45 years.
An early case-control study (Stejfa 1967) compared factors in subjects with AP ta
a control group of the same age, without CHD and free of "hypercholestennemia". It was
reported that those with AP were more likely to have a family history of CHD,
hypercholesterolernia and hypertension. Smoking and overweight were not different
between cases and controls. A cross sectional Swedish study of 5735 men (Hagman et al.
1987) showed uncomplicated AP in 166 to be associated with SBP, DBP, increased
relative body weight, smoking, DM as well as increased s e m cholesterol. low leisure
time physical activity and stress. Dwing a four year follow up of the Swedish cohort,
128 new cases of AP were shown to be related to DM and increased body weight, but not
blood pressure or smoking. In the Framingham report of various manifestations of
cardiovascular disease in subjects 35-64 years of age, SBP and body weight, but not DM
nor smoking, were associated with AP (Stokes et al. 1987).
ln multivariate analysis, it was found that DBP rather than SBP, prior to age 50
years, was more important for the prediction of MI in the MFUS cohort. DM was
significant in the stepwise Cox models at age 50 as was smoking up to age 50 years for
models of MI. BMi was important both at younger ages and at ages 55 and 60 years for
subsequent MI. The Framingham report (Stokes et al. 1987) found SBP and smoking,
but not DM or body weight to be associated with MI occwing before age 65 years. The
Goettingen study of MI in 5,790 men age 40 through 59 years reported age, SBP,
smoking and plasma glucose in addition to cholesterol measurernents to be predictive of
MI over a 10 year follow-up penod (Cremer et al. 1997). They report a combined
incidence of MI and SD to be 5.3 per 1000 pyrs in 10 years through this age group. In
their study, a 33 mm Hg change in SBP was estimated to have an odds ratio of 2.0; this
corresponds to an odds ratio of 1.23 for a 10 mm Hg change, similar to that for MI
reported in this analysis. They estimated a relative risk of MI to be 2.3 for current
smokers versus al1 others. In the MFUS analysis, smokers at age 40 through 59 years had
a relative risk ranging fkom 1.5 to 2.0 compared to non smokers. Diabetics were 2.8
times more likely to develop MI, similar to the relative risk in Our study. The
Copenhagen City Heart Study (Nyboe et al. 1989, Jensen et al. 1991) of 5,923 men 40 - 69 years of age followed over an average of 6.5 years, found SBP, and treatment for high
blood pressure to be strong risk factors for MI. The relative risk of MI increased with
grades of smoking, defined on the basis of amount smoked. Diabetics were at an
increased risk 1.8 times that o f nondiabetics. BMI was only marginally significant in
this study for MI.
In this analysis of factors relatai to SD in the MFUS, smoking was important up
to age 55 years, and SBP was significant in models up to age 65 years and BMI was
significant up to age 45 years. In the Framingham study, 69 men without prior evidence
of CHD were "victims of sudden death" during the first 26 years of follow-up (Schatzkin
et al. 1984). Systolic blood pressure, cholesterol, cigarette smoking, lefi ventncular
hypertrophy and age were associated with sudden death. In younger men, Framingham
report (Stokes et al. 1987) smoking to be the most important of these risk factors for SD.
7.3.5 The value of risk factor tracklng in moàeb of Ischemic Hcart Disease
The evidence suggests that young adult males in the top quintile of the
distribution of SBP, DBP or BMI are likely to remain in the top quintile at older ages.
Tracking was greatest for BMI and more apparent with SBP than with DBP at
comparable ages. This evidence raises a question conceming the risk of cardiovascular
events in later life associated with high levels of blood pressure and BMI in earlier life. It
may be possible that men who "track" in the top end of these distributions from younger
adult ages are those who are at greatest risk for cardiovascular disease. This question was
investigated in this thesis, and it was found that the MFUS subjects whose blood pressure
tracked at higher levels, were in fact at greater risk of subsequent IHD. Similar results
were found for those with consistently high BMI.
One objective of this thesis was to identiQ individual patterns of nsk factors that
would evolve over time and to mode1 characteristics of these patterns as possible
additional factors that might explain variation in nsk of IHD for individuals. The
repeated examinations of MFUS subjects over time has resulted in a longitudinal file of
routine measurements for each man at advancing ages pnor to detection of disease. The
number of measurements for each subject is variable and the spacing of examinations is
not exact. The distributions of blood pressure and BMI were show to change with age,
both in ternis of mean level and variability.
An approach adopted in this thesis to characterise elements of tracking at the level
of the individual was suggested by Lauer (Lauer and Clarke 1988). His method was
originally applied to longitudinal patterns of blood pressure in children, and has not been
applied to prospective studies of IHD in adults. To apply this method, it was necessary to
calculate the age-specific percentile of each SBP, DBP and BMI rneasurement, for each
subject, at al1 ages under observation. For each subject, the ordinary least squares line of
the regression of percentile value on age was detemiined for each risk factor. Three Iines
for each risk factor and each subject were detemiined, based on the measurements fiom
entry and pnor to IHD up to age 50,60 and 70 years. Recognising that the distribution of
the nsk factors change with age, it is important to express this trend over time as a
iùnction of the percentile distribution, raiher than the actual value of the risk factor, if the
descriptors of this line: the dope and variability, are to charactense tracking. These
descriptors of an individual ' s past risk factor profile were considereâ as independent
variables in Cox proportional hazard models, in addition to the variables measured one
point in time. This approach proved usehl in identifjmg aspects of SBP, DBP and BMI
tracking thot improve predictive models of IHD.
The classification of categories of level, trend and variability into discrete groups
dehed individuals with varying propensities to track. For example, those maintaining a
flat trend wiîh age, either at the high, middle or low level of the percentile distribution,
would define individuals with a high degree of tracking. For each risk factor, the
categonsations of tracking were defined based on al1 three parameters of the regession
equation. These categones providd additional signiticant information at some ages for
models of some endpoints.
In addition to the nsk factors measwed and included models at age 50, 60 and 70
years, the average percentile level of SBP, DBP and BMI were significant independent
predictors for IHD. Level was also significant at age 50 years in models for each of the
three IHD manifestations. Categories of BMI tracking added significantly to models at
age 50, for IHD as well as endpoints of MI and SD. This is supporting evidence for the
value of recognizing higher values of blooâ pressure or BM I at younger ages, remaining
high to earîy adult life, even if below traditional hypertensive or obese levels, as being
important contributors in the identification of high nsk young men.
There are few publications in the medical literature exarnining risk factor tracking
in adults as an additional contributor to models of IHD. While methodological
approaches Vary, the results of the MFUS analysis are similar to those reported in the
medical literature. The contribution of variables describing patterns of iepeat
measwements significantly contribute to models of IHD.
The contribution of repeat SBP measurements to Cox proportional hazard models
of IHD were analysed in 1,254 Frarningharn subjects who survived to age 65 years, fiee
of IHD and antihypertensive treatment (Harris et al. 1985). In that report, the average of
SBP measurements before age 65 years was signifiant (p<0.05) while the slope of the
regression line of SBP on age before age 65 years and lability of SBP defined by the
standard deviation of previous SBP measurements contributed marginally to models of
IHD incidence. The Honolulu Heart Study reported that with four measurements of SBP
between ages 40 and 50 years, that the variability about the regression line, but not the
slope of the regression of SBP on age itself were significantly associated with an
increased risk of incident definite CHD over a 1 1.6 year follow-up penod (Grove et al.
1997). The Honolulu Heart Study also reported that the variance of BMI measurements
over the IO-year penod to contributed significantly to the Cox models of incidence IHD.
7.4 Effect modification of risk factors for Ischemic Lieart Disease
7.4.1 Statistical cons iderations
When interpteting the relative risk representing the association between a risk
factor and disease onset over a period of time, a distinction must be kept between two
analytic situations defined by time of measurement of risk factors. The value of a risk
factor can be fixed in time, measured once at baseline, and its effect modeled on
development of disease over time since baseline. Alternatively, the value of a risk factor
can be measured repeatedly and upâated values over time incorporateù into a tirne
dependent covariate model of disease.
Risk factors were measured at one point in time and their effects on risk
quantifiai over varying follow-up time both in the Honolulu Heart Study (Benfante et al.
1989) as well as in the Framingham report (Kannel and Larson 1993) discussed above.
Both these repons interpreted risk factors in light of their eftect for eariy onset or iater
onset disease. In the MFUS analysis, age-specific models of nsk factors for subsequent
IHD were examined using models at the 5-year age examinations. The varying effect
over time of each risk factor at these ages was examined by iesting the proportional
hazard assumption of the Cox model. For the nsk factors measured at a specific age, an
interaction t m with the risk factor and time under study since that examination was
rnodeled. A significant interaction temi in the model would indicate that the risk factor,
measured at one point in time, had a different effect, i.e. a varying relative risk, that
depended on the length of time since examination. There was evidence in the MFUS
analysis with the smoking variable at younger ages to have a changing effect over time.
Subjects changed smoking classification during the course of the study, for example,
smokers at younger ages may have quit smoking during follow-up, and hence lowered
their risk of IHD at later follow-up times.
A risk factor may be updated over time on repeat measurernent at di fferent ages,
and the effect of the nsk factor may be changing depending on the age at examination.
This consideration was examined by modeling each risk factor as a time dependent
covariate by updating values of covariates based on the measurernent detennined at the 5-
year interval examinations pnor to IHD. The significance of an interaction terni defined
by the product of the current value of the risk factor and age at examination tested
whether the effect of a level of the risk factor depended on the age at the examination
when it was rneasured.
Another statistical consideration concems effect modification. When interpreting
effects modified by another variable, a distinction must be made between risk ratio (or
incidence ratio) and nsk difference (or incidence diffaence) mesures arising from
multiplicative and additive models, respectively (Rothan 1986). As an example of this,
a cornparison of the effects for smoking, hypertension and high blood cholesterol as
modified by age were examined for CHD incidence and stroke in men and women over
30 years of follow-up in the Framingham cohort across 10-year age categories from 3 5 4
years through 75-84 years (Psaty et al. 1 990). For both smoking and increased serum
cholesterol, the risk ratio for CHD incidence decreased with age, while the risk difference
did not change. The risk ratio for hypertension and CHD incidence did not significantly
change with age but there was marginal evidence for a signifiant increase in risk
difference. Hence, effect modification may be present, but the effect must be interpreted
in light of an additive (risk difference) or multiplicative (risk ratio) model.
Effect modification by age on nsk factors for IHD in the MFUS data was explored
graphically by examining the incidence of IHD across quintiles of SBP, DBP and BMI,
and in categories for DM and smoking. The ID and IR for this representation of the data
were calculated for the data, and trends in the ID and IR descnbed over age. Similar to
the IR, the relative risk for IHD was calculated for a fixed difference in SBP, DBP and
BMI using the Cox model. While no obvious trend in IR with age was apparent.
significance evidence for a decreasing relative risk with age was found. This seeming
inconsistency can be explained by recognising that the relative risk from the Cox model
relates a unit difference in SBP (or a 10 mm Hg difference in SBP) to nsk of IHD, while
the IR is the ratio of the incidence of IHD in the top quintile to the bottom quintile, and
with increasing age, represents subjects with a minimum difference in SBP for example,
of 18 mm Hg at age 40 years, 2 1 mm Hg at age 50 years, 30 mm Hg at age 60 years and
33 mm Hg at age 70 years. Hence, with increasing age, the effect being contrasted with
the trend in IR, is the effect of an increasing difference of SBP.
7.4.2 lnterpntatioa of the changlng effcet of risk factors for tschemic Heart Disease
It would be incorrect to interpret the declining relative risk of IHD with age for
blood pressure and smoking to mean that these risk factors are not important at older
ages. There has been caution expressed with regard to the interpretation of aging effects
on risk factors in recent review articles (Kaplan et al. 1992, Kaplan et al. 1999) and
specifically for effects on IHD in the MFUS d o r t (Tate et al. 1998) in an accornpanying
editorial (Howard and Goff 1998). In the examination of risk factors in the elderly
(Kaplan et al. 1992) it was suggested that reasons for the declining trend of relative nsk
include selective rnortality or "survivor effect", a lack of tracking of risk factors, change
in the physiological impact of risk factors and change in the clinical manifestation of
disease. These reasons will be described in the forthcoming paragraphs.
One possible explanation is that subjects with and without a particular risk factor
are viewed to be composed of two subgroups, one group susceptible to disease and one
group not susceptible to disease. The survivor effect describes a situation where subjects
susceptible to IHD and having the risk factor (either higher blood pressure or smokers for
exarnple) develop IHD at a greater rate than the group of susceptible subjects without the
risk factor. So with advancing age the group of susceptible subjects with the nsk factor is
diminishing at a greater rate than the group of subjects without the risk factor. Hence,
with advancing time, and age, the two groups are becoming more alike in ternis of their
rate of disease, and hence the relative risk associated witb the risk factor is diminishing.
The relative risk associated with a risk factor for IHD may be declining because
risk factors at younger ages may be more strongly correlated than risk factors at older
ages. This may bias results towards no association of risk factors and IHD at older ages.
The prernise is that there is a strong positive correlation between IHD risk factors at
younger aga, and therefore at least part of the geater effect that is reflected through
larger risk ratios for blood pressure and smoking at younger ages, could be due to a
greater likelihood of clusterhg of risk factors. Those who develop IHD earliest in a
cohort study, would be more likely those who have multiple risk factors. nierefore,
those mnaining at nsk of IHD to older ages will have less clustering of their nsk factors
and hence there will be fewer high nsk individuals with multiple nsk factors. The
changing conelation structure of risk factors with age has not been examined in the
MFUS as a possible reason for the declining effect of risk facton.
There may be a greater chance of misclassification of disease state in the elderly
in contrast to the younger men. This could arise because of the prevalence of subclinical
CVD. The argument is, that in the young there is a lower prevalence of atherosclerosis,
and hence a lower likelihood of misclassifying a subject without IHD as having IHD. In
the elderly, atherosclerosis is more prevalent, and with the higher prevalence of
atherosclerosis cornes a greater chance of misclassi@ng a subject without IHD as having
IHD. These misclassifications would tend to dilute the strength of the association of
these risk facton with IHD. In MFUS, diagnosis of IHD was made prospectively with
previous electrocardiograms and clinical records for reference. The likelihood of
misclassification of IHD should be considered lower than what might be expected in the
general population.
Further, a caution was expressed that reduced relative importance with age should
not be interpreted that the risk factor is less important. From a public health perspective,
in ternis of the burden of disease in the population, recognition that the incidence of IHD
continues to increase with age, and hence is much greater at older ages than at younger
ages, üanslates into a greater absolute effect, risk différence, for blood pressure and
smoking, even though the relative effbct for each of these two factors is reduced.
Even though the incidence density of IHD continues to increase afier age 65
years, the risk factors examined after this age in the MFUS, except for blood pressure and
MI, appear to be unassociated with new IHD events. It is not likely that this could be
attributed to differential survival of MFUS cohort members, as a high interna1 validity
was maintained through the small number of subjects lost to follow-up and a high rate of
completion of follow-up examinations. Further, differential suMval arising From early
deaths of smokers does not seem likely, as the proportion of never smokers rernained
relatively stable fjrom younger to older ages. Other studies have concluded that the risk
factors examined here, as well as serum cholesterol, appear to be poor predictors of late
onset coronary hem disease (Rose and Marmot 1986, Seltzer 1975).
7.5 Conclusions and implications of findinp
IHD is an important health problem in out society and continues to be a major
cause of morbidity and mortality in the elderly. Consequently, the identification of
factors associated with IHD and quantification of levels of risk should be of ongoing
interest for the primary prevention of this disease.
In MFUS, based on multivariate modeling of risk factors, the young man at
greatest risk of IHD is the overweight smoker with elevated blood pressure. By middle
age, DM is an additional important factor, while the effects of smoking and blood
pressure measured at that time, although still significant, are diminished. The tracking of
both b l d pressure and BMI to age 50 years, provideâ additional independent
information to these models. By age 60 or 70 years of age, when current values of blood
pressure were of less importance, and BMI was not statistically significant. patterns
established by ptevious blood pressure and BMI measurernents contributed significantly
to models of IHD. The relative risk of IHD associated with each risk factor changed very
little fiom univariate to multivariate analysis, providing supporting evidence for the
independence of the effects of each of these nsk factors.
It is evident that the profile of significant risk factors for IHD changes with age.
The magnitude of eticct and relative importance of risk factors for 1HD is also changing.
This dynamic relationship must be kept in mind when planning strategies for prevention
of cardiovascular disease. The patterns of risk factors evolving from repeated
measurernent o v a time in the young men of the MFUS cohon, specifically
characterisation of the relationship between blood pressure or BMI with age. should be
included as an important considerations in the planning of primary preventive strategies
for IHD.
While it is recognized that incidence of IHD increases across al1 levels of blood
pressure, the results of this thesis provide supportive evidence that high blood pressure
levels, and hence increased risk of IHD, are identifiable fiom young adult ages. Further,
the tracking characteristics of blood pressure at repeat measuranent over time, exhibiteci
by young men, at levels below hypertensive values, significantly contribute to predictive
models of IHD, beyond the contribution to modeis of current values.
The dissemination of these findings to the medical community will increase
awareness of these issues. Reduction of incident IHD could result if blood pressure could
be moderated before hypertensive levels are reached and prior to ages at increasing

incidence of IHD. As Dr William Kannel of the Framingham Heart Study stated in his
address at the 1997 Canadian Cardiovascular Society annual meeting, "The day must
corne when a first coronary event is not a signal for treabnent, but rather a sign of medical
failure."

8 BIBLIOGRAPHY
Abbtt RD, Carroll M. Interpreting multiple logistic regression coefficients in prospective observational studies. Am J Epidemiol 1984; 1 19:830-836.
Abbott RD. Logistic regression in survival analysis. Am J Epidemiol 1985; 1 2 1 :46547 1.
Allison PD. Event History Analysis: Regression for longitudinal event data Quantitative Applications in the Social Sciences, series no. 07-046. Beverley Hills and London: Sage, 1985.
Andersen PK. Survival analysis 1982- 199 1 : The second decade of the proportional hazards regression model. Statistics in Medicine 199 1 ; 10: 193 1 - 194 1.
Andersen PK. Repeated assessrnent of tisk factors in survival analysis. Stat Meth M d Res 1992; 1 (3):297-3 1 5.
Badimon JJ, Fuster V, Chesebro JH, Badimon L. Coronary Atherosclerosis. A multifactorial disease. Circulation Supplement 11 l993;87(3):113-1116.
Barrett-Connor E, Wingard DL. Sex di fferential in ischaemic heart disease mortali ty in diabetics: a prospective population-based study. Am J Epiderniol 1983; 1 18:489496.
Barrett-Connor E, Khaw K-T. Family history of heart attack as an independent predictor of death due to cardiovascular disease. Circulation 1984;69(6): 1065- 1069.
Barrett-Connor EL, Cohn BA, Wingard DL, Edelstein SL. Why is diabetes rnellitus a stronger risk factor for fatal ischemic hart disease in women than in men? The Rancho Bemardo Study . JAMA 199 1 ;265(5):627-63 1.
Beckett LA, Rosner B, Roche AF, Guo S. Senal changes in blood pressure nom adolescence into adulthood. Am J Epiderniol 1992; 135(10): 1 166- 1 1 77.
Benetos A, Safar M, Rudnichi A, Smulyan H, Richard J-L, Ducimetière P, et al. Pulse Pressure: A predictor of long-term cardiovascular mortaiity in a French male population. Hypertension 1 997;3O: 14 1 0- 14 1 5.
Benfante RJ, Red DM, MacLean CJ, Yano K. Risk factors in middle age that predict earl y and late onset of coronary heart disease. J Clin Epiderniol 1 989;42(2):9S - 1 04.
Benfante R, Reed D, Frank J. Do coronary heart disease risk factors measured in the elderly have the same predictive roles as in the middle aged Cornparisons of relative and attributable risks. Ann Epidemiol 1992;2(3):273-282.
Berenson GS, Wattingney WA, Bao W, Srinivasan SR, Radhaknshnarnurthy B. Rationale to snidy the early n a d history of hart disease: The Bogalusa Heart Study. Am J Med Sci 1995;3 1 û(supp1 1 ):S22-S28.
Black, Sir D and a working party. Obesity: A report of the Royal College of Physicians. J Roy Col1 Phys London 1983; 17(1):5-65.
Blackburn H, Keys A, Simonson E, Rautaharju P, Punsar S. The electrocardiogram in population studies: A classification system. Circulation l96O;2 1 : 1 160- 1 1 75.
Breslow NE. Analysis of survival data under the proportional hazards model. Int Stat Rev 1975;43(1):45-58.
Breslow N. Statistical methods for censored survival data. Environ Health Perspectives l979;32: 181-192.
Breslow NE, Day NE. Statistical Methods in Cancer Research, Volume 1 : The Analysis of Case-Control Studies. Lyon, International Agency for Research in Cancer, 1980.
Breslow N. Elernentary methods of cohort analysis. Int J Epi 1984; 13(1): 1 12- 1 1 5 .
Brophy M. The epidemiology of acute myocardial infarction and ischemic heart disease in Canada: Data fiom 1976 to 199 1. Can J Cardiol 1997; 1 3(5):474-478.
Burt VL, Whelton P, Roccella EJ, Brown C, Cutla JA, Higgins M, et al. Prevalence of hypertension in the US adult population: Results fiom the Third National health and Nutrition Examination Suwey, 1988- 199 1. Hypertension 1995;25:305-3 1 3.
Canadian Centre for Health Information. Causes of Death, Health Reports. Statistics Canada, Catalogue 82-003, 1 990,2( 1 ), 3.
Campbell NRC, Burgess E, Choi BCK, Taylor G, Wilson E, Cléroux J, et al. Lifestylr modifications to prevent and conml hypertension. 1. Methods and an overview of the Canadian rewmmendations. Can Med Assoc J 1 999; l 6 q 9 Supp1):S 1 46.
Cassano PA, Segal MR, Vokonas PS, Weiss ST. Body fat distribution, blwd pressure and hypertension. A prospective cohort study of men in the Nomative Aging Study. Am Epidemiol 1990; 1 :33-48.

Castelli WP, Garnison RJ, Wilson PWF, Abbott RD, Kalousdian S, Kannel WB. Incidence of coronaiy heart disease and lipoprotein cholesterol levels. The Framingham Study. JAMA 1986;256(20):2835-2838.
Cedres BL, Liu K, Stamler J, Dyer AR, Stamler R, Berkson DM, et al. Independent contribution of clectrocardiographic abnomalities to risk of death from coronary heart disease, cardiovascular diseases and al1 causes. Findings of three Chicago epidemiologic studies. Circulation l982;65(1): 146- 1 53.
Chambless LE, Dobson AJ, Pattenon CC, Raines B. On the use of a logistic risk score in predicting nsk of coronary heart disease. Statistics in Medicine 1990;9:385-396.
Chang HH, Lininger LL, Doyle JT, Maccubbin PA, Rothenberg RB. Application of the Cox mode1 as a predictor of relative risk of coronary heart disease in the Albany Study. Statistics in Medicine 1 990;9:287-292.
Colditz GA, Manson JE, Hankinson SE. The Nurses' Hedth Sîudy: 20-year contribution to the understanding of health arnong women. J Women's Health 1997;6(1):49-62.
Collett D. Modelling Sunival Data in Medical Research. 1st edition, London, Chapman and Hall, 1994.
Collins R, Peto R, MacMahon S, Hebert P, Fienbach NH, Eberlein KA, et al. Blood pressure, stroke, and coronary heart disease. Part 2, short tm reductions in blood pressure: ovetview of randomized drug trials in their epiderniological context. Lancet 1990a;335:827-838.
Collins R, Peto R, Godwin J, MacMahon S. Blood pressure and coronary heart disease. (letter) Lancet 1 99Ob;3 36: 3 70-3 7 1 .
Collins R, MacMahon S. Blood pressure, antihypertensive drug treatment and the nsks of stroke and of coronary heart disease. Brit Meû Bull 1994;50(2):272-298.
Cook NR, Cohen J, Hebert P, Taylor 10, Hennekens CH. Implications of small reductions in diastolic blood pressure for pnmary prevention. Arch Intem Med 1995; 1 SWOl-7W.
Cor DR. Regression models and life tables (with discussion). I R Statist Soc B lW2;M: 187-220.
Cox DR. Partial likelihood. Biometrika 1975;62(2):269-276.
Cox DR, Wennuth N. A comment on the coefficient of detemination for binary responses. The Amer Statis 1992;46(1): 1 4 .
Cox D. Some Aspects of Statistical Models. In: Dean K, editor. Population Health Research, Linking Theory and Methods. 1 st ed. London: Sage, 1993: 145- 1 59.
Cremer P, Nage1 D, hhm H, Labrot B, Muller-Berninger R, Elster H, et al. Ten-year follow-up results fiom the Goettingen Risk, Incidence and Prevalence Study (GRIPS). I . Risk factors for myocardial infarction in a cohort of 5790 men. Atherosclerosis 1997; l29:2Z 1-230.
Criqui MH, Barrett-Connor E, Austin M. Diffeiences between respondents and non- respondents in a population-based cardiovascular disease study. Am J Epidemiol 1978; 108:367-372.
Crowley J, Breslow N. Statistical analysis of survival data. Ann Rev Public Health l984;5:385-4 1 1.
D'Agostino RB, Lee M-L, Belanger AJ, Cupples LA, Anderson K, Kannel WB. Relation of pooled logistic regression to time dependent Cox regression analysis: The Frarningham Heart Study. Statistics in Medicine 1990;9: 1501 - 1 5 1 5.
D'Agostino RB, Belanger AJ, Kannel WB, Cruickshank JM. Relation of low diastolic blood pressure to coronary hem disease death in presence of myocardial infarction: the Frarningharn Study. Br Med J 199 1 ;303:385-389.
D' Agostino RB, Wolf PA, Belanger Al, Kannel WB. Stroke risk profile: adjustmeni for antihypertensive medication. The Framingham Study. Stmke 1994;25:40-43.
Dagenais GR, Ahmed 2, Robitaille N-M, Gingras S, Lupien PJ, et al. Total and coronary heart disease mortality in relation to major risk factors - Quebec cardiovascular study. C m J Cardiol 1 WOa;6(2): 59-65.
Dagenais GR, Robitaille N-M, Lupien PI, Christen A, Gingras S, Moo rjani S, et al. First coronary heart disease event rates in relation to major risk factors: Quebec cardiovascular study. Can J Cardiol 1 WOb;6(7):2M-280.
Dawber TR. The Framingham Study, The Epidemioloay of Atherosclerotic Disease. Cambridge Massachusetts: ~arvatd University Press, 1980.
Do11 R, Peto R, Wheatley K, Gray R, Sutherland 1. Mortality in relation to smoking: 40 years' obsmations on male British doctors. Br Med J l994;3W:gO 1-9 1 1.

Egan BM, Bassett DR, Block WD. Comparative effects of overweight on cardiovascular risk in younger vemus older men. Am J Carâiol 1991;67:248-252.
Epstein FH. Contribution of epidemiology to understanding coronary heart disease. In Marmot M, Elliott P, editon. Coronary Heart Disease Epiderniology, From Aetiology to Public Health . New York: Oxford University Press, 1995:20-32.
Foulkes MA, Davis CE. An index of tracking for longitudinal data. Biometrics 198 1 ;37:439-446.
Franklin SS, Gustin 1V W, Wong ND, Larson MG, Weber MA, Kannel WB, et al. Hemodynamic patterns of age-related changes in blood pressure. The Frarningham Heart Study. Circulation 1997;96:308-3 15.
Fried LP, Borhani NO, E ~ g h t P, Furberg CD, Gardin JM, Kronmal RA, et al. The Cardiovascular Health Study : Design and Rationale. Ann Epidemiol 199 1 ; 1 :263-276.
Ford ES, DeStefano F. Risk factors for mortality from al1 causes and from coronary hem disease among persons with diabetes. Am J Epidemiol 199 1 ; 1 33: 1220- 1230.
Gai1 MH. A bibliography and comments on the use of statistical models in epidemiology in the 1980s. Statistics in Medicine 199 1 ; 10: 1 8 19-1 885.
Glenn NV. Cohort Analysis Sage university papa series on Quantitative Applications in the Social Sciences, s i e s no. 07-005. Beverley Hills and London, Sage. 1977.
Gordon T. Hazards in the use of the logistic h c t i o n with special reference to data from prospective cardiovascular studies (editorial). J Chron Dis l974;27:97- 102.
Gordon T, Kannel WB, Halperin M. Predictability of coronary heart disease. J Chron Dis 1979;32:427-440.
Gordon T, KaMe1 WB. Multiple risk fwictions for predicting coronary heart disease: The concept, accuracy and application. Am Heart J 1982; 1 O3(6): 1 03 1 - 1039. Green MS, Symons MJ. A cornparison of the logistic risk h c t i o n and the proportional hazards model in prospective epidemiologic studies. J Chron Dis l983;36( 10):7 15-724.
Green MS. Evaluating the discriminatory power of a multiple logistic regression model. Statistics in Medicine l988;7:S 19-524.
Greenberg RS, Kleinbaum DG. Mathemetical modeling strategies for the analysis of epiderniologic research. Ann Rev Public Health l985;6:223-245.
230
Greenland S. Limitations of the logistic analysis of epidemiologic data. Am J Epidemiol 1979; 1 10(6):693-698.
Grove JS, Reed DM, Yano K, Hwmg L-J. Variability in Systolic Blood Pressure - A risk factor for coronary heart disease? Am J Epidemiol 1997; 145:77 1-776.
Hagman M, Wilhelmsen L, Wedel H, Pennert K. Risk factors for angina pectoris in a population study of Swedish men. J Chron Dis 1987;40(3):265-275.
Hamby RI. Hereditary aspects of coronary artery disease. Am Heart J 198 1 ; 1 O 1 (S):639- 649.
Harrell FE, Lee KL. The practical value of logistic regression. Proceedings of the Seventh Annuai SAS Users Group International Conference. 1985; 1 03 1 - 1036.
Harris T, Cook EF, Kannel W, Schatzkin A, Goldman L. Blood pressure experience and risk of cardiovascular disease in the elderly. Hypertension 1985;7: 1 18- 124.
Harris TB, Savage PJ, Tell GS, Hann M, Kumanyika S, Lynch JC. Carrying the burden of cardiovascular risk in old age: associations of weight and weight change with prevalent cardiovascular disease, nsk factors, and health status in the Cardiovascular Health Study. Am J Clin Nutr 1997;66:837-844.
Hassard TH. Understanding Biostatistics. Mosby-Year Book Inc., St Louis, 199 1.
Hay DI. Socioeconomic status and health status: A study of males in the Canadian Health Survey. Soc Sci Med 1988; 27(l2): 13 17- 1 325.
Health and Welfare Canada. Canadians and Heart Health, Reducing the Risk, Minister of Supply and SeMces Canada, 1995.
Health Promotion Directorate, Health and Welfare Canada. The Canadian Heart Health Initiative: A Policy in Action. Health Promotion 1992;30(4).
Heart and Stroke Foundation of Canada Ottawa: 1991.
Hem and Stroke Foundation of Canada in Canada, 2000. Ottawa: 1999.
Cardiovascular Disease in Canada. 1 99 1 .
The Changing Face of Heart Disease and Stroke

Hebert PR, Rich-Edwards JW, Manson JE, Ridker PM, Cook NR, O'Connor GT. Height and incidence of cardiovascular disease in male physicians. Circulation 1993;88(part 1): 1437-1443.
Hegsted DM, Ausman LM, Johnson JA, Dalla1 GE. Dietary fat and semm lipids: an evaluation of the experimental data. Am J Clin Nutr 1993;57:857-883.
Henderson R. Problems and prediction in survival-data analysis. Statistics in Medicine 1995;14:161-184.
Hennekens CH, Bunng JE. Epiderniology in Medicine. 1 st. ed. Little, Brown and Company: Boston, 1 987.
Hilleboe HE, James G, Doyle JT. Cardiovascular Health Center. 1. Project design for public health research. Am J Pub Health l954;44:85 1-863.
Hjermm 1, Velve Byre K, Holme 1, Leren P. Effect of diet and smoking intervention on the incidence of coronary heart disease. Lancet 198 1 ;Dec 12: 1 304- 1 3 1 0.
Holford TR. Understanding the effects of age, period and cohort on incidence and mortality rates. Ann Rev Pub1 Health 199 1 ; lZ:425-457.
Holford TR. Analysing the temporal effects of age, period and cohon. Stat Meth Med Res 1992; 1 (3):3 17-337.
Hopkins PN, Williams RR. A s w e y of 246 suggested coronary risk factors. Atherosclerosis 198 1 ;40: 1-52.
Hosmer DW, Lemeshow S. Applied Logistic Regression. New York: Wiley, 1989.
Hosmer DW, Taber S, Lerneshow S. The importance of assessing the fit of logistic regression models: A case snidy. Am J Public Health 1 99 1 ;8 1 : 1630- 1635.
Howard G, Wagenknecht LE, Burke GL, Diez-Roux A, Evans GW, McGovern P, et al. Cigarette Smoking and Progression of Atherosclerosis. The Atherosclerosis Risk in Communities (ARIC) Study. JAMA 1998;279: 1 1 9- 124.
Howard G, Goff DC. A cal1 for caution in the interpretation of the observed smaller relative importance of risk factors in the elderly. Ann Epiderniol 1 998;8:4 1 1 -4 14 (editorial).
Hsieh FY. Sample size tables for logistic regression. Statistics in Medicine 1989;8:795- 802.
232

Hsu PH, Mathewson FAL, Rabkin SW. Blood pressure and body mass index patterns - A longitudinal sîuày. J Chron Dis 1977;30:93-113.
Hubert HB, Feinleib M, McNarnara PM, Castelli WP. Obesity as an independent risk factor for cardiovascular disease: A 26-year follow-up of participants of the Framingharn Study . Circulation 1983;67(5):968-977.
Hunink MG, Goldman L, Tosteson AN, Mittlernan MA, Goldman PA, Williams LW, et al. The recent decline in mortality h m coronary hem disease, 1980- 1990. The effect of secular trends in risk factors and treatment. JAMA 1997;277:535-542.
MCLEN Multicenîre Collaborative Group. Socio-economic status and risk factors for cardiovascular disease: A multicentre collaborative study in the international clinical epidemiology network (MCLEN). J Clin Epiderniol 1 994;47( 12): 140 1 - 1409.
Jensen G, Nyboe J, Appleyard M. Schnohr P. Risk factors for acute myocardial infarction in Copenhagen. II: Smoking, alcohol intake, physical activity, obesity, oral contraception. diabetes, lipids, and blood pressure. Eur Heart J 199 1 ; 12:298-308.
IofTres MR, Hamet P, Rabkin SW, Gelskey D, Hogan K, Fodor G. Prevalence, control and awareness of high blood pressure among Canadian adults. Can Med Assoc J 1992; 146( 1 1 ): 1 997-2OO5.
Johnson JV, Stewart W, Hall EM, Fredlund P, Thoerell T. Long-tm psychosocial work environment and cardiovascular mortality among Swedish men. Am J Public Health 1996;86(3):324-33 1.
Kalbfleisch JD, Prentice RL. The Statistical Analysis of Failure Time Data. New York: Wiley, 1980.
Kalton G. Panel Sweys: Adding the fourth dimension. In: Proceedings of Statistics Canada Symposium 92, Design and Analysis of Longitudinal Surveys. Statistics Canada, 1992; 7-18.
Kannel WB, LeBauer EJ, Dawber TR, McNamara P. Relationship of body weight to development of coronary heart disease: the Framingham Study. Circulation 1967;35:734- 744.
Kannel WB, Dawber TR, Kagan A, Revotskie N, Stokes III J. Factors of risk in the development of coronary hem disease - six year follow-up experience. The Framingharn Study. Ann Intem Med 1961;55:33-50.
Kannel WB, Wolf PA, Verter J, McNamara PM. Epidemiologic assessrnent of the role of blood pressure in stroke The Frarningham Study. JAMA 1970;2 14:30 1 -3 10.
Kannel WB, Feinleib M. Naturai history of angina pectons in the Frarningham Sîudy. Am J Cardiol l972;29: 1 54- 163.
Kannel WB, McGee DL. Diabetes and cardiovascular risk factors: The Framingham Study. Circulation 1979;59(1):8- 1 3.
Kannel WB, Schatzkin A. Risk Factor Analysis. Progress in Cardiovascular Diseases 1983;26(4):309-332.
Kannel WB, Abbon RD. incidence and prognosis of wecognized myocardial infarction. An update on the Frarningharn Study. N Engl J Med 1984;3 1 1 : 1 144- 1 147.
Kannel WB. Lipids, diabetes and coronary heart disease: insights From the Framingharn Study. Am Heart 1 1985; 1 10: 1 100- 1 107.
Kannel WB, Belanger A, D'Agostino R, Israel 1. Physical activity and physical demand on the job and nsk of cardiovascular disease and death: The Frarningham Study. Am Heart J l986a; l l2(4):820-825.
Kannel WB, D ' Agostino RB, Belanger AL Fibrinogen, cigarette smoking and risk of cardiovascular disease: insights fiom the Frarningharn study. Am Heart 3 1987; 1 1 3 : 1 006- 1010.
Kannel WB. Left ventricular hypertrophy as a nsk factor: The Framingharn experience. J of Hypertens 199 1 ;9(suppl2):S3-S9.
Kannel WB, Vokonas PS. Demographics of the prevalcnce, incidence and management of coronary heart disease in the elderly and in women. Ann Epidemiol l992;2:5-14.
Kannel WB, Larson M. Long-term epidemiologic prdiction of coronary disease. The Framingham Experience. Cardiology 1993;82: 137- 1 52.
Kannel WB. Blood pressure as a cardiovascular risk factor. Prevention and treatrnent. JAMA l996;27S: 157 1 - 1576. Kaplan EL, Meier P. Nonparamebic estimation h m incomplete observations. JASA l958;53:457-48 1.
Kaplan GA, Haan MN, Cohen RD. Risk factors and the Study of Prevention in the Elderly: Metodological Issues. in Wallace RB, Woolson RF, editon: The Epidemiologic Study of the Elderly. New York: Oxford University Press Inc., 1992: 20-36.
Kaplan GA, Keil JE. Socioeconomic factors and cardiovascular disease: A review of the literature. Circulation 1993;88(4 part 1): 1973- 1998.
Kaplan GA, Haan MN, Wallace RB. Understanding changing risk factor associations with increasing age in adults. AM Rev Public Health l999;20:89-108.
Kaplan NM, Stamler J. Prevention of Coronary Heart Disease, Practical Management of Risk Factors. Philadelohia: WB Saunders Com~anv. 1983: Cha~ter 1.
Karasek R, Baker D, Marxer F, Ahlbom A, Theorell T. Job decision latitude, job demands, and cardiovascular disesse: A prospective study of Sweûish men. Am J Public Health 198 1;7 1(7):694-705.
Kay R. Proportional hazard regression models and the anaiysis of censored survival data. Appl Statist 1977;26(3):227-237.
Keil JE, Sutherland SE, Knapp RG, Gazes PC. Serum cholesterol - Risk factor for coronary disease mortality in younger and older blacks and whites. The Charleston Heart Study, 1960-1 988. AM Epidemiol 1992;2:93-99.
Kemper HCG, Snel J, Verschuur R, Storm-van Essen L. Tracking of health and risk indicators of cardiovaxular di seases h m teenager to adul t : Amsterdam Growth and Health Study. Preventive Medicine 1990; 19:642-655.
Keys A, Aravanis C, Blackburn H, Van Buchern FSP, Buzine R, Djordjevic BS, et al. Coronary heart disease: Overweight and obesity as nsk factors. Ann Intern Med 1972;77: 15-27,
Keys A. Seven Countries: Seven Countries: death and coronary heart disease. Harvard University Press: Cambridge Massachusetts, 1 980.
Khan HA, Sempos CT. Statistical Methods in Epidemiology. New York: Oxford, 1989.
Khaw KT. Sex difierences, hormones, and coronary heart disease. In Marmot M, Elliott P, editors. Comnary Heart Disase Epiderniology, From Aetiology to Public Health . New York: Oxford University Press, 1 995: 274-286.
Kiely DK, Wolf PA, Cupples LA, Beiser AS, Kannel WB. Physical activity and stroke nsk: The Frarningham Study . Am J Epidemiol 1 994; 1 40:608-620.
235

Koch GG, Atkinson SS, Stokes ME. Poisson regression. In Kotz S, Johnson NL, editors. Encyclopedia of Statistical Sciences, 7. New York: John Wiley and Sons Inc., 1986: 32-
Korn EL, Graubard BI, Midthune D. Time-to-event analysis of longitudinal follow-up of a survey: choice of the time-scale. Am J Epidemiol 1997; 145(1):72-80.
Komitzer M, Goldberg R. Contribution of long-tenn follow-up to prediction of coronary heart diseiise (Introduction). Cardiology 1993;82:85-88.
Krahn AD, ManMa J, Tate RB, Mathewson FAL, Cuddy TE. Evidence that height is an independent risk factor for coronary artery disease (The Manitoba Follow-up Study). Am J Cardiol 1994;74:398-399.
Krahn AD, ManMa J, Tate RB, Mathewson FAL, Cuddy TE. The natural history of atrial fibrillation: Incidence, risk factors, and prognosis in the Manitoba Follow-up Study. Am J M d 1995;98:476-484.
Kiamer MS, Boivin J-F. Toward an 'iuiconfounded" classification of epidemiologic research design. J Chron Dis 1 987;40(7):683-688.
Kuller LH. Epidemiology of cardiovascular diseases: current perspectives. Am J Epidemiol 1 976; 1 04425496.
Kupper LL, Janis JM, Karmous A, Greenberg BG. Statistical age-period-cohort analysis: a review and critique. J Chron Dis l985;38( 10):s 1 1-830.
Kuritz SJ, Landis JR, Koch GG. A general overview of Mantel-Haenszel methods: Applications and recent developments. AM Rev Public Health l988;g: 1 23- 1 60.
Labarthe DR. Eissa M, Varas C. Childhood precumn of high blood pressure and elevated cholesterol. AM Rev Pub1 Health 199 1 ; 12:s 19-54 1.
Labarthe DR. High Blood Pressure. In: Labarthe DR Epidemiology and Prevention of Cardiovascular Diseases: A Global Challenge. Gaithersburg, Maryland: Aspen Publishers Inc. 1 !iN8:26 1-29 1.
Larson MG. Assessmmt of cardiovascular risk factors in the elderly: The Framingham Heart Study. Statistics in Medicine 1995; 14: 1 745- 1756.
Lassen NA. Landmark Perspective, Epidemiologic assessrnent of the role of blood pressure in stroke. JAMA l996;276( 1 5): 1279-1 280.
236
Lauer RM, Clarke WR. A longitudinal view of blood pressure during childhood: The Muscatine Study. Statistics in Medicine l988;7:47-57.
Law MR, Wald NJ, Thompson SG. By how much and how quickiy does reduction in senun cholesterol lower nsk of ischernic heari disease? Br Med J 1994;308:367-372.
Leitschuh M, Cupples LA, Kannel W, Gagnon D, Chobanian A. High-nomal blood pressure progression to hypertension in the Framingharn Heart Study. Hypertension 199 1; 1 7~22-27.
Lemeshow S, Hosmer DW. A review of goodness of fit statistics for use in the development of logistic regession models. Am J Epiderniol 1982; 1 15(1):92- 106.
Lemonick MD. What's a short, bald-headed, potbellied guy to do? Time, 1993 March 8; p 54.
Lenfant C. Task force on research in epidemiology and prevention of cardiovascular diseases. Circulation l997;90(6):2609-26 1 7.
Lemer DJ, Kannel WB. Patterns of coronary heart disease morbidity and mortality in the sexes: A 26-year follow-up of the Framingharn population. Am Heart J 1 986; 1 1 1 (2):383- 390.
Lesko SM, Rosenberg L, Shapiro S. A case-control study of baldness in relation to myocardial infarction in men. JAMA 1 993;269(8):998- 1003.
Liddell FDK. The development of cohort studies in epiderniology: a review. J Clin Epidemiol 1988;41(12):1217-1237.
Lissner L, Odell PM, D'Agostino RB, Stokes III J, Kreger BE, Belanger AJ, et al. Variability of body weight and health outcornes in the Framingham population. N Engl J Med 199 1 ;324: 1839- 1844.
Luepker RV, Rosarnond WD, Murphy R, Sprafka JM, Folsom AR, McGovem PG, et al. Socioeceonomic statu and coronary heart disease factor trends. The Minnesota Heart Survey. Circulation 1993;88[part 1]:2 1 72-2 179.
Lynch J, Kaplan GA, Salonen R, Cohen RD, Salonen JT. Socioeconomic status and cmtid atherosclmsis. Circulation l!WS;92: 1 786- 1 792.
MacLean DR, Petrasovits A, Nargundkar M, Connelly PW, MacLeod E, Edwards A, et al. Canadian heart health surveys: a profile of cardiovascular risk, Survey methods and data analysis. Can Med Assoc J 1992;kne 1 Supplement:3d.
MacMahon S, Peto R, Cutler J, Collins R, Sorlie P, Neaton J. Blood pressure, stroke, and coronary hart disease. Part 1, prolonged differences in blood pressure: prospective observational studies corrected for the regtession dilution bias. Lancet 1990;335:765-774.
Manfreda J, Cuddy TE, Tate RB, Krahn A, Mathewson FAL. Regular narrow QRS complex tachycardias in the Manitoba Follow-up Study (1 948-88). Can J Cardiol l992;8(2): 195- 199.
Manolio TA, Kronmal RA, Burke GL, O'Leary DH, Price TR. Short-terni predictors of incident stroke in older persons. The Cardiovascular Health Study. Stroke l996;27: 1479- 1486.
Manson JE, Willett WC, Stampfer MJ, Colditz GA, Hunter DJ, Hankinson SE, et al. Body weight and mortality among women. N Engl J Med 1995;333 :677-685.
Mante1 N, Haenszel W. Statistical aspects of the analysis of data h m retrospective studies of disease. J Nat Cancer Inst 1959;22(4):7 19-748.
Mante1 N. Chi-square tests with one degree of fieedom; extensions of the Mantel- Haenszel procedure. JASA 1963;58:690-700.
Mantel N. Evaluation of s u ~ v a l data and two new rank order statistics arising in its consideration. Cancer Chemo Reports 1 966;50(3): 163- 1 70.
Marmor JK, Oliveria SA, Donahue RP, Garrahie EJ, White MJ, Moore LL, et al. Factors encouraging cohort maintenance in a longitudinal study. J Clin Epidemiol 199 1 ;44(6):53 1-535.
Mannot MG, Rose G, Shipley M, Hamilton PJS. Employment grade and coronary heart disease in British civil servants. J Epi Comm Health 1978;32:244-249.
Mathewson FAL, Vamam GS. Abnormal electrocardiograms in apparently healthy people. 1. Long tenn follow-up shidy. Circulation l96O;2 l(2): 1 96-203.
Mathewson FAL, Brereton DC, Keltie WA, Paul GI. The University of Manitoba Follow- up Study : A prospective investigation of cardiovascular disease. Part 1. General description - mortality and incidence of curonary heart disease. Can M d Assoc J 196Sa;92:947-953.

Mathewson FAL, Brereton DC, Keltie WA, Paul GI. The University of Manitoba Follow- up Study: A prospective investigation of cardiovascular disease. Pari 11. Build, blood pressure and electrocardiographic factors possibly associated with the development of coronary heart disease. Can Med Assoc J 1965b;92: 1002- 1006.
Mathewson FAL, Corne RA, Nelson NA, Hill NL. Blood pressure characteristics of a select group of North American males, followed for 20 years. Can Med Assoc J 1972; 106:549-557.
Mathewson FAL, Mantieda J, Tate RB, Cuddy TE. The University of Manitoba Follow- up Study - An investigation of cardiovascular disease with 35 years of foilow-up ( 1948- 1983). Can J Cadi01 1987;3(8):378-382.
McGee D, Reed D, Yano K. The results of logistic analyses when the variables are highly correlated: an ernpirical exarnple using diet and CHD incidence. J Chron Dis 1984;37(9/l O):7 1 3-7 19.
McMahan CA. An index of tracking. Biometrics 198 1 ;37:447-455.
Meilahn EN, Becker RC, Corrao JM. Primary prevention of coronary heart disease in women. Cardiology 1 995;86:286-298.
Menard J, Day M, Chatellier G, Laragh JH. Some lessons fiom Systolic Hypertension in the Elderly Program (SHEP). Am J Hypertens 1992;5:325-330.
Menard S. Longitudinal Research. Sage university papa series on Quantitative Applications in the Social Sciences, series no. 07-076. Newbury Park, CA: Sage, 1991.
Miller M. The epidemiology of triglyceride as a coronary artery disease risk factor. Clin Cardiol 1999;22(Suppl11): 11 1 -116.
Mittlbikk M, Schemper M. Explained variation for logistic regression. Statistics in Medicine 1996; 1 5: 1 987- 1997.
Mosterd A, D'Agostino RB, Silbershatz H, Sytkowski PA, Kannel WB, Grobbee DE, et al. Trends in the prevalence of hypertension, antihypertensive therapy, and left venrricular hypertrophy nom 1950 to 198% N Engl J Med l999;MO: 122 1 - 1227.
Multiple Risk Factor Intervention Trial Research Gmup. Multiple Risk Factor Intervention Trial. Risk factor changes and mortality results. JAMA l982;248( 12): 1 465- 1477.
Neil HAW, Mant D, Jones L, Morgan B, Mann JI. Lipid Screening: 1s it enough to measure total cholesterol concentration? Br Med J 1 99O;3O 1 :584-587.
Nelson MJ, Ragland DR, Syme SL. Longitudinal prediction of adult blood pressure from juvenile blood pressure levels. Am J Epidemiol 1992; 1 36(6):633-645.
Nyboe J, Jensen G, Appleyard M, Schnolu P. Risk factors for acute myocardial infarction in Copenhagen. 1: Hereditary, educational and socioeconornic factors. Eur Heart J 1989;10:910-916.
Nygiüd O, Nordrehaug JE, Refsum H, Ueland PM, Farstad M, Vollset SE. Plasma homocysteine levels and mortality in patients with coronary artery disease. N Engl J Med l997;337:230-236.
Ode11 PM, Anderson KM, Kannel WB. New models for predicting cardiovascualr events. J Clin Epidemiol 1994;47(6):583-592.
Opit LJ, Oliver G, Salzberg M. Occupation and blood pressure. M d J Aust 1984; 140:760-764.
Pagley PR, Goldberg RJ. Coronary artery disease in women: A population based perspective. Cardiology 1995;86:265-269.
Palomaki H, Partinen M, Juvela S, Kaste M. Snoring as a risk factor for sleep-related brain infarction. Stroke 1989;20: 1 3 1 1- 13 15.
P e d d P, Holford T, Detre K, Chan Y-K. Cornparison of the logistic and Cox tegression models when outcorne is determined in al1 patients after a fixed period of time. J Chron Dis l987;40(8):76 1-767.
Peto R, Pike MC, Annitage P, Breslow NE, Cox DR, Howard SV, et al. Design and analysis of randomized clinical trials requiring prolonged observation of each patient. 1. Introduction and Design. Br J Cancer l976;34:585-6 12.
Peto R, Pike MC, Annitage P, Breslow NE, Cox DR, Howard SV, et al. Design and analysis of randomized clinical trials requiring prolonged observation of each patient. II. Analysis and Examples. Br J Cancer 1977;35: 1-39.
Prentice RL, Kalbfleisch JD. Hazard rate models with wvariates. Biometncs 1979;35:25- 39.
Prentice RL, Shimizu Y, Lin CH, Peterson AV, Kato H, Mason MW, et al. Senal blood pressure measurernents and cardiovascular disease in a Japanese cohort. Am J Epidemiol 1982; 1 l6(l): 1-28.
Prentice RL, Farewell VT. Relative ~ s k and odds ratio regression. Ann Rev Public Health 1986;7:35-S%.
Psaty BM, Koepsell TD, Manolio TA, Longstreth WT, Wagner EH, Wahl PW, et al. Risk ratios and risk differences in estimating the effect of risk factors for cardiovascular disease in the elderly. J Clin Epidemiol 1990;43(9):96 1 -970.
Rabkin SW, Mathewson FAL, Hsu PH. Relation of body weight to development of ischemic heart disease in a cohort of young North Amencan men after a 26 year observation period: The Manitoba Study. Am J Card 1977;39:452458.
Rabkin SW, Mathewson FAL, Tate RB. Predicting risk of ischernic heari disease and cerebrovascular disease fiom systolic and diastolic blood pressure. Ann Intem M d 1 978a;88:342-345.
Rabkin SW, Mathewson FAL, Tate RB. The relationship of blood pressure to stroke prognosis. Ann Intem Med 1978b389: 15-20.
Rabkin SW, Mathewson FAL, Tate RB. Long terni changes in blood pressure and risk of cerebrovascular disease. Stroke 1 978c;9(4):3 19-327.
Rabkin SW, Mathewson FAL, Tate RB. Longitudinal blood pressure measurements during a 26-year observation period and the risk of ischernic heart disease. Am J Epidemiol 1979; 1 09(6):650-662.
Rabkin S W, Mathewson FAL, Tate RB. Chronobiology of Cardiac Sudden Death in Men. JAMA l98O;W(I 2): 1357- 13%.
Rabkin SW, Mathewson FAL, Tate RB. Relationship of blood pressure in 20-39-year-old men to subsequent blood pressure and incidence of hypertension over a 30-year observation period. Circulation 1 982;65:29 1 -300.
Reeder BA, Angel A, Ledoux M, Rabkin SW, Young TK, Sweet LE. Obesity and its relation to cardiovascular disease risk factors in Canadian adults. Cm Med Assoc J 1992; 146(11):2009-20 19.
Reeder BA, Senthilselvan A, Deprés J-P, Angel A, Liu L, Wang H, et al. The association of cardiovascular disease risk factors with abdominal obesity in Canada. Can Meô Assoc J 1997; 1 57(Suppl 1):S39-S45.
24 1
Report of a WHO Study Group. Prevention of Diabetes Mellitus. Geneva, Switzerland: World Health Orgmization 1994; WHO Technical Report Series 844.
Reunanen A, Suhonen O, Aromaa A, Knekt P, Pyorala K. Incidence of different manifestations of coronary heart disease in middle-aged Fimish men and women. Acta Med Scand 1985;2 18: 19-26.
Robertson C, Gandini S, Boyle P. Age-period-cohort models: A comparative study of available methodologies. J Clin Epidemiol 1999;52(6):569-583.
Rockwood K, Tan M-H, Phillips S, McDowell 1. Prevalence of diabetes mellitus in elderly people in Canada: report fiom the Canadian Study of Health and Aging. Age and Ageing l998;27:573-577.
Rose G, Marmot MG. Social class and comnary heart disease. Br Heart J 198 1 ; 45: 13- 19.
Rose G, Shipley M. Plasma cholesterol concentration and death fiom coronary heart disease: 10 year results of the Whitehall study. Br Med S. 1986;293:306-307.
Rosengren A, Welin L, Tsipogianni A, Wilhelmsen L. Impact of cardiovascular nsk factors on coronary heart disease and mortality among middle aged diabetic men: a general population study. Br Med J l989;299: 1 127- 1 1 3 1.
Rosner B, He~ekens CH, Kass EH, Midl WE. Age-specific correlation analysis of longitudinal blood pressure data. Am J Epidemiol 1977; 1 06:306-3 1 3.
Rothman W. Modern Epidemiology Little, Brown and Company: Toronto, 1986.
Salonen JT, Slater JS, Tuomilehto J, Rauramaa R. Leisure time and occupational physical activity: risk of deatb fiom ischemic heart disease. Am S Epidemiol 1988; 127:87-94.
Schatzkin A, Cupples LA, Heeren T, Morelock S, h m e ! WB. Sudden death in the Framingham Heart Study: Diffaences in incidence and risk factors by sex and coronary disease statu. Am J Epidemiol 1984; 120:888-899.
Schemper M, Stare J. Explained variation in survival analysis. Statistics in Medicine 1996; 1 5: 1999-20 12.
Seltzer CC. Smoking and wronary heart disease in the elderly. Am J Med Sci. l9'?5;269:3O9-3 1 5.

SHEP Coopenitive Research Group: Prevention of stroke by antihypertensive drug treatment in older w o n s with isolated systolic hypertension. Final results of the Systolic Hypertension in the Elderly Program (SHEP). JAMA 199 1 ;265(24):3255-3 264.
Shinton R, Beevers G. Meta-analysis of relation between cigarette smoking and stroke. Br Med J 1989;298:789-794.
Smoking and Health. Report of the advisory cornmittee to the Surgeon General of the Public Health Service. Publication no. 1 103. Washington DC: Public Health Service; 1964.
Snidennan A, Michel C, Racine N. Heart disease in patients with diabetes mellitus. J Clin Epidemiol l992;45(12): 1 357- 1 370.
Sorlie P, Gordon T, Kannel WB. Body build and mortality: The Framingham Study. JAMA l980;243(18): 1828- 1 83 1.
Sox HC, Garber AM, Littenberg B. The resting electrocardiogram as a screening test. A clinical analysis. Ann Intern Med 1989; 1 1 1 :489-502.
Stachenko SJ, Reeder BA, Lindsay E, Donovan C, Lessard R, Balram C. Smoking prevalence and associated risk factors in Canadian adults. Can Med Assoc J 1 992; 146(ll): 1989- 1996.
Stamler J, Wentworth D, Ncaton JD. 1s relationship between serum cholesterol and risk of prernature death from coronary heart disease continuous and graded? Findinps in 356,222 primary screenees of the Multiple Risk Factor Intervention Trial (MRFIT). JAMA 1986;256:2823-2828.
Stamler J, Stamler R, Neaton JD. Blood pressure, systolic and diastolic, and cardiovascular risks. Arch Intern Med 1993a; 153598-6 1 5.
Stamler J, Dyer AR, Shekelle RB, Neaton J, Stamler R. Relationship of baseline major risk factors to coronary and all-cause monality, and to longevity: Findings from the long- tenn follow-up of Chicago cohorts. Cardiology l993b;82: 19 1-222.
Stamler J. Established major coronary risk factors. In Marmot M, Elliott P, editors. Coronary Heart Disease Epidmiology, From Aetiolop to Public Health . New York: Oxford University Press, 19953 5-66.
Stejfa M. Predictive significance of risk factors in exenional angina pectons. Cardiologia 1967;s 1 :336-339.
Stokes II1 J, Kannel WB, Wolf PA, Cupples LA, D' Agostino RB. The relative importance of selected risk factors for various manifestations of cardiovascular disease among men and women from age 34 to 64 years old: 30 years of follow-up in the Framingham Study. Circulation 1987;75(suppl V):V65-V73.
Stone MC, Thorp M. Plasma fibrinogen - a major coronary risk factor. J Roy Coll Gen Prac l985;35:565-569.
Tate RB, Manfieda J, Cuddy TE. Progression of Ischemic Heart Disease in the Manitoba Follow-up Study: 1948 - 1993. Can J Cardiol 1995a; 1 l(Suppl E): 1 O I E.
Tate RB, ManMa J, Krahn AD, Cuddy TE. Tracking of Blood Pressure over a 40-year period in the Manitoba Follow-up Study, 1948- 1988. Am J Epidemiol 1995b; l42(9):946- 954,
Tate RB, ManMa J, Cuddy TE. The varying effect of Ischemic Heart Disease risk factors with age. The Manitoba Follow-up Shidy: 1948 - 1993. Can J Cardiol 1996; 1 2(Suppl E): 159.
Tate RB, Manfkda J, Cuddy TE. Tracking of systolic blood pressure and Ischemic Heart Disease. The Manitoba Follow-up Study: 1948 - 1993. Can J Cardiol 1997a: 1 3(Suppl B): 1325.
Tate RB, ManMa J, Cuddy TE. Risk factors for manifestations of Ischemic Heart Disease. University of Manitoba Follow-up Study. Can J Cardiol 1997b; 13(Suppl C):202
Tate RB, ManMa J, Cuddy TE. The Effect of Age on Risk Factors for Ischemic Heart Disease: The Manitoba Follow-up Study, 1948- 1993. AM Epidemiol l998;8:4 1 5-42 1.
The long temi intervention with pravistatin in ischemic heart disease (LIPID) study group. Prevention of cardiovascular events and death with pravistatin in patients with coronary heart disease and a broad range of initial cholesterol. N Engl J Med l998;W: 1349- 1357.
The Nova Scotia-Saskatchewan Carcîiovascular Disease Epiderniology Group. Trends in incidence and mortality fkom acute myocardial infarction in Nova Scotia and Saskatchewan 1974 to 1985. Can J Cardiol 1992;8(3):253-258.
The Pooling Projcct Research Group. Relationship of blood pressure, semm cholesterol, smoking habit, relative weight and ECO abnormalities to incidence of major coronary events: Final repon of the pooling project. J Chron Dis 1978;3 1 :20 1-306.
Thompson DW, Furlan M. Clinical epiderniology of stroke. Neurologic Clinics 1996; l4(2):309-3 1 5.
Truett J, Comfield J, Kannel W. A multivariate andysis of the risk of coronary heart disease in Frarningharn. J Chron Dis l967;20:5 1 1 -524.
Twisk JWR, Kemper HCG, Mellenbergh GJ. Mathematical and analytical aspects of tracking. Epi Rev 1994; l6(2): î 65- 1 83.
U.S. Department of Health and Human Services. The Health Consequences of Smoking: Cardiovascular Disease, a report of the Surgeon General 1983. Public Health Service, Office on Smoking and Health, Rockville, Maryland.
U.S. Department of Health and Human Services: Diabetes Surveillance, Policy Program Research, Annual Report 1990. Public Health Service, Centres for Disease Control.
Wald NJ, Hackshaw AK. Cigarette smoking: an epidemiologic overview. Br Med Bull lW6;52(1):3- 1 1 .
Walker M, Wannamethee G, Whincup PH, Shaper AG. Weight change and risk of heart attack in middle-aged British men. Int J Epidemiol 1995;24:694-703.
Walker SH, Duncan DB. Estimation of the probability of an event as a function of several independent variables. Biometrics 1967;54: 167- 1 79.
Wannamethee G, Shaper AG: Body weight and mortality in middle aged British men: impact of smoking. Br M d J l989;299: 1497- 1 502.
Ware JH, Wu MC. Tracking: prediction of future values from serial measurernents. Biometrics 1 98 1 ;37:427-437.
Welin L, Sviirdsudd K, Wilhelmsen L, Larsson B, Tibblin G. Analysis of tisk factors for stroke in a whort of men bom in 19 13. N Engl J Med l987;3 1 7(9):52 1-526.
Welin L, Eriksson H, Larsson B, Svirdsudd K, Wilhelmsen L, Tibblin G. Risk factors for coronary heart disease during 25 years of follow-up. The Study of Men Born in 19 13. Cardiology 1993;82:223-228.
Wen SW, Krama MS, Hwy J, Hanley JA, Usher RH: Terminal digit preference, random m r , and bias in routine clinical measwment of blood pressure. J Clin Epidemiol l993;46(l O): 1 187- 1 193.
Wielgosz A. Establishing surveillance of cardiovascular disease incidence in Canada. Cm J Cardiol l992;8(3):249-Z 1.
Wigle DT, Mao Y, Wong T, Lane R. Ewnomic Burden of Illness in Canada, 1986. Ottawa, ON: Health and Welfare Canada, 1990.
Williams SRP, Jones E, Bell W, Davies B, Boume MW: Body habitus and coronary heart disease in men. A review with teference to methods of body habitus assessment. Eur Heart J 1 997; 1 8:376-393.
Wilson PWF, Kannel WB: 1s baldness bad for the heart? (editorial) JAMA 1 993;269(8): 1 O3 5- 1036.
Wolf PA, D' Agostino RB, Belanger AJ, Kannel WB. Probability of stroke: a risk profile fiom the Framingham Study. Stroke 199 1 a;22:3 12-3 18.
Wolf PA, Abbott RD, Kannel WB. Atrial fibrillation as an independent risk factor for stroke: The Framingham Study. Stroke 199 1 b;22:983-988.
Wolinsky FD. Age, period and cohort analysis of health-related behaviour. In: Dean K. editor. Population Health Research, Linking nieory and Methods. 1 st ed. London: Sage, 1993: 54-73.
Woodward M, Shewry MC, Smith WCS, Tunstall-Pedoe H: Social statu and coronary heart disease: results from the Scottish Heart Health Study. Preventive Medicine 1992; 2 1 : 136-148.
Woodward M. Epiderniology: Study Design and Data Analysis Chapman and HalVCRC: Boca Raton, 1999.
WHO Scientific Group. The pathological diagnosis of acute ischemic heart disease. WHO Tech Rep Ser l970;44 1 5.
Yano K, Rhoads GG, Kagan A. Coffee, alcohol and nsk of coronary heart disease among Japanese men living in Hawaii. N Engl J Med 1977;297:405-409.
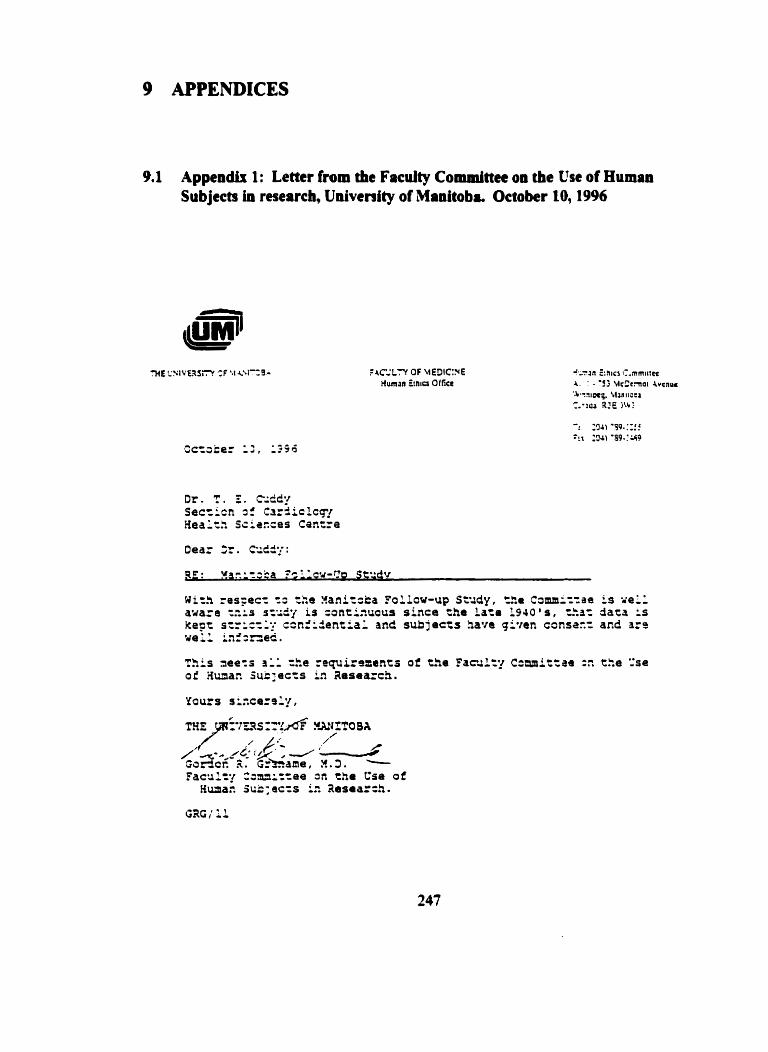
9 APPENDICES
9.1 Appeadlx 1: Letter from the Faculty Cornmittee on the Use of Human Subjects in researcb, Univenity of Manitoba. October 10,1996
'HE C'SIVERSTT CF 1.1 &\1'=3-
Appendix 2: Peer reviewed pubkations from the Manitoba FoUow-up Study
Mathewson FAL, Taylor WJR. Prolonged P-R Interval in Apparently Healthy People. Assoc Life Insur Med Dir America lMî;36:44-73.
Mathewson FAL, Harvie FH. Cornplete Heart Block in an Experienced Pilot. Br Heart J 1957;XIX (2):253-258.
Mathewson FAL. The Abnormal Electrocardiogram Without Other Manifestations of Heart Disease. Man Med Review 1960;40(2): 1 3 1 - 1 33.
Mathewson FAL, Varnam GS. Abnonnal Electrocardiograrns In Apparently Healthy People. Part 1. Long Term Follow-up Study. Circulation 1960;XXI (2): 196-203.
Mathewson FAL, Vamam GS. Abnormal Electrocardiograms in Apparently Healthy People. Part II. The Electrocardiogram in the Diagnosis of Subclinical Myocardial Disease-Serial Records of 32 people. Circulation 1960;XXI (2):204-2 1 3.
Mathewson FAL, Brereton DC. Atrio-Ventricular Heart Block University of Manitoba Follow-up Study Reports-Series 1963. Trans Assoc Life Insur Med Dir of Amerka l964;48:2 10-234.
Mathewson FAL, Brereton DC, Keltie WA, Paul GI. The University of Manitoba Follow-up Study. A Prospective Investigation of Cardiovascular Disease. Part 1. General Description-Mortality and Incidence of Coronary Heart Disease. Can Med Assoc 5 1 965;92:947-953.
Mathewson FAL, Brereton DC, Keltie WA, Paul GI. The University of Manitoba Follow-up Study. A Prospective Investigation of Cardiovascular Disease Part II: Build, Blood Pressure and Electrocardiogniphic Factors Possibly Associated with the Development of Coronary Hem Disease. C m Med Assoc J 1965;92: 1002- 1006.
Mathewson FAL, Come RA, Nelson NA, Hill NL. Blood Pressure Characteristics of a Select Group of North Arnerican Males, Followed for 20 years. Can Med Assoc J 1 972; 106549-557.
10. Come RA, Mathewson FAL. Congenital Cornplete Atriovenaicular Heart Block. A 25 Year Follow-up Study . Am J Cardiol l972;29:4 1 2-4 1 5.
1 1. Mathewson FAL, Rabkin SW, Hsu P-H. Atrioventricular Heart Block-27 Year Follow-up Experience. Assn Life Insur Dir America 1976;60: 1 10- 130.
12. Rabkin SW, Mathewson FAL, Hsu P-H. Relation of Body Weight to Development of Ischemic Heart Disease in a Cohort of Young North American Men AAer a 26 Year Observation Period: The Manitoba Study. Am J Cardiol 1977;39:452-458.
13. Hsu P-H, Mathewson FAL, Rabkin SW. Blood Pressure and Body Mass Index Patterns: A Longitudinal Study. J Chron Dis l977;30:93- 1 1 3.
14. Hsu P-H, Mathewson FAL, Abu-Zeid, HAH, Rabkin SW. Change in Risk Factor and the Development of Chronic Disease-A Methodological Illustration. J Chron Dis l977;30:567-584.
15. Rabkin SW, Mathewson FAL, Tate RB. Prognosis aAer Acute Myocardial Infarction: Relation to Blood Pressure Values Before lnfarction in a Prospective Cardiovascular Study. Am J Cardiol l977;40:604-6 10.
16. Rabkin SW, Mathewson FAL, Tate RB. Preâicting Risk of Ischemic Heart Disease and Cerebrovascular Disease fiom Systolic and Diastolic Blood Pressures. Ann Int Med 1978;88:342-345.
17. Rabkin SW, Mathewson FAL, Tate RB. The Relation of Blood Pressure to Stroke Prognosis. AM Int M d l978;89: 15-20,
18. Rabkin SW, Mathewson FAL, Tate RB. Long Tem Changes in Blood Pressure and Risk of Cerebrovascular Disease. Stroke 1978;9(4):3 19-327.
19. Rabkin SW, Mathcwson FAL, Tate RB. Natural History of Marked Lefi Axis Deviation (Left Anterior Hemi-block): Am J Cardiol 1979;43:605-611.
20. Rabkin SW Mathewson FAL, Tate RB. Longitudinal Blood Pressure Measurements During a 26 Year Observation Period and the Risk of Ischemic Heart Disease. Am J Epiderniol 1979; 109(6):650-662.
2 1. Rabkin SW, Mathewson FAL, Tate RB. Risk of Sudden Death for Intravenûicular Conduction Defects in men without apparent Heart Disease: Manitoba Study. International Congress Series no. 49 1, Ex- Medica, Amsterdam-Oxford- Princeton, 1979: 585-587.
22. Rabkin SW, Mathewson FAL, Tate RB. Nahiral History of Lefi Bundle Branch Block. Br Head 3 l980;43: 164- 169.
23. Rabkin SW, Mathewson FAL, Tate RB. Chronobiology of Cardiac Sudden Death in Men. JAMA 1980;244(12): 1357-1358.
24. Rabkh SW, Mathewson FAL, Tate RB. Relationship of Venüicular Ectopy in Men Without Apparent Heart Disease to Occurrence of Ischemic Heart Disease and Sudden Death. Am Heart J 1981; 101(2): 135-142.
25. Rabkin SW, Mathewson FAL, Tate RB. The Natwal History of Right Bundle Branch Block and Frontal Plane QRS Axis in Apparently Healthy Men. Chest 1 98 1 $0: 19 1 - 196,
26. Rabkin SW, Mathewson FAL, Tate RB. Long Tem Follow-up of Incomplete Right Bundle Branch Block: The Risk of Development of Complete Right Bundle Branch Block. J Elcctrocardiology 198 1 ; 14(4):379-386.
27. Rabkin SW, Mathewson FAL, Tate RB. The Relationship of Marked Lefi Axis Deviation to the Risk of Ischemic Heart Disease, Int J Cardiol 198 1 ; 1 : 1 69- 1 78.
28. Rabkin SW, Mathewson FAL, Tate RB. Relationship of Blood Pressure in 20-39 yearsld-men to Subsequent Blood Pressure and Incidence of Hypertension over a 30- year Observation Period. Circulation l982;65(2):29 1 -300.
29. Rabkin SW, Mathewson FAL, Tate RB. The Elecm>cardiogram in Apparently Healthy Men and the Risk of Sudden Death. Br Heart J 1982;47:546-552.
30. Mathewson FAL, Mymin D, Manfieda J, Tate RB. The University of Manitoba Follow-Up Study natural history of heart disease in World War II aircrew. State of the Shidy - 1983. U Man Med J 1984;54(2):8 1 -86.
3 1. Mymin D, Mathewson FAL, Tate RB, Manfreda J. The natural history of Primary first-degree atriovenüicular heart block. N Eng J Med 1986;3 15: 1 183- 1 187.
32. Mathewson FAL, ManMa J, Tate RB, Cuddy TE. The University of Manitoba Follow-up Study - An investigation of cardiovascular disease with 35 years of follow- up ( 1948- 1983). Can J Cardiol 1987;3(8):378-382.
33. Krahn AD, Manfieda J, Tate RB, Mathewson FAL, Cuddy TE. The Natural History of Electmcardiographic Preexcitation in Men. AM Intem Med 1992; 1 16:456460.
34. ManMa J, Cuddy TE, Tate RB, Krahn A, Mathewson FAL. Regular narrow QRS complex tachycardias in the Manitoba Follow-up Study (1 948- 1988). Can J Cardiol l992;8(2): 195- 199.
35. Krahn AD, Mathewson FAL, Cuddy TE. The Naniral History of Asymptomatic Complete Heart Block. A Case Series from the Manitoba Follow-up Study. Can J Cardiol l992;8( t 0): 1047- 1049.
36. Krahn AD, M a n M a J, Tate RB, Mathewson FAL, Cuddy TE. Evidence that Height is an Independent Risk Factor for Coronary Artery Disease (The Manitoba Follow-up Study). Am J Cardiol 1994;74:398-399.
37. Krahn AD, ManMa J, Tate RB, Mathewson FAL, Cuddy, TE. The Natural History of Atrial Fibrillation: Incidence, Risk Factors and Prognosis in the Manitoba Follow- Up Study. Am J Med 1995;98:476-484.
38. Tate RB, Manfreda J, Krahn AD, Cuddy TE. Tracking of Blood Pressure in the Manitoba Follow-up Study, 1948- 1988. Am J Epidemiol 1995; 14 1 (9):946-954.
39. Tate RB, M a n M a J, Cuddy TE. The Efféct of Age on Risk Factors for Ischemic Heart Disease: The Manitoba Follow-up Study, 1948- 1993. Ann Epidemiol 1998;8:4 1 5-42 1. (with editorial p 4 1 1-4 14)
Related Documents