Robert A. Cummins Australian Centre on Quality of Life Deakin University Measurement scales and depression http://www.deakin.edu.au/ research/acqol

Robert A. Cummins Australian Centre on Quality of Life Deakin University Measurement scales and depression .
Dec 17, 2015
Welcome message from author
This document is posted to help you gain knowledge. Please leave a comment to let me know what you think about it! Share it to your friends and learn new things together.
Transcript
Robert A. CumminsAustralian Centre on Quality of Life
Deakin University
Measurement scales and depression
http://www.deakin.edu.au/research/acqol
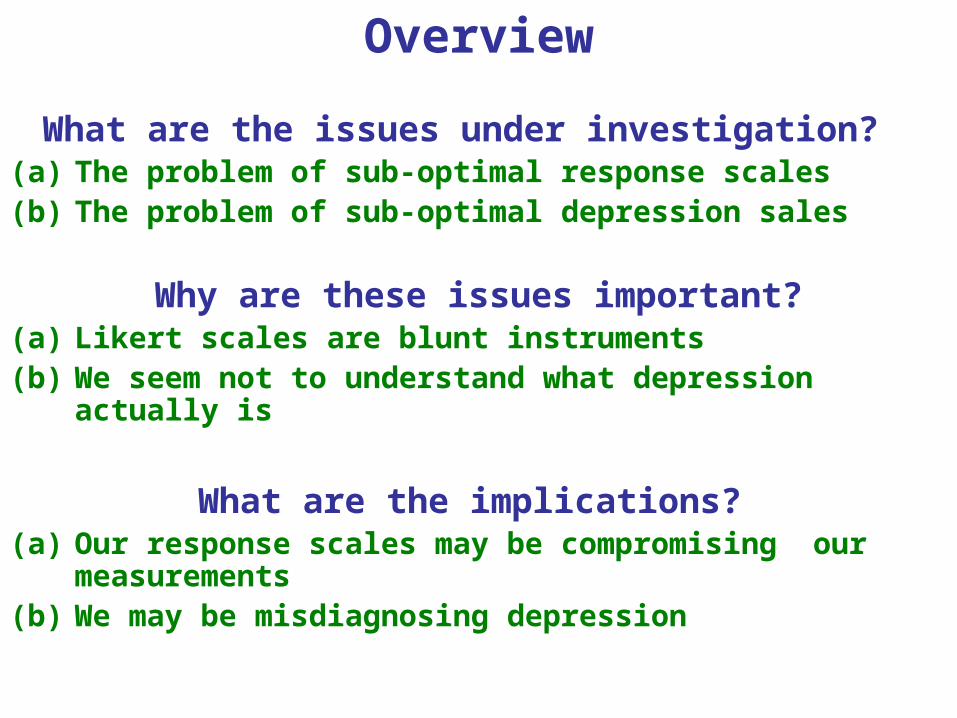
What are the issues under investigation? (a) The problem of sub-optimal response scales(b) The problem of sub-optimal depression sales
Why are these issues important?(a) Likert scales are blunt instruments(b) We seem not to understand what depression actually is
What are the implications? (a) Our response scales may be compromising our measurements(b) We may be misdiagnosing depression
Overview
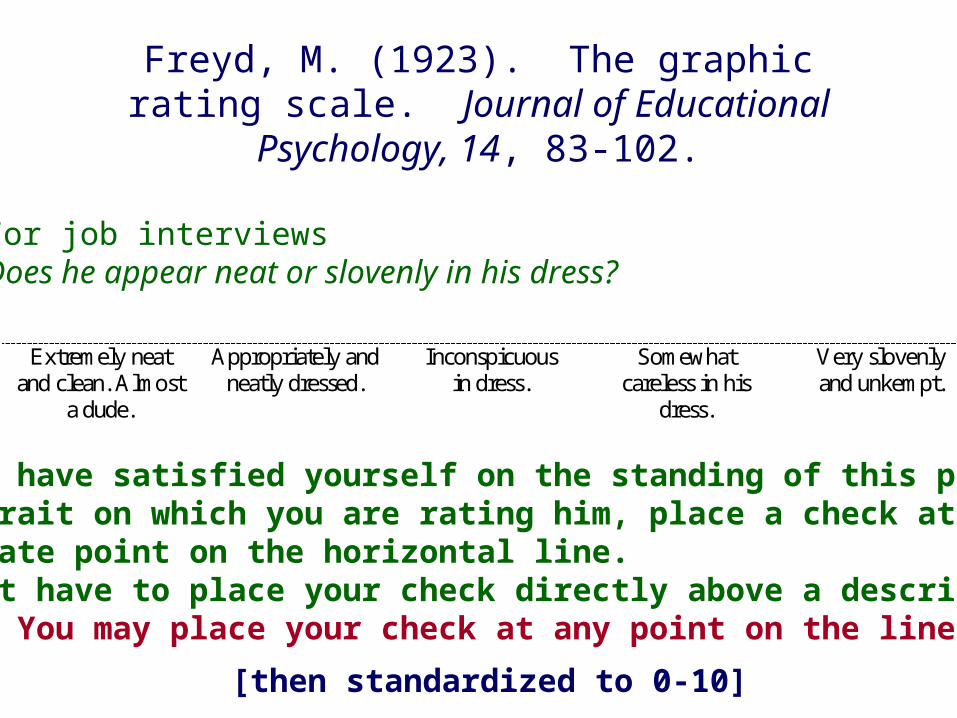
Freyd, M. (1923). The graphic rating scale. Journal of Educational Psychology, 14, 83-102.
“When you have satisfied yourself on the standing of this person in the trait on which you are rating him, place a check at the appropriate point on the horizontal line. You do not have to place your check directly above a descriptive phrase. You may place your check at any point on the line.” (p.88).
Extremely neat and clean. Almost
a dude.
Appropriately and neatly dressed.
Inconspicuous in dress.
Somewhat careless in his
dress.
Very slovenly and unkempt.
For job interviewsDoes he appear neat or slovenly in his dress?
[then standardized to 0-10]
1903 - 1981
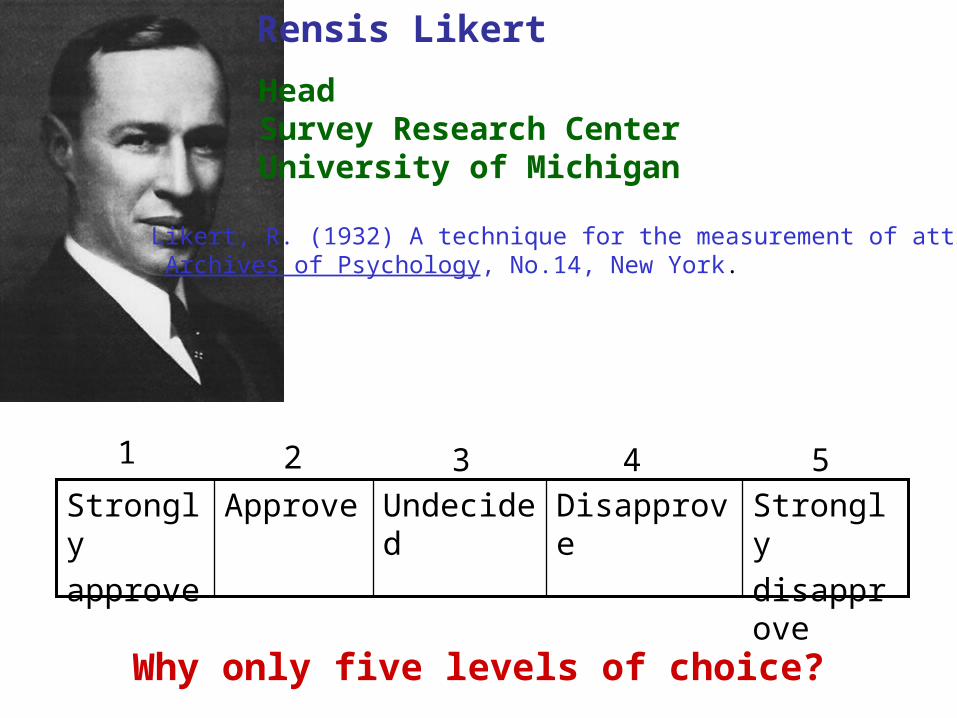
Rensis Likert
HeadSurvey Research CenterUniversity of Michigan
Why only five levels of choice?
Likert, R. (1932) A technique for the measurement of attitudes. Archives of Psychology, No.14, New York.
Strongly
disapprove
DisapproveUndecidedApproveStrongly
approve
1 2 3 4 5
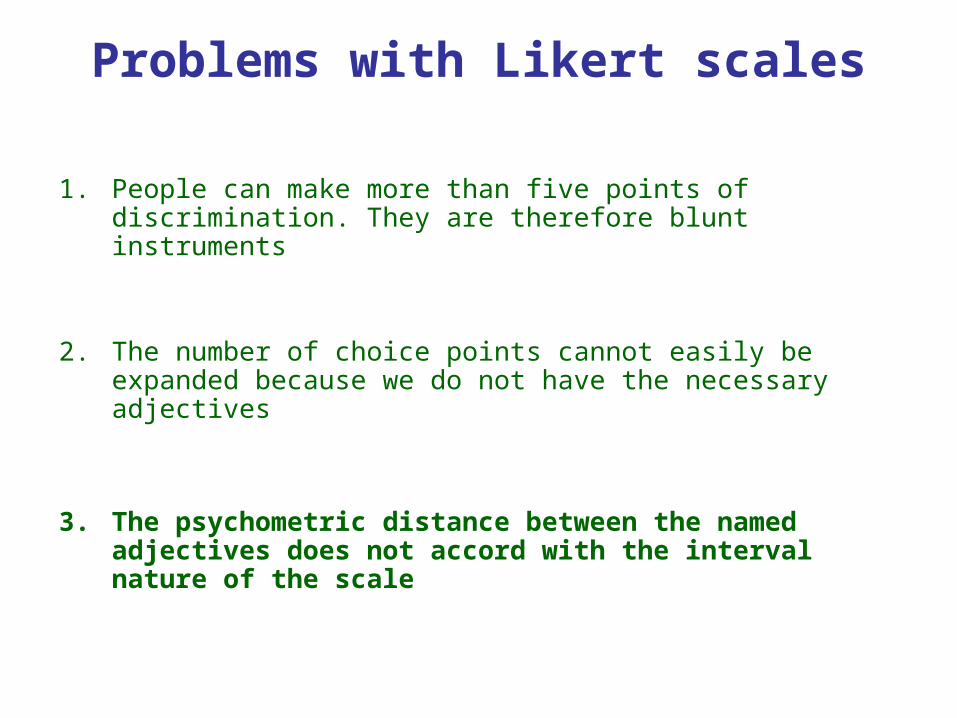
1. People can make more than five points of discrimination. They are therefore blunt instruments, not capturing the full extent of discrimination
Problem #1
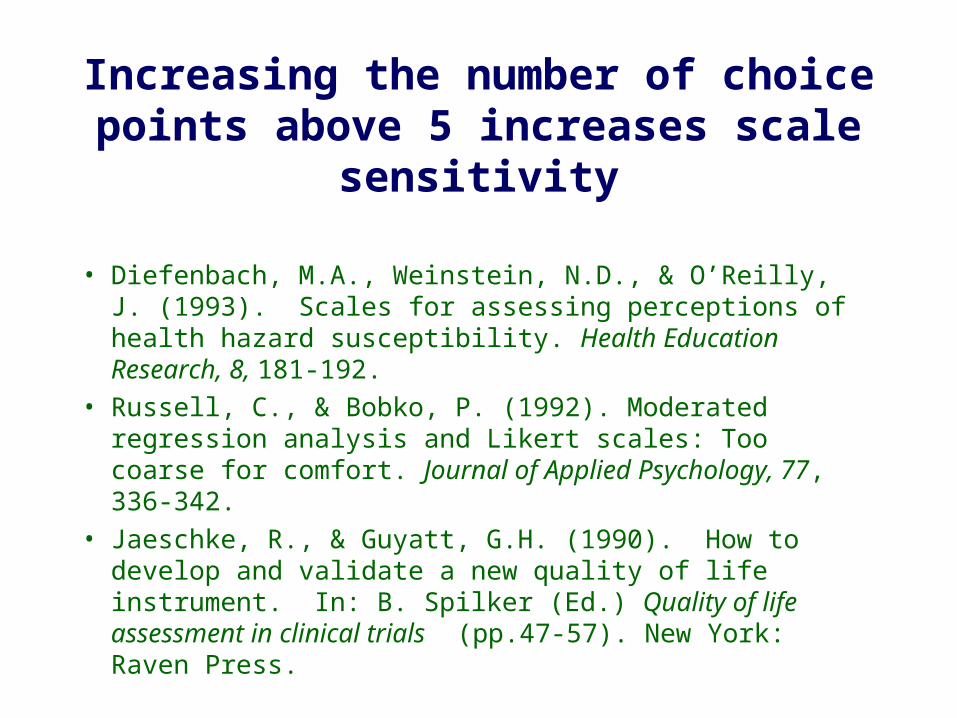
Increasing the number of choice points above 5 increases scale sensitivity
• Diefenbach, M.A., Weinstein, N.D., & O’Reilly, J. (1993). Scales for assessing perceptions of health hazard susceptibility. Health Education Research, 8, 181-192.
• Russell, C., & Bobko, P. (1992). Moderated regression analysis and Likert scales: Too coarse for comfort. Journal of Applied Psychology, 77, 336-342.
• Jaeschke, R., & Guyatt, G.H. (1990). How to develop and validate a new quality of life instrument. In: B. Spilker (Ed.) Quality of life assessment in clinical trials (pp.47-57). New York: Raven Press.
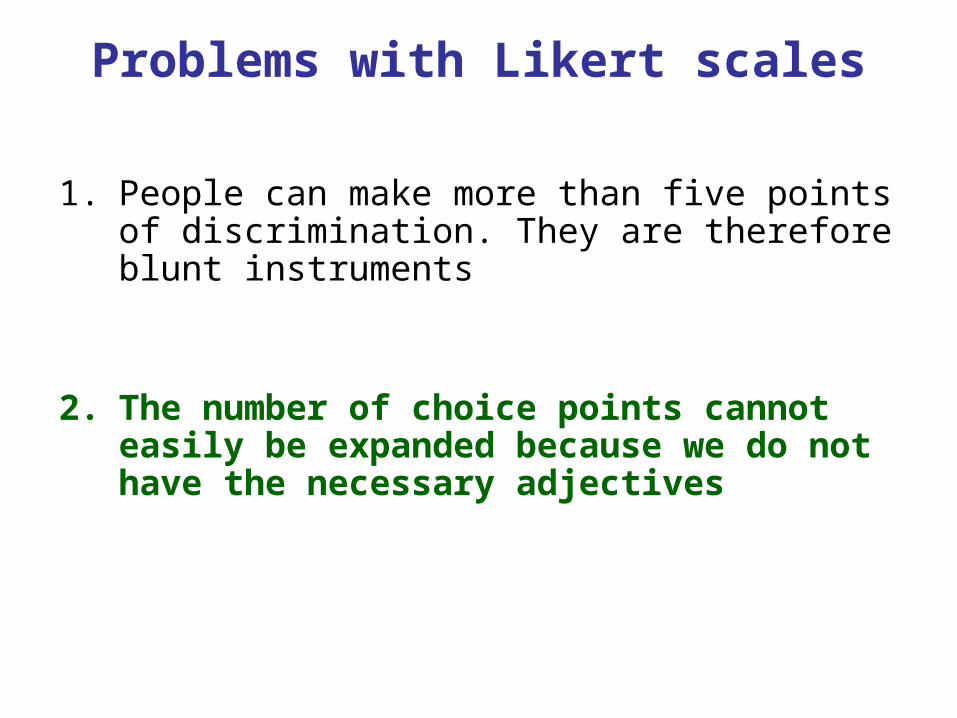
1. People can make more than five points of discrimination. They are therefore blunt instruments
2. The number of choice points cannot easily be expanded because we do not have the necessary adjectives
Problems with Likert scales
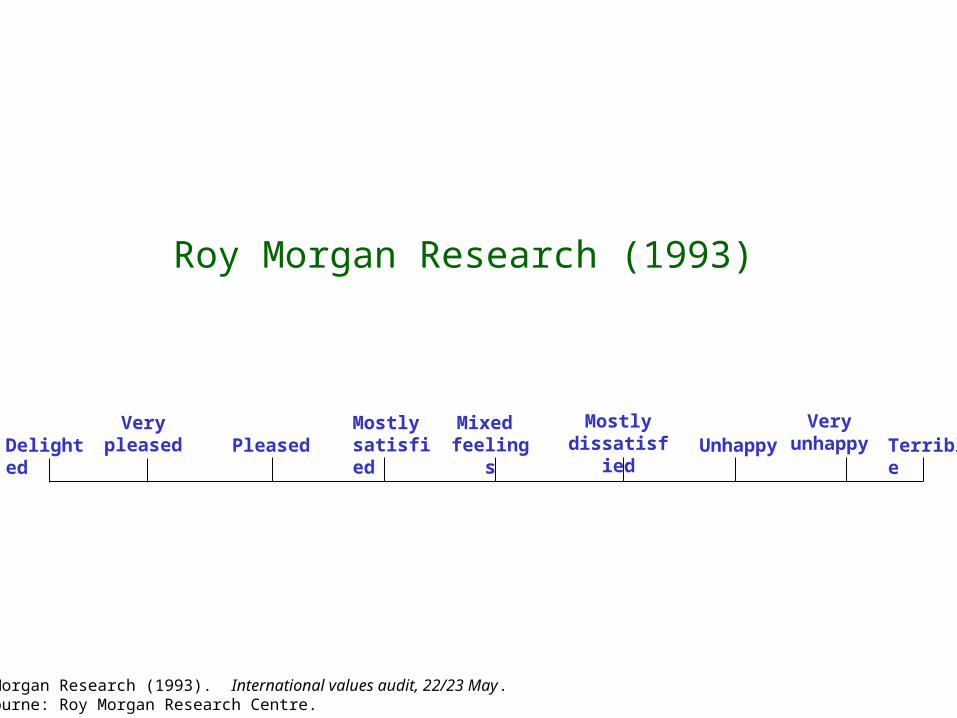
Roy Morgan Research (1993)
Roy Morgan Research (1993). International values audit, 22/23 May. Melbourne: Roy Morgan Research Centre.
DelightedVery
pleased PleasedMostlysatisfied
Mixed feelings Unhappy
Mostlydissatisfied
Veryunhappy Terrible
1. People can make more than five points of discrimination. They are therefore blunt instruments
2. The number of choice points cannot easily be expanded because we do not have the necessary adjectives
3. The psychometric distance between the named adjectives does not accord with the interval nature of the scale
Problems with Likert scales
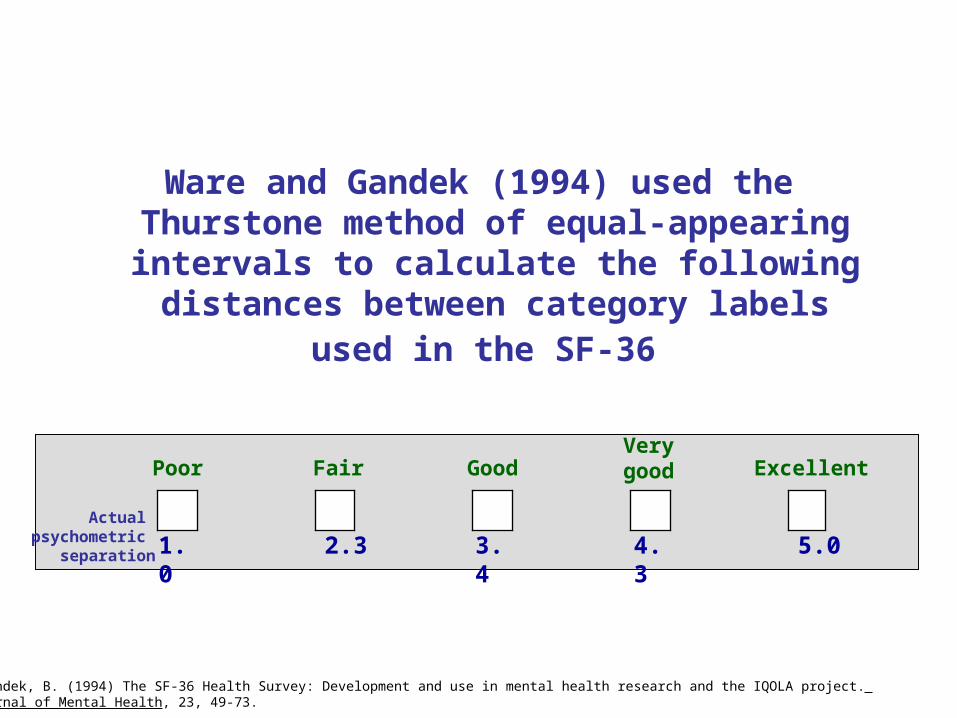
Ware and Gandek (1994) used the Thurstone method of equal-appearing intervals to
calculate the following distances between category labels used in the SF-36
5.04.33.42.31.0Actual
psychometric separation
Poor Fair GoodVerygood Excellent
Ware, J. E., & Gandek, B. (1994) The SF-36 Health Survey: Development and use in mental health research and the IQOLA project. International Journal of Mental Health, 23, 49-73.
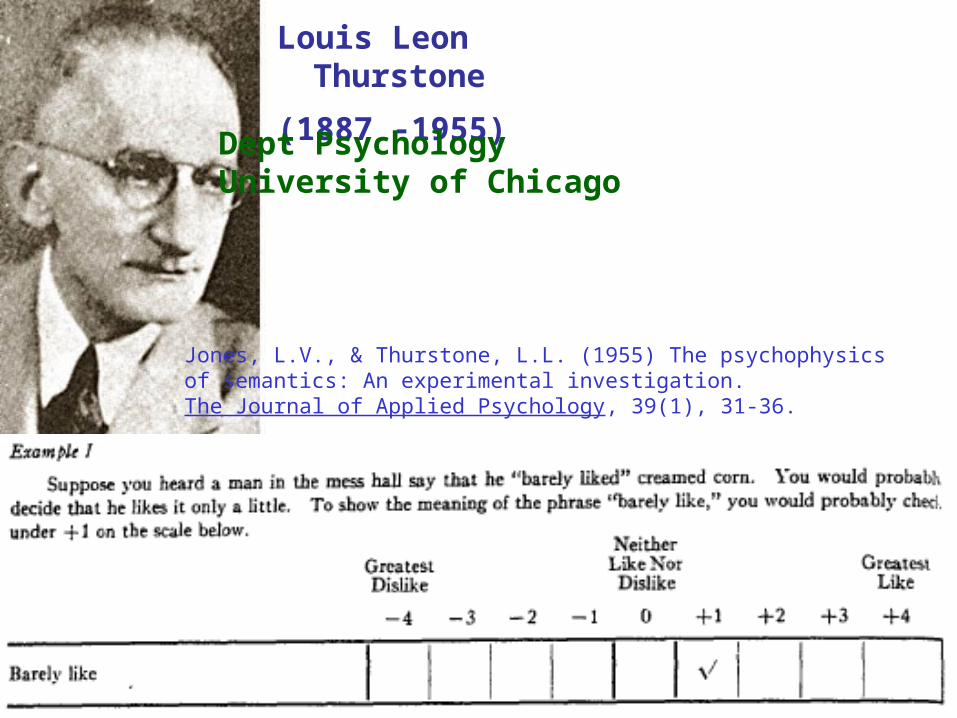
Louis Leon Thurstone
(1887 -1955)
Dept PsychologyUniversity of Chicago
Jones, L.V., & Thurstone, L.L. (1955) The psychophysics of semantics: An experimental investigation. The Journal of Applied Psychology, 39(1), 31-36.
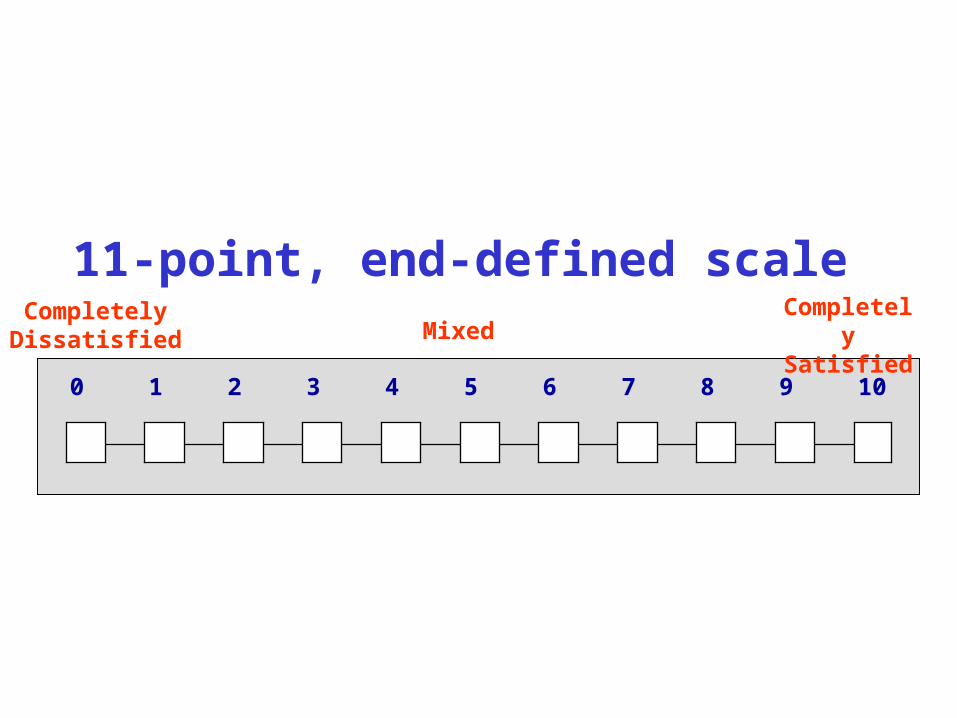
11-point, end-defined scale
109876543210
CompletelyDissatisfied
CompletelySatisfiedMixed
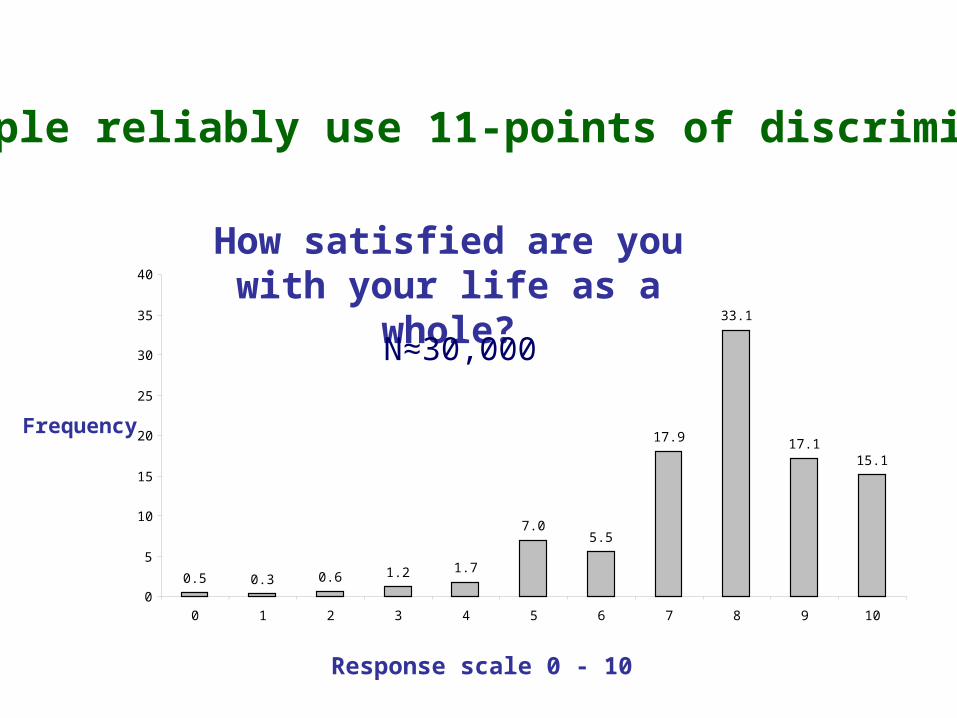
How satisfied are you with your life as a whole?
0.5 0.3 0.6 1.2 1.7
7.05.5
17.9
33.1
17.115.1
0
5
10
15
20
25
30
35
40
0 1 2 3 4 5 6 7 8 9 10
Frequency
Response scale 0 - 10
Can people reliably use 11-points of discrimination?
N≈30,000
The relationship between SWB and depression
Can the Subjective Wellbeing, or Positive Affect, be used as a measure of depression?
Critical issue #2
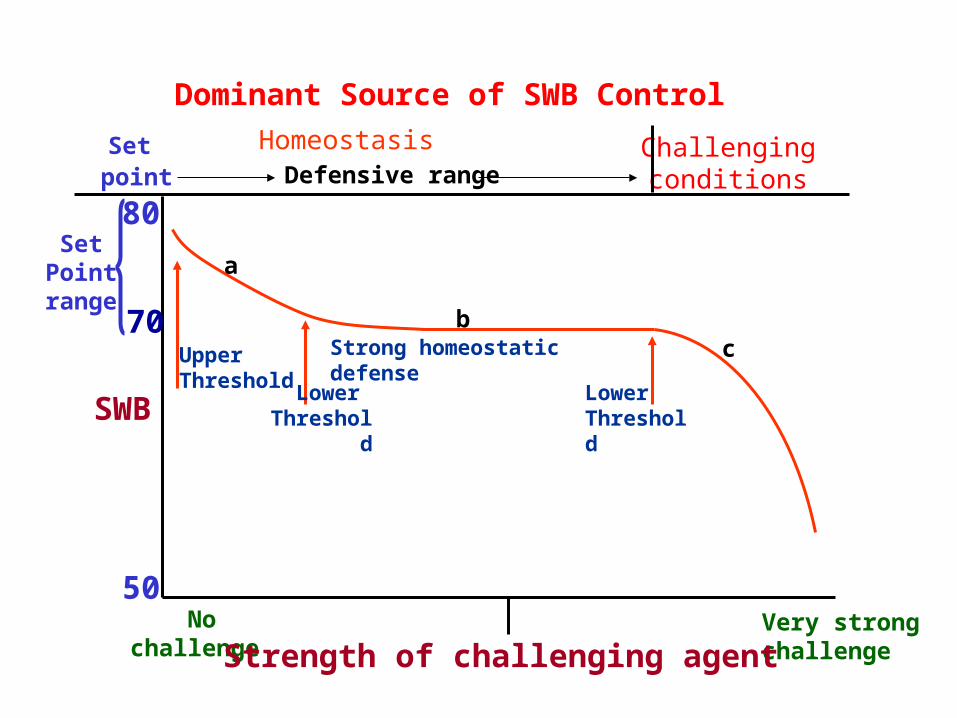
Dominant Source of SWB Control
Challengingconditions
SetPointrange
SWB
50
UpperThreshold
Lower Threshold
Nochallenge
Set point
Homeostasis
Very strongchallengeStrength of challenging agent
70
Defensive range
Strong homeostatic defense
80
a
bc
Lower Threshold
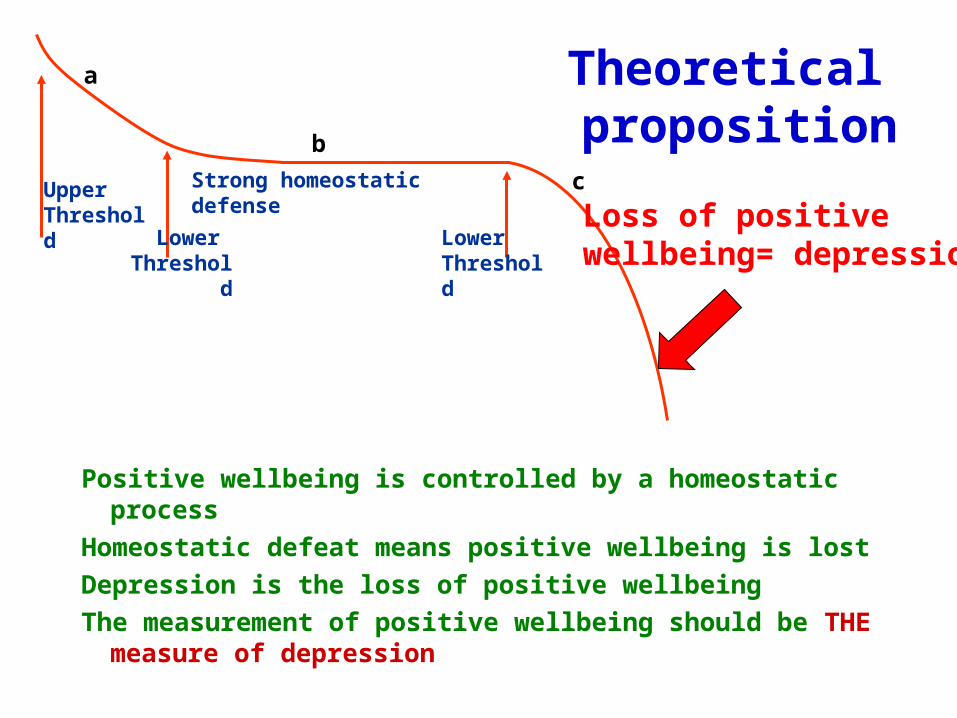
Theoretical proposition
Positive wellbeing is controlled by a homeostatic process
Homeostatic defeat means positive wellbeing is lost
Depression is the loss of positive wellbeing
The measurement of positive wellbeing should be THE measure of depression
UpperThreshold
Lower Threshold
Strong homeostatic defense
a
b
c
Lower Threshold
Loss of positivewellbeing= depression
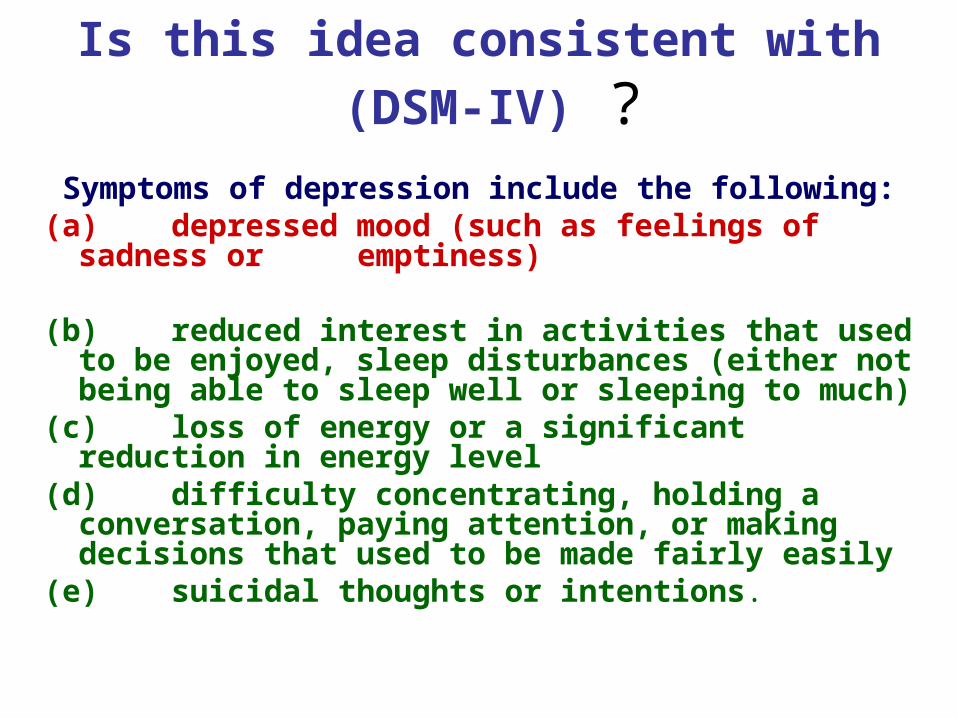
Is this idea consistent with (DSM-IV) ?
Symptoms of depression include the following:(a) depressed mood (such as feelings of sadness or
emptiness)
(b) reduced interest in activities that used to be enjoyed, sleep disturbances (either not being able to sleep well or sleeping to much)
(c) loss of energy or a significant reduction in energy level
(d) difficulty concentrating, holding a conversation, paying attention, or making decisions that used to be made fairly easily
(e) suicidal thoughts or intentions.
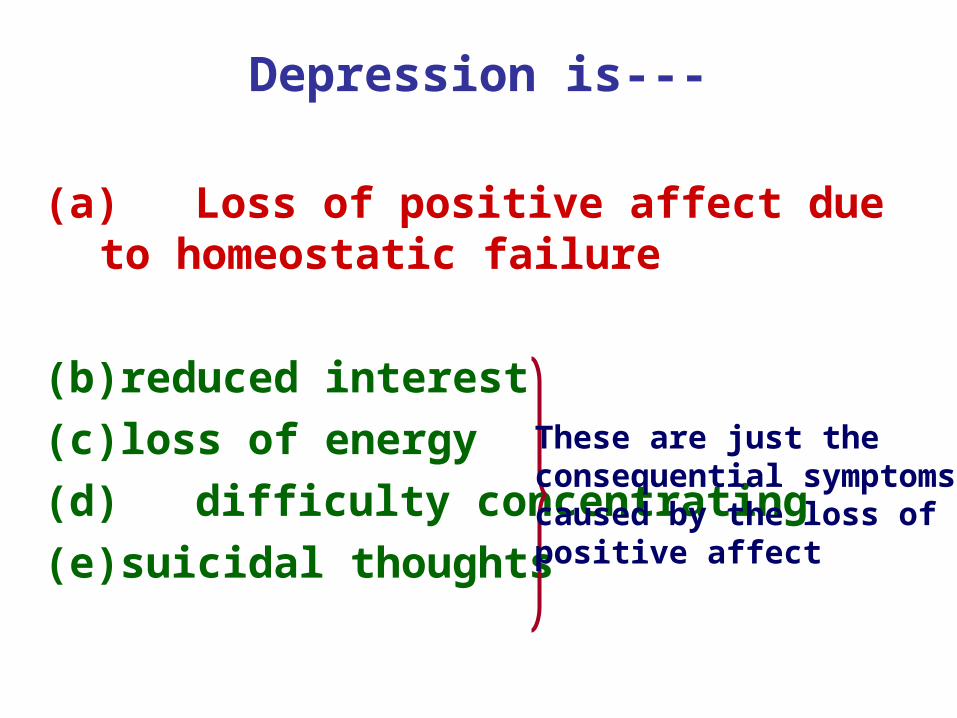
Depression is---
(a) Loss of positive affect due to homeostatic failure
(b)reduced interest
(c) loss of energy
(d)difficulty concentrating
(e) suicidal thoughts
These are just the consequential symptomscaused by the loss of positive affect
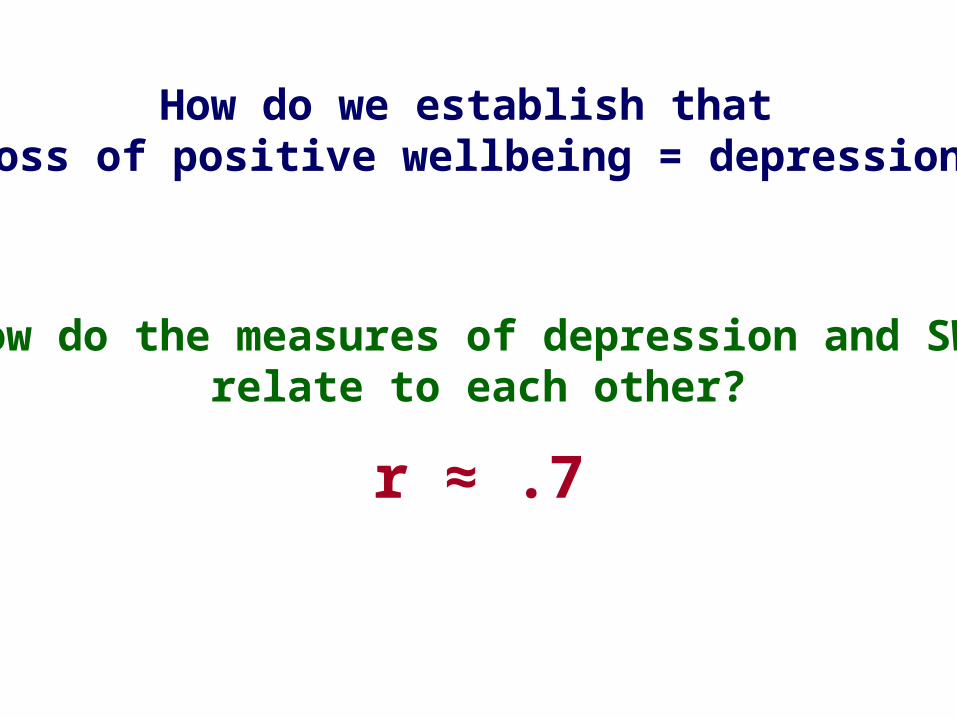
How do the measures of depression and SWB relate to each other?
r ≈ .7
How do we establish that loss of positive wellbeing = depression?
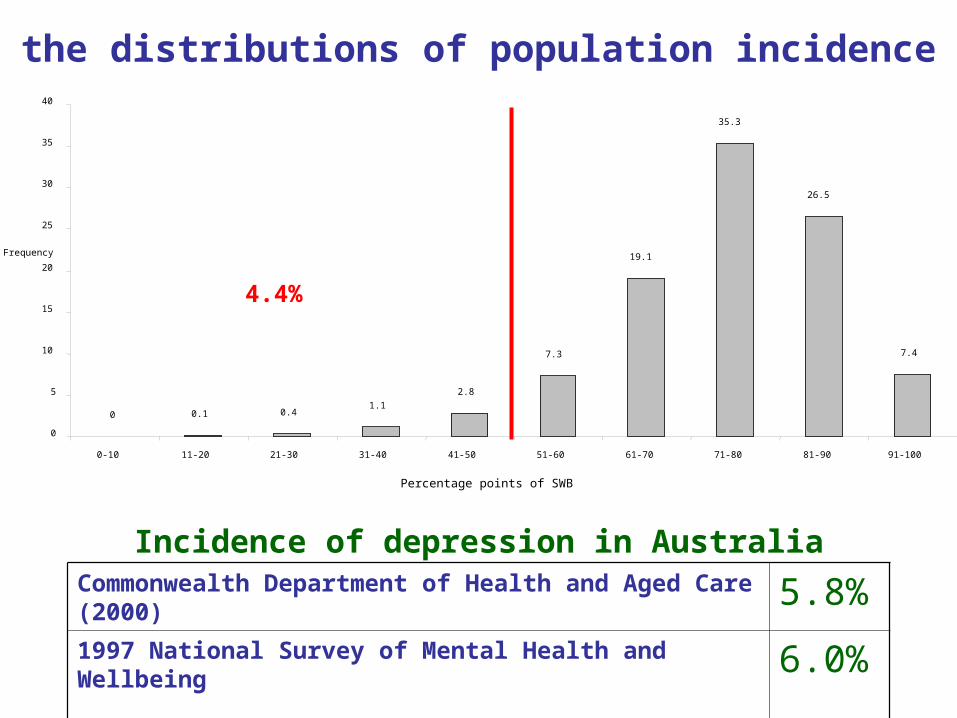
4.4%
0 0.1 0.41.1
2.8
7.3
19.1
35.3
26.5
7.4
0
5
10
15
20
25
30
35
40
0-10 11-20 21-30 31-40 41-50 51-60 61-70 71-80 81-90 91-100
Frequency
Percentage points of SWB
How do the distributions of population incidence match?
Commonwealth Department of Health and Aged Care (2000) 5.8%1997 National Survey of Mental Health and Wellbeing 6.0%
Incidence of depression in Australia
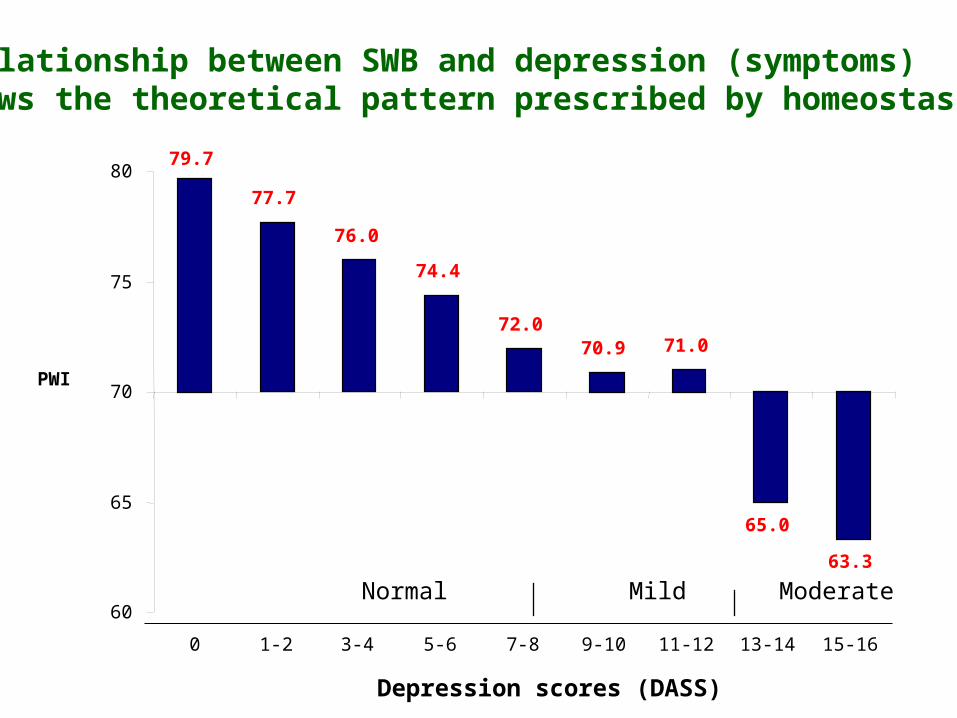
Depression scores (DASS)
Normal Mild Moderate
79.7
77.7
76.0
74.4
72.070.9 71.0
65.0
63.3
60
65
70
75
80
0 1-2 3-4 5-6 7-8 9-10 11-12 13-14 15-16
PWI
The relationship between SWB and depression (symptoms) follows the theoretical pattern prescribed by homeostasis.
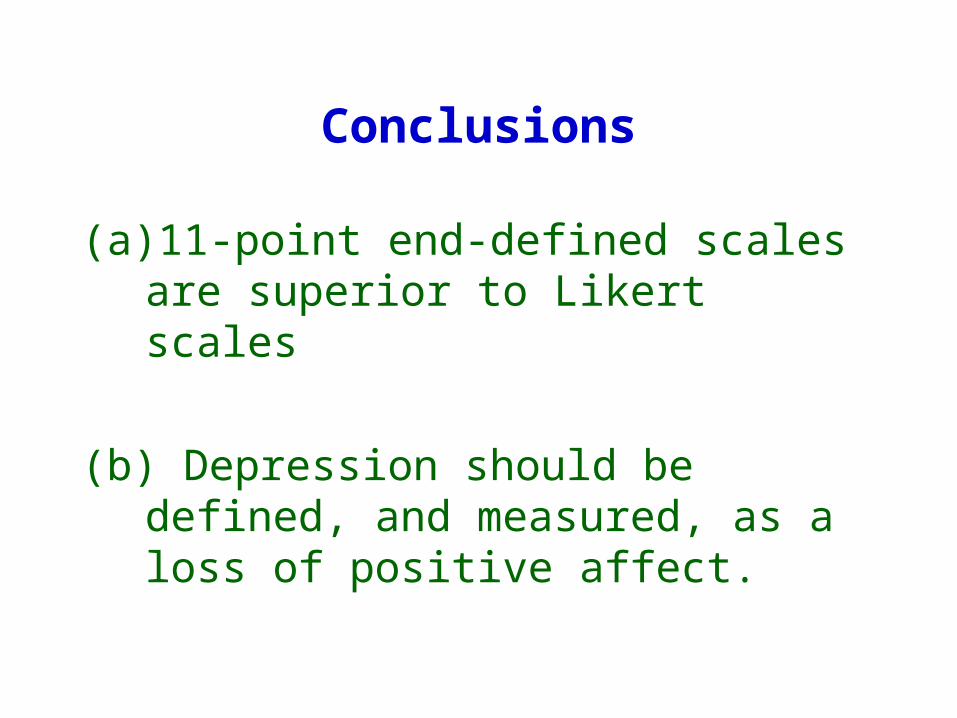
Conclusions
(a) 11-point end-defined scales are superior to Likert scales
(b) Depression should be defined, and measured, as a loss of positive affect.
Related Documents