Roadshow presentation Q4 2017 February/March 2018

Welcome message from author
This document is posted to help you gain knowledge. Please leave a comment to let me know what you think about it! Share it to your friends and learn new things together.
Transcript

Roadshow presentation
Q4 2017February/March 2018
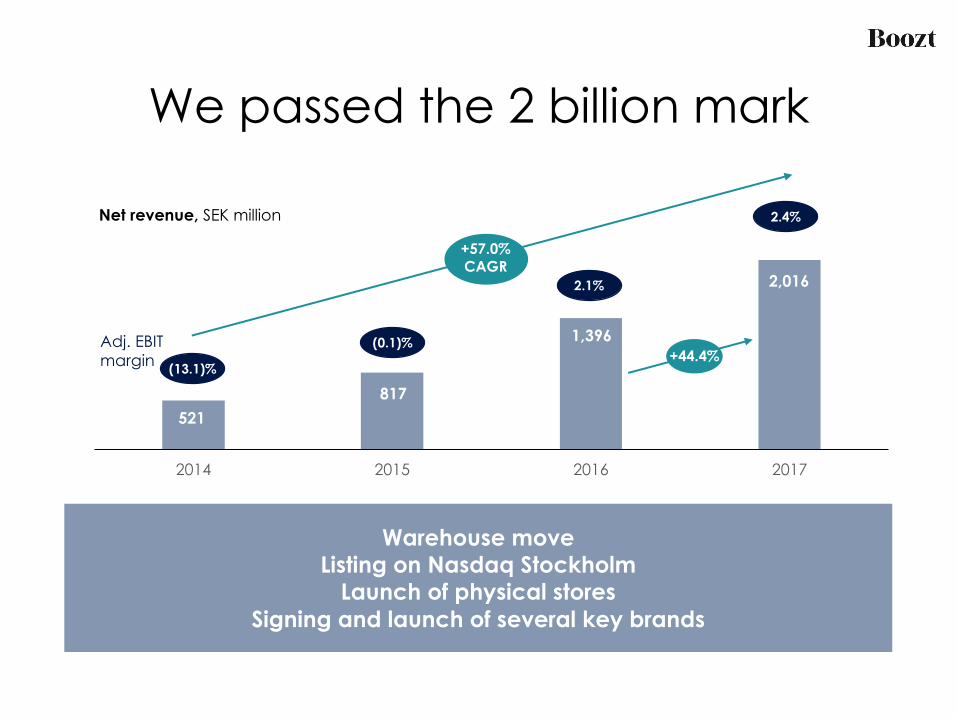
We passed the 2 billion mark
2014 2015 2016 2017
(13.1)%
(0.1)%
2.1%
Adj. EBIT margin
Net revenue, SEK million
+57.0% CAGR
2.4%
521817
1,396
2,016
Warehouse moveListing on Nasdaq Stockholm
Launch of physical storesSigning and launch of several key brands
+44.4%
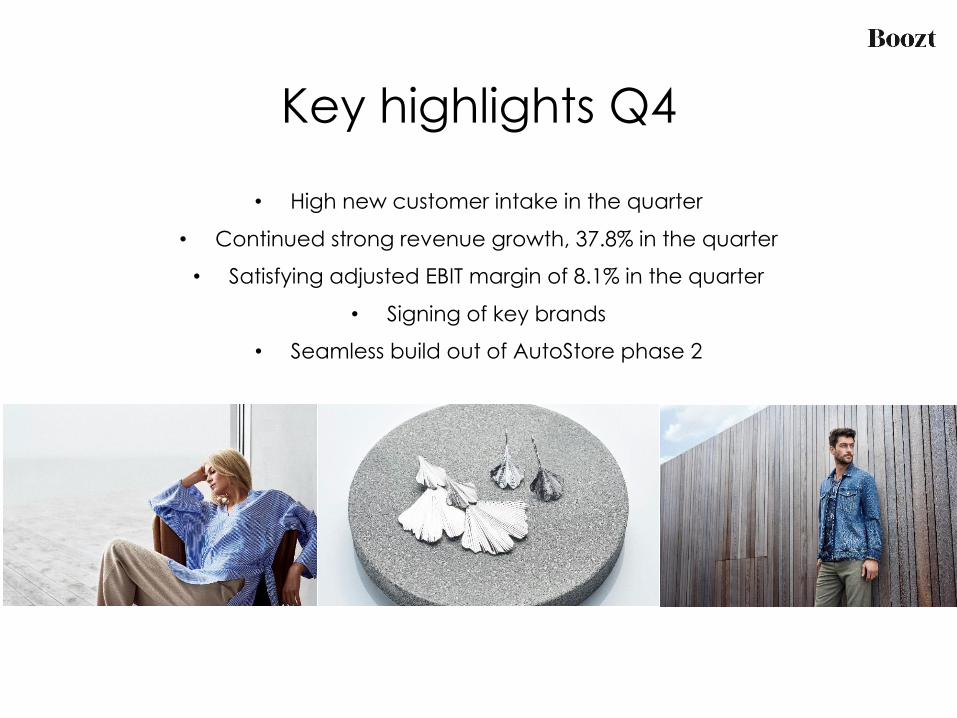
Key highlights Q4
• High new customer intake in the quarter
• Continued strong revenue growth, 37.8% in the quarter
• Satisfying adjusted EBIT margin of 8.1% in the quarter
• Signing of key brands
• Seamless build out of AutoStore phase 2
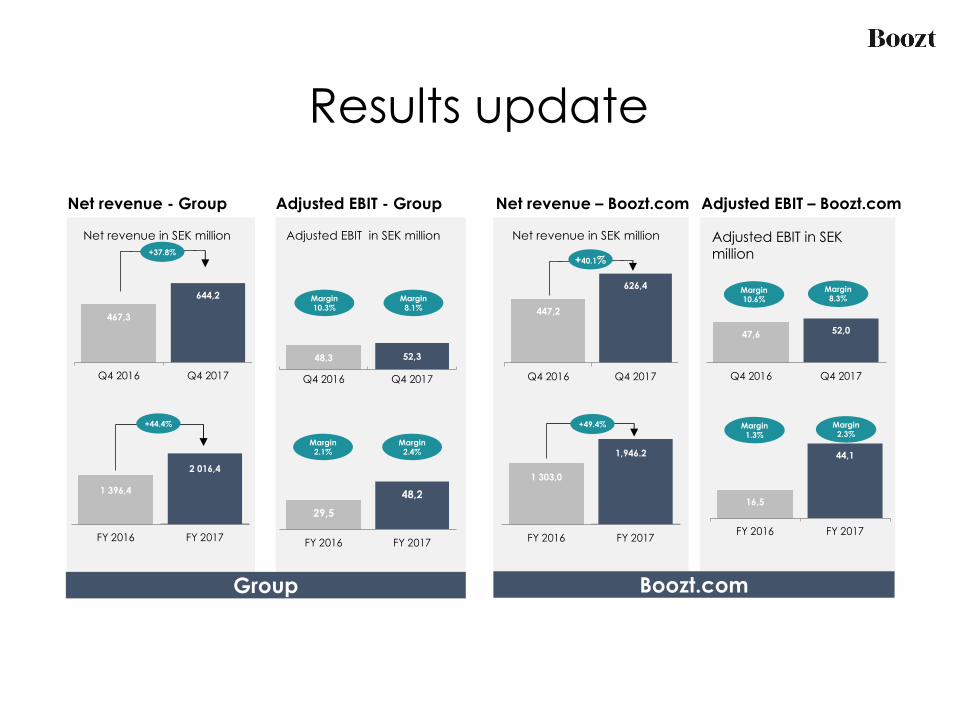
Results update
Adjusted EBIT - Group
Adjusted EBIT in SEK million
Net revenue - Group
Net revenue in SEK million
467,3
644,2
Q4 2016 Q4 2017
1 396,4
2 016,4
FY 2016 FY 2017
447,2
626,4
Q4 2016 Q4 2017
+40.1%
1 303,0
FY 2016 FY 2017
Net revenue – Boozt.com
Net revenue in SEK million
48,3 52,3
Q4 2016 Q4 2017
Margin 8.1%
Margin 10.3%
29,5
48,2
FY 2016 FY 2017
Margin 2.4%
Margin 2.1%
Adjusted EBIT – Boozt.com
Adjusted EBIT in SEK million
47,6 52,0
Q4 2016 Q4 2017
Margin 10.6%
Margin8.3%
16,5
44,1
FY 2016 FY 2017
Margin 1.3%
Margin 2.3%
+49.4%+44.4%
+37.8%
Boozt.comGroup
1,946.2
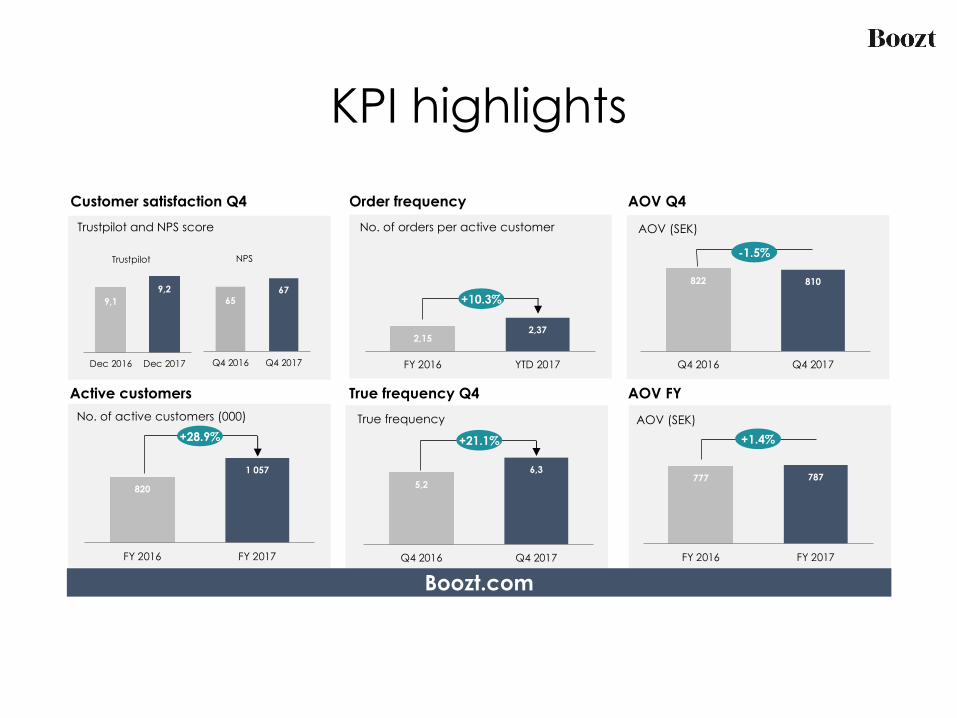
KPI highlights
777 787
FY 2016 FY 2017
822 810
Q4 2016 Q4 2017
820
1 057
FY 2016 FY 2017
AOV Q4
True frequency Q4Active customers
9,19,2
Dec 2016 Dec 2017
6567
Q4 2016 Q4 2017
Customer satisfaction Q4 No. of orders per active customer
True frequency AOV (SEK)
AOV (SEK)
Order frequency
AOV FY
5,26,3
Q4 2016 Q4 2017
+21.1%+28.9%
-1.5%
+1.4%
2,152,37
FY 2016 YTD 2017
+10.3%
Trustpilot and NPS score
No. of active customers (000)
Boozt.com
Trustpilot NPS
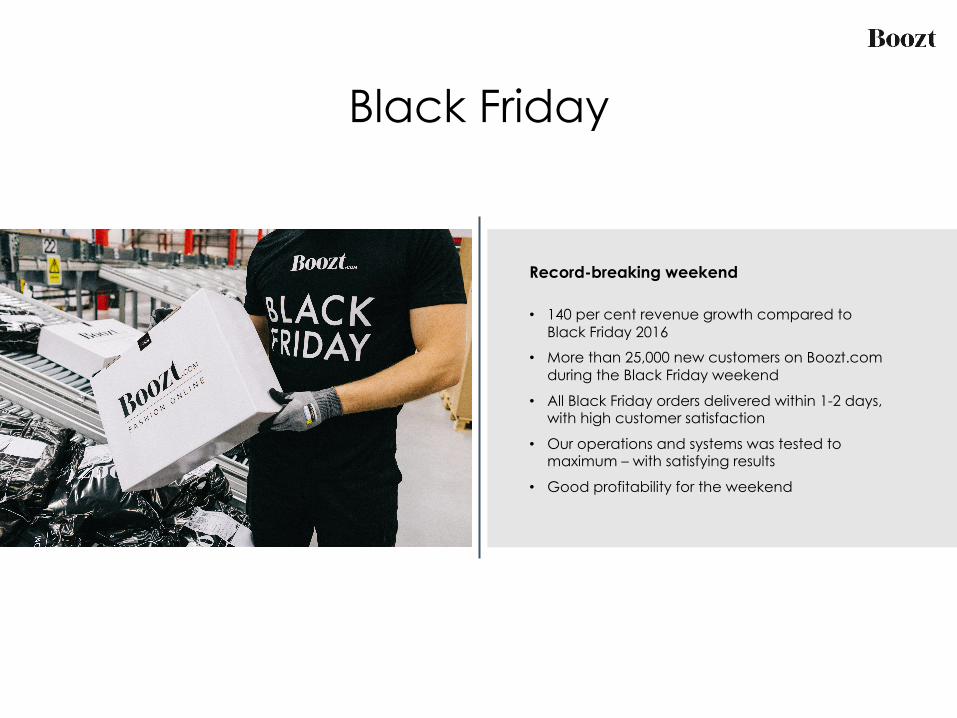
Black Friday
• 140 per cent revenue growth compared to Black Friday 2016
• More than 25,000 new customers on Boozt.com during the Black Friday weekend
• All Black Friday orders delivered within 1-2 days, with high customer satisfaction
• Our operations and systems was tested to maximum – with satisfying results
• Good profitability for the weekend
Record-breaking weekend
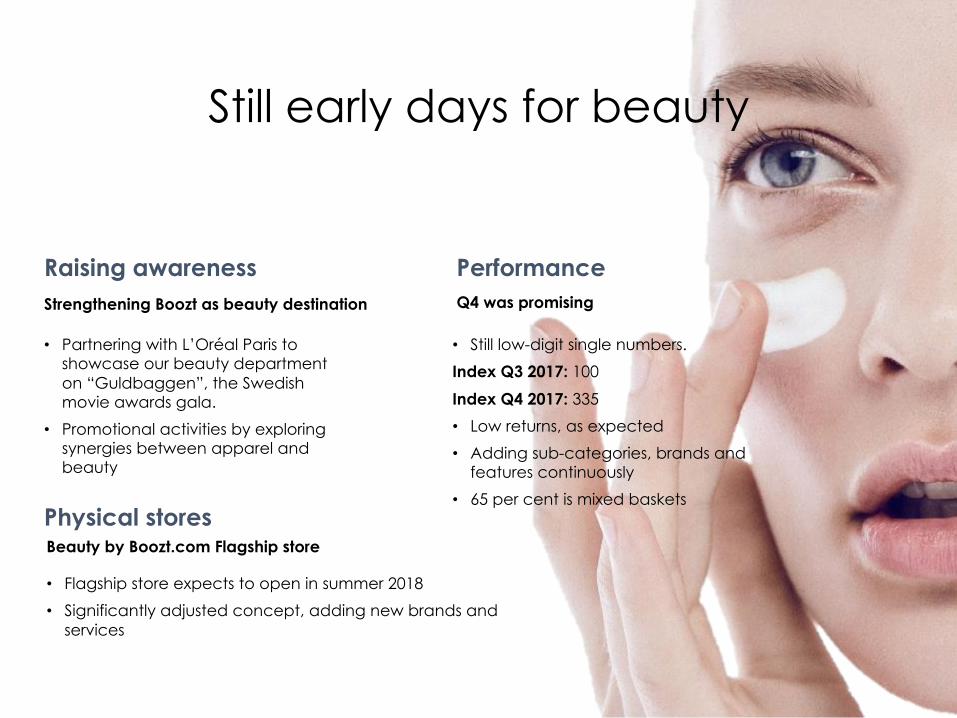
Still early days for beauty
Physical stores
Raising awareness
• Partnering with L’Oréal Paris to showcase our beauty department on “Guldbaggen”, the Swedish movie awards gala.
• Promotional activities by exploring synergies between apparel and beauty
Strengthening Boozt as beauty destination Q4 was promising
• Still low-digit single numbers. Index Q3 2017: 100
Index Q4 2017: 335• Low returns, as expected• Adding sub-categories, brands and
features continuously• 65 per cent is mixed baskets
Performance
Beauty by Boozt.com Flagship store
• Flagship store expects to open in summer 2018• Significantly adjusted concept, adding new brands and
services

adidas and Reebok will be sold on Boozt.com as from late summer 2018
The newly signed agreement kicks off our investment in making Boozt a confident sport and athleisure destination
adidas and Reebok
adidas Boost collection, borrowed from adidas.com

FINANCIAL UPDATE FOURTH QUARTER
AND FULL YEAR 2017
Q4 2016 Q4 2017
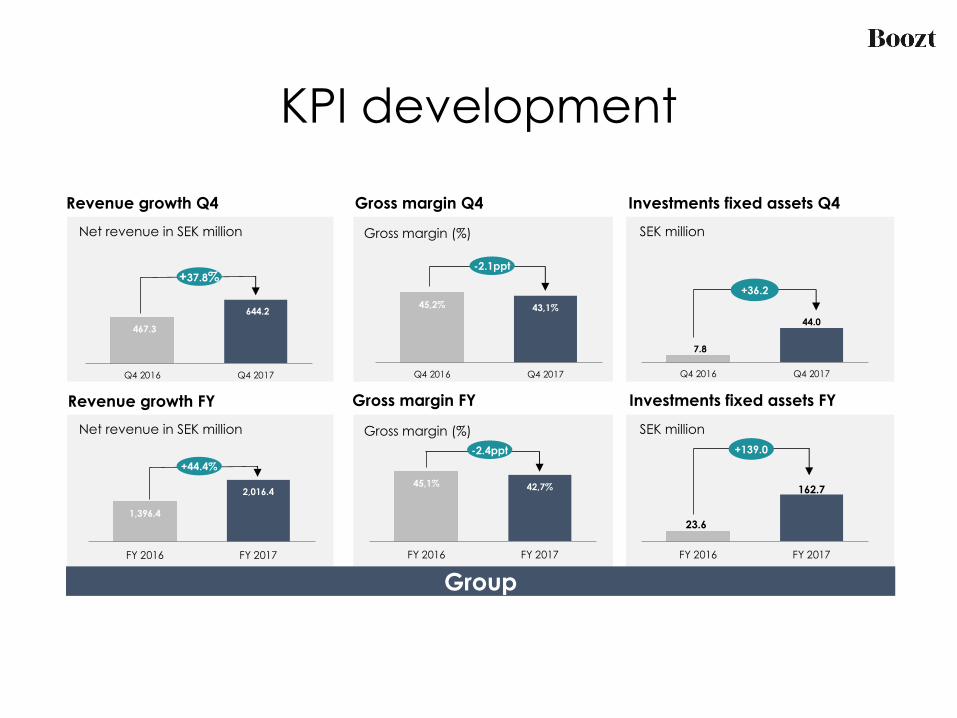
KPI development
Investments fixed assets Q4Revenue growth Q4
23.6
162.7
FY 2016 FY 2017
1,396.4
2,016.4
FY 2016 FY 2017
7.8
44.0
Q4 2016 Q4 2017
Gross margin Q4
Gross margin (%)
Gross margin FY
Gross margin (%)
45,2% 43,1%
Q4 2016 Q4 2017
45,1% 42,7%
FY 2016 FY 2017
-2.1ppt
-2.4ppt +139.0
+36.2
Investments fixed assets FY
Net revenue in SEK million
+37.8%
SEK million
SEK million
Revenue growth FY
Net revenue in SEK million
Group
+44.4%
467.3
644.2
30,7
49,1
FY 2016 FY 2017
Net revenue Q4 (SEK million)
7,914,2
Q4 2016 Q4 2017
12,2
3,5
Q4 2016 Q4 2017
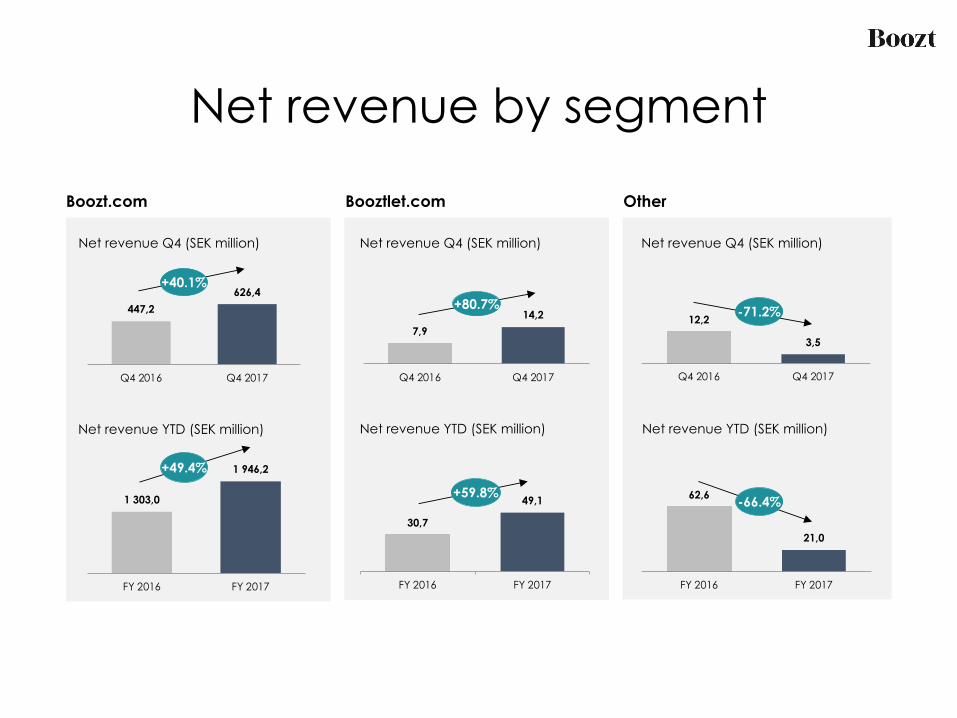
Net revenue by segment
1 303,0
1 946,2
FY 2016 FY 2017
447,2626,4
Q4 2016 Q4 2017
Net revenue Q4 (SEK million) Net revenue Q4 (SEK million)
Net revenue YTD (SEK million) Net revenue YTD (SEK million)Net revenue YTD (SEK million)
+40.1%+80.7% -71.2%
+59.8%
+49.4%
62,6
21,0
FY 2016 FY 2017
-66.4%
Boozt.com Booztlet.com Other
16,5
44,1
FY 2016 FY 2017
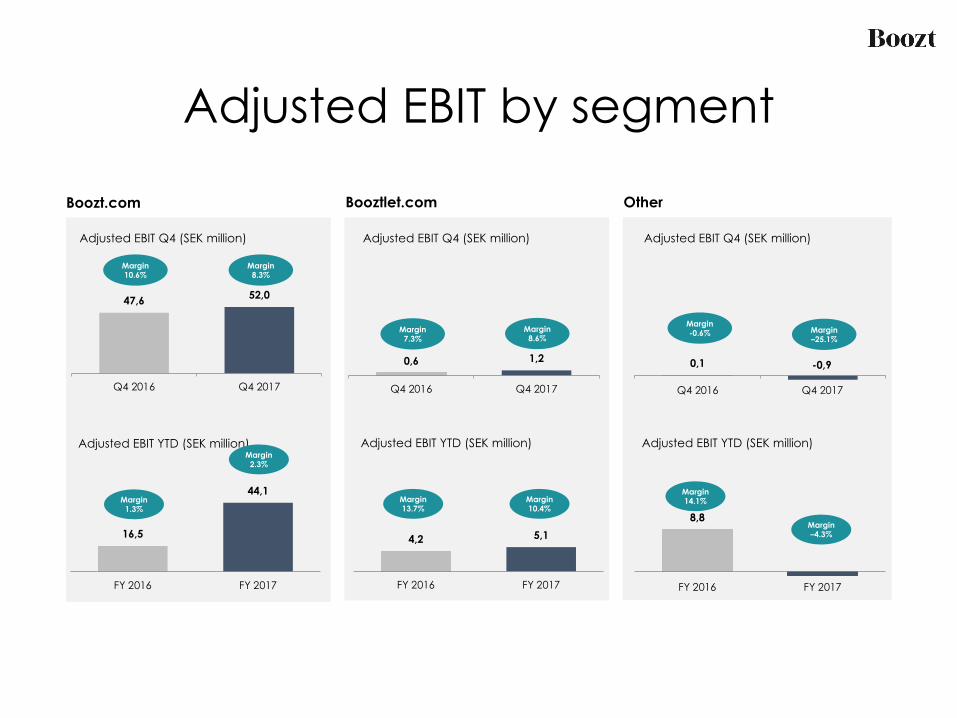
Adjusted EBIT by segment
47,6 52,0
Q4 2016 Q4 2017
Adjusted EBIT Q4 (SEK million) Adjusted EBIT Q4 (SEK million) Adjusted EBIT Q4 (SEK million)
0,6 1,2
Q4 2016 Q4 2017
0,1 -0,9
Q4 2016 Q4 2017
Adjusted EBIT YTD (SEK million) Adjusted EBIT YTD (SEK million)Adjusted EBIT YTD (SEK million)
4,2 5,1
FY 2016 FY 2017
8,8
FY 2016 FY 2017
Margin -0.6% Margin
–25.1%
Margin –4.3%
Margin 14.1%
Margin 7.3%
Margin 8.6%
Margin 13.7%
Margin 10.4%
Margin2.3%
Margin 1.3%
Margin 8.3%
Margin 10.6%
Boozt.com Booztlet.com Other
Q4 2016 Q4 2017
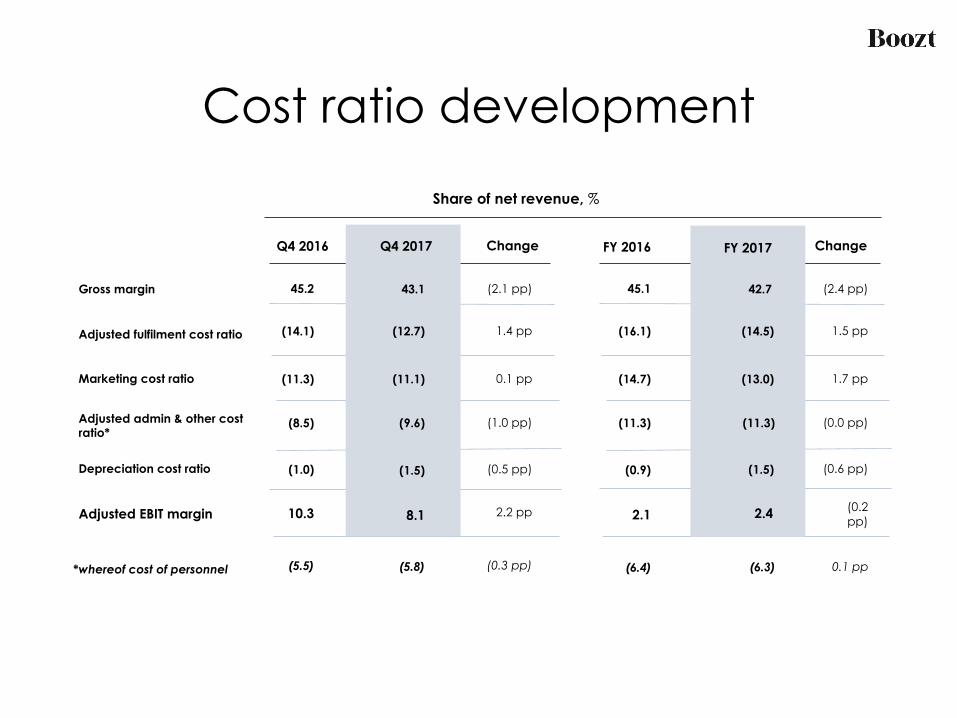
Cost ratio development
45.2 43.1
8.1
Q4 2017
Gross margin
Marketing cost ratio
Depreciation cost ratio
Adjusted fulfilment cost ratio
Adjusted admin & other cost ratio*
Adjusted EBIT margin
(8.5)
(1.0)
10.3
(14.1)
(11.3)
(12.7)
(11.1)
(9.6)
(1.5)
Share of net revenue, %
45.1
(11.3)
(0.9)
2.1
(16.1)
(14.7)
Q4 2016 FY 2016Change
(2.1 pp)
1.4 pp
0.1 pp
(1.0 pp)
(0.5 pp)
2.2 pp
Change
(2.4 pp)
1.5 pp
1.7 pp
(0.0 pp)
(0.6 pp)
(0.2 pp)
42.7
2.4
(14.5)
(13.0)
(11.3)
(1.5)
FY 2017
*whereof cost of personnel (5.5) (5.8) (0.3 pp) (6.4) 0.1 pp(6.3)
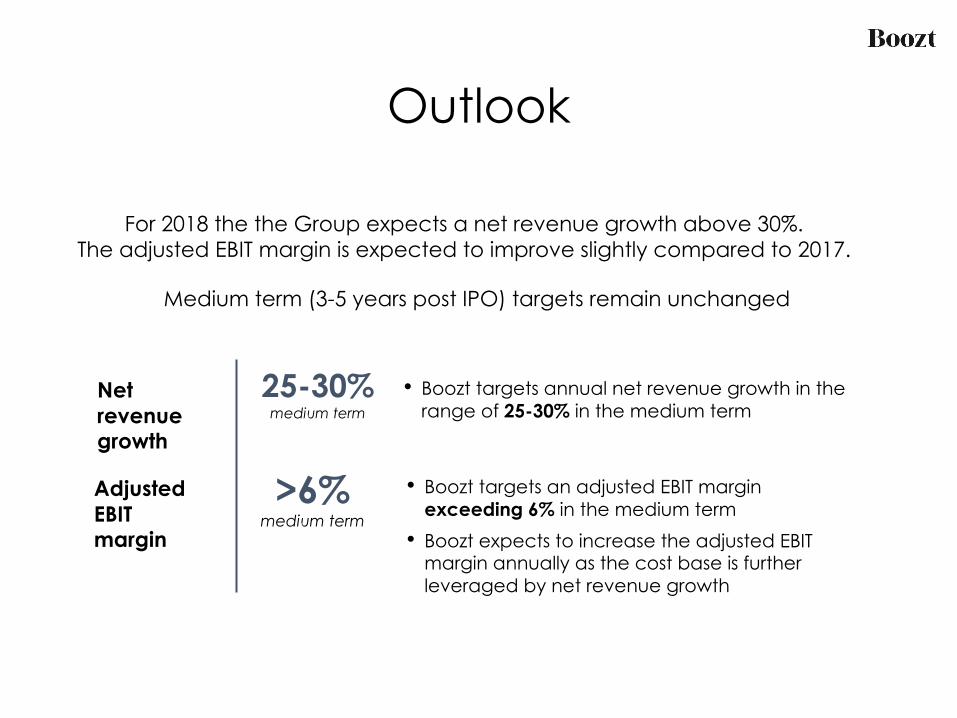
Outlook
25-30%medium term
>6%medium term
For 2018 the the Group expects a net revenue growth above 30%.The adjusted EBIT margin is expected to improve slightly compared to 2017.
• Boozt targets annual net revenue growth in the range of 25-30% in the medium term
• Boozt targets an adjusted EBIT margin exceeding 6% in the medium term• Boozt expects to increase the adjusted EBIT
margin annually as the cost base is further leveraged by net revenue growth
Net revenue growth
Adjusted EBIT margin
Medium term (3-5 years post IPO) targets remain unchanged

COMPANY OVERVIEW
15
16
Our vision is to become the leading player in Nordic fashion e-commerce
Our mission is to deliver an outstanding online fashion shopping experience with unrivaled customer service
WE DELIVER FASHION
5 middle aged men selling fashion…
Jesper Brøndum
CTO
Allan Junge-Jensen
CFO
Hermann Haraldsson
CEO
Niels Hemmingsen
COO
Peter G. Jørgensen
CMO
Sept 2017: SEK 170m+
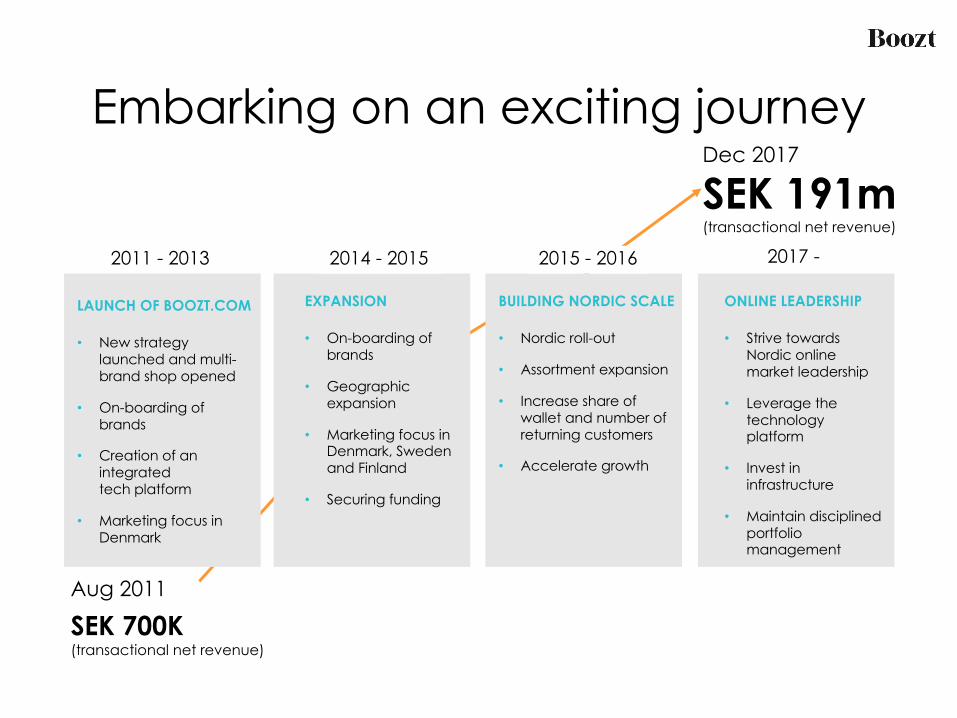
BUILDING NORDIC SCALE
• Nordic roll-out
• Assortment expansion
• Increase share of wallet and number of returning customers
• Accelerate growth
2015 - 2016
ONLINE LEADERSHIP
• Strive towards Nordic online market leadership
• Leverage the technology platform
• Invest in infrastructure
• Maintain disciplined portfolio management
2017 -
Dec 2017
SEK 191m(transactional net revenue)
2011 - 2013
LAUNCH OF BOOZT.COM
• New strategy launched and multi-brand shop opened
• On-boarding of brands
• Creation of an integrated tech platform
• Marketing focus in Denmark
Aug 2011
SEK 700K (transactional net revenue)
EXPANSION
• On-boarding of brands
• Geographic expansion
• Marketing focus in Denmark, Sweden and Finland
• Securing funding
2014 - 2015
Embarking on an exciting journey
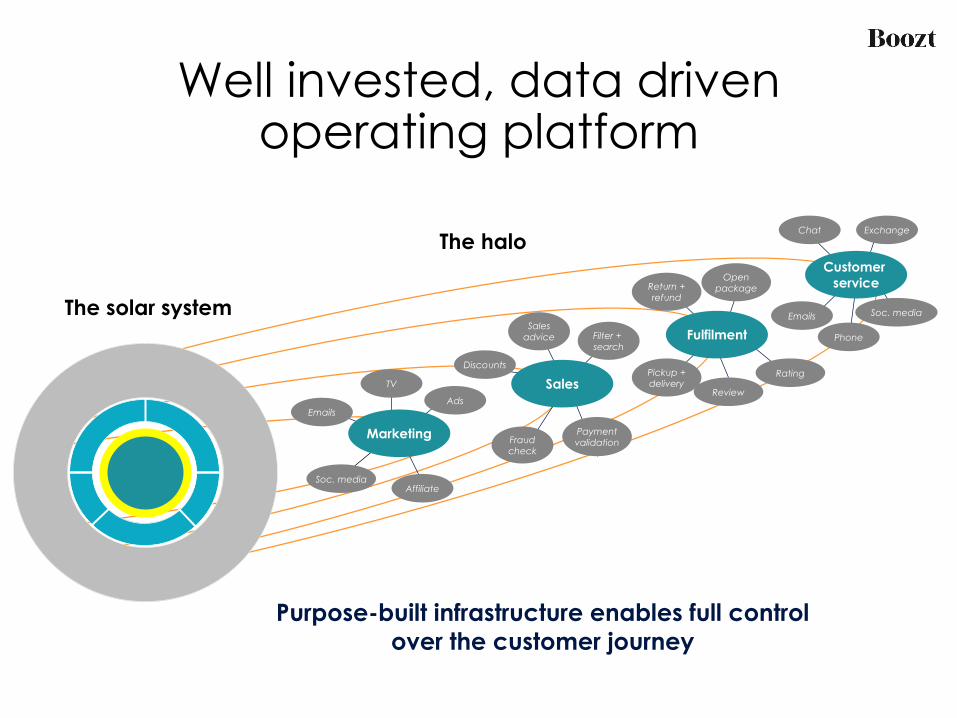
Well invested, data driven operating platform
Purpose-built infrastructure enables full control over the customer journey
Ads
TV
Emails
Marketing
AffiliateSoc. media
Filter + search
Salesadvice
Fraudcheck
Paymentvalidation
Discounts
Sales
Return +refund
Openpackage
Review
RatingPickup +delivery
Fulfilment
Customer service
Chat Exchange
Phone
Emails Soc. mediaThe solar system
The halo
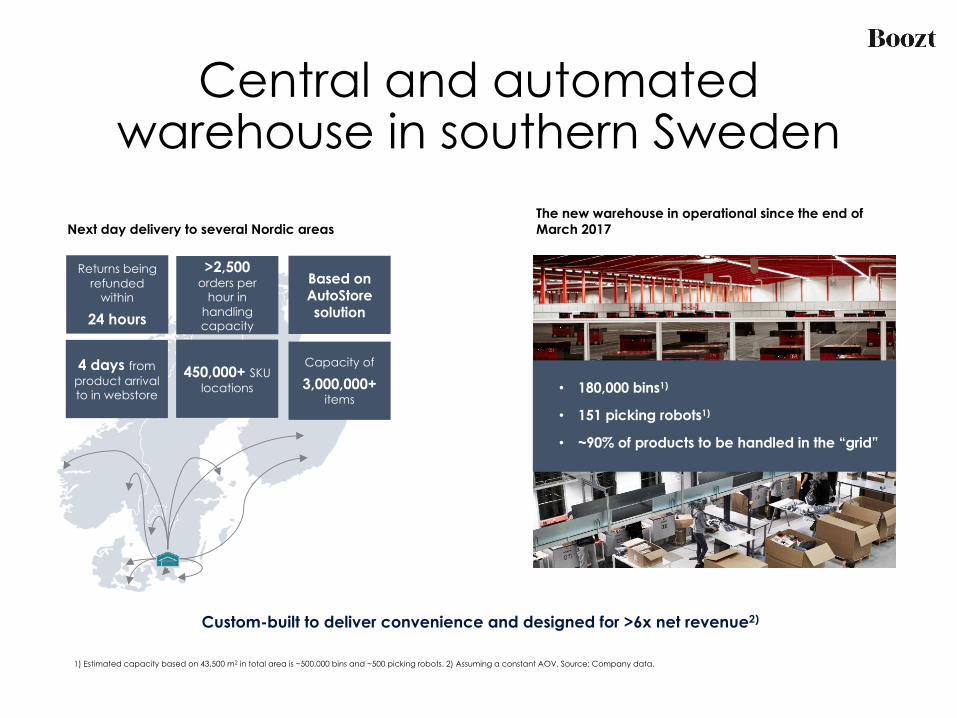
Central and automatedwarehouse in southern Sweden
1) Estimated capacity based on 43,500 m2 in total area is ~500,000 bins and ~500 picking robots. 2) Assuming a constant AOV. Source: Company data.
450,000+ SKU locations
Capacity of
3,000,000+items
Based on AutoStore solution
4 days from product arrival to in webstore
Returns being refunded
within
24 hours
>2,500orders per
hour in handling capacity
The new warehouse in operational since the end of March 2017Next day delivery to several Nordic areas
Custom-built to deliver convenience and designed for >6x net revenue2)
• 180,000 bins1)
• 151 picking robots1)
• ~90% of products to be handled in the “grid”
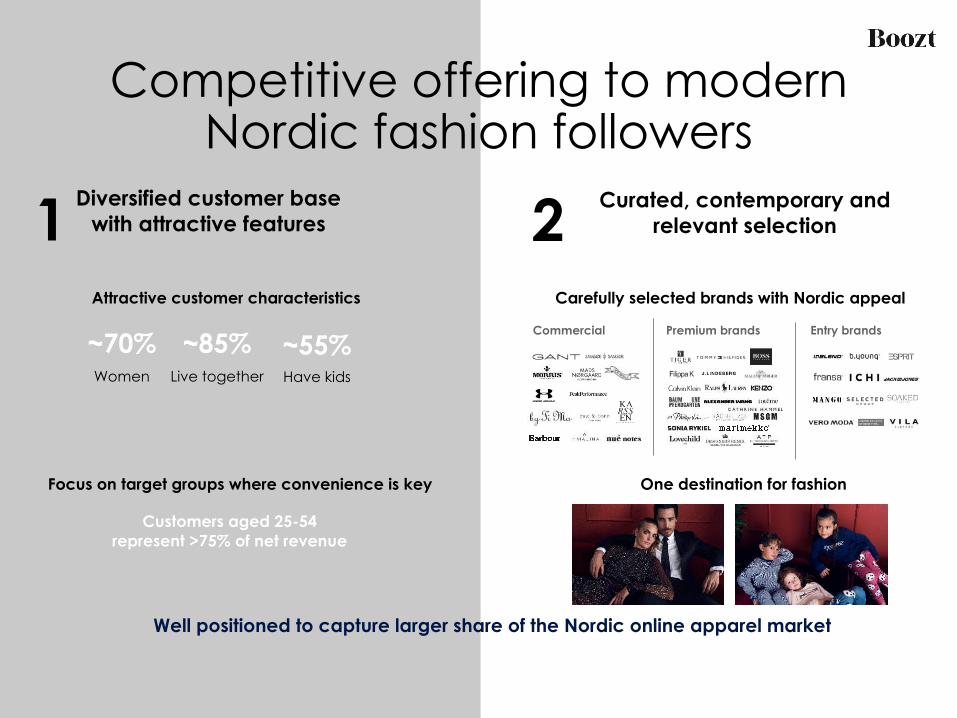
Competitive offering to modern Nordic fashion followers
One destination for fashion
Curated, contemporary and relevant selection
Carefully selected brands with Nordic appealAttractive customer characteristics
Focus on target groups where convenience is key
Diversified customer base with attractive features
~70% ~85% ~55%Women Live together Have kids
Customers aged 25-54 represent >75% of net revenue
Well positioned to capture larger share of the Nordic online apparel market
21Entry brandsPremium brandsCommercial
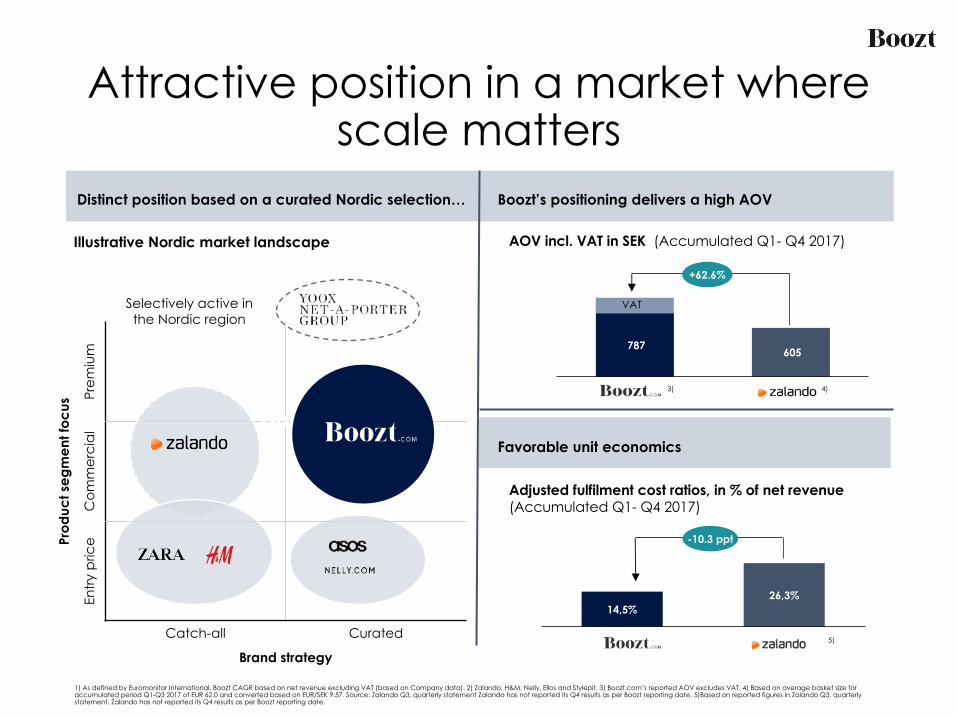
Attractive position in a market wherescale matters
Prod
uct s
egm
ent f
ocus
Prem
ium
Com
mer
cia
lEn
try p
rice
Catch-all Curated
Brand strategy
Distinct position based on a curated Nordic selection…
Favorable unit economics
Illustrative Nordic market landscape
Boozt’s positioning delivers a high AOV
AOV incl. VAT in SEK (Accumulated Q1- Q4 2017)
Selectively active in the Nordic region
787 605
VAT
3) 4)
+62.6%
Adjusted fulfilment cost ratios, in % of net revenue (Accumulated Q1- Q4 2017)
14,5%26,3%
-10.3 ppt
5)
1) As defined by Euromonitor International. Boozt CAGR based on net revenue excluding VAT (based on Company data). 2) Zalando, H&M, Nelly, Ellos and Stylepit. 3) Boozt.com’s reported AOV excludes VAT. 4) Based on average basket size for accumulated period Q1-Q3 2017 of EUR 62.0 and converted based on EUR/SEK 9.57. Source: Zalando Q3, quarterly statement Zalando has not reported its Q4 results as per Boozt reporting date. 5)Based on reported figures in Zalando Q3, quarterly statement. Zalando has not reported its Q4 results as per Boozt reporting date.
24
THE MARKET
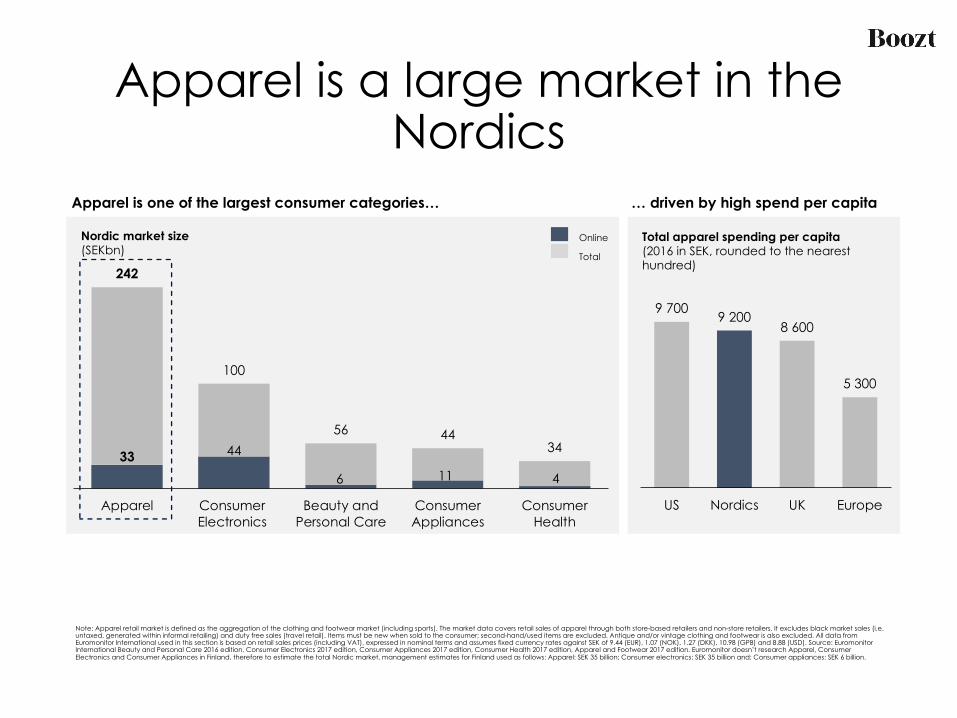
Apparel is a large market in the Nordics
Note: Apparel retail market is defined as the aggregation of the clothing and footwear market (including sports). The market data covers retail sales of apparel through both store-based retailers and non-store retailers. It excludes black market sales (i.e. untaxed, generated within informal retailing) and duty free sales (travel retail). Items must be new when sold to the consumer; second-hand/used items are excluded. Antique and/or vintage clothing and footwear is also excluded. All data from Euromonitor International used in this section is based on retail sales prices (including VAT), expressed in nominal terms and assumes fixed currency rates against SEK of 9.44 (EUR), 1.07 (NOK), 1.27 (DKK), 10.98 (GPB) and 8.88 (USD). Source: Euromonitor International Beauty and Personal Care 2016 edition, Consumer Electronics 2017 edition, Consumer Appliances 2017 edition, Consumer Health 2017 edition, Apparel and Footwear 2017 edition. Euromonitor doesn’t research Apparel, Consumer Electronics and Consumer Appliances in Finland, therefore to estimate the total Nordic market, management estimates for Finland used as follows: Apparel: SEK 35 billion; Consumer electronics: SEK 35 billion and; Consumer appliances: SEK 6 billion.
33 44
6 11 4
242
100
56 4434
Apparel ConsumerElectronics
Beauty andPersonal Care
ConsumerAppliances
ConsumerHealth
Nordic market size (SEKbn)
9 700 9 2008 600
5 300
US Nordics UK Europe
Total apparel spending per capita (2016 in SEK, rounded to the nearest hundred)
Apparel is one of the largest consumer categories… … driven by high spend per capita
Online
Total
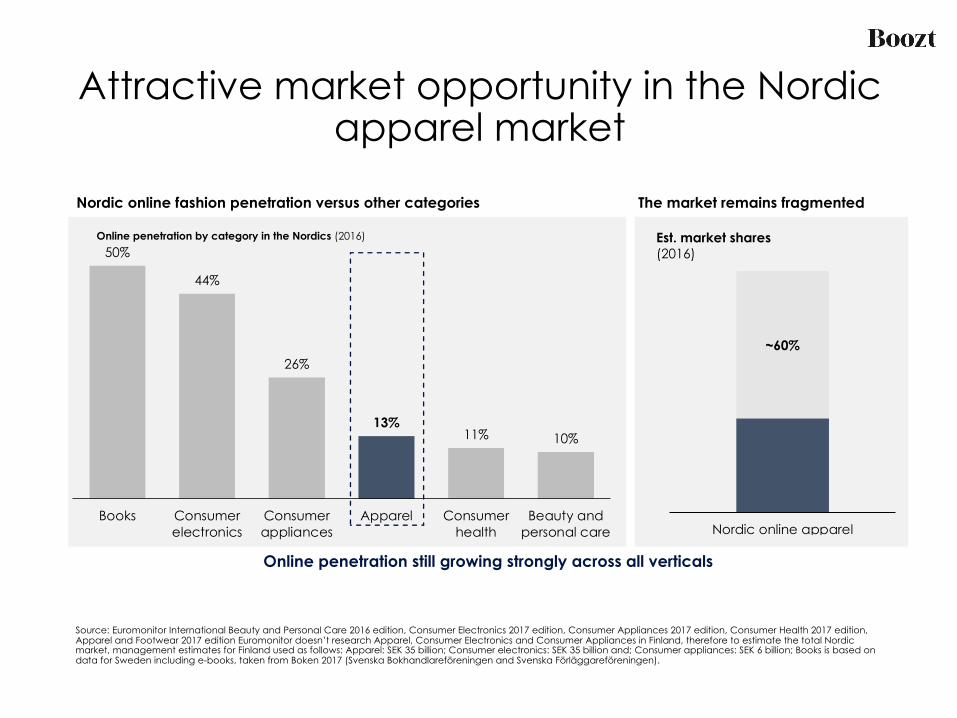
Attractive market opportunity in the Nordic apparel market
Source: Euromonitor International Beauty and Personal Care 2016 edition, Consumer Electronics 2017 edition, Consumer Appliances 2017 edition, Consumer Health 2017 edition, Apparel and Footwear 2017 edition Euromonitor doesn’t research Apparel, Consumer Electronics and Consumer Appliances in Finland, therefore to estimate the total Nordic market, management estimates for Finland used as follows: Apparel: SEK 35 billion; Consumer electronics: SEK 35 billion and; Consumer appliances: SEK 6 billion; Books is based on data for Sweden including e-books, taken from Boken 2017 (Svenska Bokhandlareföreningen and Svenska Förläggareföreningen).
50%
44%
26%
13%11% 10%
Books Consumerelectronics
Consumerappliances
Apparel Consumerhealth
Beauty andpersonal care
Online penetration by category in the Nordics (2016)
~60%
Nordic online apparel
Est. market shares (2016)
Nordic online fashion penetration versus other categories The market remains fragmented
Online penetration still growing strongly across all verticals
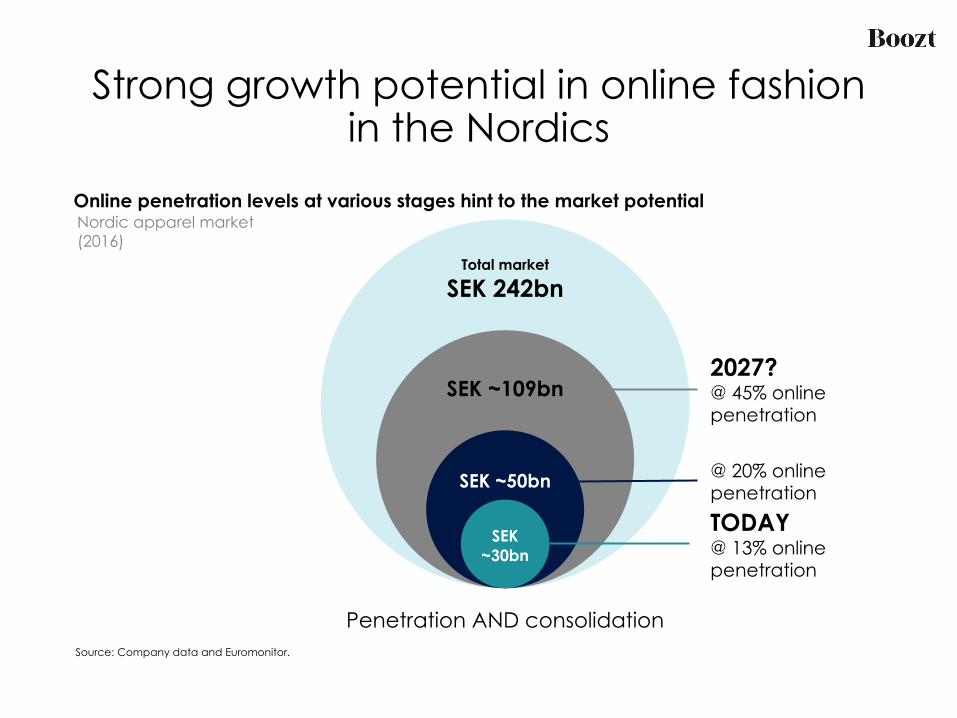
Strong growth potential in online fashion in the Nordics
Total market
SEK 242bn
SEK ~109bn
SEK ~50bn
Source: Company data and Euromonitor.
Nordic apparel market (2016)
Penetration AND consolidation
Online penetration levels at various stages hint to the market potential
SEK ~30bn
TODAY@ 13% online penetration
@ 20% online penetration
2027?@ 45% online penetration
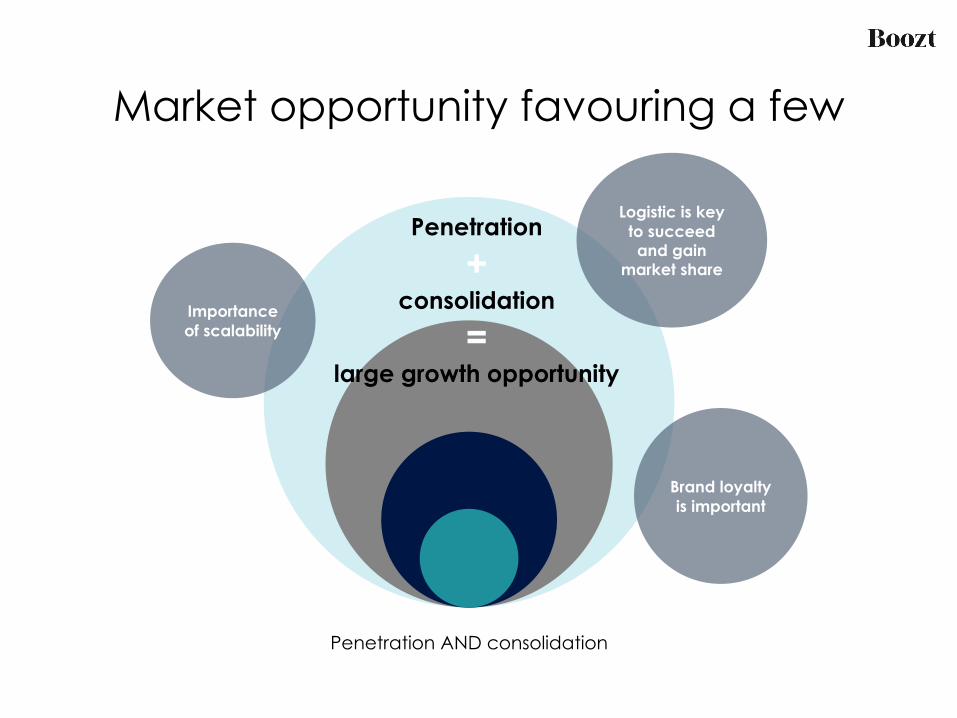
Market opportunity favouring a few
Penetration AND consolidation
Logistic is key to succeed and gain
market share
Brand loyalty is important
Importance of scalability
Penetration
+ consolidation
= large growth opportunity
29
OUR GROWTH STRATEGY
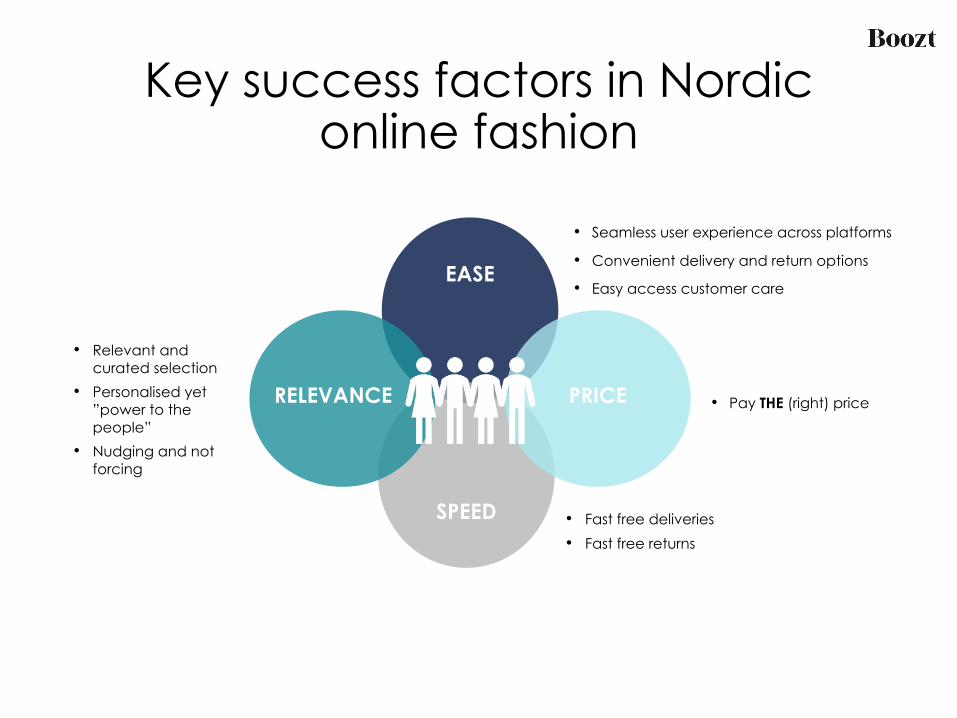
Key success factors in Nordic online fashion
• Relevant and curated selection
• Personalised yet”power to the people”
• Nudging and not forcing
• Pay THE (right) price
• Seamless user experience across platforms
• Convenient delivery and return options
• Easy access customer care
• Fast free deliveries
• Fast free returns
EASE
SPEED
PRICERELEVANCE
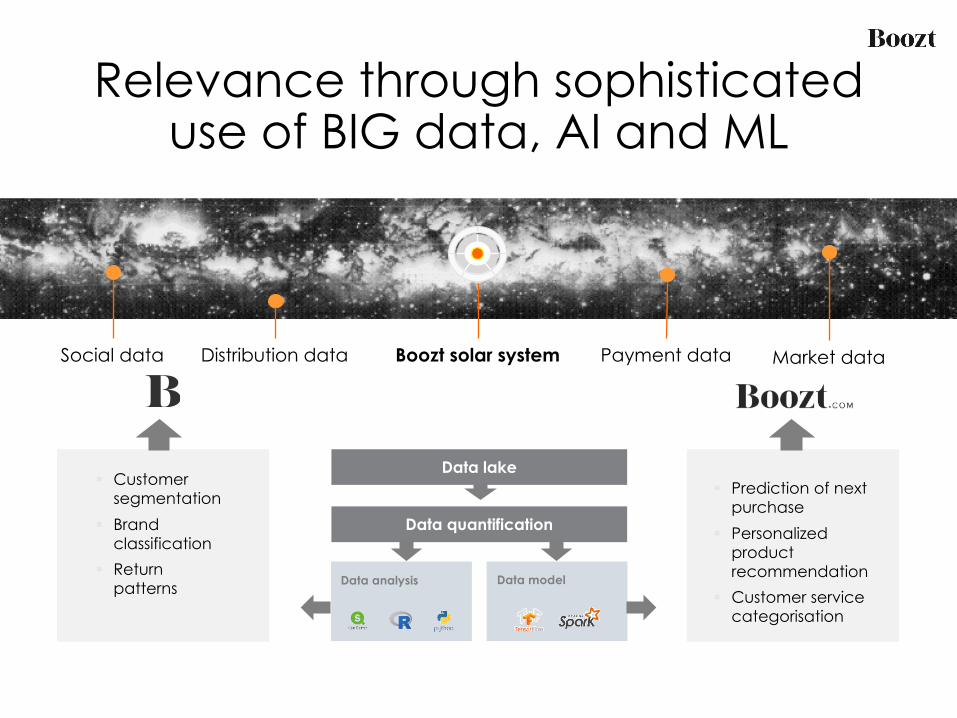
Relevance through sophisticateduse of BIG data, AI and ML
Social data Distribution data Boozt solar system Payment data Market data
Data lake
Data quantification
Data analysis Data model
§ Customer segmentation
§ Brand classification
§ Return patterns
§ Prediction of next purchase
§ Personalized product recommendation
§ Customer service categorisation
32
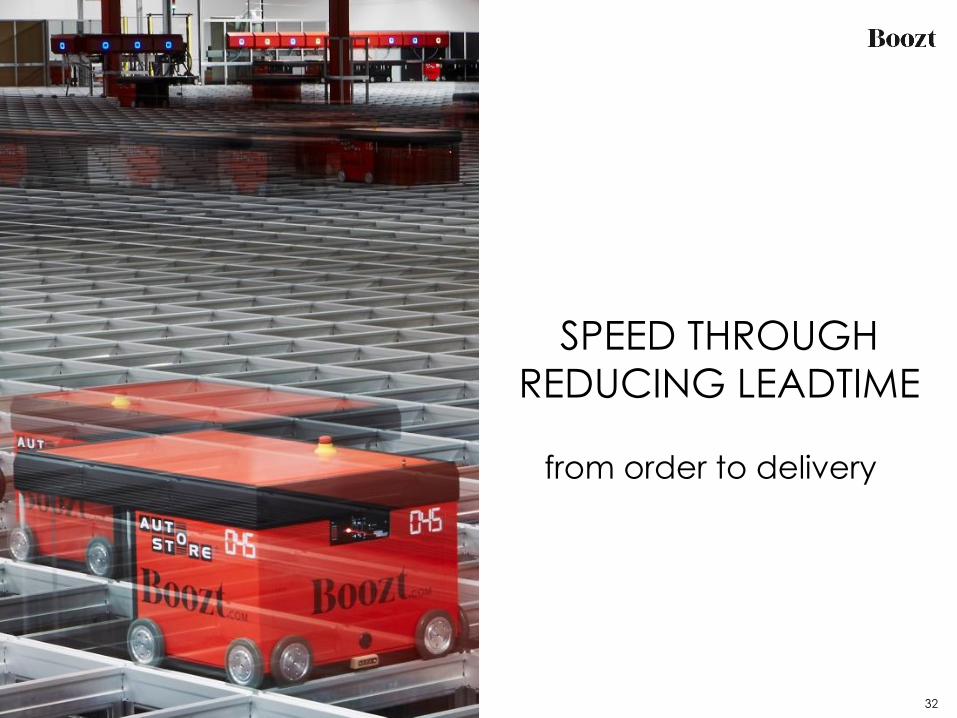
SPEED THROUGH REDUCING LEADTIME
from order to delivery
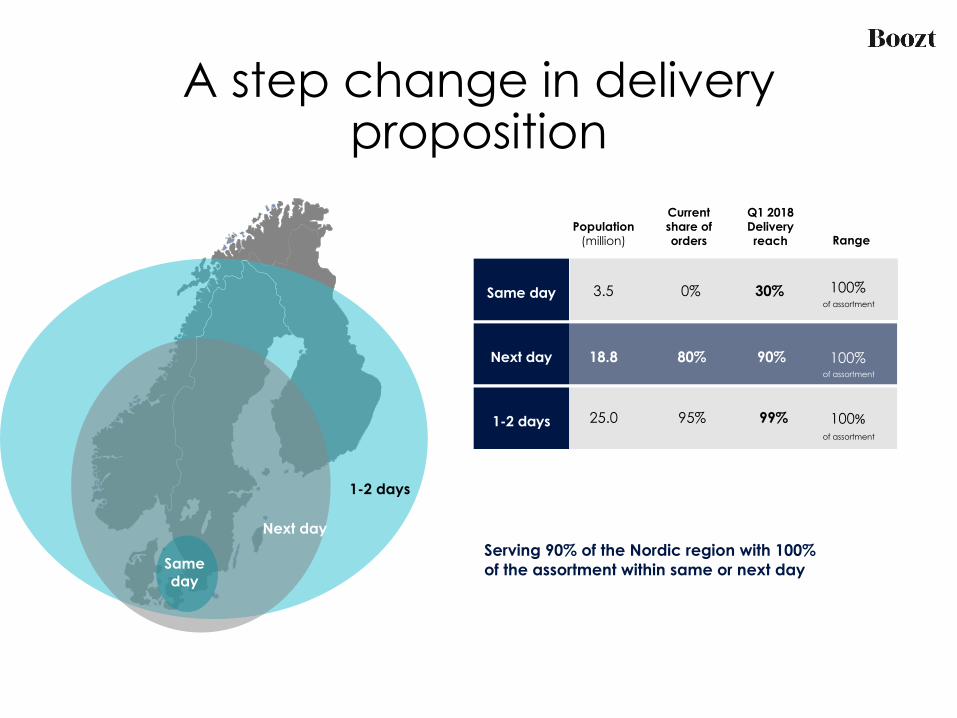
A step change in deliveryproposition
1-2 days
Next day
Same day
Next day
Same day
1-2 days
Serving 90% of the Nordic region with 100% of the assortment within same or next day
Q1 2018Deliveryreach
Current share oforders
99%
Population(million)
18.8
25.0
0%
80%
95%
30%
90%
3.5 100%
100%
100%
Range
of assortment
of assortment
of assortment
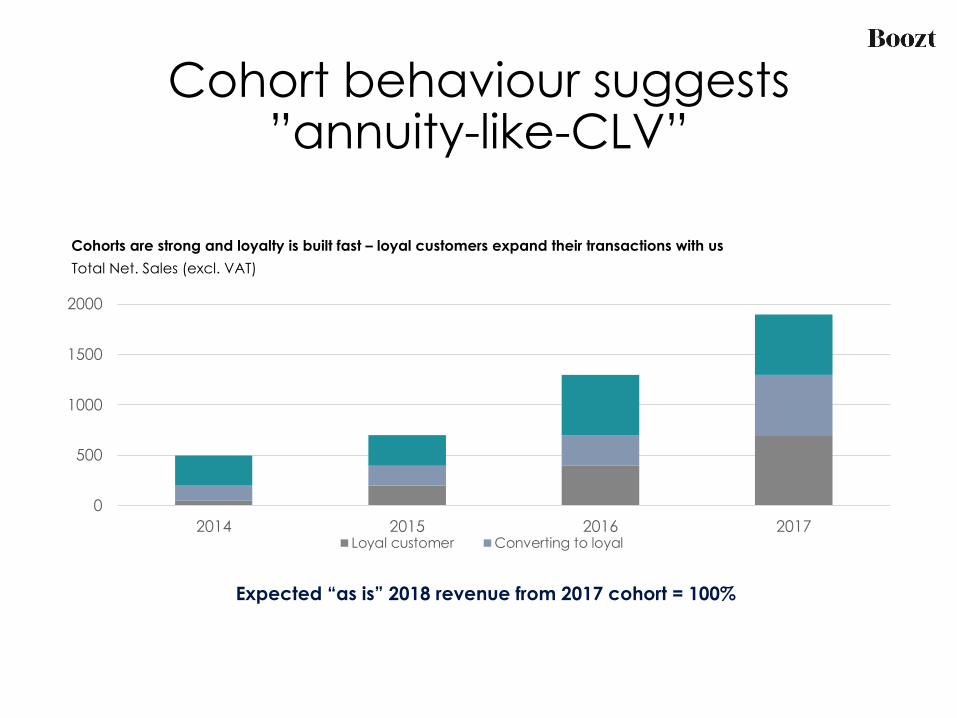
Cohort behaviour suggests ”annuity-like-CLV”
NEW
Cohorts are strong and loyalty is built fast – loyal customers expand their transactions with us
Expected “as is” 2018 revenue from 2017 cohort = 100%
0
500
1000
1500
2000
2014 2015 2016 2017Loyal customer Converting to loyal
Total Net. Sales (excl. VAT)
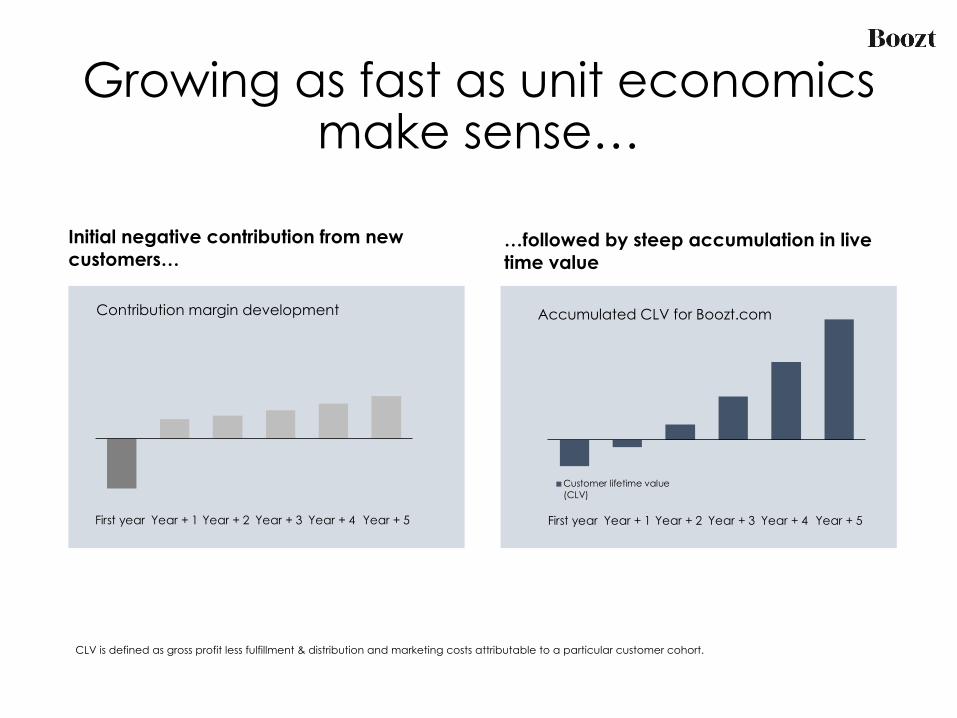
Growing as fast as unit economicsmake sense…
Contribution margin development
First year Year + 1 Year + 2 Year + 3 Year + 4 Year + 5
Initial negative contribution from new customers…
Accumulated CLV for Boozt.com
First year Year + 1 Year + 2 Year + 3 Year + 4 Year + 5
Customer lifetime value(CLV)
…followed by steep accumulation in live time value
CLV is defined as gross profit less fulfillment & distribution and marketing costs attributable to a particular customer cohort.

APPENDIX
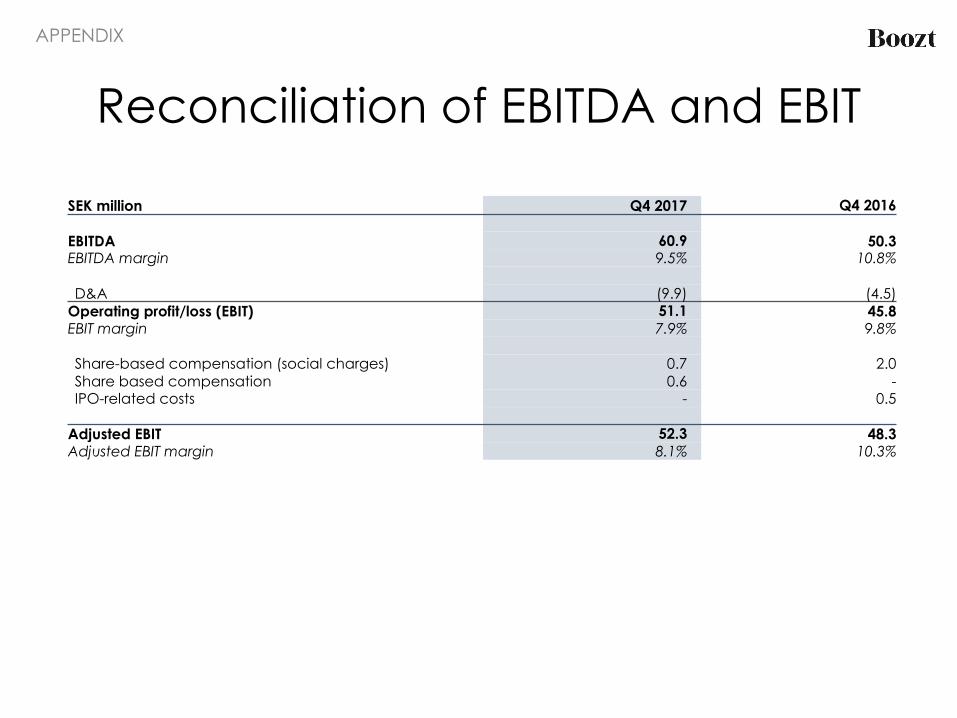
Reconciliation of EBITDA and EBIT
SEK million Q4 2017 Q4 2016
EBITDA 60.9 50.3EBITDA margin 9.5% 10.8%
D&A (9.9) (4.5)Operating profit/loss (EBIT) 51.1 45.8EBIT margin 7.9% 9.8%
Share-based compensation (social charges) 0.7 2.0Share based compensation 0.6 -IPO-related costs - 0.5
Adjusted EBIT 52.3 48.3Adjusted EBIT margin 8.1% 10.3%
APPENDIX
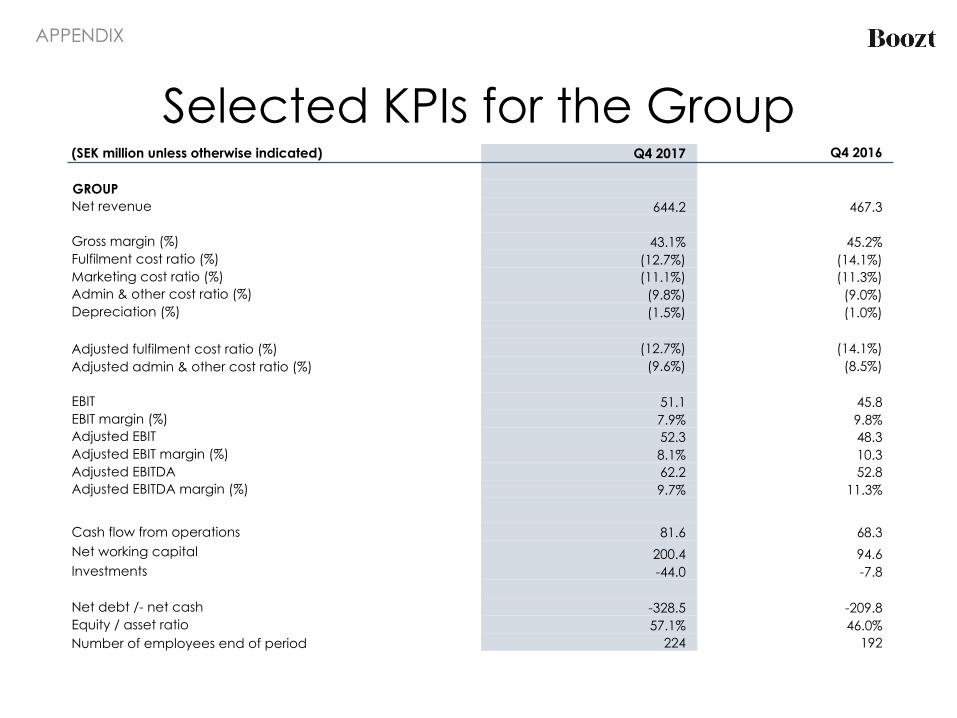
Selected KPIs for the Group(SEK million unless otherwise indicated) Q4 2017 Q4 2016
GROUPNet revenue 644.2 467.3
Gross margin (%) 43.1% 45.2%Fulfilment cost ratio (%) (12.7%) (14.1%)Marketing cost ratio (%) (11.1%) (11.3%)Admin & other cost ratio (%) (9.8%) (9.0%)Depreciation (%) (1.5%) (1.0%)
Adjusted fulfilment cost ratio (%) (12.7%) (14.1%)Adjusted admin & other cost ratio (%) (9.6%) (8.5%)
EBIT 51.1 45.8EBIT margin (%) 7.9% 9.8%Adjusted EBIT 52.3 48.3Adjusted EBIT margin (%) 8.1% 10.3Adjusted EBITDA 62.2 52.8Adjusted EBITDA margin (%) 9.7% 11.3%
Cash flow from operations 81.6 68.3Net working capital 200.4 94.6Investments -44.0 -7.8
Net debt /- net cash -328.5 -209.8Equity / asset ratio 57.1% 46.0%Number of employees end of period 224 192
APPENDIX
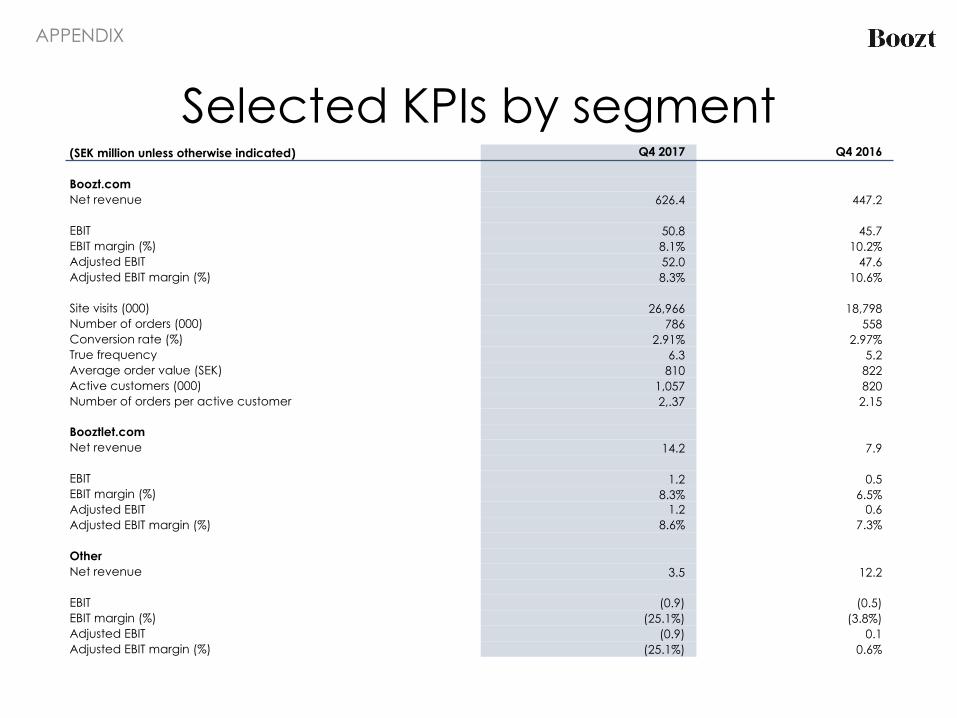
Selected KPIs by segment(SEK million unless otherwise indicated) Q4 2017 Q4 2016
Boozt.comNet revenue 626.4 447.2
EBIT 50.8 45.7EBIT margin (%) 8.1% 10.2%Adjusted EBIT 52.0 47.6Adjusted EBIT margin (%) 8.3% 10.6%
Site visits (000) 26,966 18,798Number of orders (000) 786 558Conversion rate (%) 2.91% 2.97%True frequency 6.3 5.2Average order value (SEK) 810 822Active customers (000) 1,057 820Number of orders per active customer 2,.37 2.15
Booztlet.comNet revenue 14.2 7.9
EBIT 1.2 0.5EBIT margin (%) 8.3% 6.5%Adjusted EBIT 1.2 0.6Adjusted EBIT margin (%) 8.6% 7.3%
OtherNet revenue 3.5 12.2
EBIT (0.9) (0.5)EBIT margin (%) (25.1%) (3.8%)Adjusted EBIT (0.9) 0.1Adjusted EBIT margin (%) (25.1%) 0.6%
APPENDIX
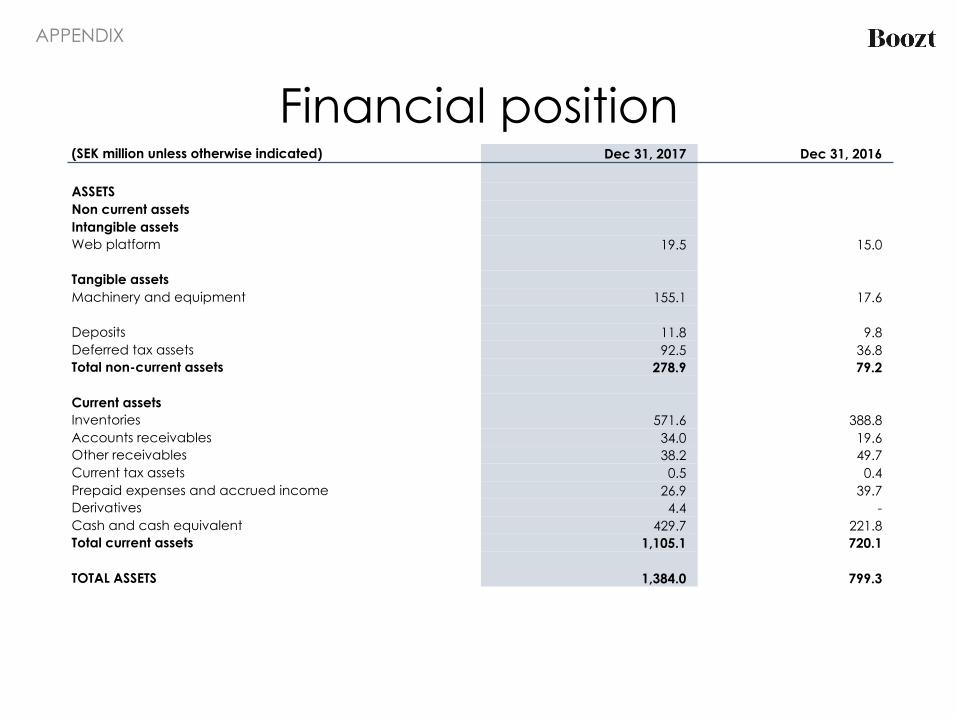
Financial position(SEK million unless otherwise indicated) Dec 31, 2017 Dec 31, 2016
ASSETSNon current assetsIntangible assetsWeb platform 19.5 15.0
Tangible assetsMachinery and equipment 155.1 17.6
Deposits 11.8 9.8Deferred tax assets 92.5 36.8Total non-current assets 278.9 79.2
Current assetsInventories 571.6 388.8Accounts receivables 34.0 19.6Other receivables 38.2 49.7Current tax assets 0.5 0.4Prepaid expenses and accrued income 26.9 39.7Derivatives 4.4 -Cash and cash equivalent 429.7 221.8Total current assets 1,105.1 720.1
TOTAL ASSETS 1,384.0 799.3
APPENDIX
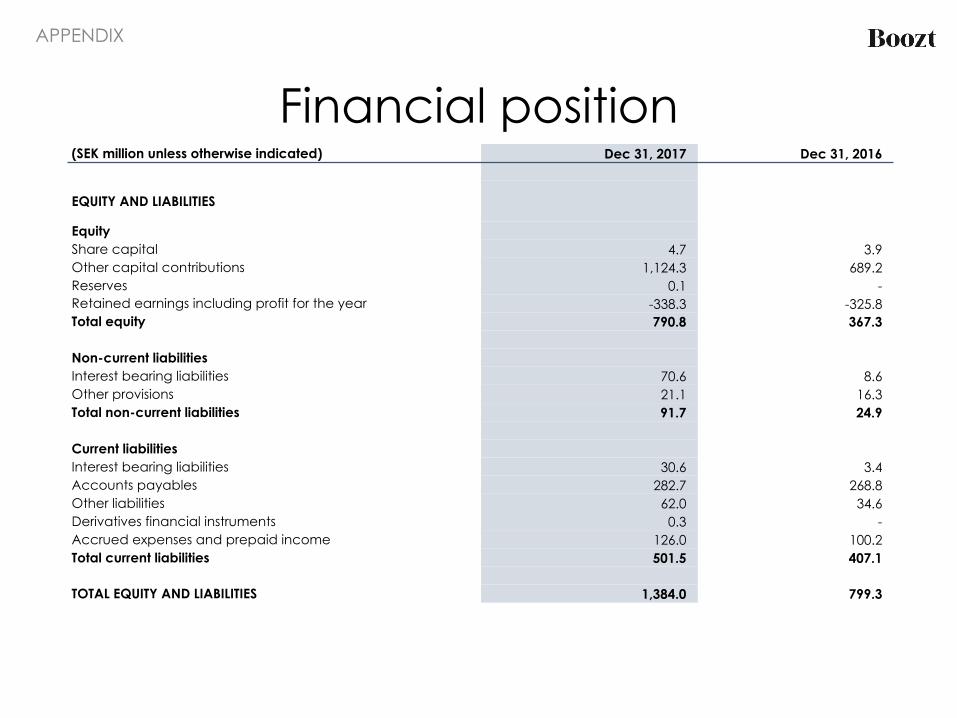
Financial position(SEK million unless otherwise indicated) Dec 31, 2017 Dec 31, 2016
EQUITY AND LIABILITIES
EquityShare capital 4.7 3.9 Other capital contributions 1,124.3 689.2 Reserves 0.1 -Retained earnings including profit for the year -338.3 -325.8 Total equity 790.8 367.3
Non-current liabilitiesInterest bearing liabilities 70.6 8.6Other provisions 21.1 16.3Total non-current liabilities 91.7 24.9
Current liabilitiesInterest bearing liabilities 30.6 3.4Accounts payables 282.7 268.8Other liabilities 62.0 34.6Derivatives financial instruments 0.3 -Accrued expenses and prepaid income 126.0 100.2Total current liabilities 501.5 407.1
TOTAL EQUITY AND LIABILITIES 1,384.0 799.3
APPENDIX
Disclaimer
The Company’s financial targets set forth above constitute forward-looking information that is subject to considerableuncertainty. The financial targets are based upon a number of assumptions relating to, among others, the development ofthe Company’s industry, business, results of operations and financial condition. Company’s business, results of operationsand financial condition, and the development of the industry and the macroeconomic environment in which theCompany operates, may differ materially from, and be more negative than, those assumed by the Company’s whenpreparing the financial targets set out above. As a result, the Company’s ability to reach these financial targets is subjectto uncertainties and contingencies, some of which are beyond its control, and no assurance can be given that theCompany will be able to reach these targets or that the Company’s financial condition or results of operations will not bematerially different from these financial targets.
Related Documents