
Welcome message from author
This document is posted to help you gain knowledge. Please leave a comment to let me know what you think about it! Share it to your friends and learn new things together.
Transcript

:
ROADMAP OFSDGs INDONESIA:
A HIGHLIGHT
Ministry of National Development Planning/National Development Planning Agency

iii
FOREWORDIndonesia is committed to successfully implement the Sustainable Development Goals by achieving the 2030 development agenda. In this regard, the Indonesia’s Presidential Regulation no. 59/2017 concerning the implementation of SDGs in Indonesia mandated the Ministry of National Development Planning of the Republic of Indonesia to provide the Roadmap of SDGs Indonesia.
The Roadmap of SDGs Indonesia was developed through a long process and discussion by involving multi-stakeholder participation, ensuring that the contents of this roadmap reflect all stakeholders’ aspirations with rigorous exercises. The roadmap defines issues and projections of main SDGs indicators in each goal, including its forward-looking policies to achieve such targets. There are around 60 selected indicators to include in the full version of the roadmap. This book presents a summary version of the roadmap that shows some highlights only, covering 29 selected indicators. The full version of the roadmap will be soon finalized in due time and launched in Indonesia at the Indonesian SDGs Annual Summit 2019.
From the projection exercises and intervention scenarios of the indicators, it is clear that the achievement of such targets need strong collaboration among stakeholders and commitments in both activities and financing, as the gaps still remain for achieving the ambitious 2030 agenda. Therefore, this roadmap will be an important tool to guide all stakeholders on the directions and targets of the Indonesian 2030 agenda by emphasizing a productive collaboration among stakeholders and deep understanding that each goal and target of 2030 agenda is interlinked and will be the leverage to one and another.
I do thank to the SDGs team in the Ministry of National Development Planning for the efforts of making this roadmap, as well as all parties who have contributed and supported to the completion of this book.
Prof. Dr. Bambang PS BrodjonegoroMinister of National Development Planning/the Head of National
Development Planning Agencyof the Republic of Indonesia
iv
LIST OF ABBREVIATIONS
ASEAN : Association of Southeast Asian
Nations
Bappenas : Ministry of National Development
Planning
BPJS Kesehatan : National Health Insurance Bu-
reau
BPS : Statistics Indonesia
BTN : Bank Tabungan Negara (com-
mercial bank)
CSR : Corporate Social Responsibility
GDP : Growth Domestic Products
ICT : Information, Communication, and
Technology
IGES : Institute for Global Environmen-
tal Strategies
JKN : National Health Insurance
KPBU : Government and Business Enti-
ties Cooperation
NGOs : Non Governmental Organizations
OECD : Organisation for Economic
Co-operation and Development
PINA : Non-Government Budget Equity
Financing
PISA : Programme for International
Student Assessment
Riskesdas : Basic Health Research
RKP : Government Work Plan
RPJMN : National Medium Term Develop-
ment Plan
SAKERNAS : National Labor Force Survey
SDGs : Sustainable Development Goals
SDKI : Indonesia Demographic and
Health Survey
SJSN : National Social Security System
SUPAS : Population Survey between Cen-
suses
SUSENAS : National Socio-Economic Survey
UNFPA : United Nations Population Fund
WHO : World Health Organization
v
TABLE OF CONTENTSFOREWORD . . . . . . . . . . . . . . . . . . . . . . . . . . . . . . . . . . . . . . . . iiiLIST OF ABBREVIATIONS . . . . . . . . . . . . . . . . . . . . . . . . . . . . ivTABLE OF CONTENTS . . . . . . . . . . . . . . . . . . . . . . . . . . . . . . . . v
1. CHAPTER 1 ROADMAP OVERVIEW . . . . . . . . . . . . . . . . . . . 1
2. CHAPTER 2 THE 2030 SDGs TARGET AND POLICY . . . . . . 6
2.1. GOAL 1 NO PROVERTY . . . . . . . . . . . . . . . . . . . . . . . . . . . . . . .72.1.1. Percentage of people living below the national
poverty line (1.2.1*) . . . . . . . . . . . . . . . . . . . . . . 82.2. GOAL 2 ZERO HUNGER . . . . . . . . . . . . . . . . . . . . . . . . . . . . . .11
2.2.1. Prevalence of population who experienced food insecurity at moderate or severe levels based on Food Insecurity Experiences Scale (FIES) (2.1.2) . . . . . . . . . . . . . . . . . . . . . . . . . . . 12
2.2.2. Prevalence of stunting in children under five (2.2.1) . . . . . . . . . . . . . . . . . . . . . . . . . . . . . . . . 13
2.3. GOAL 3 GOOD HEALTH AND WELL-BEING . . . . . . . . . . . . .172.3.1. 3.1.1* Maternal mortality per 100,000 live
births . . . . . . . . . . . . . . . . . . . . . . . . . . . . . . . . . 182.3.2. Infant Mortality per 1,000 live births (3.2.2.(a))
. . . . . . . . . . . . . . . . . . . . . . . . . . . . . . . . . . . . . 192.3.3. Tuberculosis (TB) Incidence per 100,000
population (3.3.2.(a)) . . . . . . . . . . . . . . . . . . . . 202.3.4. Percentage of smoking in adolescent (people
aged 10-18 year old) (3.4.1.(a)) . . . . . . . . . . . 212.3.5. Prevalence of Obesity in Adult Population (Age
≥18 year old) (3.4.1.(c)) . . . . . . . . . . . . . . . . . . 222.3.6. Total Fertility Rate (TFR) (3.7.2.(a)) . . . . . . . . 232.3.7. Coverage of National Health Insurance
(3.8.2.(a)) . . . . . . . . . . . . . . . . . . . . . . . . . . . . . 242.4. GOAL 4 QUALITY EDUCATION . . . . . . . . . . . . . . . . . . . . . . . .27
2.4.1. Proportion of children: (a) at fourth grade who achieve minimum proficiency in (i) reading and (ii) mathematics (4.1.1*) . . . . . . . . . . . . . . . . . 28
2.4.2. Proportion of adolescent: (c) at ninth grade who achieve minimum proficiency in (i) reading & (ii) mathematics (4.1.1*) . . . . . . . . . . . . . . . 30
2.4.3. Gross enrollment rate, preprimary (4.2.2.(a)) 322.4.4. Gross enrollment rate, higher secondary
(4.3.1.(a)) . . . . . . . . . . . . . . . . . . . . . . . . . . . . . 332.4.5. Gross enrollment rate, tertiary (4.3.1.(b)) . . . 342.4.6. Net ratio of girls to boys (3) higher secondary
& in (4) tertiary education (4.5.1*) . . . . . . . . . 352.4.7. 4.5.1* Net ratio of girls to boys in (3) higher
secondary, and (4) tertiary education . . . . . . 362.5. GOAL 5 GENDER EQUALITY . . . . . . . . . . . . . . . . . . . . . . . . . .43
2.5.1. Proportion of women aged 20–24 years who were married or in a union before age 18 y.o (5.3.1.*) . . . . . . . . . . . . . . . . . . . . . . . . . . . . . . . 44
2.6. GOAL 6 CLEAN WATER AND SANITATION . . . . . . . . . . . . .472.6.1. Percentage of households having access to an
improved drinking water services (6.1.1.(a)) . . . . . . . . . . . . . . . . . . . . . . . . . . . . . . . . . . . . . . . 48
vi
2.6.2. Percentage of households having access to an improved sanitation (6.2.1.(b)) . . . . . . . . . . . . 50
2.7. GOAL 7 AFFORDABLE AND CLEAN ENERGY . . . . . . . . . . .532.7.1. Electric power consumption per capita
(7.1.1.(a)) . . . . . . . . . . . . . . . . . . . . . . . . . . . . . 542.7.2. Renewable energy mix (7.2.1*) . . . . . . . . . . . 57
2.8. GOAL 8 DECENT WORK AND ECONOMIC GROWTH . . . . .612.8.1. Growth rate of real GDP per capita (8.1.1*) . 622.8.2. Unemployment Rate (8.5.2*) . . . . . . . . . . . . . 64
2.9. GOAL 9 INDUSTRY, INNOVATION AND INFRASTRUCTURE . . . . . . . . . . . . . . . . . . . . . . . . . . . . . . . . . . . . . . . . . . . . . . . . . . .672.9.1. Proportion of population served by mobile
broadband service (9.c.1*) . . . . . . . . . . . . . . . 682.10. GOAL 10 REDUCED INEQUALITIES . . . . . . . . . . . . . . . . . . . .71
2.10.1. Gini coefficient (10.1.1*) . . . . . . . . . . . . . . . . . 722.11. GOAL 11 SUSTAINABLE CITIES AND COMMUNITIES . . .75
2.11.1. Proportion of households with access to decent and affordable housing (11.1.1.(a)) . 76
2.12. GOAL 13 CLIMATE ACTION . . . . . . . . . . . . . . . . . . . . . . . . . .792.12.1. Intensity of the green house gas emissions
(13.2.1.(b)) . . . . . . . . . . . . . . . . . . . . . . . . . . . . 802.13. GOAL 15 LIFE ON LAND . . . . . . . . . . . . . . . . . . . . . . . . . . . . .83
2.13.1. Proportion of forest cover to total land area (15.1.1.(a)) . . . . . . . . . . . . . . . . . . . . . . . . . . . . 84
2.14. GOAL 17 PARTNERSHIPS FOR THE GOALS . . . . . . . . . . . .872.14.1. Tax revenue to GDP ratio (17.1.1.(a)) . . . . . . 882.14.2. Proportion of individuals using internet
(17.8.1*) . . . . . . . . . . . . . . . . . . . . . . . . . . . . . . 90
3. CHAPTER 3 INTERLINKAGES OF 17 GOALS . . . . . . . . . . . 93
3.1. Introduction . . . . . . . . . . . . . . . . . . . . . . . . . . . . . . . . . . . . . . . .943.2. Literature Review . . . . . . . . . . . . . . . . . . . . . . . . . . . . . . . . . . .953.3. Methodology . . . . . . . . . . . . . . . . . . . . . . . . . . . . . . . . . . . . . . .963.4. Mapping of Interlinkages . . . . . . . . . . . . . . . . . . . . . . . . . . . .993.5. Future Prospect . . . . . . . . . . . . . . . . . . . . . . . . . . . . . . . . . . 102
4. CHAPTER 4 SDGS FINANCING STRATEGY . . . . . . . . . . . 103
4.1. Introduction . . . . . . . . . . . . . . . . . . . . . . . . . . . . . . . . . . . . . . 1044.2. Counting SDGs Investment Needs for Indonesia . . . . . . 1054.3. SDGs Investment in Indonesia and the Role of Non-
Government . . . . . . . . . . . . . . . . . . . . . . . . . . . . . . . . . . . . . . 1064.4. Indonesia Financing Strategy for SDGs . . . . . . . . . . . . . . 1084.5. The Objectives of Financing Strategies . . . . . . . . . . . . . . 1094.6. Implementing Financing Strategies for SDGs . . . . . . . . . 1104.7. The Indonesia’s SDGs Financing HUB . . . . . . . . . . . . . . . . 1114.8. Financing Sources Coordinated and Synchronized by SDGs
Financing HUB . . . . . . . . . . . . . . . . . . . . . . . . . . . . . . . . . . . 112
5. CHAPTER 5 THE WAY FORWARD . . . . . . . . . . . . . . . . . . 113
5.1. The Way Forward . . . . . . . . . . . . . . . . . . . . . . . . . . . . . . . . . 114
1Roadmap of SDGs Indonesia
1. CHAPTER 1 ROADMAP OVERVIEW
CHAPTER 1
ROADMAP OVERVIEW
2
Roadmap OverviewChapter 1
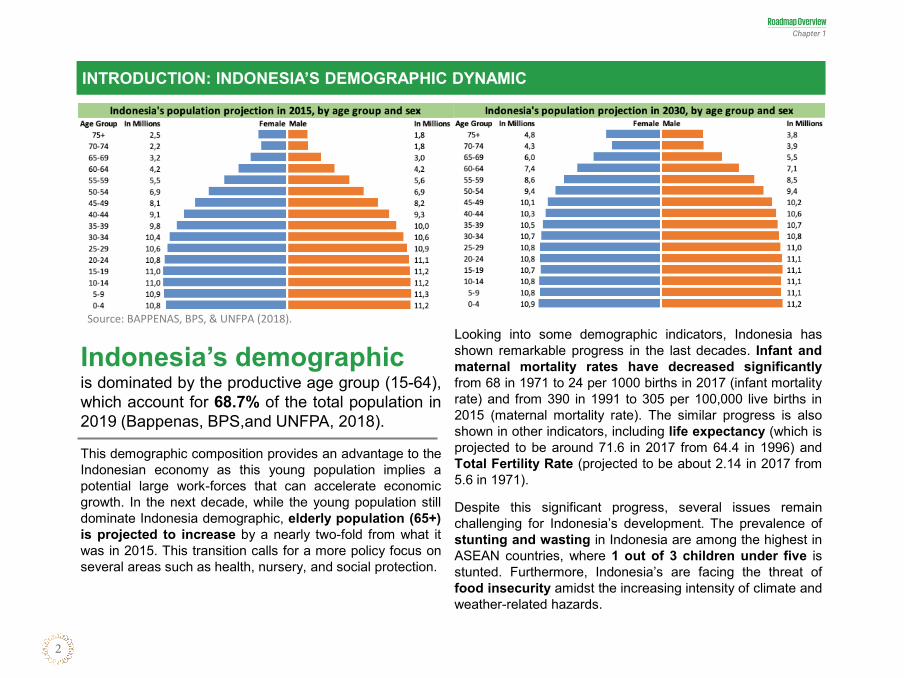
Looking into some demographic indicators, Indonesia hasshown remarkable progress in the last decades. Infant andmaternal mortality rates have decreased significantlyfrom 68 in 1971 to 24 per 1000 births in 2017 (infant mortalityrate) and from 390 in 1991 to 305 per 100,000 live births in2015 (maternal mortality rate). The similar progress is alsoshown in other indicators, including life expectancy (which isprojected to be around 71.6 in 2017 from 64.4 in 1996) andTotal Fertility Rate (projected to be about 2.14 in 2017 from5.6 in 1971).
Despite this significant progress, several issues remainchallenging for Indonesia’s development. The prevalence ofstunting and wasting in Indonesia are among the highest inASEAN countries, where 1 out of 3 children under five isstunted. Furthermore, Indonesia’s are facing the threat offood insecurity amidst the increasing intensity of climate andweather-related hazards.
INTRODUCTION: INDONESIA’S DEMOGRAPHIC DYNAMIC
Source: BAPPENAS, BPS, & UNFPA (2018).
Indonesia’s demographic is dominated by the productive age group (15-64),which account for 68.7% of the total population in2019 (Bappenas, BPS,and UNFPA, 2018).
This demographic composition provides an advantage to theIndonesian economy as this young population implies apotential large work-forces that can accelerate economicgrowth. In the next decade, while the young population stilldominate Indonesia demographic, elderly population (65+)is projected to increase by a nearly two-fold from what itwas in 2015. This transition calls for a more policy focus onseveral areas such as health, nursery, and social protection.
3Roadmap of SDGs Indonesia
INTRODUCTION: ECONOMIC DEVELOPMENT PROGRESS
Source: OECD
2621792,16
3369484
4205102
5163064
0
1000000
2000000
3000000
4000000
5000000
6000000
2015 2020 2025 2030
Indonesia’s real GDP (in million USD)
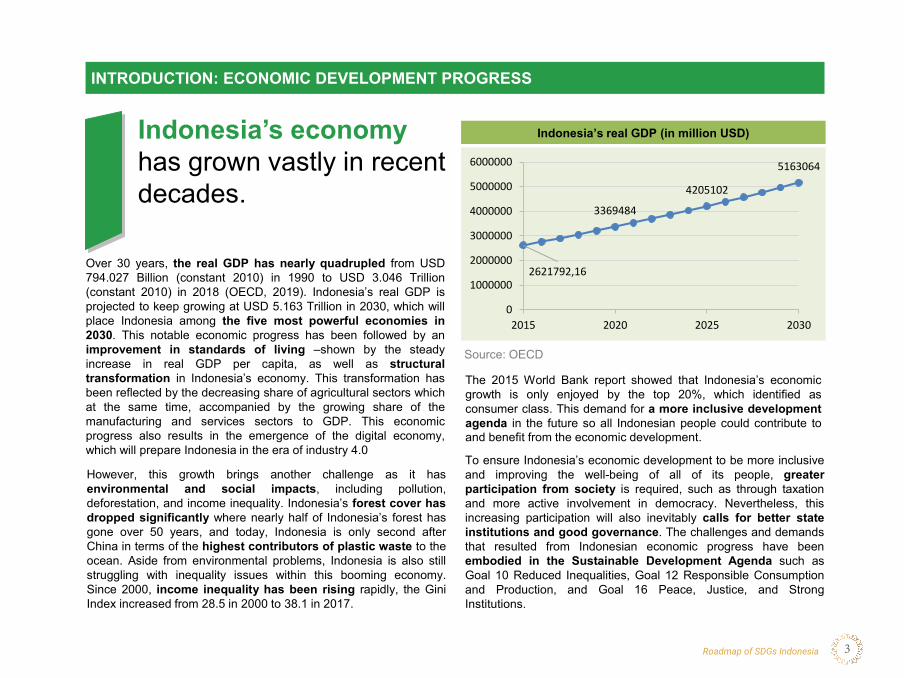
To ensure Indonesia’s economic development to be more inclusiveand improving the well-being of all of its people, greaterparticipation from society is required, such as through taxationand more active involvement in democracy. Nevertheless, thisincreasing participation will also inevitably calls for better stateinstitutions and good governance. The challenges and demandsthat resulted from Indonesian economic progress have beenembodied in the Sustainable Development Agenda such asGoal 10 Reduced Inequalities, Goal 12 Responsible Consumptionand Production, and Goal 16 Peace, Justice, and StrongInstitutions.
Over 30 years, the real GDP has nearly quadrupled from USD794.027 Billion (constant 2010) in 1990 to USD 3.046 Trillion(constant 2010) in 2018 (OECD, 2019). Indonesia’s real GDP isprojected to keep growing at USD 5.163 Trillion in 2030, which willplace Indonesia among the five most powerful economies in2030. This notable economic progress has been followed by animprovement in standards of living –shown by the steadyincrease in real GDP per capita, as well as structuraltransformation in Indonesia’s economy. This transformation hasbeen reflected by the decreasing share of agricultural sectors whichat the same time, accompanied by the growing share of themanufacturing and services sectors to GDP. This economicprogress also results in the emergence of the digital economy,which will prepare Indonesia in the era of industry 4.0
Indonesia’s economyhas grown vastly in recent decades.
However, this growth brings another challenge as it hasenvironmental and social impacts, including pollution,deforestation, and income inequality. Indonesia’s forest cover hasdropped significantly where nearly half of Indonesia’s forest hasgone over 50 years, and today, Indonesia is only second afterChina in terms of the highest contributors of plastic waste to theocean. Aside from environmental problems, Indonesia is also stillstruggling with inequality issues within this booming economy.Since 2000, income inequality has been rising rapidly, the GiniIndex increased from 28.5 in 2000 to 38.1 in 2017.
The 2015 World Bank report showed that Indonesia’s economicgrowth is only enjoyed by the top 20%, which identified asconsumer class. This demand for a more inclusive developmentagenda in the future so all Indonesian people could contribute toand benefit from the economic development.
4
Roadmap OverviewChapter 1
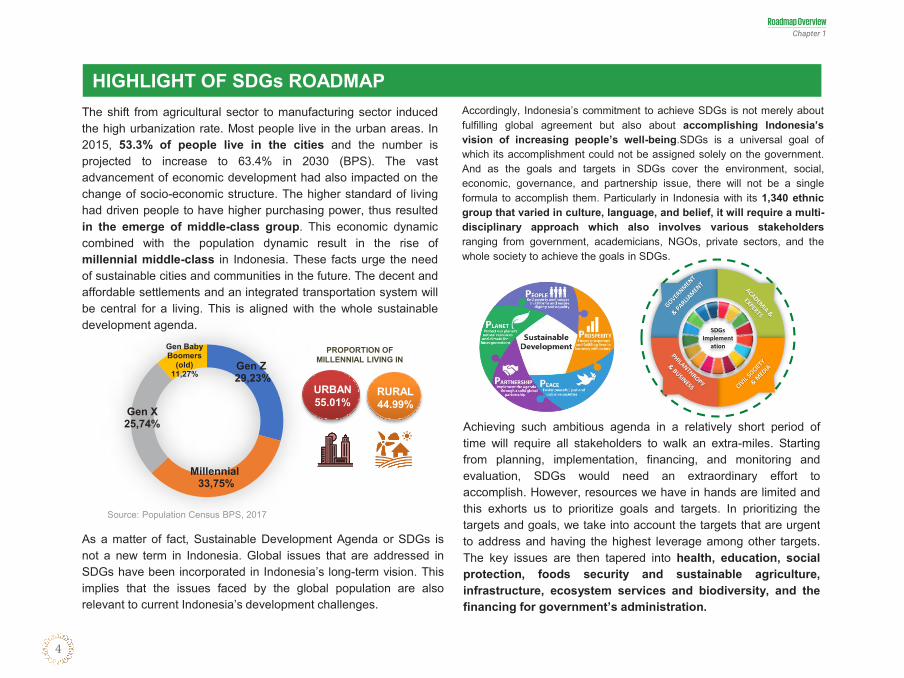
The shift from agricultural sector to manufacturing sector inducedthe high urbanization rate. Most people live in the urban areas. In2015, 53.3% of people live in the cities and the number isprojected to increase to 63.4% in 2030 (BPS). The vastadvancement of economic development had also impacted on thechange of socio-economic structure. The higher standard of livinghad driven people to have higher purchasing power, thus resultedin the emerge of middle-class group. This economic dynamiccombined with the population dynamic result in the rise ofmillennial middle-class in Indonesia. These facts urge the needof sustainable cities and communities in the future. The decent andaffordable settlements and an integrated transportation system willbe central for a living. This is aligned with the whole sustainabledevelopment agenda.
As a matter of fact, Sustainable Development Agenda or SDGs isnot a new term in Indonesia. Global issues that are addressed inSDGs have been incorporated in Indonesia’s long-term vision. Thisimplies that the issues faced by the global population are alsorelevant to current Indonesia’s development challenges.
Accordingly, Indonesia’s commitment to achieve SDGs is not merely aboutfulfilling global agreement but also about accomplishing Indonesia’svision of increasing people’s well-being.SDGs is a universal goal ofwhich its accomplishment could not be assigned solely on the government.And as the goals and targets in SDGs cover the environment, social,economic, governance, and partnership issue, there will not be a singleformula to accomplish them. Particularly in Indonesia with its 1,340 ethnicgroup that varied in culture, language, and belief, it will require a multi-disciplinary approach which also involves various stakeholdersranging from government, academicians, NGOs, private sectors, and thewhole society to achieve the goals in SDGs.
Achieving such ambitious agenda in a relatively short period oftime will require all stakeholders to walk an extra-miles. Startingfrom planning, implementation, financing, and monitoring andevaluation, SDGs would need an extraordinary effort toaccomplish. However, resources we have in hands are limited andthis exhorts us to prioritize goals and targets. In prioritizing thetargets and goals, we take into account the targets that are urgentto address and having the highest leverage among other targets.The key issues are then tapered into health, education, socialprotection, foods security and sustainable agriculture,infrastructure, ecosystem services and biodiversity, and thefinancing for government’s administration.
SDGsImplement
ation
HIGHLIGHT OF SDGs ROADMAP
PROPORTION OF MILLENNIAL LIVING IN
RURAL44.99%
URBAN55.01%
Gen Z29,23%
Millennial33,75%
Gen X25,74%
Gen Baby Boomers
(old)11,27%
Source: Population Census BPS, 2017
5Roadmap of SDGs Indonesia
To monitor how far or how close we are to SDGs targets, we needmeasurable indicators to trace SDGs progress in Indonesia. Asmany as 94 out of 241 indicators in SDGs are in fact alreadyaligned with targets in RPJMN. Even so, to understand the pathprojection of SDGs indicators, all stakeholders would need aroadmap which will act as a guidance to better plan and target theprograms. The roadmap is expected to be used together,cooperatively, to accomplish SDGs 2030.
HIGHLIGHT OF SDGs ROADMAP
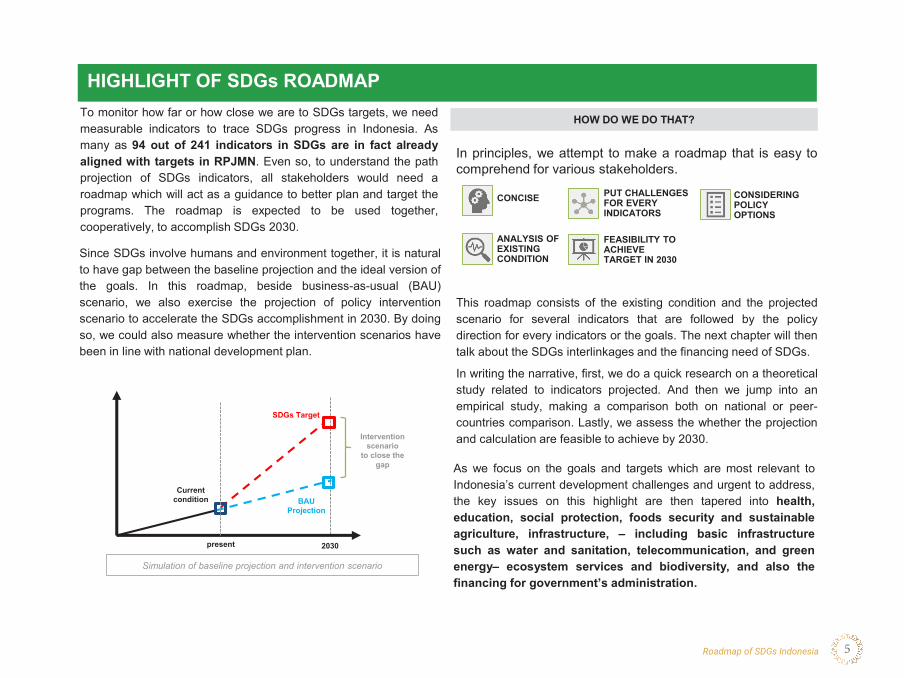
Since SDGs involve humans and environment together, it is naturalto have gap between the baseline projection and the ideal version ofthe goals. In this roadmap, beside business-as-usual (BAU)scenario, we also exercise the projection of policy interventionscenario to accelerate the SDGs accomplishment in 2030. By doingso, we could also measure whether the intervention scenarios havebeen in line with national development plan.
Current condition
SDGs Target
BAU Projection
Intervention scenario
to close the gap
present 2030
HOW DO WE DO THAT?
In principles, we attempt to make a roadmap that is easy tocomprehend for various stakeholders.
This roadmap consists of the existing condition and the projectedscenario for several indicators that are followed by the policydirection for every indicators or the goals. The next chapter will thentalk about the SDGs interlinkages and the financing need of SDGs.
In writing the narrative, first, we do a quick research on a theoreticalstudy related to indicators projected. And then we jump into anempirical study, making a comparison both on national or peer-countries comparison. Lastly, we assess the whether the projectionand calculation are feasible to achieve by 2030.
As we focus on the goals and targets which are most relevant toIndonesia’s current development challenges and urgent to address,the key issues on this highlight are then tapered into health,education, social protection, foods security and sustainableagriculture, infrastructure, – including basic infrastructuresuch as water and sanitation, telecommunication, and greenenergy– ecosystem services and biodiversity, and also thefinancing for government’s administration.
CONCISE
ANALYSIS OF EXISTING CONDITION
PUT CHALLENGES FOR EVERY INDICATORS
CONSIDERING POLICY OPTIONS
FEASIBILITY TO ACHIEVE TARGET IN 2030
Simulation of baseline projection and intervention scenario
6
Roadmap OverviewChapter 1
2. CHAPTER 2 THE 2030 SDGs TAR-
GET AND POLICY
CHAPTER 2
THE 2030 SDGsTARGET AND POLICY
GOAL
1
7Roadmap of SDGs Indonesia
2 .1 . G O A L 1 N O P R O V E R T Y
2 .1
G OA L 1N O P OV E R T Y
8
GOAL 1 NO POVERTYA Highlight
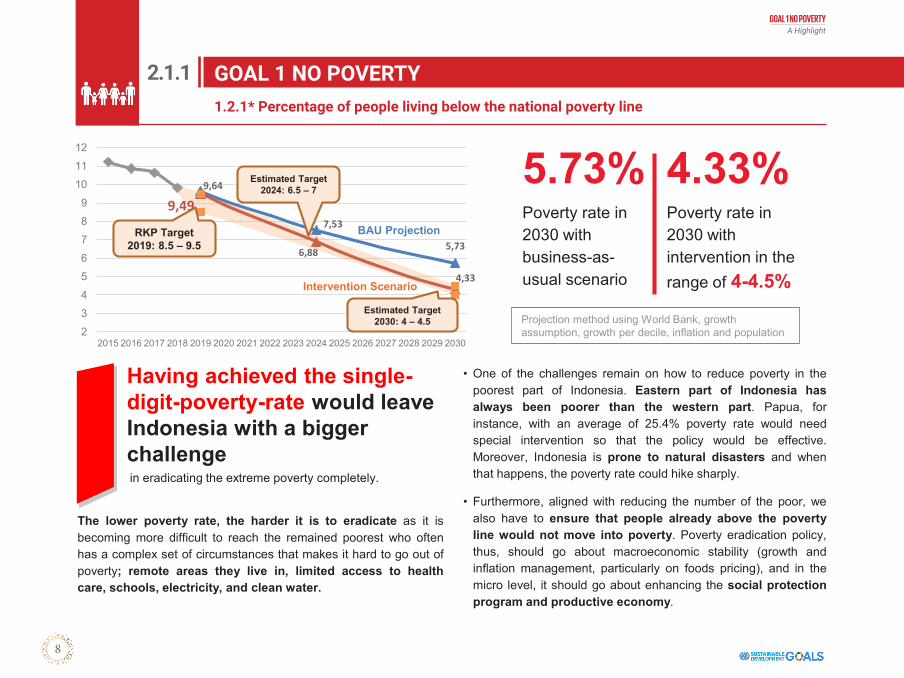
• One of the challenges remain on how to reduce poverty in thepoorest part of Indonesia. Eastern part of Indonesia hasalways been poorer than the western part. Papua, forinstance, with an average of 25.4% poverty rate would needspecial intervention so that the policy would be effective.Moreover, Indonesia is prone to natural disasters and whenthat happens, the poverty rate could hike sharply.
• Furthermore, aligned with reducing the number of the poor, wealso have to ensure that people already above the povertyline would not move into poverty. Poverty eradication policy,thus, should go about macroeconomic stability (growth andinflation management, particularly on foods pricing), and in themicro level, it should go about enhancing the social protectionprogram and productive economy.
1.2.1* Percentage of people living below the national poverty line
GOAL 1 NO POVERTY
5.73%Poverty rate in 2030 with business-as-usual scenario
4.33%Poverty rate in 2030 with intervention in the range of 4-4.5%
9,64
7,53
5,736,88
4,33
23456789
101112
2015 2016 2017 2018 2019 2020 2021 2022 2023 2024 2025 2026 2027 2028 2029 2030
Estimated Target2030: 4 – 4.5
9,49RKP Target
2019: 8.5 – 9.5BAU Projection
Intervention Scenario
Projection method using World Bank, growth assumption, growth per decile, inflation and population
The lower poverty rate, the harder it is to eradicate as it isbecoming more difficult to reach the remained poorest who oftenhas a complex set of circumstances that makes it hard to go out ofpoverty; remote areas they live in, limited access to healthcare, schools, electricity, and clean water.
Having achieved the single-digit-poverty-rate would leaveIndonesia with a bigger challenge in eradicating the extreme poverty completely.
Estimated Target2024: 6.5 – 7
2.1.1. Percentage of people living below the national poverty line (1.2.1*)
1.2.1* Percentage of people living below the national poverty line
GOAL 1 NO POVERTY2.1.1
GOAL
1
9Roadmap of SDGs Indonesia
Year Baseline Intervention Target range
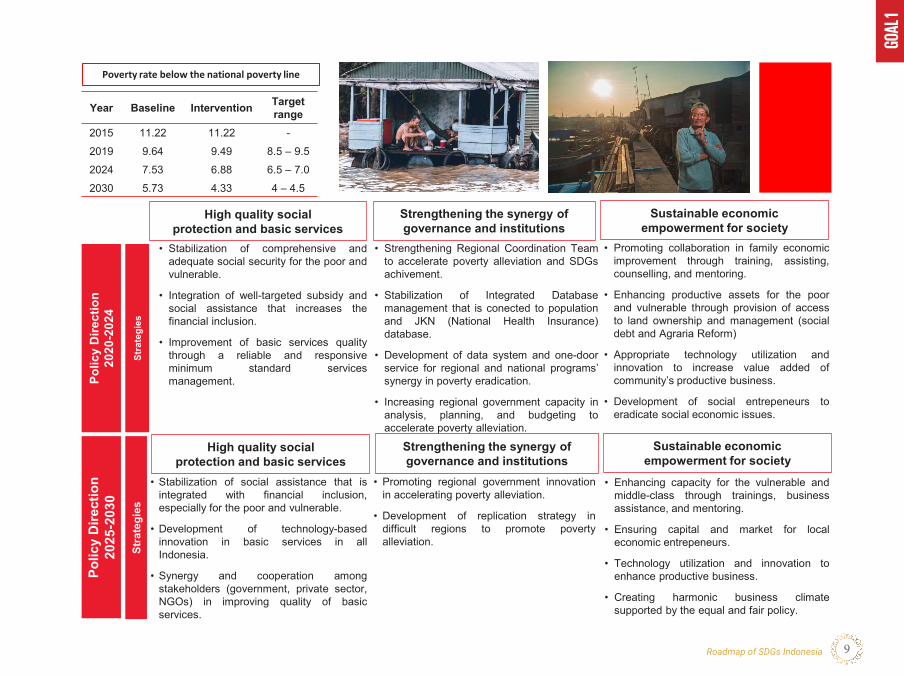
2015 11.22 11.22 -2019 9.64 9.49 8.5 – 9.52024 7.53 6.88 6.5 – 7.02030 5.73 4.33 4 – 4.5
Polic
y D
irect
ion
2020
-202
4
Stra
tegi
es
• Strengthening Regional Coordination Teamto accelerate poverty alleviation and SDGsachivement.
• Stabilization of Integrated Databasemanagement that is conected to populationand JKN (National Health Insurance)database.
• Development of data system and one-doorservice for regional and national programs’synergy in poverty eradication.
• Increasing regional government capacity inanalysis, planning, and budgeting toaccelerate poverty alleviation.
• Promoting collaboration in family economicimprovement through training, assisting,counselling, and mentoring.
• Enhancing productive assets for the poorand vulnerable through provision of accessto land ownership and management (socialdebt and Agraria Reform)
• Appropriate technology utilization andinnovation to increase value added ofcommunity’s productive business.
• Development of social entrepeneurs toeradicate social economic issues.
• Stabilization of comprehensive andadequate social security for the poor andvulnerable.
• Integration of well-targeted subsidy andsocial assistance that increases thefinancial inclusion.
• Improvement of basic services qualitythrough a reliable and responsiveminimum standard servicesmanagement.
Strengthening the synergy of governance and institutions
High quality social protection and basic services
Sustainable economic empowerment for society
Polic
y D
irect
ion
2025
-203
0
Stra
tegi
es
• Stabilization of social assistance that isintegrated with financial inclusion,especially for the poor and vulnerable.
• Development of technology-basedinnovation in basic services in allIndonesia.
• Synergy and cooperation amongstakeholders (government, private sector,NGOs) in improving quality of basicservices.
• Promoting regional government innovationin accelerating poverty alleviation.
• Development of replication strategy indifficult regions to promote povertyalleviation.
• Enhancing capacity for the vulnerable andmiddle-class through trainings, businessassistance, and mentoring.
• Ensuring capital and market for localeconomic entrepeneurs.
• Technology utilization and innovation toenhance productive business.
• Creating harmonic business climatesupported by the equal and fair policy.
Poverty rate below the national poverty line
Strengthening the synergy of governance and institutions
High quality social protection and basic services
Sustainable economic empowerment for society

GOAL 1 NO POVERTYA Highlight
GOAL
2
Roadmap of SDGs Indonesia 11
2 . 2 . G O A L 2 Z E R O H U N G E R
2 . 2
G OA L 2Z E R O H U N G E R
GOAL 2 ZERO HUNGERA Highlight
12
Data source: SUSENAS, BPS
GOAL 2 ZERO HUNGER2.1.2 Prevalence of population who experienced food insecurity at moderate or severe levels based on Food Insecurity Experiences Scale (FIES)
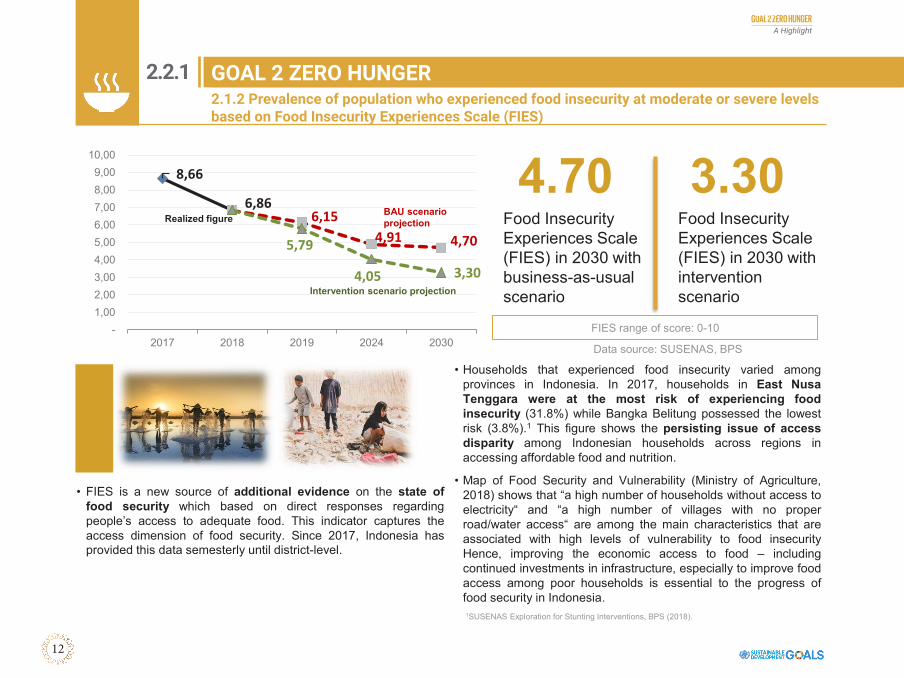
4.70 3.30Food Insecurity Experiences Scale (FIES) in 2030 with business-as-usual scenario
Food Insecurity Experiences Scale (FIES) in 2030 with intervention scenario
8,66
6,86 6,15
4,91 4,705,79
4,05 3,30
- 1,00 2,00 3,00 4,00 5,00 6,00 7,00 8,00 9,00
10,00
2017 2018 2019 2024 2030
Realized figureBAU scenario projection
Intervention scenario projection
FIES range of score: 0-10
• Households that experienced food insecurity varied amongprovinces in Indonesia. In 2017, households in East NusaTenggara were at the most risk of experiencing foodinsecurity (31.8%) while Bangka Belitung possessed the lowestrisk (3.8%).1 This figure shows the persisting issue of accessdisparity among Indonesian households across regions inaccessing affordable food and nutrition.
• Map of Food Security and Vulnerability (Ministry of Agriculture,2018) shows that “a high number of households without access toelectricity“ and “a high number of villages with no properroad/water access“ are among the main characteristics that areassociated with high levels of vulnerability to food insecurityHence, improving the economic access to food – includingcontinued investments in infrastructure, especially to improve foodaccess among poor households is essential to the progress offood security in Indonesia.1SUSENAS Exploration for Stunting Interventions, BPS (2018).
• FIES is a new source of additional evidence on the state offood security which based on direct responses regardingpeople’s access to adequate food. This indicator captures theaccess dimension of food security. Since 2017, Indonesia hasprovided this data semesterly until district-level.
2.1.2 Prevalence of population who experienced food insecurity at moderate or severe levelsbased on Food Insecurity Experiences Scale (FIES)
2.2.1. Prevalence of population who experienced food insecurity at moderate or severe levels based on Food Insecurity Experiences Scale (FIES) (2.1.2)
GOAL 2 ZERO HUNGER2.2.1

GOAL
2
Roadmap of SDGs Indonesia 13
• Indonesian poor children are almost twice as likely to sufferfrom stunting than their better-off peers.
Data source: Basic Health Survey (RISKESDAS), Ministry of Health
*Exponential projection model.Note: Projection number under intervention scenario for children under five is not available on the 2019 Government Work Plan, the number only available for children under two.
GOAL 2 ZERO HUNGER2.2.1 Prevalence of stunting in children under five
22.37% 10.0%Prevalence of stunting in 2030 with business-as-usual scenario*
Prevalence of stunting in 2030 with intervention scenario
36,8 35,6
32,07 29,13
25,8422,37
1910
0
5
10
15
20
25
30
35
40
2007 2010 2013 2015 2019 2024 2030
Realized figure
BAU scenario projection
Intervention scenario projection
37,2
1Regional Overview of Food Security and Nutrition, FAO (2018).
• In 2013, 48% of children under five from families in the poorestfifth of the population were stunted compared to 29% in therichest fifth group.2 This gap might be explained by the inequalaccess to improved sanitation and drinking water, health care,and high nutrient foods as well as inadequate access to care andfeeding practices among households in different socioeconomicstatus and geographical condition.
• A multi-sectoral approach is required to accelerate stuntingreduction in Indonesia to deliver an integrated nutritionintervention at critical periods during the first 1,000 days of life. Thisintervention includes provision of adequate nutrients forpregnant mothers and children under two, appropriate exclusivebreastfeeding and complementary feeding practices, growthmonitoring, access to improved sanitation and drinking water, earlychildhood development, and promotion of good parenting practices.
30.8% of Indonesian children under five is stunted in 2018
It has put Indonesia as a country with a high prevalence of stuntingaccording to WHO classification. The prevalence of stunting inIndonesia is among the highest compared to its peer countries inSoutheast Asia.1
2Riskesdas, Ministry of Health Republic of Indonesia (2018)
2.2.1 Prevalence of stunting in children under five
2.2.2. Prevalence of stunting in children under five (2.2.1)
GOAL 2 ZERO HUNGER2.2.2
GOAL 2 ZERO HUNGERA Highlight
14
Year Baseline Intervention
2015 8.66 8.66
2019 6.15 5.79
2024 4.91 4.05
2030 4.70 3.30
Prevalence of FIES
Stra
tegi
es
Polic
y Dire
ctio
n20
20-2
024
Polic
y Dire
ctio
n20
25-2
030
Stra
tegi
es
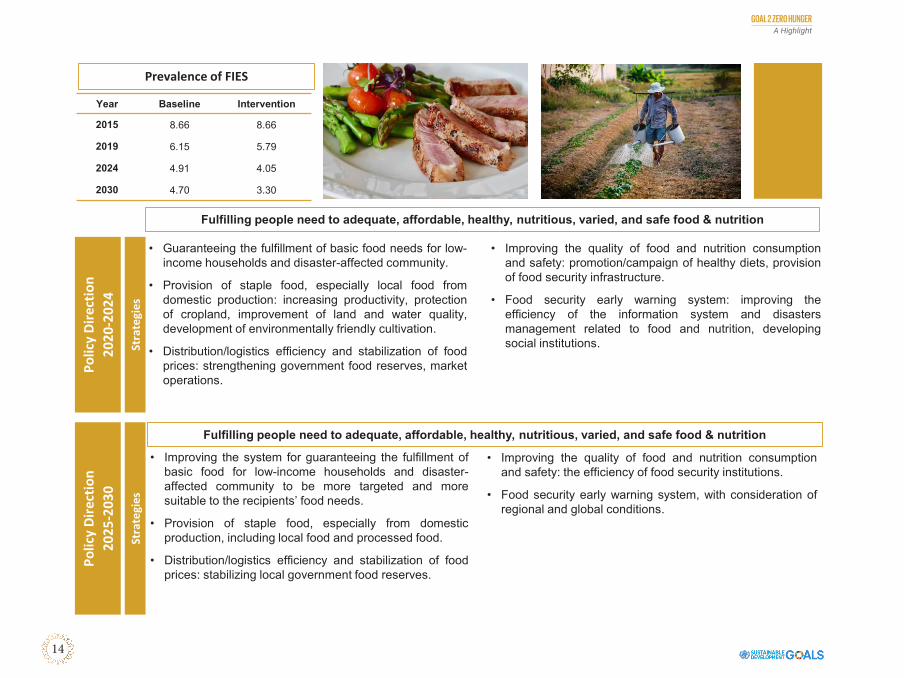
Fulfilling people need to adequate, affordable, healthy, nutritious, varied, and safe food & nutrition
• Guaranteeing the fulfillment of basic food needs for low-income households and disaster-affected community.
• Provision of staple food, especially local food fromdomestic production: increasing productivity, protectionof cropland, improvement of land and water quality,development of environmentally friendly cultivation.
• Distribution/logistics efficiency and stabilization of foodprices: strengthening government food reserves, marketoperations.
• Improving the quality of food and nutrition consumptionand safety: promotion/campaign of healthy diets, provisionof food security infrastructure.
• Food security early warning system: improving theefficiency of the information system and disastersmanagement related to food and nutrition, developingsocial institutions.
• Improving the system for guaranteeing the fulfillment ofbasic food for low-income households and disaster-affected community to be more targeted and moresuitable to the recipients’ food needs.
• Provision of staple food, especially from domesticproduction, including local food and processed food.
• Distribution/logistics efficiency and stabilization of foodprices: stabilizing local government food reserves.
• Improving the quality of food and nutrition consumptionand safety: the efficiency of food security institutions.
• Food security early warning system, with consideration ofregional and global conditions.
Fulfilling people need to adequate, affordable, healthy, nutritious, varied, and safe food & nutrition
GOAL
2
Roadmap of SDGs Indonesia 15
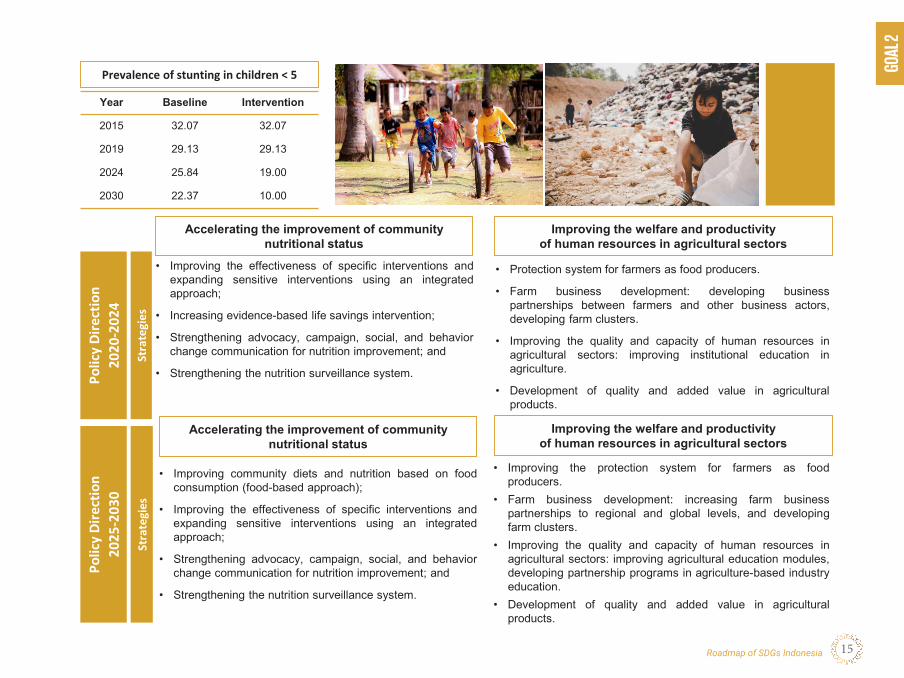
Prevalence of stunting in children < 5
Year Baseline Intervention
2015 32.07 32.07
2019 29.13 29.13
2024 25.84 19.00
2030 22.37 10.00
Stra
tegi
es
Polic
y Dire
ctio
n20
20-2
024
Accelerating the improvement of community nutritional status
• Improving the effectiveness of specific interventions andexpanding sensitive interventions using an integratedapproach;
• Increasing evidence-based life savings intervention;
• Strengthening advocacy, campaign, social, and behaviorchange communication for nutrition improvement; and
• Strengthening the nutrition surveillance system.
Polic
y Dire
ctio
n20
25-2
030
Stra
tegi
es
• Improving community diets and nutrition based on foodconsumption (food-based approach);
• Improving the effectiveness of specific interventions andexpanding sensitive interventions using an integratedapproach;
• Strengthening advocacy, campaign, social, and behaviorchange communication for nutrition improvement; and
• Strengthening the nutrition surveillance system.
• Protection system for farmers as food producers.
• Farm business development: developing businesspartnerships between farmers and other business actors,developing farm clusters.
• Improving the quality and capacity of human resources inagricultural sectors: improving institutional education inagriculture.
• Development of quality and added value in agriculturalproducts.
• Improving the protection system for farmers as foodproducers.
• Farm business development: increasing farm businesspartnerships to regional and global levels, and developingfarm clusters.
• Improving the quality and capacity of human resources inagricultural sectors: improving agricultural education modules,developing partnership programs in agriculture-based industryeducation.
• Development of quality and added value in agriculturalproducts.
Improving the welfare and productivity of human resources in agricultural sectors
Improving the welfare and productivity of human resources in agricultural sectors
Accelerating the improvement of community nutritional status

GOAL 2 ZERO HUNGERA Highlight
GOAL
3
Roadmap of SDGs Indonesia 17
2 . 3 . G O A L 3 G O O D H E A LT H A N D W E L L- B E I N G
2 . 3
G OA L 3G O O D H E A LT H A N D W E L L- B E I N G

GOAL 3 GOOD HEALTH AND WELL-BEINGA Highlight
18
Maternal mortality inIndonesia is the highest among peer countries in ASEAN.
3.1.1* Maternal mortality per 100,000 live birth
305276
244
210
305
243
183 131
0
50
100
150
200
250
300
350
2015 2019 2024 2030
BAU Projection
Intervention Scenario
• The skilled birth attendance is essential to preventmaternal death. However, there is still a gap in the coverageof skilled birth attendance across region. The coverage inJava-Bali region was 52% while in other regions was only42%. The skilled birth attendance coverage should beincreased significantly to achieve maternal mortality reductionin 2030.
• Lack of access to a quality health-care also increases thematernal mortality. The access to the quality health-care isnot only hampered by the absence of health-care provider, butalso related to the geographical barrier particularly for peopleliving in remote areas. It is also worth noting that competentmidwives and a functioning maternal referral system have asignificant role in preventing maternal mortality.
210Mortality per 100,000 live birth BAU scenario
GOAL 3 GOOD HEALTH AND WELLBEING
Source: Population Census and SUPAS
Policy intervention scenario used ARR 5.0%
The main causes for maternal mortality are varied fromhealth issues to socioeconomic issues. Women who aremarried in the younger age have a higher risk of mortalityduring childbirth.
131Mortality per
100,000 live birth with intervention
scenario
3.1.1* Maternal mortality per 100,000 live births
2.3.1. 3.1.1* Maternal mortality per 100,000 live births
GOAL 3 GOOD HEALTH AND WELL-BEING2.3.1
GOAL
3
Roadmap of SDGs Indonesia 19
3432
22,719,1
15,626,9
21,7
16 12
0
5
10
15
20
25
30
35
40
2007 2012 2015 2019 2024 2030
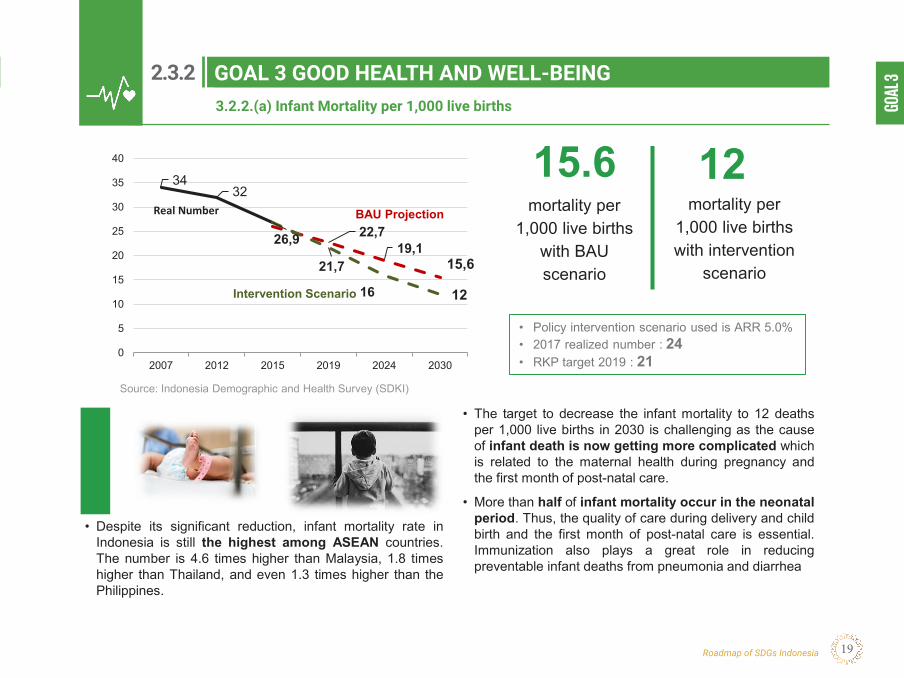
3.2.2.(a) Infant Mortality per 1,000 live births
• The target to decrease the infant mortality to 12 deathsper 1,000 live births in 2030 is challenging as the causeof infant death is now getting more complicated whichis related to the maternal health during pregnancy andthe first month of post-natal care.
• More than half of infant mortality occur in the neonatalperiod. Thus, the quality of care during delivery and childbirth and the first month of post-natal care is essential.Immunization also plays a great role in reducingpreventable infant deaths from pneumonia and diarrhea
15.6 12Real Number BAU Projection
Intervention Scenario
GOAL 3 GOOD HEALTH AND WELLBEING
mortality per 1,000 live births
with BAU scenario
mortality per 1,000 live births with intervention
scenario
• Policy intervention scenario used is ARR 5.0%• 2017 realized number : 24• RKP target 2019 : 21
Source: Indonesia Demographic and Health Survey (SDKI)
• Despite its significant reduction, infant mortality rate inIndonesia is still the highest among ASEAN countries.The number is 4.6 times higher than Malaysia, 1.8 timeshigher than Thailand, and even 1.3 times higher than thePhilippines.
3.2.2.(a) Infant Mortality per 1,000 live births
2.3.2. Infant Mortality per 1,000 live births (3.2.2.(a))
GOAL 3 GOOD HEALTH AND WELL-BEING2.3.2
GOAL 3 GOOD HEALTH AND WELL-BEINGA Highlight
20
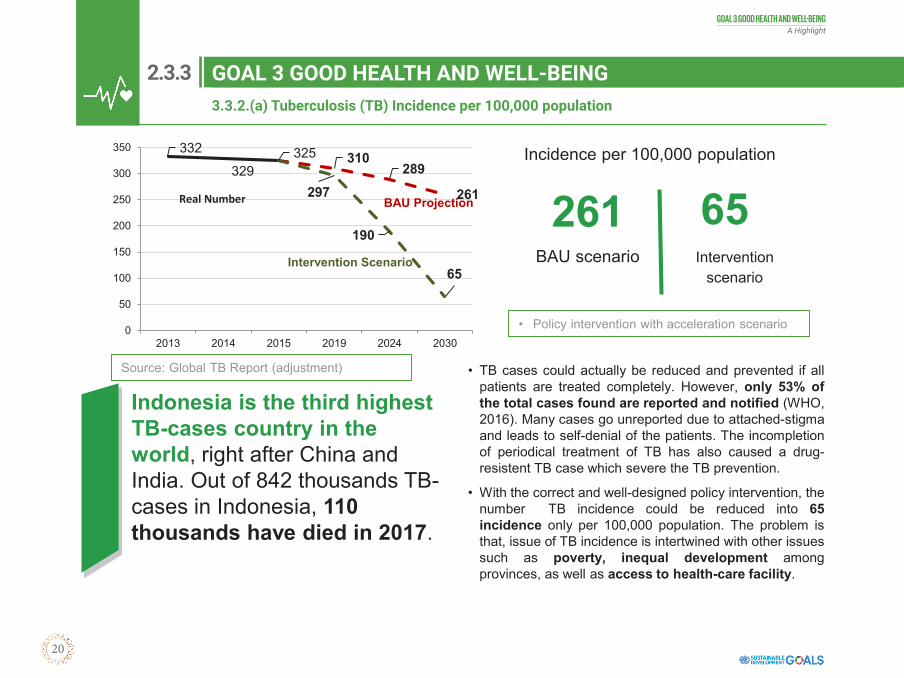
3.3.2.(a) Tuberculosis (TB) Incidence per 100,000 population
332
329325 310
289
261297
190
65
0
50
100
150
200
250
300
350
2013 2014 2015 2019 2024 2030
• TB cases could actually be reduced and prevented if allpatients are treated completely. However, only 53% ofthe total cases found are reported and notified (WHO,2016). Many cases go unreported due to attached-stigmaand leads to self-denial of the patients. The incompletionof periodical treatment of TB has also caused a drug-resistent TB case which severe the TB prevention.
• With the correct and well-designed policy intervention, thenumber TB incidence could be reduced into 65incidence only per 100,000 population. The problem isthat, issue of TB incidence is intertwined with other issuessuch as poverty, inequal development amongprovinces, as well as access to health-care facility.
261BAU scenario
65Real Number BAU Projection
Intervention Scenario
GOAL 3 GOOD HEALTH AND WELLBEING
Intervention scenario
Incidence per 100,000 population
• Policy intervention with acceleration scenario
Indonesia is the third highest TB-cases country in the world, right after China and India. Out of 842 thousands TB-cases in Indonesia, 110 thousands have died in 2017.
Source: Global TB Report (adjustment)
3.3.2.(a) Tuberculosis (TB) Incidence per 100,000 population
2.3.3. Tuberculosis (TB) Incidence per 100,000 population (3.3.2.(a))
GOAL 3 GOOD HEALTH AND WELL-BEING2.3.3
GOAL
3
Roadmap of SDGs Indonesia 21
7,91
9,53 12,05
15,95
9,1 8,7 7,5
0
2
4
6
8
10
12
14
16
18
2015 2019 2024 2030
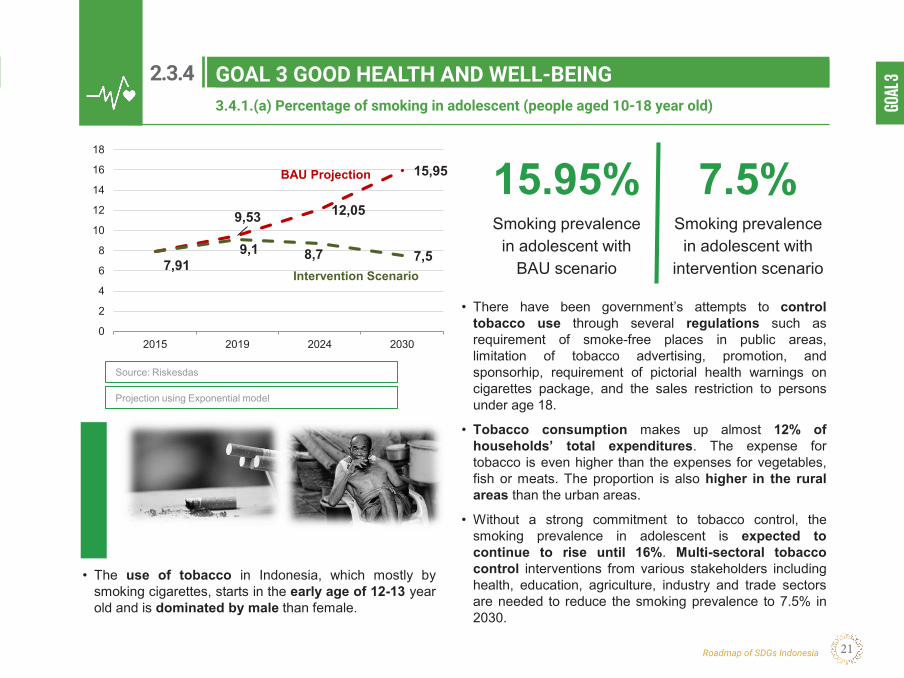
3.4.1.(a) Percentage of smoking in adolescent (people aged 10-18 year old)
15.95%Smoking prevalence
in adolescent with BAU scenario
7.5%Smoking prevalence
in adolescent with intervention scenario
• There have been government’s attempts to controltobacco use through several regulations such asrequirement of smoke-free places in public areas,limitation of tobacco advertising, promotion, andsponsorhip, requirement of pictorial health warnings oncigarettes package, and the sales restriction to personsunder age 18.
• Tobacco consumption makes up almost 12% ofhouseholds’ total expenditures. The expense fortobacco is even higher than the expenses for vegetables,fish or meats. The proportion is also higher in the ruralareas than the urban areas.
• Without a strong commitment to tobacco control, thesmoking prevalence in adolescent is expected tocontinue to rise until 16%. Multi-sectoral tobaccocontrol interventions from various stakeholders includinghealth, education, agriculture, industry and trade sectorsare needed to reduce the smoking prevalence to 7.5% in2030.
BAU Projection
Intervention Scenario
GOAL 3 GOOD HEALTH AND WELLBEING
• The use of tobacco in Indonesia, which mostly bysmoking cigarettes, starts in the early age of 12-13 yearold and is dominated by male than female.
Source: Riskesdas
Projection using Exponential model
3.4.1.(a) Percentage of smoking in adolescent (people aged 10-18 year old)
2.3.4. Percentage of smoking in adolescent (people aged 10-18 year old) (3.4.1.(a))
GOAL 3 GOOD HEALTH AND WELL-BEING2.3.4
GOAL 3 GOOD HEALTH AND WELL-BEINGA Highlight
22
10,514,8
22,8331,86
47,54
17,48
21,8 21,8
0
5
10
15
20
25
30
35
40
45
50
2007 2013 2015 2019 2024 2030
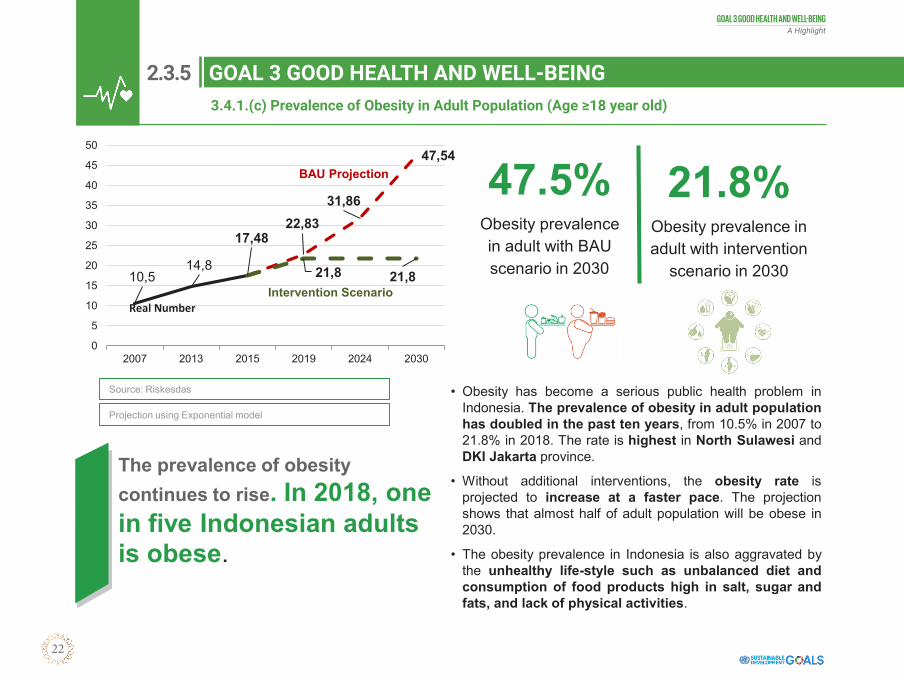
3.4.1.(c) Prevalence of Obesity in Adult Population (Age ≥18 year old)
47.5%Obesity prevalence in adult with BAU scenario in 2030
21.8%Obesity prevalence in adult with intervention
scenario in 2030
• Obesity has become a serious public health problem inIndonesia. The prevalence of obesity in adult populationhas doubled in the past ten years, from 10.5% in 2007 to21.8% in 2018. The rate is highest in North Sulawesi andDKI Jakarta province.
• Without additional interventions, the obesity rate isprojected to increase at a faster pace. The projectionshows that almost half of adult population will be obese in2030.
• The obesity prevalence in Indonesia is also aggravated bythe unhealthy life-style such as unbalanced diet andconsumption of food products high in salt, sugar andfats, and lack of physical activities.
Real Number
BAU Projection
Intervention Scenario
GOAL 3 GOOD HEALTH AND WELLBEING
The prevalence of obesity continues to rise. In 2018, one in five Indonesian adults is obese.
Source: Riskesdas
Projection using Exponential model
3.4.1.(c) Prevalence of Obesity in Adult Population (Age ≥18 year old)
2.3.5. Prevalence of Obesity in Adult Population (Age ≥18 year old) (3.4.1.(c))
GOAL 3 GOOD HEALTH AND WELL-BEING2.3.5
GOAL
3
Roadmap of SDGs Indonesia 23
2,56 2,52 2,472,42
2,37 2,28 2,16 2,1
0
0,5
1
1,5
2
2,5
3
2015 2019 2024 2030
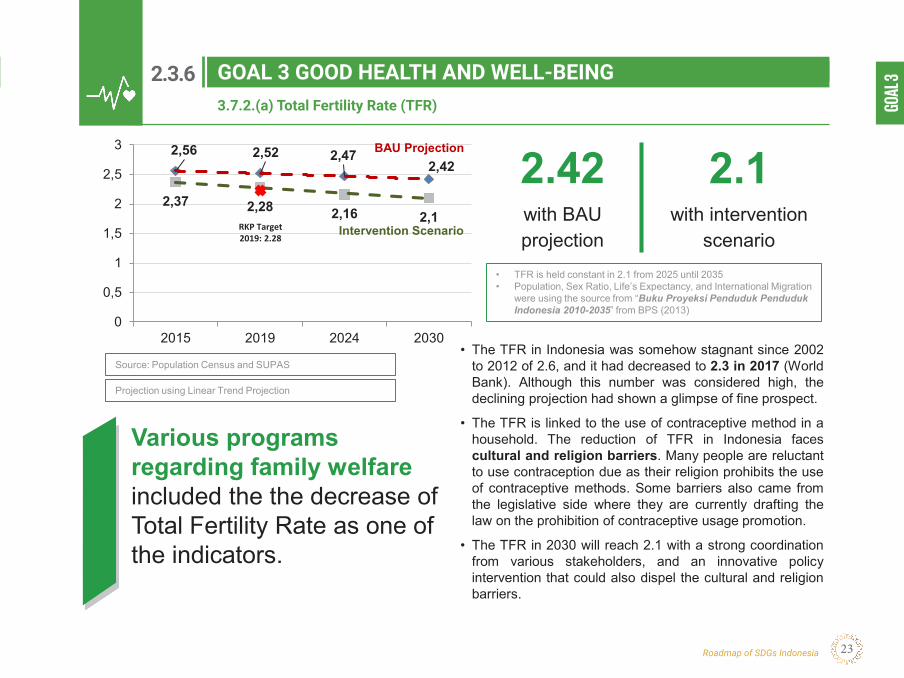
3.7.2.(a) Total Fertility Rate (TFR)
RKP Target2019: 2.28
2.42with BAU projection
2.1with intervention
scenario
• The TFR in Indonesia was somehow stagnant since 2002to 2012 of 2.6, and it had decreased to 2.3 in 2017 (WorldBank). Although this number was considered high, thedeclining projection had shown a glimpse of fine prospect.
• The TFR is linked to the use of contraceptive method in ahousehold. The reduction of TFR in Indonesia facescultural and religion barriers. Many people are reluctantto use contraception due as their religion prohibits the useof contraceptive methods. Some barriers also came fromthe legislative side where they are currently drafting thelaw on the prohibition of contraceptive usage promotion.
• The TFR in 2030 will reach 2.1 with a strong coordinationfrom various stakeholders, and an innovative policyintervention that could also dispel the cultural and religionbarriers.
BAU Projection
Intervention Scenario
GOAL 3 GOOD HEALTH AND WELLBEING
Various programs regarding family welfare included the the decrease of Total Fertility Rate as one of the indicators.
Source: Population Census and SUPAS
Projection using Linear Trend Projection
• TFR is held constant in 2.1 from 2025 until 2035• Population, Sex Ratio, Life’s Expectancy, and International Migration
were using the source from “Buku Proyeksi Penduduk Penduduk Indonesia 2010-2035” from BPS (2013)
3.7.2.(a) Total Fertility Rate (TFR)
2.3.6. Total Fertility Rate (TFR) (3.7.2.(a))
GOAL 3 GOOD HEALTH AND WELL-BEING2.3.6
GOAL 3 GOOD HEALTH AND WELL-BEINGA Highlight
24
3.8.2.(a) Coverage of National Health Insurance
61,3877,85
88,7797,54
61,38
95 98 100
0
20
40
60
80
100
120
2015 2019 2024 2030
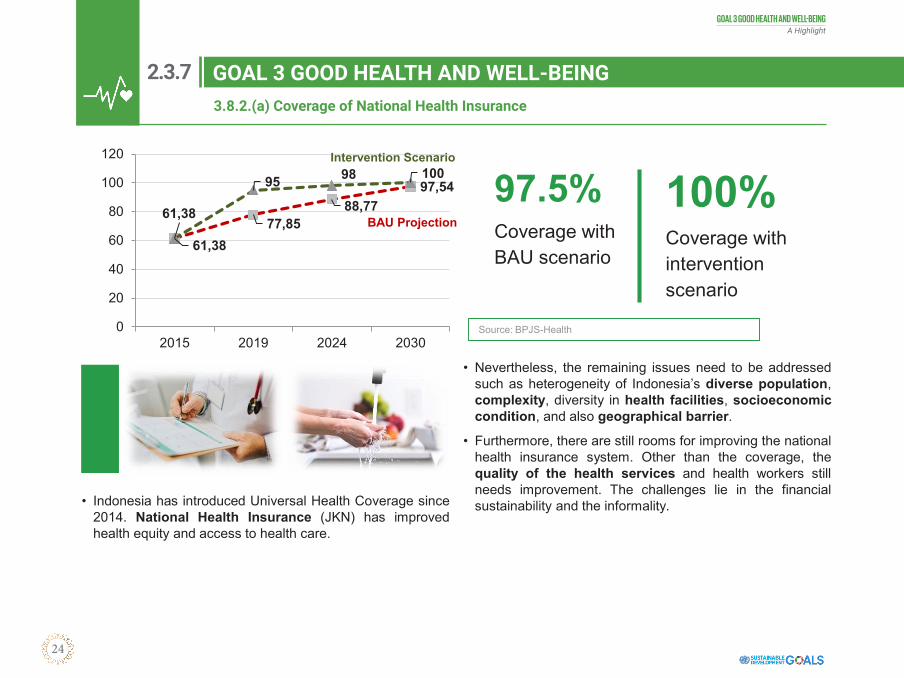
97.5%Coverage with BAU scenario
100%Coverage with intervention scenario
• Nevertheless, the remaining issues need to be addressedsuch as heterogeneity of Indonesia’s diverse population,complexity, diversity in health facilities, socioeconomiccondition, and also geographical barrier.
• Furthermore, there are still rooms for improving the nationalhealth insurance system. Other than the coverage, thequality of the health services and health workers stillneeds improvement. The challenges lie in the financialsustainability and the informality.
BAU Projection
Intervention Scenario
GOAL 3 GOOD HEALTH AND WELLBEING
• Indonesia has introduced Universal Health Coverage since2014. National Health Insurance (JKN) has improvedhealth equity and access to health care.
Source: BPJS-Health
3.8.2.(a) Coverage of National Health Insurance
2.3.7. Coverage of National Health Insurance (3.8.2.(a))
GOAL 3 GOOD HEALTH AND WELL-BEING2.3.7
GOAL
3
Roadmap of SDGs Indonesia 25
Stra
tegi
es
Polic
y Dire
ctio
n20
20-2
024
Improving maternal and child health, family planning, and reproductive health
• Improving continuum of care for maternal, newborn,and child health in public and private health facilities
• Expanding complete basic immunization coverage• Improving nutritional status of adolescent girls and
pregnant women• Improving access and quality of family planning and
reproductive health services• Strengthening community-based maternal and child
health services (e.g. Posyandu, Polindes,Poskesdes)
• improving the availability and competency of healthworkers
Polic
y Dire
ctio
n20
25-2
030
Stra
tegi
es
• Improving a thorough health-care services includinghealth promotion, disease prevention, diagnosis,disease handling, disease management,rehabilitation, and palliative services.
• Increasing production of medicines and medicaldevices in the country to improve access for qualitypharmacy and medical devices products.
Strengthening Community Movement of Healthy Living
• Creating healthy settings and environment (e.g. healthy cities, markets, schools, and workplaces)
• Providing public open space and mass transportation networks to promote physical activity
• Promoting health-in-all policies and regulations to apply higher tobacco tax and total ban on tobacco advertising and promotion, as well as restrict food products high in salt, sugar, and fats
• Promoting innovative healthy life behaviour change strategies• Increasing access to healthy food choices
Enhancing access and health services quality in all regions
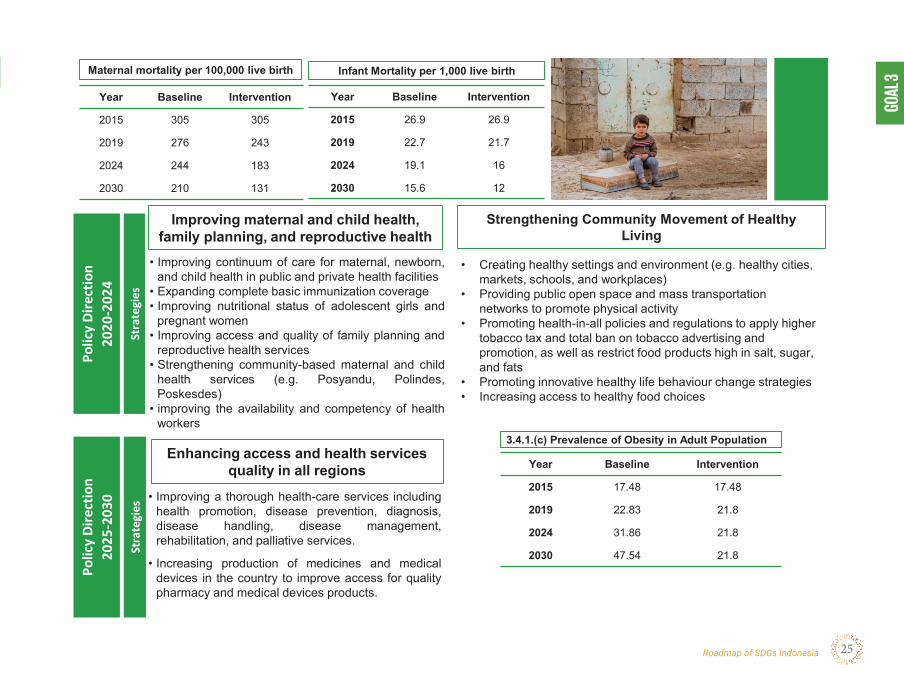
Year Baseline Intervention
2015 305 305
2019 276 243
2024 244 183
2030 210 131
Maternal mortality per 100,000 live birth
Year Baseline Intervention
2015 17.48 17.48
2019 22.83 21.8
2024 31.86 21.8
2030 47.54 21.8
3.4.1.(c) Prevalence of Obesity in Adult Population
Year Baseline Intervention
2015 26.9 26.9
2019 22.7 21.7
2024 19.1 16
2030 15.6 12
Infant Mortality per 1,000 live birth
GOAL 3 GOOD HEALTH AND WELL-BEINGA Highlight
26
Stra
tegi
es
Polic
y Dire
ctio
n20
20-2
024
Enhancing health-care services and foods and drugs control
enhancing basic health services and references, health-care workers’ competences, improving pharmacies’competitiveness and medical devices, increasing thecontrol of foods and drugs’ effectivity, and also enhancingthe health’s management and financing.
the adjustment of tariffs and premium for a sustainablefinancing, increasing participation particularly of the informalworkers, implementing active purchasing and the explicitformulation of JKN’s benefits, and also strengthening theinstitution and monitoring and evaluation system for JKN
Strengthening the Implementation of National Health Insurance
Polic
y Dire
ctio
n20
25-2
030
Stra
tegi
es • Capability of adapting advanced technology of healthservices.
• Establishment of diseases’ prevention and control.• Mainstreaming of health-based development.• Strengthening the national health insurance supported
by the increasing capacity of health-care services in allregions.
Strengthening the Implementation of National Health Insurance
controlling disease risk factors with a focus on expansionof early detection and real time surveillance, strengtheninghealth security including strengthening alert system forextraordinary event and health quarantines, andstrenghtening disease management
Improving disease control
Year Baseline Intervention
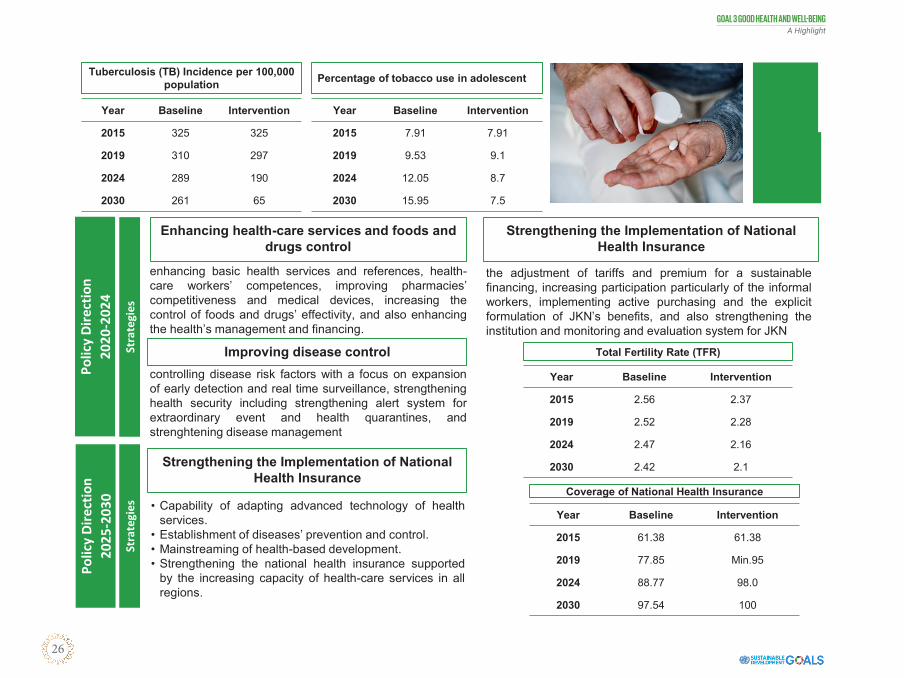
2015 325 325
2019 310 297
2024 289 190
2030 261 65
Tuberculosis (TB) Incidence per 100,000 population
Year Baseline Intervention
2015 7.91 7.91
2019 9.53 9.1
2024 12.05 8.7
2030 15.95 7.5
Percentage of tobacco use in adolescent
Year Baseline Intervention
2015 2.56 2.37
2019 2.52 2.28
2024 2.47 2.16
2030 2.42 2.1
Total Fertility Rate (TFR)
Year Baseline Intervention
2015 61.38 61.38
2019 77.85 Min.95
2024 88.77 98.0
2030 97.54 100
Coverage of National Health Insurance
GOAL
4
Roadmap of SDGs Indonesia 27
GOAL 4 QUALITY EDUCATION
2 . 4 . G O A L 4 Q U A L I T Y E D U C AT I O N
2 .4
G OA L 4Q UA L I T Y E D U C AT I O N
GOAL 4 QUALITY EDUCATIONA Highlight
28
GOAL 4 QUALITY EDUCATION
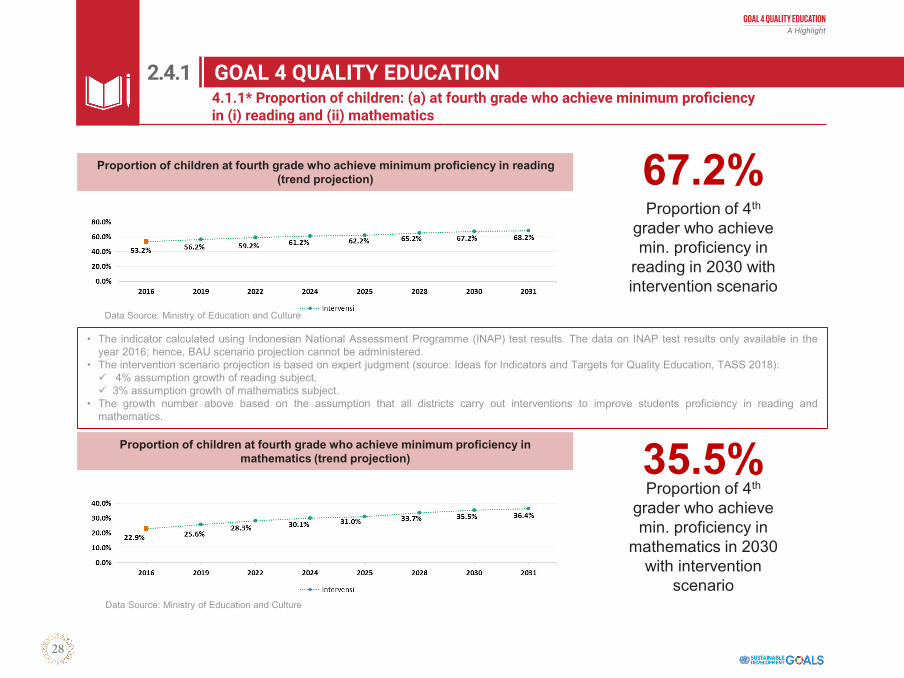
• The indicator calculated using Indonesian National Assessment Programme (INAP) test results. The data on INAP test results only available in theyear 2016; hence, BAU scenario projection cannot be administered.
• The intervention scenario projection is based on expert judgment (source: Ideas for Indicators and Targets for Quality Education, TASS 2018):✓ 4% assumption growth of reading subject.✓ 3% assumption growth of mathematics subject.
• The growth number above based on the assumption that all districts carry out interventions to improve students proficiency in reading andmathematics.
GOAL 4 QUALITY EDUCATION4.1.1* Proportion of children: (a) at fourth grade who achieve minimum proficiency in (i) reading and (ii) mathematics
67.2%Proportion of 4th
grader who achieve min. proficiency in
reading in 2030 with intervention scenario
Proportion of children at fourth grade who achieve minimum proficiency in reading (trend projection)
Data Source: Ministry of Education and Culture
Data Source: Ministry of Education and Culture
Proportion of children at fourth grade who achieve minimum proficiency in mathematics (trend projection) 35.5%
Proportion of 4th
grader who achieve min. proficiency in
mathematics in 2030 with intervention
scenario
4.1.1* Proportion of children: (a) at fourth grade who achieve minimum proficiencyin (i) reading and (ii) mathematics
2.4.1. Proportion of children: (a) at fourth grade who achieve minimum proficiency in (i) reading and (ii) mathematics (4.1.1*)
2.4.1
GOAL
4
Roadmap of SDGs Indonesia 29
GOAL 4 QUALITY EDUCATION
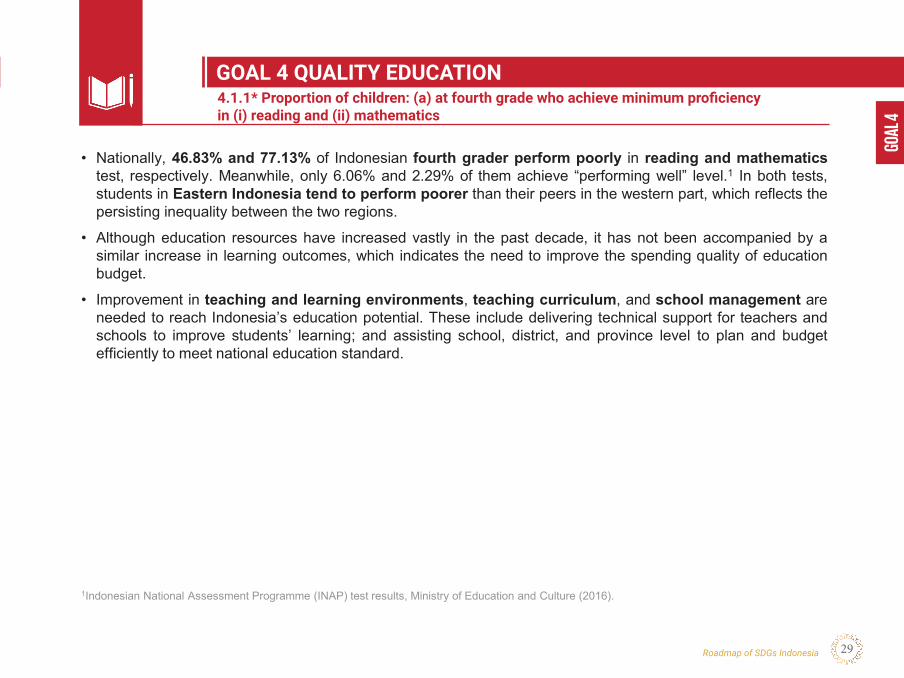
• Nationally, 46.83% and 77.13% of Indonesian fourth grader perform poorly in reading and mathematicstest, respectively. Meanwhile, only 6.06% and 2.29% of them achieve “performing well” level.1 In both tests,students in Eastern Indonesia tend to perform poorer than their peers in the western part, which reflects thepersisting inequality between the two regions.
• Although education resources have increased vastly in the past decade, it has not been accompanied by asimilar increase in learning outcomes, which indicates the need to improve the spending quality of educationbudget.
• Improvement in teaching and learning environments, teaching curriculum, and school management areneeded to reach Indonesia’s education potential. These include delivering technical support for teachers andschools to improve students’ learning; and assisting school, district, and province level to plan and budgetefficiently to meet national education standard.
1Indonesian National Assessment Programme (INAP) test results, Ministry of Education and Culture (2016).
GOAL 4 QUALITY EDUCATION4.1.1* Proportion of children: (a) at fourth grade who achieve minimum proficiency in (i) reading and (ii) mathematics
4.1.1* Proportion of children: (a) at fourth grade who achieve minimum proficiencyin (i) reading and (ii) mathematics
GOAL 4 QUALITY EDUCATIONA Highlight
30
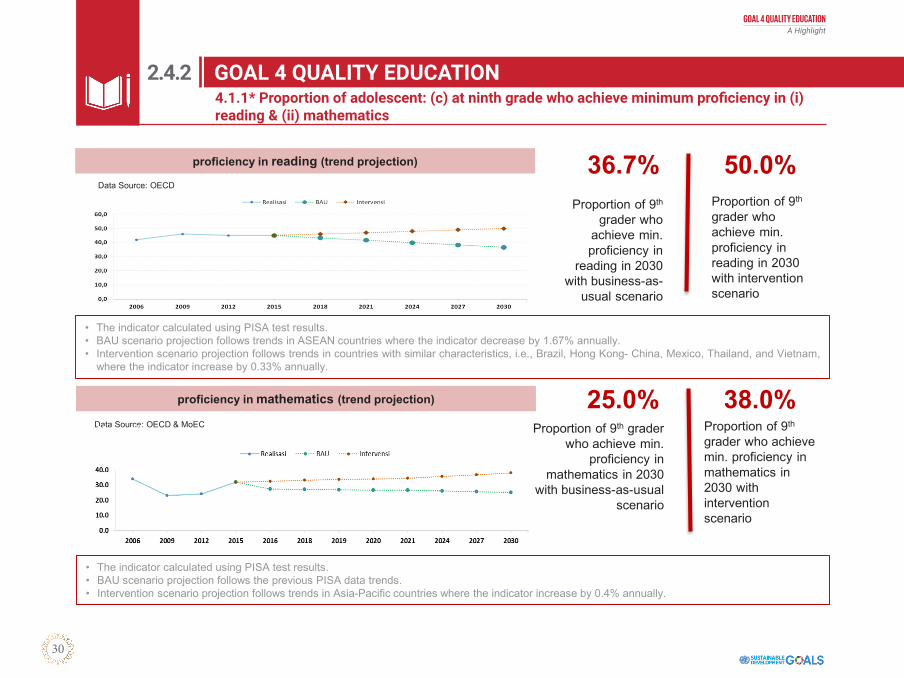
GOAL 4 QUALITY EDUCATION4.1.1* Proportion of adolescent: (c) at ninth grade who achieve minimum proficiency in (i) reading & (ii) mathematics
36.7% 50.0%Proportion of 9th
grader who achieve min. proficiency in
reading in 2030 with business-as-
usual scenario
Proportion of 9th
grader who achieve min. proficiency in reading in 2030 with intervention scenario
• The indicator calculated using PISA test results.• BAU scenario projection follows trends in ASEAN countries where the indicator decrease by 1.67% annually.• Intervention scenario projection follows trends in countries with similar characteristics, i.e., Brazil, Hong Kong- China, Mexico, Thailand, and Vietnam,
where the indicator increase by 0.33% annually.
proficiency in reading (trend projection)
• The indicator calculated using PISA test results.• BAU scenario projection follows the previous PISA data trends.• Intervention scenario projection follows trends in Asia-Pacific countries where the indicator increase by 0.4% annually.
Data Source: OECD & MoEC
proficiency in mathematics (trend projection) 25.0% 38.0%Proportion of 9th grader
who achieve min. proficiency in
mathematics in 2030 with business-as-usual
scenario
Proportion of 9th
grader who achieve min. proficiency in mathematics in 2030 with intervention scenario
GOAL 4 QUALITY EDUCATION
Data Source: OECD
4.1.1* Proportion of adolescent: (c) at ninth grade who achieve minimum proficiency in (i)reading & (ii) mathematics
2.4.2. Proportion of adolescent: (c) at ninth grade who achieve minimum proficiency in (i) reading & (ii) mathematics (4.1.1*)
2.4.2
GOAL
4
Roadmap of SDGs Indonesia 31
GOAL 4 QUALITY EDUCATION
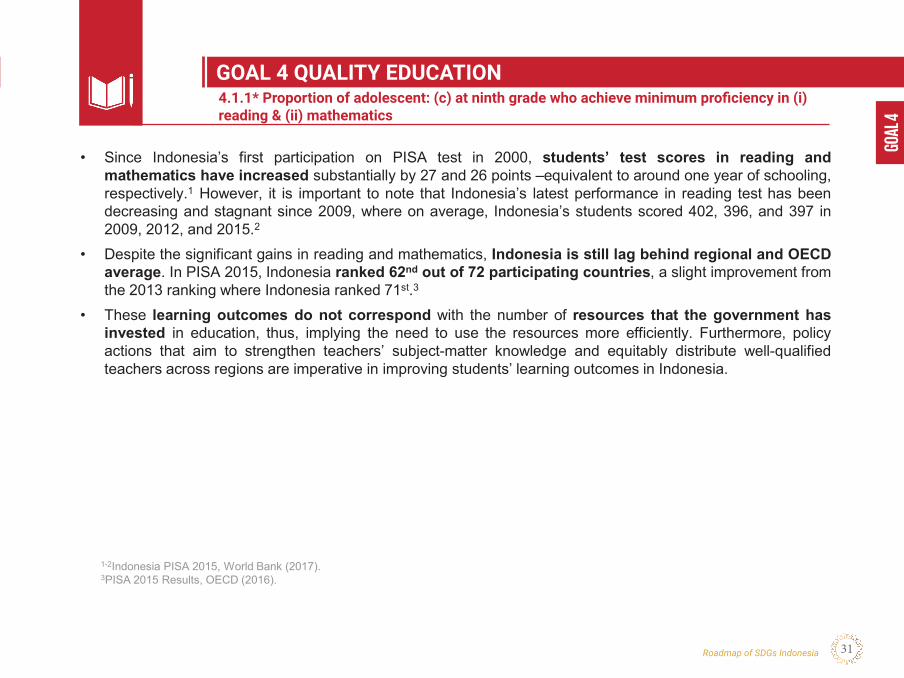
• Since Indonesia’s first participation on PISA test in 2000, students’ test scores in reading andmathematics have increased substantially by 27 and 26 points –equivalent to around one year of schooling,respectively.1 However, it is important to note that Indonesia’s latest performance in reading test has beendecreasing and stagnant since 2009, where on average, Indonesia’s students scored 402, 396, and 397 in2009, 2012, and 2015.2
• Despite the significant gains in reading and mathematics, Indonesia is still lag behind regional and OECDaverage. In PISA 2015, Indonesia ranked 62nd out of 72 participating countries, a slight improvement fromthe 2013 ranking where Indonesia ranked 71st.3
• These learning outcomes do not correspond with the number of resources that the government hasinvested in education, thus, implying the need to use the resources more efficiently. Furthermore, policyactions that aim to strengthen teachers’ subject-matter knowledge and equitably distribute well-qualifiedteachers across regions are imperative in improving students’ learning outcomes in Indonesia.
1-2Indonesia PISA 2015, World Bank (2017).3PISA 2015 Results, OECD (2016).
4.1.1* Proportion of adolescent: (c) at ninth grade who achieve minimum proficiency in (i) reading & (ii) mathematics
GOAL 4 QUALITY EDUCATION4.1.1* Proportion of adolescent: (c) at ninth grade who achieve minimum proficiency in (i)reading & (ii) mathematics
GOAL 4 QUALITY EDUCATIONA Highlight
32
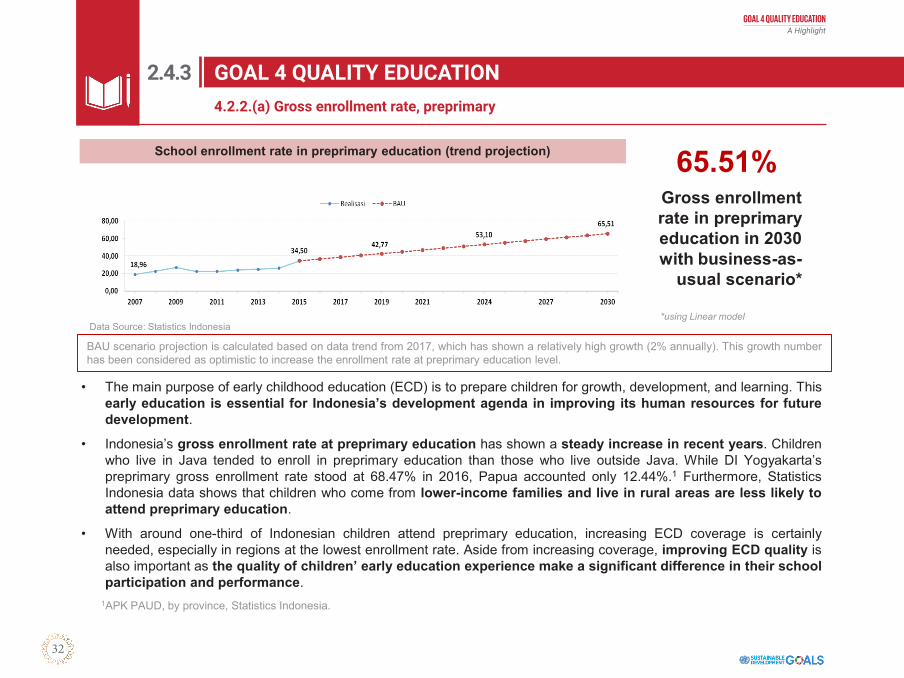
GOAL 4 QUALITY EDUCATIONGOAL 4 Quality Education4.2.2a Gross enrollment rate, preprimary
65.51%Gross enrollment rate in preprimary education in 2030 with business-as-
usual scenario*
School enrollment rate in preprimary education (trend projection)
BAU scenario projection is calculated based on data trend from 2017, which has shown a relatively high growth (2% annually). This growth numberhas been considered as optimistic to increase the enrollment rate at preprimary education level.
Data Source: Statistics Indonesia*using Linear model
• The main purpose of early childhood education (ECD) is to prepare children for growth, development, and learning. Thisearly education is essential for Indonesia’s development agenda in improving its human resources for futuredevelopment.
• Indonesia’s gross enrollment rate at preprimary education has shown a steady increase in recent years. Childrenwho live in Java tended to enroll in preprimary education than those who live outside Java. While DI Yogyakarta’spreprimary gross enrollment rate stood at 68.47% in 2016, Papua accounted only 12.44%.1 Furthermore, StatisticsIndonesia data shows that children who come from lower-income families and live in rural areas are less likely toattend preprimary education.
• With around one-third of Indonesian children attend preprimary education, increasing ECD coverage is certainlyneeded, especially in regions at the lowest enrollment rate. Aside from increasing coverage, improving ECD quality isalso important as the quality of children’ early education experience make a significant difference in their schoolparticipation and performance.
1APK PAUD, by province, Statistics Indonesia.
4.2.2.(a) Gross enrollment rate, preprimary
2.4.3. Gross enrollment rate, preprimary (4.2.2.(a))
2.4.3
GOAL
4
Roadmap of SDGs Indonesia 33
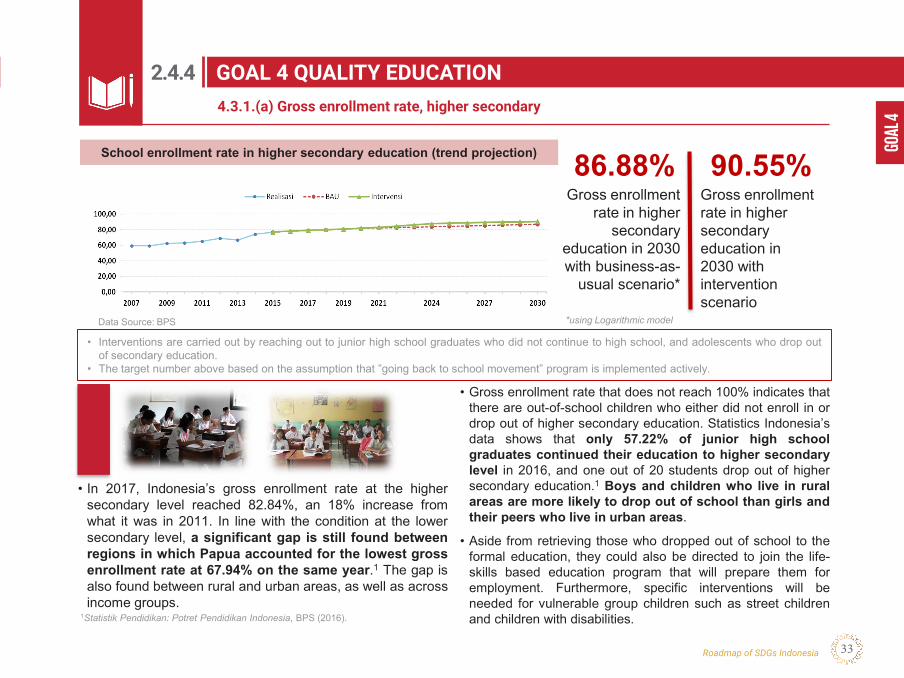
GOAL 4 QUALITY EDUCATIONGOAL 4 Quality Education4.3.1a Gross enrollment rate, higher secondary
86.88% 90.55%Gross enrollment
rate in higher secondary
education in 2030 with business-as-
usual scenario*
Gross enrollment rate in higher secondary education in 2030 with intervention scenario
• Interventions are carried out by reaching out to junior high school graduates who did not continue to high school, and adolescents who drop outof secondary education.
• The target number above based on the assumption that ”going back to school movement” program is implemented actively.
Data Source: BPS
• Gross enrollment rate that does not reach 100% indicates thatthere are out-of-school children who either did not enroll in ordrop out of higher secondary education. Statistics Indonesia’sdata shows that only 57.22% of junior high schoolgraduates continued their education to higher secondarylevel in 2016, and one out of 20 students drop out of highersecondary education.1 Boys and children who live in ruralareas are more likely to drop out of school than girls andtheir peers who live in urban areas.
• Aside from retrieving those who dropped out of school to theformal education, they could also be directed to join the life-skills based education program that will prepare them foremployment. Furthermore, specific interventions will beneeded for vulnerable group children such as street childrenand children with disabilities.1Statistik Pendidikan: Potret Pendidikan Indonesia, BPS (2016).
*using Logarithmic model
• In 2017, Indonesia’s gross enrollment rate at the highersecondary level reached 82.84%, an 18% increase fromwhat it was in 2011. In line with the condition at the lowersecondary level, a significant gap is still found betweenregions in which Papua accounted for the lowest grossenrollment rate at 67.94% on the same year.1 The gap isalso found between rural and urban areas, as well as acrossincome groups.
School enrollment rate in higher secondary education (trend projection)
4.3.1.(a) Gross enrollment rate, higher secondary
2.4.4. Gross enrollment rate, higher secondary (4.3.1.(a))
2.4.4
GOAL 4 QUALITY EDUCATIONA Highlight
34
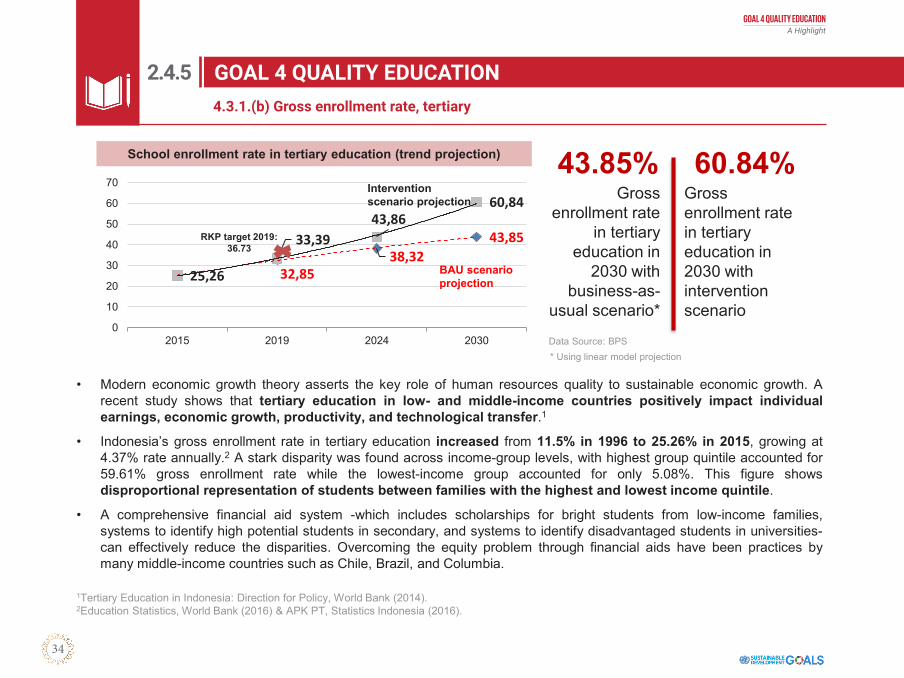
GOAL 4 QUALITY EDUCATIONGOAL 4 Quality Education4.3.1b Gross enrollment rate, tertiary
43.85% 60.84%Gross
enrollment rate in tertiary
education in 2030 with
business-as-usual scenario*
Gross enrollment rate in tertiary education in 2030 with intervention scenario
School enrollment rate in tertiary education (trend projection)
32,8538,32
43,85
25,26
33,3943,86
60,84
0
10
20
30
40
50
60
70
2015 2019 2024 2030
RKP target 2019: 36.73
BAU scenario projection
Intervention scenario projection
* Using linear model projectionData Source: BPS
• Modern economic growth theory asserts the key role of human resources quality to sustainable economic growth. Arecent study shows that tertiary education in low- and middle-income countries positively impact individualearnings, economic growth, productivity, and technological transfer.1
• Indonesia’s gross enrollment rate in tertiary education increased from 11.5% in 1996 to 25.26% in 2015, growing at4.37% rate annually.2 A stark disparity was found across income-group levels, with highest group quintile accounted for59.61% gross enrollment rate while the lowest-income group accounted for only 5.08%. This figure showsdisproportional representation of students between families with the highest and lowest income quintile.
• A comprehensive financial aid system -which includes scholarships for bright students from low-income families,systems to identify high potential students in secondary, and systems to identify disadvantaged students in universities-can effectively reduce the disparities. Overcoming the equity problem through financial aids have been practices bymany middle-income countries such as Chile, Brazil, and Columbia.
1Tertiary Education in Indonesia: Direction for Policy, World Bank (2014).2Education Statistics, World Bank (2016) & APK PT, Statistics Indonesia (2016).
4.3.1.(b) Gross enrollment rate, tertiary
2.4.5. Gross enrollment rate, tertiary (4.3.1.(b))
2.4.5
GOAL
4
Roadmap of SDGs Indonesia 35
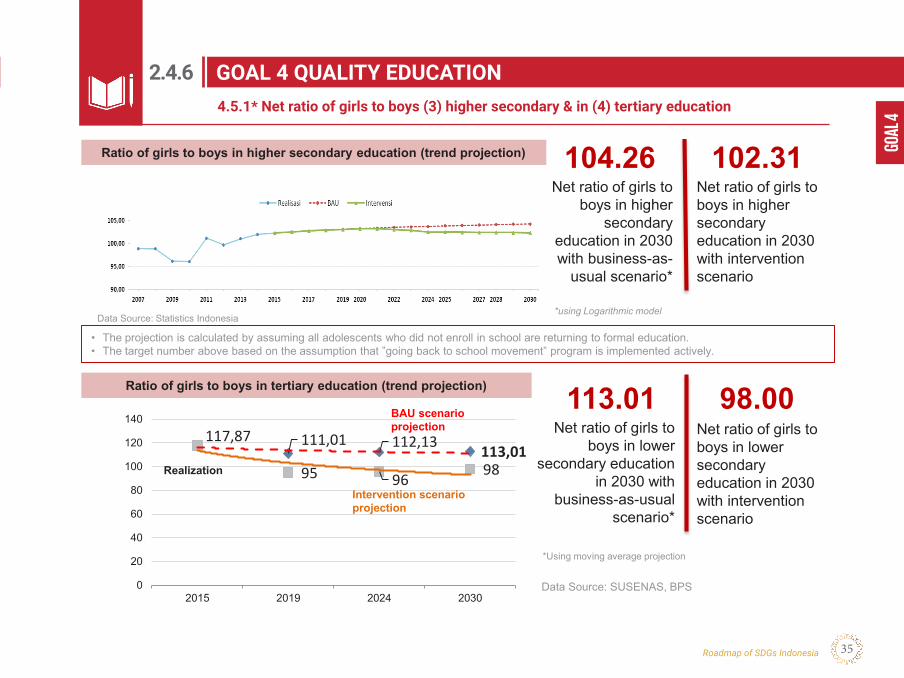
GOAL 4 QUALITY EDUCATIONGOAL 4 Quality Education4.5.1* Net ratio of girls to boys (3) higher secondary & in (4) tertiary education
104.26 102.31Net ratio of girls to
boys in higher secondary
education in 2030 with business-as-
usual scenario*
Net ratio of girls to boys in higher secondary education in 2030 with intervention scenario
113.01 98.00Net ratio of girls to
boys in lower secondary education
in 2030 with business-as-usual
scenario*
Net ratio of girls to boys in lower secondary education in 2030 with intervention scenario
Ratio of girls to boys in higher secondary education (trend projection)
*using Logarithmic modelData Source: Statistics Indonesia
• The projection is calculated by assuming all adolescents who did not enroll in school are returning to formal education.• The target number above based on the assumption that ”going back to school movement” program is implemented actively.
Ratio of girls to boys in tertiary education (trend projection)
*Using moving average projection
117,87 111,01 112,13 113,0195 96 98
0
20
40
60
80
100
120
140
2015 2019 2024 2030
BAU scenarioprojection
Intervention scenario projection
Realization
Data Source: SUSENAS, BPS
4.5.1* Net ratio of girls to boys (3) higher secondary & in (4) tertiary education
2.4.6. Net ratio of girls to boys (3) higher secondary & in (4) tertiary education (4.5.1*)
2.4.6
GOAL 4 QUALITY EDUCATIONA Highlight
36
GOAL 4 QUALITY EDUCATIONGOAL 4 Quality Education4.5.1* Net ratio of girls to boys in (1) primary, (2) lower secondary, (3) higher secondary, and (4) tertiary education
• Indonesia’s net ratio of girls to boys in almost all education levels –except primary education, shows higherparticipation of girls than boys. This figure supported by Ministry of Education and Culture data that showsa higher number of drop-outs in boys where the number of male students who dropped out from the lowerand higher secondary education nearly thrice and twice of female drop-outs.1
• Although the data at national level shows a higher prevalence of male dropouts, it is important to observe thepattern at the regional level. At the higher secondary level, the following provinces exhibit a high gap of girlsto boys net ratio: West Sumatera (124.15), West Nusa Tenggara (86.18), and Gorontalo (143.63). A moreglaring disparity was found at tertiary education where nearly one-third of provinces in Indonesia record netratio of girls to boys at the range of 120-160.2
• In order to achieve the target of net ratio of girls to boys at nearly 100, the action that will be taken should notbe a one-size-fits-all policy. The approach should be locally oriented that derived from observations thattake into account dropouts issues across gender and socio-economic condition.
1Ministry of Education and Culture, 2018.2Statistics Indonesia, 2016.
2.4.7. 4.5.1* Net ratio of girls to boys in (3) higher secondary, and (4) tertiary education
4.5.1* Net ratio of girls to boys in (3) higher secondary, and (4) tertiary education
2.4.7

GOAL
4
Roadmap of SDGs Indonesia 37
GOAL 4 QUALITY EDUCATION
Stra
tegi
es
Polic
y Dire
ctio
n20
20-2
024
Accelerate the implementation of 12 years compulsory education program
• proper education assistance for children at learning ageswho come from underprivileged households,
• equal distribution of quality education services betweenregions,
• helping school-aged children who are not in school toreturn to school through the revitalization of the retrievalprogram.
• applying curriculum that provides teaching reinforcementfocusing on mathematics, literacy, and science at all levels,and strengthening education in characters, religion, andcitizenship;
• reinforcing the implementation of student learningassessments through strengthening the role of teachers forlearning assessments in the classroom, as well as utilizingthe learning assessment results to improve the learningquality
Polic
y Dire
ctio
n20
25-2
030
Stra
tegi
es
• proper education assistance for children at learning ageswho come from underprivileged households,
• equal distribution of quality education services betweenregions,
• helping school-aged children who are not in school toreturn to school through the revitalization of the retrievalprogram.
Improve the quality of teaching and learning so that students gain basic skills, the ability to think critically, have personal
values and character to become productive citizens
• applying curriculum that provides teaching reinforcementfocusing on mathematics, literacy, and science at all levels,and strengthening education in characters, religion, andcitizenship
• reinforcing the implementation of student learningassessments through strengthening the role of teachers forlearning assessments in the classroom, as well as utilizingthe learning assessment results to improve the learningquality.
Accelerate the implementation of 12 years compulsory education program
Improve the quality of teaching and learning so that students gain basic skills, the ability to think critically, have personal
values and character to become productive citizens
Reading Mathematics
Year Intervention Intervention
2016 53.2 22.9
2019 56.2 25.6
2024 61.2 30.1
2030 67.2 35.5
4.1.1* Proportion of children at (a) fourth grade who achieve minimum proficiency

GOAL 4 QUALITY EDUCATIONA Highlight
38
GOAL 4 QUALITY EDUCATION
Stra
tegi
es
Polic
y Dire
ctio
n20
20-2
024
Improve the quality of vocational education as well as employment skills education & training
• development of vocational education models that are inline with regional development and driven bypartnerships with the local business/industry,
• improving the quality of entrepreneurship education &training and employment skills
• increasing the number of certification for vocationalgraduates
• LPTK revitalization,
• structuring the mechanism of new teachers’ appointmentand placement,
• equalize teachers distribution within positions, betweeneducation units, and between regions;
• strengthening the function of heads of education units andschool/madrasah supervisors in conducting the qualityassurance of education services.
Polic
y Dire
ctio
n20
25-2
030
Stra
tegi
es
• development of vocational education models that arein line with regional development and driven bypartnerships with the local business/industry,
• improving the quality of entrepreneurship education &training and employment skills
• increasing the number of certification for vocationalgraduates
Improve the management quality of teachers and educational staff
• between education units, and between regions;
• strengthening the function of heads of education units andschool/madrasah supervisors in conducting the qualityassurance of education services.
Improve the quality of vocational education as well as employment skills education & training
Improve the management quality of teachers and educational staff
Reading Mathematics
Year Baseline Intervention Baseline Intervention
2015 45.0 45.0 32.0 32.0
2019 42.8 46.1 26.8 33.6
2024 40.0 48.0 26.0 35.6
2030 36.7 50.0 25.0 38.0
4.1.1* Proportion of adolescent: (c) at ninth grade who achieve minimum proficiency
GOAL
4
Roadmap of SDGs Indonesia 39
GOAL 4 QUALITY EDUCATION
Stra
tegi
es
Polic
y Dire
ctio
n20
20-2
024
Improving the access and quality of early childhood education services
• raising the local governments’ commitment to carry outearly childhood education
• quality improvement of early childhood educationinstitutions
• raising the local governments’ commitment to carry outearly childhood education
• quality improvement of early childhood educationinstitutions
Polic
y Dire
ctio
n20
25-2
030
Stra
tegi
es
Improve the quality of educational equity
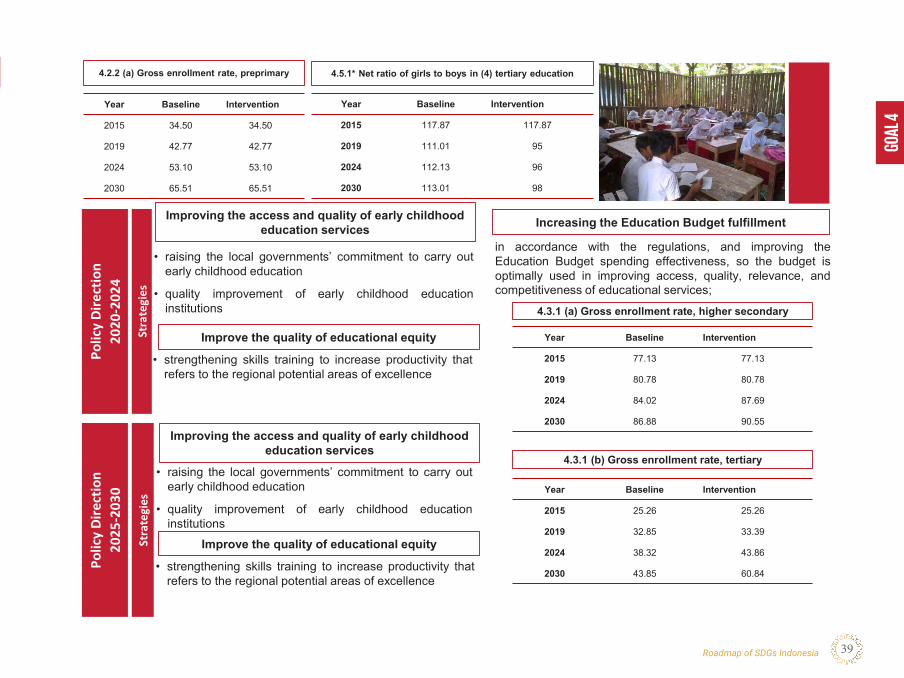
Increasing the Education Budget fulfillment
in accordance with the regulations, and improving theEducation Budget spending effectiveness, so the budget isoptimally used in improving access, quality, relevance, andcompetitiveness of educational services;
Improving the access and quality of early childhood education services
• strengthening skills training to increase productivity thatrefers to the regional potential areas of excellence
Improve the quality of educational equity
• strengthening skills training to increase productivity thatrefers to the regional potential areas of excellence
Year Baseline Intervention
2015 34.50 34.50
2019 42.77 42.77
2024 53.10 53.10
2030 65.51 65.51
4.2.2 (a) Gross enrollment rate, preprimary
Year Baseline Intervention
2015 117.87 117.87
2019 111.01 95
2024 112.13 96
2030 113.01 98
4.5.1* Net ratio of girls to boys in (4) tertiary education
Year Baseline Intervention
2015 77.13 77.13
2019 80.78 80.78
2024 84.02 87.69
2030 86.88 90.55
4.3.1 (a) Gross enrollment rate, higher secondary
Year Baseline Intervention
2015 25.26 25.26
2019 32.85 33.39
2024 38.32 43.86
2030 43.85 60.84
4.3.1 (b) Gross enrollment rate, tertiary
GOAL 4 QUALITY EDUCATIONA Highlight
40
GOAL 4 QUALITY EDUCATION
Stra
tegi
es
Polic
y Dire
ctio
n20
20-2
024
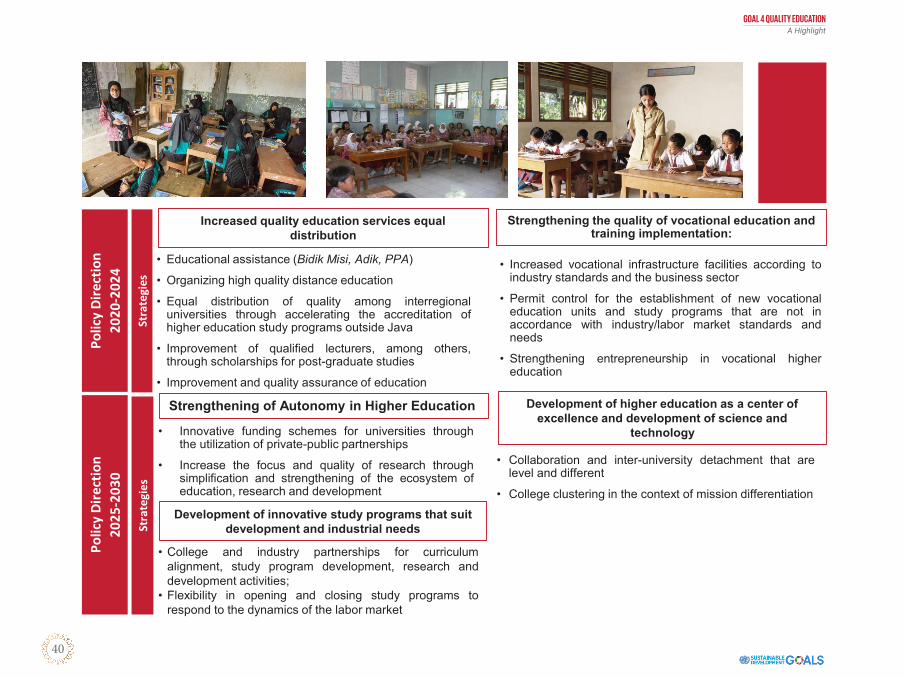
Increased quality education services equal distribution
• Educational assistance (Bidik Misi, Adik, PPA)
• Organizing high quality distance education
• Equal distribution of quality among interregionaluniversities through accelerating the accreditation ofhigher education study programs outside Java
• Improvement of qualified lecturers, among others,through scholarships for post-graduate studies
• Improvement and quality assurance of education
• College and industry partnerships for curriculumalignment, study program development, research anddevelopment activities;
• Flexibility in opening and closing study programs torespond to the dynamics of the labor market
Polic
y Di
rect
ion
2025
-203
0
Stra
tegi
es
Strengthening the quality of vocational education and training implementation:
• Increased vocational infrastructure facilities according toindustry standards and the business sector
• Permit control for the establishment of new vocationaleducation units and study programs that are not inaccordance with industry/labor market standards andneeds
• Strengthening entrepreneurship in vocational highereducation
Development of innovative study programs that suit development and industrial needs
Development of higher education as a center of excellence and development of science and
technology
• Collaboration and inter-university detachment that arelevel and different
• College clustering in the context of mission differentiation
Strengthening of Autonomy in Higher Education
• Innovative funding schemes for universities throughthe utilization of private-public partnerships
• Increase the focus and quality of research throughsimplification and strengthening of the ecosystem ofeducation, research and development
GOAL
4
Roadmap of SDGs Indonesia 41
GOAL 4 QUALITY EDUCATION
Stra
tegi
es
Polic
y Dire
ctio
n20
20-2
024
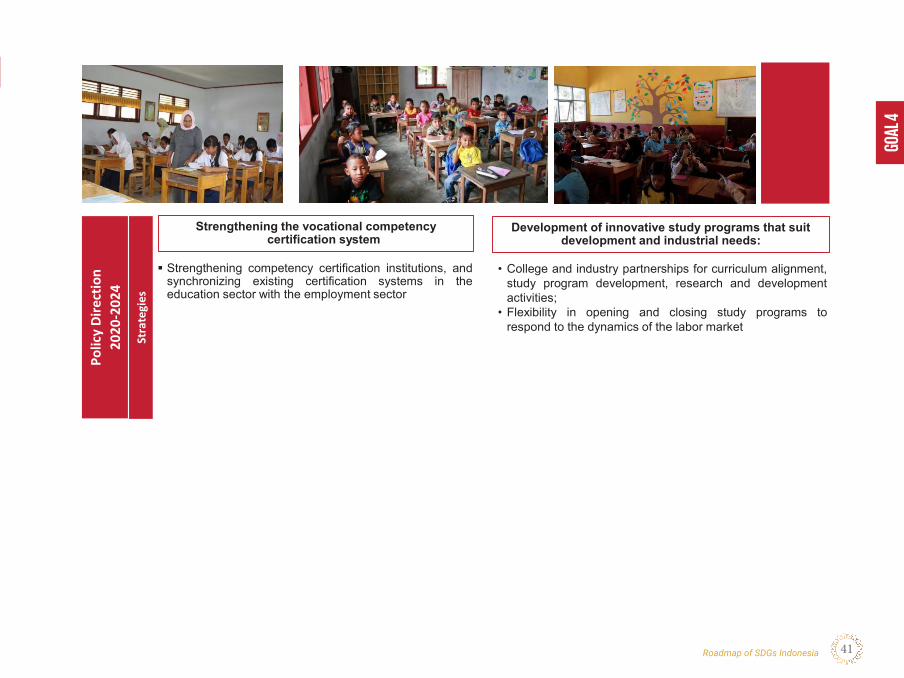
Strengthening the vocational competency certification system
▪ Strengthening competency certification institutions, andsynchronizing existing certification systems in theeducation sector with the employment sector
Development of innovative study programs that suit development and industrial needs:
• College and industry partnerships for curriculum alignment,study program development, research and developmentactivities;
• Flexibility in opening and closing study programs torespond to the dynamics of the labor market

GOAL 4 QUALITY EDUCATIONA Highlight
GOAL 4 QUALITY EDUCATION
GOAL
5
Roadmap of SDGs Indonesia 43
GOAL 5 GENDER EQUALITY
2 . 5 . G O A L 5 G E N D E R E Q U A L I T Y
2 .5
G OA L 5G E N D E R E Q UA L I T Y
GOAL 5 GENDER EQUALITYA Highlight
44
GOAL 5 GENDER EQUALITY
13,5812,14 11,28 10,59 10,03
10,598,74
6,94
02468
10121416
2013
2014
2015
2016
2017
2018
2019
2020
2021
2022
2023
2024
2025
2026
2027
2028
2029
2030
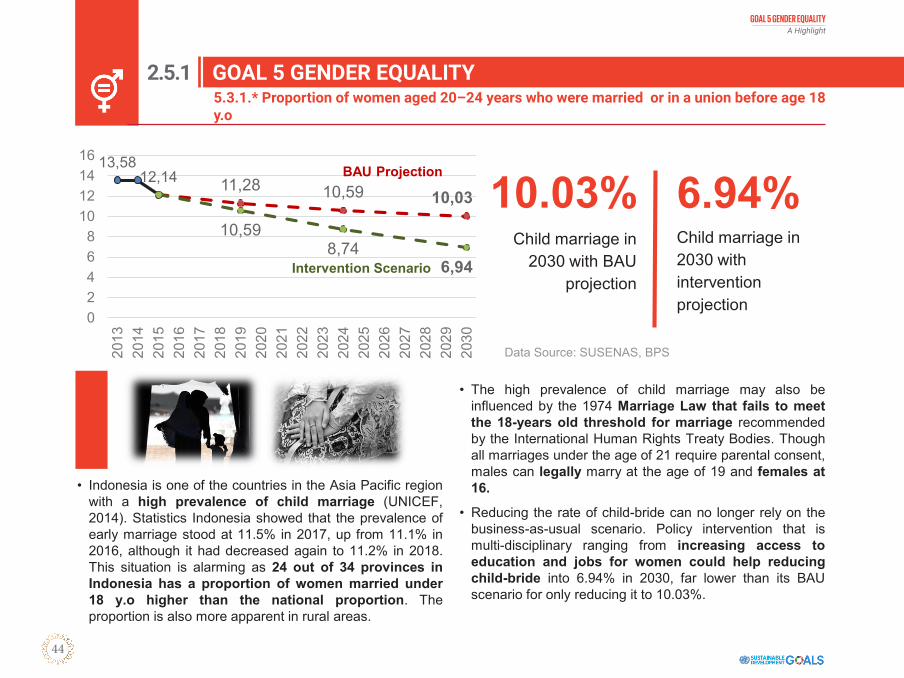
5.3.1.* Proportion of women aged 20–24 years who were married or in a union before age 18 y.o
BAU Projection
Intervention Scenario
10.03% 6.94%Child marriage in 2030 with intervention projection
• The high prevalence of child marriage may also beinfluenced by the 1974 Marriage Law that fails to meetthe 18-years old threshold for marriage recommendedby the International Human Rights Treaty Bodies. Thoughall marriages under the age of 21 require parental consent,males can legally marry at the age of 19 and females at16.
• Reducing the rate of child-bride can no longer rely on thebusiness-as-usual scenario. Policy intervention that ismulti-disciplinary ranging from increasing access toeducation and jobs for women could help reducingchild-bride into 6.94% in 2030, far lower than its BAUscenario for only reducing it to 10.03%.
GOAL 5 GENDER EQUALITY
• Indonesia is one of the countries in the Asia Pacific regionwith a high prevalence of child marriage (UNICEF,2014). Statistics Indonesia showed that the prevalence ofearly marriage stood at 11.5% in 2017, up from 11.1% in2016, although it had decreased again to 11.2% in 2018.This situation is alarming as 24 out of 34 provinces inIndonesia has a proportion of women married under18 y.o higher than the national proportion. Theproportion is also more apparent in rural areas.
Data Source: SUSENAS, BPS
Child marriage in 2030 with BAU
projection
2.5.1. Proportion of women aged 20–24 years who were married or in a union before age 18 y.o (5.3.1.*)
5.3.1.* Proportion of women aged 20–24 years who were married or in a union before age 18 y.o
2.5.1
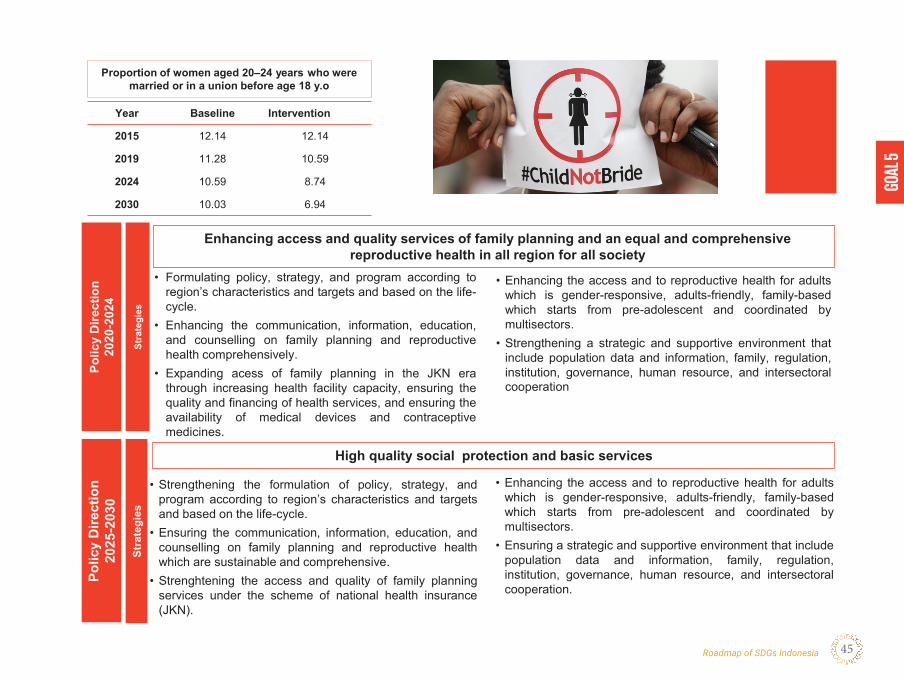
GOAL
5
Roadmap of SDGs Indonesia 45
GOAL 5 GENDER EQUALITYPo
licy
Dire
ctio
n 20
20-2
024
Stra
tegi
es
• Formulating policy, strategy, and program according toregion’s characteristics and targets and based on the life-cycle.
• Enhancing the communication, information, education,and counselling on family planning and reproductivehealth comprehensively.
• Expanding acess of family planning in the JKN erathrough increasing health facility capacity, ensuring thequality and financing of health services, and ensuring theavailability of medical devices and contraceptivemedicines.
Enhancing access and quality services of family planning and an equal and comprehensive reproductive health in all region for all society
Polic
y D
irect
ion
2025
-203
0
Stra
tegi
es
• Strengthening the formulation of policy, strategy, andprogram according to region’s characteristics and targetsand based on the life-cycle.
• Ensuring the communication, information, education, andcounselling on family planning and reproductive healthwhich are sustainable and comprehensive.
• Strenghtening the access and quality of family planningservices under the scheme of national health insurance(JKN).
High quality social protection and basic services
• Enhancing the access and to reproductive health for adultswhich is gender-responsive, adults-friendly, family-basedwhich starts from pre-adolescent and coordinated bymultisectors.
• Strengthening a strategic and supportive environment thatinclude population data and information, family, regulation,institution, governance, human resource, and intersectoralcooperation
• Enhancing the access and to reproductive health for adultswhich is gender-responsive, adults-friendly, family-basedwhich starts from pre-adolescent and coordinated bymultisectors.
• Ensuring a strategic and supportive environment that includepopulation data and information, family, regulation,institution, governance, human resource, and intersectoralcooperation.
Year Baseline Intervention
2015 12.14 12.14
2019 11.28 10.59
2024 10.59 8.74
2030 10.03 6.94
Proportion of women aged 20–24 years who were married or in a union before age 18 y.o
GOAL 5 GENDER EQUALITYA Highlight
GOAL 5 GENDER EQUALITY
GOAL
6
Roadmap of SDGs Indonesia 47
GOAL 6 CLEAN WATER AND SANITATION
2 . 6 . G O A L 6 C L E A N WAT E R A N D S A N I TAT I O N
2 .6
G OA L 6C L E A N WAT E R A N D S A N I TAT I O N
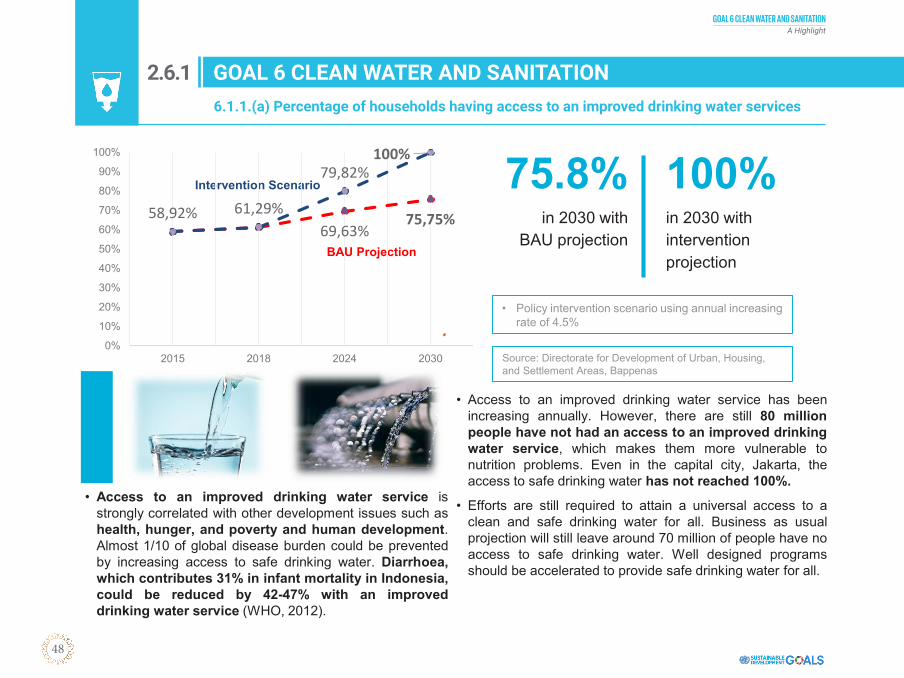
GOAL 6 CLEAN WATER AND SANITATIONA Highlight
48
GOAL 6 CLEAN WATER AND SANITATION
6.1.1.(a) Percentage of households having access to an improved drinking water services
BAU Projection
Intervention Scenario 75.8%in 2030 with
BAU projection
100%in 2030 with intervention projection
• Access to an improved drinking water service has beenincreasing annually. However, there are still 80 millionpeople have not had an access to an improved drinkingwater service, which makes them more vulnerable tonutrition problems. Even in the capital city, Jakarta, theaccess to safe drinking water has not reached 100%.
• Efforts are still required to attain a universal access to aclean and safe drinking water for all. Business as usualprojection will still leave around 70 million of people have noaccess to safe drinking water. Well designed programsshould be accelerated to provide safe drinking water for all.
69,63%75,75%58,92% 61,29%
79,82%100%
0%
10%
20%
30%
40%
50%
60%
70%
80%
90%
100%
2015 2018 2024 2030
• Policy intervention scenario using annual increasing rate of 4.5%
Source: Directorate for Development of Urban, Housing, and Settlement Areas, Bappenas
GOAL 6 CLEAN WATER AND SANITATION
• Access to an improved drinking water service isstrongly correlated with other development issues such ashealth, hunger, and poverty and human development.Almost 1/10 of global disease burden could be preventedby increasing access to safe drinking water. Diarrhoea,which contributes 31% in infant mortality in Indonesia,could be reduced by 42-47% with an improveddrinking water service (WHO, 2012).
2.6.1. Percentage of households having access to an improved drinking water services (6.1.1.(a))
6.1.1.(a) Percentage of households having access to an improved drinking water services
2.6.1

GOAL
6
Roadmap of SDGs Indonesia 49
GOAL 6 CLEAN WATER AND SANITATIONPo
licy
Dire
ctio
n 20
20-2
024
Stra
tegi
es
• Enhancing good governance for the provision of safedrinking water provision for all people
• Conserving raw water resources, optimalizing theutilization of raw water resources (such as dam), andefficient utilization of technology
• Enhancing operator’s capacity in the provision of safedrinking water
• Developing and managing the safe drinking water systemfor society
75% Access to Improved Drinking Water Service
Polic
y D
irect
ion
2025
-203
0
Stra
tegi
es
• Enhancing good governance for the provision of safedrinking water provision for all people
• Enhancing operator’s capacity in the provision of safedrinking water
• Accelerating the infrastructure development for safedrinking water system for society
• Conserving raw water resources, optimalizing theutilization of raw water resources (such as dam), andefficient utilization of technology
100% Access to Improved Drinking Water Service
• Change in community behavior to support the waterresources’ conservation and the provision of safe drinkingwater
• Change in community behavior to support the waterresources’ conservation and the provision of safe drinkingwater
Year Baseline Intervention
2015 58.92 58.92
2019 64.53 64.05
2024 69.63 79.82
2030 75.75 100
Percentage of households having access to safe drinking water
Financal Support for Improved Drinking Water Service Development around 24.5 million SR until 2024
Financal Support for Improved Drinking Water Service Development around 35.52 million SR 2030
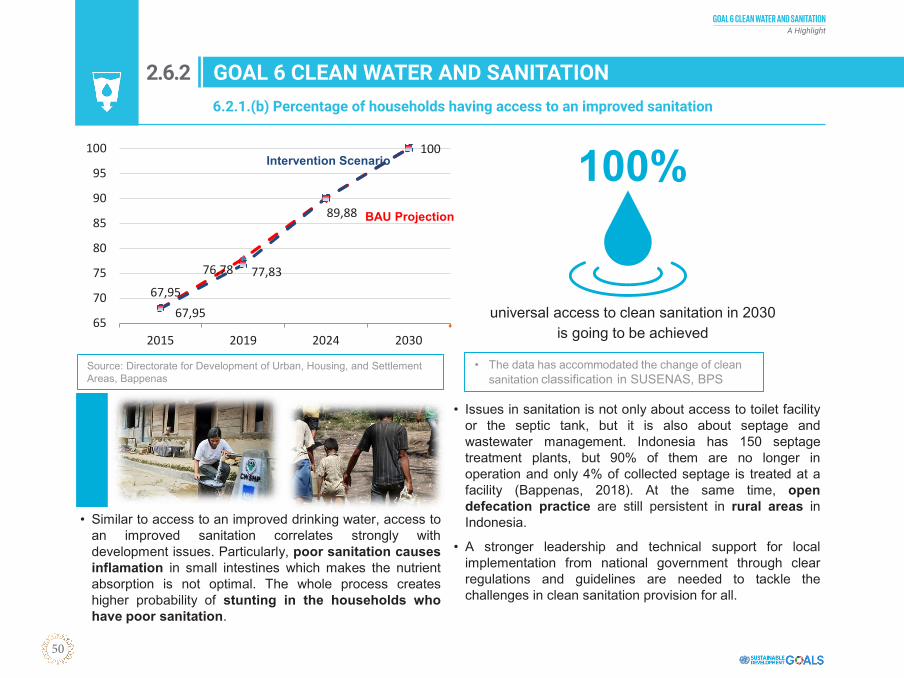
GOAL 6 CLEAN WATER AND SANITATIONA Highlight
50
GOAL 6 CLEAN WATER AND SANITATION
67,95
77,83
89,88
100
67,95
76,78
65
70
75
80
85
90
95
100
2015 2019 2024 2030
BAU Projection
Intervention Scenario
6.2.1.(b) Percentage of households having access to an improved sanitation
• Issues in sanitation is not only about access to toilet facilityor the septic tank, but it is also about septage andwastewater management. Indonesia has 150 septagetreatment plants, but 90% of them are no longer inoperation and only 4% of collected septage is treated at afacility (Bappenas, 2018). At the same time, opendefecation practice are still persistent in rural areas inIndonesia.
• A stronger leadership and technical support for localimplementation from national government through clearregulations and guidelines are needed to tackle thechallenges in clean sanitation provision for all.
• The data has accommodated the change of clean sanitation classification in SUSENAS, BPS
Source: Directorate for Development of Urban, Housing, and Settlement Areas, Bappenas
100%
universal access to clean sanitation in 2030 is going to be achieved
GOAL 6 CLEAN WATER AND SANITATION
• Similar to access to an improved drinking water, access toan improved sanitation correlates strongly withdevelopment issues. Particularly, poor sanitation causesinflamation in small intestines which makes the nutrientabsorption is not optimal. The whole process createshigher probability of stunting in the households whohave poor sanitation.
2.6.2. Percentage of households having access to an improved sanitation (6.2.1.(b))
6.2.1.(b) Percentage of households having access to an improved sanitation
2.6.2
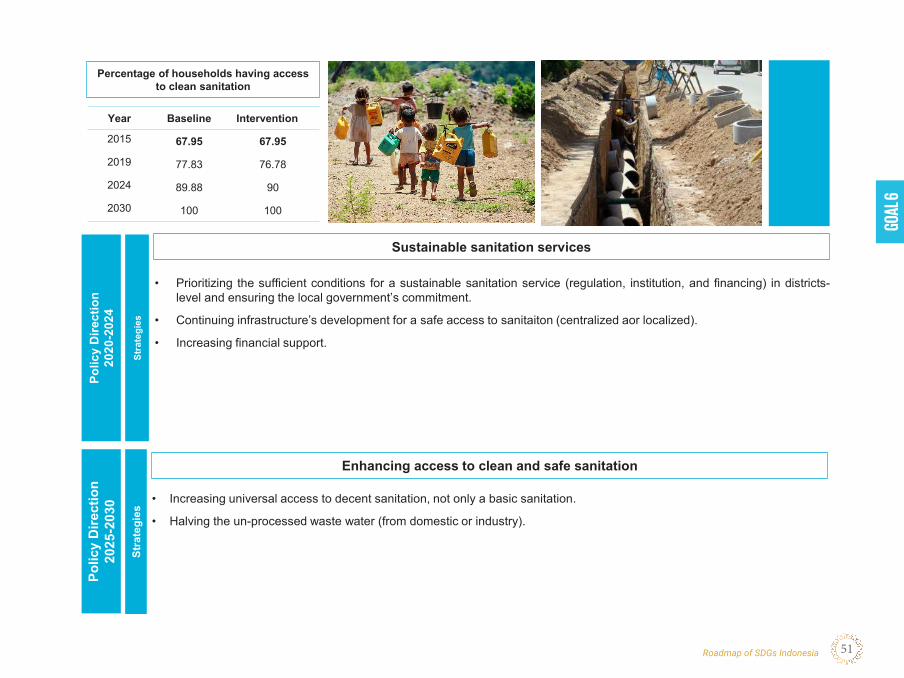
GOAL
6
Roadmap of SDGs Indonesia 51
GOAL 6 CLEAN WATER AND SANITATIONPo
licy
Dire
ctio
n 20
20-2
024
Stra
tegi
es
• Prioritizing the sufficient conditions for a sustainable sanitation service (regulation, institution, and financing) in districts-level and ensuring the local government’s commitment.
• Continuing infrastructure’s development for a safe access to sanitaiton (centralized aor localized).
• Increasing financial support.
Sustainable sanitation services
Polic
y D
irect
ion
2025
-203
0
Stra
tegi
es
• Increasing universal access to decent sanitation, not only a basic sanitation.
• Halving the un-processed waste water (from domestic or industry).
Enhancing access to clean and safe sanitation
Year Baseline Intervention
2015 67.95 67.95
2019 77.83 76.78
2024 89.88 90
2030 100 100
Percentage of households having access to clean sanitation

GOAL 6 CLEAN WATER AND SANITATIONA Highlight
GOAL 6 CLEAN WATER AND SANITATION

GOAL
7
Roadmap of SDGs Indonesia 53
GOAL 7 AFFORDABLE AND CLEAN ENERGY
2 . 7. G O A L 7 A F F O R D A B L E A N D C L E A N E N E R G Y
2 . 7
G OA L 7A F F O R DA B L E A N D C L E A N E N E R GY
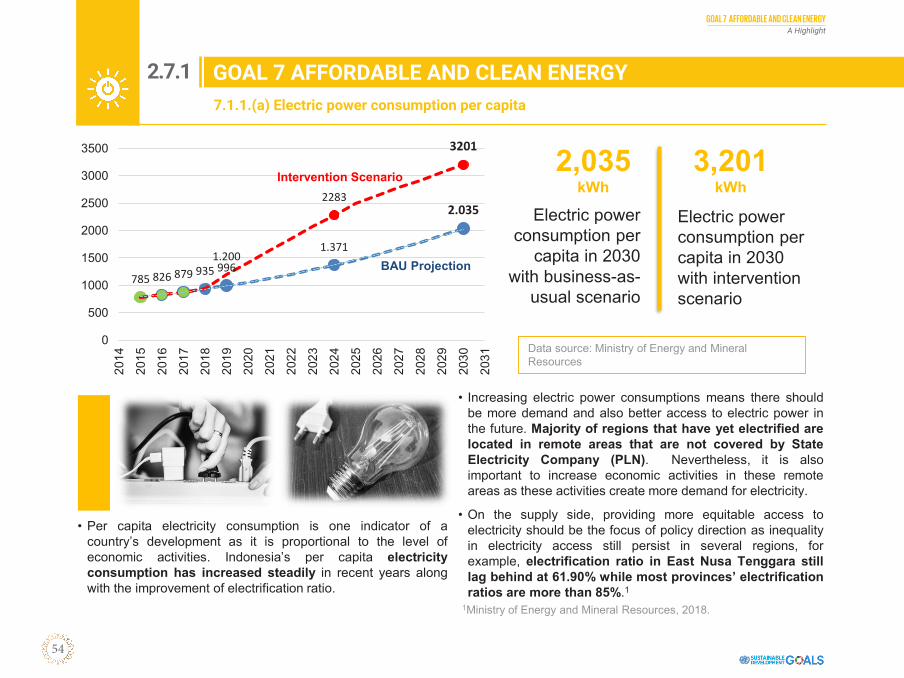
GOAL 7 AFFORDABLE AND CLEAN ENERGYA Highlight
54
GOAL 7 AFFORDABLE AND CLEAN ENERGY
HASIL PROYEKSI INDIKATOR TUJUAN 7 SDGs (1/3)
Data source: Ministry of Energy and Mineral Resources
785996
1.371
2.035
826 879 9351.200
2283
3201
0
500
1000
1500
2000
2500
3000
3500
2014
2015
2016
2017
2018
2019
2020
2021
2022
2023
2024
2025
2026
2027
2028
2029
2030
2031
2,035kWh
3,201kWh
Electric power consumption per
capita in 2030 with business-as-
usual scenario
Electric power consumption per capita in 2030 with intervention scenario
• Increasing electric power consumptions means there shouldbe more demand and also better access to electric power inthe future. Majority of regions that have yet electrified arelocated in remote areas that are not covered by StateElectricity Company (PLN). Nevertheless, it is alsoimportant to increase economic activities in these remoteareas as these activities create more demand for electricity.
• On the supply side, providing more equitable access toelectricity should be the focus of policy direction as inequalityin electricity access still persist in several regions, forexample, electrification ratio in East Nusa Tenggara stilllag behind at 61.90% while most provinces’ electrificationratios are more than 85%.1
1Ministry of Energy and Mineral Resources, 2018.
7.1.1.(a) Electric power consumption per capita
GOAL 7 AFFORDABLE AND CLEAN ENERGY
Intervention Scenario
BAU Projection
• Per capita electricity consumption is one indicator of acountry’s development as it is proportional to the level ofeconomic activities. Indonesia’s per capita electricityconsumption has increased steadily in recent years alongwith the improvement of electrification ratio.
2.7.1. Electric power consumption per capita (7.1.1.(a))
7.1.1.(a) Electric power consumption per capita
2.7.1
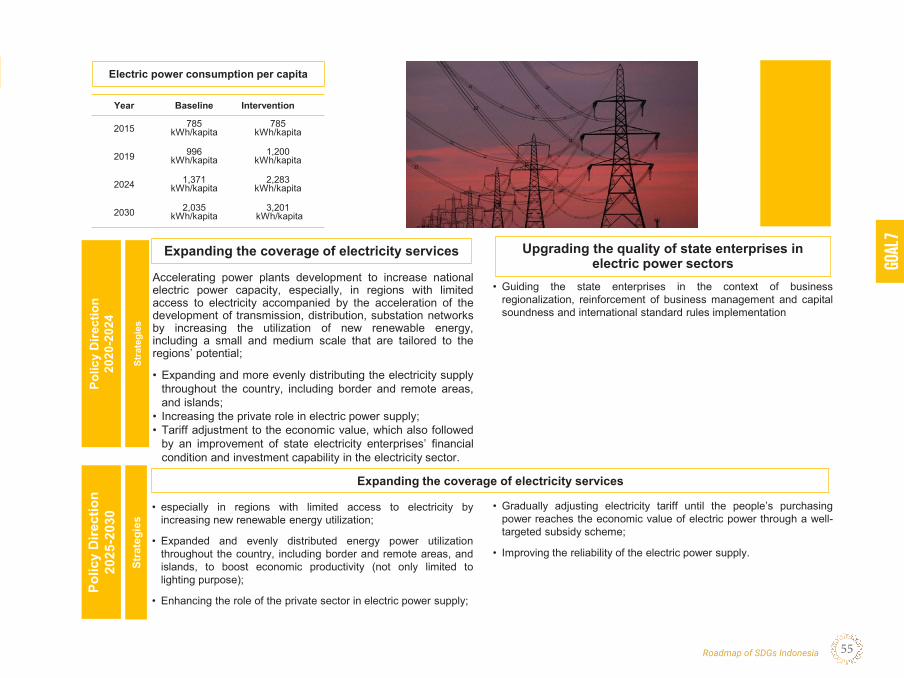
GOAL
7
Roadmap of SDGs Indonesia 55
GOAL 7 AFFORDABLE AND CLEAN ENERGYPo
licy
Dire
ctio
n 20
20-2
024
Stra
tegi
es
Accelerating power plants development to increase nationalelectric power capacity, especially, in regions with limitedaccess to electricity accompanied by the acceleration of thedevelopment of transmission, distribution, substation networksby increasing the utilization of new renewable energy,including a small and medium scale that are tailored to theregions’ potential;
• Expanding and more evenly distributing the electricity supplythroughout the country, including border and remote areas,and islands;
• Increasing the private role in electric power supply;• Tariff adjustment to the economic value, which also followed
by an improvement of state electricity enterprises’ financialcondition and investment capability in the electricity sector.
Upgrading the quality of state enterprises in electric power sectors
Polic
y D
irect
ion
2025
-203
0
Stra
tegi
es
• especially in regions with limited access to electricity byincreasing new renewable energy utilization;
• Expanded and evenly distributed energy power utilizationthroughout the country, including border and remote areas, andislands, to boost economic productivity (not only limited tolighting purpose);
• Enhancing the role of the private sector in electric power supply;
Expanding the coverage of electricity services
• Guiding the state enterprises in the context of businessregionalization, reinforcement of business management and capitalsoundness and international standard rules implementation
Year Baseline Intervention
2015 785kWh/kapita
785 kWh/kapita
2019 996kWh/kapita
1,200 kWh/kapita
2024 1,371 kWh/kapita
2,283 kWh/kapita
2030 2,035 kWh/kapita
3,201kWh/kapita
Electric power consumption per capita
Expanding the coverage of electricity services
• Gradually adjusting electricity tariff until the people’s purchasingpower reaches the economic value of electric power through a well-targeted subsidy scheme;
• Improving the reliability of the electric power supply.
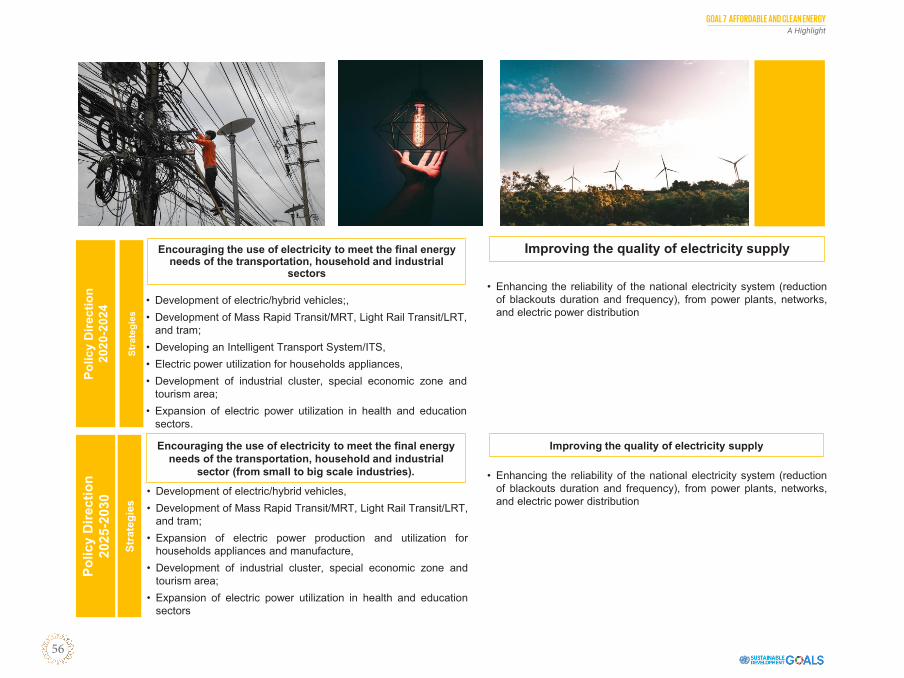
GOAL 7 AFFORDABLE AND CLEAN ENERGYA Highlight
56
GOAL 7 AFFORDABLE AND CLEAN ENERGYPo
licy
Dire
ctio
n 20
20-2
024
Stra
tegi
es
• Development of electric/hybrid vehicles;,• Development of Mass Rapid Transit/MRT, Light Rail Transit/LRT,
and tram;• Developing an Intelligent Transport System/ITS,• Electric power utilization for households appliances,• Development of industrial cluster, special economic zone and
tourism area;• Expansion of electric power utilization in health and education
sectors.
Improving the quality of electricity supply
Polic
y D
irect
ion
2025
-203
0
Stra
tegi
es
• Development of electric/hybrid vehicles,• Development of Mass Rapid Transit/MRT, Light Rail Transit/LRT,
and tram;• Expansion of electric power production and utilization for
households appliances and manufacture,• Development of industrial cluster, special economic zone and
tourism area;• Expansion of electric power utilization in health and education
sectors
Encouraging the use of electricity to meet the final energy needs of the transportation, household and industrial
sector (from small to big scale industries).
• Enhancing the reliability of the national electricity system (reductionof blackouts duration and frequency), from power plants, networks,and electric power distribution
Encouraging the use of electricity to meet the final energy needs of the transportation, household and industrial
sectors
• Enhancing the reliability of the national electricity system (reductionof blackouts duration and frequency), from power plants, networks,and electric power distribution
Improving the quality of electricity supply
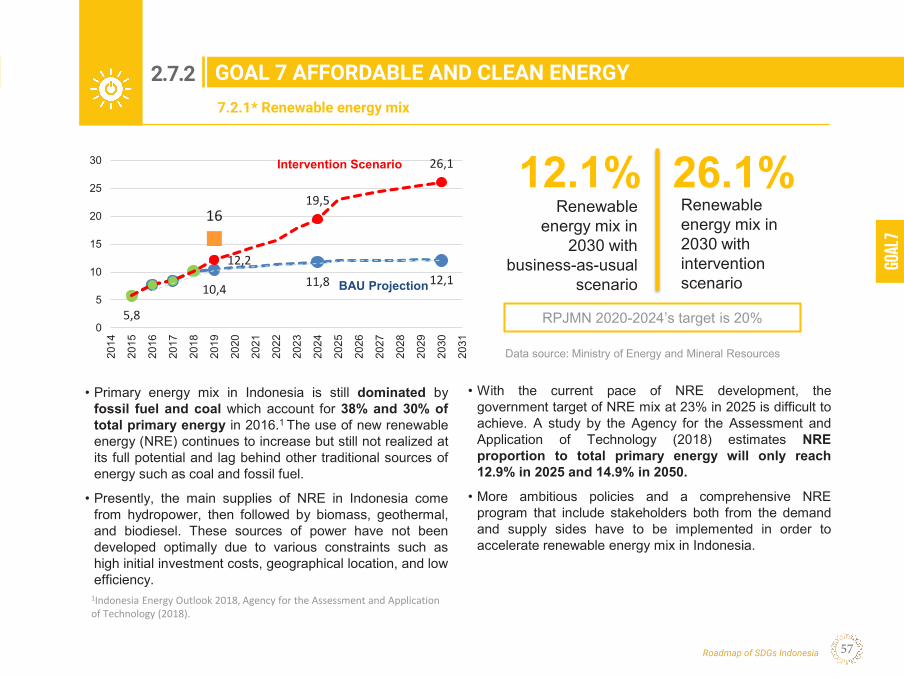
GOAL
7
Roadmap of SDGs Indonesia 57
GOAL 7 AFFORDABLE AND CLEAN ENERGY
HASIL PROYEKSI INDIKATOR TUJUAN 7 SDGs (1/3)
Data source: Ministry of Energy and Mineral Resources
12.1% 26.1%Renewable
energy mix in 2030 with
business-as-usual scenario
Renewable energy mix in 2030 with intervention scenario
• With the current pace of NRE development, thegovernment target of NRE mix at 23% in 2025 is difficult toachieve. A study by the Agency for the Assessment andApplication of Technology (2018) estimates NREproportion to total primary energy will only reach12.9% in 2025 and 14.9% in 2050.
• More ambitious policies and a comprehensive NREprogram that include stakeholders both from the demandand supply sides have to be implemented in order toaccelerate renewable energy mix in Indonesia.
1Indonesia Energy Outlook 2018, Agency for the Assessment and Application of Technology (2018).
5,8
10,4 11,8 12,1
16
12,2
19,5
26,1
0
5
10
15
20
25
30
2014
2015
2016
2017
2018
2019
2020
2021
2022
2023
2024
2025
2026
2027
2028
2029
2030
2031
RPJMN 2020-2024’s target is 20%
7.2.1* Renewable energy mix
GOAL 7 AFFORDABLE AND CLEAN ENERGY
Intervention Scenario
BAU Projection
• Primary energy mix in Indonesia is still dominated byfossil fuel and coal which account for 38% and 30% oftotal primary energy in 2016.1 The use of new renewableenergy (NRE) continues to increase but still not realized atits full potential and lag behind other traditional sources ofenergy such as coal and fossil fuel.
• Presently, the main supplies of NRE in Indonesia comefrom hydropower, then followed by biomass, geothermal,and biodiesel. These sources of power have not beendeveloped optimally due to various constraints such ashigh initial investment costs, geographical location, and lowefficiency.
2.7.2. Renewable energy mix (7.2.1*)
7.2.1* Renewable energy mix
2.7.2

GOAL 7 AFFORDABLE AND CLEAN ENERGYA Highlight
58
GOAL 7 AFFORDABLE AND CLEAN ENERGYPo
licy
Dire
ctio
n 20
20-2
024
Stra
tegi
es
• Development of an NRE-based small electric powerenergy system for supplying electric power in regions thatare not covered by grid expansion,
• Budget allocation for the NRE infrastructuresdevelopment for villages that will not be electrifiedsustainably for a long-term use,
• Establishment of an NRE’s separate business entity thatmandated by the government to develop, utilize, and/orpurchase NRE;
• Increasing the role of the private sector
Polic
y D
irect
ion
2025
-203
0
Stra
tegi
es • Strengthening the development of smart grid system;• Budget enforcement for the NRE infrastructures
development,• National industry development to support NRE power
plants construction
Increasing the utilization of new renewable energy (NRE)
Year Baseline Intervention
2015 5.8% 5.8%
2019 10.4% 12.2%
2024 11.8% 19.5%*
2030 12.1% 26.1%
Renewable energy mix
Increasing the utilization of new renewable energy (NRE) to generate electricity
• Increasing the national capacity in the field of nuclear poweruse safety,
• Preparing pre-feasibility academic studies as a basis to makea decision on the planning of nuclear power plantdevelopment,
• Preparation of nuclear power plants development.
• incentive-based policy to encourage investment in NRE,• Regulatory reform to maximize citizens’ participation in NRE
development,• Designing an NRE development plan that feasible to
implement.
Developing nuclear power plants utilization
*RPJMN 2020-2024’s target is 20%
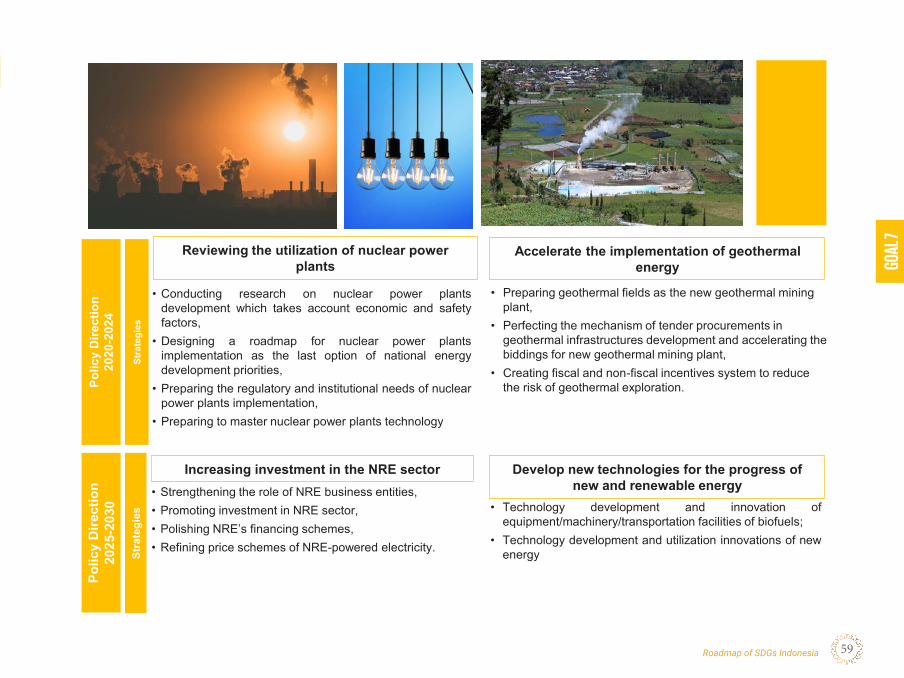
GOAL
7
Roadmap of SDGs Indonesia 59
GOAL 7 AFFORDABLE AND CLEAN ENERGYPo
licy
Dire
ctio
n 20
20-2
024
Stra
tegi
es
• Conducting research on nuclear power plantsdevelopment which takes account economic and safetyfactors,
• Designing a roadmap for nuclear power plantsimplementation as the last option of national energydevelopment priorities,
• Preparing the regulatory and institutional needs of nuclearpower plants implementation,
• Preparing to master nuclear power plants technology
Polic
y D
irect
ion
2025
-203
0
Stra
tegi
es
• Strengthening the role of NRE business entities,• Promoting investment in NRE sector,• Polishing NRE’s financing schemes,• Refining price schemes of NRE-powered electricity.
Increasing investment in the NRE sector
Reviewing the utilization of nuclear power plants
• Technology development and innovation ofequipment/machinery/transportation facilities of biofuels;
• Technology development and utilization innovations of newenergy
• Preparing geothermal fields as the new geothermal mining plant,
• Perfecting the mechanism of tender procurements in geothermal infrastructures development and accelerating the biddings for new geothermal mining plant,
• Creating fiscal and non-fiscal incentives system to reduce the risk of geothermal exploration.
Develop new technologies for the progress of new and renewable energy
Accelerate the implementation of geothermal energy
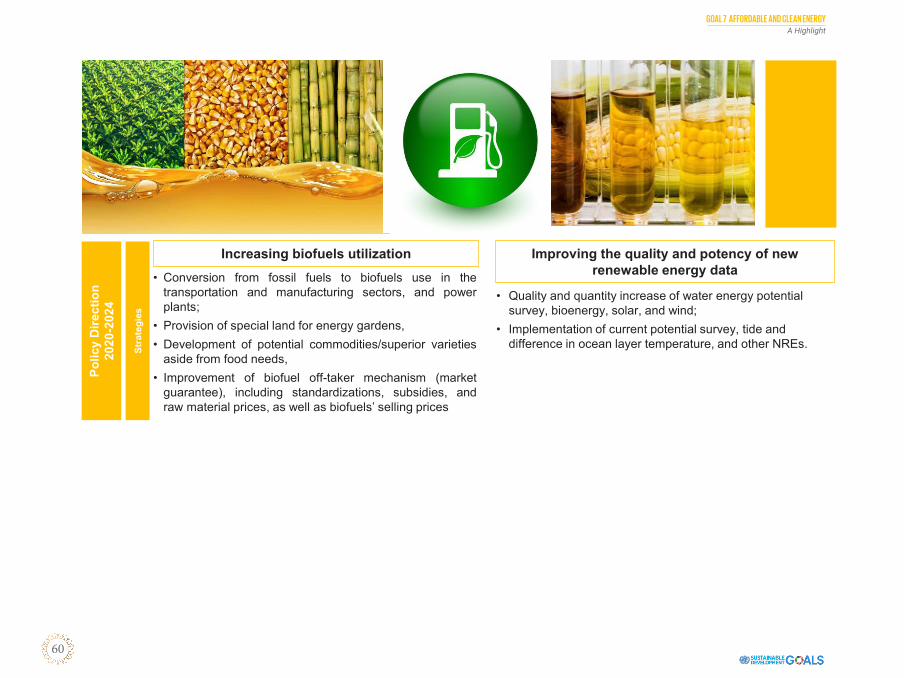
GOAL 7 AFFORDABLE AND CLEAN ENERGYA Highlight
60
GOAL 7 AFFORDABLE AND CLEAN ENERGYPo
licy
Dire
ctio
n 20
20-2
024
Stra
tegi
es
• Conversion from fossil fuels to biofuels use in thetransportation and manufacturing sectors, and powerplants;
• Provision of special land for energy gardens,• Development of potential commodities/superior varieties
aside from food needs,• Improvement of biofuel off-taker mechanism (market
guarantee), including standardizations, subsidies, andraw material prices, as well as biofuels’ selling prices
Increasing biofuels utilization
• Quality and quantity increase of water energy potential survey, bioenergy, solar, and wind;
• Implementation of current potential survey, tide and difference in ocean layer temperature, and other NREs.
Improving the quality and potency of new renewable energy data
GOAL
8
Roadmap of SDGs Indonesia 61
GOAL 8 DECENT WORK AND ECONOMIC GROWTH
2 . 8 . G O A L 8 D E C E N T W O R K A N D E C O N O M I C G R O W T H
2 .8
G OA L 8D E C E N T W O R K A N D E C O N O M I C G R O W T H
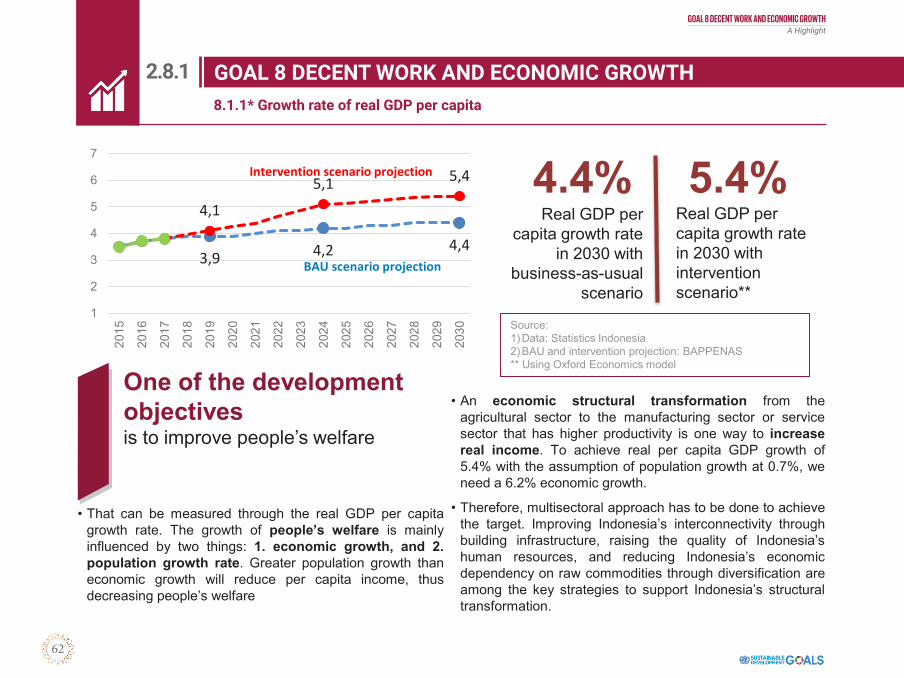
GOAL 8 DECENT WORK AND ECONOMIC GROWTHA Highlight
62
GOAL 8 DECENT WORK AND ECONOMIC GROWTH
HASIL PROYEKSI INDIKATOR TUJUAN 8 SDGs (1/4)
3,9 4,2 4,4
4,15,1 5,4
1
2
3
4
5
6
7
2015
2016
2017
2018
2019
2020
2021
2022
2023
2024
2025
2026
2027
2028
2029
2030 Source:
1) Data: Statistics Indonesia2) BAU and intervention projection: BAPPENAS** Using Oxford Economics model
4.4% 5.4%Real GDP per
capita growth rate in 2030 with
business-as-usual scenario
Real GDP per capita growth rate in 2030 with intervention scenario**
• An economic structural transformation from theagricultural sector to the manufacturing sector or servicesector that has higher productivity is one way to increasereal income. To achieve real per capita GDP growth of5.4% with the assumption of population growth at 0.7%, weneed a 6.2% economic growth.
• Therefore, multisectoral approach has to be done to achievethe target. Improving Indonesia’s interconnectivity throughbuilding infrastructure, raising the quality of Indonesia’shuman resources, and reducing Indonesia’s economicdependency on raw commodities through diversification areamong the key strategies to support Indonesia’s structuraltransformation.
8.1.1* Growth rate of real GDP per capita
Intervention scenario projection
BAU scenario projection
GOAL 8 DECENT WORK AND ECONOMIC GROWTH
• That can be measured through the real GDP per capitagrowth rate. The growth of people’s welfare is mainlyinfluenced by two things: 1. economic growth, and 2.population growth rate. Greater population growth thaneconomic growth will reduce per capita income, thusdecreasing people’s welfare
One of the development objectives is to improve people’s welfare
2.8.1. Growth rate of real GDP per capita (8.1.1*)
8.1.1* Growth rate of real GDP per capita
2.8.1
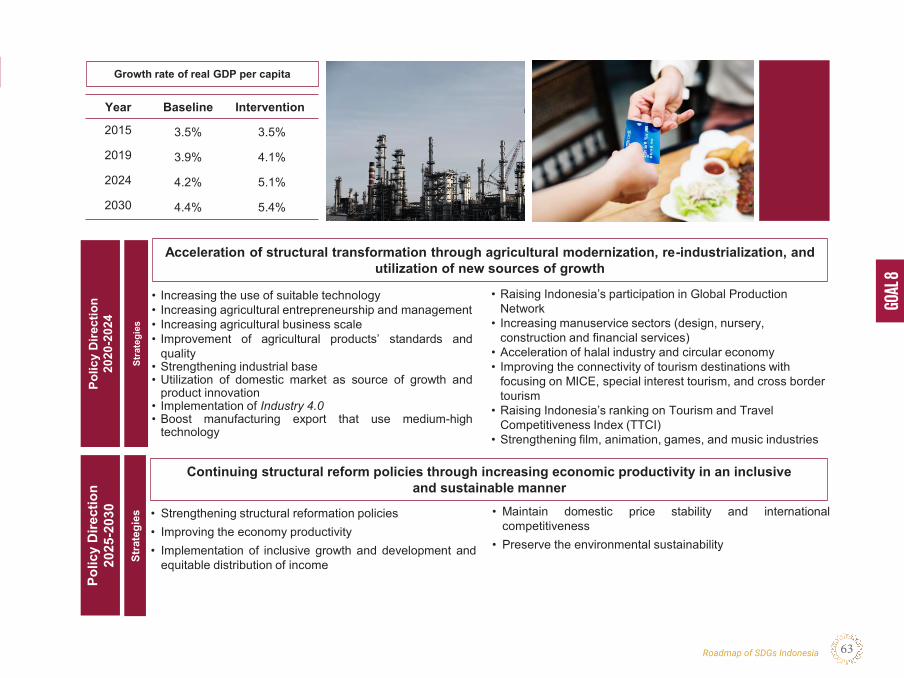
GOAL
8
Roadmap of SDGs Indonesia 63
GOAL 8 DECENT WORK AND ECONOMIC GROWTHPo
licy
Dire
ctio
n 20
20-2
024
Stra
tegi
es
• Increasing the use of suitable technology• Increasing agricultural entrepreneurship and management• Increasing agricultural business scale• Improvement of agricultural products’ standards and
quality• Strengthening industrial base• Utilization of domestic market as source of growth and
product innovation• Implementation of Industry 4.0• Boost manufacturing export that use medium-high
technology
Polic
y D
irect
ion
2025
-203
0
Stra
tegi
es • Strengthening structural reformation policies• Improving the economy productivity• Implementation of inclusive growth and development and
equitable distribution of income
Continuing structural reform policies through increasing economic productivity in an inclusive and sustainable manner
Year Baseline Intervention
2015 3.5% 3.5%
2019 3.9% 4.1%
2024 4.2% 5.1%
2030 4.4% 5.4%
Growth rate of real GDP per capita
Acceleration of structural transformation through agricultural modernization, re-industrialization, and utilization of new sources of growth
• Maintain domestic price stability and internationalcompetitiveness
• Preserve the environmental sustainability
• Raising Indonesia’s participation in Global Production Network
• Increasing manuservice sectors (design, nursery, construction and financial services)
• Acceleration of halal industry and circular economy• Improving the connectivity of tourism destinations with
focusing on MICE, special interest tourism, and cross border tourism
• Raising Indonesia’s ranking on Tourism and Travel Competitiveness Index (TTCI)
• Strengthening film, animation, games, and music industries

GOAL 8 DECENT WORK AND ECONOMIC GROWTHA Highlight
64
GOAL 8 DECENT WORK AND ECONOMIC GROWTH
8.5.2* Unemployment Rate
5,45,0
4,75,2
4,6
3,83,0
3,5
4,0
4,5
5,0
5,5
6,0
6,5
2015
2016
2017
2018
2019
2020
2021
2022
2023
2024
2025
2026
2027
2028
2029
2030
Une
mpl
oym
ent R
ate
(%)
4,8-5,2
FKP Target
Actual
BAU Projection
Intervention Scenario
4.7%Unemployment
rate in 2030 with BAU projection
3.8%Unemployment rate in 2030 with intervention projection
• Youth unemployment in Indonesia, which makes up a58% of total unemployment, is the highest in ASEAN, andis higher than world’s average. Not only that, the skillmismatch between the graduates and the jobs available inthe economy is also an issue to address to. Structuraltransformation from agricultural sector to a service sectorshould be accompanied by the provision of high qualityhuman resources.
• The level of unemployment should be pushed down to itsnatural rate. In USA, the natural rate if unemployment isbetween 4.5%-5% in 2030. Therefore, decreasing thelevel of unemployment in Indonesia to 3.8% in 2030 ispossible if the issues on youth unemployment, jobsquality, and low productivity workers are being addressedas well.
GOAL 8 DECENT WORK AND ECONOMIC GROWTH
• Unemployment is strongly linked to social and criminalissue in which high level of unemployment mightthreaten a social cohesion and security. In Indonesia,underemployment and low productivity of jobs still persisteven after successfully decreasing the unemploymentrate to 5.3% in 2017.
Source: SAKERNAS, BPS
Baseline projection from BPSIntervention scenario from Bappenas
2.8.2. Unemployment Rate (8.5.2*)
8.5.2* Unemployment Rate
2.8.2
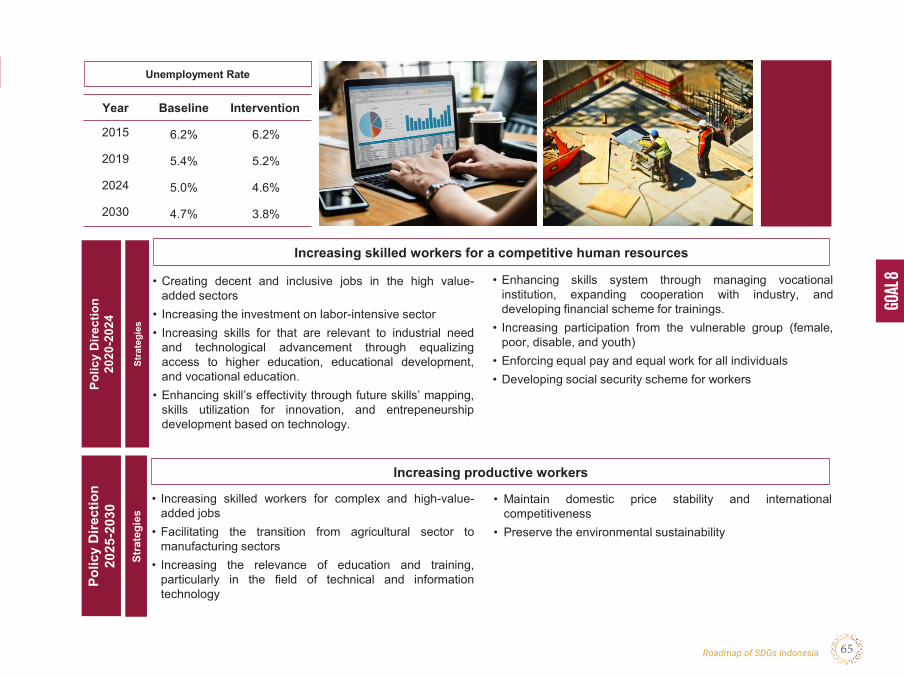
GOAL
8
Roadmap of SDGs Indonesia 65
GOAL 8 DECENT WORK AND ECONOMIC GROWTHPo
licy
Dire
ctio
n 20
20-2
024
Stra
tegi
es
• Creating decent and inclusive jobs in the high value-added sectors
• Increasing the investment on labor-intensive sector• Increasing skills for that are relevant to industrial need
and technological advancement through equalizingaccess to higher education, educational development,and vocational education.
• Enhancing skill’s effectivity through future skills’ mapping,skills utilization for innovation, and entrepeneurshipdevelopment based on technology.
Polic
y D
irect
ion
2025
-203
0
Stra
tegi
es
• Increasing skilled workers for complex and high-value-added jobs
• Facilitating the transition from agricultural sector tomanufacturing sectors
• Increasing the relevance of education and training,particularly in the field of technical and informationtechnology
Increasing productive workers
Year Baseline Intervention
2015 6.2% 6.2%
2019 5.4% 5.2%
2024 5.0% 4.6%
2030 4.7% 3.8%
Unemployment Rate
Increasing skilled workers for a competitive human resources
• Maintain domestic price stability and internationalcompetitiveness
• Preserve the environmental sustainability
• Enhancing skills system through managing vocationalinstitution, expanding cooperation with industry, anddeveloping financial scheme for trainings.
• Increasing participation from the vulnerable group (female,poor, disable, and youth)
• Enforcing equal pay and equal work for all individuals• Developing social security scheme for workers

GOAL 8 DECENT WORK AND ECONOMIC GROWTHA Highlight
GOAL 8 DECENT WORK AND ECONOMIC GROWTH

GOAL
9
Roadmap of SDGs Indonesia 67
GOAL 9 INDUSTRY, INNOVATION AND INFRASTRUCTURE
2 . 9 . G O A L 9 I N D U S T R Y, I N N O VAT I O N A N D I N F R A S T R U C T U R E
2 .9
G OA L 9I N D U ST RY, I N N OVAT I O N A N D I N F R A ST R U C T U R E

GOAL 9 INDUSTRY, INNOVATION AND INFRASTRUCTUREA Highlight
68
GOAL 9 INDUSTRY, INNOVATION AND INFRASTRUCTURE
9.c.1* Proportion of population served by mobile broadband service
12,5
86,2 91 92,5
86,594,5
100
0
20
40
60
80
100
BAU Projection
Intervention Scenario
92.5%in 2030 with BAU projection
100%in 2030 with intervention projection
• Nevertheless, disparity in regional development betweenthe eastern and the western part of Indonesia still persistsas it affects to the low rate of population served by mobilebroadband service. In Maluku and Papua, for instance, 55%of villages had not received a cellular phone signal, andonly 60% of the population master the cell-phone(SUSENAS, 2014).
• Strong commitment from national and local governmentwith a well-targeted policy package should be acceleratedto reach the 2030 agenda. This number is highly possibleas the rate is showing a promising trend for the upcomingdecade.
GOAL 9 INDUSTRY, INNOVATION AND INFRASTRUCTURE
• In the era where digital technology is inevitable and morepeople need to be connected to keep up with the changing-era, mobile broadband service is a necessary feature tohelp people be more empowered. Government’scommitment to provide mobile broadband service in allregions in Indonesia had shown a fruitful result as mobilebroadband’s penetration reached 90% in 2019 (Kominfo,2019).
Source: Ministry of Communications and Information Technology
2.9.1. Proportion of population served by mobile broadband service (9.c.1*)
9.c.1* Proportion of population served by mobile broadband service
2.9.1
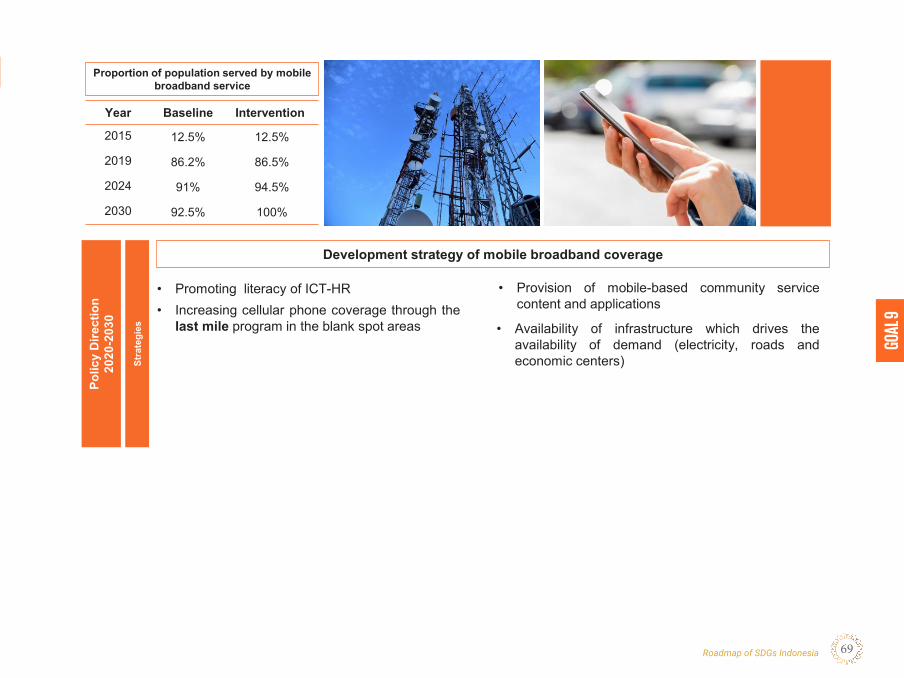
GOAL
9
Roadmap of SDGs Indonesia 69
GOAL 9 INDUSTRY, INNOVATION AND INFRASTRUCTURE
Year Baseline Intervention
2015 12.5% 12.5%
2019 86.2% 86.5%
2024 91% 94.5%
2030 92.5% 100%
Proportion of population served by mobile broadband service
Development strategy of mobile broadband coverage
Polic
y D
irect
ion
2020
-203
0
Stra
tegi
es
• Increasing cellular phone coverage through thelast mile program in the blank spot areas
• Promoting literacy of ICT-HR
• Availability of infrastructure which drives theavailability of demand (electricity, roads andeconomic centers)
• Provision of mobile-based community servicecontent and applications

GOAL 10 REDUCED INEQUALITIES
GOAL 9 INDUSTRY, INNOVATION AND INFRASTRUCTUREA Highlight
GOAL 9 INDUSTRY, INNOVATION AND INFRASTRUCTURE
GOAL
10
Roadmap of SDGs Indonesia 71
GOAL 10 REDUCED INEQUALITIES GOAL 10 REDUCED INEQUALITIES
2 .1 0 . G O A L 1 0 R E D U C E D I N E Q U A L I T I E S
2 .1 0
G OA L 1 0R E D U C E D I N E Q UA L I T I E S
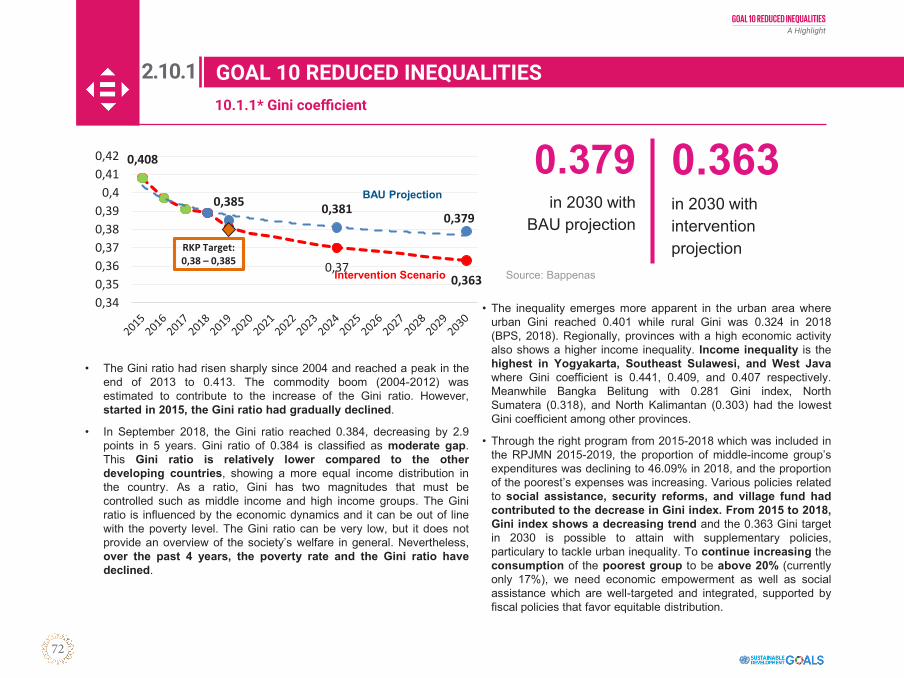
GOAL 10 REDUCED INEQUALITIESA Highlight
72
GOAL 10 REDUCED INEQUALITIES
10.1.1* Gini coefficient
0,408
0,385 0,381 0,379
RKP Target: 0,38 – 0,385 0,37
0,3630,340,350,360,370,380,39
0,40,410,42
BAU Projection
Intervention Scenario
0.379in 2030 with
BAU projection
0.363in 2030 with intervention projection
GOAL 10 REDUCED INEQUALITIES
Source: Bappenas
• The Gini ratio had risen sharply since 2004 and reached a peak in theend of 2013 to 0.413. The commodity boom (2004-2012) wasestimated to contribute to the increase of the Gini ratio. However,started in 2015, the Gini ratio had gradually declined.
• In September 2018, the Gini ratio reached 0.384, decreasing by 2.9points in 5 years. Gini ratio of 0.384 is classified as moderate gap.This Gini ratio is relatively lower compared to the otherdeveloping countries, showing a more equal income distribution inthe country. As a ratio, Gini has two magnitudes that must becontrolled such as middle income and high income groups. The Giniratio is influenced by the economic dynamics and it can be out of linewith the poverty level. The Gini ratio can be very low, but it does notprovide an overview of the society’s welfare in general. Nevertheless,over the past 4 years, the poverty rate and the Gini ratio havedeclined.
• The inequality emerges more apparent in the urban area whereurban Gini reached 0.401 while rural Gini was 0.324 in 2018(BPS, 2018). Regionally, provinces with a high economic activityalso shows a higher income inequality. Income inequality is thehighest in Yogyakarta, Southeast Sulawesi, and West Javawhere Gini coefficient is 0.441, 0.409, and 0.407 respectively.Meanwhile Bangka Belitung with 0.281 Gini index, NorthSumatera (0.318), and North Kalimantan (0.303) had the lowestGini coefficient among other provinces.
• Through the right program from 2015-2018 which was included inthe RPJMN 2015-2019, the proportion of middle-income group’sexpenditures was declining to 46.09% in 2018, and the proportionof the poorest’s expenses was increasing. Various policies relatedto social assistance, security reforms, and village fund hadcontributed to the decrease in Gini index. From 2015 to 2018,Gini index shows a decreasing trend and the 0.363 Gini targetin 2030 is possible to attain with supplementary policies,particulary to tackle urban inequality. To continue increasing theconsumption of the poorest group to be above 20% (currentlyonly 17%), we need economic empowerment as well as socialassistance which are well-targeted and integrated, supported byfiscal policies that favor equitable distribution.
2.10.1. Gini coefficient (10.1.1*)
10.1.1* Gini coefficient
2.10.1
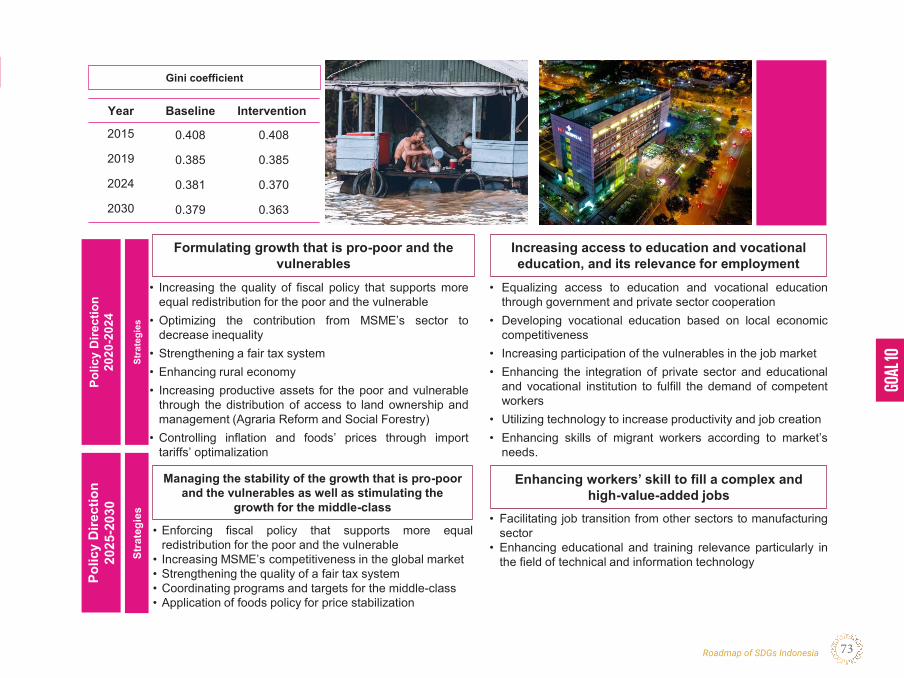
GOAL
10
Roadmap of SDGs Indonesia 73
GOAL 10 REDUCED INEQUALITIES GOAL 10 REDUCED INEQUALITIESPo
licy
Dire
ctio
n 20
20-2
024
Stra
tegi
es
• Increasing the quality of fiscal policy that supports moreequal redistribution for the poor and the vulnerable
• Optimizing the contribution from MSME’s sector todecrease inequality
• Strengthening a fair tax system• Enhancing rural economy• Increasing productive assets for the poor and vulnerable
through the distribution of access to land ownership andmanagement (Agraria Reform and Social Forestry)
• Controlling inflation and foods’ prices through importtariffs’ optimalization
Polic
y D
irect
ion
2025
-203
0
Stra
tegi
es
• Enforcing fiscal policy that supports more equalredistribution for the poor and the vulnerable
• Increasing MSME’s competitiveness in the global market• Strengthening the quality of a fair tax system• Coordinating programs and targets for the middle-class• Application of foods policy for price stabilization
Managing the stability of the growth that is pro-poor and the vulnerables as well as stimulating the
growth for the middle-class
Year Baseline Intervention
2015 0.408 0.408
2019 0.385 0.385
2024 0.381 0.370
2030 0.379 0.363
Gini coefficient
Formulating growth that is pro-poor and the vulnerables
• Facilitating job transition from other sectors to manufacturingsector
• Enhancing educational and training relevance particularly inthe field of technical and information technology
• Equalizing access to education and vocational educationthrough government and private sector cooperation
• Developing vocational education based on local economiccompetitiveness
• Increasing participation of the vulnerables in the job market• Enhancing the integration of private sector and educational
and vocational institution to fulfill the demand of competentworkers
• Utilizing technology to increase productivity and job creation• Enhancing skills of migrant workers according to market’s
needs.
Increasing access to education and vocational education, and its relevance for employment
Enhancing workers’ skill to fill a complex and high-value-added jobs
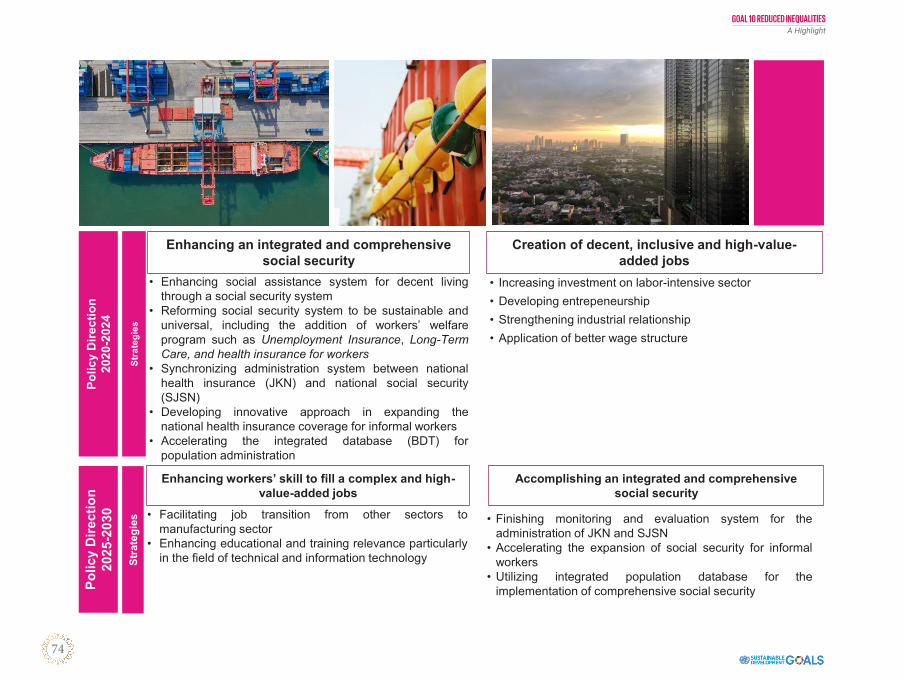
GOAL 10 REDUCED INEQUALITIESA Highlight
74
GOAL 10 REDUCED INEQUALITIESPo
licy
Dire
ctio
n 20
20-2
024
Stra
tegi
es
• Increasing investment on labor-intensive sector• Developing entrepeneurship• Strengthening industrial relationship• Application of better wage structure
Polic
y D
irect
ion
2025
-203
0
Stra
tegi
es • Facilitating job transition from other sectors tomanufacturing sector
• Enhancing educational and training relevance particularlyin the field of technical and information technology
Enhancing workers’ skill to fill a complex and high-value-added jobs
Creation of decent, inclusive and high-value-added jobs
• Finishing monitoring and evaluation system for theadministration of JKN and SJSN
• Accelerating the expansion of social security for informalworkers
• Utilizing integrated population database for theimplementation of comprehensive social security
• Enhancing social assistance system for decent livingthrough a social security system
• Reforming social security system to be sustainable anduniversal, including the addition of workers’ welfareprogram such as Unemployment Insurance, Long-TermCare, and health insurance for workers
• Synchronizing administration system between nationalhealth insurance (JKN) and national social security(SJSN)
• Developing innovative approach in expanding thenational health insurance coverage for informal workers
• Accelerating the integrated database (BDT) forpopulation administration
Enhancing an integrated and comprehensive social security
Accomplishing an integrated and comprehensive social security
GOAL
11
Roadmap of SDGs Indonesia 75
GOAL 11 SUSTAINABLE CITIES AND COMMUNITIESGOAL 10 REDUCED INEQUALITIES
2 .1 1 . G O A L 1 1 S U S TA I N A B L E C I T I E S A N D C O M M U N I T I E S
2 .1 1
G OA L 1 1S U STA I N A B L E C I T I E S A N D C O M M U N I T I E S
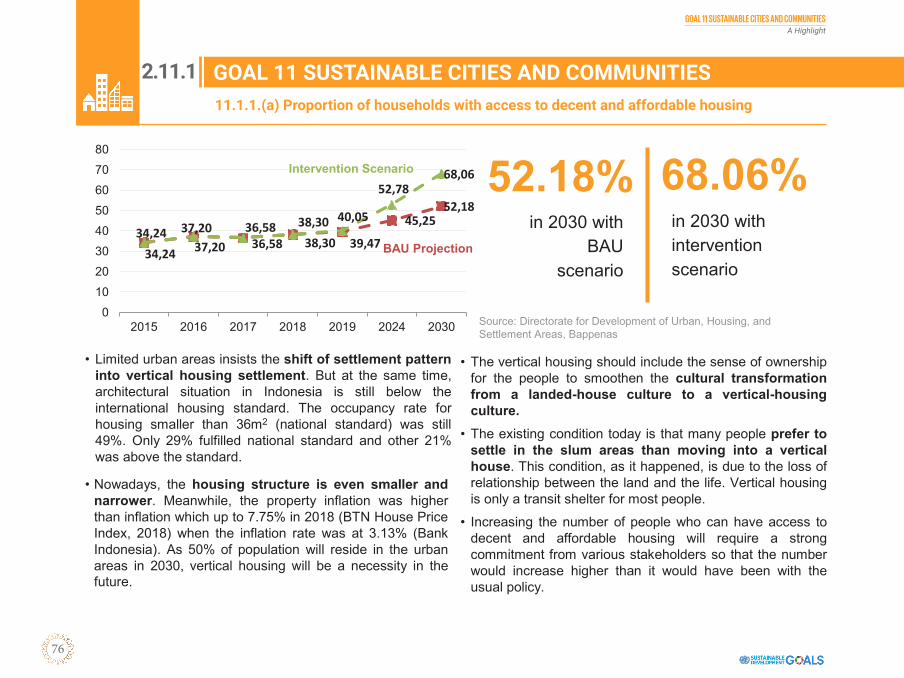
GOAL 11 SUSTAINABLE CITIES AND COMMUNITIESA Highlight
76
GOAL 11 SUSTAINABLE CITIES AND COMMUNITIES
34,24 37,20 36,58 38,30 39,4745,25
52,18
34,24 37,20 36,58 38,30 40,05
52,7868,06
01020304050607080
2015 2016 2017 2018 2019 2024 2030
GOAL 11 SUSTAINABLE AND COMMUNITIES11.1.1 (a) Proportion of households with access to decent and affordable housing
• The vertical housing should include the sense of ownershipfor the people to smoothen the cultural transformationfrom a landed-house culture to a vertical-housingculture.
• The existing condition today is that many people prefer tosettle in the slum areas than moving into a verticalhouse. This condition, as it happened, is due to the loss ofrelationship between the land and the life. Vertical housingis only a transit shelter for most people.
• Increasing the number of people who can have access todecent and affordable housing will require a strongcommitment from various stakeholders so that the numberwould increase higher than it would have been with theusual policy.
52.18% 68.06%BAU Projection
Intervention Scenario
• Limited urban areas insists the shift of settlement patterninto vertical housing settlement. But at the same time,architectural situation in Indonesia is still below theinternational housing standard. The occupancy rate forhousing smaller than 36m2 (national standard) was still49%. Only 29% fulfilled national standard and other 21%was above the standard.
• Nowadays, the housing structure is even smaller andnarrower. Meanwhile, the property inflation was higherthan inflation which up to 7.75% in 2018 (BTN House PriceIndex, 2018) when the inflation rate was at 3.13% (BankIndonesia). As 50% of population will reside in the urbanareas in 2030, vertical housing will be a necessity in thefuture.
Source: Directorate for Development of Urban, Housing, and Settlement Areas, Bappenas
in 2030 with BAU
scenario
in 2030 with intervention scenario
2.11.1. Proportion of households with access to decent and affordable housing (11.1.1.(a))
11.1.1.(a) Proportion of households with access to decent and affordable housing
2.11.1
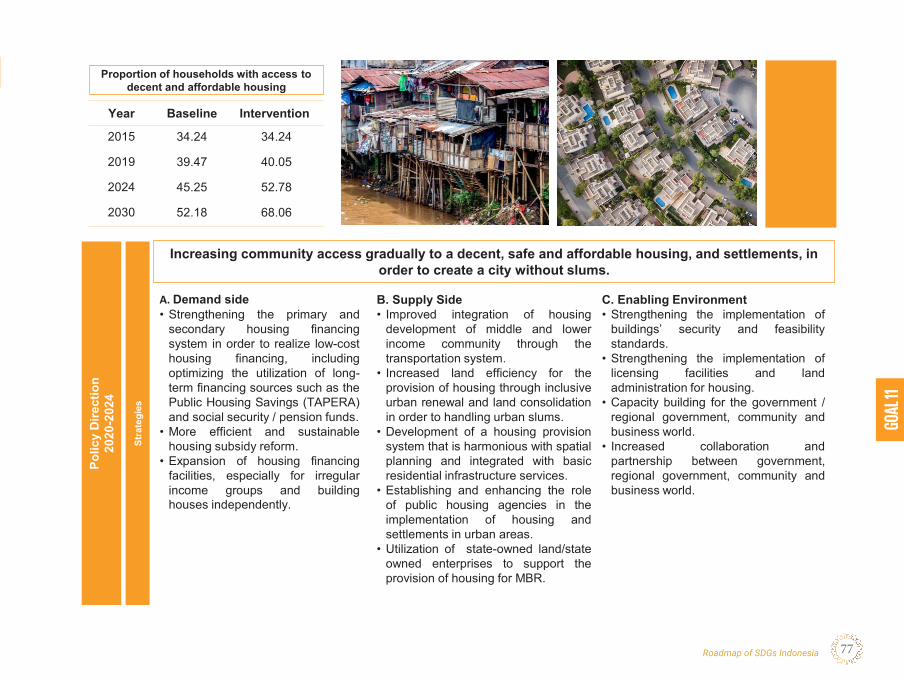
GOAL
11
Roadmap of SDGs Indonesia 77
GOAL 11 SUSTAINABLE CITIES AND COMMUNITIESPo
licy
Dire
ctio
n 20
20-2
024
Stra
tegi
es
A. Demand side• Strengthening the primary and
secondary housing financingsystem in order to realize low-costhousing financing, includingoptimizing the utilization of long-term financing sources such as thePublic Housing Savings (TAPERA)and social security / pension funds.
• More efficient and sustainablehousing subsidy reform.
• Expansion of housing financingfacilities, especially for irregularincome groups and buildinghouses independently.
Year Baseline Intervention
2015 34.24 34.24
2019 39.47 40.05
2024 45.25 52.78
2030 52.18 68.06
Proportion of households with access to decent and affordable housing
Increasing community access gradually to a decent, safe and affordable housing, and settlements, in order to create a city without slums.
C. Enabling Environment• Strengthening the implementation of
buildings’ security and feasibilitystandards.
• Strengthening the implementation oflicensing facilities and landadministration for housing.
• Capacity building for the government /regional government, community andbusiness world.
• Increased collaboration andpartnership between government,regional government, community andbusiness world.
B. Supply Side• Improved integration of housing
development of middle and lowerincome community through thetransportation system.
• Increased land efficiency for theprovision of housing through inclusiveurban renewal and land consolidationin order to handling urban slums.
• Development of a housing provisionsystem that is harmonious with spatialplanning and integrated with basicresidential infrastructure services.
• Establishing and enhancing the roleof public housing agencies in theimplementation of housing andsettlements in urban areas.
• Utilization of state-owned land/stateowned enterprises to support theprovision of housing for MBR.
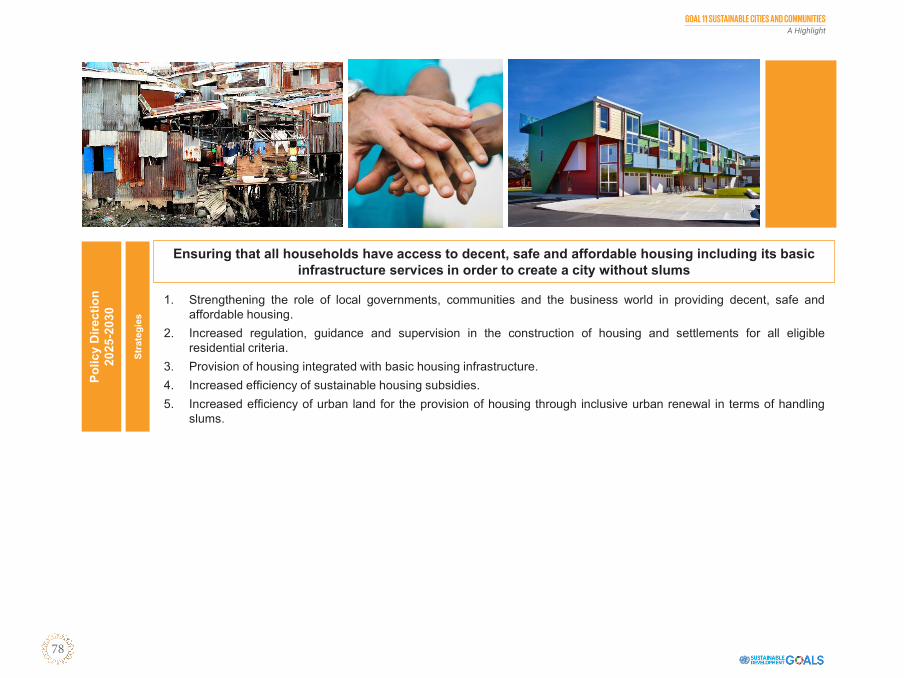
GOAL 11 SUSTAINABLE CITIES AND COMMUNITIESA Highlight
78
GOAL 11 SUSTAINABLE CITIES AND COMMUNITIESPo
licy
Dire
ctio
n 20
25-2
030
Stra
tegi
es
1. Strengthening the role of local governments, communities and the business world in providing decent, safe andaffordable housing.
2. Increased regulation, guidance and supervision in the construction of housing and settlements for all eligibleresidential criteria.
3. Provision of housing integrated with basic housing infrastructure.4. Increased efficiency of sustainable housing subsidies.5. Increased efficiency of urban land for the provision of housing through inclusive urban renewal in terms of handling
slums.
Ensuring that all households have access to decent, safe and affordable housing including its basic infrastructure services in order to create a city without slums
GOAL
13
Roadmap of SDGs Indonesia 79
GOAL 13 CLIMATE ACTION
2 .1 2 . G O A L 1 3 C L I M AT E A C T I O N
2 .1 2
G OA L 1 3C L I M AT EAC T I O N
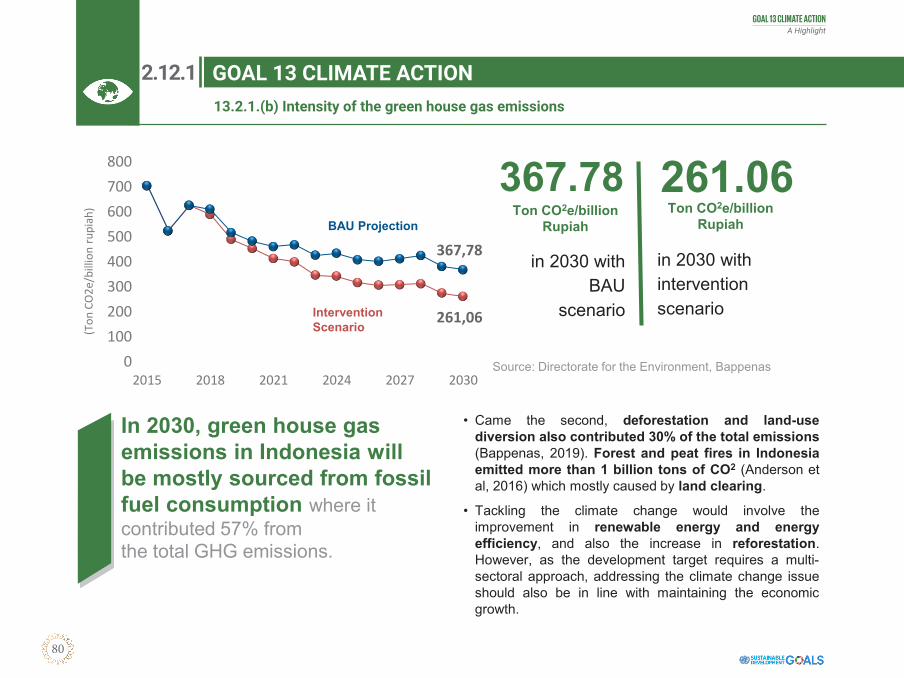
GOAL 13 CLIMATE ACTIONA Highlight
80
GOAL 13 CLIMATE ACTION
13.2.1.(b) Intensity of the green house gas emissions
(Ton
CO2
e/bi
llion
rupi
ah)
367.78 261.06
• Came the second, deforestation and land-usediversion also contributed 30% of the total emissions(Bappenas, 2019). Forest and peat fires in Indonesiaemitted more than 1 billion tons of CO2 (Anderson etal, 2016) which mostly caused by land clearing.
• Tackling the climate change would involve theimprovement in renewable energy and energyefficiency, and also the increase in reforestation.However, as the development target requires a multi-sectoral approach, addressing the climate change issueshould also be in line with maintaining the economicgrowth.
GOAL 13 CLIMATE ACTION
In 2030, green house gas emissions in Indonesia will be mostly sourced from fossil fuel consumption where it contributed 57% from the total GHG emissions.
261,06
367,78
0100200300400500600700800
2015 2018 2021 2024 2027 2030
BAU Projection
Intervention Scenario
Source: Directorate for the Environment, Bappenas
Ton CO2e/billion Rupiah
in 2030 with BAU
scenario
in 2030 with intervention scenario
Ton CO2e/billion Rupiah
2.12.1. Intensity of the green house gas emissions (13.2.1.(b))
13.2.1.(b) Intensity of the green house gas emissions
2.12.1
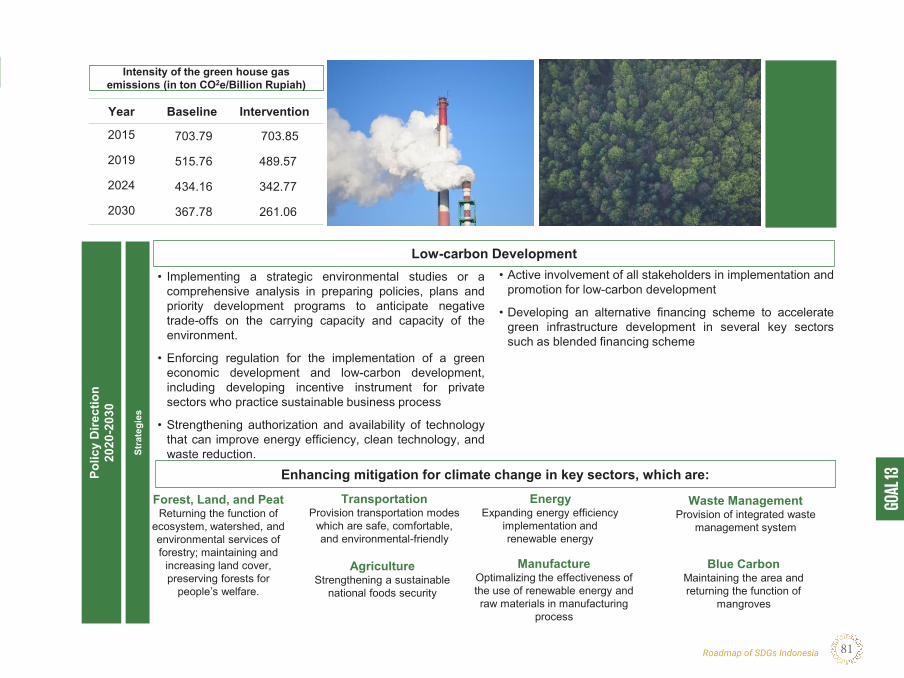
GOAL
13
Roadmap of SDGs Indonesia 81
GOAL 13 CLIMATE ACTIONPo
licy
Dire
ctio
n 20
20-2
030
Stra
tegi
es
Year Baseline Intervention
2015 703.79 703.85
2019 515.76 489.57
2024 434.16 342.77
2030 367.78 261.06
Intensity of the green house gas emissions (in ton CO2e/Billion Rupiah)
Low-carbon Development• Implementing a strategic environmental studies or a
comprehensive analysis in preparing policies, plans andpriority development programs to anticipate negativetrade-offs on the carrying capacity and capacity of theenvironment.
• Enforcing regulation for the implementation of a greeneconomic development and low-carbon development,including developing incentive instrument for privatesectors who practice sustainable business process
• Strengthening authorization and availability of technologythat can improve energy efficiency, clean technology, andwaste reduction.
• Active involvement of all stakeholders in implementation andpromotion for low-carbon development
• Developing an alternative financing scheme to accelerategreen infrastructure development in several key sectorssuch as blended financing scheme
Forest, Land, and PeatReturning the function of
ecosystem, watershed, and environmental services of forestry; maintaining and
increasing land cover, preserving forests for
people’s welfare.
TransportationProvision transportation modes
which are safe, comfortable, and environmental-friendly
AgricultureStrengthening a sustainable
national foods security
EnergyExpanding energy efficiency
implementation and renewable energy
ManufactureOptimalizing the effectiveness of the use of renewable energy and raw materials in manufacturing
process
Waste ManagementProvision of integrated waste
management system
Blue CarbonMaintaining the area and returning the function of
mangroves
Enhancing mitigation for climate change in key sectors, which are:

GOAL 15 LIFE ON LAND
GOAL 13 CLIMATE ACTIONA Highlight
GOAL 13 CLIMATE ACTION
GOAL
15
Roadmap of SDGs Indonesia 83
GOAL 15 LIFE ON LAND GOAL 15 LIFE ON LAND
2 .1 3 . G O A L 1 5 L I F E O N L A N D
2 .1 3
G OA L 1 5L I F E O N L A N D
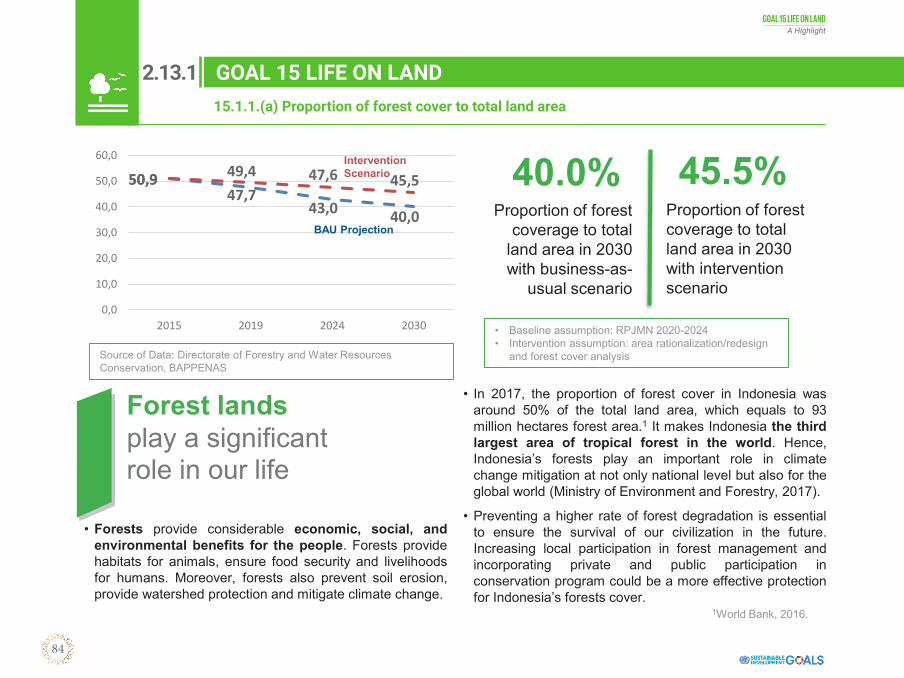
GOAL 15 LIFE ON LANDA Highlight
84
GOAL 15 LIFE ON LAND
HASIL PROYEKSI INDIKATOR TUJUAN 8 SDGs (1/4)
15.1.1(a) Proportion of forest cover to total land area
• In 2017, the proportion of forest cover in Indonesia wasaround 50% of the total land area, which equals to 93million hectares forest area.1 It makes Indonesia the thirdlargest area of tropical forest in the world. Hence,Indonesia’s forests play an important role in climatechange mitigation at not only national level but also for theglobal world (Ministry of Environment and Forestry, 2017).
• Preventing a higher rate of forest degradation is essentialto ensure the survival of our civilization in the future.Increasing local participation in forest management andincorporating private and public participation inconservation program could be a more effective protectionfor Indonesia’s forests cover.
1World Bank, 2016.
• Baseline assumption: RPJMN 2020-2024• Intervention assumption: area rationalization/redesign
and forest cover analysis
40.0% 45.5%Proportion of forest
coverage to total land area in 2030 with business-as-
usual scenario
Proportion of forest coverage to total land area in 2030 with intervention scenario
Source of Data: Directorate of Forestry and Water Resources Conservation, BAPPENAS
50,947,7
43,0 40,0
50,9 49,4 47,6 45,5
0,0
10,0
20,0
30,0
40,0
50,0
60,0
2015 2019 2024 2030
GOAL 15 LIFE ON LAND
BAU Projection
Intervention Scenario
• Forests provide considerable economic, social, andenvironmental benefits for the people. Forests providehabitats for animals, ensure food security and livelihoodsfor humans. Moreover, forests also prevent soil erosion,provide watershed protection and mitigate climate change.
Forest lands play a significant role in our life
2.13.1. Proportion of forest cover to total land area (15.1.1.(a))
15.1.1.(a) Proportion of forest cover to total land area
2.13.1
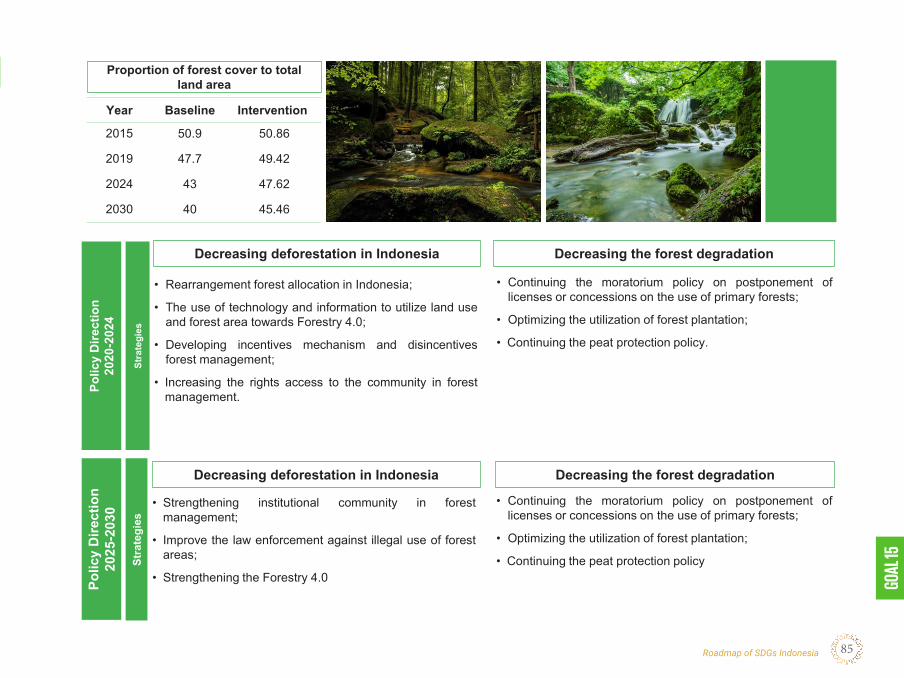
GOAL
15
Roadmap of SDGs Indonesia 85
GOAL 15 LIFE ON LAND GOAL 15 LIFE ON LANDPo
licy
Dire
ctio
n 20
20-2
024
Stra
tegi
es
• Rearrangement forest allocation in Indonesia;
• The use of technology and information to utilize land useand forest area towards Forestry 4.0;
• Developing incentives mechanism and disincentivesforest management;
• Increasing the rights access to the community in forestmanagement.
Polic
y D
irect
ion
2025
-203
0
Stra
tegi
es
• Strengthening institutional community in forestmanagement;
• Improve the law enforcement against illegal use of forestareas;
• Strengthening the Forestry 4.0
Decreasing deforestation in Indonesia
Year Baseline Intervention
2015 50.9 50.86
2019 47.7 49.42
2024 43 47.62
2030 40 45.46
Proportion of forest cover to total land area
Decreasing deforestation in Indonesia
• Continuing the moratorium policy on postponement oflicenses or concessions on the use of primary forests;
• Optimizing the utilization of forest plantation;
• Continuing the peat protection policy
• Continuing the moratorium policy on postponement oflicenses or concessions on the use of primary forests;
• Optimizing the utilization of forest plantation;
• Continuing the peat protection policy.
Decreasing the forest degradation
Decreasing the forest degradation

GOAL 17 PARTNERSHIPS FOR THE GOALS
GOAL 15 LIFE ON LANDA Highlight
GOAL 15 LIFE ON LAND
GOAL
17
Roadmap of SDGs Indonesia 87
GOAL 17 PARTNERSHIPS FOR THE GOALS GOAL 17 PARTNERSHIPS FOR THE GOALSGOAL 15 LIFE ON LAND
2 .1 4 . G O A L 1 7 PA R T N E R S H I P S F O R T H E G O A L S
2 .1 4
G OA L 1 7 PA R T N E R S H I P S F O R T H E G OA L S
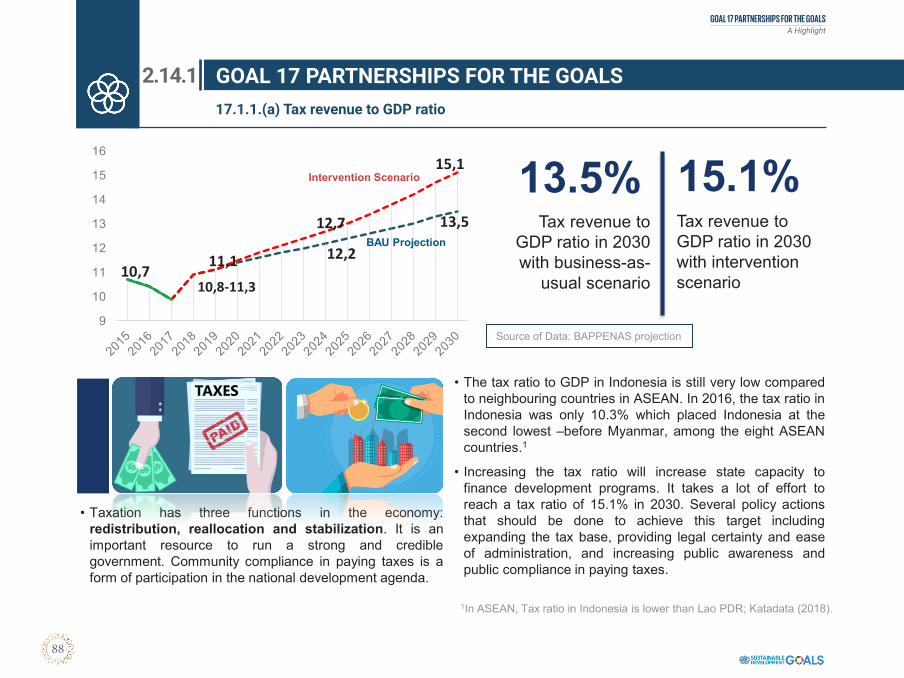
GOAL 17 PARTNERSHIPS FOR THE GOALSA Highlight
88
GOAL 17 PARTNERSHIPS FOR THE GOALS
HASIL PROYEKSI INDIKATOR TUJUAN 8 SDGs (1/4)
• The tax ratio to GDP in Indonesia is still very low comparedto neighbouring countries in ASEAN. In 2016, the tax ratio inIndonesia was only 10.3% which placed Indonesia at thesecond lowest –before Myanmar, among the eight ASEANcountries.1
• Increasing the tax ratio will increase state capacity tofinance development programs. It takes a lot of effort toreach a tax ratio of 15.1% in 2030. Several policy actionsthat should be done to achieve this target includingexpanding the tax base, providing legal certainty and easeof administration, and increasing public awareness andpublic compliance in paying taxes.
1In ASEAN, Tax ratio in Indonesia is lower than Lao PDR; Katadata (2018).
13.5% 15.1%Tax revenue to
GDP ratio in 2030 with business-as-
usual scenario
Tax revenue to GDP ratio in 2030 with intervention scenario
12,2
13,5
10,7 11,1
12,7
15,1
10,8-11,3
9
10
11
12
13
14
15
16
Source of Data: BAPPENAS projection
17.1.1a Tax revenue to GDP ratio
GOAL 17 PARTNERSHIPS FOR THE GOALS
BAU Projection
Intervention Scenario
• Taxation has three functions in the economy:redistribution, reallocation and stabilization. It is animportant resource to run a strong and crediblegovernment. Community compliance in paying taxes is aform of participation in the national development agenda.
2.14.1. Tax revenue to GDP ratio (17.1.1.(a))
17.1.1.(a) Tax revenue to GDP ratio
2.14.1
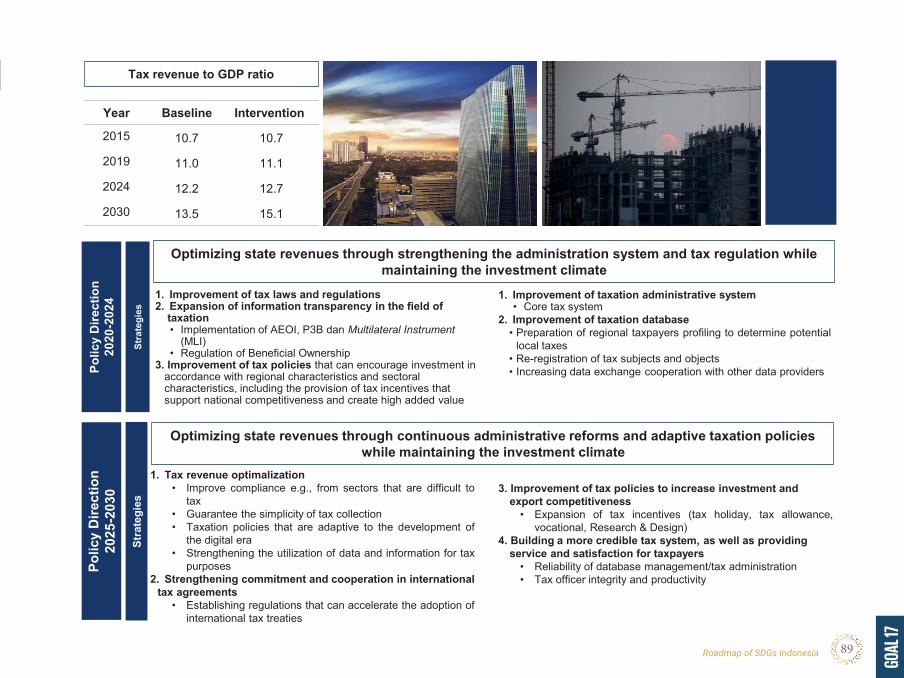
GOAL
17
Roadmap of SDGs Indonesia 89
GOAL 17 PARTNERSHIPS FOR THE GOALS GOAL 17 PARTNERSHIPS FOR THE GOALSPo
licy
Dire
ctio
n 20
20-2
024
Stra
tegi
es
1. Improvement of tax laws and regulations2. Expansion of information transparency in the field of
taxation• Implementation of AEOI, P3B dan Multilateral Instrument
(MLI)• Regulation of Beneficial Ownership
3. Improvement of tax policies that can encourage investment in accordance with regional characteristics and sectoral characteristics, including the provision of tax incentives that support national competitiveness and create high added value
Polic
y D
irect
ion
2025
-203
0
Stra
tegi
es
1. Tax revenue optimalization• Improve compliance e.g., from sectors that are difficult to
tax• Guarantee the simplicity of tax collection• Taxation policies that are adaptive to the development of
the digital era• Strengthening the utilization of data and information for tax
purposes2. Strengthening commitment and cooperation in international
tax agreements• Establishing regulations that can accelerate the adoption of
international tax treaties
Optimizing state revenues through continuous administrative reforms and adaptive taxation policies while maintaining the investment climate
Year Baseline Intervention
2015 10.7 10.7
2019 11.0 11.1
2024 12.2 12.7
2030 13.5 15.1
Tax revenue to GDP ratio
Optimizing state revenues through strengthening the administration system and tax regulation while maintaining the investment climate
3. Improvement of tax policies to increase investment andexport competitiveness
• Expansion of tax incentives (tax holiday, tax allowance,vocational, Research & Design)
4. Building a more credible tax system, as well as providingservice and satisfaction for taxpayers
• Reliability of database management/tax administration• Tax officer integrity and productivity
1. Improvement of taxation administrative system• Core tax system
2. Improvement of taxation database• Preparation of regional taxpayers profiling to determine potential
local taxes• Re-registration of tax subjects and objects• Increasing data exchange cooperation with other data providers
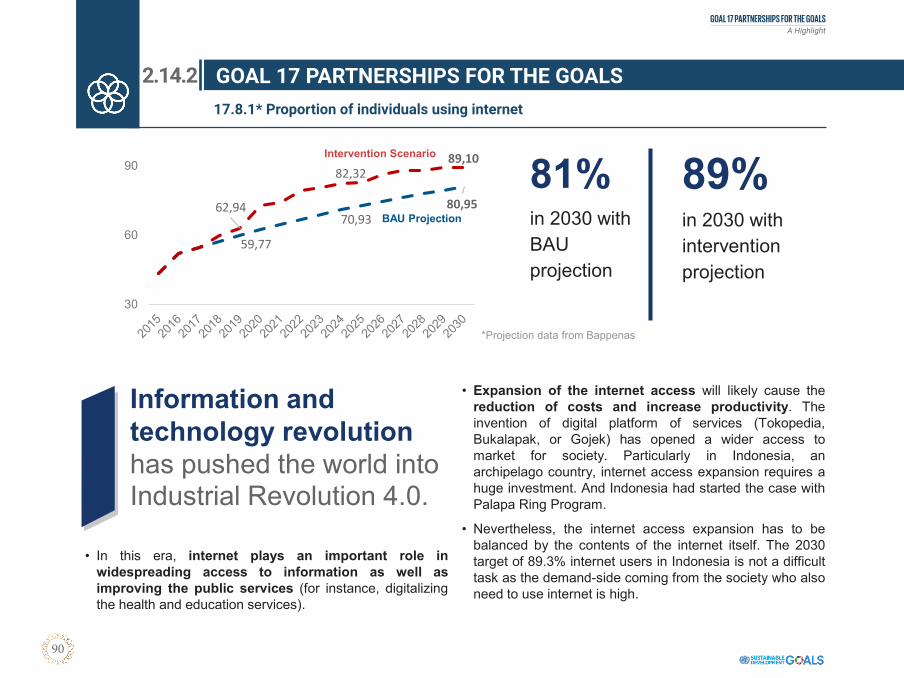
GOAL 17 PARTNERSHIPS FOR THE GOALSA Highlight
90
GOAL 17 PARTNERSHIPS FOR THE GOALS
59,77
70,9380,9562,94
82,3289,10
30
60
90
• Expansion of the internet access will likely cause thereduction of costs and increase productivity. Theinvention of digital platform of services (Tokopedia,Bukalapak, or Gojek) has opened a wider access tomarket for society. Particularly in Indonesia, anarchipelago country, internet access expansion requires ahuge investment. And Indonesia had started the case withPalapa Ring Program.
• Nevertheless, the internet access expansion has to bebalanced by the contents of the internet itself. The 2030target of 89.3% internet users in Indonesia is not a difficulttask as the demand-side coming from the society who alsoneed to use internet is high.
BAU Projection
Intervention Scenario
17.8.1* Proportion of individuals using internet
81%in 2030 with BAU projection
89%in 2030 with intervention projection
GOAL 17 PARTNERSHIPS FOR THE GOALS
• In this era, internet plays an important role inwidespreading access to information as well asimproving the public services (for instance, digitalizingthe health and education services).
Information and technology revolution has pushed the world into Industrial Revolution 4.0.
*Projection data from Bappenas
2.14.2. Proportion of individuals using internet (17.8.1*)
17.8.1* Proportion of individuals using internet
2.14.2
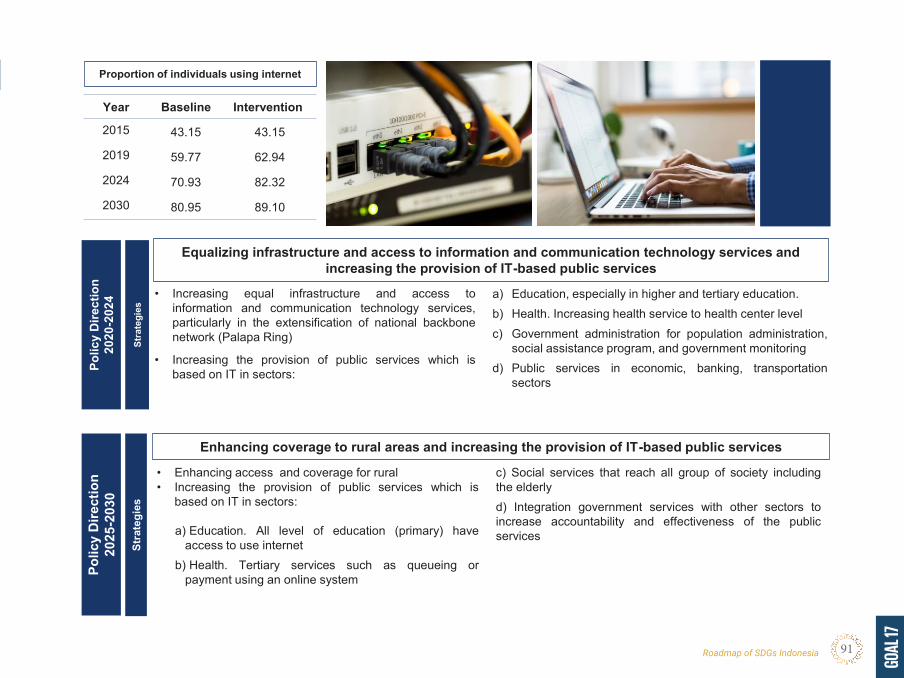
GOAL
17
Roadmap of SDGs Indonesia 91
GOAL 17 PARTNERSHIPS FOR THE GOALS GOAL 17 PARTNERSHIPS FOR THE GOALSPo
licy
Dire
ctio
n 20
20-2
024
Stra
tegi
es
• Increasing equal infrastructure and access toinformation and communication technology services,particularly in the extensification of national backbonenetwork (Palapa Ring)
• Increasing the provision of public services which isbased on IT in sectors:
Polic
y D
irect
ion
2025
-203
0
Stra
tegi
es
• Enhancing access and coverage for rural• Increasing the provision of public services which is
based on IT in sectors:
a) Education. All level of education (primary) haveaccess to use internet
b) Health. Tertiary services such as queueing orpayment using an online system
Enhancing coverage to rural areas and increasing the provision of IT-based public services
Year Baseline Intervention
2015 43.15 43.15
2019 59.77 62.94
2024 70.93 82.32
2030 80.95 89.10
Proportion of individuals using internet
Equalizing infrastructure and access to information and communication technology services and increasing the provision of IT-based public services
c) Social services that reach all group of society includingthe elderlyd) Integration government services with other sectors toincrease accountability and effectiveness of the publicservices
a) Education, especially in higher and tertiary education.b) Health. Increasing health service to health center levelc) Government administration for population administration,
social assistance program, and government monitoringd) Public services in economic, banking, transportation
sectors

3. CHAPTER 3 IN-TERLINKAGES OF 17 GOALS
CHAPTER 3
INTERLINKAGES OF17 GOALS

INTERLINKAGES of 17 GoalsChapter 3
94
INTRODUCTION
Since Indonesia adopted the SustainableDevelopment Goals (SDGs), there have been so manyconcerns on how the 17 goals and their targets areinterlinked with one to another. These concerns arosebecause Indonesia’s Development Plans are alwaysdesigned through a holistic approach, with theframework of Thematic, Holistic, Integrated, andSpatial (THIS), along with the fact that Indonesia is abig country consisting of thousands of islands withhundreds of cultural tribes.
It is undoubted that the implementation of SDGsrequests a more systematic policy design,comprehensive implementation strategies, and multi-stakeholder collaborations. All of these need to betranslated into such understanding of interlinkagesamong goals and targets into concrete results on theground.
Therefore, this chapter discusses the results ofdetailed mappings of interlinkages across some of theIndonesia’s SDG goals and targets. In practical terms,this chapter would be a good reference for all SDGsstakeholders to put their priorities and policy strategieson the goals and targets that can be the leverages ofthe other goals and targets.
How the 17 goals and their targets are interlinked with one to another
3 .1 . I n t r o d u c t i o n
3.1
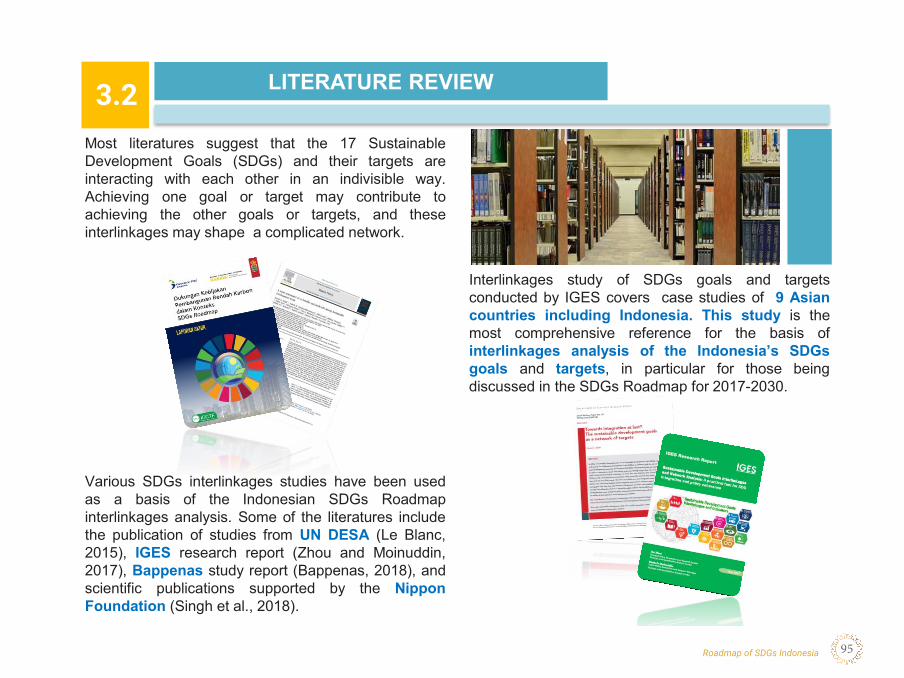
Roadmap of SDGs Indonesia 95
LITERATURE REVIEW
Most literatures suggest that the 17 SustainableDevelopment Goals (SDGs) and their targets areinteracting with each other in an indivisible way.Achieving one goal or target may contribute toachieving the other goals or targets, and theseinterlinkages may shape a complicated network.
Various SDGs interlinkages studies have been usedas a basis of the Indonesian SDGs Roadmapinterlinkages analysis. Some of the literatures includethe publication of studies from UN DESA (Le Blanc,2015), IGES research report (Zhou and Moinuddin,2017), Bappenas study report (Bappenas, 2018), andscientific publications supported by the NipponFoundation (Singh et al., 2018).
Interlinkages study of SDGs goals and targetsconducted by IGES covers case studies of 9 Asiancountries including Indonesia. This study is themost comprehensive reference for the basis ofinterlinkages analysis of the Indonesia’s SDGsgoals and targets, in particular for those beingdiscussed in the SDGs Roadmap for 2017-2030.
3 . 2 . L i t e r a t u r e R e v i e w
3.2

INTERLINKAGES of 17 GoalsChapter 3
96
METHODOLOGY
The interlinkages analysis of the Indonesia SDGs was undertaken through several stages.
Second stage was to select the study that is mostrelevant to the Indonesian development context. Thestudy of IGES was selected to be the basis for furtheranalysis for the Indonesian case. IGES conducted astudy using the social network analysis (SNA)method to develop a network of SDGs interlinkagesthat were able to describe the degree of centrality,eigenvector centrality, betweenness centrality, andcloseness centrality. Furthermore, the interlinkagesresults obtained from IGES methodology were takenand became the underpinning context for the nextstage of analysis.
First stage was a review of some reputable studies onSDGs interlinkages. The objective of this literaturereview was to "compare, contrast, criticize,synthesize, and summarize" of the variousmethodology and findings.
3 . 3 . M e t h o d o l o g y
3.3
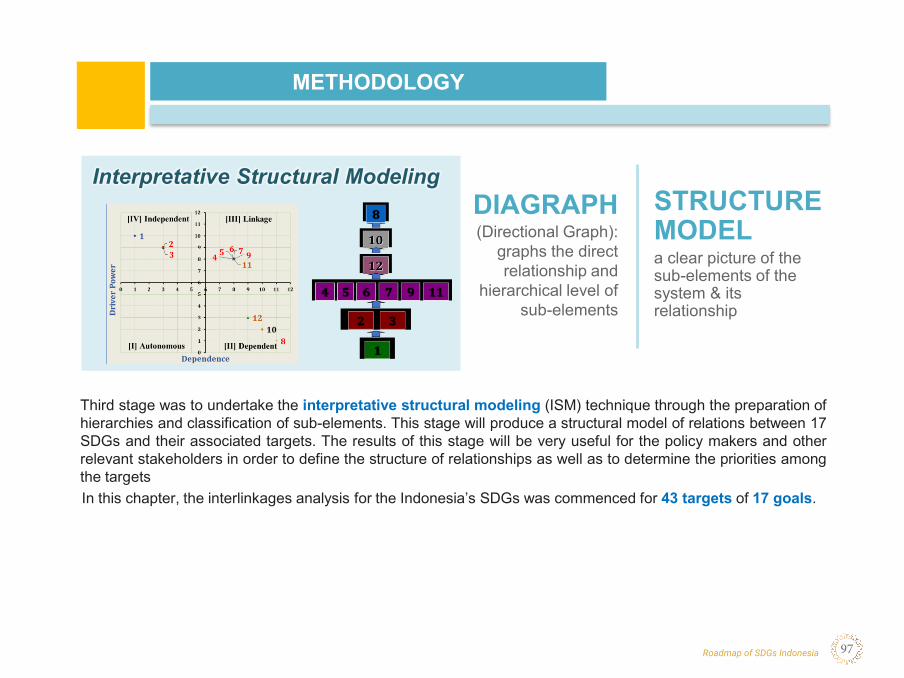
Roadmap of SDGs Indonesia 97
METHODOLOGY
Interpretative Structural ModelingDIAGRAPH(Directional Graph):
graphs the direct relationship and
hierarchical level of sub-elements
STRUCTURE MODELa clear picture of the sub-elements of the system & its relationship
Third stage was to undertake the interpretative structural modeling (ISM) technique through the preparation ofhierarchies and classification of sub-elements. This stage will produce a structural model of relations between 17SDGs and their associated targets. The results of this stage will be very useful for the policy makers and otherrelevant stakeholders in order to define the structure of relationships as well as to determine the priorities amongthe targetsIn this chapter, the interlinkages analysis for the Indonesia’s SDGs was commenced for 43 targets of 17 goals.
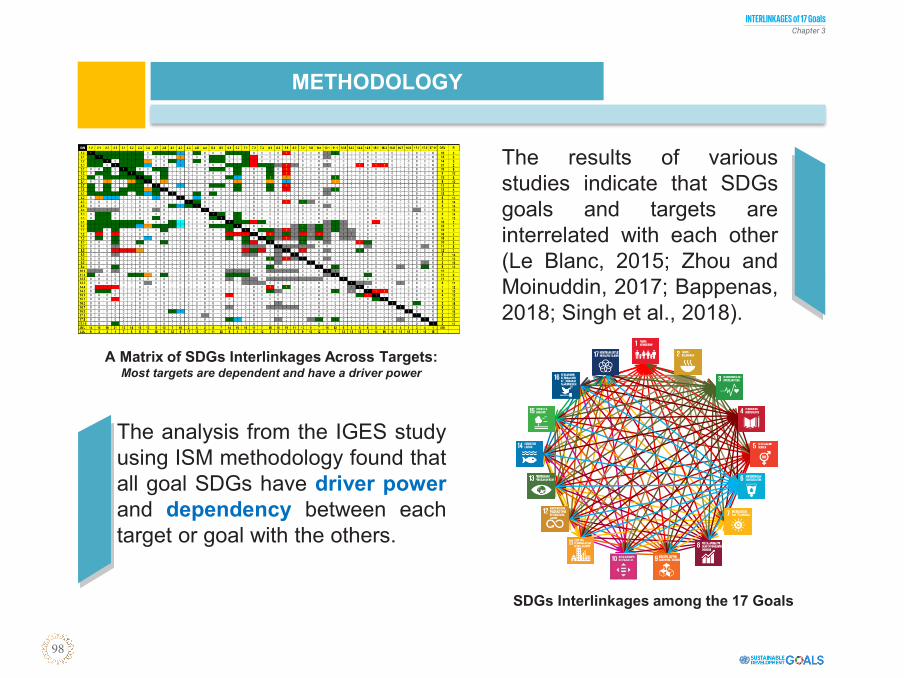
INTERLINKAGES of 17 GoalsChapter 3
98
SDGs Interlinkages among the 17 Goals
The results of variousstudies indicate that SDGsgoals and targets areinterrelated with each other(Le Blanc, 2015; Zhou andMoinuddin, 2017; Bappenas,2018; Singh et al., 2018).
A Matrix of SDGs Interlinkages Across Targets:Most targets are dependent and have a driver power
The analysis from the IGES studyusing ISM methodology found thatall goal SDGs have driver powerand dependency between eachtarget or goal with the others.
METHODOLOGY
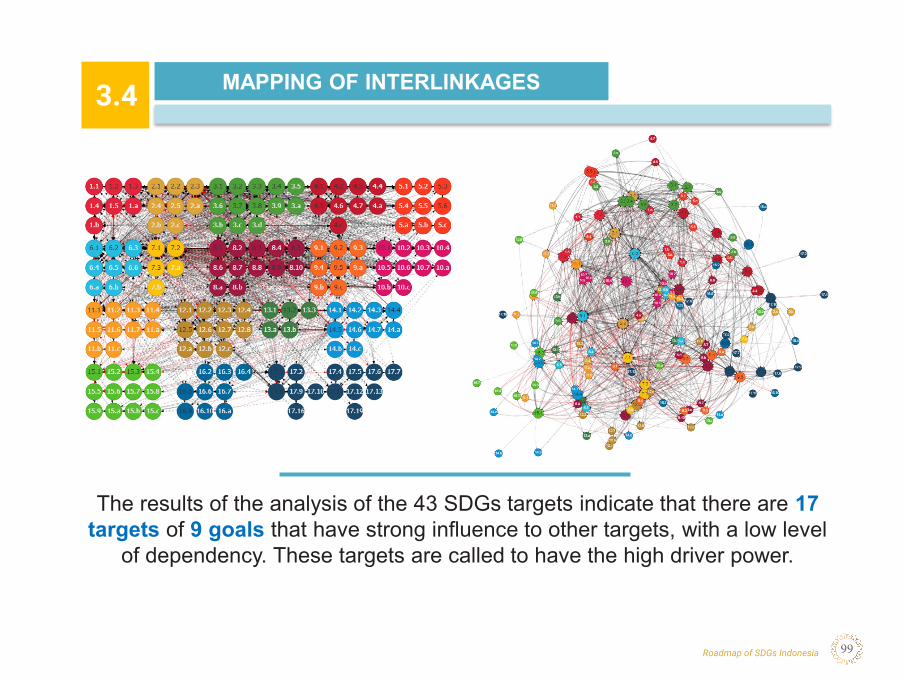
Roadmap of SDGs Indonesia 99
MAPPING OF INTERLINKAGES
The results of the analysis of the 43 SDGs targets indicate that there are 17targets of 9 goals that have strong influence to other targets, with a low level
of dependency. These targets are called to have the high driver power.
3 . 4 . M a p p i n g o f I n t e r l i n k a g e s
3.4

INTERLINKAGES of 17 GoalsChapter 3
100
MAPPING OF INTERLINKAGES
Diagraph (Directional Graph)describes the classification of SDGs targets based on driver power and dependence
Four Quadran of Diagraph Between SDGs Targets
• Sector 1: weak driver-weak dependent variables(autonomous) shows SDGs targets that haverelatively low relation to other SDGs targets, eventhough the relationship can be strong.
• Sector 2: weak driver-strongly dependent variables(dependent) show that the SDGs targets are not freebecause they have a relatively high dependence onother SDGs targets.
• Sector 3: strong driver-strongly dependent variables(linkage) show that the SDGs targets have relativelyhigh influence and dependence on other SDGstargets.
• Sector 4: strong driver-weak dependent variables(independent) indicate SDGs targets that have highinfluence and have low dependence on other SDGstargets.
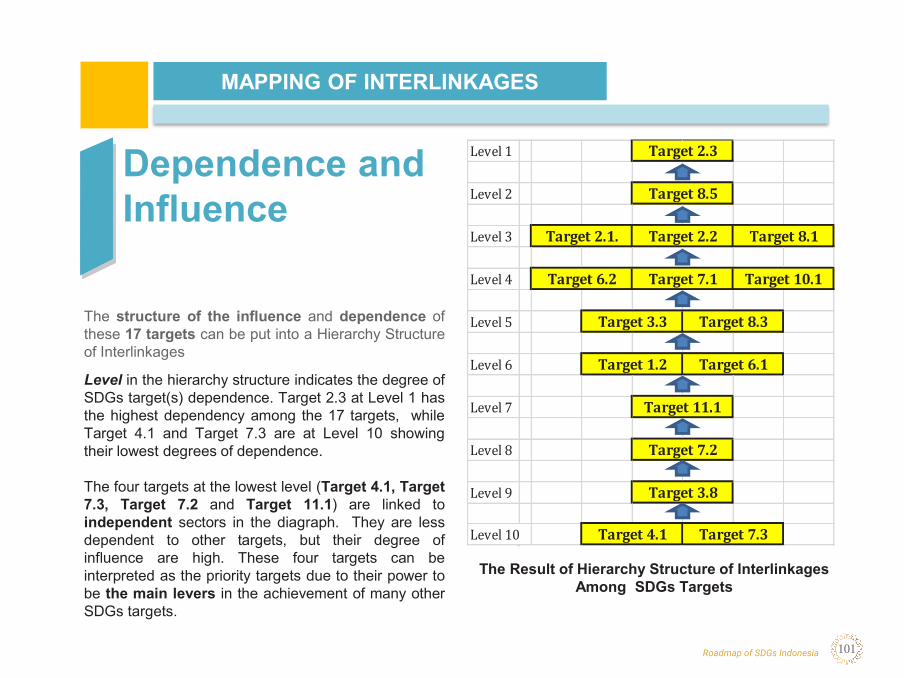
Roadmap of SDGs Indonesia 101
MAPPING OF INTERLINKAGES
Target 6.2 Target 7.1 Target 10.1
Target 3.3 Target 8.3
Target 11.1
Target 7.2
Target 3.8
Target 2.1. Target 2.2 Target 8.1
Target 4.1 Target 7.3
Target 2.3
Target 1.2 Target 6.1
Target 8.5
The Result of Hierarchy Structure of Interlinkages Among SDGs Targets
Dependence and Influence
Level in the hierarchy structure indicates the degree ofSDGs target(s) dependence. Target 2.3 at Level 1 hasthe highest dependency among the 17 targets, whileTarget 4.1 and Target 7.3 are at Level 10 showingtheir lowest degrees of dependence.
The four targets at the lowest level (Target 4.1, Target7.3, Target 7.2 and Target 11.1) are linked toindependent sectors in the diagraph. They are lessdependent to other targets, but their degree ofinfluence are high. These four targets can beinterpreted as the priority targets due to their power tobe the main levers in the achievement of many otherSDGs targets.
The structure of the influence and dependence ofthese 17 targets can be put into a Hierarchy Structureof Interlinkages
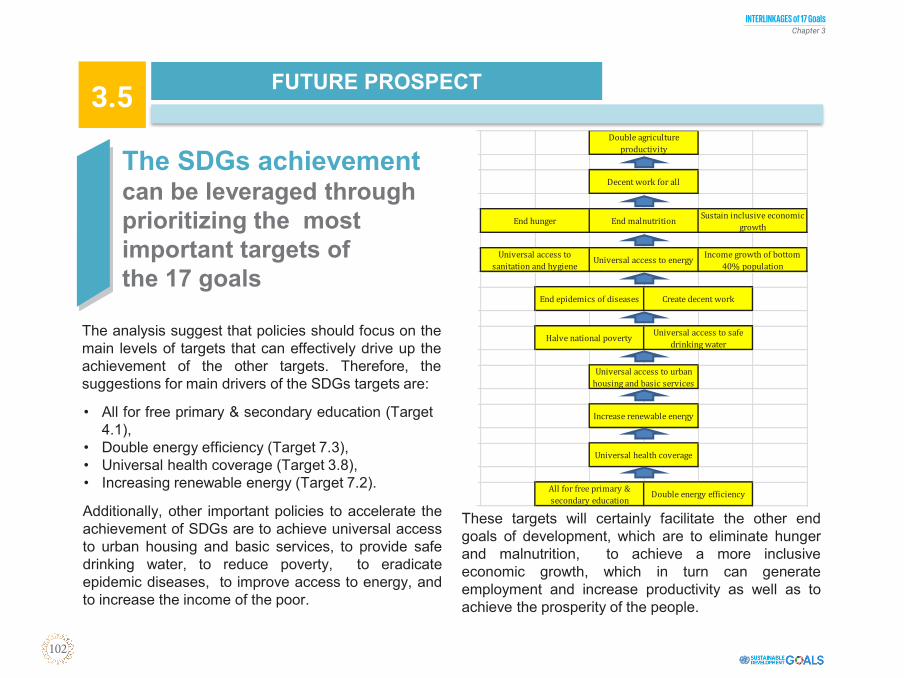
INTERLINKAGES of 17 GoalsChapter 3
102
FUTURE PROSPECT
The SDGs achievement can be leveraged through prioritizing the most important targets of the 17 goals
The analysis suggest that policies should focus on themain levels of targets that can effectively drive up theachievement of the other targets. Therefore, thesuggestions for main drivers of the SDGs targets are:
These targets will certainly facilitate the other endgoals of development, which are to eliminate hungerand malnutrition, to achieve a more inclusiveeconomic growth, which in turn can generateemployment and increase productivity as well as toachieve the prosperity of the people.
• All for free primary & secondary education (Target4.1),
• Double energy efficiency (Target 7.3),• Universal health coverage (Target 3.8),• Increasing renewable energy (Target 7.2).
Additionally, other important policies to accelerate theachievement of SDGs are to achieve universal accessto urban housing and basic services, to provide safedrinking water, to reduce poverty, to eradicateepidemic diseases, to improve access to energy, andto increase the income of the poor.
3 . 5 . F u t u r e P r o s p e c t
3.5

Roadmap of SDGs Indonesia 103
4. CHAPTER 4 SDGS FINANC-ING STRATEGYCHAPTER 4
SDGsFINANCING STRATEGY
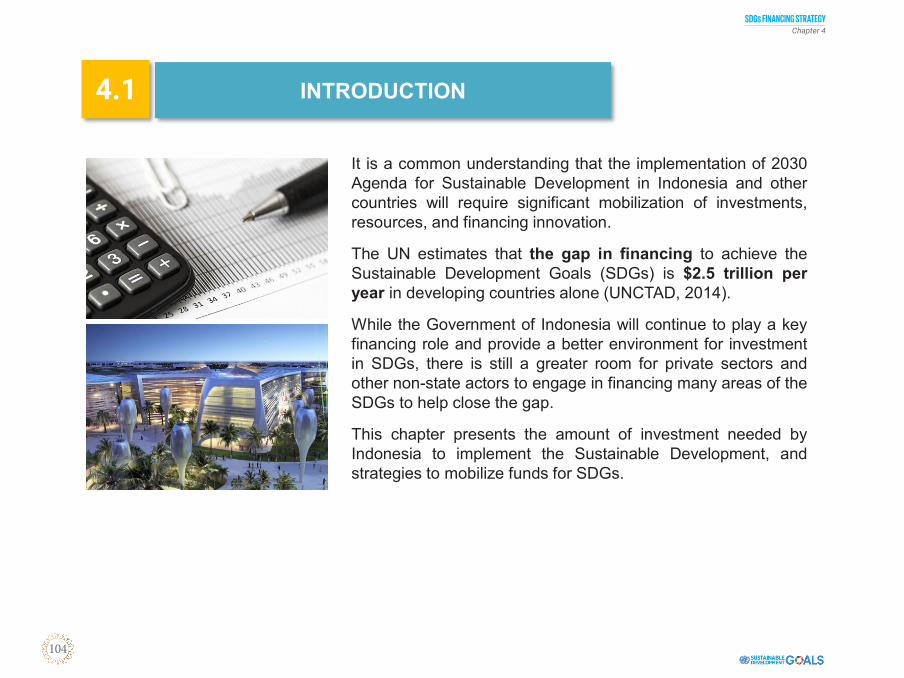
SDGs FINANCING STRATEGYChapter 4
104
INTRODUCTION
It is a common understanding that the implementation of 2030Agenda for Sustainable Development in Indonesia and othercountries will require significant mobilization of investments,resources, and financing innovation.
The UN estimates that the gap in financing to achieve theSustainable Development Goals (SDGs) is $2.5 trillion peryear in developing countries alone (UNCTAD, 2014).
While the Government of Indonesia will continue to play a keyfinancing role and provide a better environment for investmentin SDGs, there is still a greater room for private sectors andother non-state actors to engage in financing many areas of theSDGs to help close the gap.
This chapter presents the amount of investment needed byIndonesia to implement the Sustainable Development, andstrategies to mobilize funds for SDGs.
4 .1 . I n t r o d u c t i o n
4.1
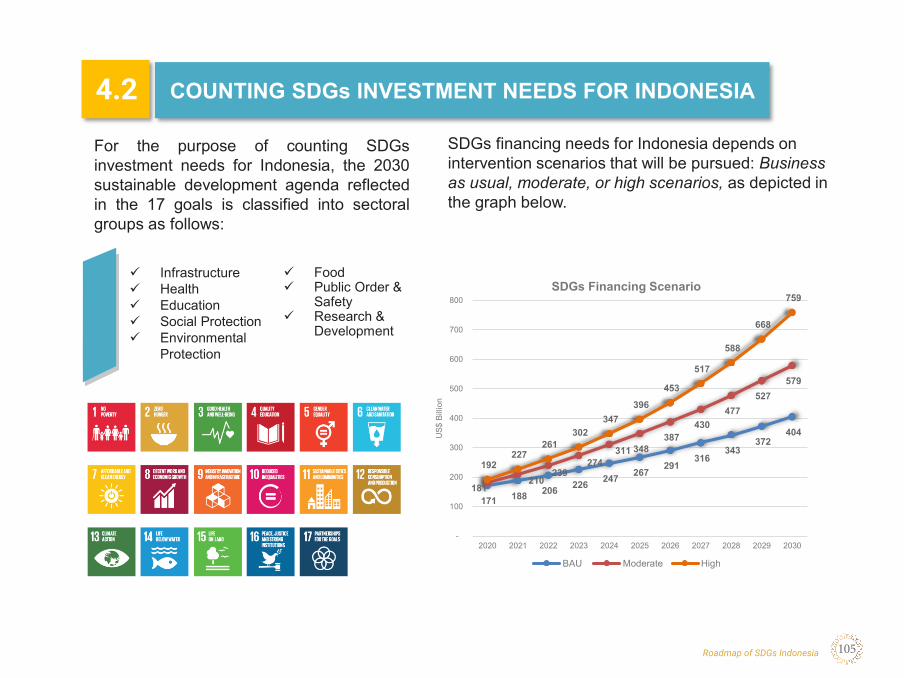
Roadmap of SDGs Indonesia 105
COUNTING SDGs INVESTMENT NEEDS FOR INDONESIA
✓ Food ✓ Public Order &
Safety✓ Research &
Development
For the purpose of counting SDGsinvestment needs for Indonesia, the 2030sustainable development agenda reflectedin the 17 goals is classified into sectoralgroups as follows:
✓ Infrastructure✓ Health✓ Education✓ Social Protection✓ Environmental
Protection
SDGs financing needs for Indonesia depends on intervention scenarios that will be pursued: Business as usual, moderate, or high scenarios, as depicted in the graph below.
171 188 206 226 247 267 291
316 343
372 404
181 210
239 274
311 348 387
430 477
527 579
192 227
261 302
347 396
453
517
588
668
759
-
100
200
300
400
500
600
700
800
2020 2021 2022 2023 2024 2025 2026 2027 2028 2029 2030
US$
Bill
ion
SDGs Financing Scenario
BAU Moderate High
4 . 2 . C o u n t i n g S D G s I n v e s t m e n t N e e d s f o r I n d o n e s i a
4.2
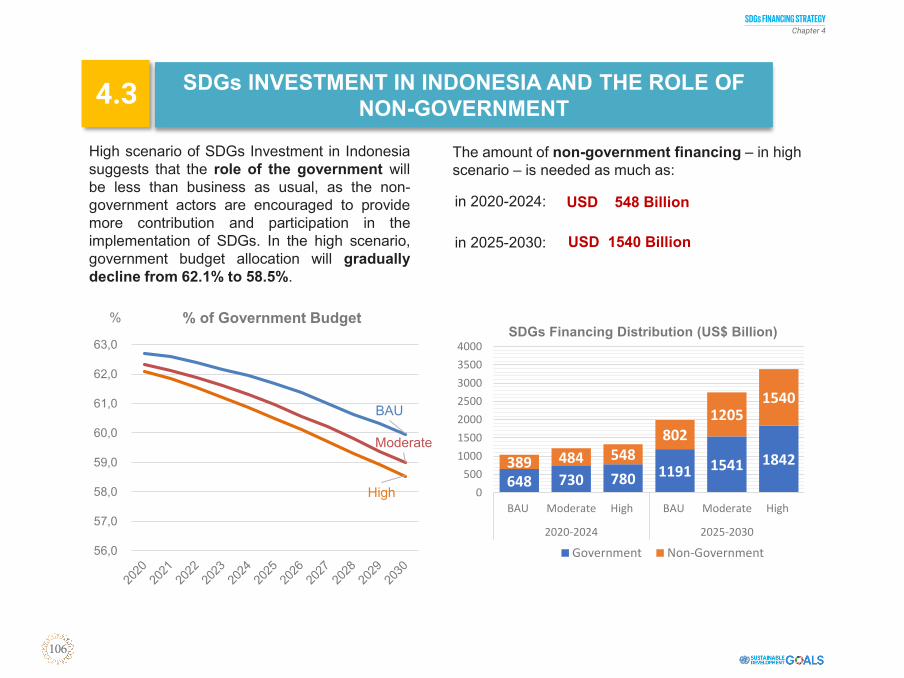
SDGs FINANCING STRATEGYChapter 4
106
SDGs INVESTMENT IN INDONESIA AND THE ROLE OF NON-GOVERNMENT
High scenario of SDGs Investment in Indonesiasuggests that the role of the government willbe less than business as usual, as the non-government actors are encouraged to providemore contribution and participation in theimplementation of SDGs. In the high scenario,government budget allocation will graduallydecline from 62.1% to 58.5%.
BAU
Moderate
High
56,0
57,0
58,0
59,0
60,0
61,0
62,0
63,0
% % of Government Budget
The amount of non-government financing – in high scenario – is needed as much as:
USD 548 Billionin 2020-2024:
USD 1540 Billionin 2025-2030:
648 730 780 1191 1541 1842389 484 548802
12051540
0500
1000150020002500300035004000
BAU Moderate High BAU Moderate High
2020-2024 2025-2030
SDGs Financing Distribution (US$ Billion)
Government Non-Government
4 . 3 . S D G s I n v e s t m e n t i n I n d o n e s i a a n d t h e R o l e o f N o n - G o v e r n m e n t
4.3
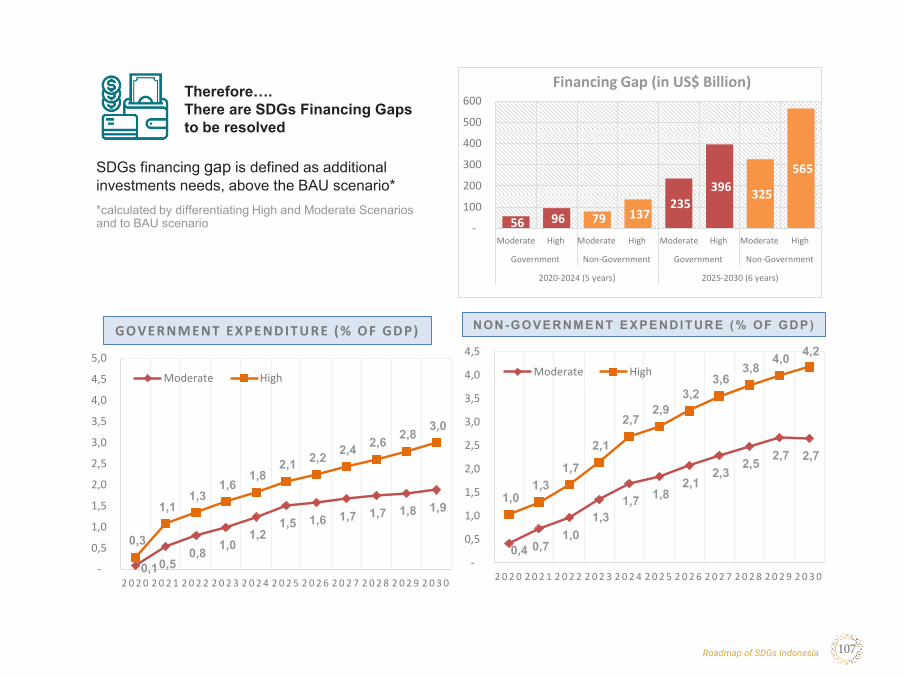
Roadmap of SDGs Indonesia 107
Therefore….There are SDGs Financing Gaps to be resolved
*calculated by differentiating High and Moderate Scenarios and to BAU scenario
SDGs financing gap is defined as additional investments needs, above the BAU scenario*
0,1 0,5 0,8 1,0
1,2 1,5 1,6 1,7 1,7 1,8 1,9
0,3
1,1 1,3
1,6 1,8
2,1 2,2 2,4 2,6 2,8 3,0
-
0,5
1,0
1,5
2,0
2,5
3,0
3,5
4,0
4,5
5,0
2 0 2 0 2 0 2 1 2 0 2 2 2 0 2 3 2 0 2 4 2 0 2 5 2 0 2 6 2 0 2 7 2 0 2 8 2 0 2 9 2 0 3 0
Moderate High
0,4 0,7 1,0
1,3 1,7 1,8
2,1 2,3
2,5 2,7 2,7
1,0 1,3
1,7
2,1
2,7 2,9
3,2 3,6
3,8 4,0 4,2
-
0,5
1,0
1,5
2,0
2,5
3,0
3,5
4,0
4,5
2 0 2 0 2 0 2 1 2 0 2 2 2 0 2 3 2 0 2 4 2 0 2 5 2 0 2 6 2 0 2 7 2 0 2 8 2 0 2 9 2 0 3 0
Moderate High
56 96 79 137 235
396 325
565
-
100
200
300
400
500
600
Moderate High Moderate High Moderate High Moderate High
Government Non-Government Government Non-Government
2020-2024 (5 years) 2025-2030 (6 years)
Financing Gap (in US$ Billion)
NON-GOVERNM ENT EXPENDITURE (% OF GDP)GOVER NM ENT EX PENDIT U R E (% OF GDP)
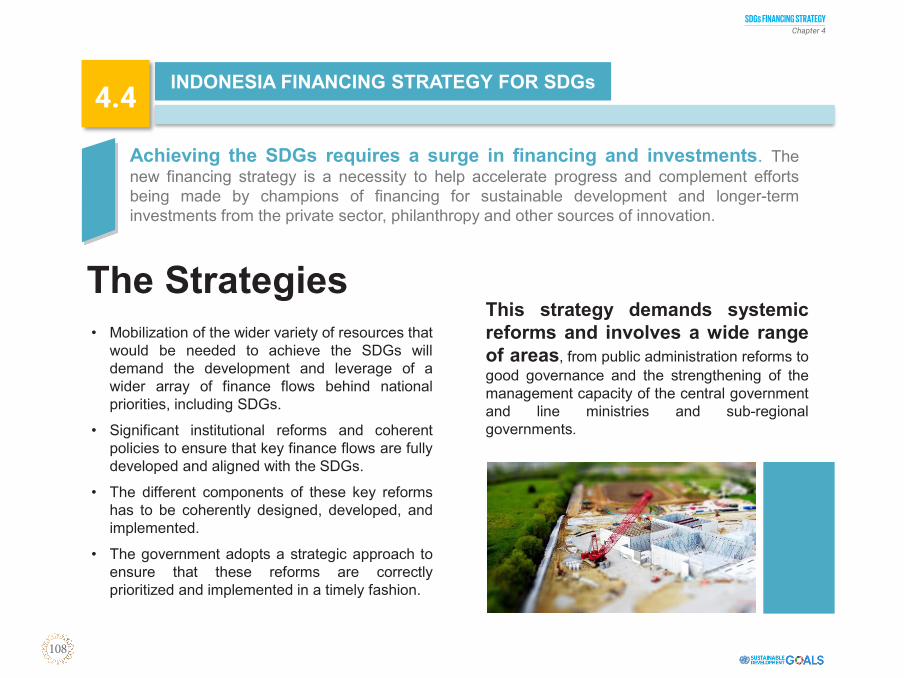
SDGs FINANCING STRATEGYChapter 4
108
INDONESIA FINANCING STRATEGY FOR SDGs
Achieving the SDGs requires a surge in financing and investments. Thenew financing strategy is a necessity to help accelerate progress and complement effortsbeing made by champions of financing for sustainable development and longer-terminvestments from the private sector, philanthropy and other sources of innovation.
• Mobilization of the wider variety of resources thatwould be needed to achieve the SDGs willdemand the development and leverage of awider array of finance flows behind nationalpriorities, including SDGs.
• Significant institutional reforms and coherentpolicies to ensure that key finance flows are fullydeveloped and aligned with the SDGs.
• The different components of these key reformshas to be coherently designed, developed, andimplemented.
• The government adopts a strategic approach toensure that these reforms are correctlyprioritized and implemented in a timely fashion.
This strategy demands systemicreforms and involves a wide rangeof areas, from public administration reforms togood governance and the strengthening of themanagement capacity of the central governmentand line ministries and sub-regionalgovernments.
The Strategies
4 . 4 . I n d o n e s i a F i n a n c i n g S t r a t e g y f o r S D G s
4.4
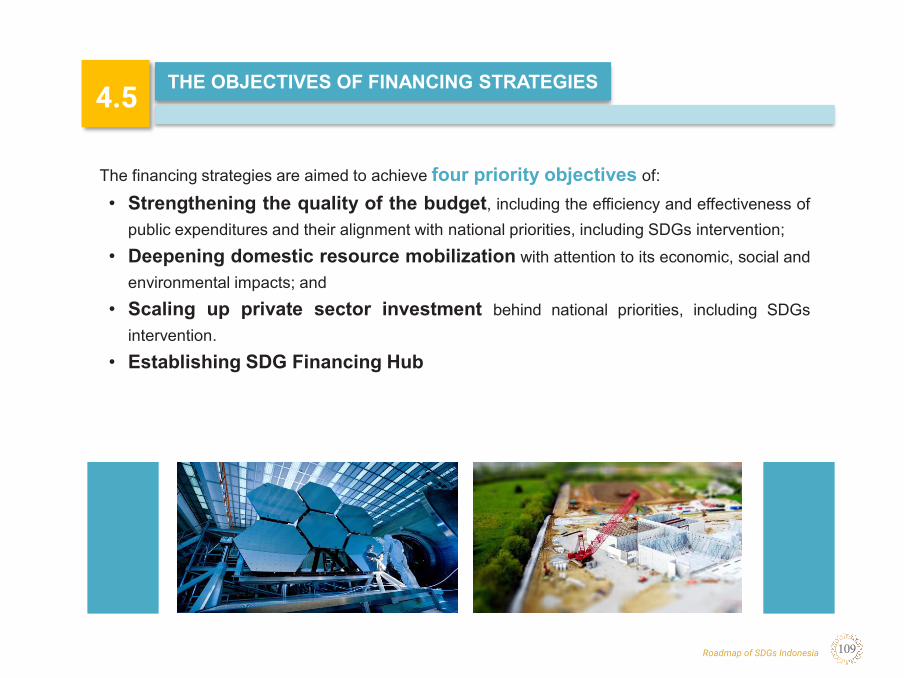
Roadmap of SDGs Indonesia 109
THE OBJECTIVES OF FINANCING STRATEGIES
The financing strategies are aimed to achieve four priority objectives of:
• Strengthening the quality of the budget, including the efficiency and effectiveness ofpublic expenditures and their alignment with national priorities, including SDGs intervention;
• Deepening domestic resource mobilization with attention to its economic, social andenvironmental impacts; and
• Scaling up private sector investment behind national priorities, including SDGsintervention.
• Establishing SDG Financing Hub
4 . 5 . T h e O b j e c t i v e s o f F i n a n c i n g S t r a t e g i e s
4.5
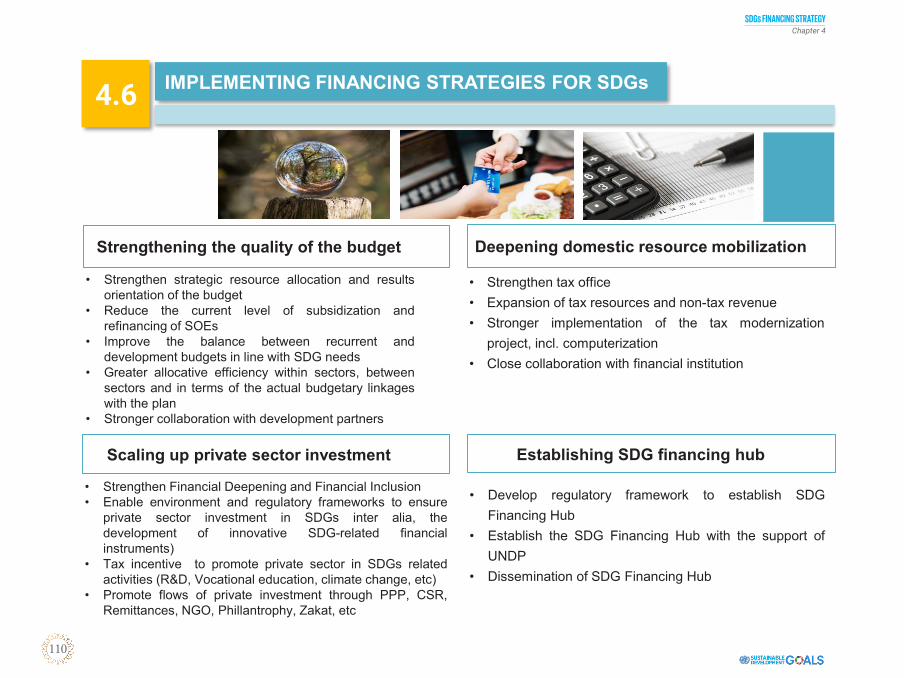
SDGs FINANCING STRATEGYChapter 4
110
Strengthening the quality of the budget Deepening domestic resource mobilization
Scaling up private sector investment Establishing SDG financing hub
• Strengthen strategic resource allocation and resultsorientation of the budget
• Reduce the current level of subsidization andrefinancing of SOEs
• Improve the balance between recurrent anddevelopment budgets in line with SDG needs
• Greater allocative efficiency within sectors, betweensectors and in terms of the actual budgetary linkageswith the plan
• Stronger collaboration with development partners
• Strengthen tax office• Expansion of tax resources and non-tax revenue• Stronger implementation of the tax modernization
project, incl. computerization• Close collaboration with financial institution
• Strengthen Financial Deepening and Financial Inclusion• Enable environment and regulatory frameworks to ensure
private sector investment in SDGs inter alia, thedevelopment of innovative SDG-related financialinstruments)
• Tax incentive to promote private sector in SDGs relatedactivities (R&D, Vocational education, climate change, etc)
• Promote flows of private investment through PPP, CSR,Remittances, NGO, Phillantrophy, Zakat, etc
• Develop regulatory framework to establish SDGFinancing Hub
• Establish the SDG Financing Hub with the support ofUNDP
• Dissemination of SDG Financing Hub
IMPLEMENTING FINANCING STRATEGIES FOR SDGs
4 . 6 . I m p l e m e n t i n g F i n a n c i n g S t r a t e g i e s f o r S D G s
4.6
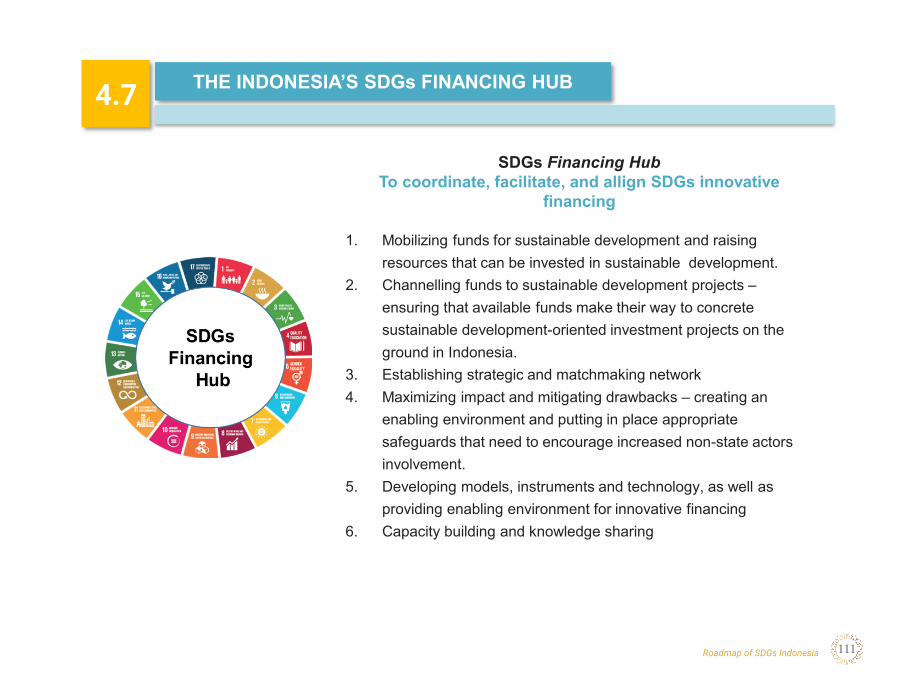
Roadmap of SDGs Indonesia 111
THE INDONESIA’S SDGs FINANCING HUB
SDGs Financing HubTo coordinate, facilitate, and allign SDGs innovative
financing
1. Mobilizing funds for sustainable development and raising resources that can be invested in sustainable development.
2. Channelling funds to sustainable development projects –ensuring that available funds make their way to concrete sustainable development-oriented investment projects on the ground in Indonesia.
3. Establishing strategic and matchmaking network4. Maximizing impact and mitigating drawbacks – creating an
enabling environment and putting in place appropriate safeguards that need to encourage increased non-state actors involvement.
5. Developing models, instruments and technology, as well as providing enabling environment for innovative financing
6. Capacity building and knowledge sharing
4 . 7. T h e I n d o n e s i a ’s S D G s F i n a n c i n g H U B
4.7
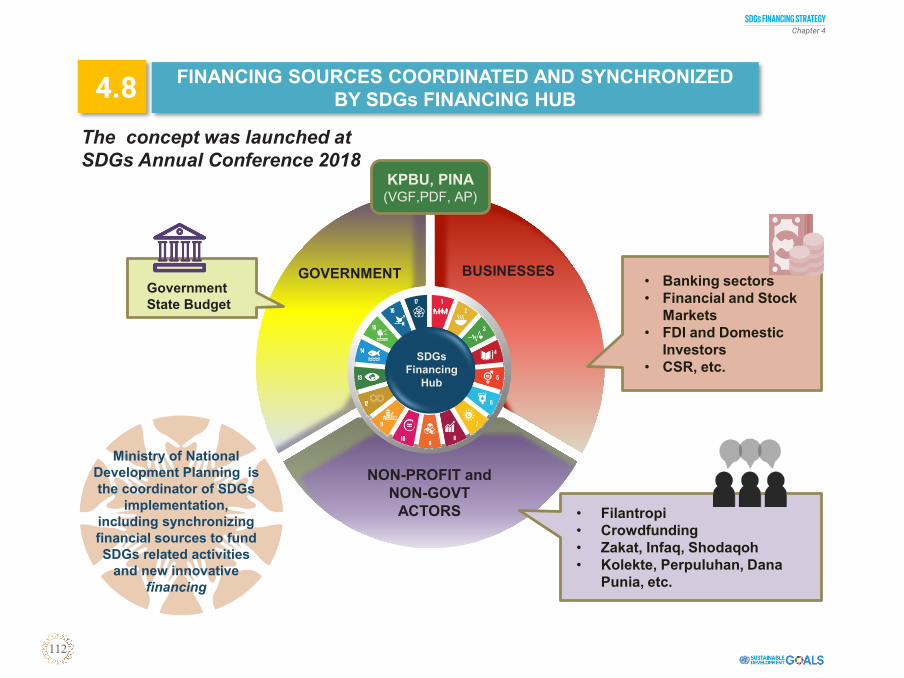
SDGs FINANCING STRATEGYChapter 4
112
FINANCING SOURCES COORDINATED AND SYNCHRONIZED BY SDGs FINANCING HUB
GOVERNMENT
NON-PROFIT and NON-GOVT
ACTORS
BUSINESSES• Banking sectors• Financial and Stock
Markets• FDI and Domestic
Investors• CSR, etc.
• Filantropi• Crowdfunding• Zakat, Infaq, Shodaqoh• Kolekte, Perpuluhan, Dana
Punia, etc.
Government State Budget
KPBU, PINA(VGF,PDF, AP)
Ministry of National Development Planning is the coordinator of SDGs
implementation, including synchronizing financial sources to fund SDGs related activities
and new innovative financing
The concept was launched at SDGs Annual Conference 2018
SDGs Financing
Hub
4 . 8 . F i n a n c i n g S o u r c e s C o o r d i n a t e d a n d S y n c h r o n i z e d b y S D G s F i n a n c i n g H U B
4.8
Roadmap of SDGs Indonesia 113
5. CHAPTER 5 THE WAY FORWARDCHAPTER 5
THE WAY FORWARD
THE WAY FORWARDChapter 5
114
Accomplishing SDGs is also accomplishing the Indonesia’s development agenda. Indonesia is putting itsbest effort to mainstream SDGs into its development policies and targets, and to ensure its implementationon the ground. These ambitious goals must be achieved, but it needs collaborative actions amongstakeholders, shared contribution, as well as innovative approaches and strategies.
The roadmap of SDGs Indonesia is an important vehicle for Indonesia’s SDGs stakeholders in reaching thesame goals and missions, with clear targets and directions. The roadmap shall be an important document,showing the high commitment of Indonesia to bring the 2030 agenda into the next development plan andinto the reality. Indonesia is confident to achieve such targets, albeit remaining issues in hands, and thesestill need to be addressed carefully.
The interlinkages of SDGs targets and indicators presented in the roadmap shall be the basis for policy-makers and stakeholders to put their intervention priorities. Besides, it is essential to convince thatachieving certain targets of SDGs will be the leverage of other targets’ achievements. Therefore, eachtarget and indicator cannot be treated individually, but it needs a comprehensive framework of policyintervention.
Furthermore, Indonesia is fully aware that the implementation of SDGs needs huge sources of financing. Amagnificent financing strategy is a must, while supporting the creative and innovating financing to developis also a necessity. Financing resource mobilization will also be the key to the successful implementation ofthe 2030 agenda.
Apart from that, Indonesia will always put its best to the successful achievement of 2030 agenda!
THE WAY FORWARD
5 .1 . T h e W a y F o r w a r d
5.1
** all pictures/photos are taken from pexels.com
Related Documents


