A3025378 ROADING ASSET MANAGEMENT PLAN 2020

Welcome message from author
This document is posted to help you gain knowledge. Please leave a comment to let me know what you think about it! Share it to your friends and learn new things together.
Transcript
A3025378
ROADING
ASSET MANAGEMENT PLAN 2020

A3025378 Roading Asset Management Plan 2020
Roading Asset Management Plan 2020 A3025378
Asset Management Plan
Activity Roading
Name Signature Date
Prepared By ICC Roading Assets Team
Asset Manager Russell Pearson
Group Manager Review
Peer Review
Council Adoption

Roading Asset Management Plan 2020 A3025378
Changes to be incorporated in Next Review
Number Date of Change Reason for Change 1
2
Roading Asset Management Plan 2020 A3025378 5
TABLE OF CONTENTS 3
Changes to be incorporated in Next Review ...................................................................... 4 Executive Summary ........................................................................................................... 20 1. Introduction to the AMP ............................................................................................ 27 1.1 Purpose of the AMP .................................................................................................... 27
1.2 Rationale for the Activity .............................................................................................. 28
2. Strategic Context....................................................................................................... 30 2.1 Overview .................................................................................................................. 30
2.2 National Context .......................................................................................................... 31
2.2.1 Ministry of Transport Strategic Outcomes Framework ...................................... 31
2.2.2 Government Policy Statement on Land Transport (GPS) ................................. 32
2.2.3 Waka Kotahi NZ Transport Agency Context ..................................................... 34
2.2.4 One Network Road Classification (ONRC) ....................................................... 38
2.3 Southland Regional Context ........................................................................................ 40
2.4 Invercargill City Context .............................................................................................. 42
2.4.1 Invercargill Today............................................................................................. 42
2.4.2 Transport System Overview ............................................................................. 42
2.4.3 Long Term Plan (LTP) ..................................................................................... 45
2.4.4 30 Year Infrastructure Strategy ........................................................................ 47
2.5 Strategic Assessment .................................................................................................. 49
2.5.1 Alignment with Strategic Context ..................................................................... 49
2.5.2 Business Case Approach ................................................................................. 52
2.5.3 Strategic Issues and Challenges ...................................................................... 53
2.5.4 Problems, Benefits and Consequences ........................................................... 53
2.5.5 Desired Outcomes ........................................................................................... 56
2.6 The Evidence Base ..................................................................................................... 58
2.6.1 Safety .............................................................................................................. 58
2.6.2 Asset Condition and Performance .................................................................... 62
2.6.3 Resilience and Climate Change ....................................................................... 74
2.6.4 Accessibility ..................................................................................................... 75
2.7 Strategic Responses ................................................................................................... 77
2.7.1 Safety .............................................................................................................. 78
2.7.2 Asset condition and performance ..................................................................... 79
2.7.3 Resilience and Climate Change ....................................................................... 79
2.7.4 Accessibility ..................................................................................................... 80
2.8 Strategic Case Summary............................................................................................. 81
Roading Asset Management Plan 2020 A3025378
6
2.9 Key Assumptions ........................................................................................................ 86
2.9.1 Internal, Financial and External Factors ........................................................... 86
2.9.2 Other Assumptions .......................................................................................... 99
2.9.3. Key Messages ................................................................................................. 99
3. The Service We Provide .......................................................................................... 100 3.1 Customer Profile ....................................................................................................... 100
3.1.1 Our Stakeholders and Community ................................................................. 100
3.1.2 How We Engage our Communities ................................................................ 101
3.1.3 Community Research .................................................................................... 102
3.1.4 Key Service Attributes Valued by Customers ................................................. 102
3.2 Service Drivers .......................................................................................................... 103
3.2.1 Community Expectations ............................................................................... 103
3.2.2 Legislative Requirements ............................................................................... 104
3.2.3 Industry Standards and Guidelines ................................................................ 105
3.3 Levels of Service ....................................................................................................... 107
3.3.1 Alignment of Customer Levels of Service with Community Outcomes............ 107
3.3.2 Customer Levels of Service ........................................................................... 108
3.3.3 How Did We Measure Up in the Last Year ..................................................... 110
3.3.4 ONRC Technical Levels of Service ................................................................ 111
3.4 Levels of Service Issues and Challenges .................................................................. 112
3.4.1 Current Levels of Service Gaps and Possible Responses .............................. 112
3.4.2 Level of Service Target Trends ...................................................................... 115
4. Demand for Our Services ....................................................................................... 117 4.1 Demand Forecast ...................................................................................................... 117
4.1.1 Factors Influencing Demand .......................................................................... 117
4.1.2 Projected Growth or Decline in Demand for the Service ................................ 119
4.2 Changes in Service Expectations (Future Levels of Service) ..................................... 120
4.3 Expected Implications for the Activity ........................................................................ 120
4.4 Future Demand Issues and Challenges ..................................................................... 122
4.4.1 Possible Asset-related Demand Responses .................................................. 123
4.4.2 Non-Asset Solutions ...................................................................................... 124
4.4.3 Managing Expectations .................................................................................. 124
4.4.4 Key Messages – Demand .............................................................................. 124
5. Asset Profile ............................................................................................................ 126 5.1 Asset Overview ......................................................................................................... 126
5.2 Asset Description ...................................................................................................... 126
5.2.1 Network Characteristics ................................................................................. 128
5.2.2 Traffic Volumes .............................................................................................. 129
Roading Asset Management Plan 2020 A3025378
7
5.2.2 Sealed Pavements ......................................................................................... 131
5.2.3 Unsealed Pavements ..................................................................................... 134
5.2.4 Kerb and Channel / Surface Water Channels / Drainage Culverts ................. 134
5.2.5 Footpaths and Cycleways .............................................................................. 137
5.2.6 Traffic Services .............................................................................................. 139
5.2.7 Structures ...................................................................................................... 142
5.2.8 Carparking ..................................................................................................... 144
5.2.9 Other Assets .................................................................................................. 145
5.2.10 Public Transport Assets ................................................................................. 145
5.3 Critical Assets ........................................................................................................... 146
5.3.1 Asset Criticality Criteria .................................................................................. 146
5.3.2 Identification of Critical Assets ....................................................................... 147
5.4 Asset Condition ......................................................................................................... 148
5.4.1 Condition Inspections and Surveys ................................................................ 148
5.4.2 Sealed Roads Condition ................................................................................ 148
5.4.3 Footpaths Condition ....................................................................................... 153
5.4.4 Structures Condition ...................................................................................... 154
5.4.5 Traffic Services Condition .............................................................................. 155
5.4.6 Condition Monitoring Frequencies .................................................................. 155
5.5 Asset Capacity and Performance .............................................................................. 155
5.5.1 Network Performance .................................................................................... 155
5.5.2 Asset Capacity and Utilisation ........................................................................ 156
5.6 Road Safety .............................................................................................................. 157
5.6.1 Crash Trends ................................................................................................. 157
5.6.2 ONRC Comparisons ...................................................................................... 160
5.6.3 Summary of Key Road Safety Issues ............................................................. 160
5.7 Summary of Asset Trends, Issues and Challenges ................................................... 161
6. Sustainability, Risk and Resilience ........................................................................ 163 6.1 Sustainability ............................................................................................................. 163
6.1.1 Social and Cultural ......................................................................................... 163
6.1.2 Environmental ................................................................................................ 164
6.1.3 Climate Change ............................................................................................. 164
6.1.4 Economic and Financial ................................................................................. 164
6.1.6 Summary of Sustainability Challenges and Issues ......................................... 165
6.2 Risk ……… ............................................................................................................ 165
6.2.1 Risk Framework / Standard ............................................................................ 165
6.2.3 Critical Assets Decision-Making ..................................................................... 166
6.2.4 Risk Identification and Assessment ................................................................ 166
Roading Asset Management Plan 2020 A3025378
8
6.2.5 Summary of Key Risk Issues ......................................................................... 167
6.2.6 Possible Approaches to Risk Mitigation ......................................................... 167
6.3 Resilience ................................................................................................................ 167
6.3.1 Resilience Definition ...................................................................................... 167
6.3.2 Business Continuity and Emergency Response Arrangements ...................... 168
6.3.3 Current and Desired Resilience Assessment ................................................. 169
6.3.4 Summary of Resilience Issues and Challenges ............................................. 169
6.4 Negative Effects ........................................................................................................ 169
7. Managing Our Activities (Programme Business Case) ........................................ 174 7.1 Responding to the Issues and Challenges ................................................................ 174
7.1.1 Strategic Responses ...................................................................................... 174
7.1.2 Investment Areas ........................................................................................... 174
7.1.3 Investment Approach ..................................................................................... 175
7.1.4 Programme Case Evaluation ......................................................................... 178
7.2 Lifecycle Activities ..................................................................................................... 180
7.2.1 Operations and Maintenance Strategy ........................................................... 180
7.2.2 Operations and Maintenance Standards and Specifications .......................... 181
7.2.3 Renewal Strategy .......................................................................................... 181
7.2.4 Renewal Criteria / Intervention Standards ...................................................... 183
7.2.5 Asset Development Strategy .......................................................................... 184
7.2.6 Capital Development Selection Criteria .......................................................... 185
7.2.7 Asset Disposals ............................................................................................. 185
7.2.8 Programme Work Categories ......................................................................... 186
7.2.9 Alignment with Strategic Responses .............................................................. 188
7.3 Sealed Roads Pavements ......................................................................................... 191
7.3.1 Sealed Roads Pavement Maintenance .......................................................... 191
7.3.2 Sealed Roads Pavement Renewals ............................................................... 192
7.3.3 Sealed Roads Technical Analysis .................................................................. 193
7.3.4 Sealed Roads Programme Evaluation ........................................................... 201
7.3.5 Sealed Roads Capital Development .............................................................. 203
7.3.6 Sealed Roads Programme Story on a Page................................................... 204
7.4 Unsealed Roads Pavements ..................................................................................... 209
7.4.1 Unsealed Roads Pavement Maintenance ...................................................... 209
7.4.2 Unsealed Roads Pavement Renewals ........................................................... 210
7.4.3 Unsealed Roads Programme Evaluation ....................................................... 211
7.4.3 Unsealed Roads Capital Development ........................................................... 212
7.4.4 Unsealed Pavements Activity – Story on a Page ........................................... 212
7.5 Structures ................................................................................................................ 214
Roading Asset Management Plan 2020 A3025378
9
7.5.1 Structures Maintenance ................................................................................. 214
7.5.2 Structures Renewals ...................................................................................... 215
7.5.3 Structures Programme Evaluation ................................................................. 216
7.5.3 Structures Capital Development ..................................................................... 217
7.5.4 Structures Activity Summary and Programme Needs ..................................... 217
7.6 Kerb and Channel / Drainage .................................................................................... 219
7.6.1 K&C / Drainage Maintenance ......................................................................... 219
7.6.2 K&C / Drainage Renewals ............................................................................. 220
7.6.3 K&C / Drainage Programme Evaluation ......................................................... 223
7.6.3 K&C / Drainage Capital Development ............................................................ 225
7.6.4 K&C / Drainage Activity Summary and Programme Needs ............................ 225
7.7 Footpaths and Cycleways ......................................................................................... 227
7.7.1 Footpaths and Cycleways Maintenance ......................................................... 227
7.7.2 Footpaths and Cycleways Renewals ............................................................. 228
7.7.3 Footpaths and Cycleways Programme Evaluation ......................................... 229
7.7.3 Footpaths and Cycleways Capital Development ............................................ 231
7.7.4 Footpaths and Cycleways Activity Summary and Programme Needs ............ 232
7.8 Traffic Services ......................................................................................................... 234
7.8.1 Traffic Services Maintenance ......................................................................... 234
7.8.2 Traffic Services Renewals .............................................................................. 235
7.8.3 Traffic Services Programme Evaluation ......................................................... 236
7.8.3 Traffic Services Capital Development ............................................................ 237
7.8.4 Traffic Services Activity Summary and Programme Needs ............................ 238
7.9 Environmental Maintenance and Renewal ................................................................ 240
7.9.1 Environmental Maintenance ........................................................................... 240
7.9.2 Environmental Renewals ............................................................................... 240
7.9.3 Environmental Maintenance Programme Evaluation ...................................... 240
7.9.3 Environmental Maintenance Activity Summary and Programme Needs ......... 241
7.11 Carparking ................................................................................................................ 243
7.11.1 Carparking Maintenance ................................................................................ 243
7.11.2 Carparking Renewals ..................................................................................... 243
7.11.2 Carparking Programme Evaluation ................................................................ 243
7.11.3 Car Parking Capital Development .................................................................. 244
7.12 Other Assets – Unsubsidised .................................................................................... 244
7.12.1 Other Assets Maintenance ............................................................................. 244
7.12.2 Other Assets Renewals ................................................................................. 245
7.12.2 Other Assets Capital Development ................................................................ 245
7.13 Emergency Works and Minor Events ........................................................................ 245
Roading Asset Management Plan 2020 A3025378
10
7.14 Resilience Improvements .......................................................................................... 246
7.15 Low Cost Low Risk Improvements ............................................................................ 247
7.16 Promotion of Road Safety and Demand Management Activities ................................ 249
7.17 Investment Management Work Categories ................................................................ 253
7.17.1 Asset Management Planning ......................................................................... 253
7.17.2 Programme Business Case Development ...................................................... 253
7.18 Network and Asset Management ............................................................................... 254
7.19 Recommended Programme ...................................................................................... 257
7.19.1 Evaluation of Options / Alternative Programmes ............................................ 257
7.19.2 Recommended Investment Management and Operation / Maintenance
Programmes .............................................................................................................. 257
7.7.3 Recommended Renewal Programmes ........................................................... 257
7.7.4 Recommended Capital Development and Community Education Programmes258
7.20 How the Activity will be Resourced ............................................................................ 258
7.20.1 Internal Resourcing ........................................................................................ 258
7.20.2 Procurement Strategy .................................................................................... 259
8. Financial Management ............................................................................................ 261 8.1. Overview ................................................................................................................ 261
8.2 Financial Summary – What the Activity Costs ........................................................... 261
8.2.1 Council Funded Programmes (includes Inflation) ........................................... 262
8.2.2 NZTA Assisted Programmes (includes Inflation) ............................................ 270
8.2.3 Programme Implications ................................................................................ 272
8.3 Financial Policies ...................................................................................................... 272
8.4 How We Pay for the Activity ...................................................................................... 272
8.5 Asset Valuation Forecasts ......................................................................................... 273
8.5.1 30-year Valuation and Depreciation Forecast ................................................ 273
8.6 Procurement.............................................................................................................. 274
8.7 Confidence Levels in Programmes ............................................................................ 277
8.7 Reliability of Financial Forecasts ............................................................................... 279
8.7.1 Revenue Forecasts ........................................................................................ 279
8.7.2 Operational Forecasts .................................................................................... 279
8.7.3 Maintenance and Renewal Forecasts ............................................................ 279
8.7.4 Development Forecasts ................................................................................. 280
8.8 Summary of Programme Assumptions ...................................................................... 280
9. DELIVERING AND MONITORING THE PROGRAMME ........................................... 285 9.1 Programme Governance and Reporting .................................................................... 285
9.2 Stakeholder Engagement and Communications ........................................................ 287
9.3 Business Processes .................................................................................................. 287
Roading Asset Management Plan 2020 A3025378
11
9.4 Information Systems and Data .................................................................................. 289
9.5 Programme Performance Monitoring and Review ..................................................... 292
9.5.1 Monitoring Approach ...................................................................................... 292
9.5.2 Frequency of Review ..................................................................................... 292
10. Continuous Improvement ....................................................................................... 293 10.1 Current Activity Management Practice ....................................................................... 293
10.2 Improvements from 2017 Activity Management Plan ................................................. 294
10.2.1 2017 AMP Peer Review ................................................................................. 294
10.2.2 2017 AMP Improvement Plan Status ............................................................. 295
10.2.3 REG Alignment .............................................................................................. 296
10.3 Improvement Programme .......................................................................................... 297
10.3.1 Improvement Actions identified in Current AMP ............................................. 297
10.3.2 Improvement Plan Programme ...................................................................... 299
10.4 Monitoring and Review .............................................................................................. 306
11. Glossary ................................................................................................................... 308 12. Appendices .............................................................................................................. 309
Roading Asset Management Plan 2020 A3025378
12
List of Tables Table 2.1 Community Outcomes .....................................................................................45
Table 2.2 How Roading Contributes ................................................................................46
Table 2.3 Alignment of Objectives ...................................................................................51
Table 2.4 Summary of Asset Groups (excluding pavements)...........................................64
Table 2.5 Natural Hazards ...............................................................................................74
Table 2.6 Strategic Case Summaries ..............................................................................81
Table 2.7 GPS 2021 Gaps ...............................................................................................82
Table 2.8 ........................................................................................................................84
Table 2.9 Key Assumptions - Internal, Financial and External Factors .............................86
Table 2.10 ........................................................................................................................99
Table 3.1 Our Stakeholders and Community ................................................................. 100
Table 3.2 Community Expectations ............................................................................... 103
Table 3.3 Legislative Requirements ............................................................................... 105
Table 3.4 Industry Standards and Guidelines ................................................................ 106
Table 3.5 Alignment between Customer Levels of Service and the Outcomes .............. 107
Table 3.6 Mandatory Measures (DIA) ............................................................................ 108
Table 3.7 ONRC Measures ........................................................................................... 109
Table 3.8 Council Measures .......................................................................................... 109
Table 3.9 Performance Reporting for Roading ............................................................... 110
Table 3.10 Current Levels of Service Gaps and Possible Responses .............................. 112
Table 3.11 Planned Customer Levels of Service ............................................................. 116
Table 4.1 Factors Influencing Demand .......................................................................... 117
Table 4.2 Expected Implications for the Activity ............................................................. 120
Table 5.1 Asset Description ........................................................................................... 126
Table 5.2 Network Statistics for Network Length (KM) and Journeys Travelled ............. 128
Table 5.3 Asset Type and Useful Life ............................................................................ 130
Table 5.4 Lengths of Sealed Surfaces by ONRC Classification ..................................... 131
Table 5.5 Table of Sealed Roads Top Surface Materials ............................................... 131
Table 5.7 Unsealed Road Lengths by ONRC Hierarchy ................................................ 134
Table 5.8 Channels ....................................................................................................... 136
Table 5.9 Sizes and Types of Culverts by Material ........................................................ 137
Table 5.10 Footpath Network by Materials ...................................................................... 138
Table 5.11 Pole Ownership ............................................................................................. 140
Table 5.12 List of Sign Assets ......................................................................................... 140
Table 5.13 Railings by Type ............................................................................................ 142
Roading Asset Management Plan 2020 A3025378
13
Table 5.14 Construction Type of Bridges ......................................................................... 143
Table 5.15 Location of Bridges ........................................................................................ 143
Table 5.16 Carparks ........................................................................................................ 144
Table 5.17 Bus Shelters .................................................................................................. 145
Table 5.18 Asset Criticality Criteria .................................................................................. 146
Table 5.19 Identification of Critical Assets ....................................................................... 147
Table 5.20 Condition Monitoring Survey and Frequency Results ..................................... 155
Table 6.1 High Risk Identification and Assessment ....................................................... 166
Table 6.2 Approaches to Risk Mitigation ........................................................................ 167
Table 6.3 Monitoring and Managing Negative Effects .................................................... 170
Table 7.1 ...................................................................................................................... 175
Table 7.2 ...................................................................................................................... 180
Table 7.3 Primary Types of Maintenance Carried Out on Main Assets .......................... 181
Table 7.4 Priority Ranking Table for Planned and Reactive Replacement Works .......... 183
Table 7.5 NZTA’s Work Categories for Financial Assistance ......................................... 185
Table 7.6 Subsidised Roading Activities ........................................................................ 186
Table 7.7 Unsubsidised Roading Activities .................................................................... 188
Table 7.8 Linkage between Strategic Responses and Activity / Asset Classes .............. 189
Table 7.9 Sealed Road Pavement Maintenance ............................................................ 191
Table 7.10 Sealed Road Pavement Maintenance - Primary Types of Maintenance Activity ..
...................................................................................................................... 191
Table 7.11 Sealed Road Pavements Renewals - Work Categories ................................. 192
Table 7.12 Sealed Road Pavements Renewals - Primary Types of Renewal Work ......... 192
Table 7.13 Sealed Road Treatment Types ...................................................................... 194
Table 7.14 Forward Works Programme Assessment ....................................................... 195
Table 7.15 dTIMS Analysis .............................................................................................. 196
Table 7.16 dTIMS 30 Year Analysis................................................................................. 197
Table 7.17 Annual Life Cycle Costs ................................................................................. 200
Table 7.18 Average 3 to 10 Year Programmes - $5.0m Budget ....................................... 200
Table 7.19 Average 30 Year Programmes - $5.5 and $5.0m Budgets ............................. 201
Table 7.20 Sealed Roads Short Term Forecasts ($000) .................................................. 202
Table 7.21 Sealed Roads 10 Year Forecasts ($000) ....................................................... 202
Table 7.22 Sealed Pavements Short Term Forecasts ($000) .......................................... 203
Table 7.23 Sealed Pavements 10 Year Forecasts ($000) ................................................ 203
Table 7.24 Sealed Roads – Subdivision Locations .......................................................... 203
Table 7.25 Unsealed Pavement Maintenance ................................................................. 209
Table 7.26 Unsealed Pavement Maintenance - Primary Types of Maintenance Activity .. 209
Table 7.27 Unsealed Pavement Renewals ...................................................................... 210
Roading Asset Management Plan 2020 A3025378
14
Table 7.28 Unsealed Pavement Renewals - Primary Types of Renewal Activity ............. 210
Table 7.29 Unsealed Roads Short Term Maintenance Forecasts ($000) ......................... 212
Table 7.30 Unsealed Roads 10 Year Maintenance Forecasts ($000) .............................. 212
Table 7.31 Unsealed Roads Short Term Renewal Forecasts .......................................... 212
Table 7.32 Unsealed Roads 10 Year Renewal Forecasts ................................................ 212
Table 7.33 Structures Maintenance ................................................................................. 214
Table 7.34 Structures Maintenance - Primary Types of Maintenance Activity .................. 214
Table 7.35 Structures Renewals ...................................................................................... 215
Table 7.36 Structures Renewals - Primary Types of Renewal Activity ............................. 215
Table 7.37 Structures Short Term Maintenance Forecast ($000) ..................................... 216
Table 7.38 Structures 10 Year Maintenance Forecast ($000) .......................................... 216
Table 7.39 Structures Short Term Renewals Forecast ($000) ......................................... 216
Table 7.40 Structures 10 Year Renewals Forecast ($000) ............................................... 217
Table 7.41 Routine Drainage Maintenance ...................................................................... 219
Table 7.42 Routine Drainage Maintenance - Primary Types of Maintenance Activity ....... 219
Table 7.43 Drainage Renewals ........................................................................................ 220
Table 7.44 K&C Historical Renewal Costs ....................................................................... 220
Table 7.45 K&C Historical Renewal Costs ....................................................................... 220
Table 7.46 Developing the Forward Works Programme................................................... 221
Table 7.47 Kerb and Channel / Drainage Short Term Maintenance Forecast ($000) ....... 224
Table 7.48 Kerb and Channel / Drainage 10 Year Maintenance Forecast ($000) ............ 224
Table 7.49 Kerb and Channel / Drainage Short Term Renewals Forecast ($000) ............ 224
Table 7.50 Kerb and Channel / Drainage 10 Year Renewals Forecast ($000) ................. 224
Table 7.51 Footpaths and Cycle Path Maintenance ......................................................... 227
Table 7.52 Footpaths and Cycle Path Maintenance - Primary Types of Maintenance Activity
...................................................................................................................... 227
Table 7.53 Footpaths and Cycleways Renewals ............................................................. 228
Table 7.54 Footpaths and Cycleways Renewal Strategy ................................................. 228
Table 7.55 Footpaths and Cycleways Short Term Maintenance Forecast ($000) ............ 230
Table 7.56 Footpaths and Cycleways 10 Year Maintenance Forecast ($000) .................. 231
Table 7.57 Footpaths and Cycleways Short Term Renewals Forecast ($000) ................. 231
Table 7.58 Footpaths and Cycleways 10 Year Renewals Forecast ($000) ...................... 231
Table 7.59 Footpaths and Cycleways Improvements ....................................................... 231
Table 7.60 Traffic Services Maintenance ......................................................................... 234
Table 7.61 Traffic Services Maintenance - Primary Types of Maintenance Activity .......... 234
Table 7.62 Network Services Renewals .......................................................................... 235
Table 7.63 Network Services Renewals - Primary Types of Renewal Activity .................. 236
Table 7.64 Traffic Services Short Term Maintenance Forecast ($000) ............................ 237
Roading Asset Management Plan 2020 A3025378
15
Table 7.65 Traffic Services 10 Year Maintenance Forecast ($000) .................................. 237
Table 7.66 Traffic Services Short Term Renewal Forecast ($000) ................................... 237
Table 7.67 Traffic Services 10 Year Renewal Forecast ($000) ........................................ 237
Table 7.68 Environmental Maintenance ........................................................................... 240
Table 7.69 Environmental Renewals ............................................................................... 240
Table 7.70 Environmental Maintenance Short Term Forecast ($000) .............................. 241
Table 7.71 Environmental Maintenance 10 Year Forecast ($000) ................................... 241
Table 7.72 Carparking Maintenance ................................................................................ 243
Table 7.73 Carparking Renewals ..................................................................................... 243
Table 7.74 Carparking Short Term Maintenance Forecast ($000) ................................... 243
Table 7.75 Carparking 10 Year Maintenance Forecast ($000) ......................................... 244
Table 7.76 Carparking Short Term Renewal Forecast ($000) .......................................... 244
Table 7.77 Carparking 10 Year Renewal Forecast ($000) ............................................... 244
Table 7.78 Other Assets Maintenance ............................................................................. 244
Table 7.79 Other Assets Renewals ................................................................................. 245
Table 7.80 Emergency Works and Minor Events ............................................................. 245
Table 7.81 Resilience Improvements ............................................................................... 246
Table 7.82 Resilience Improvements Short Term Forecast ($000) .................................. 246
Table 7.83 Resilience Improvements 10 Year Forecast ($000) ........................................ 246
Table 7.84 Low Cost Low Risk Improvements ................................................................. 247
Table 7.85 Low Cost Low Risk Improvements Programme .............................................. 248
Table 7.86 Low Cost Low Risk Short Term Forecast ($000) ............................................ 248
Table 7.87 Low Cost Low Risk 10 Year Forecast ($000) ................................................. 248
Table 7.88 Community Education Programmes ............................................................... 249
Table 7.89 Recommended Community Education Programme Short Term Forecast ($000)
...................................................................................................................... 250
Table 7.90 Recommended Community Education Programme 10 Year Forecast ($000) 250
Table 7.91 Asset Management Planning ......................................................................... 253
Table 7.92 Activity Management Planning Short Term Forecast ($000) .......................... 253
Table 7.93 Activity Management Planning 10 Year Forecast ($000) ................................ 253
Table 7.94 Programme Business Case Development ...................................................... 253
Table 7.95 Activity Management Planning Short Term Forecast ($000) .......................... 254
Table 7.96 Activity Management Planning 10 Year Forecast ($000) ................................ 254
Table 7.97 Network and Asset Management ................................................................... 254
Table 7.98 Network and Asset Management Short Term Forecast ($000) ....................... 255
Table 7.99 Network and Asset Management 10 Year Forecast ($000) ............................ 255
Table 7.100 NZTA Work Categories .................................................................................. 257
Table 7.101 Recommended Renewal Programmes ........................................................... 257
Roading Asset Management Plan 2020 A3025378
16
Table 7.102 Recommended Capital Development and Community Education Programmes ...
...................................................................................................................... 258
Table 7.103 Anticipated Works .......................................................................................... 260
Table 8.1 560000_2019 Works and Services Roading Services .................................... 262
Table 8.2 560000_2019 Works and Services Roading Services .................................... 263
Table 8.3 56100_2019 Roading Services – Land Transport ProgramError! Bookmark not defined.
Table 8.4 Funding included in Council budgets (561000) in NZTA Funding Categories
Error! Bookmark not defined. Table 8.5 2018-2021 Road Funding .............................................................................. 273
Table 8.7 Confidence Levels in Programmes ................................................................ 277
Table 8.8 Confidence Levels and Areas of Uncertainty of Major Assets Categories ...... 278
Table 8.9 Relative Asset Grouping within Roading ........................................................ 278
Table 10.1 Asset Management Practices ........................................................................ 293
Table 10.2 2017 AMP Improvement Actions .................................................................... 295
Table 10.3 New Improvement Actions ............................................................................. 297
Table 10.4 Improvement Programme .............................................................................. 299
Roading Asset Management Plan 2020 A3025378 17
List of Figures Figure 1.1 Transport System Relationships ......................................................................29
Figure 2.1 ........................................................................................................................30
Figure 2.2 MoT Transport Outcomes ................................................................................31
Figure 2.3 GPS Strategic Direction – Priorities and Objectives .........................................32
Figure 2.4 GPS 2021 Key Outcomes ................................................................................33
Figure 2.5 Arataki Overview ..............................................................................................35
Figure 2.6 ........................................................................................................................38
Figure 2.7 Arataki Southland Region at a Glance .............................................................39
Figure 2.8 Joint Strategic Results Framework ...................................................................41
Figure 2.9 Schematic Layout of the Roading Network ......................................................43
Figure 2.10 ONRC Classifications ......................................................................................44
Figure 2.11 Context of Long Term Plan ..............................................................................47
Figure 2.12 Principles and Desired Behaviours of the BCA ................................................52
Figure 2.14 The Right Amount of Effort ...............................................................................53
Figure 2.15 2018 Workshop Part Two (Key Theme Analysis) .............................................54
Figure 2.16 ILM Problem Statements..................................................................................56
Figure 2.17 ILM Benefits Map (2020) ..................................................................................57
Figure 2.18 3-Years Crash Trends ......................................................................................58
Figure 2.19 Peer Group 2018/19 Comparison ....................................................................59
Figure 2.20 Serious Injuries and Fatalities ..........................................................................59
Figure 2.21 Collective Risk .................................................................................................60
Figure 2.22 Personal Risk ...................................................................................................61
Figure 2.23 DSI at Intersections ..........................................................................................61
Figure 2.24 Vulnerable Road Users DSI .............................................................................62
Figure 2.25 Proportion of travel on roads smoother than the threshold ...............................63
Figure 2.26 85th Percentile Roughness ...............................................................................64
Figure 2.27 WC111 - Sealed Pavement Maintenance ........................................................66
Figure 2.28 WC212 - Sealed Road Resurfacing .................................................................66
Figure 2.29 WC214 - Sealed Road Pavement Rehabilitation ..............................................66
Figure 2.30 WC113 & 213 - Routine Drainage Maintenance and Renewal .........................67
Figure 2.31 WC112 - Unsealed Pavement Maintenance.....................................................67
Figure 2.32 WC211 - Unsealed Road Metalling ..................................................................67
Figure 2.33 WC121 & 221 - Environmental Maintenance and Renewal ..............................68
Figure 2.34 WC122 & 222 - Traffic Services Maintenance and Renewal ............................68
Figure 2.35 WC151 - Network and Asset Management ......................................................68
Roading Asset Management Plan 2020 A3025378
18
Figure 2.36 WC123 - Operational Traffic Management .......................................................69
Figure 2.37 Cost Efficiency 2 – Chip Seal Resurfacing Quantities 2015/16 to 2019/20 .......69
Figure 2.38 Cost Efficiency 2 – Proportion of Network Chip Seal Resurfaced (2019/20) .....70
Figure 2.39 Cost Efficiency 2 – Chip Seal Resurfacing (2019/20 Cost / lane-km) – Peer
Group...............................................................................................................70
Figure 2.40 Cost Efficiency 2 – Chip Seal Resurfacing (4-Year Average Life to 2019/20) –
Peer Group ......................................................................................................70
Figure 2.41 Cost Efficiency 3 - Asphalt Resurfacing Quantities 2015/16 to 2019/20
........................................................................................................................71
Figure 2.42 Cost Efficiency 3 – Proportion of Network Asphalt Resurfaced (2019/20) ........71
Figure 2.43 Cost Efficiency 3 – Asphalt Resurfacing (2019/20 Cost/Lane-km) – Peer Group
........................................................................................................................71
Figure 2.44 Cost Efficiency 3 – Asphalt Resurfacing (4-Year Average Life to 2019/20) –
Peer Group ......................................................................................................72
Figure 2.45 Cost Efficiency EM10 – Routine Pavement Maintenance Costs (2019/20) .......72
Figure 2.46 ONRC Classifications – Urban Network ...........................................................77
Figure 4.1 Change in Demographic ................................................................................ 118
Figure 5.1 Relative Value of the Assets (based on replacement costs) ........................... 127
Figure 5.2 Network % Length (km) & Journeys Travelled (veh km) ................................. 128
Figure 5.3 Pavement Use by AADT range ...................................................................... 129
Figure 5.4 Sealed v Unsealed Proportion ....................................................................... 129
Figure 5.5 Traffic Volumes (Vehicle Kilometres Travelled on Network) ........................... 130
Figure 5.6 RSL - Chip seals ............................................................................................ 132
Figure 5.7 RSL - Asphaltic Concrete ............................................................................... 132
Figure 5.8 Pavement Ages ............................................................................................. 133
Figure 5.9 Age Profile of Kerbs and Channels by Installation Date ................................. 136
Figure 5.10 Age Profile of Culverts by Installation Date .................................................... 137
Figure 5.11 Footpath Age ................................................................................................. 138
Figure 5.12 Footpath Age Distribution (Years) by Material Type ....................................... 139
Figure 5.13 Sign Age ........................................................................................................ 141
Figure 5.14 Number of Railings versus Age (Years) ......................................................... 142
Figure 5.15 Bridge Age Distribution by Quantity and Material Type .................................. 143
Figure 5.16 Sealed Road Roughness Distribution ONRC ................................................. 149
Figure 5.17 Sealed Road Roughness Distribution Urban / Rural ....................................... 149
Figure 5.18 Smooth Travel Exposure................................................................................ 150
Figure 5.19 Amenity Customer Outcome 2: Peak Roughness - Urban Sealed Roads ...... 150
Figure 5.20 STE Condition Index by Years ....................................................................... 151
Figure 5.21 Historical Rutting Distribution - HSD Survey................................................... 151
Roading Asset Management Plan 2020 A3025378
19
Figure 5.22 Average Texture Profile Depth (mm) .............................................................. 152
Figure 5.23 Condition Index for all Sealed Roads in Invercargill City ................................ 152
Figure 5.24 Pavement Integrity for all Sealed Roads in Invercargill City ........................... 153
Figure 5.25 Condition Comparison - 2014 and 2017 ......................................................... 154
Figure 5.26 Ten Year Crash Severity Trends .................................................................... 157
Figure 5.27 Ten Year Crash Movement Trends ................................................................ 158
Figure 5.28 Location of Crashes on the ICC Road Network 2010-2020 ............................ 158
Figure 5.29 Detailed Analysis of Crash Locations (2015 to 2020) ..................................... 159
Figure 5.30 Customer Outcome 1: Number of Serious Injuries and Fatalities (DSI) .......... 160
Figure 5.31 Safety Customer Outcome 3 - Personal Risk ................................................. 160
Figure 7.1 Balance between Planned and Unplanned Maintenance ............................... 180
Figure 7.2 K&C Long Term Renewal Projection .............................................................. 223
Figure 7.3 ...................................................................................................................... 225
Figure 7.4 ...................................................................................................................... 230
Figure 8.1 Total Expenditure Over 10 Years ..................................................................................
Figure 8.2 Total Expenditure Over 30 Years ................................................................... 265
Figure 8.3 Funding Over 10 Years ..................................................................................................
Figure 8.4 Funding Over 30 Years .................................................................................. 267
Figure 8.5 Depreciation vs Capital Renewals Over 10 Years .......................................... 268
Figure 8.6 Depreciation vs Capital Renewals Over 30 Years .......................................... 268
Figure 8.7 ...................................................................................................................... 276
Figure 9.1 Programme Governance and Reporting ......................................................... 286
Figure 9.2 Management Structure of the Invercargill City Council ................................... 288
Figure 10.1 Key Asset Management Inputs ...................................................................... 293
Figure 10.2 ...................................................................................................................... 297
Roading Asset Management Plan 2020 A3025378
20
Executive Summary This Asset Plan has been developed to ensure that the roading activity can be sustainably delivered for Invercargill in a way that meets legislative requirements, seeks to meet levels of service expected by customers, and which helps enable investment support from our co-funder Waka Kotahi (NZ Transport Agency). Who are we? We are responsible for providing a safe, connected and accessible transport system within Invercargill City. We maintain our City’s roads, footpaths, cycleways and related assets such as streetlights, roadside drainage, bridges, and other structures. The transport activity includes network planning and the delivery of walking, cycling and roading projects that improve safety, help reduce carbon emissions and encourage active transport. We also look after the public transport activity and run community road safety education and promotion activities. We work closely with NZTA who are responsible for State Highways in our province, and with Environment Southland who are responsible for strategic transport planning and environmental management across the region. What we are seeking to achieve? Council’s vision is “Our City with heart” / “He Ngākau Aroha”; delivering Community Outcomes of: Enhance our City Preserve its Character Embrace Innovation and Change About this Plan This Plan looks to align the Levels of Service provided to its customers with the Community Outcomes above, together with those developed nationally through the One Network Road Classification framework. These outcomes set the performance standards appropriate for delivering work programmes, with which the Council’s network and current levels of service are well aligned. The Plan assesses the problems facing the City’s transport system and identifies the benefits that investment could deliver to the community. It describes the evidence underpinning these problems and establishes investment priorities. While for many sub-activities our current delivery programmes and investment levels are relatively consistent and do not need additional investment, a significant increase in maintenance and renewals is considered necessary for some, in particular, pavements (and surfacing). The Investment Story What are we asking for? The Why (what are the problems?)
Roading Asset Management Plan 2020 A3025378
21
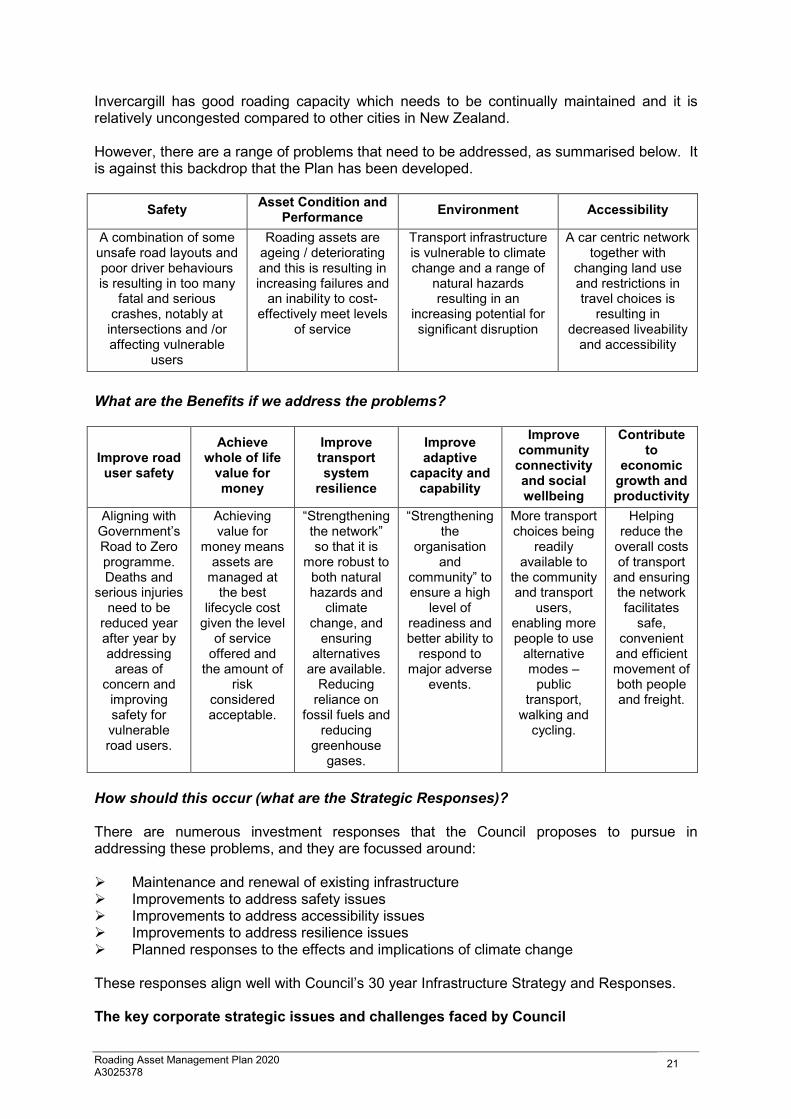
Invercargill has good roading capacity which needs to be continually maintained and it is relatively uncongested compared to other cities in New Zealand. However, there are a range of problems that need to be addressed, as summarised below. It is against this backdrop that the Plan has been developed.
Safety Asset Condition and Performance Environment Accessibility
A combination of some unsafe road layouts and poor driver behaviours is resulting in too many
fatal and serious crashes, notably at
intersections and /or affecting vulnerable
users
Roading assets are ageing / deteriorating and this is resulting in increasing failures and
an inability to cost-effectively meet levels
of service
Transport infrastructure is vulnerable to climate change and a range of
natural hazards resulting in an
increasing potential for significant disruption
A car centric network together with
changing land use and restrictions in travel choices is
resulting in decreased liveability
and accessibility
What are the Benefits if we address the problems?
Improve road user safety
Achieve whole of life
value for money
Improve transport system
resilience
Improve adaptive
capacity and capability
Improve community connectivity and social wellbeing
Contribute to
economic growth and productivity
Aligning with Government’s Road to Zero programme. Deaths and
serious injuries need to be
reduced year after year by addressing
areas of concern and
improving safety for vulnerable road users.
Achieving value for
money means assets are
managed at the best
lifecycle cost given the level
of service offered and
the amount of risk
considered acceptable.
“Strengthening the network” so that it is
more robust to both natural hazards and
climate change, and
ensuring alternatives
are available. Reducing
reliance on fossil fuels and
reducing greenhouse
gases.
“Strengthening the
organisation and
community” to ensure a high
level of readiness and better ability to
respond to major adverse
events.
More transport choices being
readily available to
the community and transport
users, enabling more people to use
alternative modes –
public transport,
walking and cycling.
Helping reduce the
overall costs of transport
and ensuring the network facilitates
safe, convenient and efficient movement of both people and freight.
How should this occur (what are the Strategic Responses)? There are numerous investment responses that the Council proposes to pursue in addressing these problems, and they are focussed around: Maintenance and renewal of existing infrastructure Improvements to address safety issues Improvements to address accessibility issues Improvements to address resilience issues Planned responses to the effects and implications of climate change These responses align well with Council’s 30 year Infrastructure Strategy and Responses. The key corporate strategic issues and challenges faced by Council
Roading Asset Management Plan 2020 A3025378
22
In addition to the specific transport problems described above, this Plan also responds to a range of wider issues: The City’s changing demographic profile. The community’s willingness and ability to pay and our ability to respond to changing
demands. An expectation from the community to retain services and provide them in a more
effective manner, at a lower cost. Encouraging growth projects whilst ensuring financial and operational sustainability for
future generations. Ensuring that Council works in a financially prudent manner that promotes the current
and future interests of the community. Responding to the changing natural environment. Retaining Invercargill’s character within its built environment. How Council will adapt to technology change. Ongoing support of Waka Kotahi NZTA and the Government to align their investment
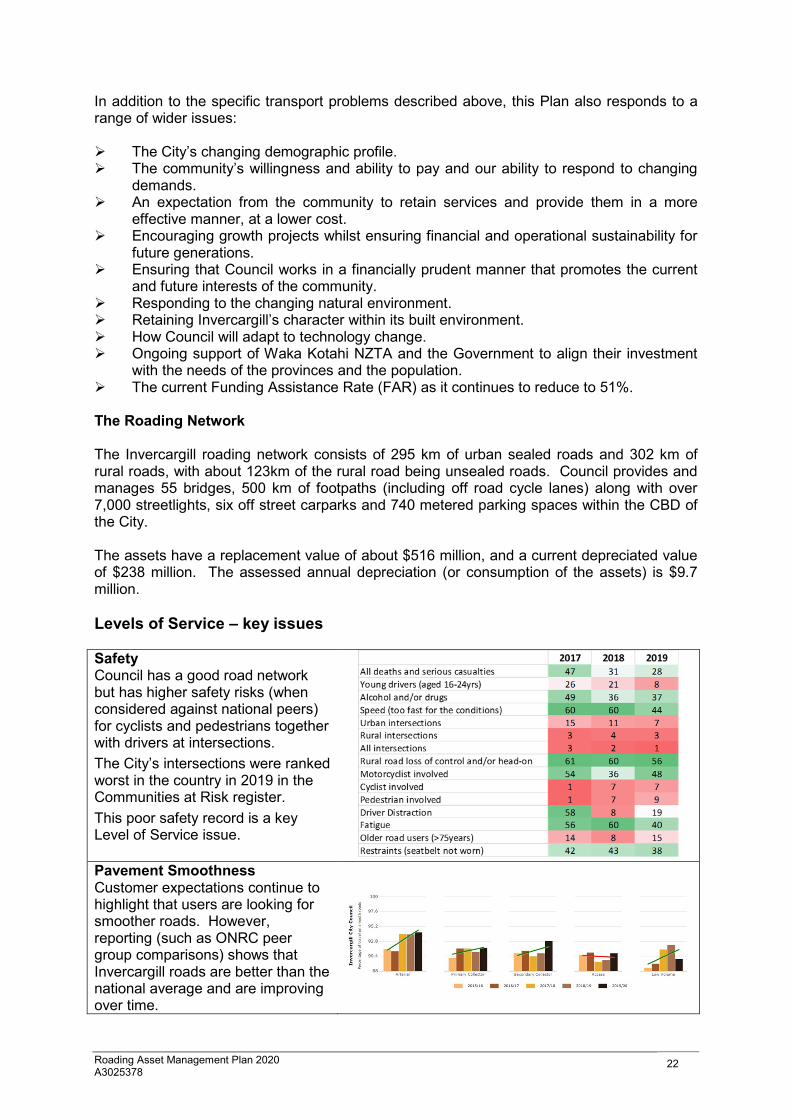
with the needs of the provinces and the population. The current Funding Assistance Rate (FAR) as it continues to reduce to 51%. The Roading Network The Invercargill roading network consists of 295 km of urban sealed roads and 302 km of rural roads, with about 123km of the rural road being unsealed roads. Council provides and manages 55 bridges, 500 km of footpaths (including off road cycle lanes) along with over 7,000 streetlights, six off street carparks and 740 metered parking spaces within the CBD of the City. The assets have a replacement value of about $516 million, and a current depreciated value of $238 million. The assessed annual depreciation (or consumption of the assets) is $9.7 million. Levels of Service – key issues Safety Council has a good road network but has higher safety risks (when considered against national peers) for cyclists and pedestrians together with drivers at intersections. The City’s intersections were ranked worst in the country in 2019 in the Communities at Risk register. This poor safety record is a key Level of Service issue.
Pavement Smoothness Customer expectations continue to highlight that users are looking for smoother roads. However, reporting (such as ONRC peer group comparisons) shows that Invercargill roads are better than the national average and are improving over time.
Roading Asset Management Plan 2020 A3025378
23
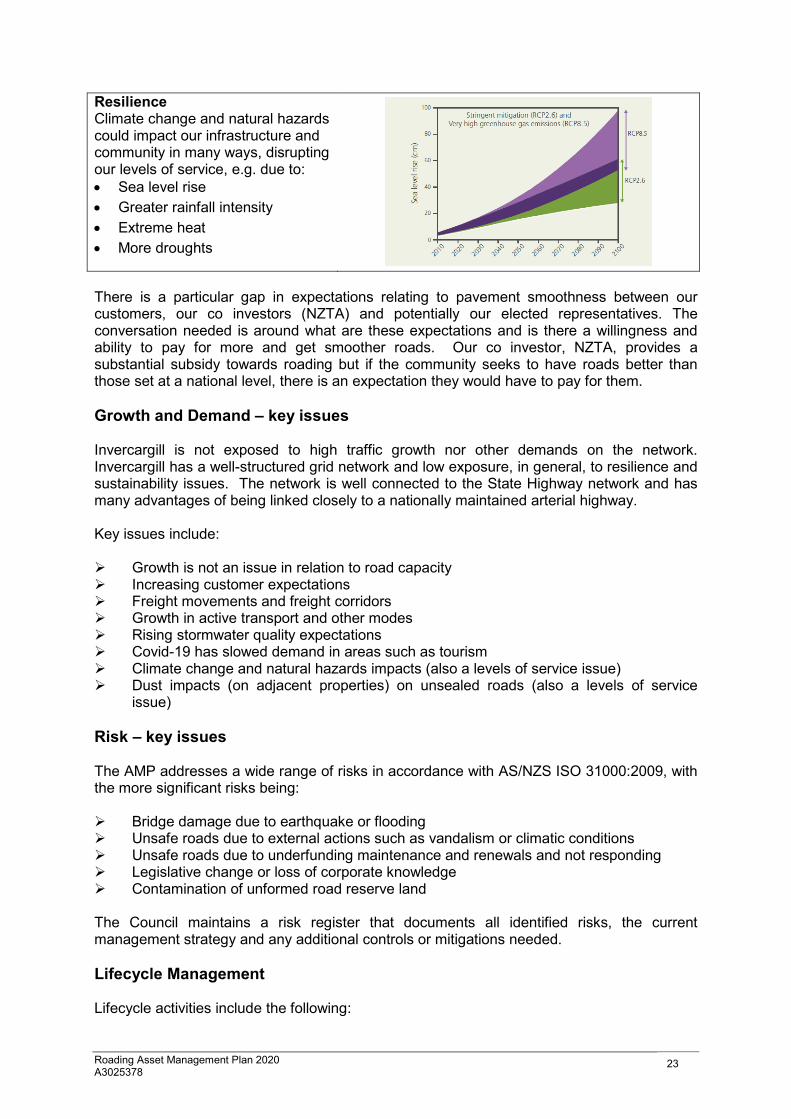
Resilience Climate change and natural hazards could impact our infrastructure and community in many ways, disrupting our levels of service, e.g. due to: • Sea level rise • Greater rainfall intensity • Extreme heat • More droughts
There is a particular gap in expectations relating to pavement smoothness between our customers, our co investors (NZTA) and potentially our elected representatives. The conversation needed is around what are these expectations and is there a willingness and ability to pay for more and get smoother roads. Our co investor, NZTA, provides a substantial subsidy towards roading but if the community seeks to have roads better than those set at a national level, there is an expectation they would have to pay for them. Growth and Demand – key issues Invercargill is not exposed to high traffic growth nor other demands on the network. Invercargill has a well-structured grid network and low exposure, in general, to resilience and sustainability issues. The network is well connected to the State Highway network and has many advantages of being linked closely to a nationally maintained arterial highway. Key issues include: Growth is not an issue in relation to road capacity Increasing customer expectations Freight movements and freight corridors Growth in active transport and other modes Rising stormwater quality expectations Covid-19 has slowed demand in areas such as tourism Climate change and natural hazards impacts (also a levels of service issue) Dust impacts (on adjacent properties) on unsealed roads (also a levels of service
issue) Risk – key issues The AMP addresses a wide range of risks in accordance with AS/NZS ISO 31000:2009, with the more significant risks being: Bridge damage due to earthquake or flooding Unsafe roads due to external actions such as vandalism or climatic conditions Unsafe roads due to underfunding maintenance and renewals and not responding Legislative change or loss of corporate knowledge Contamination of unformed road reserve land The Council maintains a risk register that documents all identified risks, the current management strategy and any additional controls or mitigations needed. Lifecycle Management Lifecycle activities include the following:
Roading Asset Management Plan 2020 A3025378
24
Planning and investment management – planning for and managing the transport system.
Operational – the costs of electricity, managing traffic, cleaning or other activities that do not physically change the asset.
Maintenance – the day-to-day activities needed to keep assets operating at the required service levels.
Renewals – capital works that replace but do not increase or improve an asset’s original design capacity or condition.
Capital Additions – new assets which increase the size of the portfolio, increasing capacity or improving levels of service.
Disposal – removal of existing assets from service. Our lifecycle objectives are: Asset preservation – focus on managing asset condition while meeting the needs of
different transport modes and users. Safety – addressing the City’s crash problems and improving safety performance
needs to be a strong focus, to reduce crashes, deaths and serious injuries, especially to vulnerable users, pedestrians and cyclists.
Prudent risk management – a transport system where the risks from climate change and potential hazards are managed to acceptable levels.
Perpetuity of assets – address inter-generational loss of service potential due to asset deterioration through appropriate operational, maintenance and renewal activities.
Value-for-money – optimise and prioritise investments to achieve best whole-of-life costs, while meeting agreed levels of service.
In developing the Programme Case an optioneering process was conducted to test alternative options and investment strategies, in particular for pavements, drainage and footpaths. This included advanced pavement deterioration modelling with the report providing key inputs into selecting the most suitable maintenance, resurfacing and renewal programmes. Detailed analysis showed that the current annual funding level of around $3.4 million for resurfacing and rehabilitation is not financially sustainable in the long term, with at least $5 million per annum considered desirable to preserve the assets and the levels of service they provide to road users. This level of investment will ensure optimal life for pavements by waterproofing the surface. This shift in the funding approach looks for a transition over four years as planned increases rather than a stepped and abrupt change. This is part of the planned management approach. Footpaths is an area where Council has previously adopted a higher risk approach, not fully funding asset consumption (depreciation) but managing renewal and maintenance whilst monitoring the condition. This situation is changing as the asset base ages and greater demands are becoming apparent – a more proactive renewal programme is now proposed with again a transition as the selected and managed approach. For drainage, the proposed programme offers a balance between optimising lifecycle costs (including the adjoining pavement), risk management, and aesthetics. It continues to deliver a programme at similar levels using the current programming approach. New capital programmes are now largely delivered through the Low Cost Low Risk work category following NZTA’s expansion of qualifying activities and financial thresholds in this category.
Roading Asset Management Plan 2020 A3025378
25
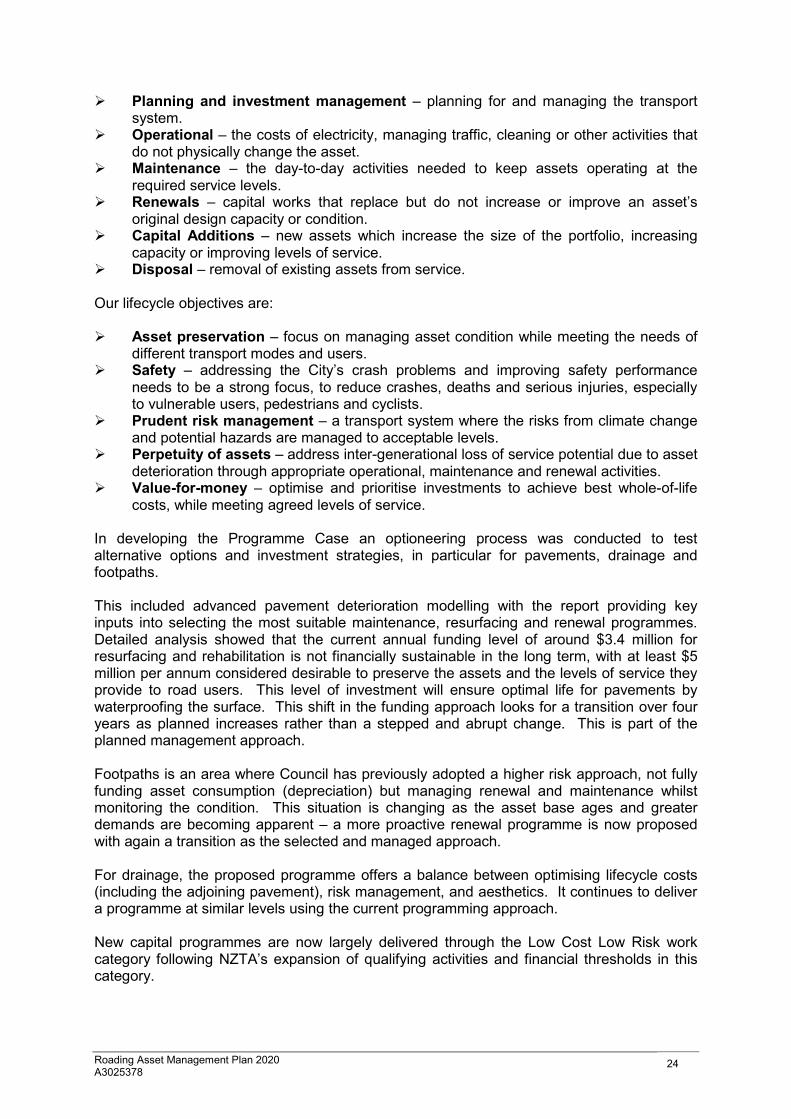
Investment Needs In addition to lifecycle drivers, renewal and new capital programmes are also heavily influenced by the City Centre upgrade and responding to the Government’s “shovel ready” initiative as part of the Covid-19 pandemic response plan. Proposed investment programmes are summarised below:
Roading Asset Management Plan 2020 A3025378
26
Asset Management Practices Council has good knowledge of its assets and corporate engineering and asset management abilities along with robust delivery contracts, meaning it is able to develop programmes needed by the asset portfolio and deliver them. We procure services in a robust, sustainable, effective and timely manner and deliver them at a cost that is both appropriate and fair. A review of delivery (Section 17A (of the LGA) review (2017)) concluded that the current structure and delivery mechanisms remain the most appropriate approach for Council. This Plan highlights through using the Government’s Asset Management Maturity Assessment Tool (from Treasury Better Business Case Approach) that the asset planning process is well placed and growing in maturity. It is reasonable to be confident in the Plan and its programmes in delivering the outcomes required and outlined. A robust improvement programme has been determined and the resourcing needed to deliver it is understood, with some confidence that it can be delivered. Council has developed and accepted a robust Asset Management Policy and Strategy and an Infrastructural and Financial Strategy, and this Plan is aligned to these documents ensuring the information needed is able to flow into the Long Term Plan with some reliability.
Roading Asset Management Plan 2020 A3025378 27
1. Introduction to the AMP
1.1 PURPOSE OF THE AMP
The Asset Management Plan (AMP) outlines how and why Invercargill and its partners will want to invest. This Plan sets out the strategic reasoning linking local and central government policy directions with the business case thinking (and options) for investment in the transportation activity. The AMP has a 30 year focus with detailed consideration of a ten-year view designed to prioritise and address key transportation issues and how they are to be managed. The ten year view is an input into the Long Term Plan
Transport is fundamental to ensuring a high quality of life and a thriving economy within Invercargill City. There is increasing pressure on the road network and the Council needs to address current and future issues. To achieve this, we are focused on maintaining defined levels of service and addressing the pressures on the system through prudent and cost-effective management of the network.
The challenge of the activity is to manage the assets in such a way that the right asset is in the right condition and when works are needed, it is undertaken at the right time in a coordinated way.
How we manage the asset includes: • Preparation and implementation of this Asset Management Plan. • Research, long term planning and policy development relating to roading
services. • Understanding risks and evaluating ways to minimise their impact on users. • Understanding customers and delivering services to a level they agree to fund. • Working closely with NZTA to ensure they continue to co-invest and support the
activities direction. • Leading teams of contractors, consultants and staff focussed on delivering the
best possible service. • Communicating with Councillors and key stakeholders to ensure they are a part
of the decisions for the activity.
It is important that roading activities align with the Government expectations (which are outlined in the Government Policy Statement (GPS) for Transport) so that the opportunity for co-investment is created.
Waka Kotahi NZ Transport Agency (NZTA), as co-funder, requires a business case approach for securing funding for land transport programmes, supported by this AMP. The AMP uses business case principles and NZTA investment assessment to support the funding application. This process complements existing best practice guidance for AMPs such as the International Infrastructure Management Manual (IIMM) and ISO 55001, and provides investment confidence for NZTA. In parallel, the AMP must meet the expectations of the Council as a key building block for the Long Term Plan (LTP).
Sitting alongside the AMP business case approach is the One Network Road Classification (ONRC) system, both being supported by the Road Efficiency Group (REG), a collaborative initiative of road controlling authorities across New Zealand.
Roading Asset Management Plan 2020 A3025378
28
The ONRC involves categorising roads based on functions as they perform as part of a national network. The ONRC supports a major shift in the road management framework at national and regional levels. Successful implementation requires not just a change in reporting, but also in our thinking about road infrastructure and its purpose. The classification is designed to assist local government and the Transport Agency to plan, invest in, maintain and operate the road network in a more strategic, consistent and affordable way throughout the country.
A key concept behind the ONRC is that it places the customer at the heart of every investment decision. The ONRC provides national standards for road asset management and will be imbedded in investment decision making for the 2021-24 NLTP (National Land Transport Plan).
Further work has been carried out recently and the ONRC is expected to become the One Network Framework with a changed focus covering Movement and Place. This AMP is focussed on the ONRC pending adoption of the new One Network Framework (ONF) within New Zealand. However, we are mindful of the emphasis on Movement and Place, these concepts being applied within the AMP. The ONF will be particularly key and important for the Invercargill City centre redevelopment given the influences the State Highway has on place functions adjacent to a busy highway with many truck movements. Investment in the transport activity needs to find the balance required for the community to have its centre as a people and business focus with place and space for community to thrive and be successful. Linking the CBD to ONF and GPS 2021 will have benefits for the transport purpose.
1.2 RATIONALE FOR THE ACTIVITY
The roading activity is one of the core Infrastructural Services activities provided by the Invercargill City Council.
The roading network (and connected infrastructure) is a strategic asset and is significant in ensuring Council’s capacity to contribute towards Community Outcomes and the wellbeing of the Community. The Invercargill roading network consists of 596 km of roads of varying capability (294 km urban sealed, 301 km of rural roads including 123 km rural unsealed roads). The network is relatively compact, strong urban and peri-urban influencers, with some rural and unsealed roads. Invercargill has a population of approximately 55,300 and is the provincial centre for Southland. Like many areas Council sees population growth as a key for community sustainability. Council fits in a Council peer group (>50% Urban) with Napier, Palmerston North and Porirua who should have similar transport needs and performance. Council also manages bridges, footpaths (500 km), streetlights, car parking and traffic signals, and also manages delivery of the Passenger Services and Total Mobility activity (on behalf of Environment Southland).
The assets have a replacement value of about $674 million (in 2019) and a current value of $974 million. The assessed annual depreciation (or consumption of the assets) is $9.6 million.
The roading activity key aim is to provide a safe, effective and efficient transport “system” in the City. All components of the asset are to support a system approach.
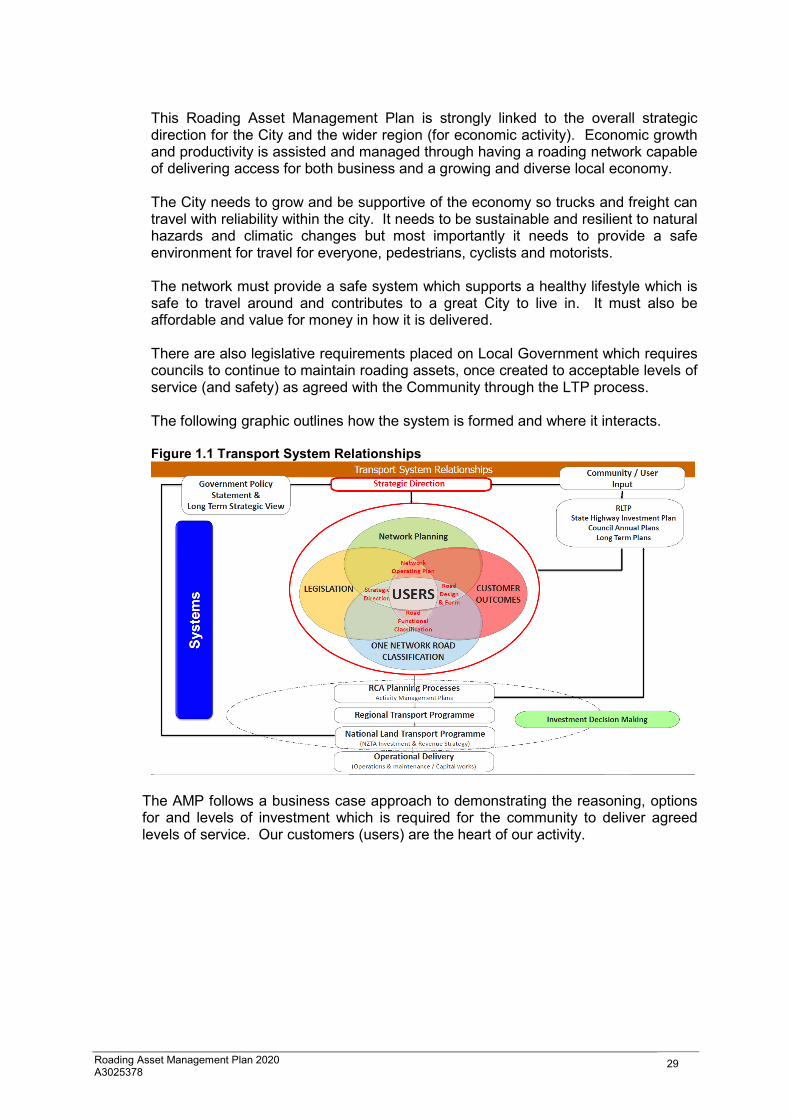
Roading Asset Management Plan 2020 A3025378
29
This Roading Asset Management Plan is strongly linked to the overall strategic direction for the City and the wider region (for economic activity). Economic growth and productivity is assisted and managed through having a roading network capable of delivering access for both business and a growing and diverse local economy.
The City needs to grow and be supportive of the economy so trucks and freight can travel with reliability within the city. It needs to be sustainable and resilient to natural hazards and climatic changes but most importantly it needs to provide a safe environment for travel for everyone, pedestrians, cyclists and motorists.
The network must provide a safe system which supports a healthy lifestyle which is safe to travel around and contributes to a great City to live in. It must also be affordable and value for money in how it is delivered.
There are also legislative requirements placed on Local Government which requires councils to continue to maintain roading assets, once created to acceptable levels of service (and safety) as agreed with the Community through the LTP process. The following graphic outlines how the system is formed and where it interacts. Figure 1.1 Transport System Relationships
The AMP follows a business case approach to demonstrating the reasoning, options for and levels of investment which is required for the community to deliver agreed levels of service. Our customers (users) are the heart of our activity.
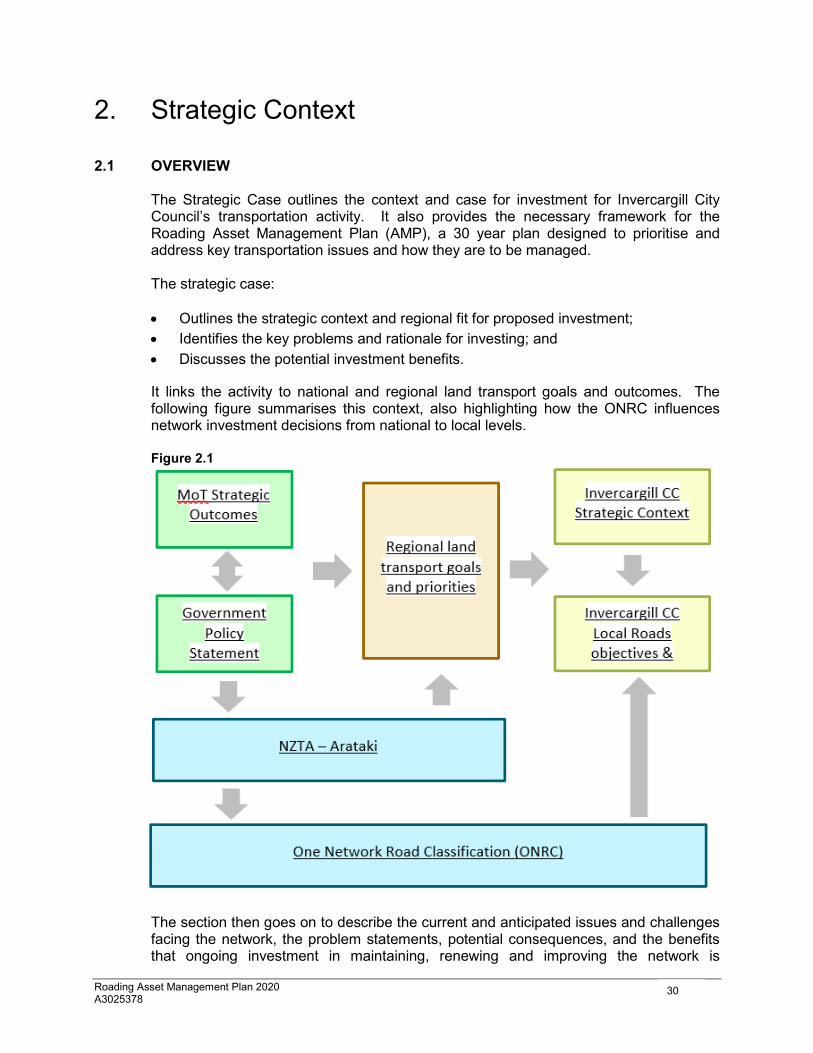
Roading Asset Management Plan 2020 A3025378
30
2. Strategic Context 2.1 OVERVIEW
The Strategic Case outlines the context and case for investment for Invercargill City Council’s transportation activity. It also provides the necessary framework for the Roading Asset Management Plan (AMP), a 30 year plan designed to prioritise and address key transportation issues and how they are to be managed.
The strategic case:
• Outlines the strategic context and regional fit for proposed investment; • Identifies the key problems and rationale for investing; and • Discusses the potential investment benefits.
It links the activity to national and regional land transport goals and outcomes. The following figure summarises this context, also highlighting how the ONRC influences network investment decisions from national to local levels. Figure 2.1
The section then goes on to describe the current and anticipated issues and challenges facing the network, the problem statements, potential consequences, and the benefits that ongoing investment in maintaining, renewing and improving the network is
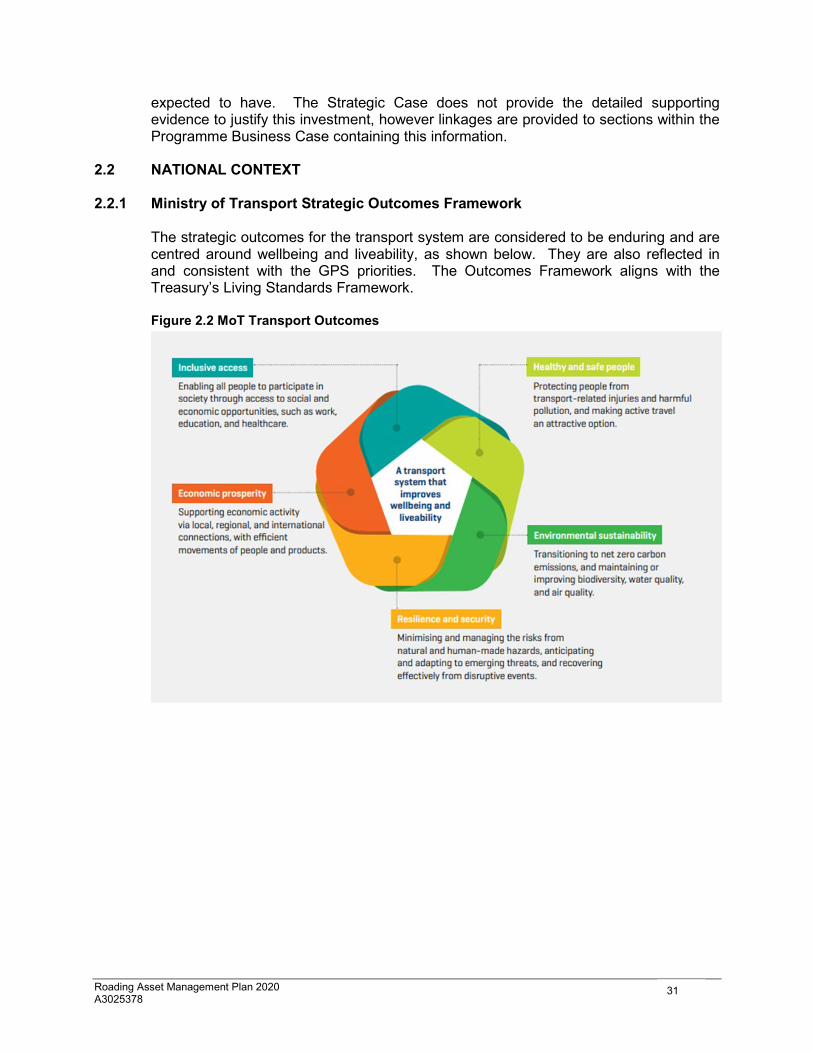
Roading Asset Management Plan 2020 A3025378
31
expected to have. The Strategic Case does not provide the detailed supporting evidence to justify this investment, however linkages are provided to sections within the Programme Business Case containing this information.
2.2 NATIONAL CONTEXT 2.2.1 Ministry of Transport Strategic Outcomes Framework
The strategic outcomes for the transport system are considered to be enduring and are centred around wellbeing and liveability, as shown below. They are also reflected in and consistent with the GPS priorities. The Outcomes Framework aligns with the Treasury’s Living Standards Framework. Figure 2.2 MoT Transport Outcomes
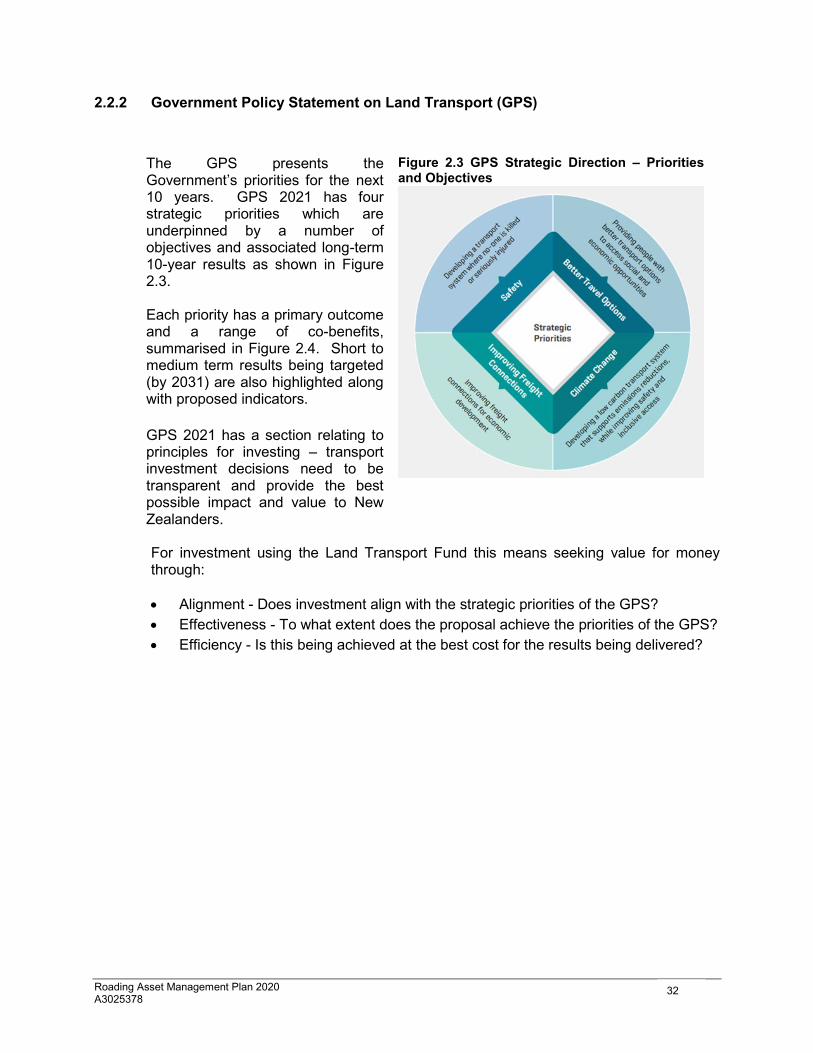
Roading Asset Management Plan 2020 A3025378
32
2.2.2 Government Policy Statement on Land Transport (GPS)
The GPS presents the Government’s priorities for the next 10 years. GPS 2021 has four strategic priorities which are underpinned by a number of objectives and associated long-term 10-year results as shown in Figure 2.3. Each priority has a primary outcome and a range of co-benefits, summarised in Figure 2.4. Short to medium term results being targeted (by 2031) are also highlighted along with proposed indicators. GPS 2021 has a section relating to principles for investing – transport investment decisions need to be transparent and provide the best possible impact and value to New Zealanders.
Figure 2.3 GPS Strategic Direction – Priorities and Objectives
For investment using the Land Transport Fund this means seeking value for money through: • Alignment - Does investment align with the strategic priorities of the GPS? • Effectiveness - To what extent does the proposal achieve the priorities of the GPS? • Efficiency - Is this being achieved at the best cost for the results being delivered?
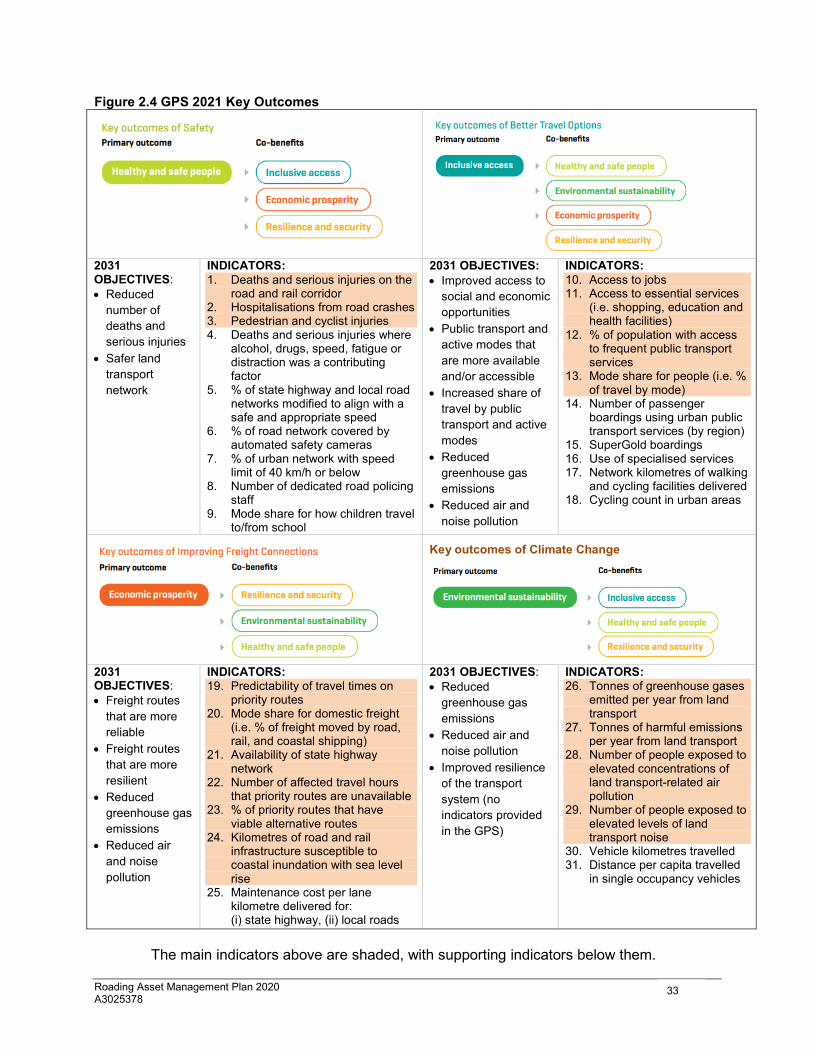
Roading Asset Management Plan 2020 A3025378
33
Figure 2.4 GPS 2021 Key Outcomes
2031 OBJECTIVES: • Reduced
number of deaths and serious injuries
• Safer land transport network
INDICATORS: 1. Deaths and serious injuries on the
road and rail corridor 2. Hospitalisations from road crashes 3. Pedestrian and cyclist injuries 4. Deaths and serious injuries where
alcohol, drugs, speed, fatigue or distraction was a contributing factor
5. % of state highway and local road networks modified to align with a safe and appropriate speed
6. % of road network covered by automated safety cameras
7. % of urban network with speed limit of 40 km/h or below
8. Number of dedicated road policing staff
9. Mode share for how children travel to/from school
2031 OBJECTIVES: • Improved access to
social and economic opportunities
• Public transport and active modes that are more available and/or accessible
• Increased share of travel by public transport and active modes
• Reduced greenhouse gas emissions
• Reduced air and noise pollution
INDICATORS: 10. Access to jobs 11. Access to essential services
(i.e. shopping, education and health facilities)
12. % of population with access to frequent public transport services
13. Mode share for people (i.e. % of travel by mode)
14. Number of passenger boardings using urban public transport services (by region)
15. SuperGold boardings 16. Use of specialised services 17. Network kilometres of walking
and cycling facilities delivered 18. Cycling count in urban areas
Key outcomes of Climate Change
2031 OBJECTIVES: • Freight routes
that are more reliable
• Freight routes that are more resilient
• Reduced greenhouse gas emissions
• Reduced air and noise pollution
INDICATORS: 19. Predictability of travel times on
priority routes 20. Mode share for domestic freight
(i.e. % of freight moved by road, rail, and coastal shipping)
21. Availability of state highway network
22. Number of affected travel hours that priority routes are unavailable
23. % of priority routes that have viable alternative routes
24. Kilometres of road and rail infrastructure susceptible to coastal inundation with sea level rise
25. Maintenance cost per lane kilometre delivered for: (i) state highway, (ii) local roads
2031 OBJECTIVES: • Reduced
greenhouse gas emissions
• Reduced air and noise pollution
• Improved resilience of the transport system (no indicators provided in the GPS)
INDICATORS: 26. Tonnes of greenhouse gases
emitted per year from land transport
27. Tonnes of harmful emissions per year from land transport
28. Number of people exposed to elevated concentrations of land transport-related air pollution
29. Number of people exposed to elevated levels of land transport noise
30. Vehicle kilometres travelled 31. Distance per capita travelled
in single occupancy vehicles
The main indicators above are shaded, with supporting indicators below them.
Roading Asset Management Plan 2020 A3025378
34
2.2.3 Waka Kotahi NZ Transport Agency Context
In addition to its role as co-funder of the Invercargill land transport network, Waka Kotahi NZ Transport Agency manages the state highway network throughout the country. The State Highway is a key network for Invercargill in that it segments the City into nearly four equal areas. It provides a key and sole link to Bluff. The resilience of the State Highway is of fundamental importance to having secure freight and transport access to the rest of the South Island and in particular the road access for commodities and fuel for the province.
Arataki
Arataki1 is the 10-year view of what is needed to deliver on the government’s current priorities and long-term objectives for the land transport system. Arataki V2 reflects initial findings on the impact of COVID-19 on the land transport system. By understanding these impacts we are better able to respond in the right way, at the right time and consider any new opportunities that may arise. Work is currently underway within Waka Kotahi NZ Transport Agency to develop this further into a 30-year view along with developing a long-term Strategic Asset Management Plan which will be focused on the state highway network and land transport activities being managed by NZTA. Arataki is made up of place-based summaries (one national, three pan-regional and 14 regional) that tell a land transport system story. These are framed by five step changes where there is a need for change. These step changes are in response to six key drivers which are trends that influence the choices made today and in the future. All of these inform actions across six levers, either directly or in partnership with others to deliver the government’s objectives for the land transport system. The key drivers are:
• Demographic change • Climate change • Technology
• Customer desire • Changing economic structure
• Funding and financial challenges
Figure 2-5 provides an overview of Arataki.
1 https://www.nzta.govt.nz/planning-and-investment/planning/arataki
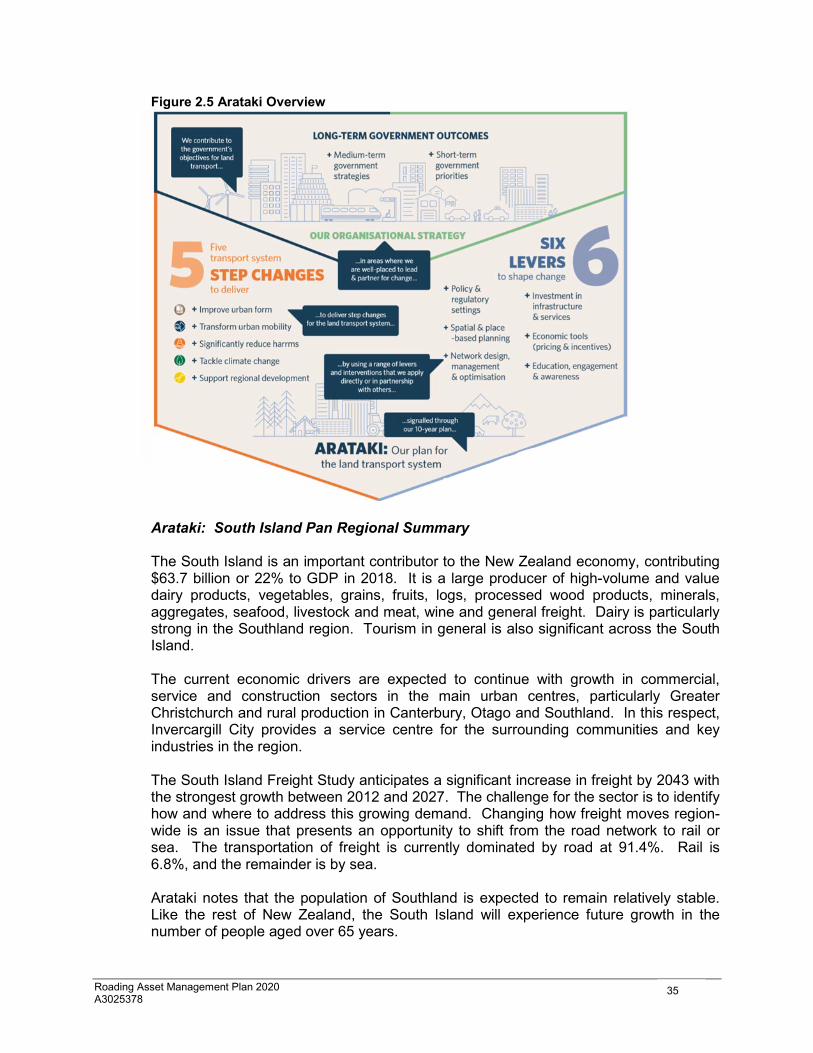
Roading Asset Management Plan 2020 A3025378
35
Figure 2.5 Arataki Overview
Arataki: South Island Pan Regional Summary
The South Island is an important contributor to the New Zealand economy, contributing $63.7 billion or 22% to GDP in 2018. It is a large producer of high-volume and value dairy products, vegetables, grains, fruits, logs, processed wood products, minerals, aggregates, seafood, livestock and meat, wine and general freight. Dairy is particularly strong in the Southland region. Tourism in general is also significant across the South Island. The current economic drivers are expected to continue with growth in commercial, service and construction sectors in the main urban centres, particularly Greater Christchurch and rural production in Canterbury, Otago and Southland. In this respect, Invercargill City provides a service centre for the surrounding communities and key industries in the region. The South Island Freight Study anticipates a significant increase in freight by 2043 with the strongest growth between 2012 and 2027. The challenge for the sector is to identify how and where to address this growing demand. Changing how freight moves region-wide is an issue that presents an opportunity to shift from the road network to rail or sea. The transportation of freight is currently dominated by road at 91.4%. Rail is 6.8%, and the remainder is by sea. Arataki notes that the population of Southland is expected to remain relatively stable. Like the rest of New Zealand, the South Island will experience future growth in the number of people aged over 65 years.
Roading Asset Management Plan 2020 A3025378
36
Arataki: Southland Regional Summary Southland Today and Tomorrow
Southland has a history of strong economic performance, built around the primary sector and manufacturing. However, the region’s high-level of productivity, fifth-highest in New Zealand, does not translate to household incomes. The region faces two key challenges for its future. The first is a static population and the second is economic reliance on a limited number of industries such as dairy and aluminium, with questions over the long-term future of the Tiwai Point smelter. Tourism was playing an increasing role in the region’s economy, driven by strong growth in international visitor numbers. Areas with a high reliance on international tourism are expected to be particularly hard hit during the post-COVID-19 slowdown. The transport system is broadly fit for purpose and provides reliable travel times on a day-to-day basis. However, the age of the region’s infrastructure is becoming an issue, with a significant number of bridges (Southland District Council) coming to the end of their design life. One of the major challenges for the region is the on-going affordability of transport and infrastructure due to a limited population growth and the rising costs of maintaining and renewing infrastructure. The Southland Regional Development Strategy Action Plan identifies two key areas where transport can support economic growth in the region. These are: Support the tourist industry through enhanced visitor experiences, corridor
improvements and increased visitor information. Safe and reliable connections within the region, and north to Queenstown and
Dunedin. Low population growth is projected for the region up to 2043 and as a result, there is likely to be little urban development pressure in Invercargill and Southland District. Growth of employment in the region’s core primary sectors is expected to continue. Retail and healthcare are also expected to remain important employers for the next decade. As a result, access for freight and the transport connection to South Port will continue to be important. Tourism, which is expected to grow in the short-term, will place greater pressure on some destinations in the region. Southland faces a range of effects from climate change. Sea level rise, flooding and storms are predicted to intensify over the next 30 years, along with increased slips and erosion. This increases risk to communities, and the road and rail networks that support them. Surface flooding is expected to increase around South Port, affecting access for freight. Improved access to high-quality data and information will enable better management of the existing transport system, making the most out of existing infrastructure and providing quality, real time information to customers. Emerging technologies such as e-scooters and on-call services are already growing. Shared transport could help people get around within the rural parts of the region and improve access to Invercargill.
Roading Asset Management Plan 2020 A3025378
37
Regional and rural communities will look for improved connections to Invercargill and Dunedin for their young people to access education and work, and for senior residents to access health and social services. Over the coming decade, councils in the region will face increased maintenance and renewal of assets such as ageing bridges. The region’s large network is important for freight, and their ability to afford this will depend to a degree on the performance of primary industries over the next 10 years. There will be greater pressure on the ability of some councils to maintain infrastructure and provide appropriate services to residents, as a result of an increasingly aged population living on fixed incomes.
Key Insights
The following insights for the region were reflected in Arataki V1 and have not been updated due to the level of uncertainty on population and economic trends: Invercargill is the largest urban centre and provides most core services for the
wider region, including the main hospital and tertiary education. Southland faces two fundamental challenges; a limited forecast longer-term
population growth and a relatively narrow economic base which relies heavily on a limited number of products.
There is good capacity on existing roads and opportunities for increased rail freight, but ageing infrastructure, especially bridges, may impact network efficiency and reliability in some areas. Southland may face affordability challenges associated with maintaining appropriate levels of service on the extensive road network.
The region is actively seeking to grow its tourism industry with a focus on dispersing visitors more widely across the region.
The region relies heavily on its extensive road networks to support rural production and enable the movement of tourists around the region. The land transport network in Southland has sufficient capacity, however there is an issue of ageing infrastructure, particularly bridges. There may be opportunities for increased rail freight.
The region will increasingly be affected by flooding and erosion along coastal roads and low-lying areas around Bluff. Inland routes such as the road to Milford Sound will be affected by heavier rainfall and increased rockfall from reduced snow falls and more extreme weather events, combined with significant natural hazards risks such as the Alpine Fault.
The safety record for Southland indicates particular issues in the Invercargill urban area and on high-risk rural roads, the Homer Tunnel and Milford journey.
Current Focus of Effort (2018-21)
A safe, reliable and resilient transport system to support farming, forestry and tourism sectors, and providing access to remote communities is important to encourage economic growth in the Southland region.
Investment through the National Land Transport Programme is based around the importance of a regional land transport system that is safe, well-connected and resilient to get goods to market and to manage the demands of tourism.
In the Catlins coastal area east of Invercargill, the Haldane-Curio Bay Road safety improvements have been completed. The $7 million project was jointly funded by the Southland District Council and Waka Kotahi NZ Transport Agency. Work
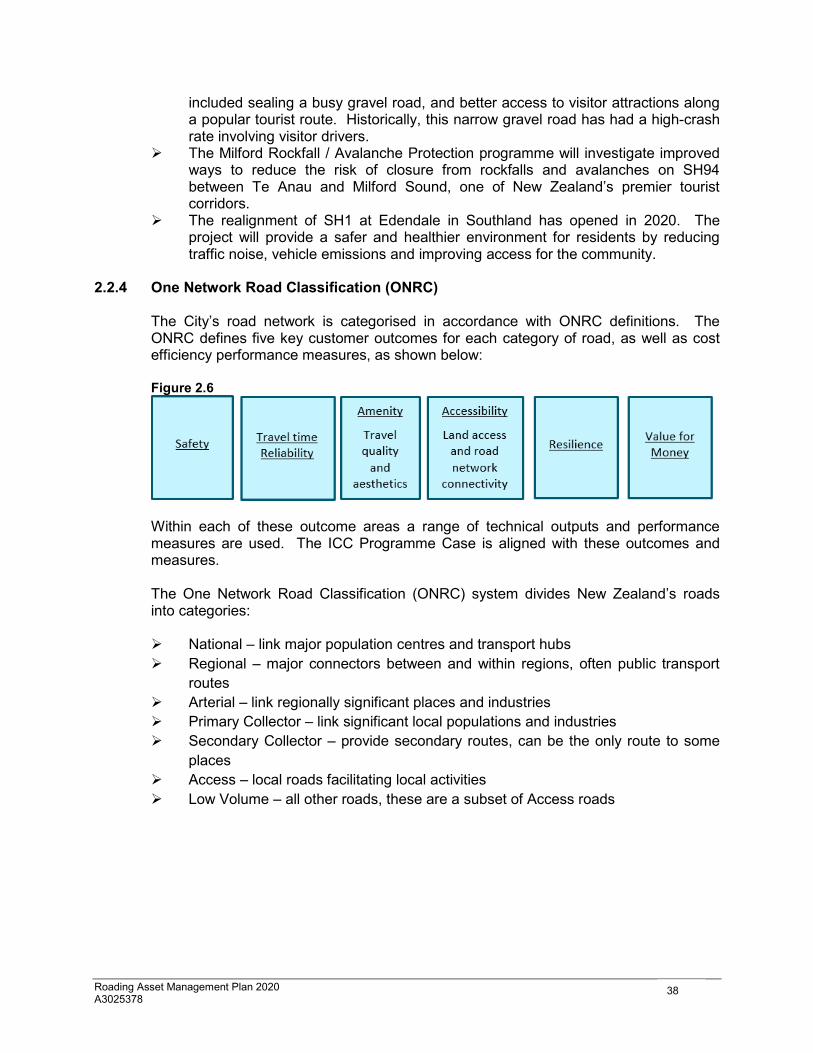
Roading Asset Management Plan 2020 A3025378
38
included sealing a busy gravel road, and better access to visitor attractions along a popular tourist route. Historically, this narrow gravel road has had a high-crash rate involving visitor drivers.
The Milford Rockfall / Avalanche Protection programme will investigate improved ways to reduce the risk of closure from rockfalls and avalanches on SH94 between Te Anau and Milford Sound, one of New Zealand’s premier tourist corridors.
The realignment of SH1 at Edendale in Southland has opened in 2020. The project will provide a safer and healthier environment for residents by reducing traffic noise, vehicle emissions and improving access for the community.
2.2.4 One Network Road Classification (ONRC)
The City’s road network is categorised in accordance with ONRC definitions. The ONRC defines five key customer outcomes for each category of road, as well as cost efficiency performance measures, as shown below: Figure 2.6
Within each of these outcome areas a range of technical outputs and performance measures are used. The ICC Programme Case is aligned with these outcomes and measures. The One Network Road Classification (ONRC) system divides New Zealand’s roads into categories: National – link major population centres and transport hubs Regional – major connectors between and within regions, often public transport
routes Arterial – link regionally significant places and industries Primary Collector – link significant local populations and industries Secondary Collector – provide secondary routes, can be the only route to some
places Access – local roads facilitating local activities Low Volume – all other roads, these are a subset of Access roads
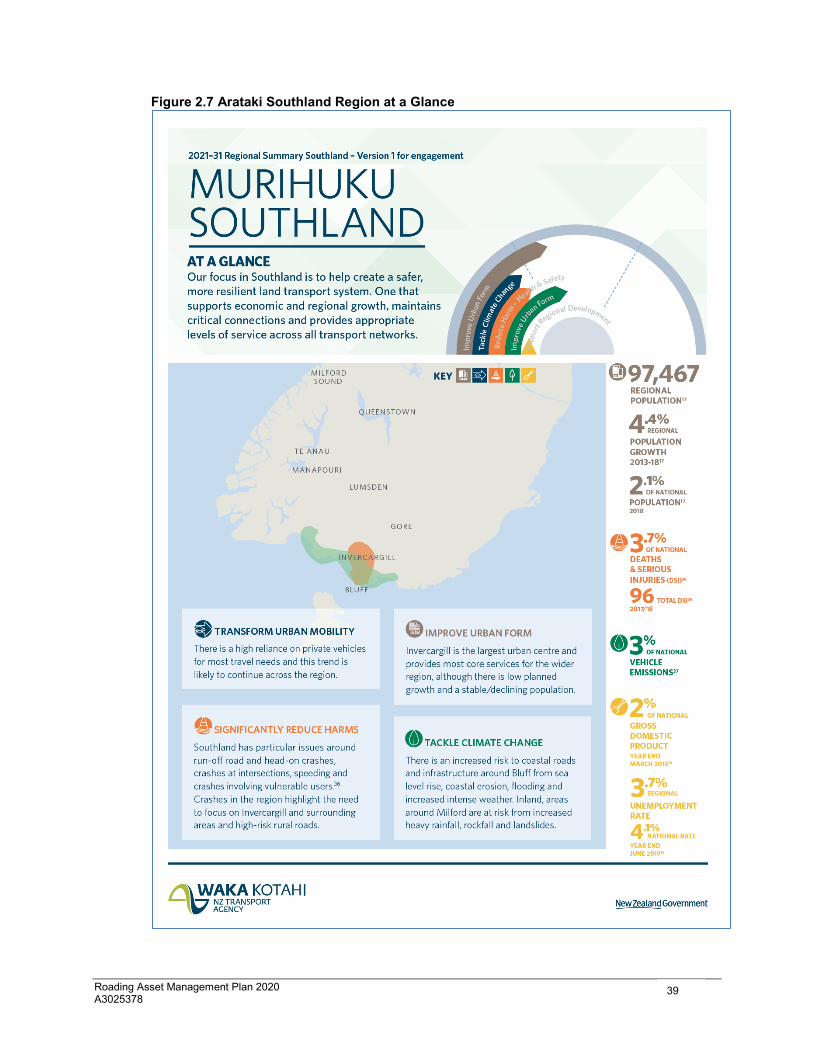
Roading Asset Management Plan 2020 A3025378
39
Figure 2.7 Arataki Southland Region at a Glance
Roading Asset Management Plan 2020 A3025378
40
2.3 SOUTHLAND REGIONAL CONTEXT
The Otago Regional Council and Environment Southland have produced a joint Strategic Results Framework which forms part of their Regional Land Transport Plans. The framework sets out: What types of activities / projects that approved organisations and the RTCs
themselves should be carrying out. How we should do this (e.g. by concentrating on addressing certain problems and
realising certain benefits, in the way that the business case approach requires). And why – identifying the results this work is intended to achieve.
The following figure summarises the framework sets out both the short-term focus (the problems and benefits to be addressed in the next three or so years) and the longer-term results sought. At the base of the strategic results framework are the types of activities that will feed into the main outputs and outcomes. It is intended that undertaking these activities will lead to the key outcomes and objectives being achieved and the problems addressed.
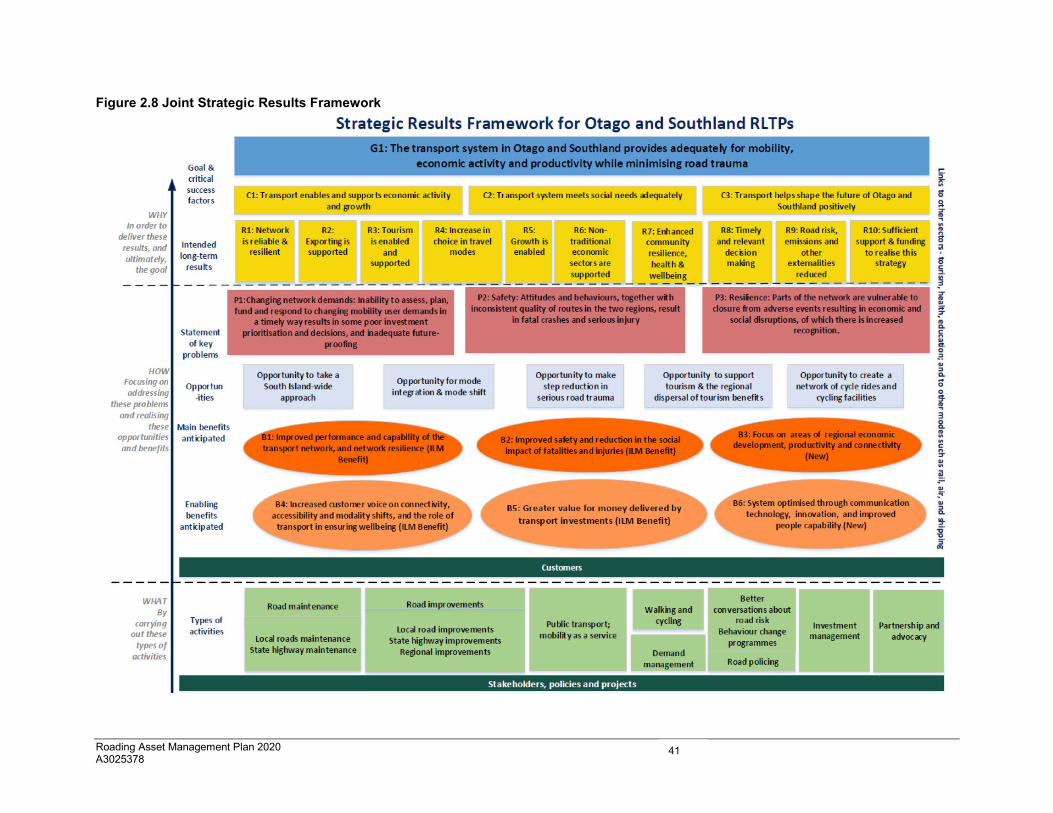
Roading Asset Management Plan 2020 A3025378
41
Figure 2.8 Joint Strategic Results Framework
Roading Asset Management Plan 2020 A3025378
42
2.4 INVERCARGILL CITY CONTEXT 2.4.1 Invercargill Today
Invercargill is the commercial centre for the Southland region. It has an estimated population in 2020 of 55,300. The region is not expected to have significant population growth but has the capacity in its infrastructure currently to satisfy a population of at least 60,000 or more. Its land area is around 49,000 hectares and includes the city, surrounding rural land and the port township of Bluff. It extends from Makarewa in the north to Bluff in the south, Kennington in the east and Oreti Beach in the west. The city is flat with parts near the coastline being low-lying, particularly near the New River estuary.
2.4.2 Transport System Overview
The Invercargill roading network consists of 295 km of urban sealed roads, 302 km of rural roads with about 123 km of the rural road being unsealed roads. Council provides and manages 55 bridges, 500 km of footpaths (including off road cycle lanes) along with streetlights, 6 off street carparks and 740 metered parking spaces within the CBD of the City. Road networks are generally formed on a grid layout and with relatively flat terrain, which makes mobility and accessibility easy for all modes of transport. The roading network has plenty of capacity. This ensures that travel reliability is a given for all road users. Invercargill has a well formed cycle network across the urban city utilising mostly on road cycle lanes. Public Passenger Transport is also provided as part of Council activities (via a delegated authority from Environment Southland in 2002) and this provides four circular BusSmart routes and 11 Council supported school bus services (5 - am and 6 - pm) together with a service supporting Southland DisAbility Enterprises (SDE). A new network and timetable is planned to be implemented in 2021. Passenger Transport is managed via the Regional Public Passenger Plan (RPTP). Roading assets have a replacement value of about $674 million, and a current value of $397 million. The assessed annual depreciation (or consumption of the assets) is $9.6 million. The infrastructure comprises road pavements, street lights, traffic signs and signals, footpaths, drainage, surface water channel systems, bridges, culverts, street furniture, parking facilities, vehicle access crossings and cycle tracks. The following diagram illustrates the assets that are covered by this AMP.
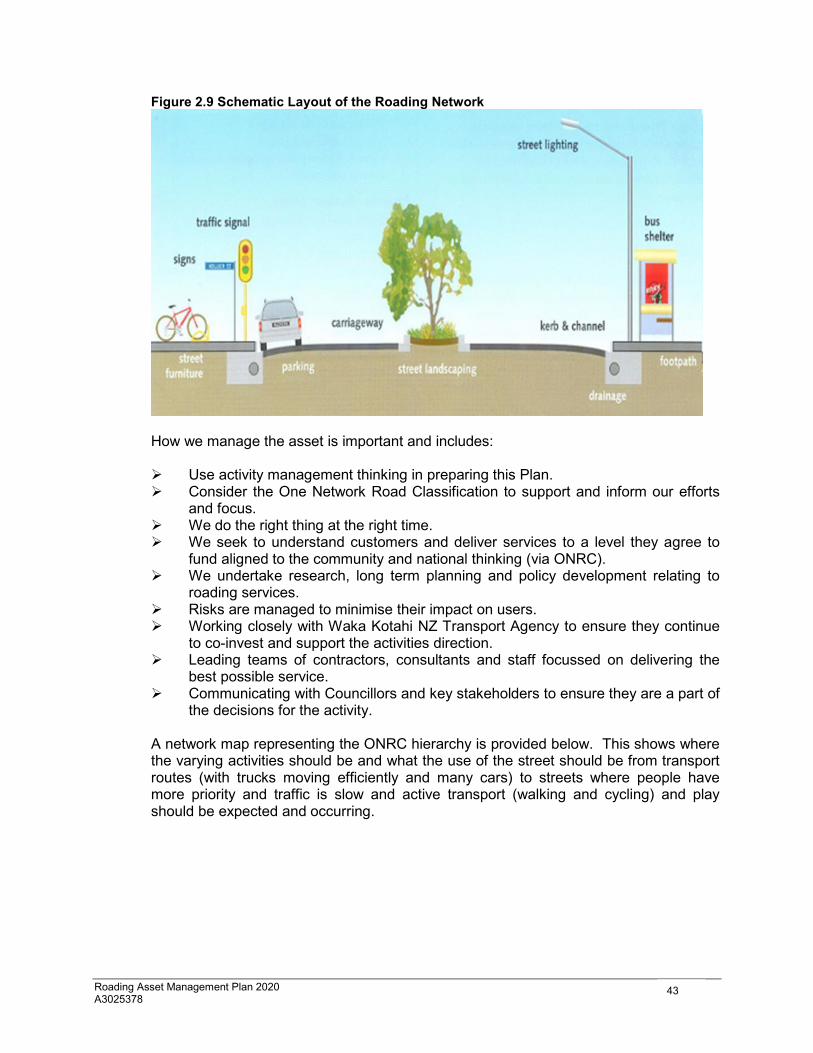
Roading Asset Management Plan 2020 A3025378
43
Figure 2.9 Schematic Layout of the Roading Network
How we manage the asset is important and includes: Use activity management thinking in preparing this Plan. Consider the One Network Road Classification to support and inform our efforts
and focus. We do the right thing at the right time. We seek to understand customers and deliver services to a level they agree to
fund aligned to the community and national thinking (via ONRC). We undertake research, long term planning and policy development relating to
roading services. Risks are managed to minimise their impact on users. Working closely with Waka Kotahi NZ Transport Agency to ensure they continue
to co-invest and support the activities direction. Leading teams of contractors, consultants and staff focussed on delivering the
best possible service. Communicating with Councillors and key stakeholders to ensure they are a part of
the decisions for the activity.
A network map representing the ONRC hierarchy is provided below. This shows where the varying activities should be and what the use of the street should be from transport routes (with trucks moving efficiently and many cars) to streets where people have more priority and traffic is slow and active transport (walking and cycling) and play should be expected and occurring.
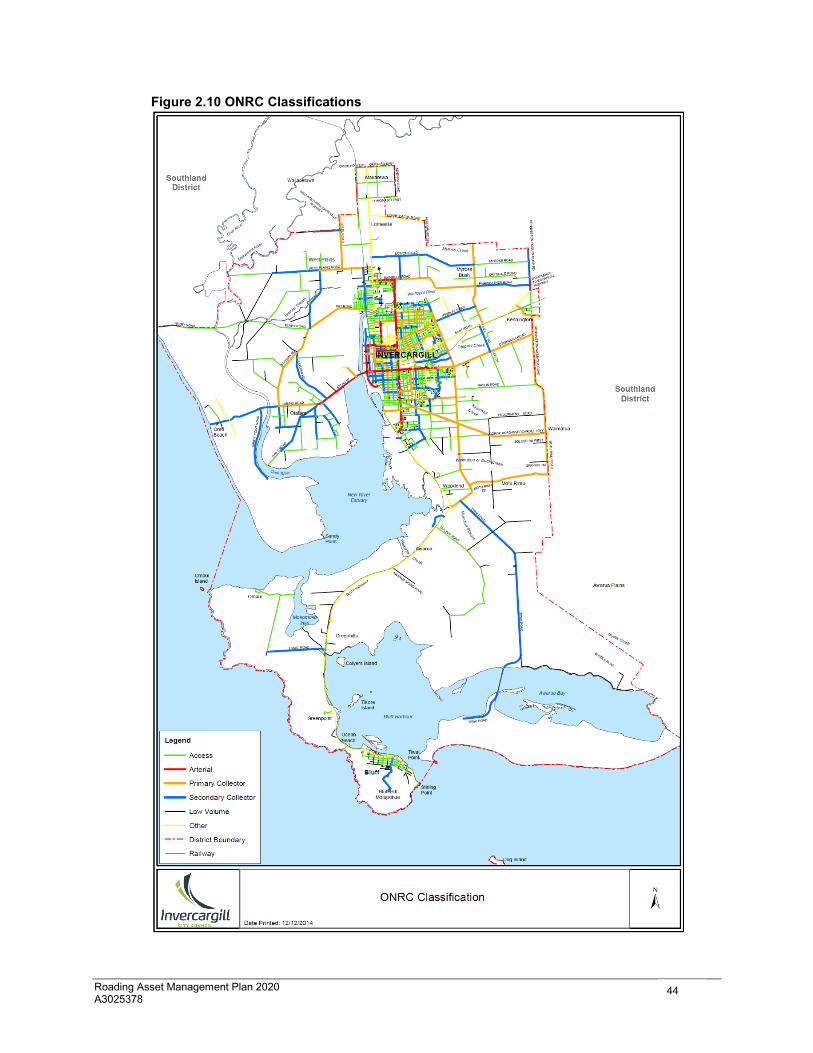
Roading Asset Management Plan 2020 A3025378
44
Figure 2.10 ONRC Classifications
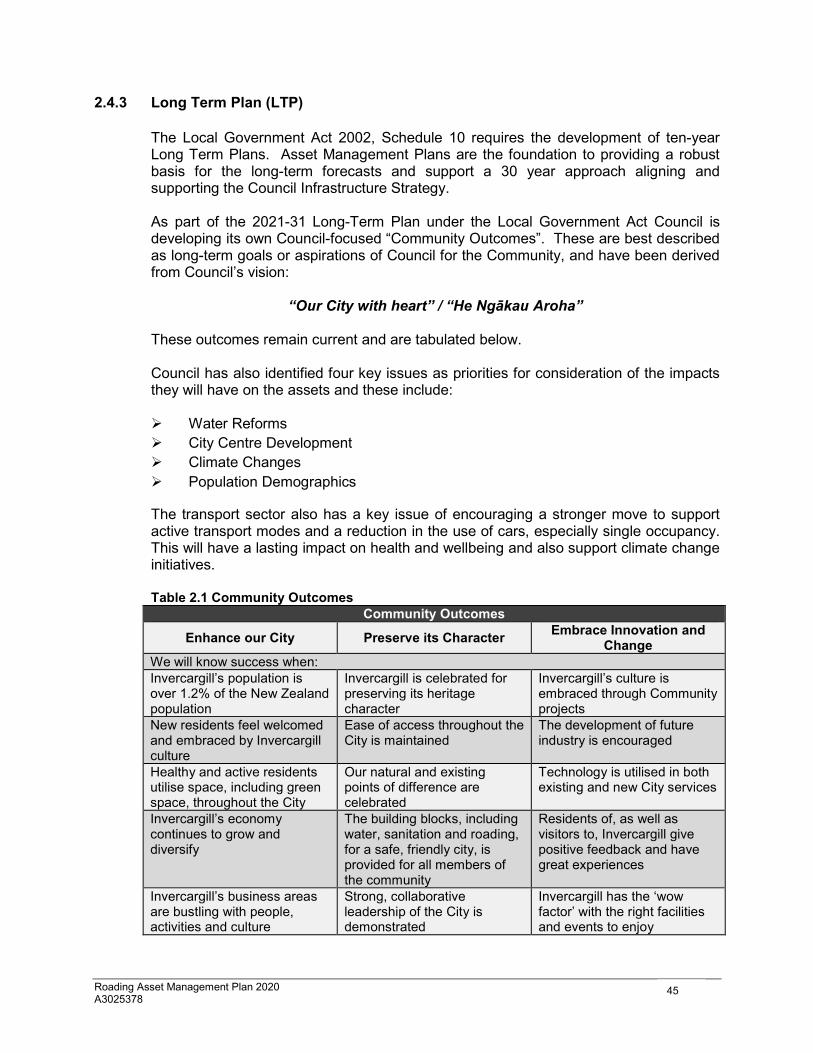
Roading Asset Management Plan 2020 A3025378
45
2.4.3 Long Term Plan (LTP)
The Local Government Act 2002, Schedule 10 requires the development of ten-year Long Term Plans. Asset Management Plans are the foundation to providing a robust basis for the long-term forecasts and support a 30 year approach aligning and supporting the Council Infrastructure Strategy. As part of the 2021-31 Long-Term Plan under the Local Government Act Council is developing its own Council-focused “Community Outcomes”. These are best described as long-term goals or aspirations of Council for the Community, and have been derived from Council’s vision:
“Our City with heart” / “He Ngākau Aroha” These outcomes remain current and are tabulated below. Council has also identified four key issues as priorities for consideration of the impacts they will have on the assets and these include: Water Reforms City Centre Development Climate Changes Population Demographics
The transport sector also has a key issue of encouraging a stronger move to support active transport modes and a reduction in the use of cars, especially single occupancy. This will have a lasting impact on health and wellbeing and also support climate change initiatives. Table 2.1 Community Outcomes
Community Outcomes
Enhance our City Preserve its Character Embrace Innovation and Change
We will know success when: Invercargill’s population is over 1.2% of the New Zealand population
Invercargill is celebrated for preserving its heritage character
Invercargill’s culture is embraced through Community projects
New residents feel welcomed and embraced by Invercargill culture
Ease of access throughout the City is maintained
The development of future industry is encouraged
Healthy and active residents utilise space, including green space, throughout the City
Our natural and existing points of difference are celebrated
Technology is utilised in both existing and new City services
Invercargill’s economy continues to grow and diversify
The building blocks, including water, sanitation and roading, for a safe, friendly city, is provided for all members of the community
Residents of, as well as visitors to, Invercargill give positive feedback and have great experiences
Invercargill’s business areas are bustling with people, activities and culture
Strong, collaborative leadership of the City is demonstrated
Invercargill has the ‘wow factor’ with the right facilities and events to enjoy
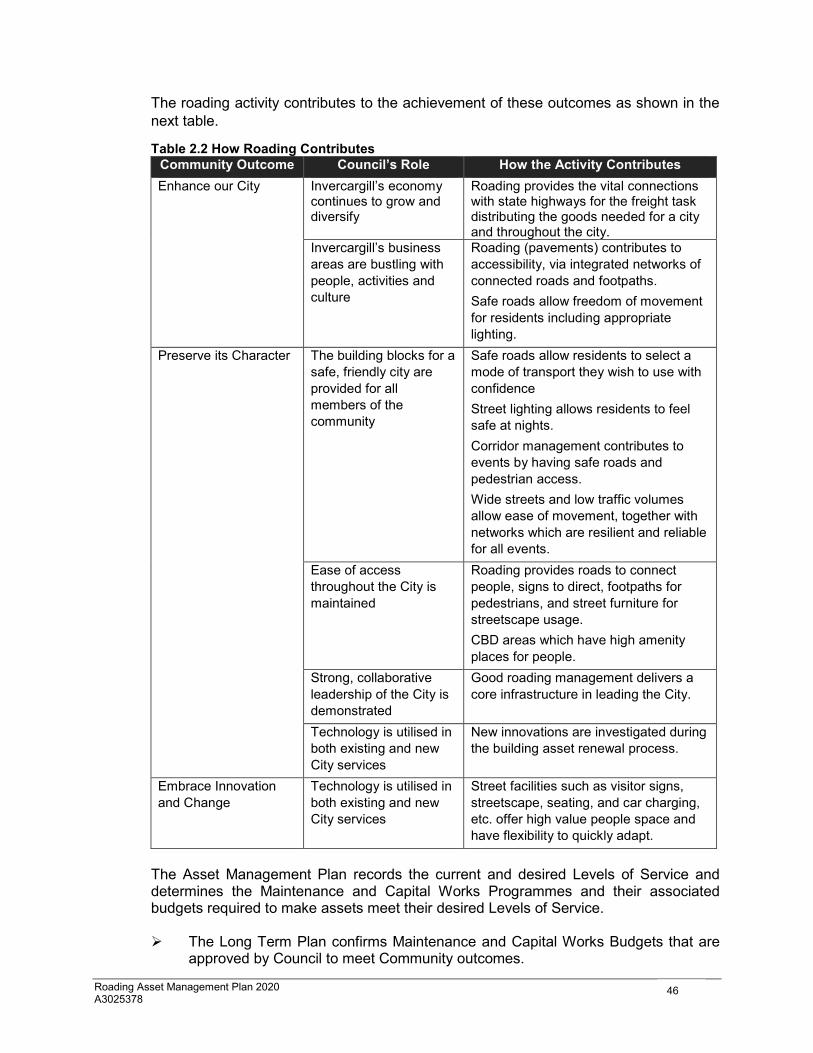
Roading Asset Management Plan 2020 A3025378
46
The roading activity contributes to the achievement of these outcomes as shown in the next table.
Table 2.2 How Roading Contributes Community Outcome Council’s Role How the Activity Contributes Enhance our City Invercargill’s economy
continues to grow and diversify
Roading provides the vital connections with state highways for the freight task distributing the goods needed for a city and throughout the city.
Invercargill’s business areas are bustling with people, activities and culture
Roading (pavements) contributes to accessibility, via integrated networks of connected roads and footpaths. Safe roads allow freedom of movement for residents including appropriate lighting.
Preserve its Character The building blocks for a safe, friendly city are provided for all members of the community
Safe roads allow residents to select a mode of transport they wish to use with confidence Street lighting allows residents to feel safe at nights. Corridor management contributes to events by having safe roads and pedestrian access. Wide streets and low traffic volumes allow ease of movement, together with networks which are resilient and reliable for all events.
Ease of access throughout the City is maintained
Roading provides roads to connect people, signs to direct, footpaths for pedestrians, and street furniture for streetscape usage. CBD areas which have high amenity places for people.
Strong, collaborative leadership of the City is demonstrated
Good roading management delivers a core infrastructure in leading the City.
Technology is utilised in both existing and new City services
New innovations are investigated during the building asset renewal process.
Embrace Innovation and Change
Technology is utilised in both existing and new City services
Street facilities such as visitor signs, streetscape, seating, and car charging, etc. offer high value people space and have flexibility to quickly adapt.
The Asset Management Plan records the current and desired Levels of Service and determines the Maintenance and Capital Works Programmes and their associated budgets required to make assets meet their desired Levels of Service. The Long Term Plan confirms Maintenance and Capital Works Budgets that are
approved by Council to meet Community outcomes.
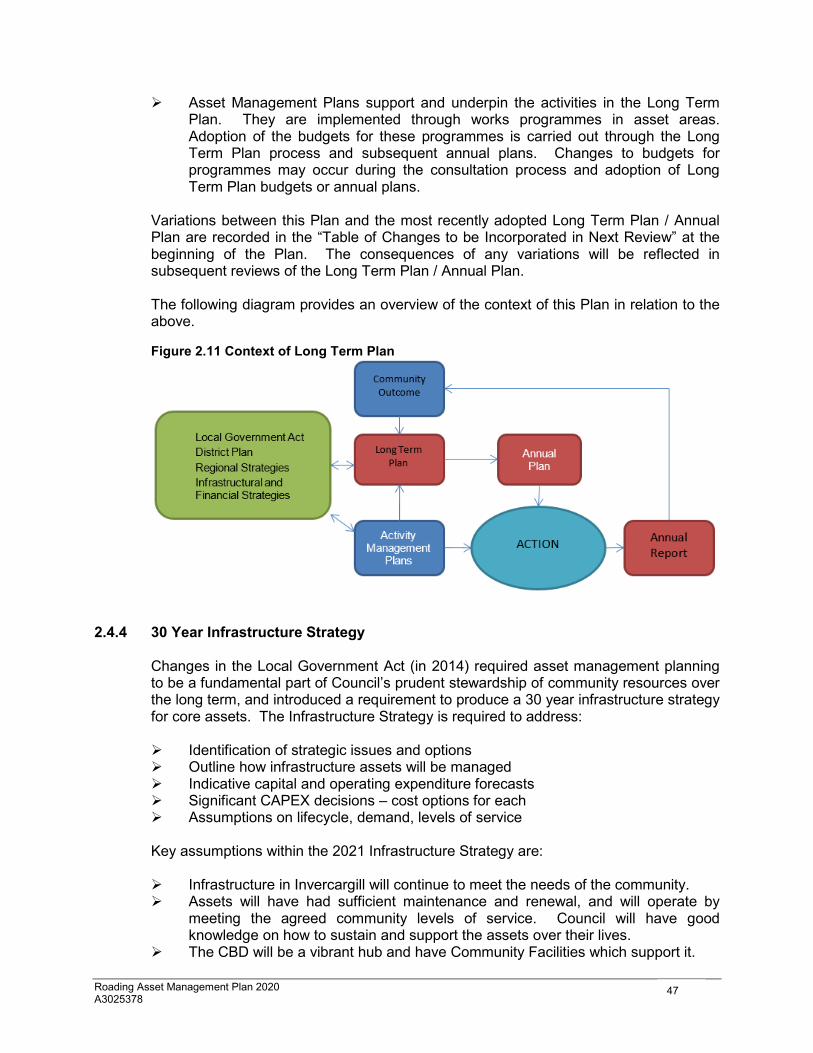
Roading Asset Management Plan 2020 A3025378
47
Asset Management Plans support and underpin the activities in the Long Term Plan. They are implemented through works programmes in asset areas. Adoption of the budgets for these programmes is carried out through the Long Term Plan process and subsequent annual plans. Changes to budgets for programmes may occur during the consultation process and adoption of Long Term Plan budgets or annual plans.
Variations between this Plan and the most recently adopted Long Term Plan / Annual Plan are recorded in the “Table of Changes to be Incorporated in Next Review” at the beginning of the Plan. The consequences of any variations will be reflected in subsequent reviews of the Long Term Plan / Annual Plan. The following diagram provides an overview of the context of this Plan in relation to the above.
Figure 2.11 Context of Long Term Plan
2.4.4 30 Year Infrastructure Strategy
Changes in the Local Government Act (in 2014) required asset management planning to be a fundamental part of Council’s prudent stewardship of community resources over the long term, and introduced a requirement to produce a 30 year infrastructure strategy for core assets. The Infrastructure Strategy is required to address: Identification of strategic issues and options Outline how infrastructure assets will be managed Indicative capital and operating expenditure forecasts Significant CAPEX decisions – cost options for each Assumptions on lifecycle, demand, levels of service
Key assumptions within the 2021 Infrastructure Strategy are: Infrastructure in Invercargill will continue to meet the needs of the community. Assets will have had sufficient maintenance and renewal, and will operate by
meeting the agreed community levels of service. Council will have good knowledge on how to sustain and support the assets over their lives.
The CBD will be a vibrant hub and have Community Facilities which support it.
Roading Asset Management Plan 2020 A3025378
48
Greater pressures on infrastructure renewals are expected as existing networks age towards their end of life. During the periods of the 1920s, 1960s and 1970s, large areas of the City and associated infrastructure were developed over short periods reflecting the growth of the City. These assets will require renewal as they reach end of life and this will involve significant financial costs. Council has been working the roading assets harder over the last years through lower investment. This was seen as ensuring the value of the assets was been consumed and implementing renewals at the right time. Assets vary in the way they are consumed, however when development has occurred in peaks there is a likelihood that these peaks, although smoother, will require increases in the investment level to meet the end of life requirements. This Plan identifies a step change is required in investment in the resurfacing area to meet this cycle. Climate change is signalled as a key issue. Climate change has many aspects and the risk to assets through increased frequency and severity of storm events, together with the predicted rise in sea level, will lead to increased flooding and disruption to continuity of services for the community with and without changes being made. Over the term of the Plan these are expected to be significant. One particular area is the access to Otatara and the use of Stead Street given the stopbank is at the end of life and has been overtopped regularly. The Strategy also notes that Council has a good road network but has unacceptable high safety risks (when considered against national peers) particularly for cycling and pedestrians and at intersections. Council’s investment in safety and in active modes will need to increase. Focus on these areas is required to make improvements to reduce crashes, deaths and serious injuries, especially to vulnerable users. Proposed strategic responses in the 2021 Infrastructure Strategy are: Maintain the current asset base – through the spatial management of future
growth. Focus on asset criticality – balance the risks of failure of some elements of the
system, allowing less important assets to “run to failure”. Focus on sound evidence-based activity decision making. Incrementally increase amounts of renewal of assets – managed increase in costs
over a period balanced by increased risk that earlier renewals of some infrastructure may be required.
Understand our community – aligning expectations with needs, sound communication.
Encourage Active Mode transport to improve the community health and wellbeing.
To give effect to these responses: Strengthen asset management practices Better investment decision making Engage our customers to better understand their needs and wants
Specific priority projects and options investigated in the Strategy relate to the Problem Statements in the 2021 AMP:
Roading Asset Management Plan 2020 A3025378
49
Utilise “optioneering” in the programme business case (services we deliver) when considering investment options (low, normal and high) for safety focussed improvements.
Select the option which supports the best and affordable outcome.
2.5 STRATEGIC ASSESSMENT
The principal objectives of the roading activity are: To provide a safe road environment. To provide an efficient, effective, reliable and resilient integrated road network for
all modes of transport. To support a change to active mode transport environment where use of cars is
reducing. To be able to demonstrate that services that are delivered are value for money. To provide and support access in the community (via Passenger Transport, Total
Mobility) and for vulnerable users. To invest appropriately to demonstrate that the assets are managed in a fiscally
prudent manner for current and future generations. Comply with statutes and regulations relating to territorial local government.
Achieving these objectives means delivering the investment benefits associated with the proposed programmes in this AMP.
2.5.1 Alignment with Strategic Context
This Plan looks to align with the Government Policy Statement for Transport (GPS2021), the One Network Road Classification (ONRC), the Otago-Southland Regional Land Transport Plan and the ICC Community Outcomes. This is demonstrated in Figure 2.12 and Table 2.3 below. This is a key area where Council, Community and Funders are engaged and linked via the local and national approaches.
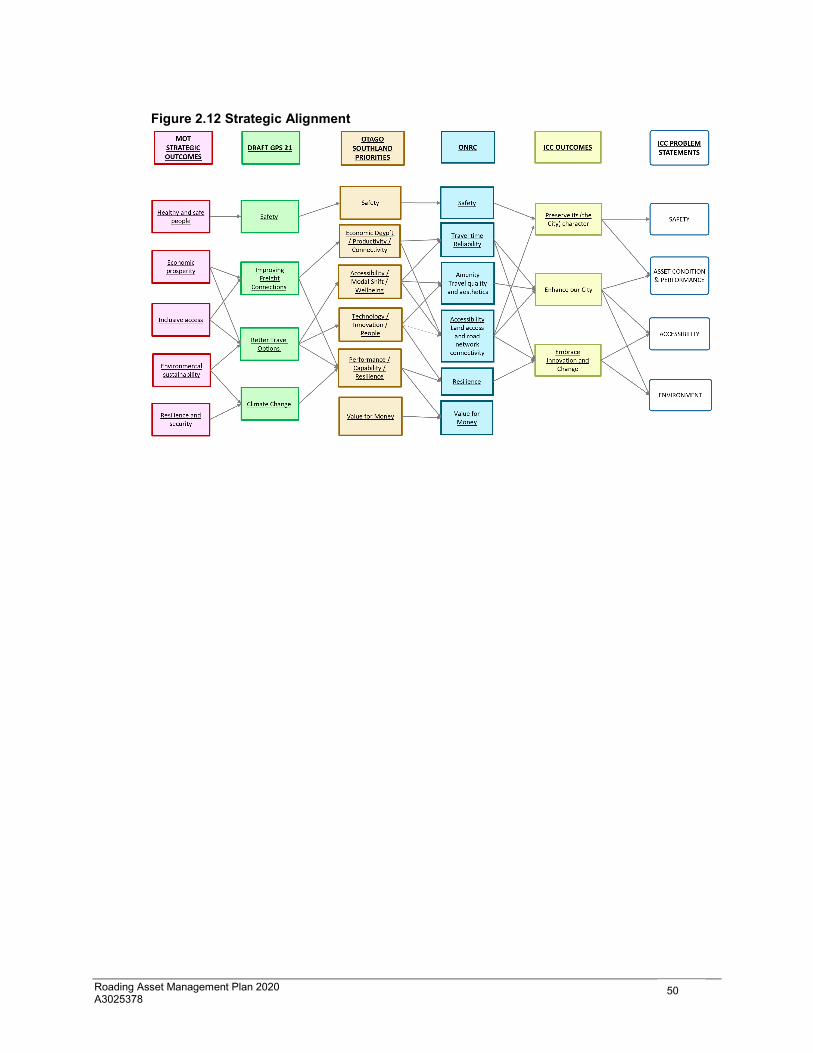
Roading Asset Management Plan 2020 A3025378
50
Figure 2.12 Strategic Alignment
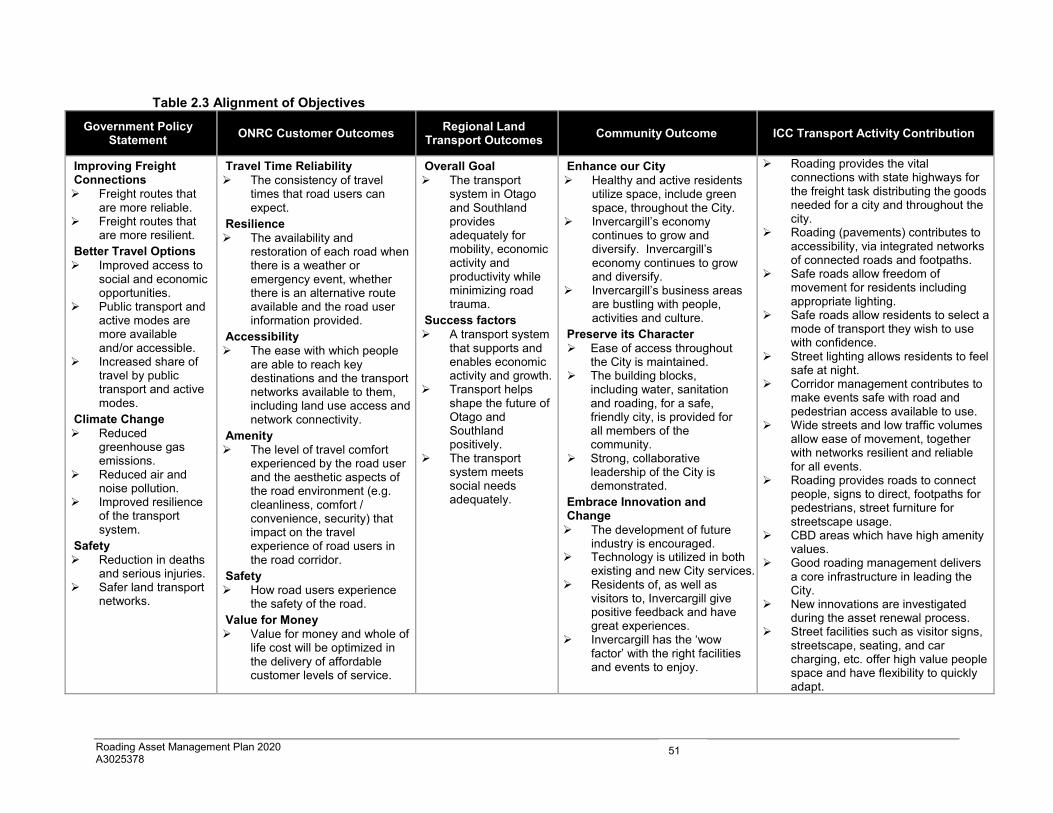
Roading Asset Management Plan 2020 A3025378
51
Table 2.3 Alignment of Objectives Government Policy
Statement ONRC Customer Outcomes Regional Land Transport Outcomes Community Outcome ICC Transport Activity Contribution
Improving Freight Connections Freight routes that
are more reliable. Freight routes that
are more resilient. Better Travel Options Improved access to
social and economic opportunities.
Public transport and active modes are more available and/or accessible.
Increased share of travel by public transport and active modes.
Climate Change Reduced
greenhouse gas emissions.
Reduced air and noise pollution.
Improved resilience of the transport system.
Safety Reduction in deaths
and serious injuries. Safer land transport
networks.
Travel Time Reliability The consistency of travel
times that road users can expect.
Resilience The availability and
restoration of each road when there is a weather or emergency event, whether there is an alternative route available and the road user information provided.
Accessibility The ease with which people
are able to reach key destinations and the transport networks available to them, including land use access and network connectivity.
Amenity The level of travel comfort
experienced by the road user and the aesthetic aspects of the road environment (e.g. cleanliness, comfort / convenience, security) that impact on the travel experience of road users in the road corridor.
Safety How road users experience
the safety of the road. Value for Money Value for money and whole of
life cost will be optimized in the delivery of affordable customer levels of service.
Overall Goal The transport
system in Otago and Southland provides adequately for mobility, economic activity and productivity while minimizing road trauma.
Success factors A transport system
that supports and enables economic activity and growth.
Transport helps shape the future of Otago and Southland positively.
The transport system meets social needs adequately.
Enhance our City Healthy and active residents
utilize space, include green space, throughout the City.
Invercargill’s economy continues to grow and diversify. Invercargill’s economy continues to grow and diversify.
Invercargill’s business areas are bustling with people, activities and culture.
Preserve its Character Ease of access throughout
the City is maintained. The building blocks,
including water, sanitation and roading, for a safe, friendly city, is provided for all members of the community.
Strong, collaborative leadership of the City is demonstrated.
Embrace Innovation and Change The development of future
industry is encouraged. Technology is utilized in both
existing and new City services. Residents of, as well as
visitors to, Invercargill give positive feedback and have great experiences.
Invercargill has the ‘wow factor’ with the right facilities and events to enjoy.
Roading provides the vital connections with state highways for the freight task distributing the goods needed for a city and throughout the city.
Roading (pavements) contributes to accessibility, via integrated networks of connected roads and footpaths.
Safe roads allow freedom of movement for residents including appropriate lighting.
Safe roads allow residents to select a mode of transport they wish to use with confidence.
Street lighting allows residents to feel safe at night.
Corridor management contributes to make events safe with road and pedestrian access available to use.
Wide streets and low traffic volumes allow ease of movement, together with networks resilient and reliable for all events.
Roading provides roads to connect people, signs to direct, footpaths for pedestrians, street furniture for streetscape usage.
CBD areas which have high amenity values.
Good roading management delivers a core infrastructure in leading the City.
New innovations are investigated during the asset renewal process.
Street facilities such as visitor signs, streetscape, seating, and car charging, etc. offer high value people space and have flexibility to quickly adapt.
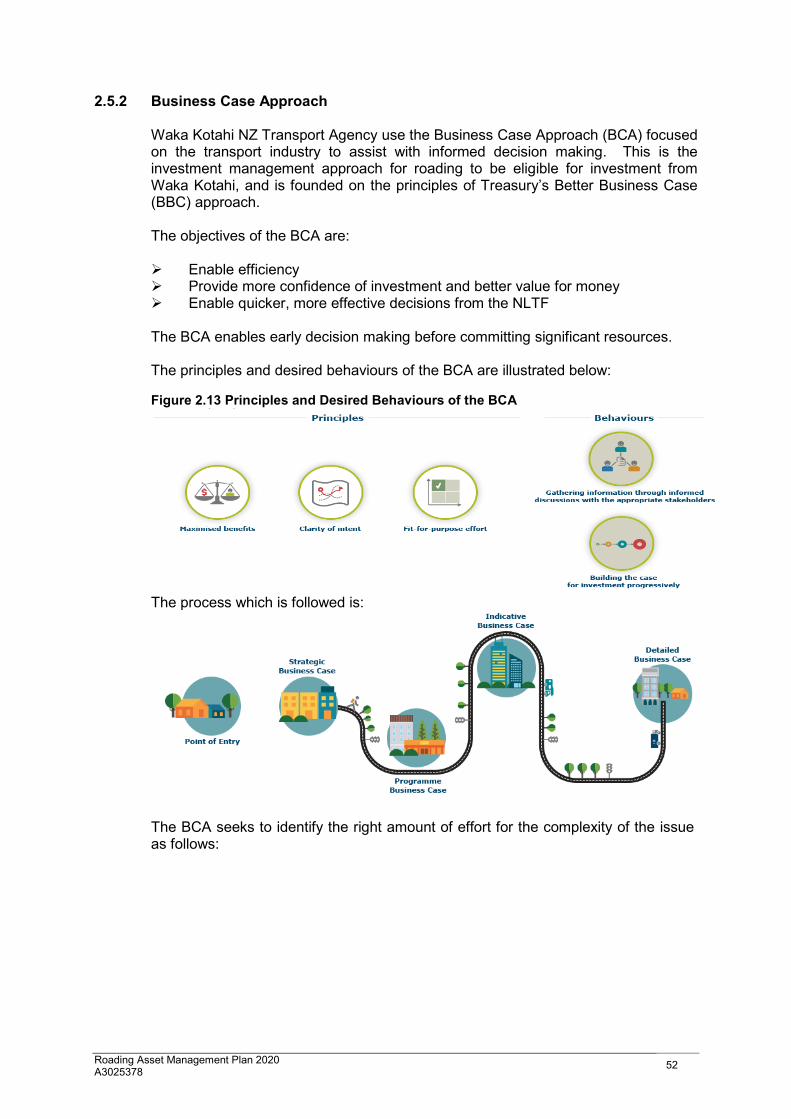
Roading Asset Management Plan 2020 A3025378 52
2.5.2 Business Case Approach
Waka Kotahi NZ Transport Agency use the Business Case Approach (BCA) focused on the transport industry to assist with informed decision making. This is the investment management approach for roading to be eligible for investment from Waka Kotahi, and is founded on the principles of Treasury’s Better Business Case (BBC) approach. The objectives of the BCA are: Enable efficiency Provide more confidence of investment and better value for money Enable quicker, more effective decisions from the NLTF
The BCA enables early decision making before committing significant resources. The principles and desired behaviours of the BCA are illustrated below: Figure 2.13 Principles and Desired Behaviours of the BCA
The process which is followed is:
The BCA seeks to identify the right amount of effort for the complexity of the issue as follows:
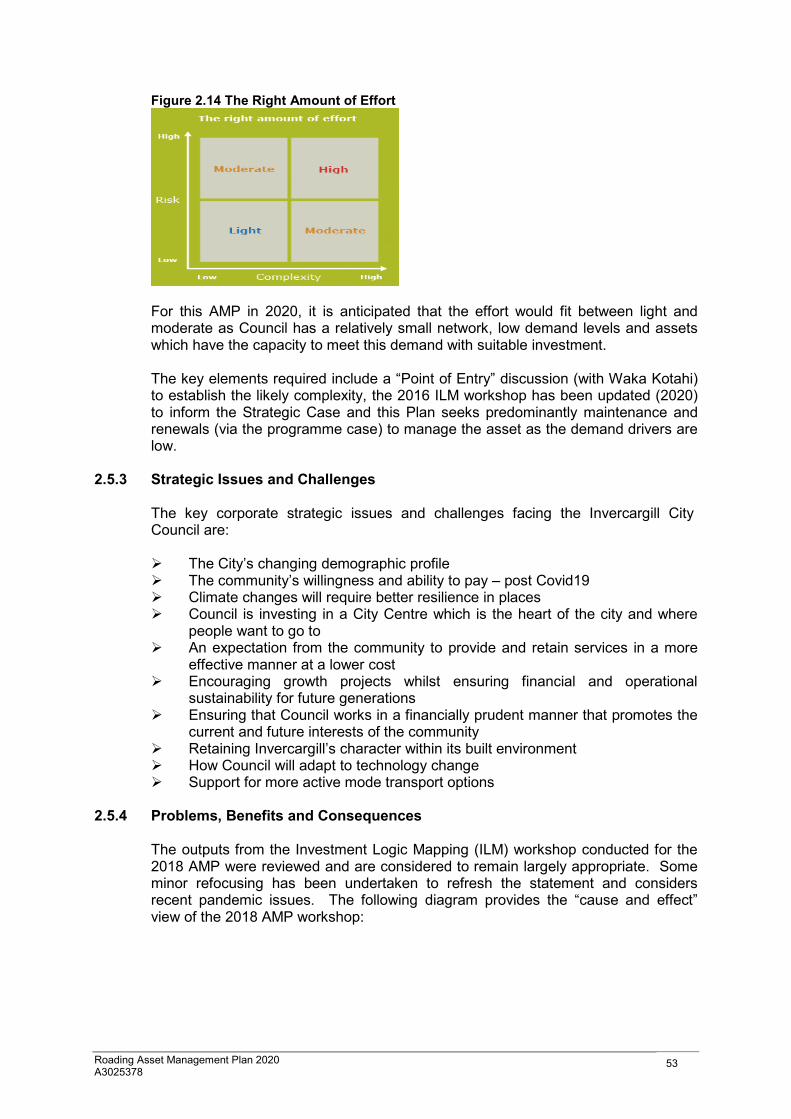
Roading Asset Management Plan 2020 A3025378
53
Figure 2.14 The Right Amount of Effort
For this AMP in 2020, it is anticipated that the effort would fit between light and moderate as Council has a relatively small network, low demand levels and assets which have the capacity to meet this demand with suitable investment. The key elements required include a “Point of Entry” discussion (with Waka Kotahi) to establish the likely complexity, the 2016 ILM workshop has been updated (2020) to inform the Strategic Case and this Plan seeks predominantly maintenance and renewals (via the programme case) to manage the asset as the demand drivers are low.
2.5.3 Strategic Issues and Challenges The key corporate strategic issues and challenges facing the Invercargill City Council are: The City’s changing demographic profile The community’s willingness and ability to pay – post Covid19 Climate changes will require better resilience in places Council is investing in a City Centre which is the heart of the city and where
people want to go to An expectation from the community to provide and retain services in a more
effective manner at a lower cost Encouraging growth projects whilst ensuring financial and operational
sustainability for future generations Ensuring that Council works in a financially prudent manner that promotes the
current and future interests of the community Retaining Invercargill’s character within its built environment How Council will adapt to technology change Support for more active mode transport options
2.5.4 Problems, Benefits and Consequences
The outputs from the Investment Logic Mapping (ILM) workshop conducted for the 2018 AMP were reviewed and are considered to remain largely appropriate. Some minor refocusing has been undertaken to refresh the statement and considers recent pandemic issues. The following diagram provides the “cause and effect” view of the 2018 AMP workshop:
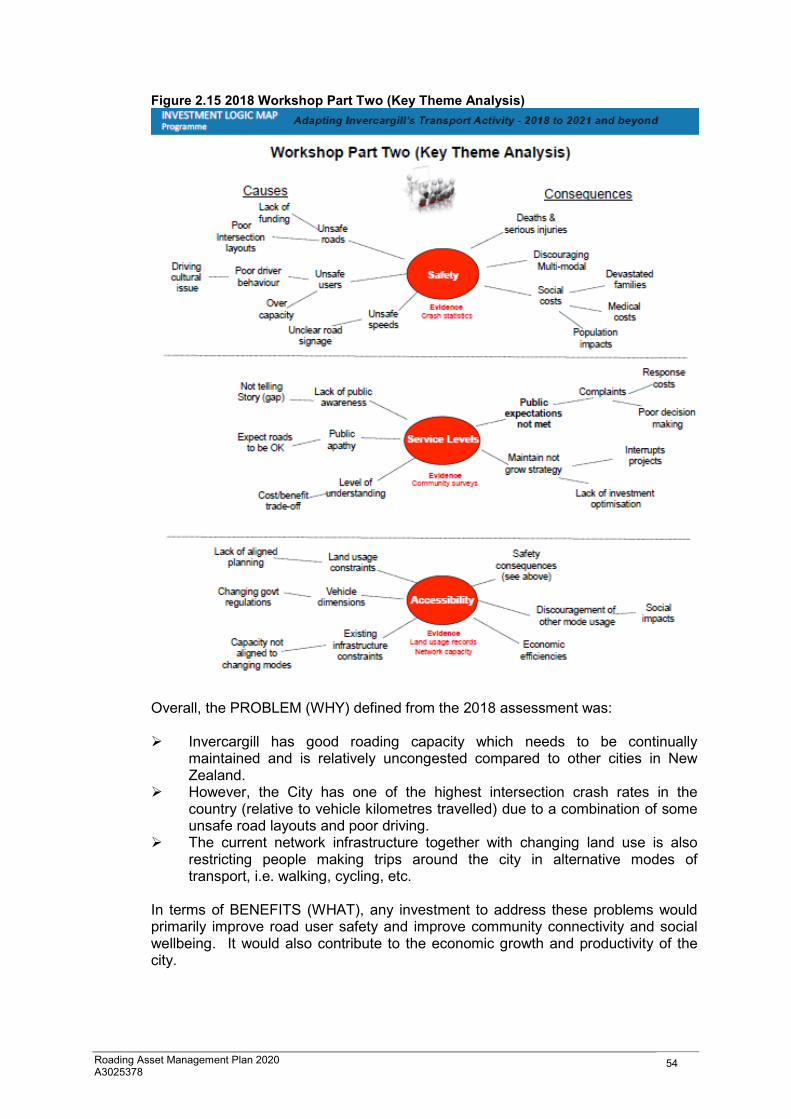
Roading Asset Management Plan 2020 A3025378
54
Figure 2.15 2018 Workshop Part Two (Key Theme Analysis)
Overall, the PROBLEM (WHY) defined from the 2018 assessment was: Invercargill has good roading capacity which needs to be continually
maintained and is relatively uncongested compared to other cities in New Zealand.
However, the City has one of the highest intersection crash rates in the country (relative to vehicle kilometres travelled) due to a combination of some unsafe road layouts and poor driving.
The current network infrastructure together with changing land use is also restricting people making trips around the city in alternative modes of transport, i.e. walking, cycling, etc.
In terms of BENEFITS (WHAT), any investment to address these problems would primarily improve road user safety and improve community connectivity and social wellbeing. It would also contribute to the economic growth and productivity of the city.
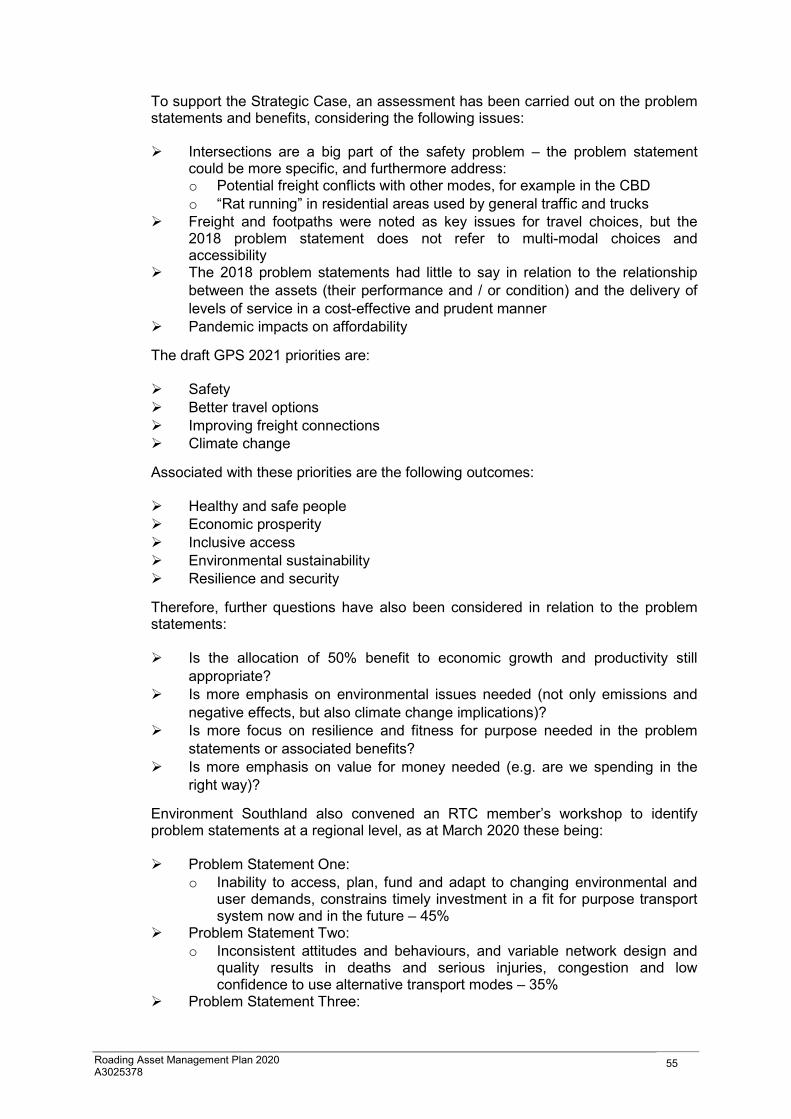
Roading Asset Management Plan 2020 A3025378
55
To support the Strategic Case, an assessment has been carried out on the problem statements and benefits, considering the following issues: Intersections are a big part of the safety problem – the problem statement
could be more specific, and furthermore address: o Potential freight conflicts with other modes, for example in the CBD o “Rat running” in residential areas used by general traffic and trucks
Freight and footpaths were noted as key issues for travel choices, but the 2018 problem statement does not refer to multi-modal choices and accessibility
The 2018 problem statements had little to say in relation to the relationship between the assets (their performance and / or condition) and the delivery of levels of service in a cost-effective and prudent manner
Pandemic impacts on affordability
The draft GPS 2021 priorities are: Safety Better travel options Improving freight connections Climate change
Associated with these priorities are the following outcomes: Healthy and safe people Economic prosperity Inclusive access Environmental sustainability Resilience and security
Therefore, further questions have also been considered in relation to the problem statements: Is the allocation of 50% benefit to economic growth and productivity still
appropriate? Is more emphasis on environmental issues needed (not only emissions and
negative effects, but also climate change implications)? Is more focus on resilience and fitness for purpose needed in the problem
statements or associated benefits? Is more emphasis on value for money needed (e.g. are we spending in the
right way)?
Environment Southland also convened an RTC member’s workshop to identify problem statements at a regional level, as at March 2020 these being: Problem Statement One:
o Inability to access, plan, fund and adapt to changing environmental and user demands, constrains timely investment in a fit for purpose transport system now and in the future – 45%
Problem Statement Two: o Inconsistent attitudes and behaviours, and variable network design and
quality results in deaths and serious injuries, congestion and low confidence to use alternative transport modes – 35%
Problem Statement Three:
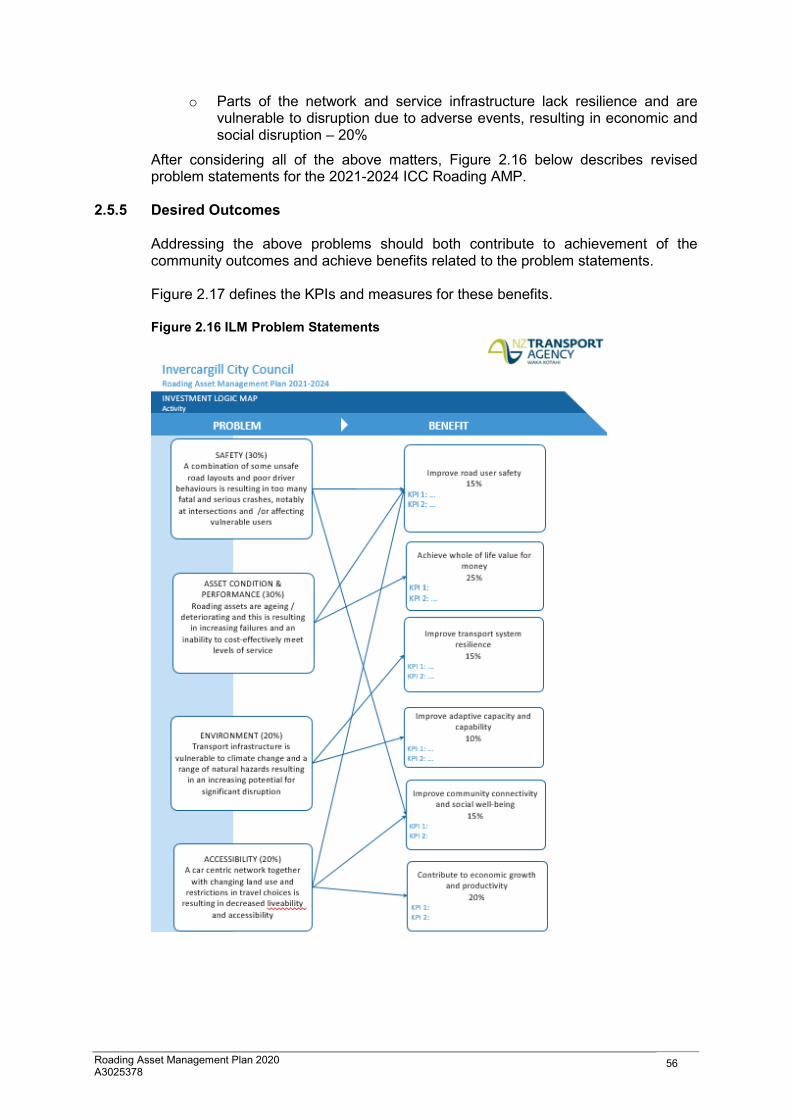
Roading Asset Management Plan 2020 A3025378
56
o Parts of the network and service infrastructure lack resilience and are vulnerable to disruption due to adverse events, resulting in economic and social disruption – 20%
After considering all of the above matters, Figure 2.16 below describes revised problem statements for the 2021-2024 ICC Roading AMP.
2.5.5 Desired Outcomes
Addressing the above problems should both contribute to achievement of the community outcomes and achieve benefits related to the problem statements. Figure 2.17 defines the KPIs and measures for these benefits. Figure 2.16 ILM Problem Statements
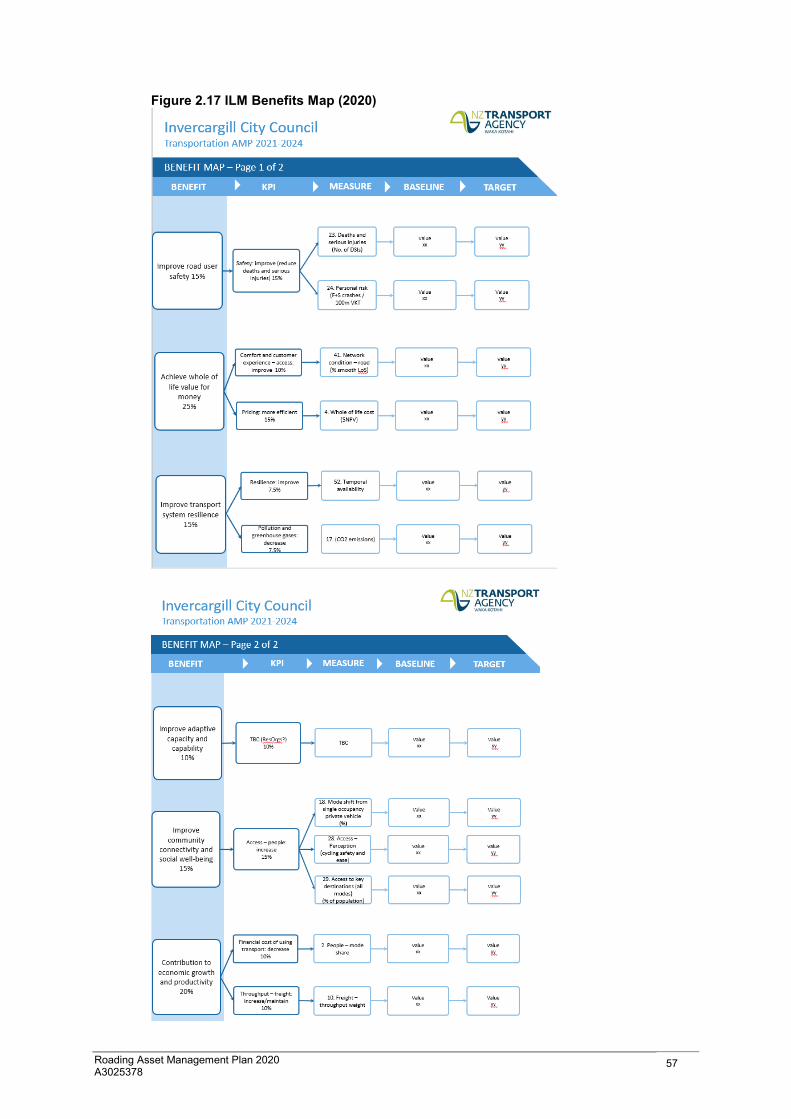
Roading Asset Management Plan 2020 A3025378
57
Figure 2.17 ILM Benefits Map (2020)
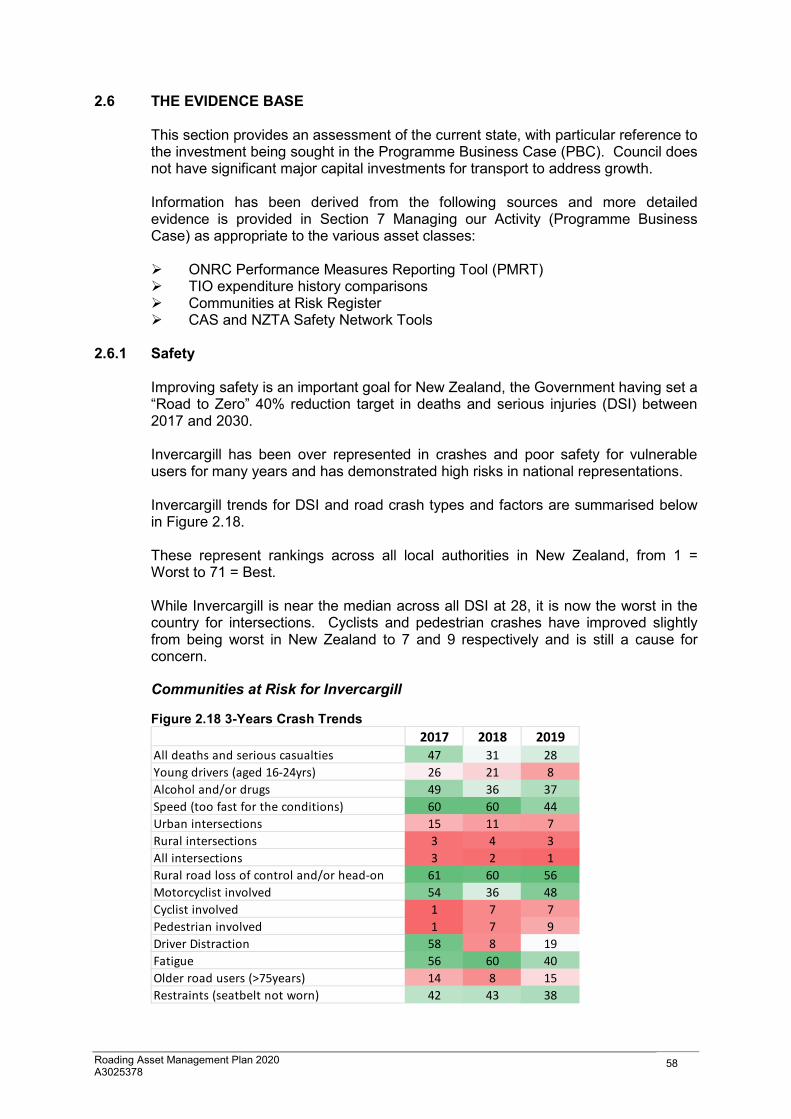
Roading Asset Management Plan 2020 A3025378
58
2.6 THE EVIDENCE BASE
This section provides an assessment of the current state, with particular reference to the investment being sought in the Programme Business Case (PBC). Council does not have significant major capital investments for transport to address growth. Information has been derived from the following sources and more detailed evidence is provided in Section 7 Managing our Activity (Programme Business Case) as appropriate to the various asset classes: ONRC Performance Measures Reporting Tool (PMRT) TIO expenditure history comparisons Communities at Risk Register CAS and NZTA Safety Network Tools
2.6.1 Safety
Improving safety is an important goal for New Zealand, the Government having set a “Road to Zero” 40% reduction target in deaths and serious injuries (DSI) between 2017 and 2030. Invercargill has been over represented in crashes and poor safety for vulnerable users for many years and has demonstrated high risks in national representations. Invercargill trends for DSI and road crash types and factors are summarised below in Figure 2.18. These represent rankings across all local authorities in New Zealand, from 1 = Worst to 71 = Best. While Invercargill is near the median across all DSI at 28, it is now the worst in the country for intersections. Cyclists and pedestrian crashes have improved slightly from being worst in New Zealand to 7 and 9 respectively and is still a cause for concern.
Communities at Risk for Invercargill
Figure 2.18 3-Years Crash Trends
2017 2018 2019All deaths and serious casualties 47 31 28Young drivers (aged 16‐24yrs) 26 21 8Alcohol and/or drugs 49 36 37Speed (too fast for the conditions) 60 60 44Urban intersections 15 11 7Rural intersections 3 4 3All intersections 3 2 1Rural road loss of control and/or head‐on 61 60 56Motorcyclist involved 54 36 48Cyclist involved 1 7 7Pedestrian involved 1 7 9Driver Distraction 58 8 19Fatigue 56 60 40Older road users (>75years) 14 8 15Restraints (seatbelt not worn) 42 43 38
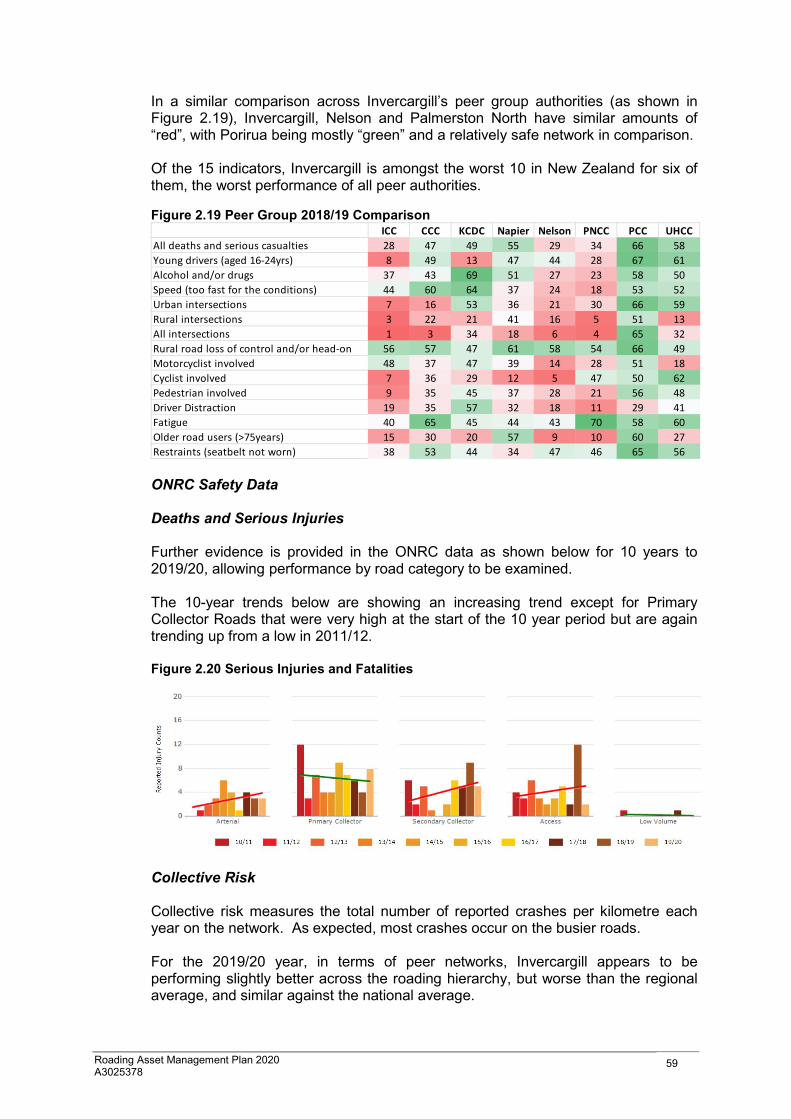
Roading Asset Management Plan 2020 A3025378
59
In a similar comparison across Invercargill’s peer group authorities (as shown in Figure 2.19), Invercargill, Nelson and Palmerston North have similar amounts of “red”, with Porirua being mostly “green” and a relatively safe network in comparison. Of the 15 indicators, Invercargill is amongst the worst 10 in New Zealand for six of them, the worst performance of all peer authorities.
Figure 2.19 Peer Group 2018/19 Comparison
ONRC Safety Data
Deaths and Serious Injuries Further evidence is provided in the ONRC data as shown below for 10 years to 2019/20, allowing performance by road category to be examined. The 10-year trends below are showing an increasing trend except for Primary Collector Roads that were very high at the start of the 10 year period but are again trending up from a low in 2011/12.
Figure 2.20 Serious Injuries and Fatalities
Collective Risk Collective risk measures the total number of reported crashes per kilometre each year on the network. As expected, most crashes occur on the busier roads. For the 2019/20 year, in terms of peer networks, Invercargill appears to be performing slightly better across the roading hierarchy, but worse than the regional average, and similar against the national average.
ICC CCC KCDC Napier Nelson PNCC PCC UHCCAll deaths and serious casualties 28 47 49 55 29 34 66 58Young drivers (aged 16‐24yrs) 8 49 13 47 44 28 67 61Alcohol and/or drugs 37 43 69 51 27 23 58 50Speed (too fast for the conditions) 44 60 64 37 24 18 53 52Urban intersections 7 16 53 36 21 30 66 59Rural intersections 3 22 21 41 16 5 51 13All intersections 1 3 34 18 6 4 65 32Rural road loss of control and/or head‐on 56 57 47 61 58 54 66 49Motorcyclist involved 48 37 47 39 14 28 51 18Cyclist involved 7 36 29 12 5 47 50 62Pedestrian involved 9 35 45 37 28 21 56 48Driver Distraction 19 35 57 32 18 11 29 41Fatigue 40 65 45 44 43 70 58 60Older road users (>75years) 15 30 20 57 9 10 60 27Restraints (seatbelt not worn) 38 53 44 34 47 46 65 56
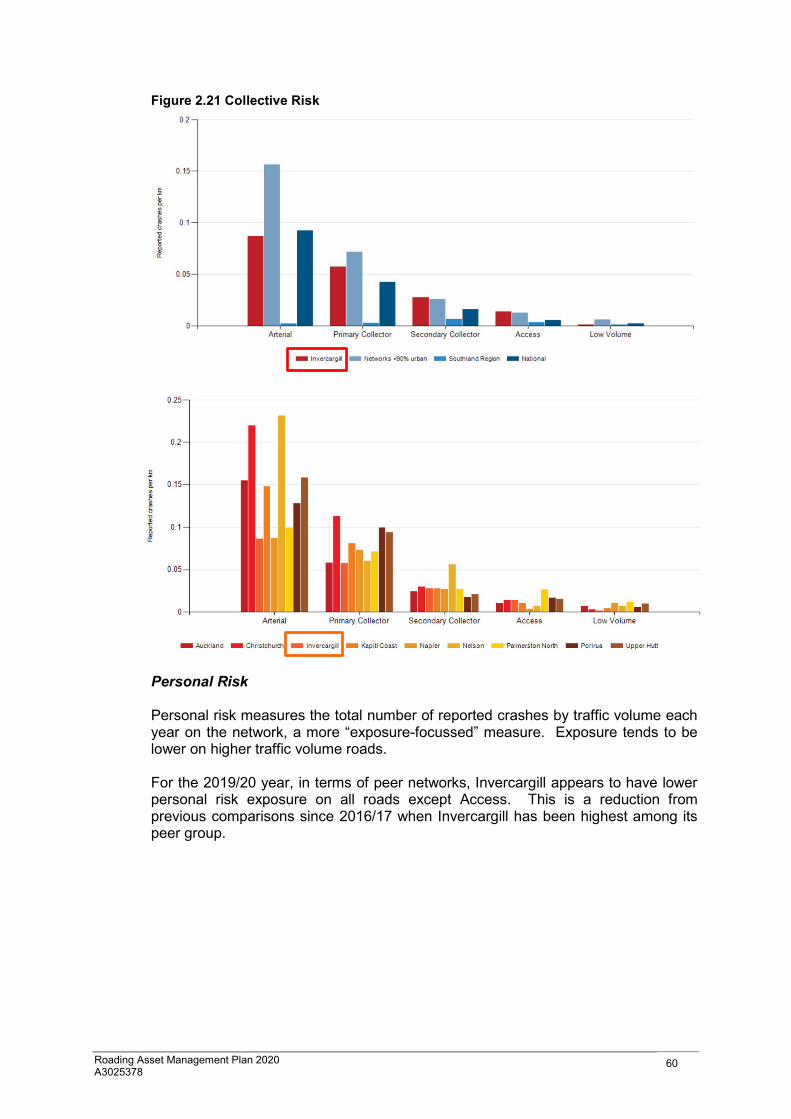
Roading Asset Management Plan 2020 A3025378
60
Figure 2.21 Collective Risk
Personal Risk Personal risk measures the total number of reported crashes by traffic volume each year on the network, a more “exposure-focussed” measure. Exposure tends to be lower on higher traffic volume roads. For the 2019/20 year, in terms of peer networks, Invercargill appears to have lower personal risk exposure on all roads except Access. This is a reduction from previous comparisons since 2016/17 when Invercargill has been highest among its peer group.
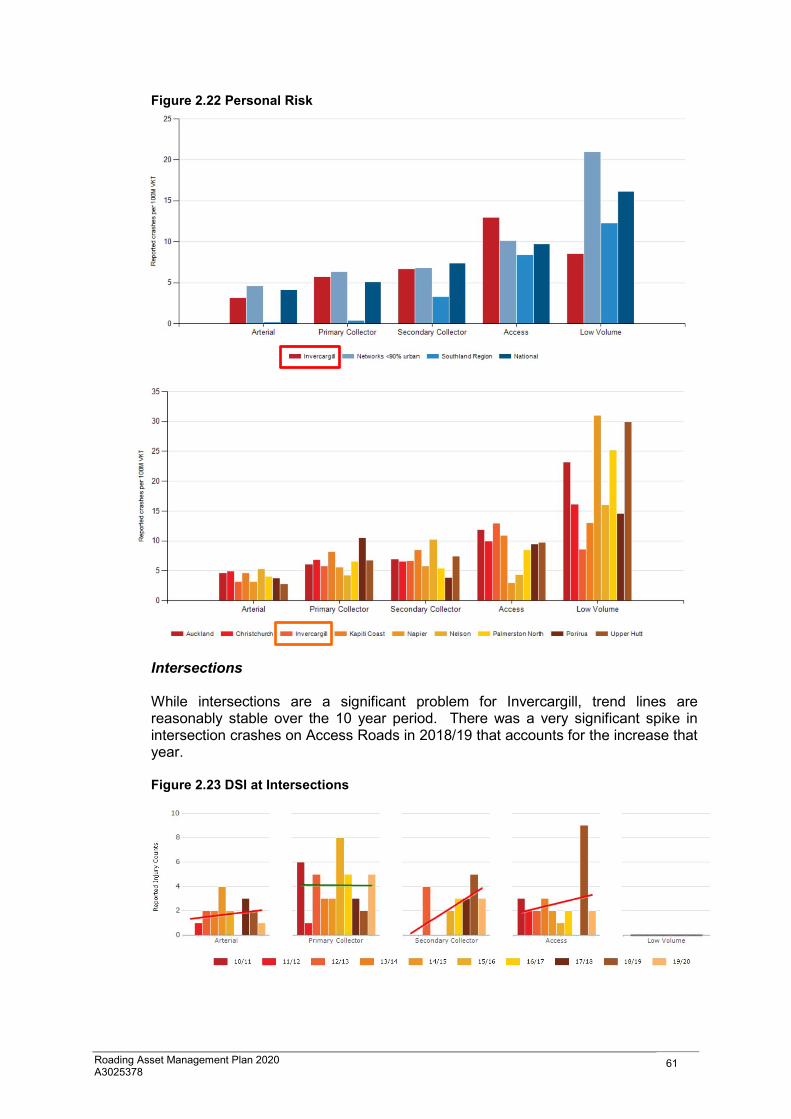
Roading Asset Management Plan 2020 A3025378
61
Figure 2.22 Personal Risk
Intersections While intersections are a significant problem for Invercargill, trend lines are reasonably stable over the 10 year period. There was a very significant spike in intersection crashes on Access Roads in 2018/19 that accounts for the increase that year. Figure 2.23 DSI at Intersections
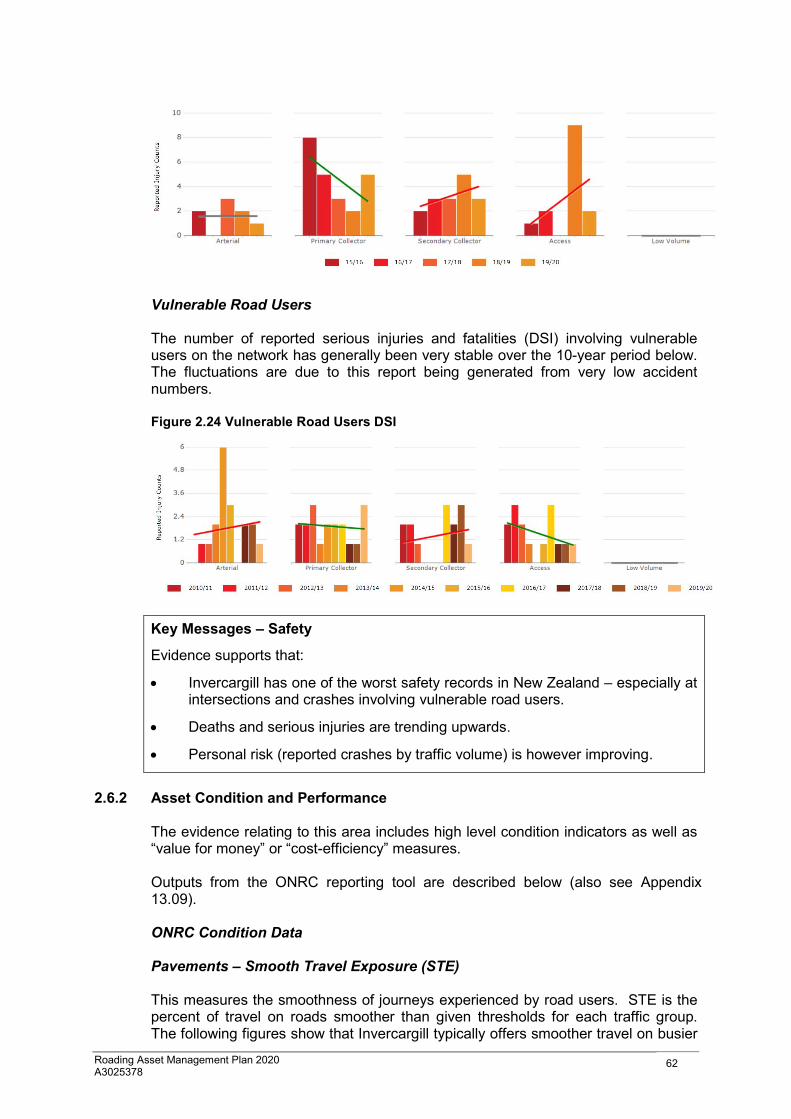
Roading Asset Management Plan 2020 A3025378
62
Vulnerable Road Users The number of reported serious injuries and fatalities (DSI) involving vulnerable users on the network has generally been very stable over the 10-year period below. The fluctuations are due to this report being generated from very low accident numbers. Figure 2.24 Vulnerable Road Users DSI
Key Messages – Safety
Evidence supports that:
• Invercargill has one of the worst safety records in New Zealand – especially at intersections and crashes involving vulnerable road users.
• Deaths and serious injuries are trending upwards.
• Personal risk (reported crashes by traffic volume) is however improving.
2.6.2 Asset Condition and Performance
The evidence relating to this area includes high level condition indicators as well as “value for money” or “cost-efficiency” measures. Outputs from the ONRC reporting tool are described below (also see Appendix 13.09).
ONRC Condition Data
Pavements – Smooth Travel Exposure (STE) This measures the smoothness of journeys experienced by road users. STE is the percent of travel on roads smoother than given thresholds for each traffic group. The following figures show that Invercargill typically offers smoother travel on busier
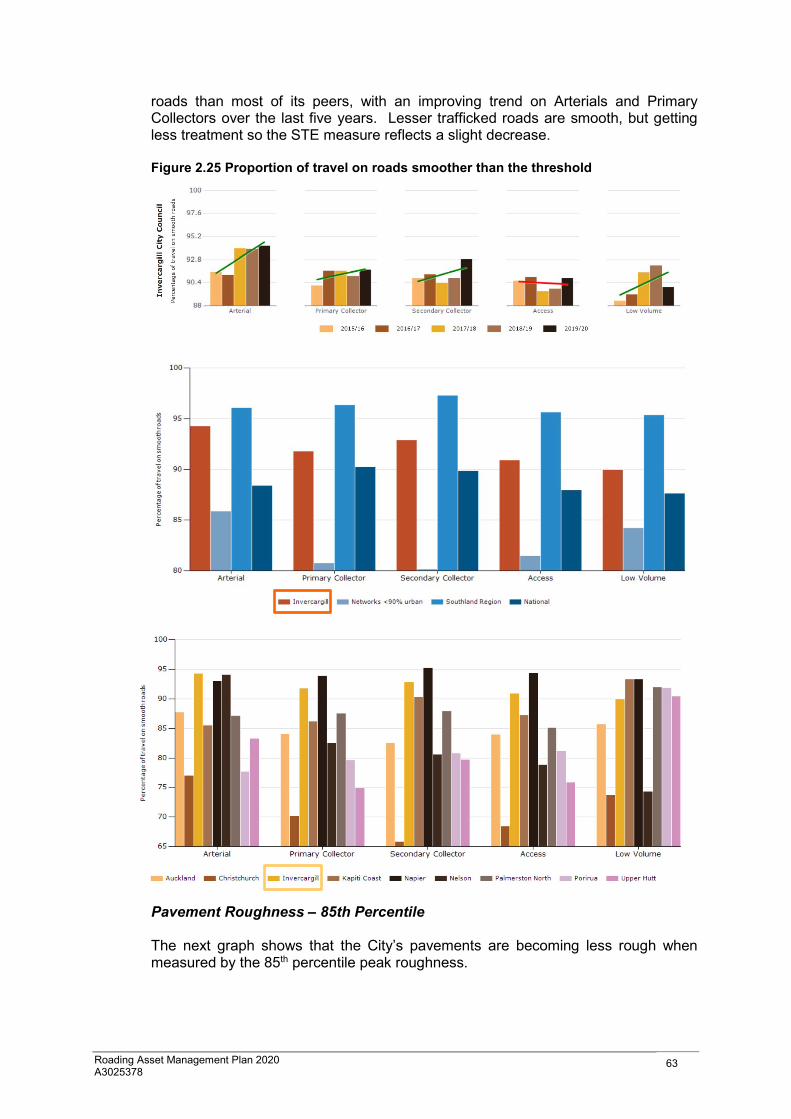
Roading Asset Management Plan 2020 A3025378
63
roads than most of its peers, with an improving trend on Arterials and Primary Collectors over the last five years. Lesser trafficked roads are smooth, but getting less treatment so the STE measure reflects a slight decrease. Figure 2.25 Proportion of travel on roads smoother than the threshold
Pavement Roughness – 85th Percentile The next graph shows that the City’s pavements are becoming less rough when measured by the 85th percentile peak roughness.
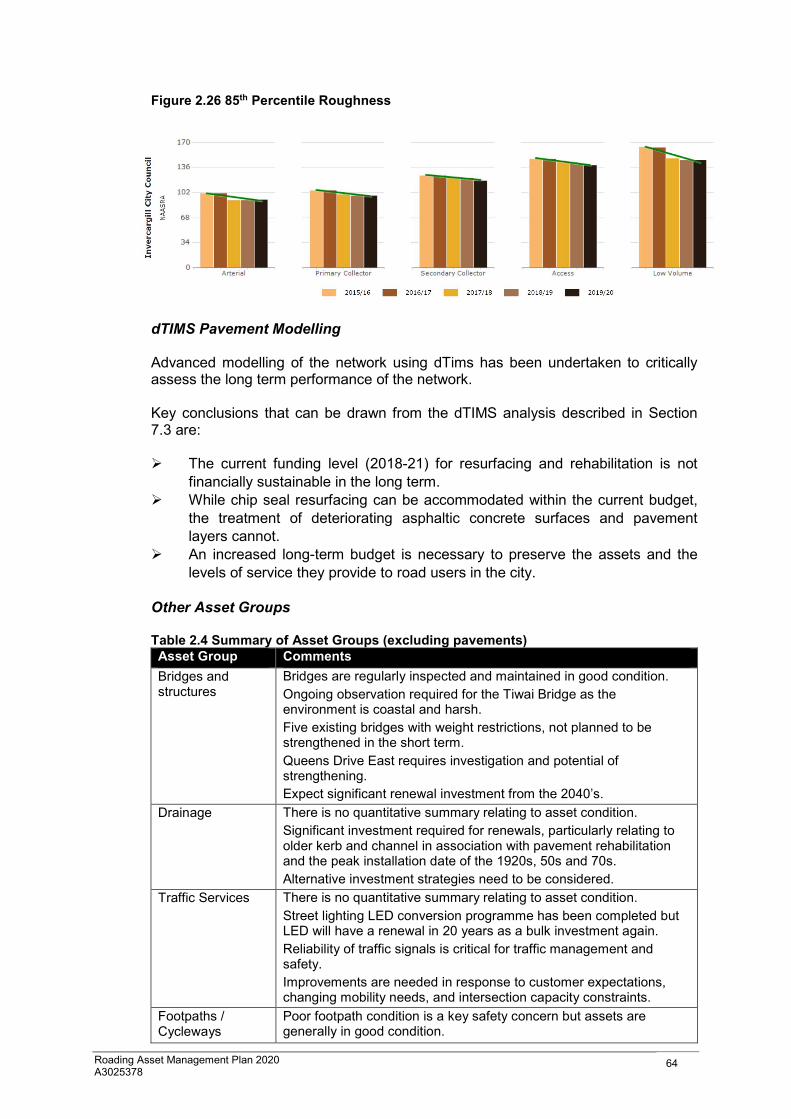
Roading Asset Management Plan 2020 A3025378
64
Figure 2.26 85th Percentile Roughness
dTIMS Pavement Modelling
Advanced modelling of the network using dTims has been undertaken to critically assess the long term performance of the network. Key conclusions that can be drawn from the dTIMS analysis described in Section 7.3 are: The current funding level (2018-21) for resurfacing and rehabilitation is not
financially sustainable in the long term. While chip seal resurfacing can be accommodated within the current budget,
the treatment of deteriorating asphaltic concrete surfaces and pavement layers cannot.
An increased long-term budget is necessary to preserve the assets and the levels of service they provide to road users in the city.
Other Asset Groups
Table 2.4 Summary of Asset Groups (excluding pavements) Asset Group Comments Bridges and structures
Bridges are regularly inspected and maintained in good condition. Ongoing observation required for the Tiwai Bridge as the environment is coastal and harsh. Five existing bridges with weight restrictions, not planned to be strengthened in the short term. Queens Drive East requires investigation and potential of strengthening. Expect significant renewal investment from the 2040’s.
Drainage There is no quantitative summary relating to asset condition. Significant investment required for renewals, particularly relating to older kerb and channel in association with pavement rehabilitation and the peak installation date of the 1920s, 50s and 70s. Alternative investment strategies need to be considered.
Traffic Services There is no quantitative summary relating to asset condition. Street lighting LED conversion programme has been completed but LED will have a renewal in 20 years as a bulk investment again. Reliability of traffic signals is critical for traffic management and safety. Improvements are needed in response to customer expectations, changing mobility needs, and intersection capacity constraints.
Footpaths / Cycleways
Poor footpath condition is a key safety concern but assets are generally in good condition.
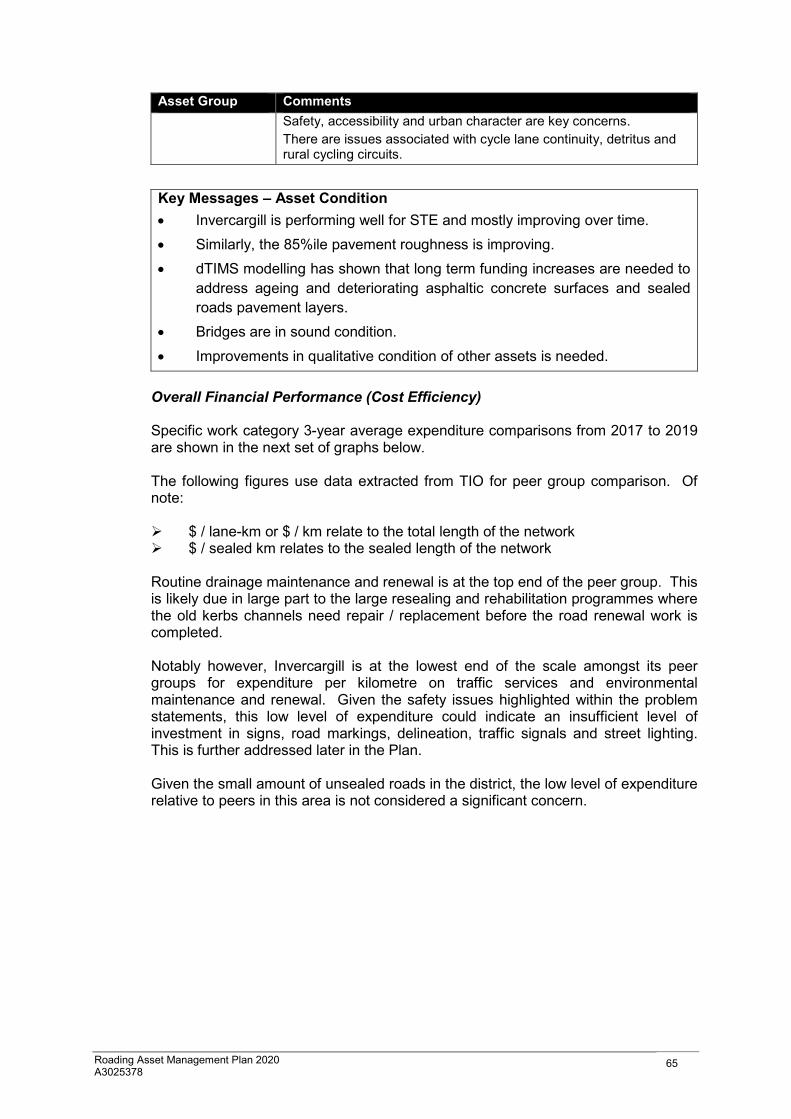
Roading Asset Management Plan 2020 A3025378
65
Asset Group Comments Safety, accessibility and urban character are key concerns. There are issues associated with cycle lane continuity, detritus and rural cycling circuits.
Key Messages – Asset Condition • Invercargill is performing well for STE and mostly improving over time. • Similarly, the 85%ile pavement roughness is improving. • dTIMS modelling has shown that long term funding increases are needed to
address ageing and deteriorating asphaltic concrete surfaces and sealed roads pavement layers.
• Bridges are in sound condition. • Improvements in qualitative condition of other assets is needed.
Overall Financial Performance (Cost Efficiency)
Specific work category 3-year average expenditure comparisons from 2017 to 2019 are shown in the next set of graphs below.
The following figures use data extracted from TIO for peer group comparison. Of note: $ / lane-km or $ / km relate to the total length of the network $ / sealed km relates to the sealed length of the network
Routine drainage maintenance and renewal is at the top end of the peer group. This is likely due in large part to the large resealing and rehabilitation programmes where the old kerbs channels need repair / replacement before the road renewal work is completed.
Notably however, Invercargill is at the lowest end of the scale amongst its peer groups for expenditure per kilometre on traffic services and environmental maintenance and renewal. Given the safety issues highlighted within the problem statements, this low level of expenditure could indicate an insufficient level of investment in signs, road markings, delineation, traffic signals and street lighting. This is further addressed later in the Plan. Given the small amount of unsealed roads in the district, the low level of expenditure relative to peers in this area is not considered a significant concern.
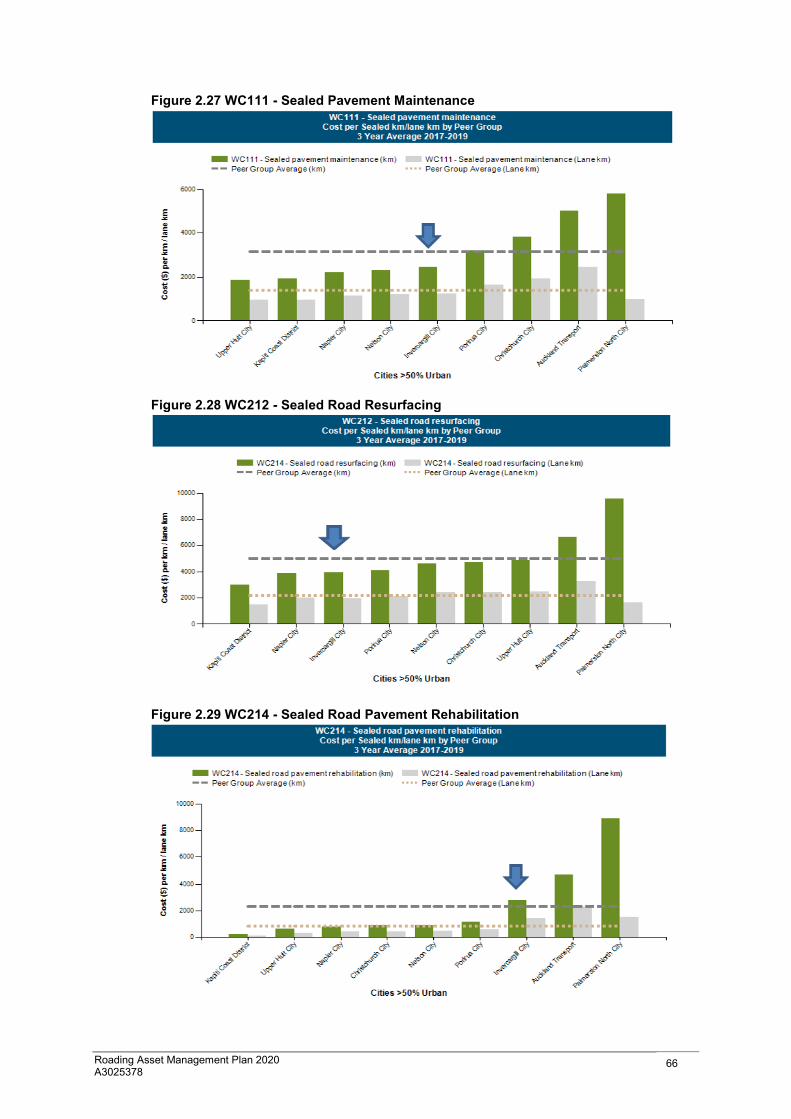
Roading Asset Management Plan 2020 A3025378
66
Figure 2.27 WC111 - Sealed Pavement Maintenance
Figure 2.28 WC212 - Sealed Road Resurfacing
Figure 2.29 WC214 - Sealed Road Pavement Rehabilitation
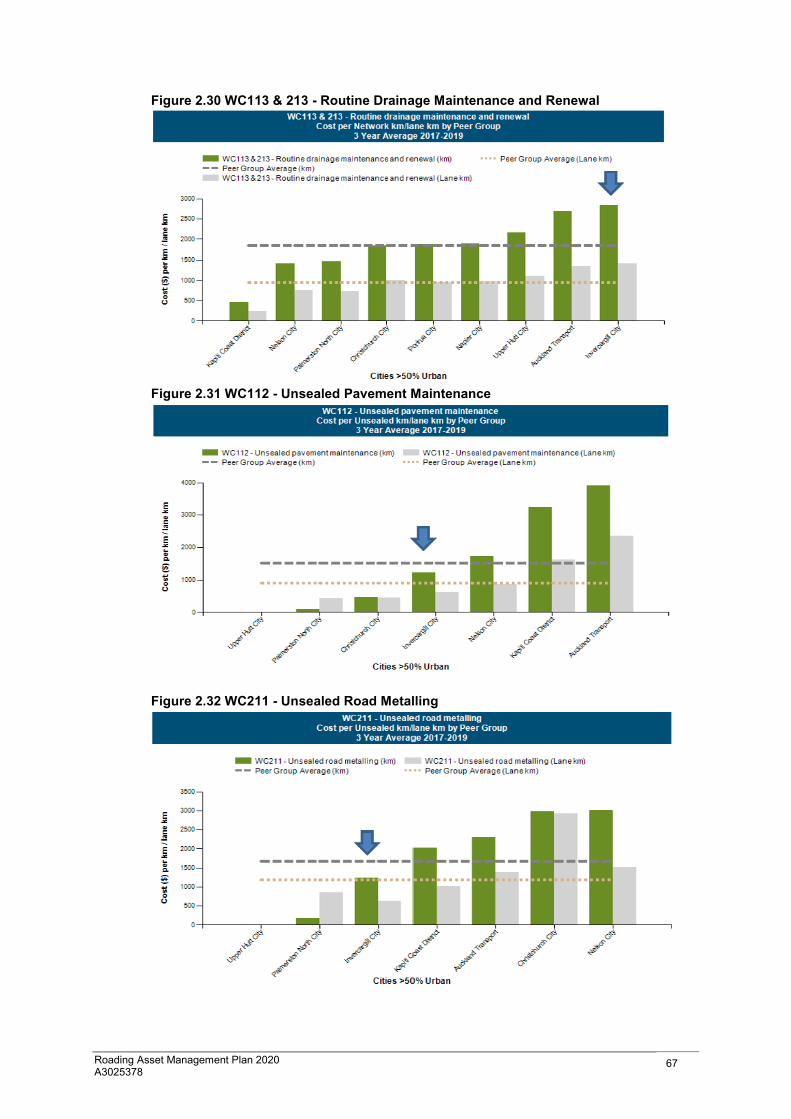
Roading Asset Management Plan 2020 A3025378
67
Figure 2.30 WC113 & 213 - Routine Drainage Maintenance and Renewal
Figure 2.31 WC112 - Unsealed Pavement Maintenance
Figure 2.32 WC211 - Unsealed Road Metalling
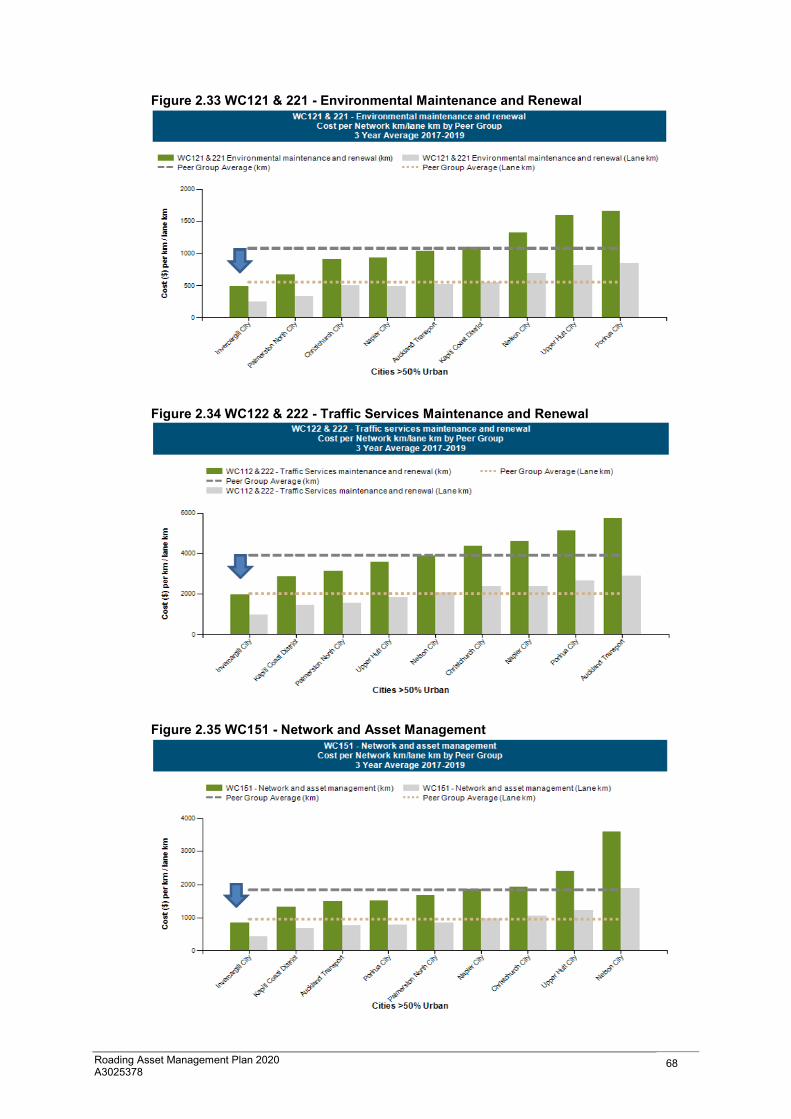
Roading Asset Management Plan 2020 A3025378
68
Figure 2.33 WC121 & 221 - Environmental Maintenance and Renewal
Figure 2.34 WC122 & 222 - Traffic Services Maintenance and Renewal
Figure 2.35 WC151 - Network and Asset Management
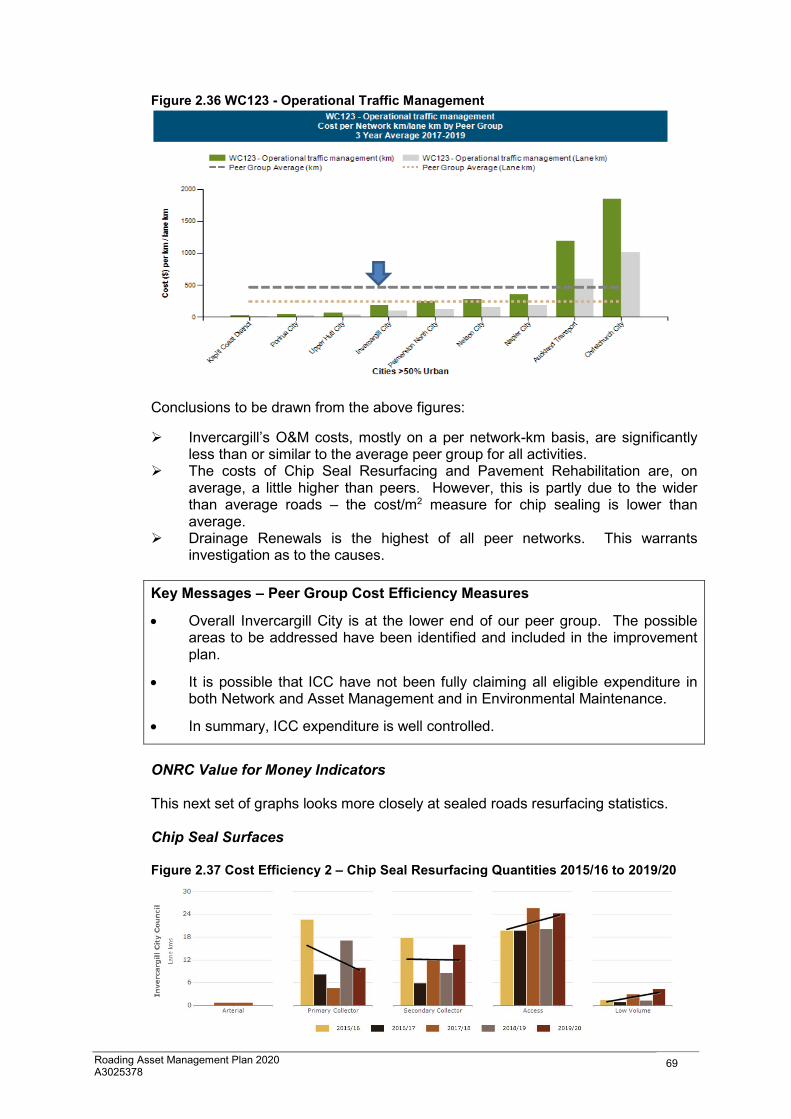
Roading Asset Management Plan 2020 A3025378
69
Figure 2.36 WC123 - Operational Traffic Management
Conclusions to be drawn from the above figures:
Invercargill’s O&M costs, mostly on a per network-km basis, are significantly less than or similar to the average peer group for all activities.
The costs of Chip Seal Resurfacing and Pavement Rehabilitation are, on average, a little higher than peers. However, this is partly due to the wider than average roads – the cost/m2 measure for chip sealing is lower than average.
Drainage Renewals is the highest of all peer networks. This warrants investigation as to the causes.
Key Messages – Peer Group Cost Efficiency Measures
• Overall Invercargill City is at the lower end of our peer group. The possible areas to be addressed have been identified and included in the improvement plan.
• It is possible that ICC have not been fully claiming all eligible expenditure in both Network and Asset Management and in Environmental Maintenance.
• In summary, ICC expenditure is well controlled.
ONRC Value for Money Indicators
This next set of graphs looks more closely at sealed roads resurfacing statistics.
Chip Seal Surfaces
Figure 2.37 Cost Efficiency 2 – Chip Seal Resurfacing Quantities 2015/16 to 2019/20
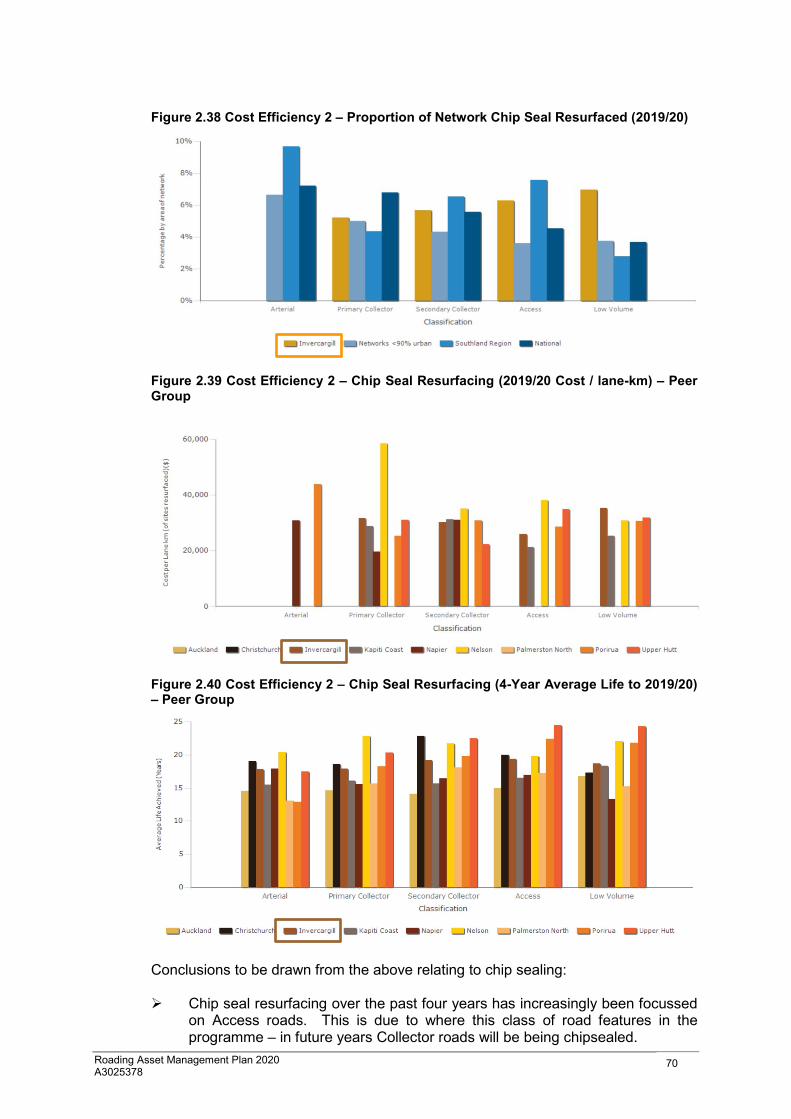
Roading Asset Management Plan 2020 A3025378
70
Figure 2.38 Cost Efficiency 2 – Proportion of Network Chip Seal Resurfaced (2019/20)
Figure 2.39 Cost Efficiency 2 – Chip Seal Resurfacing (2019/20 Cost / lane-km) – Peer Group
Figure 2.40 Cost Efficiency 2 – Chip Seal Resurfacing (4-Year Average Life to 2019/20) – Peer Group
Conclusions to be drawn from the above relating to chip sealing:
Chip seal resurfacing over the past four years has increasingly been focussed on Access roads. This is due to where this class of road features in the programme – in future years Collector roads will be being chipsealed.
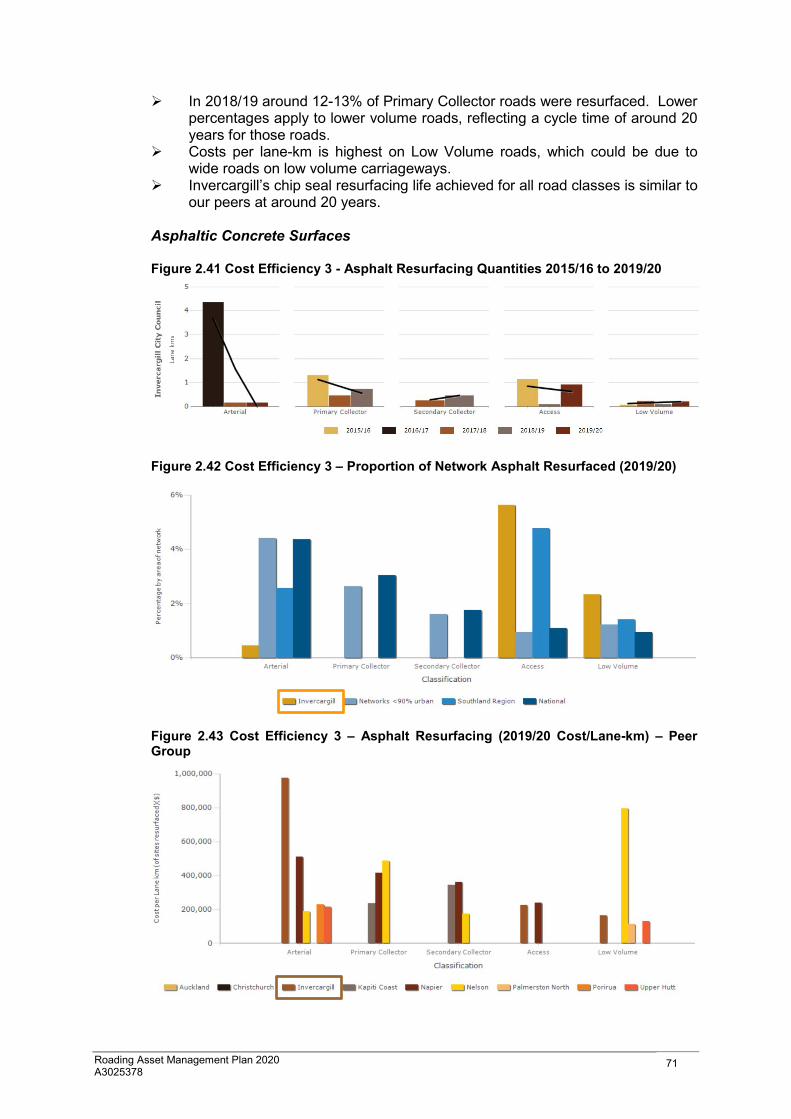
Roading Asset Management Plan 2020 A3025378
71
In 2018/19 around 12-13% of Primary Collector roads were resurfaced. Lower percentages apply to lower volume roads, reflecting a cycle time of around 20 years for those roads.
Costs per lane-km is highest on Low Volume roads, which could be due to wide roads on low volume carriageways.
Invercargill’s chip seal resurfacing life achieved for all road classes is similar to our peers at around 20 years.
Asphaltic Concrete Surfaces
Figure 2.41 Cost Efficiency 3 - Asphalt Resurfacing Quantities 2015/16 to 2019/20
Figure 2.42 Cost Efficiency 3 – Proportion of Network Asphalt Resurfaced (2019/20)
Figure 2.43 Cost Efficiency 3 – Asphalt Resurfacing (2019/20 Cost/Lane-km) – Peer Group
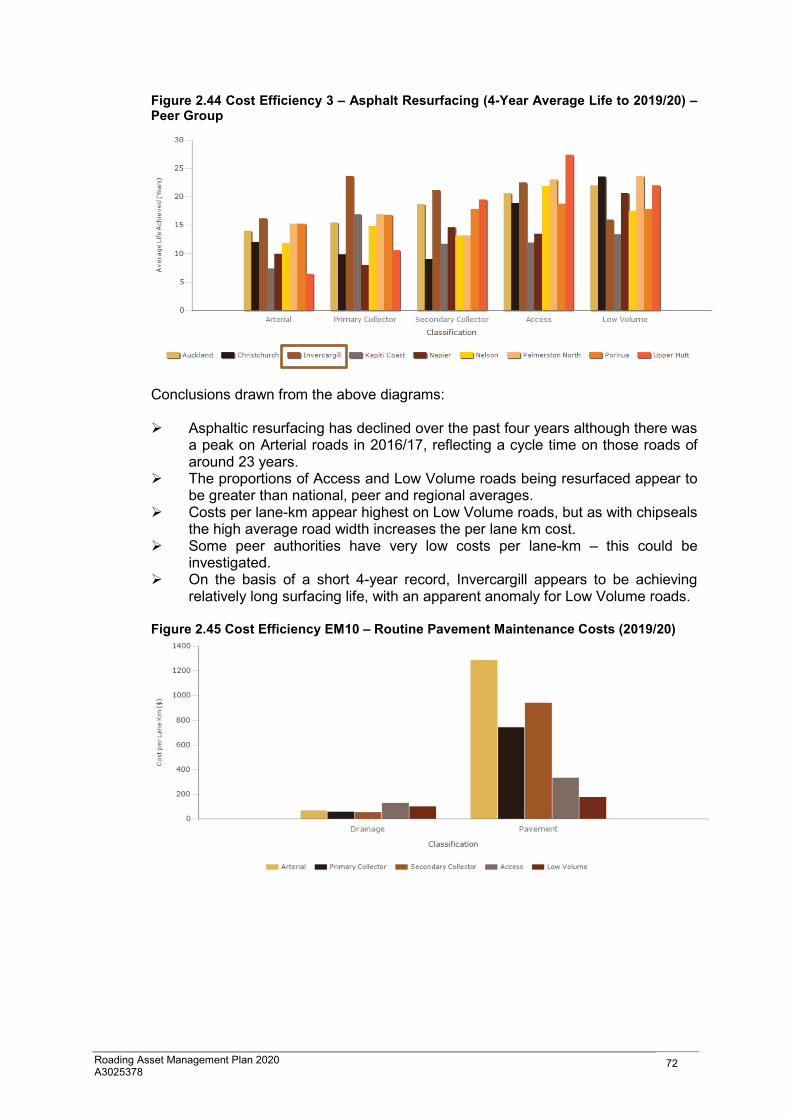
Roading Asset Management Plan 2020 A3025378
72
Figure 2.44 Cost Efficiency 3 – Asphalt Resurfacing (4-Year Average Life to 2019/20) – Peer Group
Conclusions drawn from the above diagrams: Asphaltic resurfacing has declined over the past four years although there was
a peak on Arterial roads in 2016/17, reflecting a cycle time on those roads of around 23 years.
The proportions of Access and Low Volume roads being resurfaced appear to be greater than national, peer and regional averages.
Costs per lane-km appear highest on Low Volume roads, but as with chipseals the high average road width increases the per lane km cost.
Some peer authorities have very low costs per lane-km – this could be investigated.
On the basis of a short 4-year record, Invercargill appears to be achieving relatively long surfacing life, with an apparent anomaly for Low Volume roads.
Figure 2.45 Cost Efficiency EM10 – Routine Pavement Maintenance Costs (2019/20)
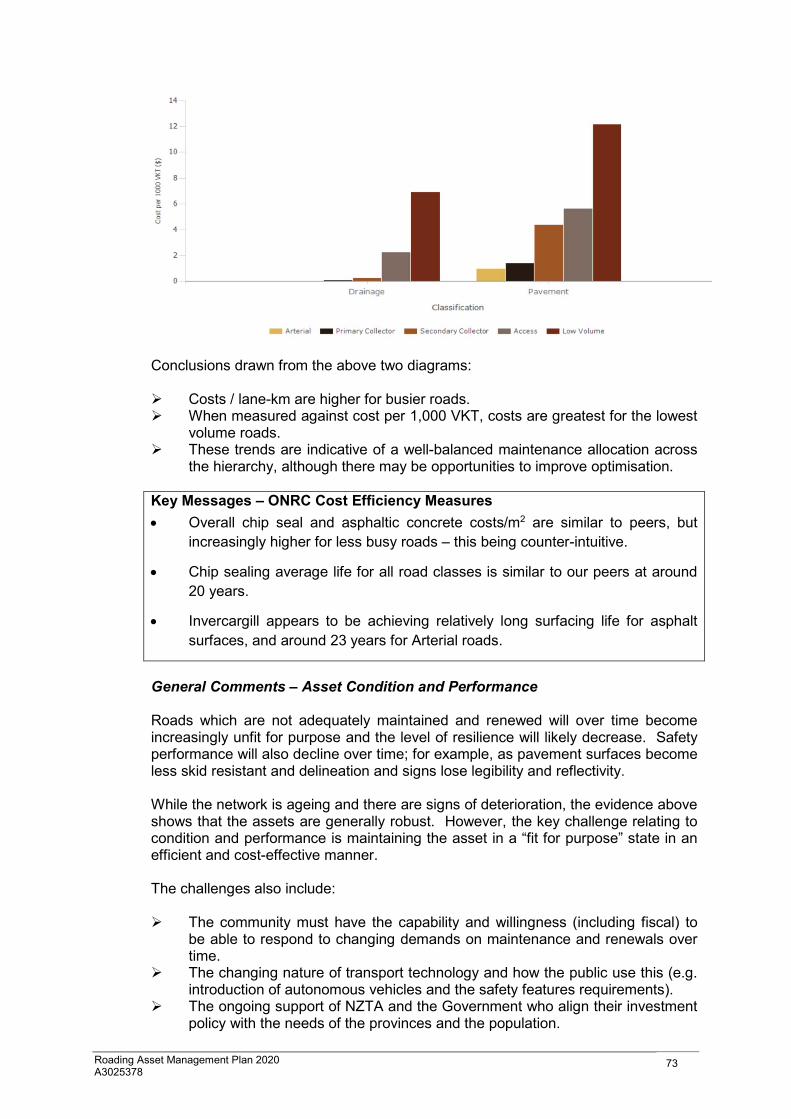
Roading Asset Management Plan 2020 A3025378
73
Conclusions drawn from the above two diagrams: Costs / lane-km are higher for busier roads. When measured against cost per 1,000 VKT, costs are greatest for the lowest
volume roads. These trends are indicative of a well-balanced maintenance allocation across
the hierarchy, although there may be opportunities to improve optimisation.
Key Messages – ONRC Cost Efficiency Measures • Overall chip seal and asphaltic concrete costs/m2 are similar to peers, but
increasingly higher for less busy roads – this being counter-intuitive.
• Chip sealing average life for all road classes is similar to our peers at around 20 years.
• Invercargill appears to be achieving relatively long surfacing life for asphalt surfaces, and around 23 years for Arterial roads.
General Comments – Asset Condition and Performance
Roads which are not adequately maintained and renewed will over time become increasingly unfit for purpose and the level of resilience will likely decrease. Safety performance will also decline over time; for example, as pavement surfaces become less skid resistant and delineation and signs lose legibility and reflectivity. While the network is ageing and there are signs of deterioration, the evidence above shows that the assets are generally robust. However, the key challenge relating to condition and performance is maintaining the asset in a “fit for purpose” state in an efficient and cost-effective manner. The challenges also include: The community must have the capability and willingness (including fiscal) to
be able to respond to changing demands on maintenance and renewals over time.
The changing nature of transport technology and how the public use this (e.g. introduction of autonomous vehicles and the safety features requirements).
The ongoing support of NZTA and the Government who align their investment policy with the needs of the provinces and the population.
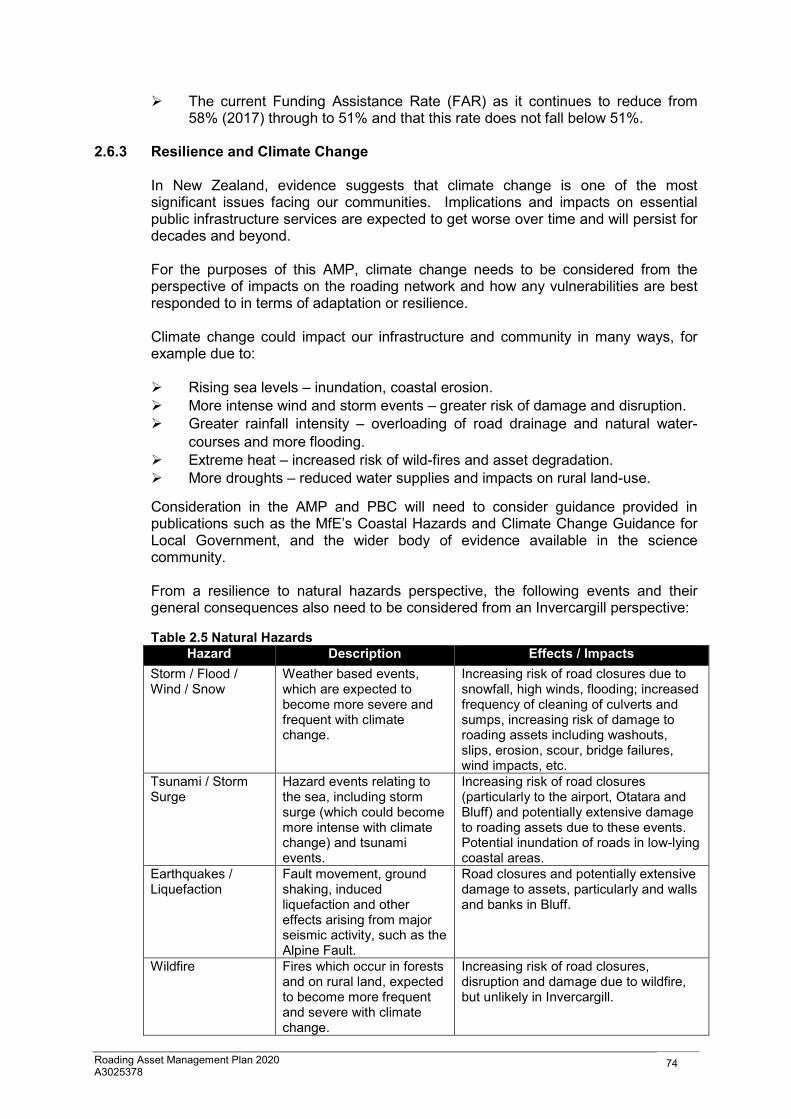
Roading Asset Management Plan 2020 A3025378
74
The current Funding Assistance Rate (FAR) as it continues to reduce from 58% (2017) through to 51% and that this rate does not fall below 51%.
2.6.3 Resilience and Climate Change
In New Zealand, evidence suggests that climate change is one of the most significant issues facing our communities. Implications and impacts on essential public infrastructure services are expected to get worse over time and will persist for decades and beyond. For the purposes of this AMP, climate change needs to be considered from the perspective of impacts on the roading network and how any vulnerabilities are best responded to in terms of adaptation or resilience. Climate change could impact our infrastructure and community in many ways, for example due to:
Rising sea levels – inundation, coastal erosion. More intense wind and storm events – greater risk of damage and disruption. Greater rainfall intensity – overloading of road drainage and natural water-
courses and more flooding. Extreme heat – increased risk of wild-fires and asset degradation. More droughts – reduced water supplies and impacts on rural land-use.
Consideration in the AMP and PBC will need to consider guidance provided in publications such as the MfE’s Coastal Hazards and Climate Change Guidance for Local Government, and the wider body of evidence available in the science community. From a resilience to natural hazards perspective, the following events and their general consequences also need to be considered from an Invercargill perspective:
Table 2.5 Natural Hazards
Hazard Description Effects / Impacts Storm / Flood / Wind / Snow
Weather based events, which are expected to become more severe and frequent with climate change.
Increasing risk of road closures due to snowfall, high winds, flooding; increased frequency of cleaning of culverts and sumps, increasing risk of damage to roading assets including washouts, slips, erosion, scour, bridge failures, wind impacts, etc.
Tsunami / Storm Surge
Hazard events relating to the sea, including storm surge (which could become more intense with climate change) and tsunami events.
Increasing risk of road closures (particularly to the airport, Otatara and Bluff) and potentially extensive damage to roading assets due to these events. Potential inundation of roads in low-lying coastal areas.
Earthquakes / Liquefaction
Fault movement, ground shaking, induced liquefaction and other effects arising from major seismic activity, such as the Alpine Fault.
Road closures and potentially extensive damage to assets, particularly and walls and banks in Bluff.
Wildfire Fires which occur in forests and on rural land, expected to become more frequent and severe with climate change.
Increasing risk of road closures, disruption and damage due to wildfire, but unlikely in Invercargill.
Roading Asset Management Plan 2020 A3025378
75
From a wider environmental perspective, the following aspects are also relevant to the roading activity: The potential for carbon emissions from land transport to continue to increase. Contamination of natural waterways through stormwater run-off from roads
and the close proximity of waterways to our sumps (discharge time and recovery times).
Noise and vibration increasing with increased traffic use. Air quality in the urban area.
Key Messages – Resilience and Climate Change • Climate change will affect Invercargill’s roading infrastructure in many ways. • Roading infrastructure is vulnerable to a range of natural hazards, some will
become worse with climate change. • Environmental issues will need attention – stormwater quality, air quality,
noise and vibration. 2.6.4 Accessibility
The City’s grid network and open street layout means it is easy for all vehicles to access all roads in the urban network; this can lead to conflicts between through traffic and local residential activities with negative impacts. The network is in some ways “too accessible”. The urban grid is illustrated in 2-44 below. The inter-relationship between adjoining land-use, fitness for purpose of the road, vulnerable road users, and the volume of heavy vehicles can create conflicting accessibility demands with negative outcomes for residents and vulnerable users. Changes may be needed to the way the roading network is defined, broadening the definition of hierarchy to encompass active and public transport modes. Some roads may need to be de-emphasized for motor vehicle journeys, with physical changes being made to provide better, more consistent facilities for pedestrians and cyclists. Some streets are very suitable to being developed and used by the community for play by their residents and there are a number of programmes such as Play Street and Innovative Streets which encourage and support these changes. Council needs to be supportive of changes in use to encourage stronger emphasis on active mode transport in areas such as “to school” travel. These are areas where higher demand exist, and where safety improvements can be gained through a mode shift. Accompanying this is the need to address traffic speed, with many of the City’s crashes relating to intersections and vulnerable road users; resolving accessibility issues is fundamental to improving safety outcomes. Speed and driver behaviour have direct links and Invercargill is recognised as having poor driver behaviours. Interestingly this issue translates from low travel demand and an expectation that they should be able to travel unimpeded which is not normally available in any urban environments. Modal choice and better transport options means having viable alternatives to making motor vehicle journeys, particularly where the journey is relatively short. The network therefore needs to cater for all modes safely and efficiently.
Roading Asset Management Plan 2020 A3025378
76
There are emerging issues and opportunities as transport options change, particularly with areas such as escooters, ebikes, mobility scooters, strengthening of vulnerable users groups, and other community inputs. These shifts can lead to increased usage and risk for footpath users where mode conflict is created. The Invercargill evidence already shows that vulnerable users represent a high risk of injury compared to the rest of the county. An example is footpath width. Current footpath dimensions do not always have sufficient width for new and larger scooters and the like, and a more strategic approach to improving the footpath network may be needed. Some local direction but national policy supported by good research would bring a consistent approach to these issues faced by most councils. Some community sectors do not have a strong voice and could be disadvantaged in some decisions.
Key Messages – Accessibility • The City has an easy to use grid network which provides a high level of
accessibility for vehicles. • However, its functionality needs to be broadened to provide better
opportunities for active modes and people. • This grid network with many intersections also contributes to the City’s safety
performance.
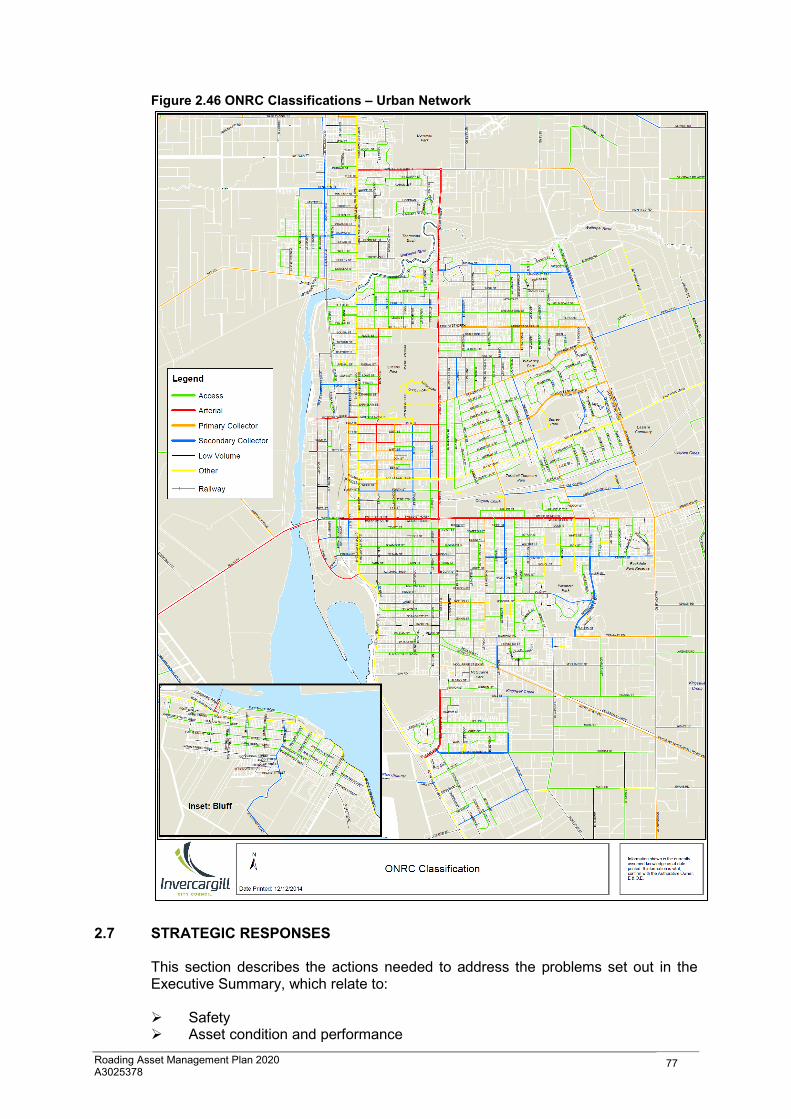
Roading Asset Management Plan 2020 A3025378
77
Figure 2.46 ONRC Classifications – Urban Network
2.7 STRATEGIC RESPONSES
This section describes the actions needed to address the problems set out in the Executive Summary, which relate to: Safety Asset condition and performance
Roading Asset Management Plan 2020 A3025378
78
Resilience and Climate Change Accessibility
These problem statements will be addressed through a range of operational and capital investment activities. Further details including proposed budgets are provided in Section 7 (Programme Business Case) for operational, maintenance, renewal and some capital activities (such as Low Cost Low Risk projects). Investment projects for roading, active transport or public transport infrastructure improvements are part of the Asset Management Plan, of which the Programme Business Case is a part. The possible responses described below will be further investigated in the Programme Case as to feasibility and effectiveness, with funding needs identified as appropriate. For completeness, the responses recognise all investment categories.
2.7.1 Safety
Improving safety will be achieved through the following key responses:
Review and implement improvements to safety management systems. Develop and implement Safety Strategy (linking local and regional strategies
to the “Road to Zero”). Investigation of actual and potential safety deficiencies or issues which are
targeted at specific road safety problems (intersections and vulnerable road users).
Strengthening leadership in encouraging Active Transport Modes. Managing speed in the community. Developing a network wide approach to “sustainable streets – places where
cars are welcome”. Strengthening education and communication projects to ensure community
understanding of Risk. Working strongly with other community providers and strengthening
community led initiatives such as Drive my Life and Right track which are targeted at specific sectors.
General network inspections, safety audit processes and crash reduction studies
Funding and addressing asset defects which have a safety implication as a priority.
Making specific improvements that have proven safety benefits – such as local traffic management schemes which reduce speed, intersection controls, improved delineation, etc.
Working with NZTA on a red-light camera strategy. Supporting community initiatives relating to education and enforcement with
our road safety partners and through roads safety coordination arrangements.
These activities are likely to be primarily funded through programmes in the following work categories:
Network asset management Traffic services maintenance and renewals Walking and cycling facilities Road safety promotion, including education and advertising and Traffic
Demand Management
Roading Asset Management Plan 2020 A3025378
79
New traffic management facilities Road improvements Speed Bylaws Low cost low risk improvements Community Funded Education Programmes
2.7.2 Asset condition and performance
Issues associated with ageing or deteriorating infrastructure will be addressed through the following key responses: Continuing with current condition monitoring and inspection processes,
increasing frequency or doing investigative testing where appropriate to the level of risk of asset failure and the criticality of the asset.
Knowing the assets well and understanding the pressures and conflicts with the community use, having strong links and good intel input from the Police and other key stakeholders.
Optimising road maintenance and renewal activities across the network to achieve the right balance of investment when assessed against the adopted levels of service, asset risk, and asset criticality.
Reviewing levels of service where under or over-delivery may be occurring (having community input and aligning to ONRC where appropriate).
Reviewing acceptable risk acceptance levels to ensure that work activities are appropriately targeted.
Developing a proactive approach to safety issues where asset condition is a contributing factor.
Developing a strategic approach to drainage and footpath replacement and upgrades with better modelling and condition ratings.
These activities will be funded through programmes in the following work categories: All road maintenance and renewal categories (W/C 100- 200+). Replacement of bridges and structures.
2.7.3 Resilience and Climate Change
These issues will be addressed through the following key responses: Updating our understanding of the vulnerabilities of the City’s roading assets
and the interdependencies with other lifeline utilities. Keeping up to date with the anticipated effects of natural hazards and climate
change on the City’s roading network. Having response plans for storm and climatic events. Investigating potential mitigation options for the roading network – both short
and long-term (including maintenance regimes to lessen impacts through to investment in greater resilience, e.g. Stead Street stopbank).
Participation in lifelines work with Environment Southland, other local authorities in the region and other CDEM stakeholders.
Improving adaptive capacity and capability within the organisation in order to better manage disruptive events.
Promote mode shift to reduce dependency and impacts on travel by cars. Develop PT strategies to encourage use, and use policy settings to encourage
and support behaviours. Develop and implement Council policies to support reduction in greenhouse
gases (e.g. electric cars and bus fleets).
Roading Asset Management Plan 2020 A3025378
80
These activities could be funded through programmes in the following work categories:
Network asset management Programme business case development Transport model development Road improvements Replacement of bridges and structures Resilience improvements Public Transport Activities ( W/C 511-524) Revenues from Bylaws – Parking
2.7.4 Accessibility
These issues will be addressed through the following key responses: Multi-modal network optimisation to identify improvements that can be made
to walking, cycling and public transport modes at a network level. This includes the development of footpath, cycling and public transport hierarchies.
Promote and encourage change for walking, cycling and public transport to provide greater transport choice, integration and flexibility, along with the promotion of good public health outcomes.
Implement travel behaviour programmes to encourage more efficient travel patterns and to reduce the number of single occupancy vehicles at peak times.
Ensure that new developments support modal choice and provide opportunities for people to travel less by private motor vehicle.
Review freight routes in the City and encourage focused travel on hierarchy by HPMV and other heavy traffic (e.g. on ONRC appropriate routes).
Determine and implement traffic changes to improve behaviours and whether any network changes or optimisation is required to address routes that should be “de-tuned” with respect to either freight or “rat running”.
Work with similar focused regional groups (e.g. Sports Southland and Cycling Southland) to optimise the community efforts for regional learnings (such as bike training).
These activities may be funded through programmes in the following work categories: Transport model development Travel demand management Promotion of demand management Walking and cycling facilities Urban cycleway programme Public transport facilities operations and maintenance Public transport infrastructure improvements and major renewals Low cost low risk public transport improvements Increased FAR Community and / or direct Government Funding
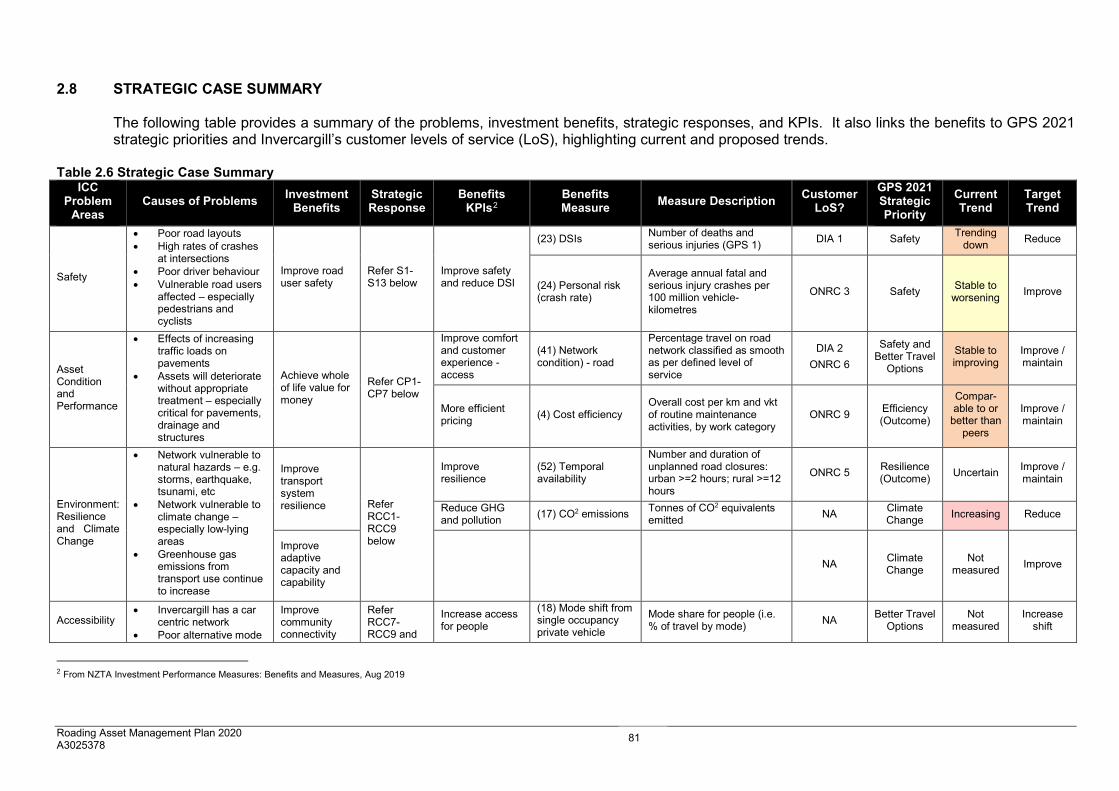
Roading Asset Management Plan 2020 A3025378 81
2.8 STRATEGIC CASE SUMMARY
The following table provides a summary of the problems, investment benefits, strategic responses, and KPIs. It also links the benefits to GPS 2021 strategic priorities and Invercargill’s customer levels of service (LoS), highlighting current and proposed trends.
Table 2.6 Strategic Case Summary ICC
Problem Areas
Causes of Problems Investment Benefits
Strategic Response
Benefits KPIs2
Benefits Measure Measure Description Customer
LoS? GPS 2021 Strategic Priority
Current Trend
Target Trend
Safety
• Poor road layouts • High rates of crashes
at intersections • Poor driver behaviour • Vulnerable road users
affected – especially pedestrians and cyclists
Improve road user safety
Refer S1-S13 below
Improve safety and reduce DSI
(23) DSIs Number of deaths and serious injuries (GPS 1) DIA 1 Safety Trending
down Reduce
(24) Personal risk (crash rate)
Average annual fatal and serious injury crashes per 100 million vehicle-kilometres
ONRC 3 Safety Stable to worsening Improve
Asset Condition and Performance
• Effects of increasing traffic loads on pavements
• Assets will deteriorate without appropriate treatment – especially critical for pavements, drainage and structures
Achieve whole of life value for money
Refer CP1-CP7 below
Improve comfort and customer experience - access
(41) Network condition) - road
Percentage travel on road network classified as smooth as per defined level of service
DIA 2 ONRC 6
Safety and Better Travel
Options
Stable to improving
Improve / maintain
More efficient pricing (4) Cost efficiency
Overall cost per km and vkt of routine maintenance activities, by work category
ONRC 9 Efficiency (Outcome)
Compar-able to or
better than peers
Improve / maintain
Environment: Resilience and Climate Change
• Network vulnerable to natural hazards – e.g. storms, earthquake, tsunami, etc
• Network vulnerable to climate change – especially low-lying areas
• Greenhouse gas emissions from transport use continue to increase
Improve transport system resilience Refer
RCC1-RCC9 below
Improve resilience
(52) Temporal availability
Number and duration of unplanned road closures: urban >=2 hours; rural >=12 hours
ONRC 5 Resilience (Outcome) Uncertain Improve /
maintain
Reduce GHG and pollution (17) CO2 emissions Tonnes of CO2 equivalents
emitted NA Climate Change Increasing Reduce
Improve adaptive capacity and capability
NA Climate Change
Not measured Improve
Accessibility • Invercargill has a car
centric network • Poor alternative mode
Improve community connectivity
Refer RCC7-RCC9 and
Increase access for people
(18) Mode shift from single occupancy private vehicle
Mode share for people (i.e. % of travel by mode) NA Better Travel
Options Not
measured Increase
shift
2 From NZTA Investment Performance Measures: Benefits and Measures, Aug 2019
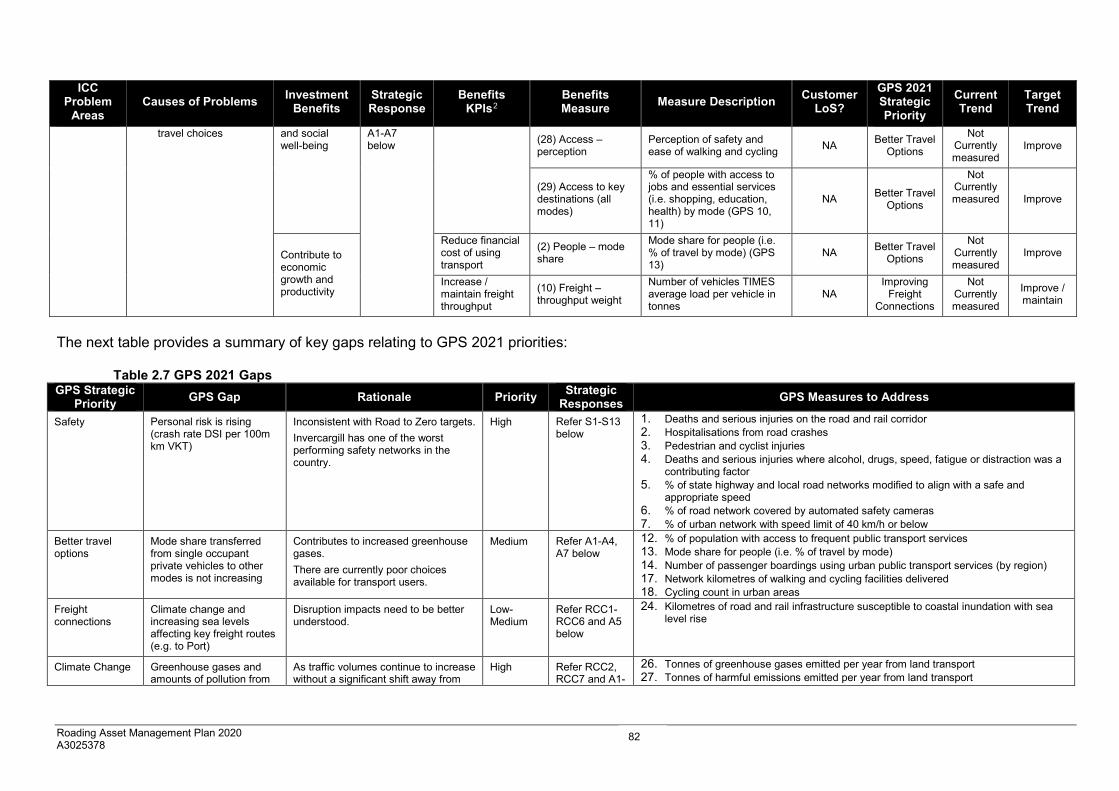
Roading Asset Management Plan 2020 A3025378
82
ICC Problem
Areas Causes of Problems Investment
Benefits Strategic Response
Benefits KPIs2
Benefits Measure Measure Description Customer
LoS? GPS 2021 Strategic Priority
Current Trend
Target Trend
travel choices and social well-being
A1-A7 below (28) Access –
perception Perception of safety and ease of walking and cycling NA Better Travel
Options
Not Currently measured
Improve
(29) Access to key destinations (all modes)
% of people with access to jobs and essential services (i.e. shopping, education, health) by mode (GPS 10, 11)
NA Better Travel Options
Not Currently measured Improve
Contribute to economic growth and productivity
Reduce financial cost of using transport
(2) People – mode share
Mode share for people (i.e. % of travel by mode) (GPS 13)
NA Better Travel Options
Not Currently measured
Improve
Increase / maintain freight throughput
(10) Freight – throughput weight
Number of vehicles TIMES average load per vehicle in tonnes
NA Improving
Freight Connections
Not Currently measured
Improve / maintain
The next table provides a summary of key gaps relating to GPS 2021 priorities:
Table 2.7 GPS 2021 Gaps GPS Strategic
Priority GPS Gap Rationale Priority Strategic Responses GPS Measures to Address
Safety Personal risk is rising (crash rate DSI per 100m km VKT)
Inconsistent with Road to Zero targets. Invercargill has one of the worst performing safety networks in the country.
High Refer S1-S13 below
1. Deaths and serious injuries on the road and rail corridor 2. Hospitalisations from road crashes 3. Pedestrian and cyclist injuries 4. Deaths and serious injuries where alcohol, drugs, speed, fatigue or distraction was a
contributing factor 5. % of state highway and local road networks modified to align with a safe and
appropriate speed 6. % of road network covered by automated safety cameras 7. % of urban network with speed limit of 40 km/h or below
Better travel options
Mode share transferred from single occupant private vehicles to other modes is not increasing
Contributes to increased greenhouse gases. There are currently poor choices available for transport users.
Medium Refer A1-A4, A7 below
12. % of population with access to frequent public transport services 13. Mode share for people (i.e. % of travel by mode) 14. Number of passenger boardings using urban public transport services (by region) 17. Network kilometres of walking and cycling facilities delivered 18. Cycling count in urban areas
Freight connections
Climate change and increasing sea levels affecting key freight routes (e.g. to Port)
Disruption impacts need to be better understood.
Low-Medium
Refer RCC1-RCC6 and A5 below
24. Kilometres of road and rail infrastructure susceptible to coastal inundation with sea level rise
Climate Change Greenhouse gases and amounts of pollution from
As traffic volumes continue to increase without a significant shift away from
High Refer RCC2, RCC7 and A1-
26. Tonnes of greenhouse gases emitted per year from land transport 27. Tonnes of harmful emissions emitted per year from land transport
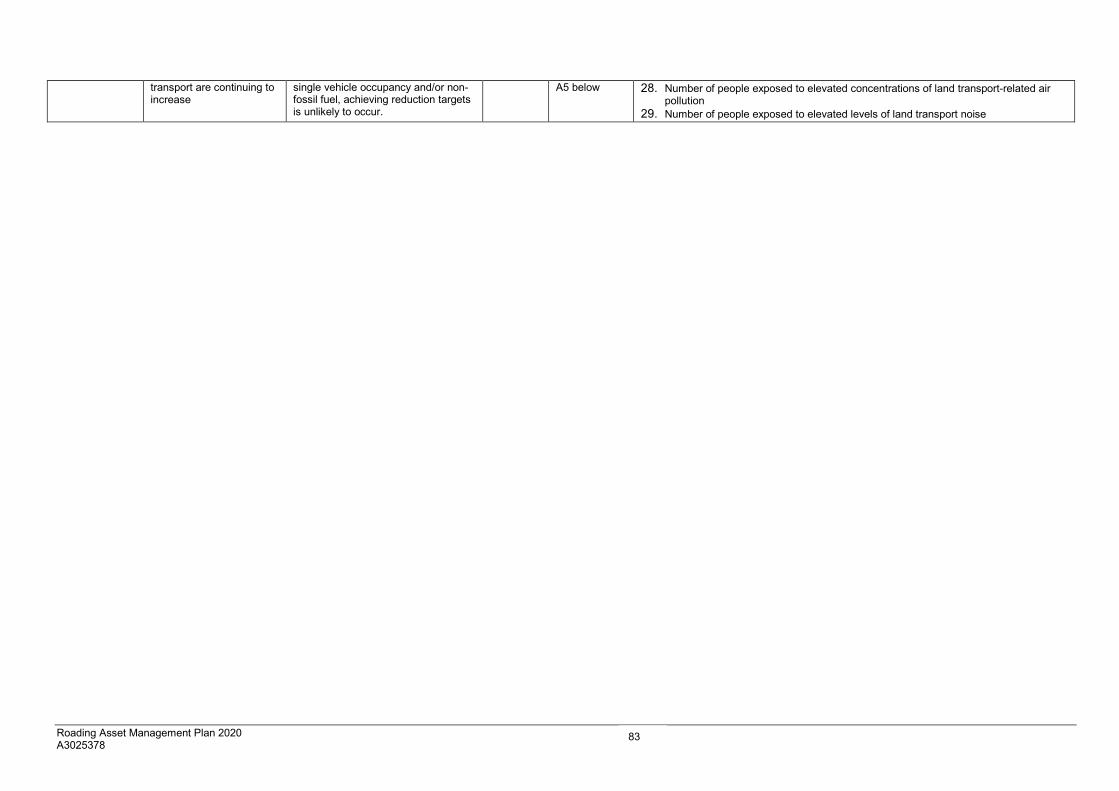
Roading Asset Management Plan 2020 A3025378
83
transport are continuing to increase
single vehicle occupancy and/or non-fossil fuel, achieving reduction targets is unlikely to occur.
A5 below 28. Number of people exposed to elevated concentrations of land transport-related air pollution
29. Number of people exposed to elevated levels of land transport noise
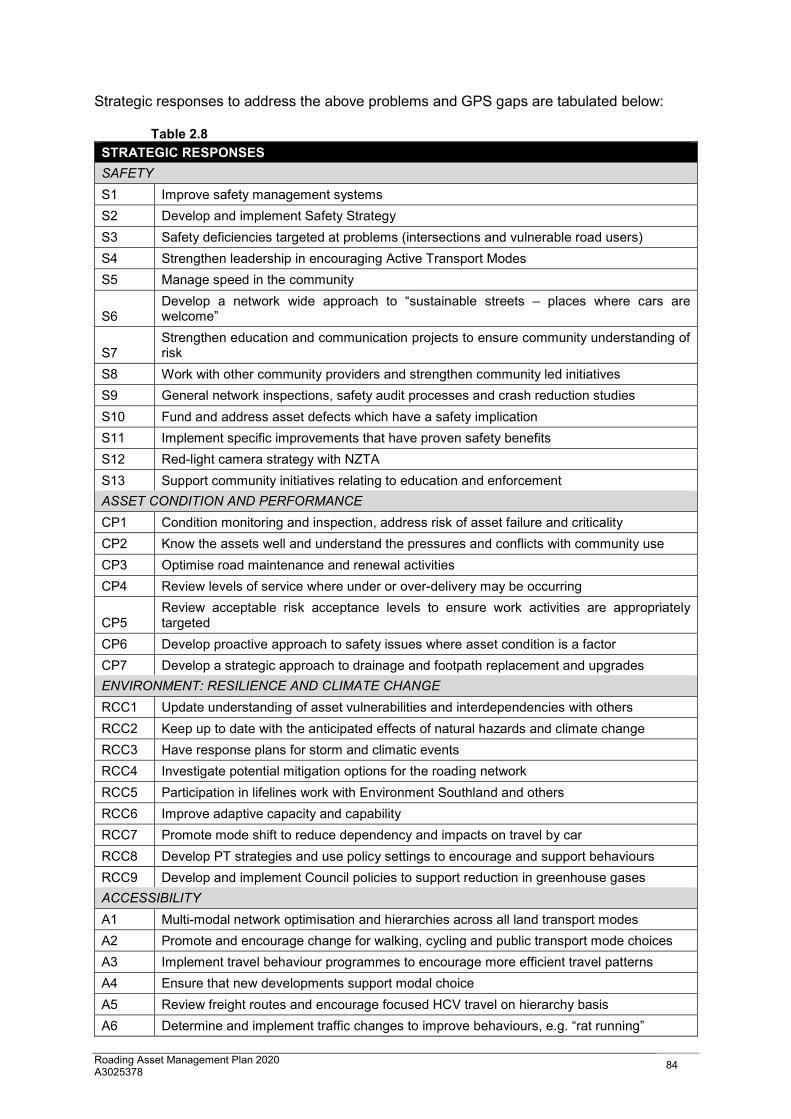
Roading Asset Management Plan 2020 A3025378 84
Strategic responses to address the above problems and GPS gaps are tabulated below:
Table 2.8 STRATEGIC RESPONSES SAFETY S1 Improve safety management systems S2 Develop and implement Safety Strategy S3 Safety deficiencies targeted at problems (intersections and vulnerable road users) S4 Strengthen leadership in encouraging Active Transport Modes S5 Manage speed in the community
S6 Develop a network wide approach to “sustainable streets – places where cars are welcome”
S7 Strengthen education and communication projects to ensure community understanding of risk
S8 Work with other community providers and strengthen community led initiatives S9 General network inspections, safety audit processes and crash reduction studies S10 Fund and address asset defects which have a safety implication S11 Implement specific improvements that have proven safety benefits S12 Red-light camera strategy with NZTA S13 Support community initiatives relating to education and enforcement ASSET CONDITION AND PERFORMANCE CP1 Condition monitoring and inspection, address risk of asset failure and criticality CP2 Know the assets well and understand the pressures and conflicts with community use CP3 Optimise road maintenance and renewal activities CP4 Review levels of service where under or over-delivery may be occurring
CP5 Review acceptable risk acceptance levels to ensure work activities are appropriately targeted
CP6 Develop proactive approach to safety issues where asset condition is a factor CP7 Develop a strategic approach to drainage and footpath replacement and upgrades ENVIRONMENT: RESILIENCE AND CLIMATE CHANGE RCC1 Update understanding of asset vulnerabilities and interdependencies with others RCC2 Keep up to date with the anticipated effects of natural hazards and climate change RCC3 Have response plans for storm and climatic events RCC4 Investigate potential mitigation options for the roading network RCC5 Participation in lifelines work with Environment Southland and others RCC6 Improve adaptive capacity and capability RCC7 Promote mode shift to reduce dependency and impacts on travel by car RCC8 Develop PT strategies and use policy settings to encourage and support behaviours RCC9 Develop and implement Council policies to support reduction in greenhouse gases ACCESSIBILITY A1 Multi-modal network optimisation and hierarchies across all land transport modes A2 Promote and encourage change for walking, cycling and public transport mode choices A3 Implement travel behaviour programmes to encourage more efficient travel patterns A4 Ensure that new developments support modal choice A5 Review freight routes and encourage focused HCV travel on hierarchy basis A6 Determine and implement traffic changes to improve behaviours, e.g. “rat running”

Roading Asset Management Plan 2020 A3025378
85
STRATEGIC RESPONSES A7 Work with regional groups to optimise community learning
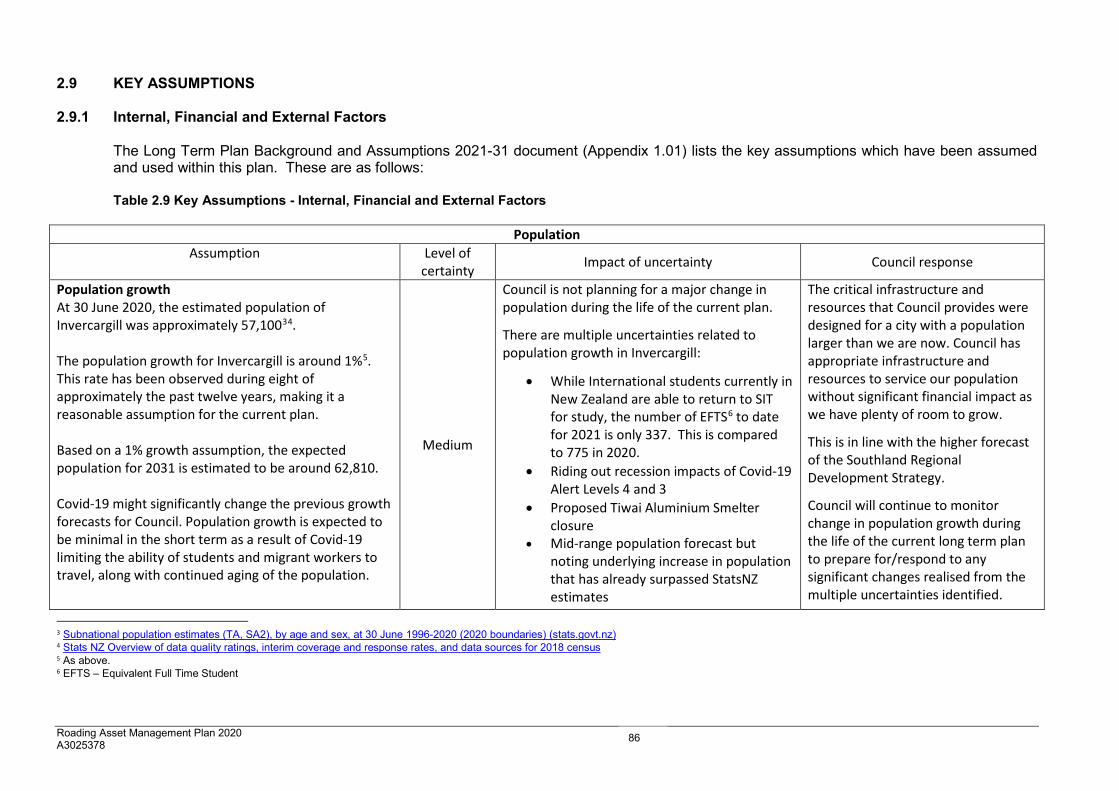
Roading Asset Management Plan 2020 A3025378 86
2.9 KEY ASSUMPTIONS
2.9.1 Internal, Financial and External Factors The Long Term Plan Background and Assumptions 2021-31 document (Appendix 1.01) lists the key assumptions which have been assumed and used within this plan. These are as follows: Table 2.9 Key Assumptions - Internal, Financial and External Factors
Population
Assumption Level of certainty Impact of uncertainty Council response
Population growth At 30 June 2020, the estimated population of Invercargill was approximately 57,10034. The population growth for Invercargill is around 1%5. This rate has been observed during eight of approximately the past twelve years, making it a reasonable assumption for the current plan. Based on a 1% growth assumption, the expected population for 2031 is estimated to be around 62,810. Covid‐19 might significantly change the previous growth forecasts for Council. Population growth is expected to be minimal in the short term as a result of Covid‐19 limiting the ability of students and migrant workers to travel, along with continued aging of the population.
Medium
Council is not planning for a major change in population during the life of the current plan.
There are multiple uncertainties related to population growth in Invercargill:
• While International students currently in New Zealand are able to return to SIT for study, the number of EFTS6 to date for 2021 is only 337. This is compared to 775 in 2020.
• Riding out recession impacts of Covid‐19 Alert Levels 4 and 3
• Proposed Tiwai Aluminium Smelter closure
• Mid‐range population forecast but noting underlying increase in population that has already surpassed StatsNZ estimates
The critical infrastructure and resources that Council provides were designed for a city with a population larger than we are now. Council has appropriate infrastructure and resources to service our population without significant financial impact as we have plenty of room to grow.
This is in line with the higher forecast of the Southland Regional Development Strategy.
Council will continue to monitor change in population growth during the life of the current long term plan to prepare for/respond to any significant changes realised from the multiple uncertainties identified.
3 Subnational population estimates (TA, SA2), by age and sex, at 30 June 1996-2020 (2020 boundaries) (stats.govt.nz) 4 Stats NZ Overview of data quality ratings, interim coverage and response rates, and data sources for 2018 census 5 As above. 6 EFTS – Equivalent Full Time Student
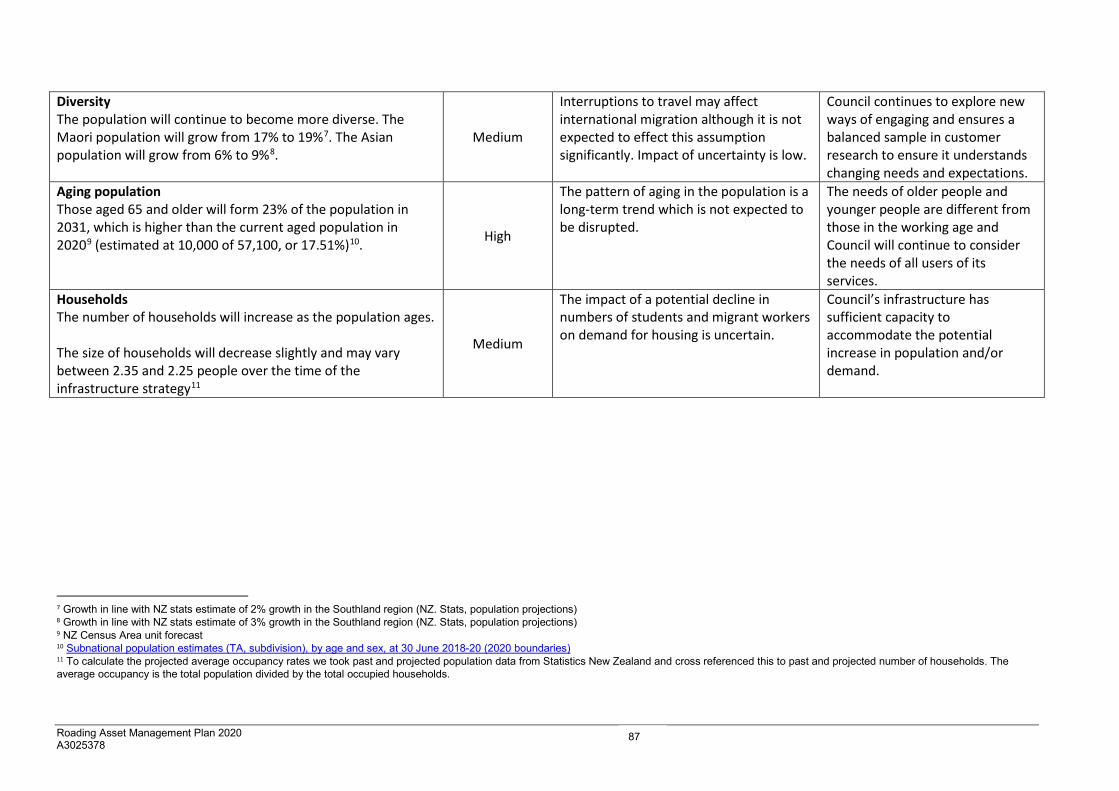
Roading Asset Management Plan 2020 A3025378
87
Diversity The population will continue to become more diverse. The Maori population will grow from 17% to 19%7. The Asian population will grow from 6% to 9%8.
Medium
Interruptions to travel may affect international migration although it is not expected to effect this assumption significantly. Impact of uncertainty is low.
Council continues to explore new ways of engaging and ensures a balanced sample in customer research to ensure it understands changing needs and expectations.
Aging population Those aged 65 and older will form 23% of the population in 2031, which is higher than the current aged population in 20209 (estimated at 10,000 of 57,100, or 17.51%)10. High
The pattern of aging in the population is a long‐term trend which is not expected to be disrupted.
The needs of older people and younger people are different from those in the working age and Council will continue to consider the needs of all users of its services.
Households The number of households will increase as the population ages. The size of households will decrease slightly and may vary between 2.35 and 2.25 people over the time of the infrastructure strategy11
Medium
The impact of a potential decline in numbers of students and migrant workers on demand for housing is uncertain.
Council’s infrastructure has sufficient capacity to accommodate the potential increase in population and/or demand.
7 Growth in line with NZ stats estimate of 2% growth in the Southland region (NZ. Stats, population projections) 8 Growth in line with NZ stats estimate of 3% growth in the Southland region (NZ. Stats, population projections) 9 NZ Census Area unit forecast 10 Subnational population estimates (TA, subdivision), by age and sex, at 30 June 2018-20 (2020 boundaries) 11 To calculate the projected average occupancy rates we took past and projected population data from Statistics New Zealand and cross referenced this to past and projected number of households. The average occupancy is the total population divided by the total occupied households.
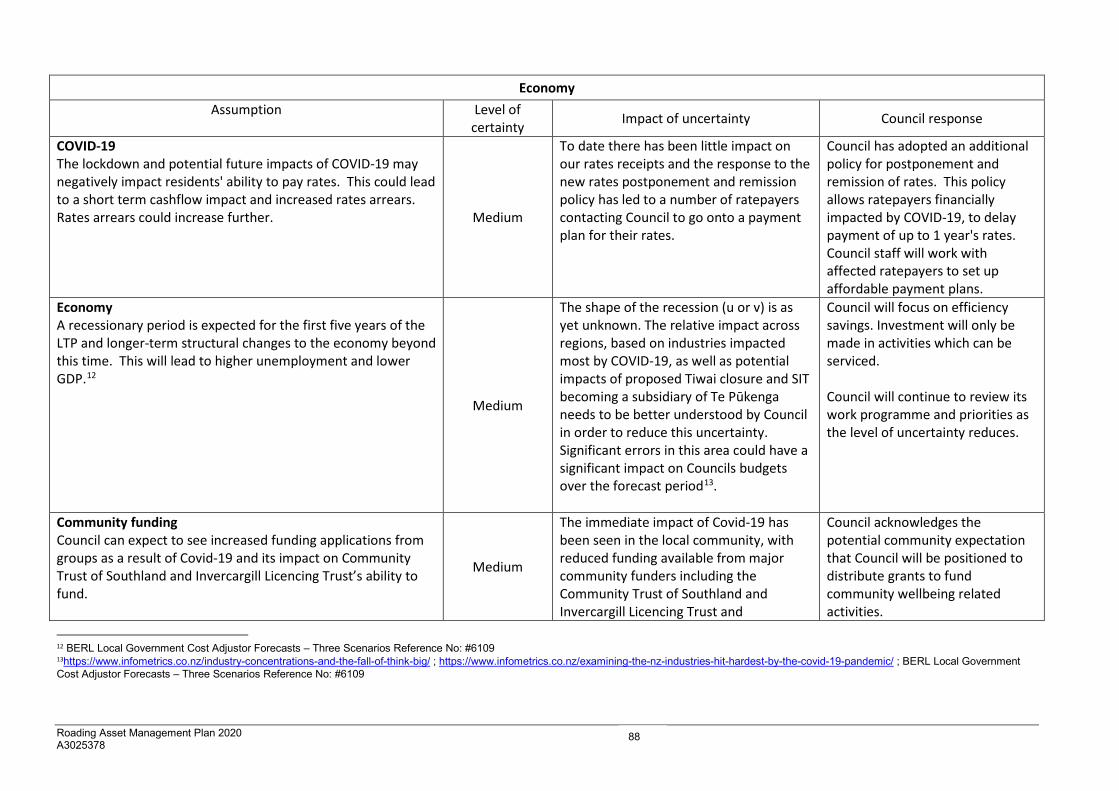
Roading Asset Management Plan 2020 A3025378
88
Economy Assumption Level of
certainty Impact of uncertainty Council response
COVID-19 The lockdown and potential future impacts of COVID‐19 may negatively impact residents' ability to pay rates. This could lead to a short term cashflow impact and increased rates arrears. Rates arrears could increase further.
Medium
To date there has been little impact on our rates receipts and the response to the new rates postponement and remission policy has led to a number of ratepayers contacting Council to go onto a payment plan for their rates.
Council has adopted an additional policy for postponement and remission of rates. This policy allows ratepayers financially impacted by COVID‐19, to delay payment of up to 1 year's rates. Council staff will work with affected ratepayers to set up affordable payment plans.
Economy A recessionary period is expected for the first five years of the LTP and longer‐term structural changes to the economy beyond this time. This will lead to higher unemployment and lower GDP.12
Medium
The shape of the recession (u or v) is as yet unknown. The relative impact across regions, based on industries impacted most by COVID‐19, as well as potential impacts of proposed Tiwai closure and SIT becoming a subsidiary of Te Pūkenga needs to be better understood by Council in order to reduce this uncertainty. Significant errors in this area could have a significant impact on Councils budgets over the forecast period13.
Council will focus on efficiency savings. Investment will only be made in activities which can be serviced. Council will continue to review its work programme and priorities as the level of uncertainty reduces.
Community funding Council can expect to see increased funding applications from groups as a result of Covid‐19 and its impact on Community Trust of Southland and Invercargill Licencing Trust’s ability to fund.
Medium
The immediate impact of Covid‐19 has been seen in the local community, with reduced funding available from major community funders including the Community Trust of Southland and Invercargill Licencing Trust and
Council acknowledges the potential community expectation that Council will be positioned to distribute grants to fund community wellbeing related activities.
12 BERL Local Government Cost Adjustor Forecasts – Three Scenarios Reference No: #6109 13https://www.infometrics.co.nz/industry-concentrations-and-the-fall-of-think-big/ ; https://www.infometrics.co.nz/examining-the-nz-industries-hit-hardest-by-the-covid-19-pandemic/ ; BERL Local Government Cost Adjustor Forecasts – Three Scenarios Reference No: #6109
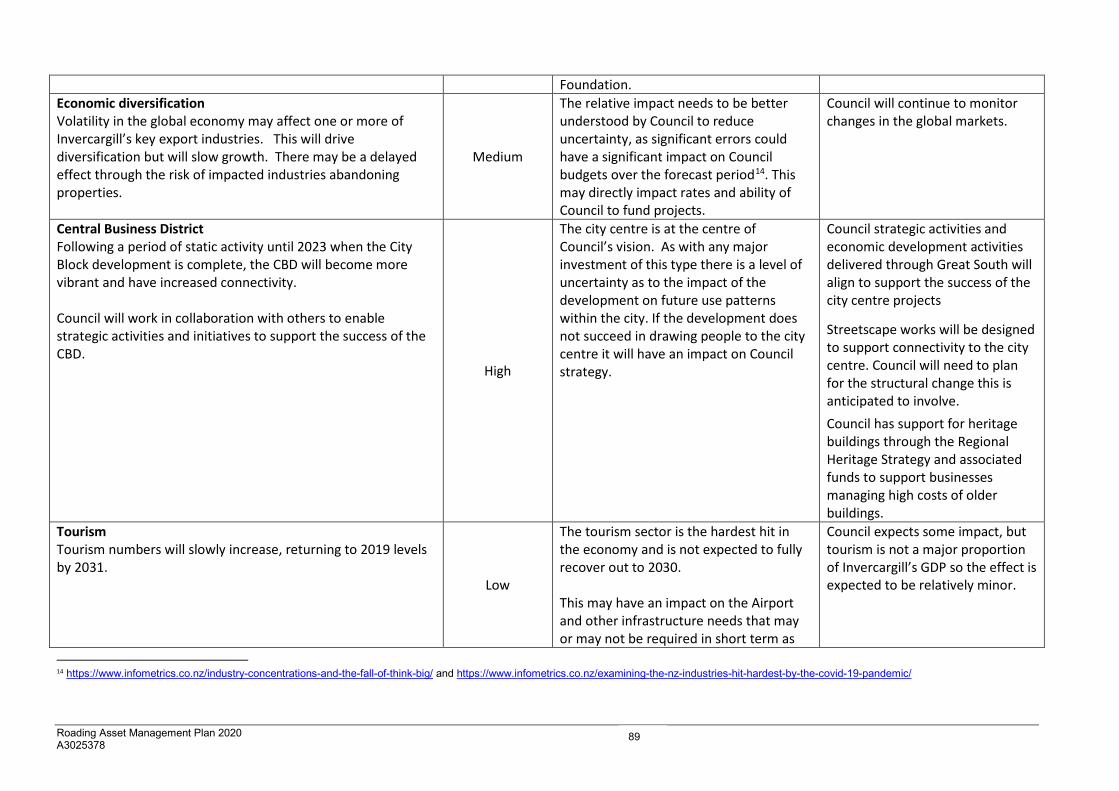
Roading Asset Management Plan 2020 A3025378
89
Foundation. Economic diversification Volatility in the global economy may affect one or more of Invercargill’s key export industries. This will drive diversification but will slow growth. There may be a delayed effect through the risk of impacted industries abandoning properties.
Medium
The relative impact needs to be better understood by Council to reduce uncertainty, as significant errors could have a significant impact on Council budgets over the forecast period14. This may directly impact rates and ability of Council to fund projects.
Council will continue to monitor changes in the global markets.
Central Business District Following a period of static activity until 2023 when the City Block development is complete, the CBD will become more vibrant and have increased connectivity. Council will work in collaboration with others to enable strategic activities and initiatives to support the success of the CBD. High
The city centre is at the centre of Council’s vision. As with any major investment of this type there is a level of uncertainty as to the impact of the development on future use patterns within the city. If the development does not succeed in drawing people to the city centre it will have an impact on Council strategy.
Council strategic activities and economic development activities delivered through Great South will align to support the success of the city centre projects
Streetscape works will be designed to support connectivity to the city centre. Council will need to plan for the structural change this is anticipated to involve.
Council has support for heritage buildings through the Regional Heritage Strategy and associated funds to support businesses managing high costs of older buildings.
Tourism Tourism numbers will slowly increase, returning to 2019 levels by 2031.
Low
The tourism sector is the hardest hit in the economy and is not expected to fully recover out to 2030. This may have an impact on the Airport and other infrastructure needs that may or may not be required in short term as
Council expects some impact, but tourism is not a major proportion of Invercargill’s GDP so the effect is expected to be relatively minor.
14 https://www.infometrics.co.nz/industry-concentrations-and-the-fall-of-think-big/ and https://www.infometrics.co.nz/examining-the-nz-industries-hit-hardest-by-the-covid-19-pandemic/
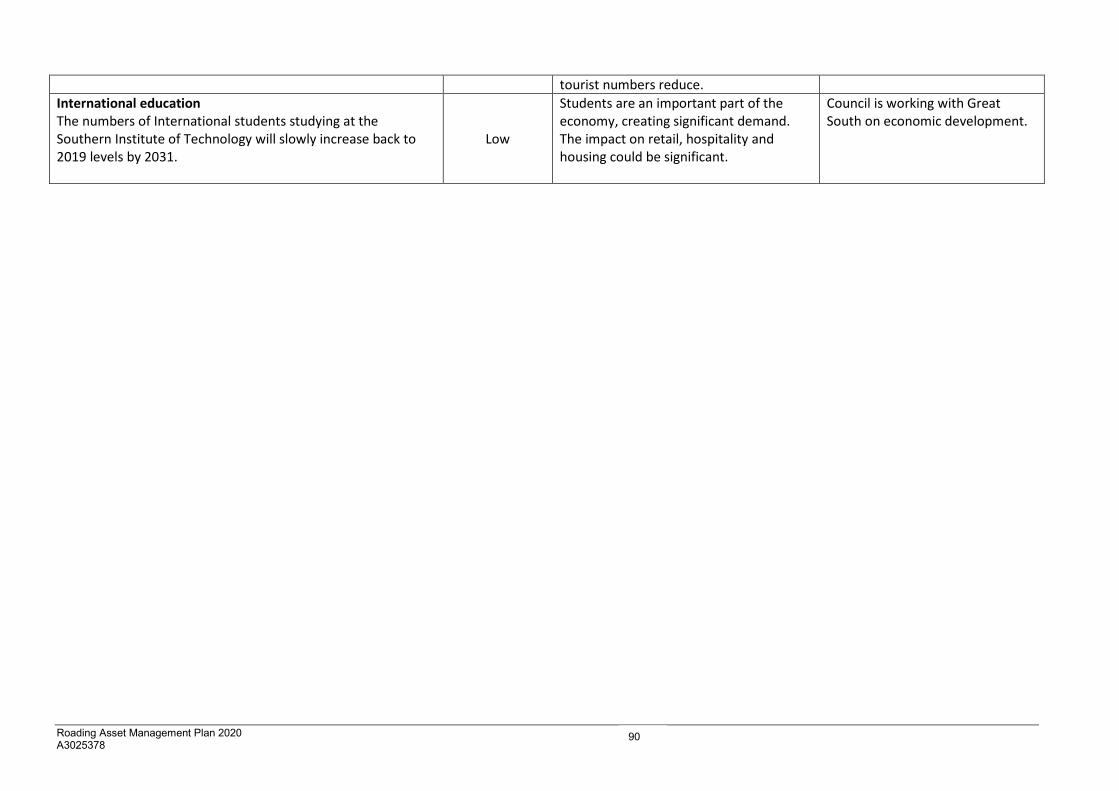
Roading Asset Management Plan 2020 A3025378
90
tourist numbers reduce. International education The numbers of International students studying at the Southern Institute of Technology will slowly increase back to 2019 levels by 2031.
Low
Students are an important part of the economy, creating significant demand. The impact on retail, hospitality and housing could be significant.
Council is working with Great South on economic development.
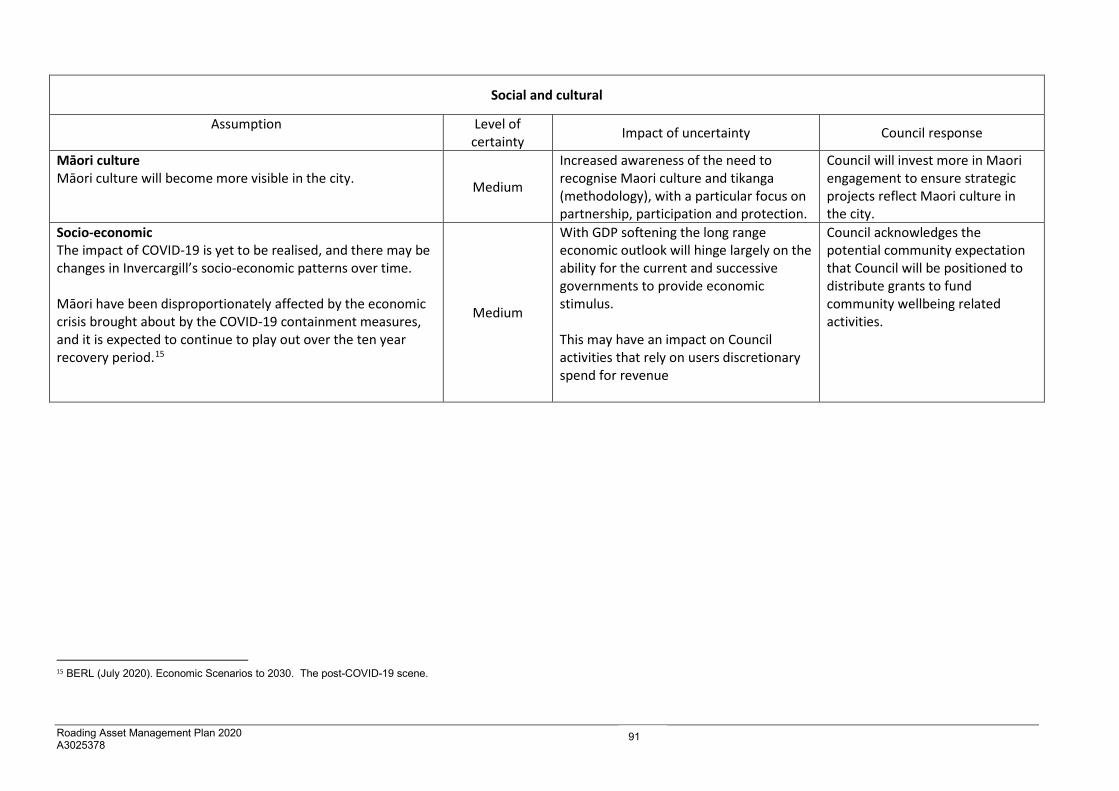
Roading Asset Management Plan 2020 A3025378
91
Social and cultural
Assumption Level of certainty Impact of uncertainty Council response
Māori culture Māori culture will become more visible in the city. Medium
Increased awareness of the need to recognise Maori culture and tikanga (methodology), with a particular focus on partnership, participation and protection.
Council will invest more in Maori engagement to ensure strategic projects reflect Maori culture in the city.
Socio-economic The impact of COVID‐19 is yet to be realised, and there may be changes in Invercargill’s socio‐economic patterns over time. Māori have been disproportionately affected by the economic crisis brought about by the COVID‐19 containment measures, and it is expected to continue to play out over the ten year recovery period.15
Medium
With GDP softening the long range economic outlook will hinge largely on the ability for the current and successive governments to provide economic stimulus. This may have an impact on Council activities that rely on users discretionary spend for revenue
Council acknowledges the potential community expectation that Council will be positioned to distribute grants to fund community wellbeing related activities.
15 BERL (July 2020). Economic Scenarios to 2030. The post-COVID-19 scene.
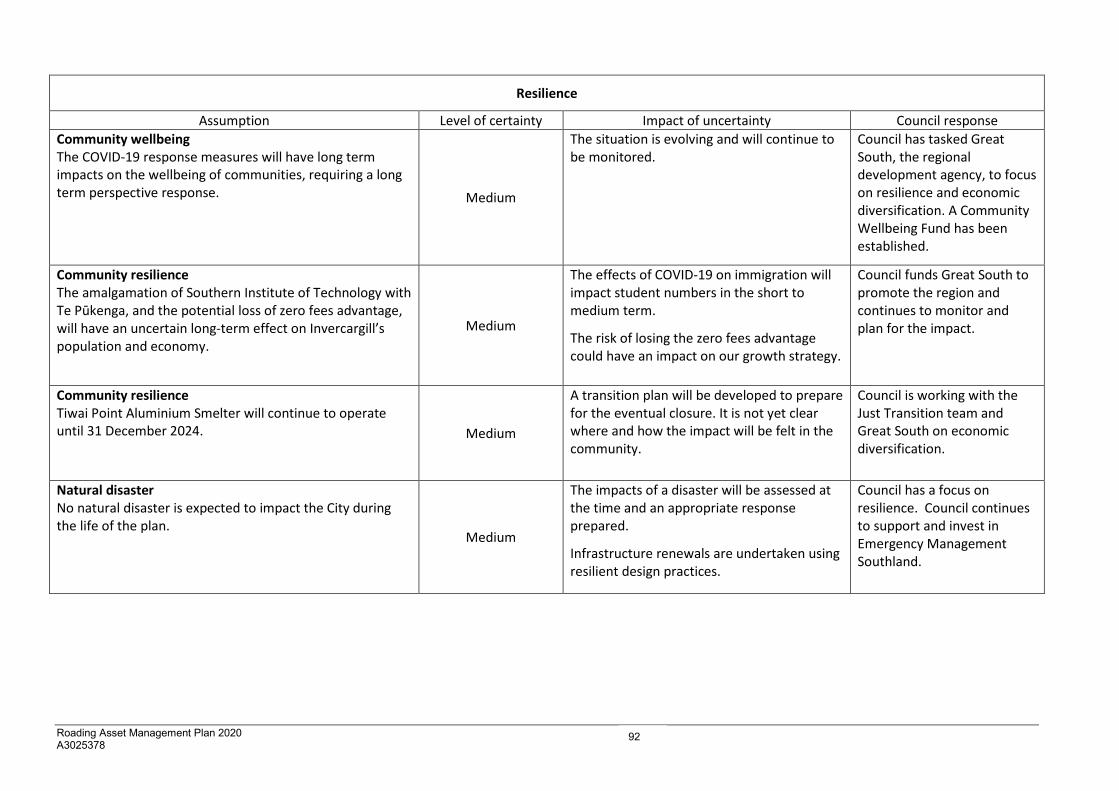
Roading Asset Management Plan 2020 A3025378
92
Resilience
Assumption Level of certainty Impact of uncertainty Council response Community wellbeing The COVID‐19 response measures will have long term impacts on the wellbeing of communities, requiring a long term perspective response. Medium
The situation is evolving and will continue to be monitored.
Council has tasked Great South, the regional development agency, to focus on resilience and economic diversification. A Community Wellbeing Fund has been established.
Community resilience The amalgamation of Southern Institute of Technology with Te Pūkenga, and the potential loss of zero fees advantage, will have an uncertain long‐term effect on Invercargill’s population and economy.
Medium
The effects of COVID‐19 on immigration will impact student numbers in the short to medium term.
The risk of losing the zero fees advantage could have an impact on our growth strategy.
Council funds Great South to promote the region and continues to monitor and plan for the impact.
Community resilience Tiwai Point Aluminium Smelter will continue to operate until 31 December 2024. Medium
A transition plan will be developed to prepare for the eventual closure. It is not yet clear where and how the impact will be felt in the community.
Council is working with the Just Transition team and Great South on economic diversification.
Natural disaster No natural disaster is expected to impact the City during the life of the plan.
Medium
The impacts of a disaster will be assessed at the time and an appropriate response prepared.
Infrastructure renewals are undertaken using resilient design practices.
Council has a focus on resilience. Council continues to support and invest in Emergency Management Southland.
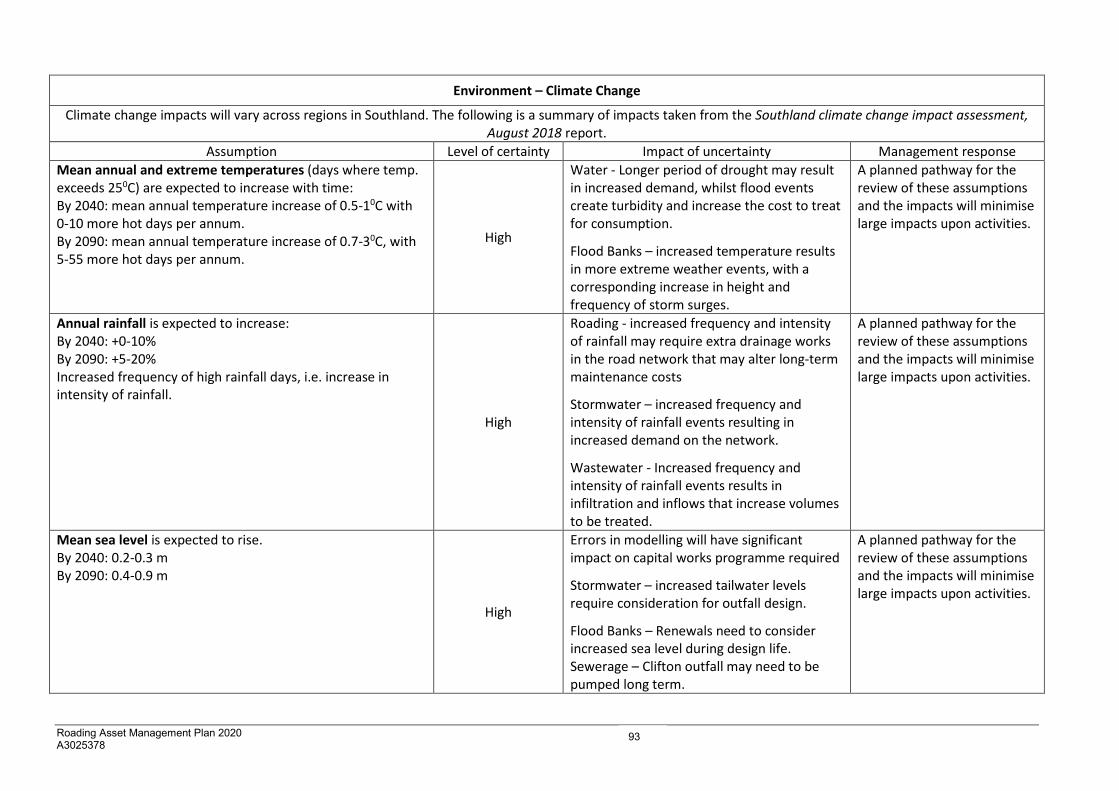
Roading Asset Management Plan 2020 A3025378
93
Environment – Climate Change
Climate change impacts will vary across regions in Southland. The following is a summary of impacts taken from the Southland climate change impact assessment, August 2018 report.
Assumption Level of certainty Impact of uncertainty Management response Mean annual and extreme temperatures (days where temp. exceeds 250C) are expected to increase with time: By 2040: mean annual temperature increase of 0.5‐10C with 0‐10 more hot days per annum. By 2090: mean annual temperature increase of 0.7‐30C, with 5‐55 more hot days per annum.
High
Water ‐ Longer period of drought may result in increased demand, whilst flood events create turbidity and increase the cost to treat for consumption.
Flood Banks – increased temperature results in more extreme weather events, with a corresponding increase in height and frequency of storm surges.
A planned pathway for the review of these assumptions and the impacts will minimise large impacts upon activities.
Annual rainfall is expected to increase: By 2040: +0‐10% By 2090: +5‐20% Increased frequency of high rainfall days, i.e. increase in intensity of rainfall.
High
Roading ‐ increased frequency and intensity of rainfall may require extra drainage works in the road network that may alter long‐term maintenance costs
Stormwater – increased frequency and intensity of rainfall events resulting in increased demand on the network.
Wastewater ‐ Increased frequency and intensity of rainfall events results in infiltration and inflows that increase volumes to be treated.
A planned pathway for the review of these assumptions and the impacts will minimise large impacts upon activities.
Mean sea level is expected to rise. By 2040: 0.2‐0.3 m By 2090: 0.4‐0.9 m
High
Errors in modelling will have significant impact on capital works programme required
Stormwater – increased tailwater levels require consideration for outfall design.
Flood Banks – Renewals need to consider increased sea level during design life. Sewerage – Clifton outfall may need to be pumped long term.
A planned pathway for the review of these assumptions and the impacts will minimise large impacts upon activities.
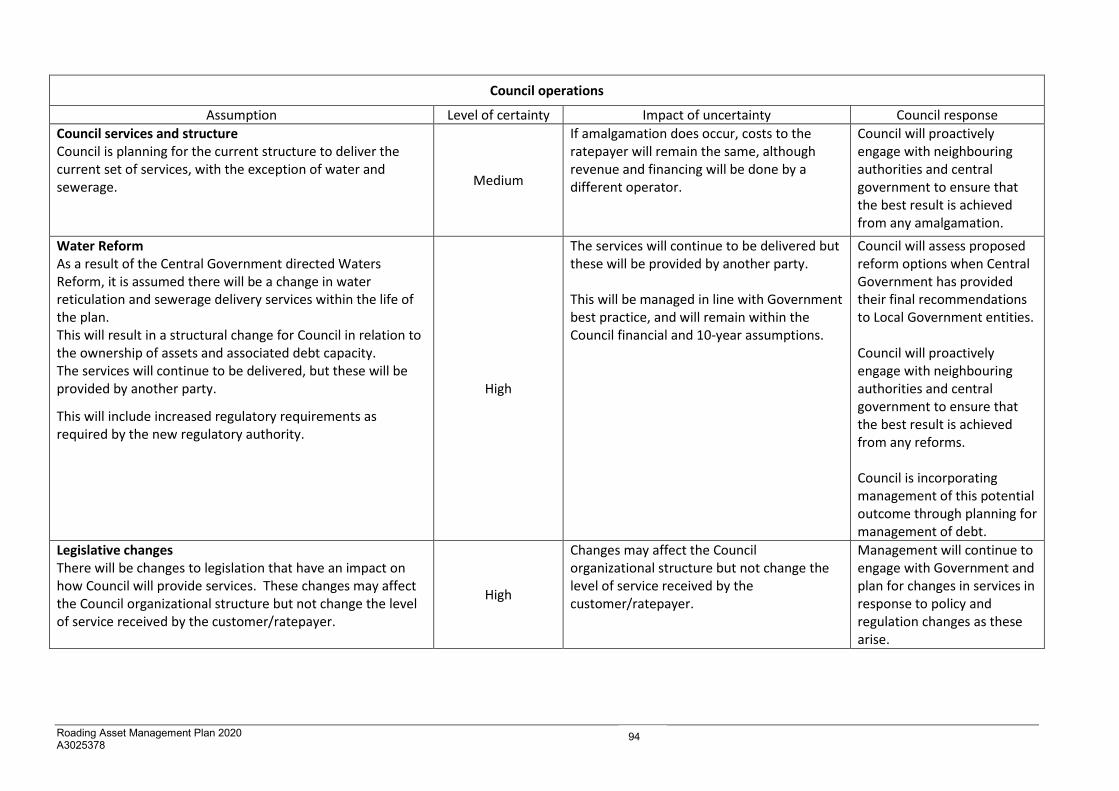
Roading Asset Management Plan 2020 A3025378
94
Council operations
Assumption Level of certainty Impact of uncertainty Council response Council services and structure Council is planning for the current structure to deliver the current set of services, with the exception of water and sewerage. Medium
If amalgamation does occur, costs to the ratepayer will remain the same, although revenue and financing will be done by a different operator.
Council will proactively engage with neighbouring authorities and central government to ensure that the best result is achieved from any amalgamation.
Water Reform As a result of the Central Government directed Waters Reform, it is assumed there will be a change in water reticulation and sewerage delivery services within the life of the plan. This will result in a structural change for Council in relation to the ownership of assets and associated debt capacity. The services will continue to be delivered, but these will be provided by another party.
This will include increased regulatory requirements as required by the new regulatory authority.
High
The services will continue to be delivered but these will be provided by another party. This will be managed in line with Government best practice, and will remain within the Council financial and 10‐year assumptions.
Council will assess proposed reform options when Central Government has provided their final recommendations to Local Government entities. Council will proactively engage with neighbouring authorities and central government to ensure that the best result is achieved from any reforms. Council is incorporating management of this potential outcome through planning for management of debt.
Legislative changes There will be changes to legislation that have an impact on how Council will provide services. These changes may affect the Council organizational structure but not change the level of service received by the customer/ratepayer.
High
Changes may affect the Council organizational structure but not change the level of service received by the customer/ratepayer.
Management will continue to engage with Government and plan for changes in services in response to policy and regulation changes as these arise.
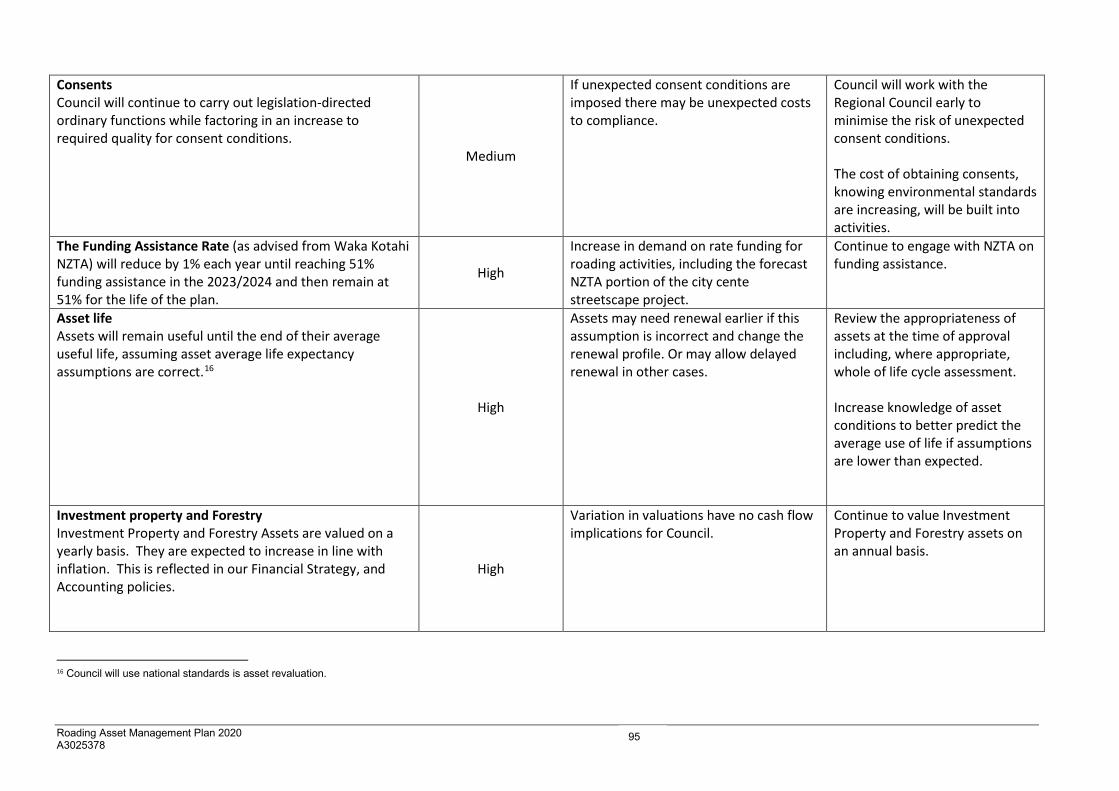
Roading Asset Management Plan 2020 A3025378
95
Consents Council will continue to carry out legislation‐directed ordinary functions while factoring in an increase to required quality for consent conditions.
Medium
If unexpected consent conditions are imposed there may be unexpected costs to compliance.
Council will work with the Regional Council early to minimise the risk of unexpected consent conditions. The cost of obtaining consents, knowing environmental standards are increasing, will be built into activities.
The Funding Assistance Rate (as advised from Waka Kotahi NZTA) will reduce by 1% each year until reaching 51% funding assistance in the 2023/2024 and then remain at 51% for the life of the plan.
High
Increase in demand on rate funding for roading activities, including the forecast NZTA portion of the city cente streetscape project.
Continue to engage with NZTA on funding assistance.
Asset life Assets will remain useful until the end of their average useful life, assuming asset average life expectancy assumptions are correct.16
High
Assets may need renewal earlier if this assumption is incorrect and change the renewal profile. Or may allow delayed renewal in other cases.
Review the appropriateness of assets at the time of approval including, where appropriate, whole of life cycle assessment. Increase knowledge of asset conditions to better predict the average use of life if assumptions are lower than expected.
Investment property and Forestry Investment Property and Forestry Assets are valued on a yearly basis. They are expected to increase in line with inflation. This is reflected in our Financial Strategy, and Accounting policies.
High
Variation in valuations have no cash flow implications for Council.
Continue to value Investment Property and Forestry assets on an annual basis.
16 Council will use national standards is asset revaluation.
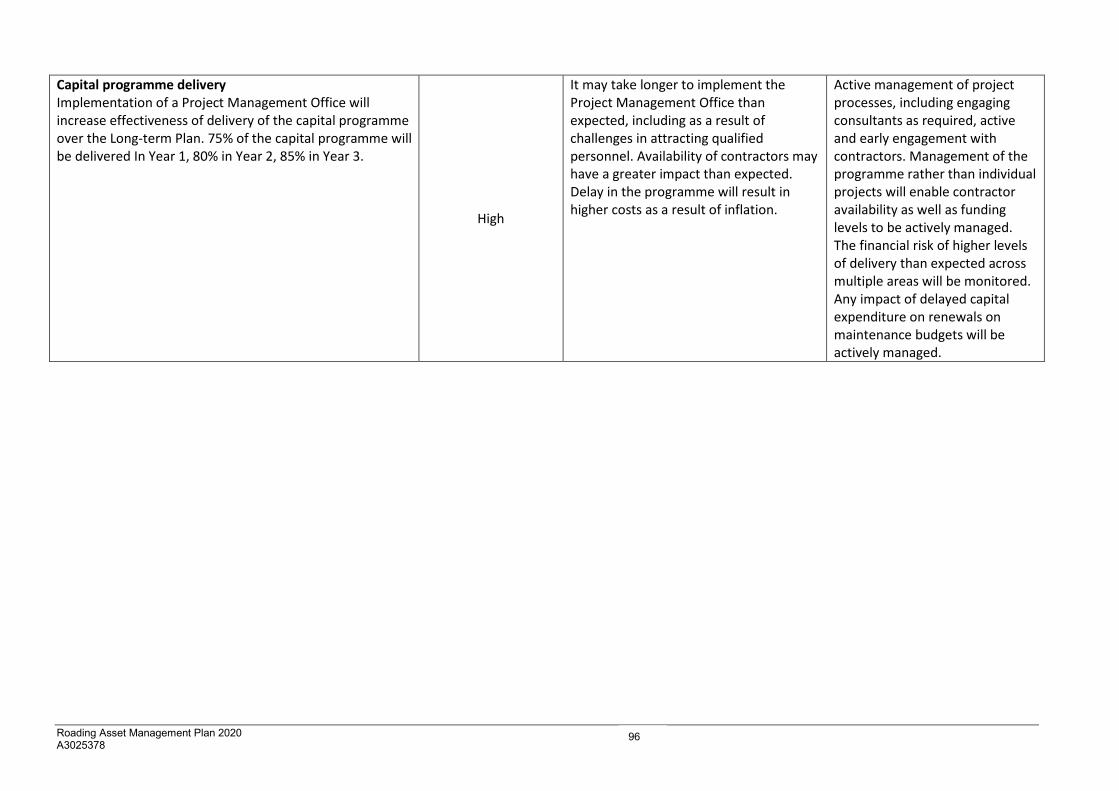
Roading Asset Management Plan 2020 A3025378
96
Capital programme delivery Implementation of a Project Management Office will increase effectiveness of delivery of the capital programme over the Long‐term Plan. 75% of the capital programme will be delivered In Year 1, 80% in Year 2, 85% in Year 3.
High
It may take longer to implement the Project Management Office than expected, including as a result of challenges in attracting qualified personnel. Availability of contractors may have a greater impact than expected. Delay in the programme will result in higher costs as a result of inflation.
Active management of project processes, including engaging consultants as required, active and early engagement with contractors. Management of the programme rather than individual projects will enable contractor availability as well as funding levels to be actively managed. The financial risk of higher levels of delivery than expected across multiple areas will be monitored. Any impact of delayed capital expenditure on renewals on maintenance budgets will be actively managed.
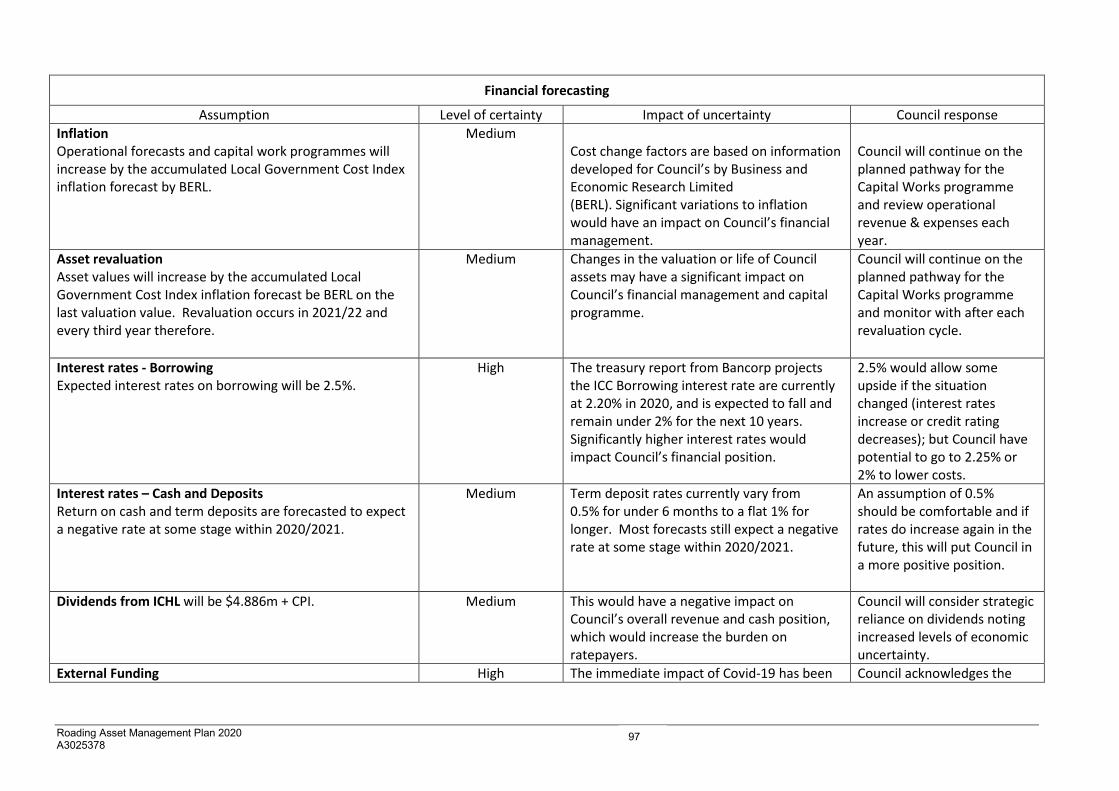
Roading Asset Management Plan 2020 A3025378
97
Financial forecasting
Assumption Level of certainty Impact of uncertainty Council response Inflation Operational forecasts and capital work programmes will increase by the accumulated Local Government Cost Index inflation forecast by BERL.
Medium Cost change factors are based on information developed for Council’s by Business and Economic Research Limited (BERL). Significant variations to inflation would have an impact on Council’s financial management.
Council will continue on the planned pathway for the Capital Works programme and review operational revenue & expenses each year.
Asset revaluation Asset values will increase by the accumulated Local Government Cost Index inflation forecast be BERL on the last valuation value. Revaluation occurs in 2021/22 and every third year therefore.
Medium Changes in the valuation or life of Council assets may have a significant impact on Council’s financial management and capital programme.
Council will continue on the planned pathway for the Capital Works programme and monitor with after each revaluation cycle.
Interest rates - Borrowing Expected interest rates on borrowing will be 2.5%.
High The treasury report from Bancorp projects the ICC Borrowing interest rate are currently at 2.20% in 2020, and is expected to fall and remain under 2% for the next 10 years. Significantly higher interest rates would impact Council’s financial position.
2.5% would allow some upside if the situation changed (interest rates increase or credit rating decreases); but Council have potential to go to 2.25% or 2% to lower costs.
Interest rates – Cash and Deposits Return on cash and term deposits are forecasted to expect a negative rate at some stage within 2020/2021.
Medium Term deposit rates currently vary from 0.5% for under 6 months to a flat 1% for longer. Most forecasts still expect a negative rate at some stage within 2020/2021.
An assumption of 0.5% should be comfortable and if rates do increase again in the future, this will put Council in a more positive position.
Dividends from ICHL will be $4.886m + CPI. Medium This would have a negative impact on Council’s overall revenue and cash position, which would increase the burden on ratepayers.
Council will consider strategic reliance on dividends noting increased levels of economic uncertainty.
External Funding High The immediate impact of Covid‐19 has been Council acknowledges the
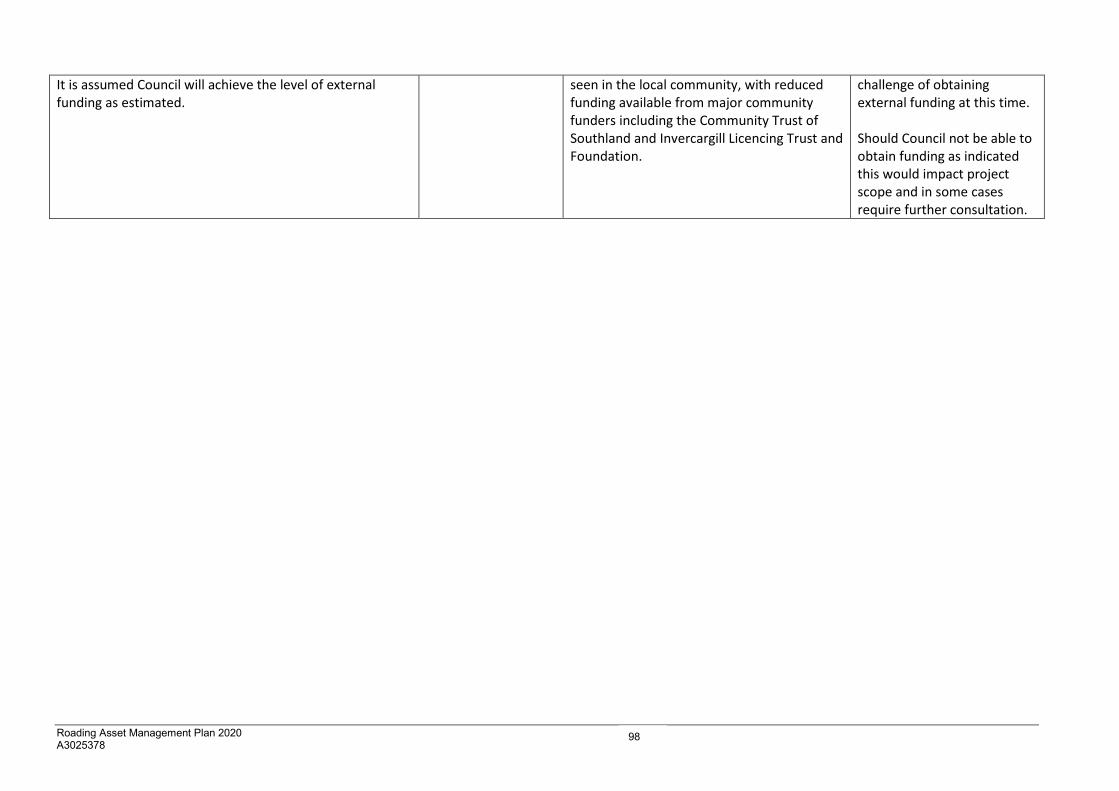
Roading Asset Management Plan 2020 A3025378
98
It is assumed Council will achieve the level of external funding as estimated.
seen in the local community, with reduced funding available from major community funders including the Community Trust of Southland and Invercargill Licencing Trust and Foundation.
challenge of obtaining external funding at this time. Should Council not be able to obtain funding as indicated this would impact project scope and in some cases require further consultation.
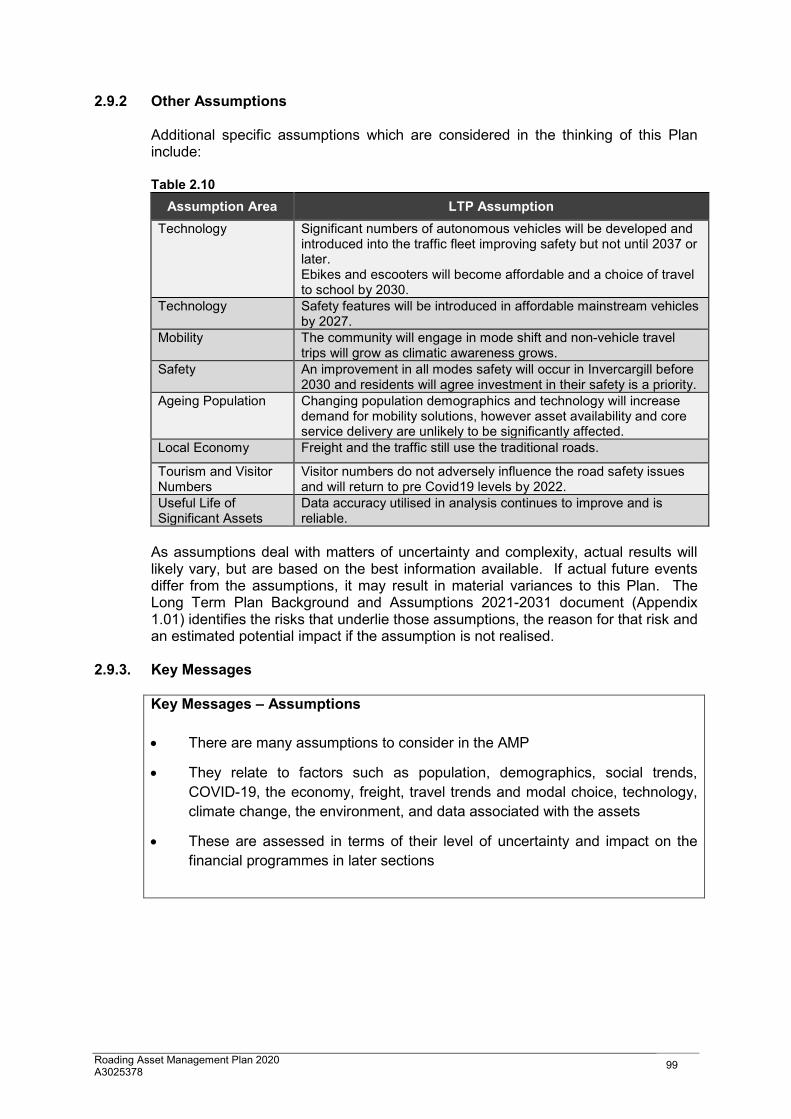
Roading Asset Management Plan 2020 A3025378 99
2.9.2 Other Assumptions
Additional specific assumptions which are considered in the thinking of this Plan include: Table 2.10
Assumption Area LTP Assumption
Technology Significant numbers of autonomous vehicles will be developed and introduced into the traffic fleet improving safety but not until 2037 or later. Ebikes and escooters will become affordable and a choice of travel to school by 2030.
Technology Safety features will be introduced in affordable mainstream vehicles by 2027.
Mobility The community will engage in mode shift and non-vehicle travel trips will grow as climatic awareness grows.
Safety An improvement in all modes safety will occur in Invercargill before 2030 and residents will agree investment in their safety is a priority.
Ageing Population Changing population demographics and technology will increase demand for mobility solutions, however asset availability and core service delivery are unlikely to be significantly affected.
Local Economy Freight and the traffic still use the traditional roads.
Tourism and Visitor Numbers
Visitor numbers do not adversely influence the road safety issues and will return to pre Covid19 levels by 2022.
Useful Life of Significant Assets
Data accuracy utilised in analysis continues to improve and is reliable.
As assumptions deal with matters of uncertainty and complexity, actual results will likely vary, but are based on the best information available. If actual future events differ from the assumptions, it may result in material variances to this Plan. The Long Term Plan Background and Assumptions 2021-2031 document (Appendix 1.01) identifies the risks that underlie those assumptions, the reason for that risk and an estimated potential impact if the assumption is not realised.
2.9.3. Key Messages
Key Messages – Assumptions • There are many assumptions to consider in the AMP
• They relate to factors such as population, demographics, social trends, COVID-19, the economy, freight, travel trends and modal choice, technology, climate change, the environment, and data associated with the assets
• These are assessed in terms of their level of uncertainty and impact on the financial programmes in later sections
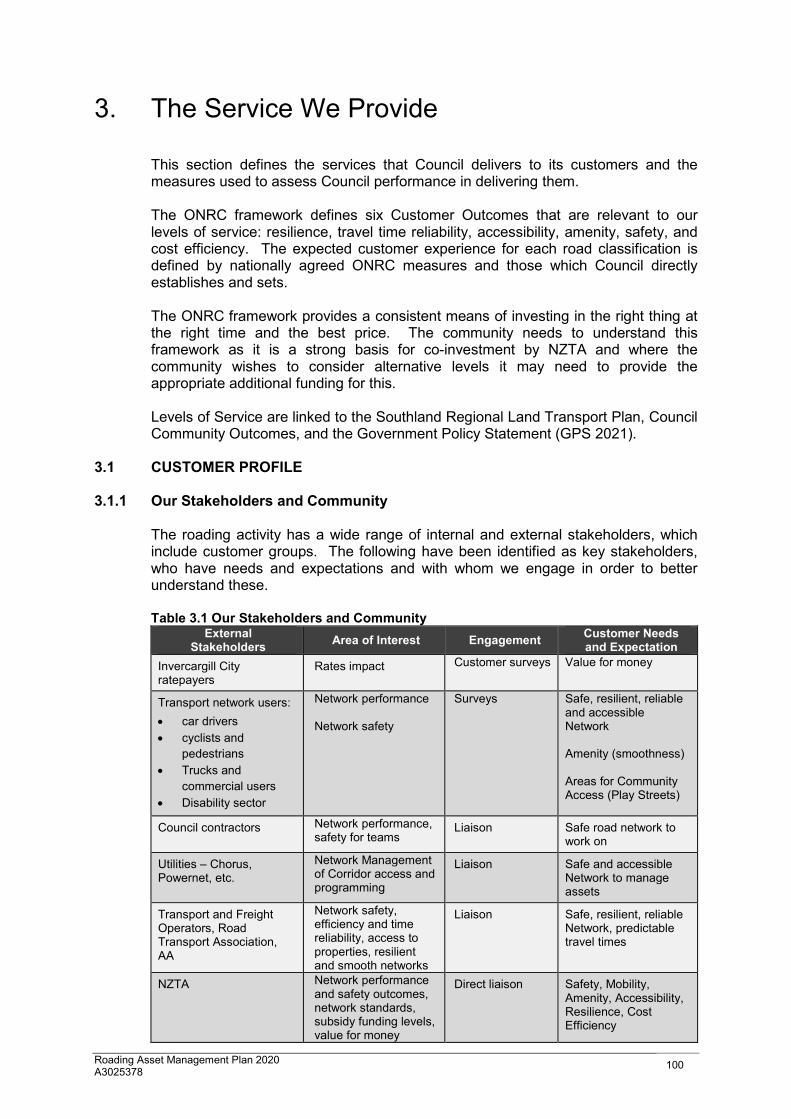
Roading Asset Management Plan 2020 A3025378 100
3. The Service We Provide This section defines the services that Council delivers to its customers and the measures used to assess Council performance in delivering them. The ONRC framework defines six Customer Outcomes that are relevant to our levels of service: resilience, travel time reliability, accessibility, amenity, safety, and cost efficiency. The expected customer experience for each road classification is defined by nationally agreed ONRC measures and those which Council directly establishes and sets. The ONRC framework provides a consistent means of investing in the right thing at the right time and the best price. The community needs to understand this framework as it is a strong basis for co-investment by NZTA and where the community wishes to consider alternative levels it may need to provide the appropriate additional funding for this. Levels of Service are linked to the Southland Regional Land Transport Plan, Council Community Outcomes, and the Government Policy Statement (GPS 2021).
3.1 CUSTOMER PROFILE 3.1.1 Our Stakeholders and Community
The roading activity has a wide range of internal and external stakeholders, which include customer groups. The following have been identified as key stakeholders, who have needs and expectations and with whom we engage in order to better understand these. Table 3.1 Our Stakeholders and Community
External Stakeholders Area of Interest Engagement Customer Needs
and Expectation Invercargill City ratepayers
Rates impact Customer surveys Value for money
Transport network users: • car drivers • cyclists and
pedestrians • Trucks and
commercial users • Disability sector
Network performance Network safety
Surveys Safe, resilient, reliable and accessible Network Amenity (smoothness) Areas for Community Access (Play Streets)
Council contractors Network performance, safety for teams
Liaison Safe road network to work on
Utilities – Chorus, Powernet, etc.
Network Management of Corridor access and programming
Liaison Safe and accessible Network to manage assets
Transport and Freight Operators, Road Transport Association, AA
Network safety, efficiency and time reliability, access to properties, resilient and smooth networks
Liaison Safe, resilient, reliable Network, predictable travel times
NZTA Network performance and safety outcomes, network standards, subsidy funding levels, value for money
Direct liaison Safety, Mobility, Amenity, Accessibility, Resilience, Cost Efficiency
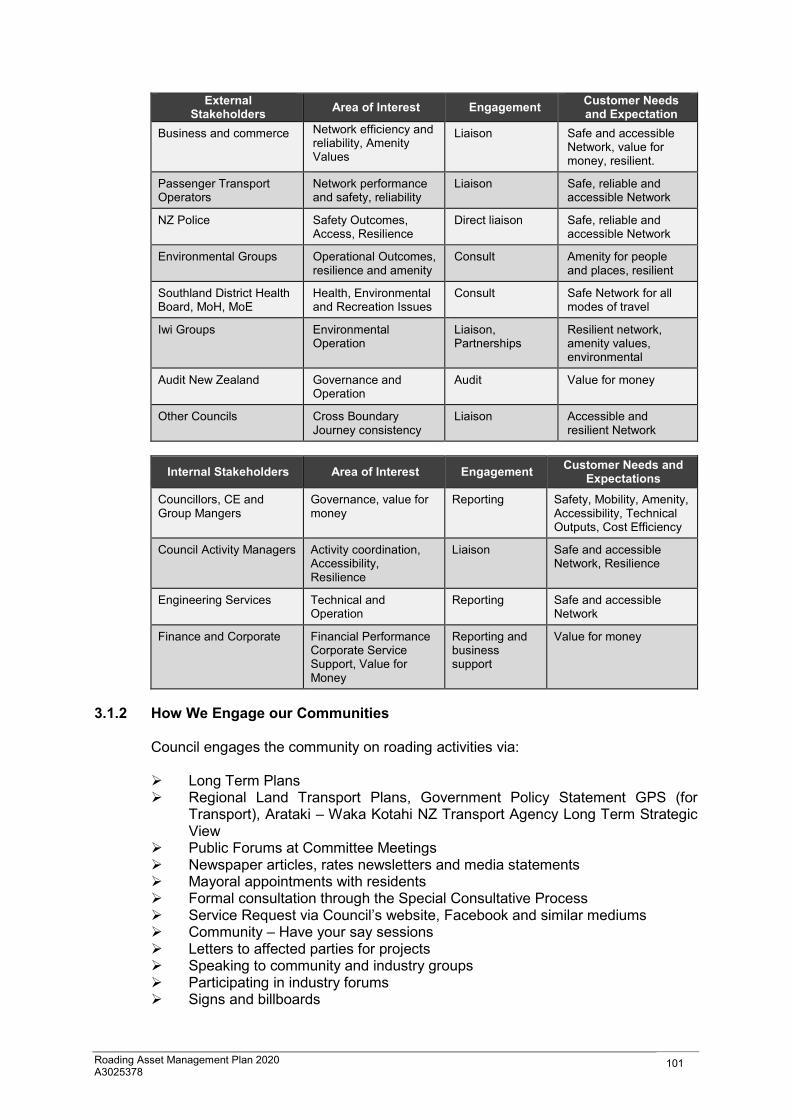
Roading Asset Management Plan 2020 A3025378
101
External Stakeholders Area of Interest Engagement Customer Needs
and Expectation Business and commerce Network efficiency and
reliability, Amenity Values
Liaison Safe and accessible Network, value for money, resilient.
Passenger Transport Operators
Network performance and safety, reliability
Liaison Safe, reliable and accessible Network
NZ Police Safety Outcomes, Access, Resilience
Direct liaison Safe, reliable and accessible Network
Environmental Groups Operational Outcomes, resilience and amenity
Consult Amenity for people and places, resilient
Southland District Health Board, MoH, MoE
Health, Environmental and Recreation Issues
Consult Safe Network for all modes of travel
Iwi Groups Environmental Operation
Liaison, Partnerships
Resilient network, amenity values, environmental
Audit New Zealand Governance and Operation
Audit Value for money
Other Councils Cross Boundary Journey consistency
Liaison Accessible and resilient Network
Internal Stakeholders Area of Interest Engagement Customer Needs and Expectations
Councillors, CE and Group Mangers
Governance, value for money
Reporting Safety, Mobility, Amenity, Accessibility, Technical Outputs, Cost Efficiency
Council Activity Managers Activity coordination, Accessibility, Resilience
Liaison Safe and accessible Network, Resilience
Engineering Services Technical and Operation
Reporting Safe and accessible Network
Finance and Corporate Financial Performance Corporate Service Support, Value for Money
Reporting and business support
Value for money
3.1.2 How We Engage our Communities
Council engages the community on roading activities via: Long Term Plans Regional Land Transport Plans, Government Policy Statement GPS (for
Transport), Arataki – Waka Kotahi NZ Transport Agency Long Term Strategic View
Public Forums at Committee Meetings Newspaper articles, rates newsletters and media statements Mayoral appointments with residents Formal consultation through the Special Consultative Process Service Request via Council’s website, Facebook and similar mediums Community – Have your say sessions Letters to affected parties for projects Speaking to community and industry groups Participating in industry forums Signs and billboards
Roading Asset Management Plan 2020 A3025378
102
3.1.3 Community Research
Council has undertaken surveys in 2014, 2016 and 2020 to receive the resident’s assessments of Council’s services. The 2020 research (Appendix 1.08) was undertaken to understand: What residents want from Council activities; How they perceive the value for money of those activities; and The level of service desired. A survey was underway in 2020 to revisit the key issues but was disrupted by the Covid-19 issues. The key findings from 2016 still are seen as strong community directions and will continue to be utilised and are: Roading is seen as a high priority (90% importance rating; 3rd highest). Support of respondents to see more spent (invested) to provide a better
quality service. Only 59% thought the road surface was good (with similar results for
footpaths). Only 8% felt unsafe on roads. Surfacing (road and footpaths) improvements was the most common
improvement suggested. Customer service requests are also logged corporately and this information is another platform which can be used to understand community requirements and where demand is growing or issues of concern are developing. The Problem Statements in Section 2 have been reviewed and updated to include understandings gathered over the last three years. Many customers drive State Highways through the City and Council receives many requests for their improvement. The survey may be impacted by this input which is typically not tested.
3.1.4 Key Service Attributes Valued by Customers
Customers see the most important aspects of the roading activity as: Connected reliable roads and streets safe for all modes of transport. Council advocating, promoting and delivering programmes which support
access and mobility for the community. A road network which is reliable and resilient from storms, natural hazards or
the effects of climate change. Roading programmes and changes to assets encouraging a shift from car use
to walking and cycling. Accessible footpaths for use of many transport modes (walking, mobility
devices, scooters) with suitable access to properties to support our changing population demographics.
A City Centre which encourages people to visit and stay through having place functionality.
A Council where environmental issues are considered when making choices and decisions.
Roads with clear road signs, markings and traffic signals. A heart of Invercargill to be proud of that is well maintained, clean and safe.
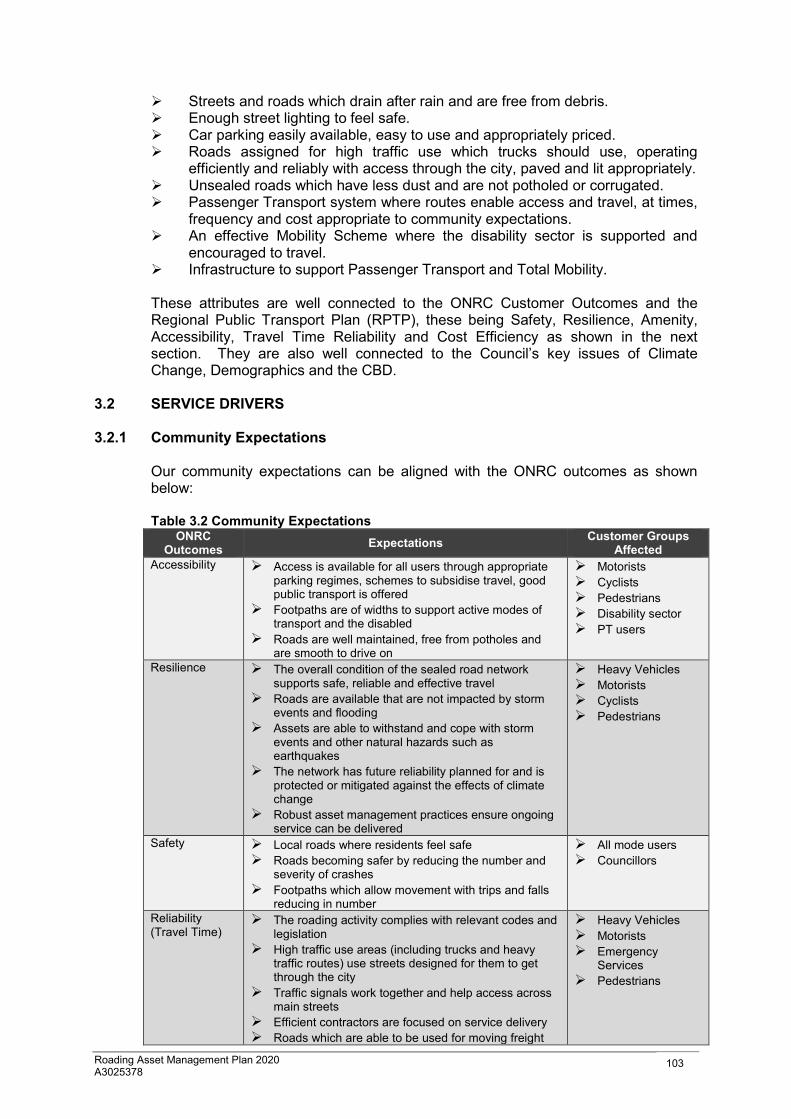
Roading Asset Management Plan 2020 A3025378
103
Streets and roads which drain after rain and are free from debris. Enough street lighting to feel safe. Car parking easily available, easy to use and appropriately priced. Roads assigned for high traffic use which trucks should use, operating
efficiently and reliably with access through the city, paved and lit appropriately. Unsealed roads which have less dust and are not potholed or corrugated. Passenger Transport system where routes enable access and travel, at times,
frequency and cost appropriate to community expectations. An effective Mobility Scheme where the disability sector is supported and
encouraged to travel. Infrastructure to support Passenger Transport and Total Mobility.
These attributes are well connected to the ONRC Customer Outcomes and the Regional Public Transport Plan (RPTP), these being Safety, Resilience, Amenity, Accessibility, Travel Time Reliability and Cost Efficiency as shown in the next section. They are also well connected to the Council’s key issues of Climate Change, Demographics and the CBD.
3.2 SERVICE DRIVERS 3.2.1 Community Expectations
Our community expectations can be aligned with the ONRC outcomes as shown below: Table 3.2 Community Expectations
ONRC Outcomes Expectations Customer Groups
Affected Accessibility Access is available for all users through appropriate
parking regimes, schemes to subsidise travel, good public transport is offered
Footpaths are of widths to support active modes of transport and the disabled
Roads are well maintained, free from potholes and are smooth to drive on
Motorists Cyclists Pedestrians Disability sector PT users
Resilience The overall condition of the sealed road network supports safe, reliable and effective travel
Roads are available that are not impacted by storm events and flooding
Assets are able to withstand and cope with storm events and other natural hazards such as earthquakes
The network has future reliability planned for and is protected or mitigated against the effects of climate change
Robust asset management practices ensure ongoing service can be delivered
Heavy Vehicles Motorists Cyclists Pedestrians
Safety Local roads where residents feel safe Roads becoming safer by reducing the number and
severity of crashes Footpaths which allow movement with trips and falls
reducing in number
All mode users Councillors
Reliability (Travel Time)
The roading activity complies with relevant codes and legislation
High traffic use areas (including trucks and heavy traffic routes) use streets designed for them to get through the city
Traffic signals work together and help access across main streets
Efficient contractors are focused on service delivery Roads which are able to be used for moving freight
Heavy Vehicles Motorists Emergency
Services Pedestrians
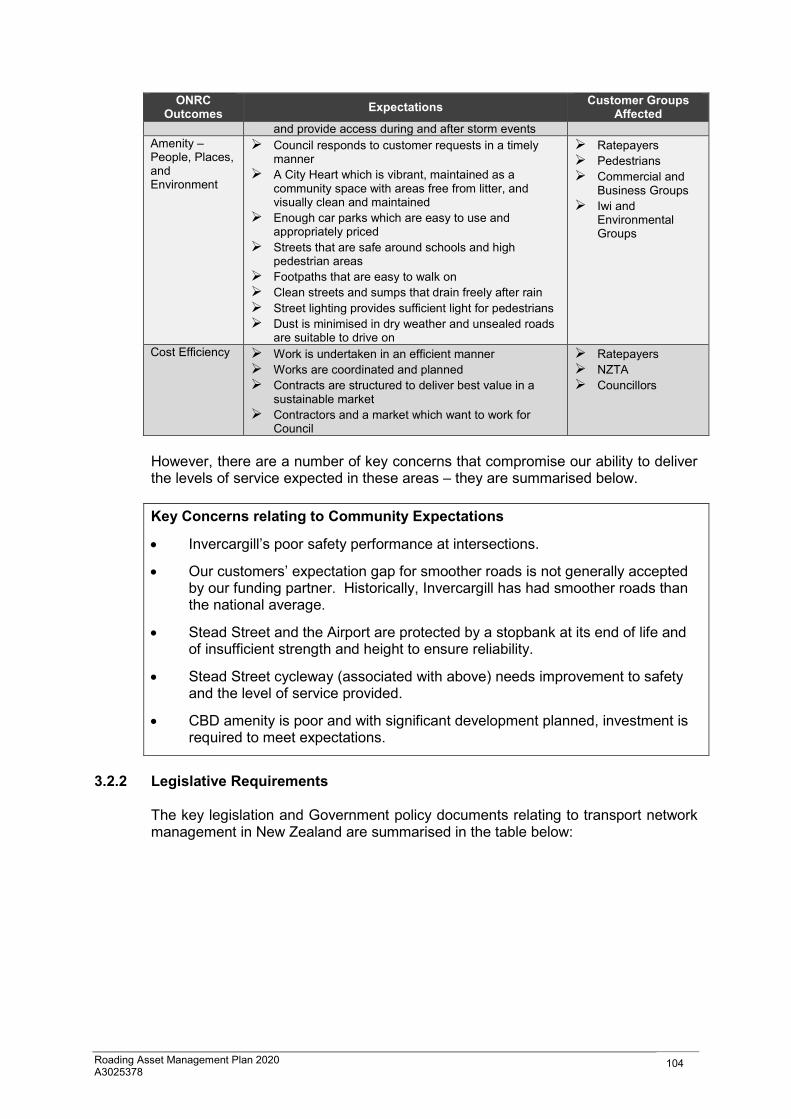
Roading Asset Management Plan 2020 A3025378
104
ONRC Outcomes Expectations Customer Groups
Affected and provide access during and after storm events
Amenity – People, Places, and Environment
Council responds to customer requests in a timely manner
A City Heart which is vibrant, maintained as a community space with areas free from litter, and visually clean and maintained
Enough car parks which are easy to use and appropriately priced
Streets that are safe around schools and high pedestrian areas
Footpaths that are easy to walk on Clean streets and sumps that drain freely after rain Street lighting provides sufficient light for pedestrians Dust is minimised in dry weather and unsealed roads
are suitable to drive on
Ratepayers Pedestrians Commercial and
Business Groups Iwi and
Environmental Groups
Cost Efficiency Work is undertaken in an efficient manner Works are coordinated and planned Contracts are structured to deliver best value in a
sustainable market Contractors and a market which want to work for
Council
Ratepayers NZTA Councillors
However, there are a number of key concerns that compromise our ability to deliver the levels of service expected in these areas – they are summarised below. Key Concerns relating to Community Expectations
• Invercargill’s poor safety performance at intersections.
• Our customers’ expectation gap for smoother roads is not generally accepted by our funding partner. Historically, Invercargill has had smoother roads than the national average.
• Stead Street and the Airport are protected by a stopbank at its end of life and of insufficient strength and height to ensure reliability.
• Stead Street cycleway (associated with above) needs improvement to safety and the level of service provided.
• CBD amenity is poor and with significant development planned, investment is required to meet expectations.
3.2.2 Legislative Requirements
The key legislation and Government policy documents relating to transport network management in New Zealand are summarised in the table below:
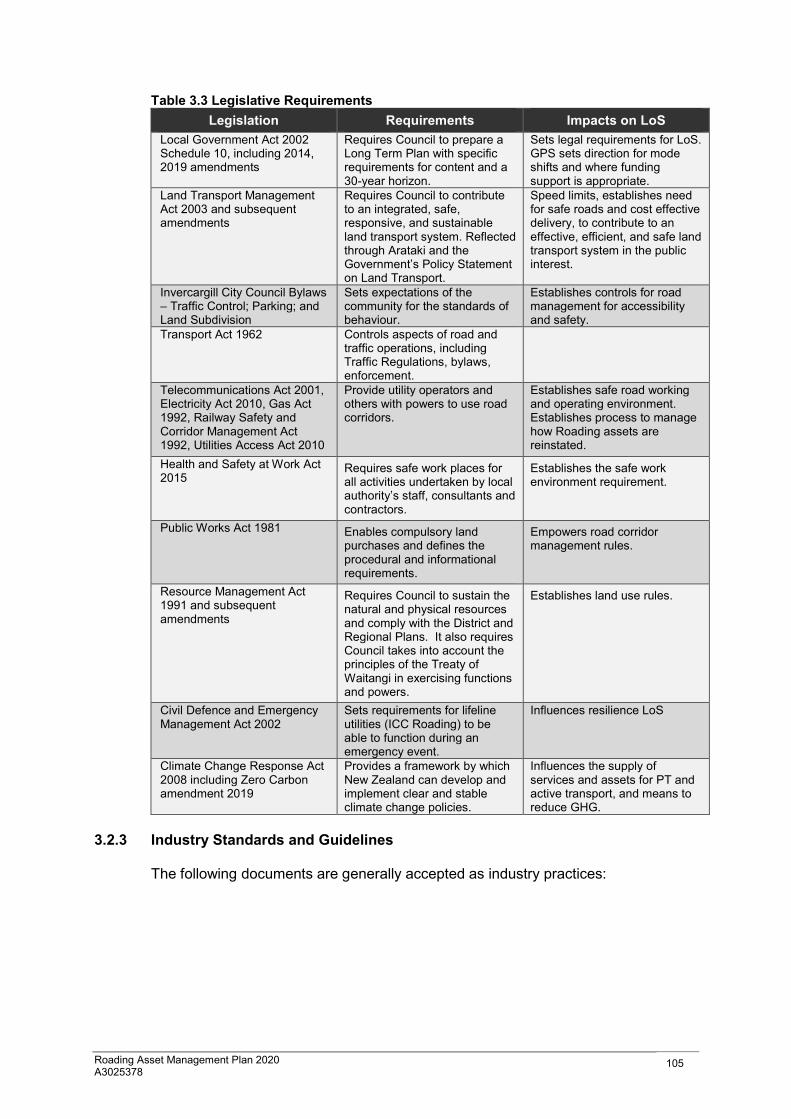
Roading Asset Management Plan 2020 A3025378
105
Table 3.3 Legislative Requirements Legislation Requirements Impacts on LoS
Local Government Act 2002 Schedule 10, including 2014, 2019 amendments
Requires Council to prepare a Long Term Plan with specific requirements for content and a 30-year horizon.
Sets legal requirements for LoS. GPS sets direction for mode shifts and where funding support is appropriate.
Land Transport Management Act 2003 and subsequent amendments
Requires Council to contribute to an integrated, safe, responsive, and sustainable land transport system. Reflected through Arataki and the Government’s Policy Statement on Land Transport.
Speed limits, establishes need for safe roads and cost effective delivery, to contribute to an effective, efficient, and safe land transport system in the public interest.
Invercargill City Council Bylaws – Traffic Control; Parking; and Land Subdivision
Sets expectations of the community for the standards of behaviour.
Establishes controls for road management for accessibility and safety.
Transport Act 1962 Controls aspects of road and traffic operations, including Traffic Regulations, bylaws, enforcement.
Telecommunications Act 2001, Electricity Act 2010, Gas Act 1992, Railway Safety and Corridor Management Act 1992, Utilities Access Act 2010
Provide utility operators and others with powers to use road corridors.
Establishes safe road working and operating environment. Establishes process to manage how Roading assets are reinstated.
Health and Safety at Work Act 2015
Requires safe work places for all activities undertaken by local authority’s staff, consultants and contractors.
Establishes the safe work environment requirement.
Public Works Act 1981 Enables compulsory land purchases and defines the procedural and informational requirements.
Empowers road corridor management rules.
Resource Management Act 1991 and subsequent amendments
Requires Council to sustain the natural and physical resources and comply with the District and Regional Plans. It also requires Council takes into account the principles of the Treaty of Waitangi in exercising functions and powers.
Establishes land use rules.
Civil Defence and Emergency Management Act 2002
Sets requirements for lifeline utilities (ICC Roading) to be able to function during an emergency event.
Influences resilience LoS
Climate Change Response Act 2008 including Zero Carbon amendment 2019
Provides a framework by which New Zealand can develop and implement clear and stable climate change policies.
Influences the supply of services and assets for PT and active transport, and means to reduce GHG.
3.2.3 Industry Standards and Guidelines
The following documents are generally accepted as industry practices:
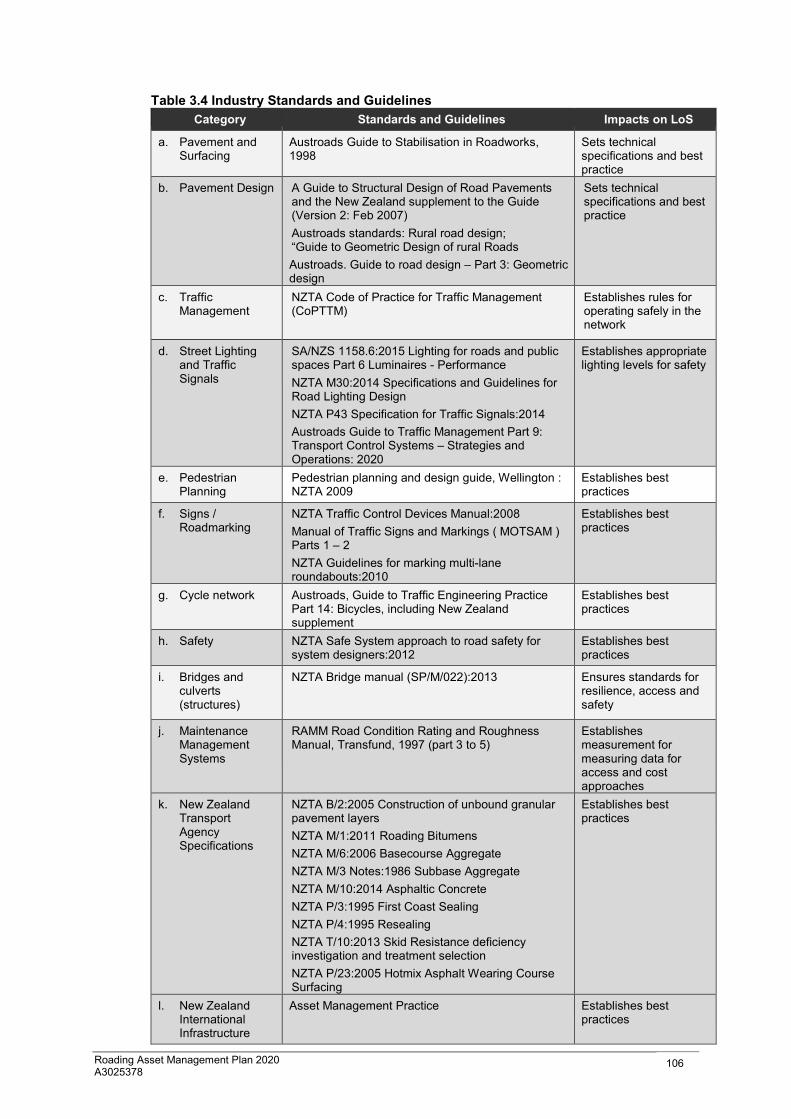
Roading Asset Management Plan 2020 A3025378
106
Table 3.4 Industry Standards and Guidelines Category Standards and Guidelines Impacts on LoS
a. Pavement and Surfacing
Austroads Guide to Stabilisation in Roadworks, 1998
Sets technical specifications and best practice
b. Pavement Design A Guide to Structural Design of Road Pavements and the New Zealand supplement to the Guide (Version 2: Feb 2007) Austroads standards: Rural road design; “Guide to Geometric Design of rural Roads Austroads. Guide to road design – Part 3: Geometric design
Sets technical specifications and best practice
c. Traffic Management
NZTA Code of Practice for Traffic Management (CoPTTM)
Establishes rules for operating safely in the network
d. Street Lighting and Traffic Signals
SA/NZS 1158.6:2015 Lighting for roads and public spaces Part 6 Luminaires - Performance NZTA M30:2014 Specifications and Guidelines for Road Lighting Design NZTA P43 Specification for Traffic Signals:2014 Austroads Guide to Traffic Management Part 9: Transport Control Systems – Strategies and Operations: 2020
Establishes appropriate lighting levels for safety
e. Pedestrian Planning
Pedestrian planning and design guide, Wellington : NZTA 2009
Establishes best practices
f. Signs / Roadmarking
NZTA Traffic Control Devices Manual:2008 Manual of Traffic Signs and Markings ( MOTSAM ) Parts 1 – 2 NZTA Guidelines for marking multi-lane roundabouts:2010
Establishes best practices
g. Cycle network Austroads, Guide to Traffic Engineering Practice Part 14: Bicycles, including New Zealand supplement
Establishes best practices
h. Safety NZTA Safe System approach to road safety for system designers:2012
Establishes best practices
i. Bridges and culverts (structures)
NZTA Bridge manual (SP/M/022):2013 Ensures standards for resilience, access and safety
j. Maintenance Management Systems
RAMM Road Condition Rating and Roughness Manual, Transfund, 1997 (part 3 to 5)
Establishes measurement for measuring data for access and cost approaches
k. New Zealand Transport Agency Specifications
NZTA B/2:2005 Construction of unbound granular pavement layers NZTA M/1:2011 Roading Bitumens NZTA M/6:2006 Basecourse Aggregate NZTA M/3 Notes:1986 Subbase Aggregate NZTA M/10:2014 Asphaltic Concrete NZTA P/3:1995 First Coast Sealing NZTA P/4:1995 Resealing NZTA T/10:2013 Skid Resistance deficiency investigation and treatment selection NZTA P/23:2005 Hotmix Asphalt Wearing Course Surfacing
Establishes best practices
l. New Zealand International Infrastructure
Asset Management Practice Establishes best practices
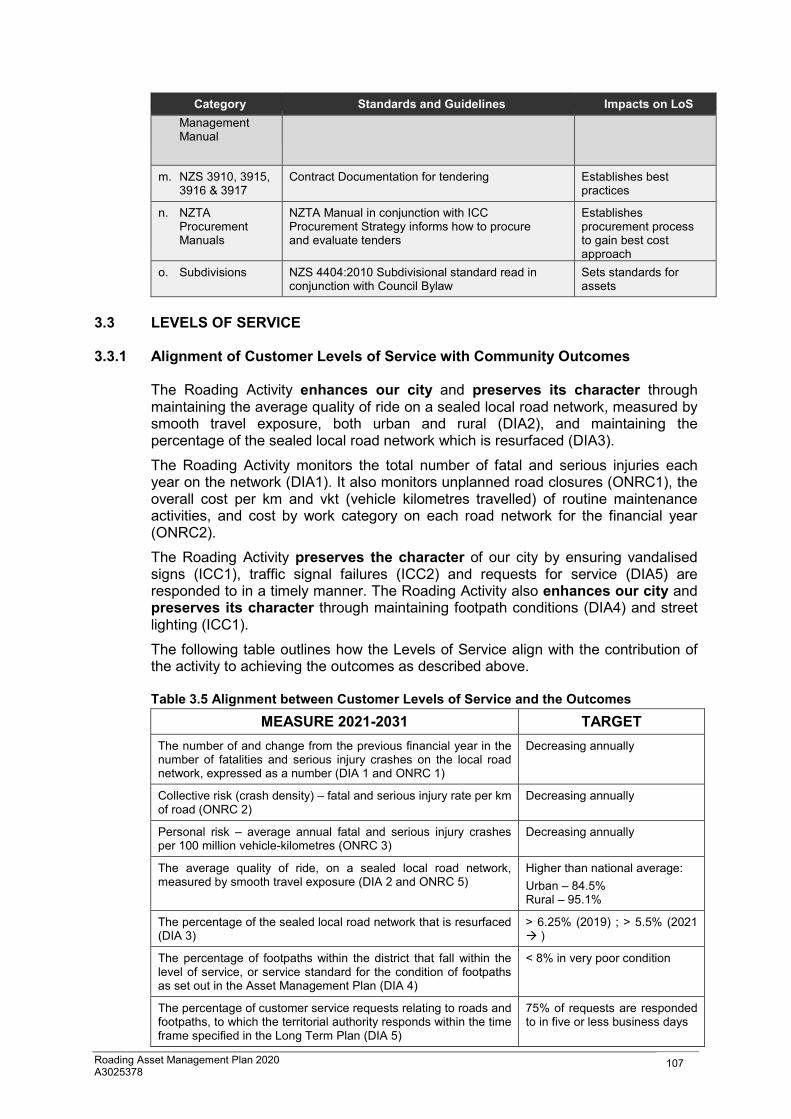
Roading Asset Management Plan 2020 A3025378
107
Category Standards and Guidelines Impacts on LoS Management Manual
m. NZS 3910, 3915, 3916 & 3917
Contract Documentation for tendering Establishes best practices
n. NZTA Procurement Manuals
NZTA Manual in conjunction with ICC Procurement Strategy informs how to procure and evaluate tenders
Establishes procurement process to gain best cost approach
o. Subdivisions NZS 4404:2010 Subdivisional standard read in conjunction with Council Bylaw
Sets standards for assets
3.3 LEVELS OF SERVICE 3.3.1 Alignment of Customer Levels of Service with Community Outcomes
The Roading Activity enhances our city and preserves its character through maintaining the average quality of ride on a sealed local road network, measured by smooth travel exposure, both urban and rural (DIA2), and maintaining the percentage of the sealed local road network which is resurfaced (DIA3). The Roading Activity monitors the total number of fatal and serious injuries each year on the network (DIA1). It also monitors unplanned road closures (ONRC1), the overall cost per km and vkt (vehicle kilometres travelled) of routine maintenance activities, and cost by work category on each road network for the financial year (ONRC2). The Roading Activity preserves the character of our city by ensuring vandalised signs (ICC1), traffic signal failures (ICC2) and requests for service (DIA5) are responded to in a timely manner. The Roading Activity also enhances our city and preserves its character through maintaining footpath conditions (DIA4) and street lighting (ICC1). The following table outlines how the Levels of Service align with the contribution of the activity to achieving the outcomes as described above. Table 3.5 Alignment between Customer Levels of Service and the Outcomes
MEASURE 2021-2031 TARGET The number of and change from the previous financial year in the number of fatalities and serious injury crashes on the local road network, expressed as a number (DIA 1 and ONRC 1)
Decreasing annually
Collective risk (crash density) – fatal and serious injury rate per km of road (ONRC 2)
Decreasing annually
Personal risk – average annual fatal and serious injury crashes per 100 million vehicle-kilometres (ONRC 3)
Decreasing annually
The average quality of ride, on a sealed local road network, measured by smooth travel exposure (DIA 2 and ONRC 5)
Higher than national average: Urban – 84.5% Rural – 95.1%
The percentage of the sealed local road network that is resurfaced (DIA 3)
> 6.25% (2019) ; > 5.5% (2021 )
The percentage of footpaths within the district that fall within the level of service, or service standard for the condition of footpaths as set out in the Asset Management Plan (DIA 4)
< 8% in very poor condition
The percentage of customer service requests relating to roads and footpaths, to which the territorial authority responds within the time frame specified in the Long Term Plan (DIA 5)
75% of requests are responded to in five or less business days
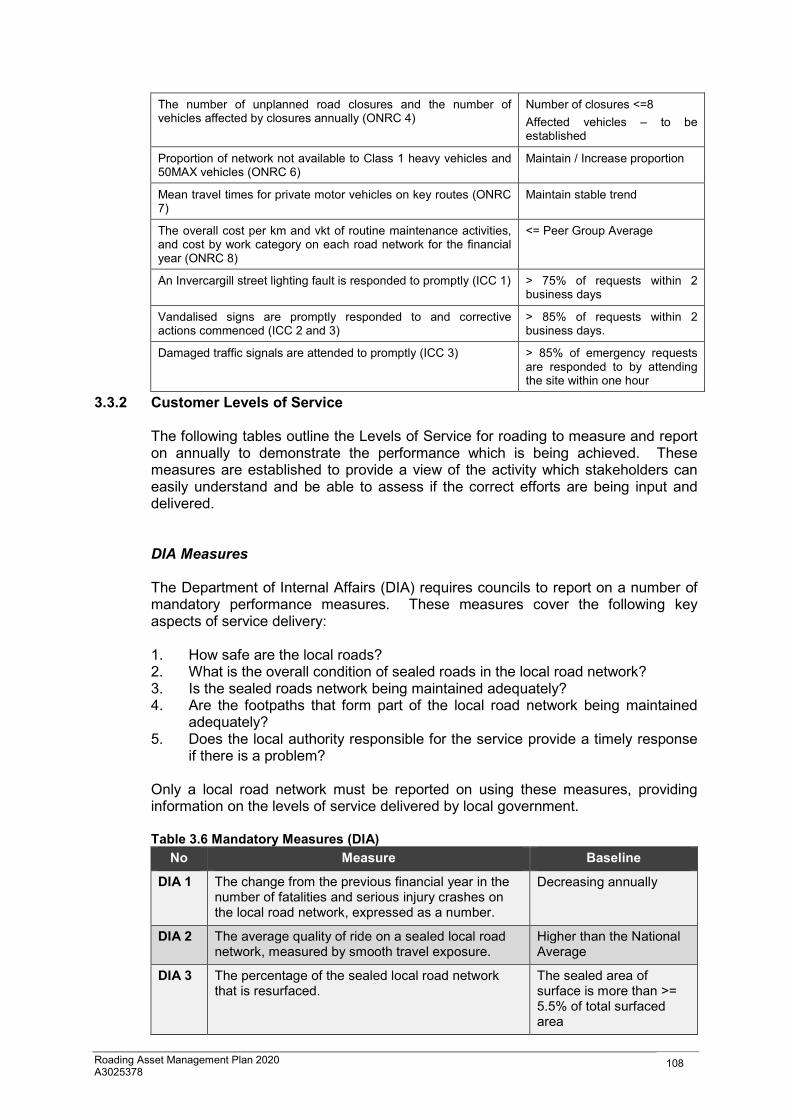
Roading Asset Management Plan 2020 A3025378
108
3.3.2 Customer Levels of Service
The following tables outline the Levels of Service for roading to measure and report on annually to demonstrate the performance which is being achieved. These measures are established to provide a view of the activity which stakeholders can easily understand and be able to assess if the correct efforts are being input and delivered.
DIA Measures
The Department of Internal Affairs (DIA) requires councils to report on a number of mandatory performance measures. These measures cover the following key aspects of service delivery: 1. How safe are the local roads? 2. What is the overall condition of sealed roads in the local road network? 3. Is the sealed roads network being maintained adequately? 4. Are the footpaths that form part of the local road network being maintained
adequately? 5. Does the local authority responsible for the service provide a timely response
if there is a problem?
Only a local road network must be reported on using these measures, providing information on the levels of service delivered by local government. Table 3.6 Mandatory Measures (DIA)
No Measure Baseline
DIA 1 The change from the previous financial year in the number of fatalities and serious injury crashes on the local road network, expressed as a number.
Decreasing annually
DIA 2 The average quality of ride on a sealed local road network, measured by smooth travel exposure.
Higher than the National Average
DIA 3 The percentage of the sealed local road network that is resurfaced.
The sealed area of surface is more than >= 5.5% of total surfaced area
The number of unplanned road closures and the number of vehicles affected by closures annually (ONRC 4)
Number of closures <=8 Affected vehicles – to be established
Proportion of network not available to Class 1 heavy vehicles and 50MAX vehicles (ONRC 6)
Maintain / Increase proportion
Mean travel times for private motor vehicles on key routes (ONRC 7)
Maintain stable trend
The overall cost per km and vkt of routine maintenance activities, and cost by work category on each road network for the financial year (ONRC 8)
<= Peer Group Average
An Invercargill street lighting fault is responded to promptly (ICC 1) > 75% of requests within 2 business days
Vandalised signs are promptly responded to and corrective actions commenced (ICC 2 and 3)
> 85% of requests within 2 business days.
Damaged traffic signals are attended to promptly (ICC 3) > 85% of emergency requests are responded to by attending the site within one hour
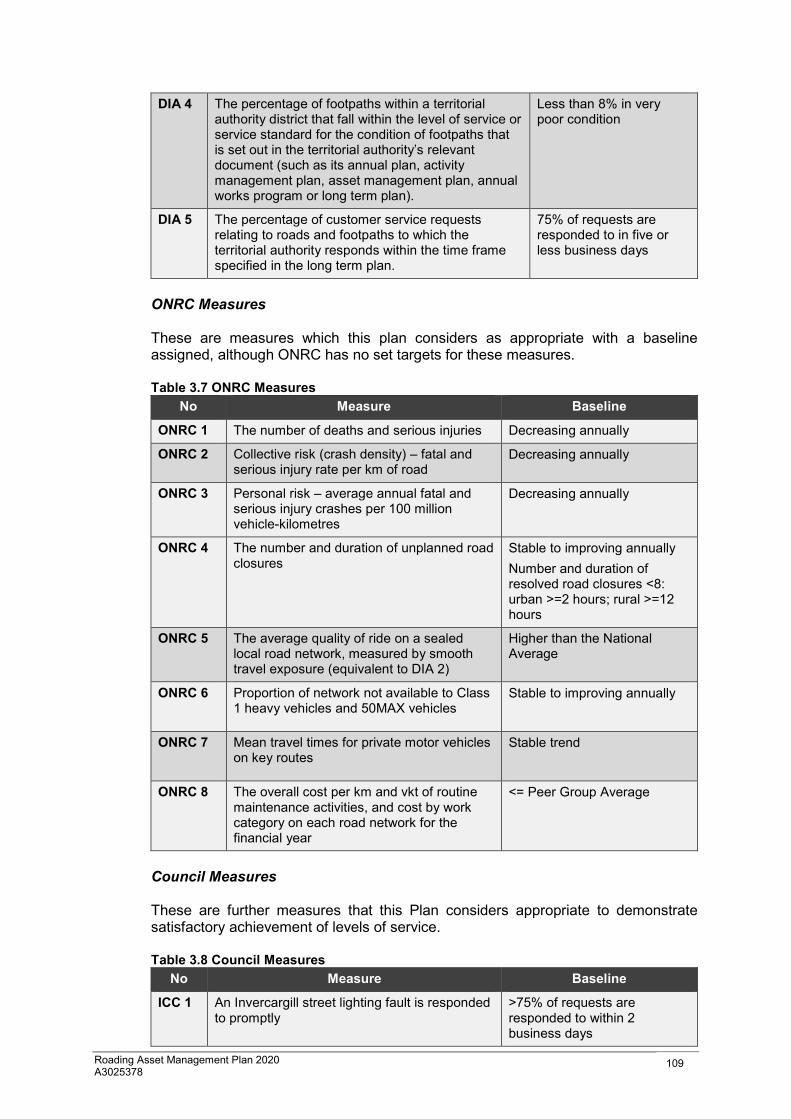
Roading Asset Management Plan 2020 A3025378
109
DIA 4 The percentage of footpaths within a territorial authority district that fall within the level of service or service standard for the condition of footpaths that is set out in the territorial authority’s relevant document (such as its annual plan, activity management plan, asset management plan, annual works program or long term plan).
Less than 8% in very poor condition
DIA 5 The percentage of customer service requests relating to roads and footpaths to which the territorial authority responds within the time frame specified in the long term plan.
75% of requests are responded to in five or less business days
ONRC Measures
These are measures which this plan considers as appropriate with a baseline assigned, although ONRC has no set targets for these measures. Table 3.7 ONRC Measures
No Measure Baseline
ONRC 1 The number of deaths and serious injuries Decreasing annually
ONRC 2 Collective risk (crash density) – fatal and serious injury rate per km of road
Decreasing annually
ONRC 3 Personal risk – average annual fatal and serious injury crashes per 100 million vehicle-kilometres
Decreasing annually
ONRC 4 The number and duration of unplanned road closures
Stable to improving annually Number and duration of resolved road closures <8: urban >=2 hours; rural >=12 hours
ONRC 5 The average quality of ride on a sealed local road network, measured by smooth travel exposure (equivalent to DIA 2)
Higher than the National Average
ONRC 6 Proportion of network not available to Class 1 heavy vehicles and 50MAX vehicles
Stable to improving annually
ONRC 7 Mean travel times for private motor vehicles on key routes
Stable trend
ONRC 8 The overall cost per km and vkt of routine maintenance activities, and cost by work category on each road network for the financial year
<= Peer Group Average
Council Measures
These are further measures that this Plan considers appropriate to demonstrate satisfactory achievement of levels of service. Table 3.8 Council Measures
No Measure Baseline
ICC 1 An Invercargill street lighting fault is responded to promptly
>75% of requests are responded to within 2 business days
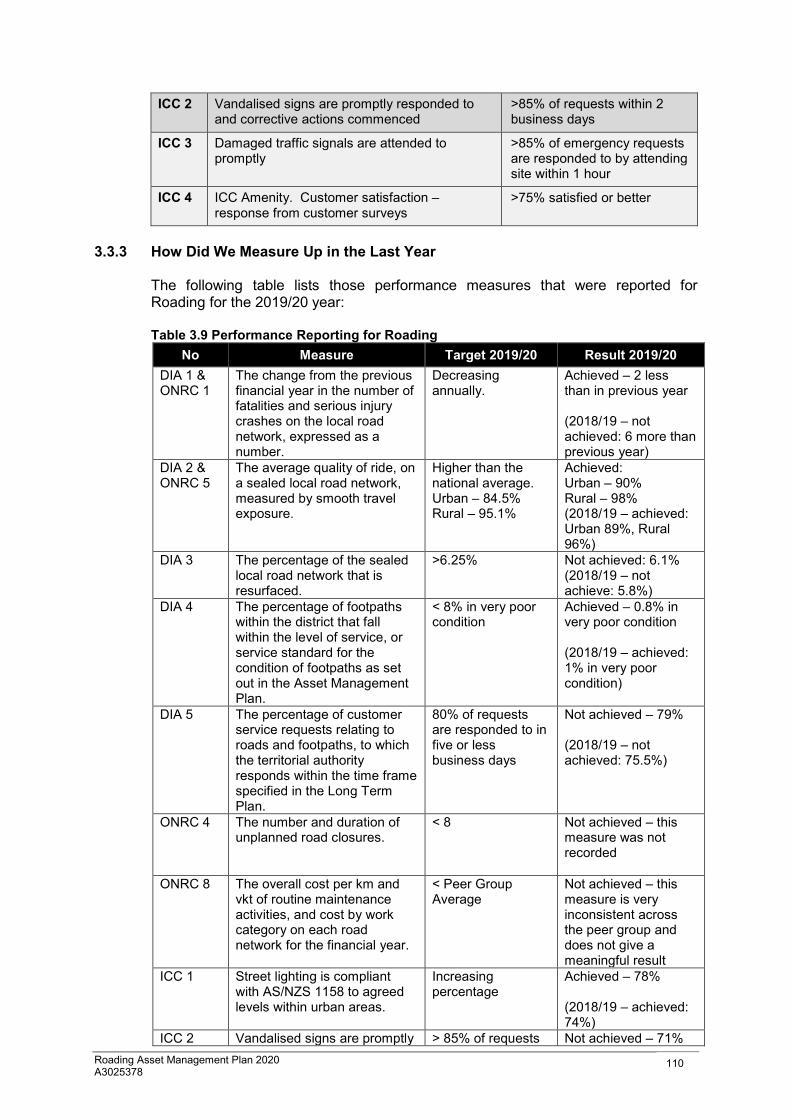
Roading Asset Management Plan 2020 A3025378
110
ICC 2 Vandalised signs are promptly responded to and corrective actions commenced
>85% of requests within 2 business days
ICC 3 Damaged traffic signals are attended to promptly
>85% of emergency requests are responded to by attending site within 1 hour
ICC 4 ICC Amenity. Customer satisfaction – response from customer surveys
>75% satisfied or better
3.3.3 How Did We Measure Up in the Last Year
The following table lists those performance measures that were reported for Roading for the 2019/20 year: Table 3.9 Performance Reporting for Roading
No Measure Target 2019/20 Result 2019/20 DIA 1 & ONRC 1
The change from the previous financial year in the number of fatalities and serious injury crashes on the local road network, expressed as a number.
Decreasing annually.
Achieved – 2 less than in previous year (2018/19 – not achieved: 6 more than previous year)
DIA 2 & ONRC 5
The average quality of ride, on a sealed local road network, measured by smooth travel exposure.
Higher than the national average. Urban – 84.5% Rural – 95.1%
Achieved: Urban – 90% Rural – 98% (2018/19 – achieved: Urban 89%, Rural 96%)
DIA 3 The percentage of the sealed local road network that is resurfaced.
>6.25% Not achieved: 6.1% (2018/19 – not achieve: 5.8%)
DIA 4 The percentage of footpaths within the district that fall within the level of service, or service standard for the condition of footpaths as set out in the Asset Management Plan.
< 8% in very poor condition
Achieved – 0.8% in very poor condition (2018/19 – achieved: 1% in very poor condition)
DIA 5 The percentage of customer service requests relating to roads and footpaths, to which the territorial authority responds within the time frame specified in the Long Term Plan.
80% of requests are responded to in five or less business days
Not achieved – 79% (2018/19 – not achieved: 75.5%)
ONRC 4 The number and duration of unplanned road closures.
< 8 Not achieved – this measure was not recorded
ONRC 8 The overall cost per km and vkt of routine maintenance activities, and cost by work category on each road network for the financial year.
< Peer Group Average
Not achieved – this measure is very inconsistent across the peer group and does not give a meaningful result
ICC 1 Street lighting is compliant with AS/NZS 1158 to agreed levels within urban areas.
Increasing percentage
Achieved – 78% (2018/19 – achieved: 74%)
ICC 2 Vandalised signs are promptly > 85% of requests Not achieved – 71%
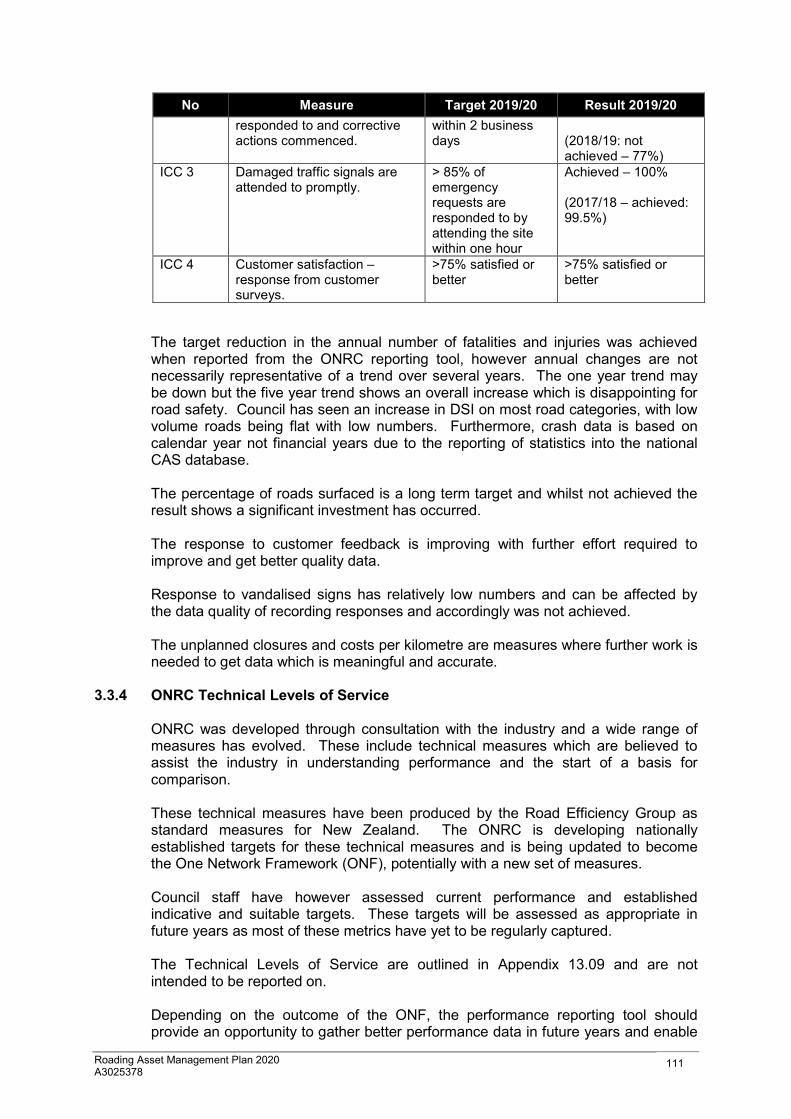
Roading Asset Management Plan 2020 A3025378
111
No Measure Target 2019/20 Result 2019/20 responded to and corrective actions commenced.
within 2 business days
(2018/19: not achieved – 77%)
ICC 3 Damaged traffic signals are attended to promptly.
> 85% of emergency requests are responded to by attending the site within one hour
Achieved – 100% (2017/18 – achieved: 99.5%)
ICC 4 Customer satisfaction – response from customer surveys.
>75% satisfied or better
>75% satisfied or better
The target reduction in the annual number of fatalities and injuries was achieved when reported from the ONRC reporting tool, however annual changes are not necessarily representative of a trend over several years. The one year trend may be down but the five year trend shows an overall increase which is disappointing for road safety. Council has seen an increase in DSI on most road categories, with low volume roads being flat with low numbers. Furthermore, crash data is based on calendar year not financial years due to the reporting of statistics into the national CAS database. The percentage of roads surfaced is a long term target and whilst not achieved the result shows a significant investment has occurred. The response to customer feedback is improving with further effort required to improve and get better quality data. Response to vandalised signs has relatively low numbers and can be affected by the data quality of recording responses and accordingly was not achieved. The unplanned closures and costs per kilometre are measures where further work is needed to get data which is meaningful and accurate.
3.3.4 ONRC Technical Levels of Service ONRC was developed through consultation with the industry and a wide range of measures has evolved. These include technical measures which are believed to assist the industry in understanding performance and the start of a basis for comparison. These technical measures have been produced by the Road Efficiency Group as standard measures for New Zealand. The ONRC is developing nationally established targets for these technical measures and is being updated to become the One Network Framework (ONF), potentially with a new set of measures. Council staff have however assessed current performance and established indicative and suitable targets. These targets will be assessed as appropriate in future years as most of these metrics have yet to be regularly captured. The Technical Levels of Service are outlined in Appendix 13.09 and are not intended to be reported on. Depending on the outcome of the ONF, the performance reporting tool should provide an opportunity to gather better performance data in future years and enable
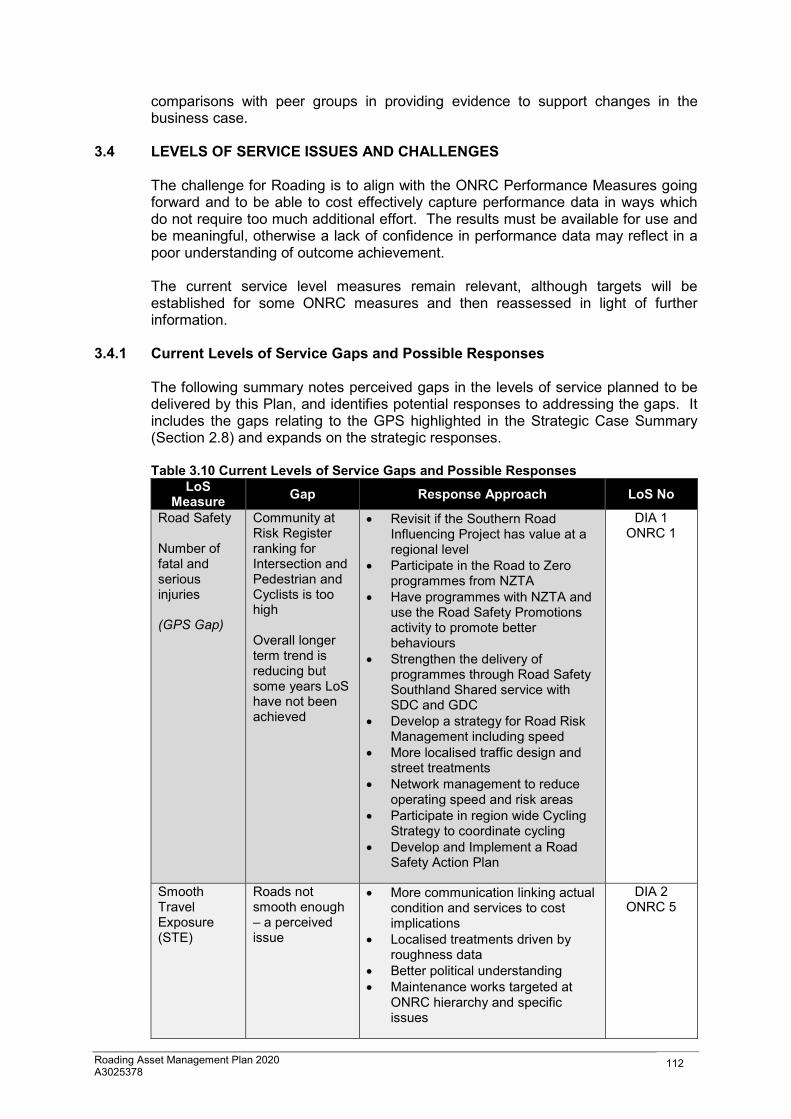
Roading Asset Management Plan 2020 A3025378
112
comparisons with peer groups in providing evidence to support changes in the business case.
3.4 LEVELS OF SERVICE ISSUES AND CHALLENGES
The challenge for Roading is to align with the ONRC Performance Measures going forward and to be able to cost effectively capture performance data in ways which do not require too much additional effort. The results must be available for use and be meaningful, otherwise a lack of confidence in performance data may reflect in a poor understanding of outcome achievement. The current service level measures remain relevant, although targets will be established for some ONRC measures and then reassessed in light of further information.
3.4.1 Current Levels of Service Gaps and Possible Responses
The following summary notes perceived gaps in the levels of service planned to be delivered by this Plan, and identifies potential responses to addressing the gaps. It includes the gaps relating to the GPS highlighted in the Strategic Case Summary (Section 2.8) and expands on the strategic responses. Table 3.10 Current Levels of Service Gaps and Possible Responses
LoS Measure Gap Response Approach LoS No
Road Safety Number of fatal and serious injuries (GPS Gap)
Community at Risk Register ranking for Intersection and Pedestrian and Cyclists is too high Overall longer term trend is reducing but some years LoS have not been achieved
• Revisit if the Southern Road Influencing Project has value at a regional level
• Participate in the Road to Zero programmes from NZTA
• Have programmes with NZTA and use the Road Safety Promotions activity to promote better behaviours
• Strengthen the delivery of programmes through Road Safety Southland Shared service with SDC and GDC
• Develop a strategy for Road Risk Management including speed
• More localised traffic design and street treatments
• Network management to reduce operating speed and risk areas
• Participate in region wide Cycling Strategy to coordinate cycling
• Develop and Implement a Road Safety Action Plan
DIA 1 ONRC 1
Smooth Travel Exposure (STE)
Roads not smooth enough – a perceived issue
• More communication linking actual condition and services to cost implications
• Localised treatments driven by roughness data
• Better political understanding • Maintenance works targeted at
ONRC hierarchy and specific issues
DIA 2 ONRC 5
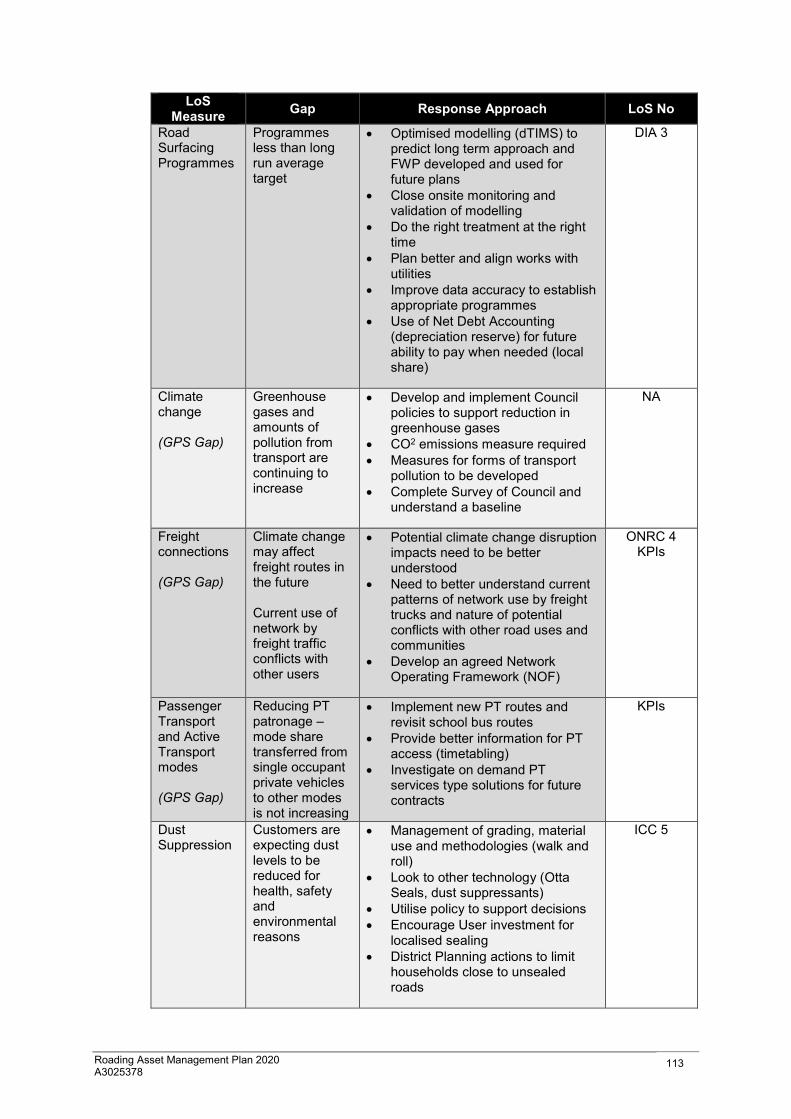
Roading Asset Management Plan 2020 A3025378
113
LoS Measure Gap Response Approach LoS No
Road Surfacing Programmes
Programmes less than long run average target
• Optimised modelling (dTIMS) to predict long term approach and FWP developed and used for future plans
• Close onsite monitoring and validation of modelling
• Do the right treatment at the right time
• Plan better and align works with utilities
• Improve data accuracy to establish appropriate programmes
• Use of Net Debt Accounting (depreciation reserve) for future ability to pay when needed (local share)
DIA 3
Climate change (GPS Gap)
Greenhouse gases and amounts of pollution from transport are continuing to increase
• Develop and implement Council policies to support reduction in greenhouse gases
• CO2 emissions measure required • Measures for forms of transport
pollution to be developed • Complete Survey of Council and
understand a baseline
NA
Freight connections (GPS Gap)
Climate change may affect freight routes in the future Current use of network by freight traffic conflicts with other users
• Potential climate change disruption impacts need to be better understood
• Need to better understand current patterns of network use by freight trucks and nature of potential conflicts with other road uses and communities
• Develop an agreed Network Operating Framework (NOF)
ONRC 4 KPIs
Passenger Transport and Active Transport modes (GPS Gap)
Reducing PT patronage – mode share transferred from single occupant private vehicles to other modes is not increasing
• Implement new PT routes and revisit school bus routes
• Provide better information for PT access (timetabling)
• Investigate on demand PT services type solutions for future contracts
KPIs
Dust Suppression
Customers are expecting dust levels to be reduced for health, safety and environmental reasons
• Management of grading, material use and methodologies (walk and roll)
• Look to other technology (Otta Seals, dust suppressants)
• Utilise policy to support decisions • Encourage User investment for
localised sealing • District Planning actions to limit
households close to unsealed roads
ICC 5
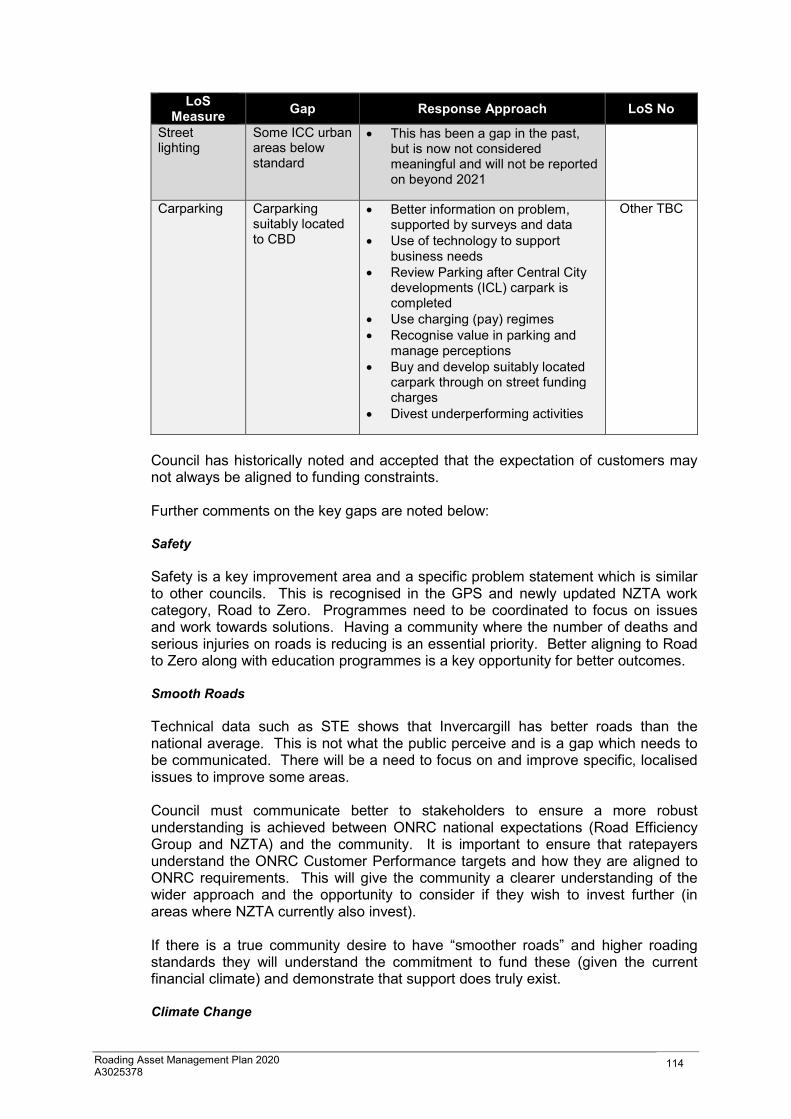
Roading Asset Management Plan 2020 A3025378
114
LoS Measure Gap Response Approach LoS No
Street lighting
Some ICC urban areas below standard
• This has been a gap in the past, but is now not considered meaningful and will not be reported on beyond 2021
Carparking Carparking suitably located to CBD
• Better information on problem, supported by surveys and data
• Use of technology to support business needs
• Review Parking after Central City developments (ICL) carpark is completed
• Use charging (pay) regimes • Recognise value in parking and
manage perceptions • Buy and develop suitably located
carpark through on street funding charges
• Divest underperforming activities
Other TBC
Council has historically noted and accepted that the expectation of customers may not always be aligned to funding constraints. Further comments on the key gaps are noted below:
Safety Safety is a key improvement area and a specific problem statement which is similar to other councils. This is recognised in the GPS and newly updated NZTA work category, Road to Zero. Programmes need to be coordinated to focus on issues and work towards solutions. Having a community where the number of deaths and serious injuries on roads is reducing is an essential priority. Better aligning to Road to Zero along with education programmes is a key opportunity for better outcomes.
Smooth Roads Technical data such as STE shows that Invercargill has better roads than the national average. This is not what the public perceive and is a gap which needs to be communicated. There will be a need to focus on and improve specific, localised issues to improve some areas. Council must communicate better to stakeholders to ensure a more robust understanding is achieved between ONRC national expectations (Road Efficiency Group and NZTA) and the community. It is important to ensure that ratepayers understand the ONRC Customer Performance targets and how they are aligned to ONRC requirements. This will give the community a clearer understanding of the wider approach and the opportunity to consider if they wish to invest further (in areas where NZTA currently also invest). If there is a true community desire to have “smoother roads” and higher roading standards they will understand the commitment to fund these (given the current financial climate) and demonstrate that support does truly exist.
Climate Change
Roading Asset Management Plan 2020 A3025378
115
Council has a need to develop a position on climate change and environmental sustainability relevant and appropriate to the community aspirations and abilities to deliver these outcomes. Relevant projects are currently managed on a project by project basis.
Seal Extensions and Dust Seal extensions have previously been an improvement area but due to funding criteria (e.g. FAR) and other budget pressures, no allocation is available for extensions unless fully funded by Council. Council has not signalled any desire to have these included in the programme but encourages direct investment by local users. Council has historically decided not to fund seal extensions and reduce dust impacts. It does however allow dust suppressants to be used where the suppressant is approved by Environment Southland. It should be noted that: • Reliability of products is variable and is affected by weather • No budget allocated to assist with direct costs of dust suppressants
Network Planning and Asset Management Further investigation in network operational planning is considered to be needed for Invercargill to refocus on how the freight demand can be better managed and aligned with opportunities within the State Highway network. Recent work on the Network Operating Framework may lead to future projects where additional bypasses are considered and implemented.
3.4.2 Level of Service Target Trends
Table 3.11 summarises proposed targets for the customer levels of service reported in this Plan. Key Messages – Levels of Service
• Safety levels of service need to be improved.
• Value for money is largely being achieved.
• Improvements are needed in relation to resilience and climate change.
• Better or new measures are needed in some areas, such as heavy vehicles, contribution to the economy and multi-modal accessibility.
• Better linking is needed to technical levels of service at an asset class level.
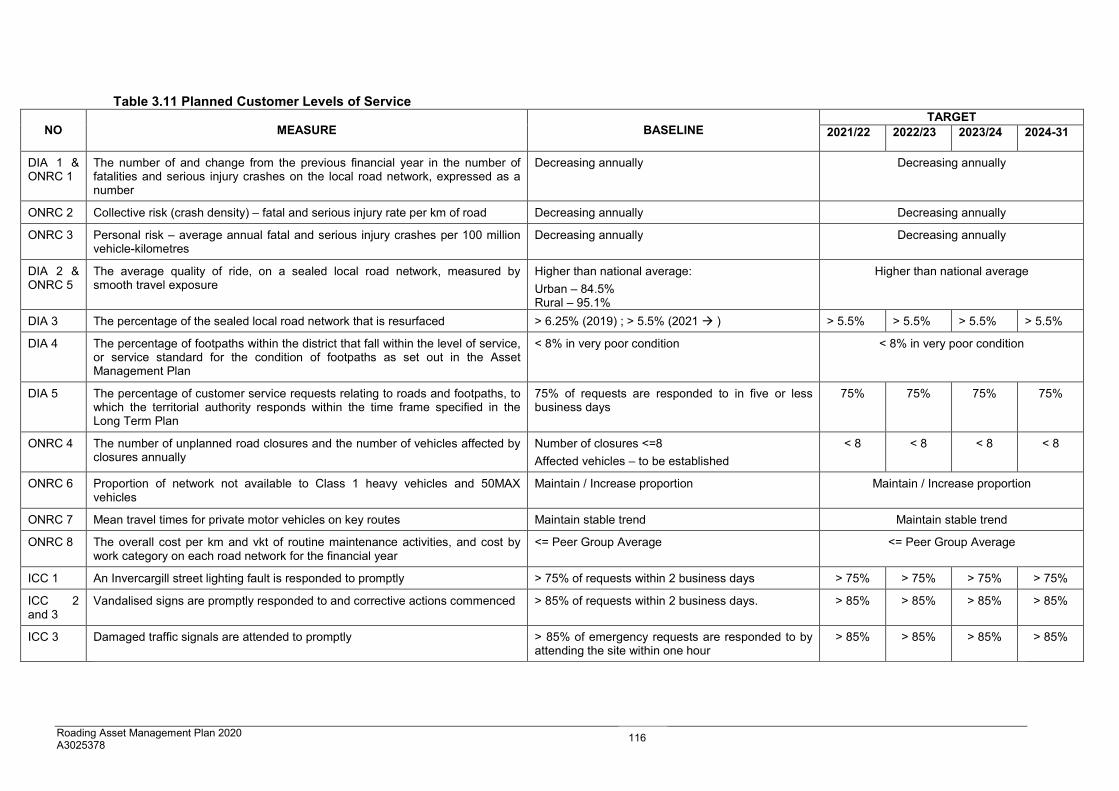
Roading Asset Management Plan 2020 A3025378 116
Table 3.11 Planned Customer Levels of Service
NO
MEASURE BASELINE TARGET
2021/22 2022/23 2023/24 2024-31
DIA 1 & ONRC 1
The number of and change from the previous financial year in the number of fatalities and serious injury crashes on the local road network, expressed as a number
Decreasing annually Decreasing annually
ONRC 2 Collective risk (crash density) – fatal and serious injury rate per km of road Decreasing annually Decreasing annually
ONRC 3 Personal risk – average annual fatal and serious injury crashes per 100 million vehicle-kilometres
Decreasing annually Decreasing annually
DIA 2 & ONRC 5
The average quality of ride, on a sealed local road network, measured by smooth travel exposure
Higher than national average: Urban – 84.5% Rural – 95.1%
Higher than national average
DIA 3 The percentage of the sealed local road network that is resurfaced > 6.25% (2019) ; > 5.5% (2021 ) > 5.5% > 5.5% > 5.5% > 5.5%
DIA 4 The percentage of footpaths within the district that fall within the level of service, or service standard for the condition of footpaths as set out in the Asset Management Plan
< 8% in very poor condition < 8% in very poor condition
DIA 5 The percentage of customer service requests relating to roads and footpaths, to which the territorial authority responds within the time frame specified in the Long Term Plan
75% of requests are responded to in five or less business days
75% 75% 75% 75%
ONRC 4 The number of unplanned road closures and the number of vehicles affected by closures annually
Number of closures <=8 Affected vehicles – to be established
< 8 < 8 < 8 < 8
ONRC 6 Proportion of network not available to Class 1 heavy vehicles and 50MAX vehicles
Maintain / Increase proportion Maintain / Increase proportion
ONRC 7 Mean travel times for private motor vehicles on key routes Maintain stable trend Maintain stable trend
ONRC 8 The overall cost per km and vkt of routine maintenance activities, and cost by work category on each road network for the financial year
<= Peer Group Average <= Peer Group Average
ICC 1 An Invercargill street lighting fault is responded to promptly > 75% of requests within 2 business days > 75% > 75% > 75% > 75%
ICC 2 and 3
Vandalised signs are promptly responded to and corrective actions commenced > 85% of requests within 2 business days. > 85% > 85% > 85% > 85%
ICC 3 Damaged traffic signals are attended to promptly > 85% of emergency requests are responded to by attending the site within one hour
> 85% > 85% > 85% > 85%
Roading Asset Management Plan 2020 A3025378 117
4. Demand for Our Services
4.1 DEMAND FORECAST
Council has developed a number of key assumptions for the Long Term Plan in setting strategic direction; these were listed in Section 2.9.
[[ 4.1.1 Factors Influencing Demand
This Asset Plan is based on a number of these assumptions which are seen to impact demand on Roading as follows: Table 4.1 Factors Influencing Demand
Demand Driver What’s happening in the City What does it mean for Transport?
Population The population assumption is that it will remain static at 55,300 increasing to 56,300 by 2031.
Sufficient network capability exists. Safety needs to be a priority.
Ageing Population
The assumption is those 65 years and older will make up over 23% of Invercargill’s population by 2031.
Priority changes for access, safety and mobility needs. Fixed incomes will affect the ability to pay.
Technology
Changes in technology will affect how Council carries out its activities.
Changes in demand for services, parking and access will change.
Customer Expectations
Increase in customer expectations of the services provided.
Unsealed road customers seeking methods to improve their service. More pressure on provided levels of service which are NZTA funded. Other funding sources may be needed.
Economic – Land Use
Changing land use is requiring different access to areas. Freight movements are changing and seeking different routes. School growth is occurring in some locations.
Use of the ONRC routes to prioritise network use for particularly heavy vehicles. Parking and other mode access around schools needs to be reviewed and changed.
Environmental Increasing awareness to carefully manage stormwater runoff. Growing longer term consideration for sea level rise and impacts of natural disasters.
Disposal of stormwater more expensive and difficult. Potential treatment considerations. Inputs into future designs required. Consideration of the impacts of climate change and disaster events on the network.
Tourism and Visitor Numbers
Covid 19 has changed the visitor market and this will take some time to recover.
Review parking and services provided.
Active Transport There is a growing expectation that more travel will be by walking and cycling.
Greater need to promote and support activities which encourage active transport modes. Consideration of more connections to cycleways and investment where safety issues create unacceptable risk.
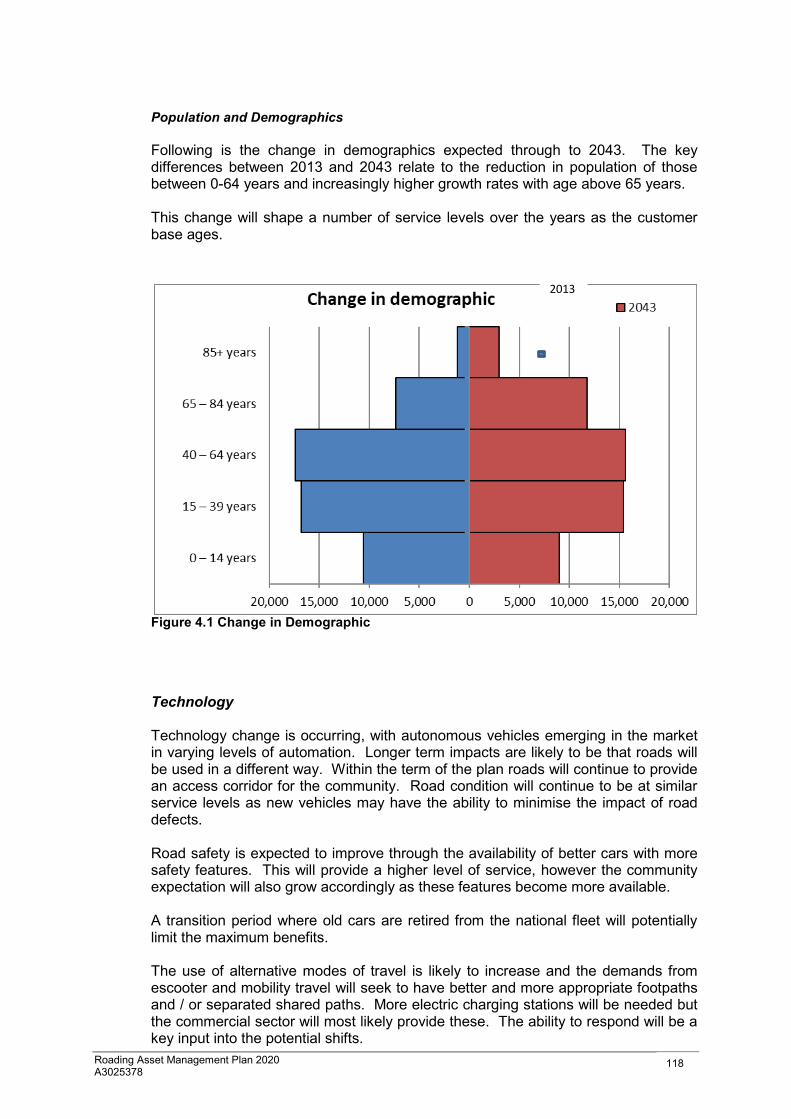
Roading Asset Management Plan 2020 A3025378
118
Population and Demographics
Following is the change in demographics expected through to 2043. The key differences between 2013 and 2043 relate to the reduction in population of those between 0-64 years and increasingly higher growth rates with age above 65 years. This change will shape a number of service levels over the years as the customer base ages.
Figure 4.1 Change in Demographic
Technology Technology change is occurring, with autonomous vehicles emerging in the market in varying levels of automation. Longer term impacts are likely to be that roads will be used in a different way. Within the term of the plan roads will continue to provide an access corridor for the community. Road condition will continue to be at similar service levels as new vehicles may have the ability to minimise the impact of road defects. Road safety is expected to improve through the availability of better cars with more safety features. This will provide a higher level of service, however the community expectation will also grow accordingly as these features become more available. A transition period where old cars are retired from the national fleet will potentially limit the maximum benefits. The use of alternative modes of travel is likely to increase and the demands from escooter and mobility travel will seek to have better and more appropriate footpaths and / or separated shared paths. More electric charging stations will be needed but the commercial sector will most likely provide these. The ability to respond will be a key input into the potential shifts.
2013
Roading Asset Management Plan 2020 A3025378
119
Economic and Land Use Trends
While the City’s economy is relatively stable post Covid19, the growth in population and demographic change leading to smaller household sizes will result in the development of new residential subdivisions and extension to the road network. New developments do however present the opportunity to improve local accessibility and safety. There are no significant changes in rural or urban land-use within the City that could affect demand on the assets. Changing land use also may place pressure for changes to levels of service for unsealed roads.
Heavy Vehicle Trends Changing economic patterns within the wider Southland and Otago regions, particularly relating to agriculture, forestry and dairying, means more heavy vehicle use of connecting roads through the City, for example to the Port, Airport, and other significant industrial destinations within the City and region. Changes to allow larger and heavier vehicles (HPMVs) on roads throughout the country will have longer term implications for pavement and bridge assets.
Environmental Climate change, resilience and natural hazard risk and wider sustainability issues are addressed in Section 6. Further to the potential implications of such risks, increasing pressures to improve the quality of stormwater discharges from road surfaces, energy use and the use of bituminous products will all have an effect on how the assets are maintained in the future.
Tourism Tourism was growing to be a significant industry within the wider Southland region, however Covid 19 has slowed this significantly and its return to previous levels may be some time away. Visitor numbers may not now grow, and with local events such as the Burt Munro Cycle Racing and Oyster Festival, there may not be an increased expectation for more facilities such as rest areas, campervan discharge points, as well as information signage. Increased self-drive tourism means more drivers using the road network who may be unfamiliar with local driving conditions or requirements.
4.1.2 Projected Growth or Decline in Demand for the Service
The roading activity is not expecting any significant growth in demand for additional capacity on the network. Invercargill has well-formed wide transport corridors and has been able to closely match the ONRC classifications with the available roading network. Cycle networks are being successfully integrated within the existing road space available and are again well integrated with on and off-road connections. However, cycleways lack connectivity with State Highway roads. Further investment to complete and connect cycleways is required.
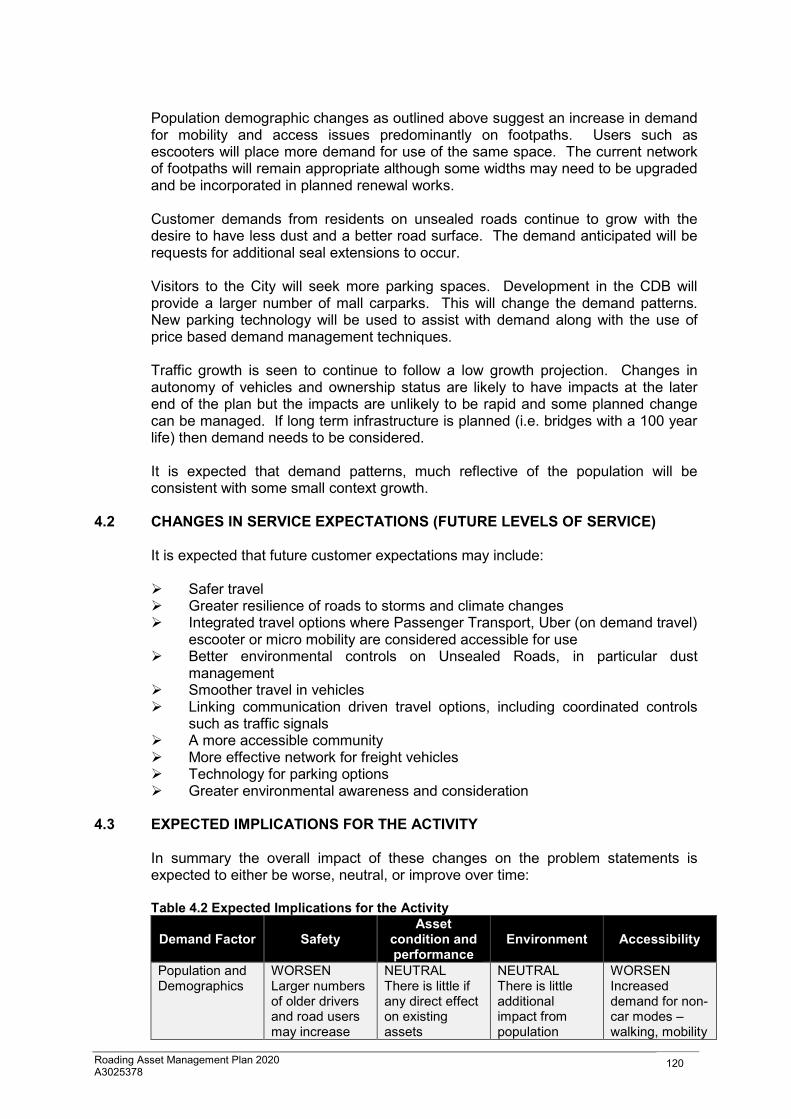
Roading Asset Management Plan 2020 A3025378
120
Population demographic changes as outlined above suggest an increase in demand for mobility and access issues predominantly on footpaths. Users such as escooters will place more demand for use of the same space. The current network of footpaths will remain appropriate although some widths may need to be upgraded and be incorporated in planned renewal works. Customer demands from residents on unsealed roads continue to grow with the desire to have less dust and a better road surface. The demand anticipated will be requests for additional seal extensions to occur. Visitors to the City will seek more parking spaces. Development in the CDB will provide a larger number of mall carparks. This will change the demand patterns. New parking technology will be used to assist with demand along with the use of price based demand management techniques. Traffic growth is seen to continue to follow a low growth projection. Changes in autonomy of vehicles and ownership status are likely to have impacts at the later end of the plan but the impacts are unlikely to be rapid and some planned change can be managed. If long term infrastructure is planned (i.e. bridges with a 100 year life) then demand needs to be considered. It is expected that demand patterns, much reflective of the population will be consistent with some small context growth.
4.2 CHANGES IN SERVICE EXPECTATIONS (FUTURE LEVELS OF SERVICE)
It is expected that future customer expectations may include: Safer travel Greater resilience of roads to storms and climate changes Integrated travel options where Passenger Transport, Uber (on demand travel)
escooter or micro mobility are considered accessible for use Better environmental controls on Unsealed Roads, in particular dust
management Smoother travel in vehicles Linking communication driven travel options, including coordinated controls
such as traffic signals A more accessible community More effective network for freight vehicles Technology for parking options Greater environmental awareness and consideration
4.3 EXPECTED IMPLICATIONS FOR THE ACTIVITY
In summary the overall impact of these changes on the problem statements is expected to either be worse, neutral, or improve over time: Table 4.2 Expected Implications for the Activity
Demand Factor Safety Asset
condition and performance
Environment Accessibility
Population and Demographics
WORSEN Larger numbers of older drivers and road users may increase
NEUTRAL There is little if any direct effect on existing assets
NEUTRAL There is little additional impact from population
WORSEN Increased demand for non-car modes – walking, mobility
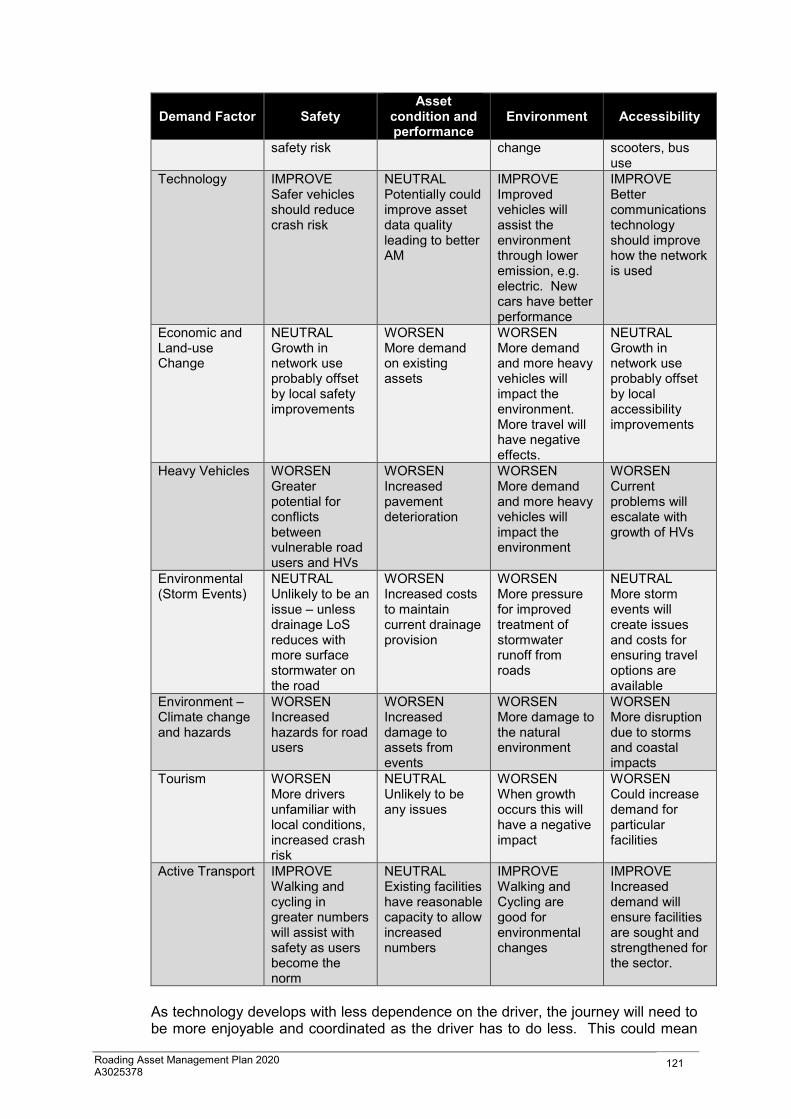
Roading Asset Management Plan 2020 A3025378
121
Demand Factor Safety Asset
condition and performance
Environment Accessibility
safety risk change scooters, bus use
Technology IMPROVE Safer vehicles should reduce crash risk
NEUTRAL Potentially could improve asset data quality leading to better AM
IMPROVE Improved vehicles will assist the environment through lower emission, e.g. electric. New cars have better performance
IMPROVE Better communications technology should improve how the network is used
Economic and Land-use Change
NEUTRAL Growth in network use probably offset by local safety improvements
WORSEN More demand on existing assets
WORSEN More demand and more heavy vehicles will impact the environment. More travel will have negative effects.
NEUTRAL Growth in network use probably offset by local accessibility improvements
Heavy Vehicles WORSEN Greater potential for conflicts between vulnerable road users and HVs
WORSEN Increased pavement deterioration
WORSEN More demand and more heavy vehicles will impact the environment
WORSEN Current problems will escalate with growth of HVs
Environmental (Storm Events)
NEUTRAL Unlikely to be an issue – unless drainage LoS reduces with more surface stormwater on the road
WORSEN Increased costs to maintain current drainage provision
WORSEN More pressure for improved treatment of stormwater runoff from roads
NEUTRAL More storm events will create issues and costs for ensuring travel options are available
Environment – Climate change and hazards
WORSEN Increased hazards for road users
WORSEN Increased damage to assets from events
WORSEN More damage to the natural environment
WORSEN More disruption due to storms and coastal impacts
Tourism WORSEN More drivers unfamiliar with local conditions, increased crash risk
NEUTRAL Unlikely to be any issues
WORSEN When growth occurs this will have a negative impact
WORSEN Could increase demand for particular facilities
Active Transport IMPROVE Walking and cycling in greater numbers will assist with safety as users become the norm
NEUTRAL Existing facilities have reasonable capacity to allow increased numbers
IMPROVE Walking and Cycling are good for environmental changes
IMPROVE Increased demand will ensure facilities are sought and strengthened for the sector.
As technology develops with less dependence on the driver, the journey will need to be more enjoyable and coordinated as the driver has to do less. This could mean
Roading Asset Management Plan 2020 A3025378
122
that the surfacing of roads will need to be smoother and delays through roadworks minimised. There will be a need to coordinate traffic equipment with on-board car technology to deliver safe travel and time reliability, identify and pay for parking and provide the best journey. The total number of cars may decrease. Controls for streetlights will likely be coordinated to maximise safety and be either dormant or dimmed when not needed for pedestrians or cars, thereby saving power and costs and pressures on the environment. Heavier vehicles, linked by technology, are likely to create pressures on pavements as the freight load increases. Road dimensions and maintenance demands may change as better optimisation of lane usage is achieved by technology. Where people live and where they want to travel to and by which means will change the activity. If less air travel is considered desirable, then road travel may increase. Responses to these implications are described in Section 4.4.
4.4 FUTURE DEMAND ISSUES AND CHALLENGES
Future demand is not expected to place significant extra traffic volumes on the network as the population profile is relatively static. The road space will still need to be used for access and it may be that cars look different, but the space will still be required. Traffic congestion in Invercargill is not likely. However, increased heavy traffic loads will need to be managed, including the growing use of HPMVs which will need to be focused on the appropriate ONRC road hierarchy where pavements are strengthened and surfacing maintained to cope with them. This could include the need for restrictions on HPMV vehicles, particularly for load restricted bridges but potentially also on roads with lower strength pavements. Car technology is evolving rapidly with autonomous vehicles, including many safety features such as lane divergence sensing and other changes being developed and likely to be delivered during the full scope of the Plan. This technology may change how roads are managed, operated and funded. The need for accessibility will grow and choices people make to travel are likely to be different as greater environmental and resilience issues become stronger in the community. A changing acceptance and less reliance on cars is occurring which will lead to other micro mobility options being considered. A challenge to manage in rural areas will be the dust issue from unsealed roads and how the health aspects are understood by customers. A draft policy is included in the appendices to assist with prioritising options but no funding is allocated. Environmental and resilience issues with increased stormwater runoff from roads are likely to be a more important aspect to manage in the future. The options to better manage the more frequent storm events is required.
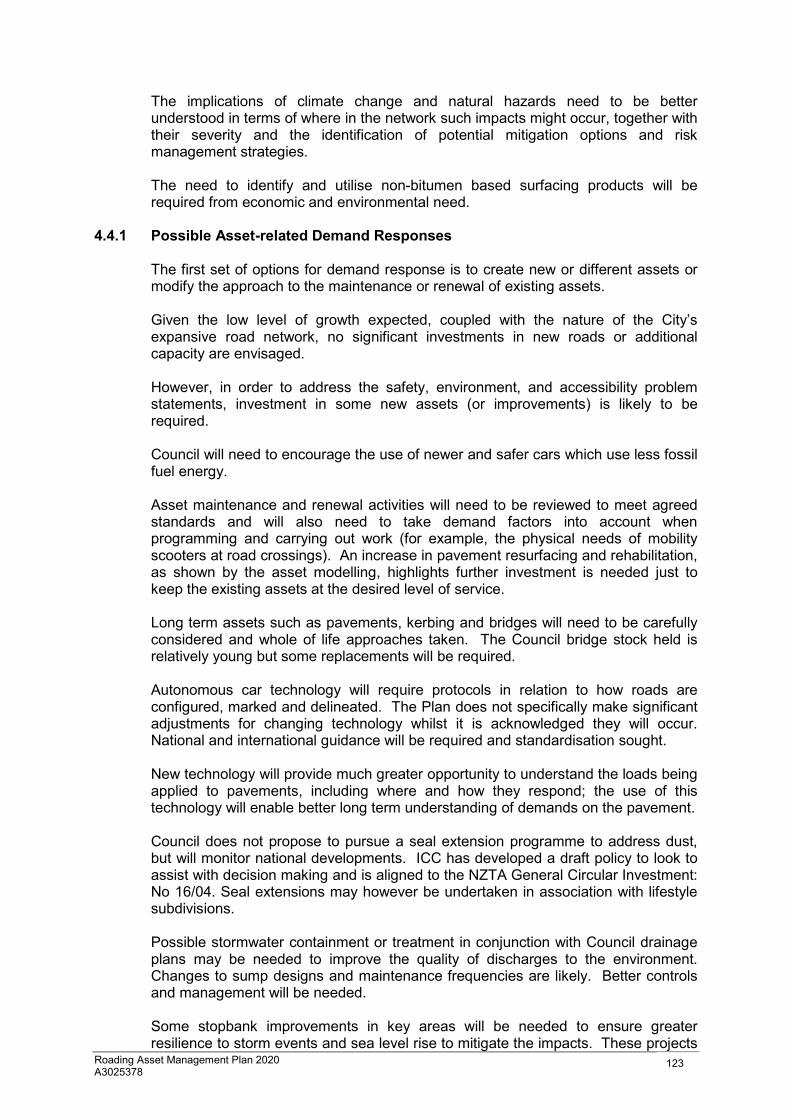
Roading Asset Management Plan 2020 A3025378
123
The implications of climate change and natural hazards need to be better understood in terms of where in the network such impacts might occur, together with their severity and the identification of potential mitigation options and risk management strategies. The need to identify and utilise non-bitumen based surfacing products will be required from economic and environmental need.
4.4.1 Possible Asset-related Demand Responses
The first set of options for demand response is to create new or different assets or modify the approach to the maintenance or renewal of existing assets. Given the low level of growth expected, coupled with the nature of the City’s expansive road network, no significant investments in new roads or additional capacity are envisaged. However, in order to address the safety, environment, and accessibility problem statements, investment in some new assets (or improvements) is likely to be required. Council will need to encourage the use of newer and safer cars which use less fossil fuel energy. Asset maintenance and renewal activities will need to be reviewed to meet agreed standards and will also need to take demand factors into account when programming and carrying out work (for example, the physical needs of mobility scooters at road crossings). An increase in pavement resurfacing and rehabilitation, as shown by the asset modelling, highlights further investment is needed just to keep the existing assets at the desired level of service. Long term assets such as pavements, kerbing and bridges will need to be carefully considered and whole of life approaches taken. The Council bridge stock held is relatively young but some replacements will be required. Autonomous car technology will require protocols in relation to how roads are configured, marked and delineated. The Plan does not specifically make significant adjustments for changing technology whilst it is acknowledged they will occur. National and international guidance will be required and standardisation sought. New technology will provide much greater opportunity to understand the loads being applied to pavements, including where and how they respond; the use of this technology will enable better long term understanding of demands on the pavement. Council does not propose to pursue a seal extension programme to address dust, but will monitor national developments. ICC has developed a draft policy to look to assist with decision making and is aligned to the NZTA General Circular Investment: No 16/04. Seal extensions may however be undertaken in association with lifestyle subdivisions. Possible stormwater containment or treatment in conjunction with Council drainage plans may be needed to improve the quality of discharges to the environment. Changes to sump designs and maintenance frequencies are likely. Better controls and management will be needed. Some stopbank improvements in key areas will be needed to ensure greater resilience to storm events and sea level rise to mitigate the impacts. These projects
Roading Asset Management Plan 2020 A3025378
124
are being financially assisted by Government (Shovel Ready) and aligning road works with these projects is required and will need the support of Waka Kotahi NZ Transport Agency funding to ensure both local and central government aspirations can be achieved.
4.4.2 Non-Asset Solutions
The second set of options relates to actions which change the way assets are used. Usually labelled “demand management”, activities such as encouraging less car journeys or modal shift will be appropriate in reducing the need for investment in roads. The community is seeking to have more access to active mode options including PT (and / or on demand services). These will be key elements in delivering any solutions. Many of the responses to future demand are likely to be non-asset solutions. Some will be in vehicles as they are manufactured. Others will be educational and behaviour changes including a shift to active transport modes such as walking or cycling to work and school. This shift in transport demand, whilst not in assets will require appropriate investment in suitable training and education resources and programmes to complement asset solutions. Many of the problem statements on safety will look to non-asset solutions.
4.4.3 Managing Expectations
A third option for responding to demand is to influence customer expectations, effectively reducing the demand. These may include: Engagement and communication programmes to reduce the level of
community expectation for smooth roads. Long term asset investment is required to keep assets operating at the
standard required and this investment does vary over time. Change planning rules and communication (at resource consenting) to reduce
the expectation of rural lifestyle residents for the same level of amenity as provided on residential streets.
Making sure drivers understand active transport and how this interlinks into the demand approach and accept that part of the road corridor is allocated for their use.
Ensuring Passenger Transport and Total Mobility are accepted as key options for travel and they continue to be supported by the community. Travel for those who are unable or cannot afford cars is key to ensuing access for everyone in the community to business, school or community life.
Gaining awareness of and acceptance that dust on low volume unsealed roads will remain and that Council does not plan to invest in this improvement.
4.4.4 Key Messages – Demand
Key Messages
• Growth is not an issue in relation to road capacity.
Roading Asset Management Plan 2020 A3025378
125
• Increasing customer expectations will continue.
• Need to examine freight movements and corridors.
• More investment to meet growth in active transport and other modes is anticipated.
• Rising stormwater quality expectations.
• Covid-19 has slowed demand in areas such as tourism.
• Climate change and natural hazards are becoming more pressing
• Council is not planning to invest in seal extensions to reduce the dust impact on unsealed roads.
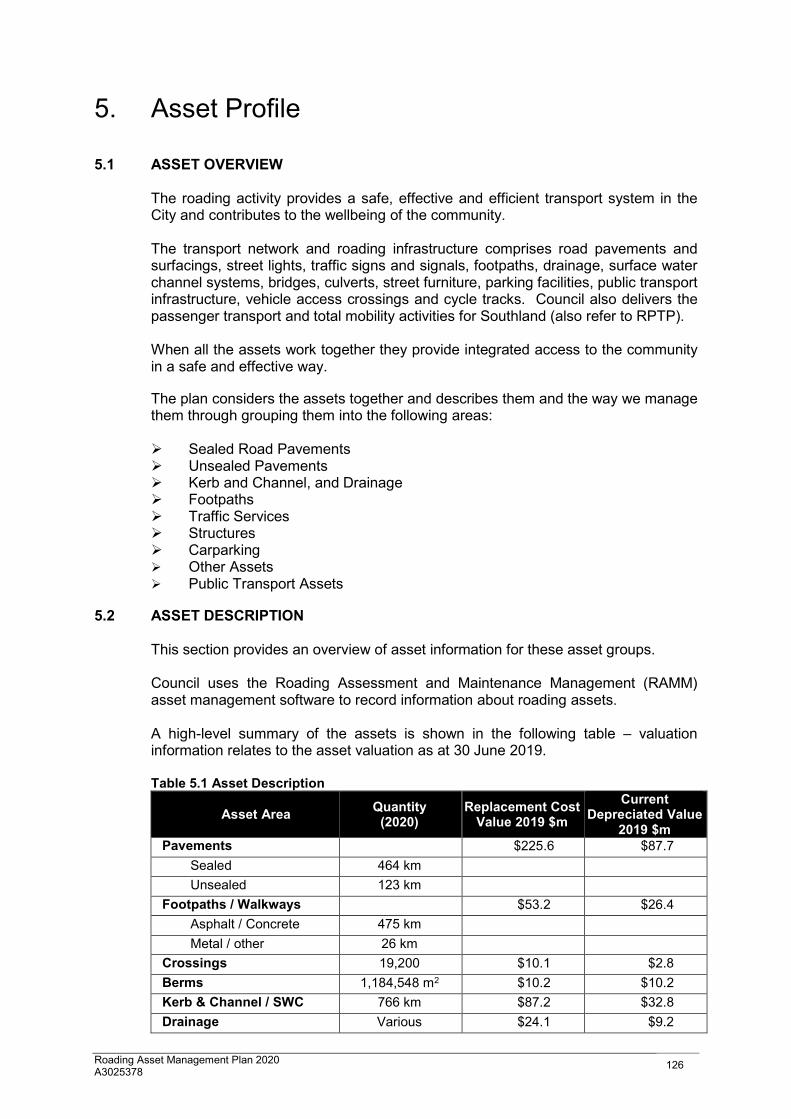
Roading Asset Management Plan 2020 A3025378 126
5. Asset Profile 5.1 ASSET OVERVIEW
The roading activity provides a safe, effective and efficient transport system in the City and contributes to the wellbeing of the community. The transport network and roading infrastructure comprises road pavements and surfacings, street lights, traffic signs and signals, footpaths, drainage, surface water channel systems, bridges, culverts, street furniture, parking facilities, public transport infrastructure, vehicle access crossings and cycle tracks. Council also delivers the passenger transport and total mobility activities for Southland (also refer to RPTP). When all the assets work together they provide integrated access to the community in a safe and effective way.
The plan considers the assets together and describes them and the way we manage them through grouping them into the following areas: Sealed Road Pavements Unsealed Pavements Kerb and Channel, and Drainage Footpaths Traffic Services Structures Carparking Other Assets Public Transport Assets
5.2 ASSET DESCRIPTION
This section provides an overview of asset information for these asset groups. Council uses the Roading Assessment and Maintenance Management (RAMM) asset management software to record information about roading assets. A high-level summary of the assets is shown in the following table – valuation information relates to the asset valuation as at 30 June 2019. Table 5.1 Asset Description
Asset Area Quantity (2020)
Replacement Cost Value 2019 $m
Current Depreciated Value
2019 $m Pavements $225.6 $87.7
Sealed 464 km Unsealed 123 km
Footpaths / Walkways $53.2 $26.4 Asphalt / Concrete 475 km Metal / other 26 km
Crossings 19,200 $10.1 $2.8 Berms 1,184,548 m2 $10.2 $10.2 Kerb & Channel / SWC 766 km $87.2 $32.8 Drainage Various $24.1 $9.2
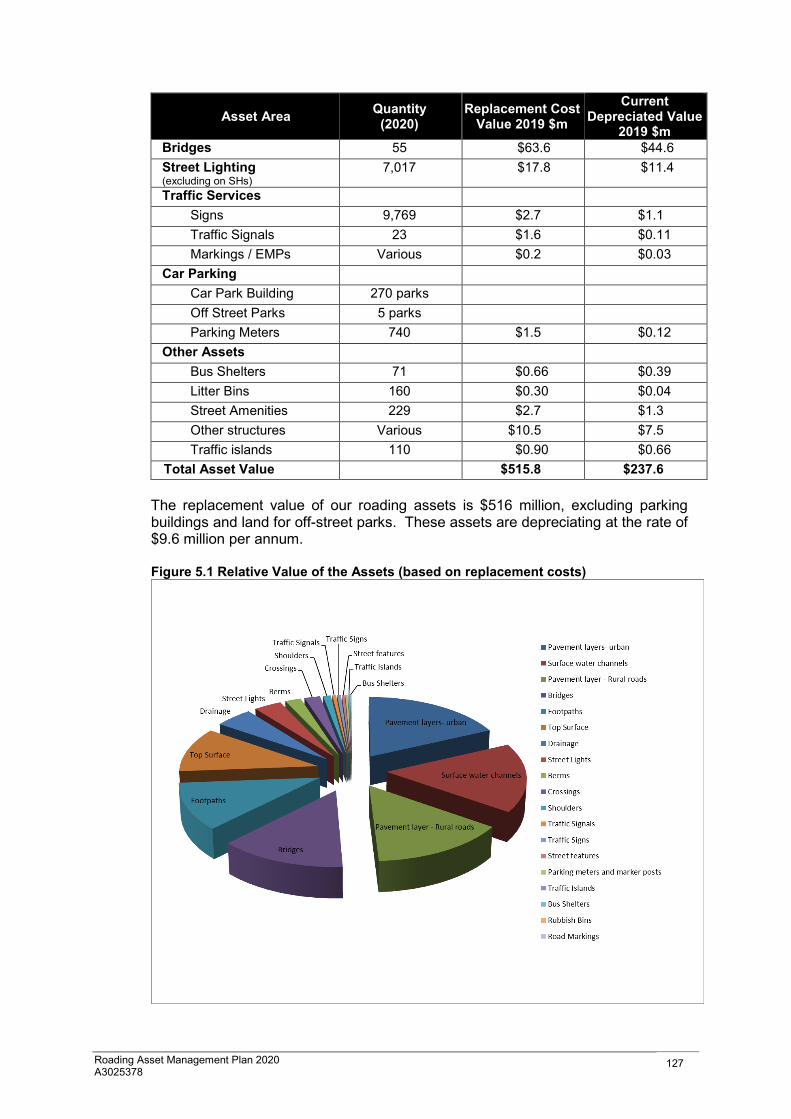
Roading Asset Management Plan 2020 A3025378
127
Asset Area Quantity (2020)
Replacement Cost Value 2019 $m
Current Depreciated Value
2019 $m Bridges 55 $63.6 $44.6 Street Lighting (excluding on SHs)
7,017 $17.8 $11.4
Traffic Services Signs 9,769 $2.7 $1.1 Traffic Signals 23 $1.6 $0.11 Markings / EMPs Various $0.2 $0.03
Car Parking Car Park Building 270 parks Off Street Parks 5 parks Parking Meters 740 $1.5 $0.12
Other Assets Bus Shelters 71 $0.66 $0.39 Litter Bins 160 $0.30 $0.04 Street Amenities 229 $2.7 $1.3 Other structures Various $10.5 $7.5 Traffic islands 110 $0.90 $0.66
Total Asset Value $515.8 $237.6
The replacement value of our roading assets is $516 million, excluding parking buildings and land for off-street parks. These assets are depreciating at the rate of $9.6 million per annum. Figure 5.1 Relative Value of the Assets (based on replacement costs)
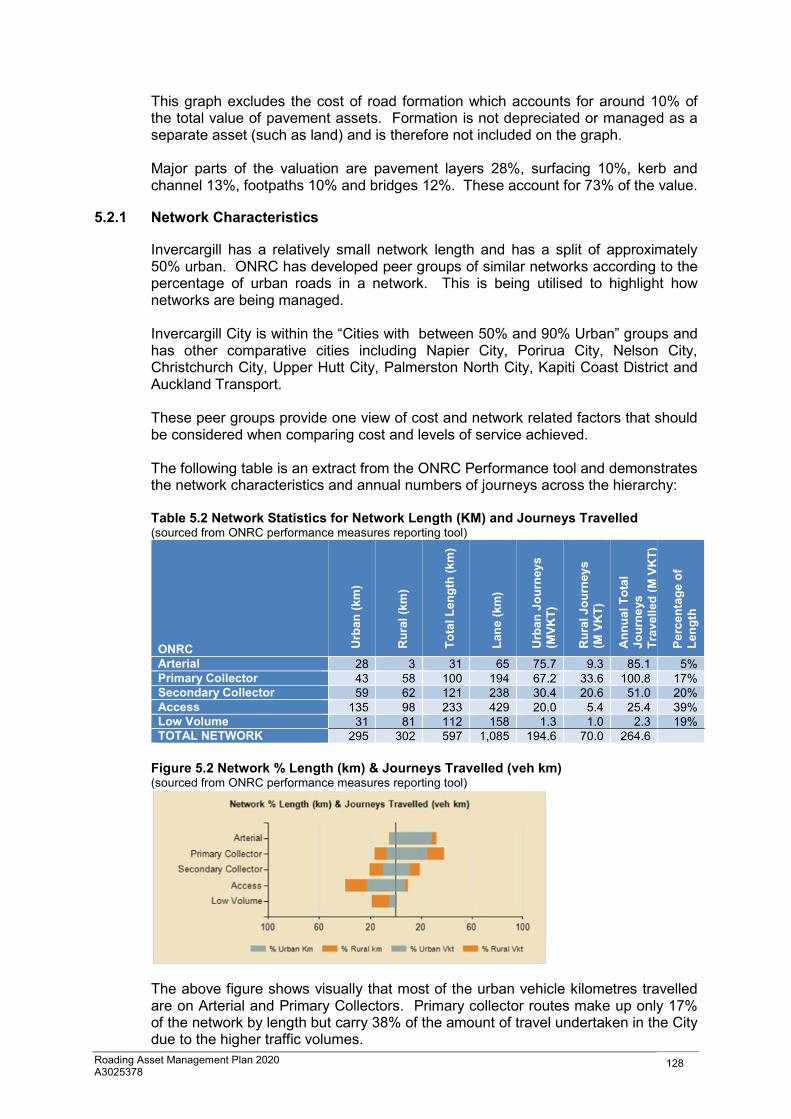
Roading Asset Management Plan 2020 A3025378
128
This graph excludes the cost of road formation which accounts for around 10% of the total value of pavement assets. Formation is not depreciated or managed as a separate asset (such as land) and is therefore not included on the graph. Major parts of the valuation are pavement layers 28%, surfacing 10%, kerb and channel 13%, footpaths 10% and bridges 12%. These account for 73% of the value.
5.2.1 Network Characteristics
Invercargill has a relatively small network length and has a split of approximately 50% urban. ONRC has developed peer groups of similar networks according to the percentage of urban roads in a network. This is being utilised to highlight how networks are being managed. Invercargill City is within the “Cities with between 50% and 90% Urban” groups and has other comparative cities including Napier City, Porirua City, Nelson City, Christchurch City, Upper Hutt City, Palmerston North City, Kapiti Coast District and Auckland Transport. These peer groups provide one view of cost and network related factors that should be considered when comparing cost and levels of service achieved. The following table is an extract from the ONRC Performance tool and demonstrates the network characteristics and annual numbers of journeys across the hierarchy: Table 5.2 Network Statistics for Network Length (KM) and Journeys Travelled (sourced from ONRC performance measures reporting tool)
ONRC Urb
an (k
m)
Rur
al (k
m)
Tota
l Len
gth
(km
)
Lane
(km
)
Urb
an J
ourn
eys
(MVK
T)
Rur
al J
ourn
eys
(M V
KT)
Ann
ual T
otal
Jo
urne
ys
Trav
elle
d (M
VK
T)
Perc
enta
ge o
f Le
ngth
Arterial 28 3 31 65 75.7 9.3 85.1 5% Primary Collector 43 58 100 194 67.2 33.6 100.8 17% Secondary Collector 59 62 121 238 30.4 20.6 51.0 20% Access 135 98 233 429 20.0 5.4 25.4 39% Low Volume 31 81 112 158 1.3 1.0 2.3 19% TOTAL NETWORK 295 302 597 1,085 194.6 70.0 264.6
Figure 5.2 Network % Length (km) & Journeys Travelled (veh km) (sourced from ONRC performance measures reporting tool)
The above figure shows visually that most of the urban vehicle kilometres travelled are on Arterial and Primary Collectors. Primary collector routes make up only 17% of the network by length but carry 38% of the amount of travel undertaken in the City due to the higher traffic volumes.
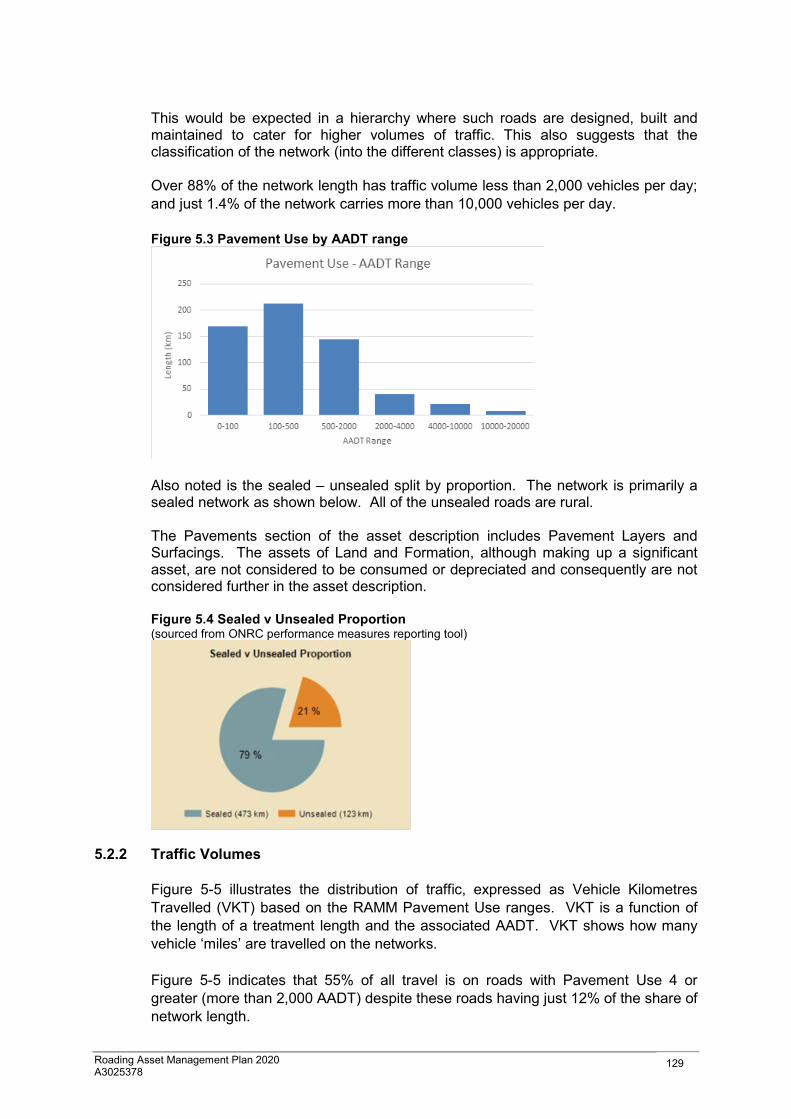
Roading Asset Management Plan 2020 A3025378
129
This would be expected in a hierarchy where such roads are designed, built and maintained to cater for higher volumes of traffic. This also suggests that the classification of the network (into the different classes) is appropriate. Over 88% of the network length has traffic volume less than 2,000 vehicles per day; and just 1.4% of the network carries more than 10,000 vehicles per day. Figure 5.3 Pavement Use by AADT range
Also noted is the sealed – unsealed split by proportion. The network is primarily a sealed network as shown below. All of the unsealed roads are rural. The Pavements section of the asset description includes Pavement Layers and Surfacings. The assets of Land and Formation, although making up a significant asset, are not considered to be consumed or depreciated and consequently are not considered further in the asset description. Figure 5.4 Sealed v Unsealed Proportion (sourced from ONRC performance measures reporting tool)
5.2.2 Traffic Volumes Figure 5-5 illustrates the distribution of traffic, expressed as Vehicle Kilometres Travelled (VKT) based on the RAMM Pavement Use ranges. VKT is a function of the length of a treatment length and the associated AADT. VKT shows how many vehicle ‘miles’ are travelled on the networks. Figure 5-5 indicates that 55% of all travel is on roads with Pavement Use 4 or greater (more than 2,000 AADT) despite these roads having just 12% of the share of network length.
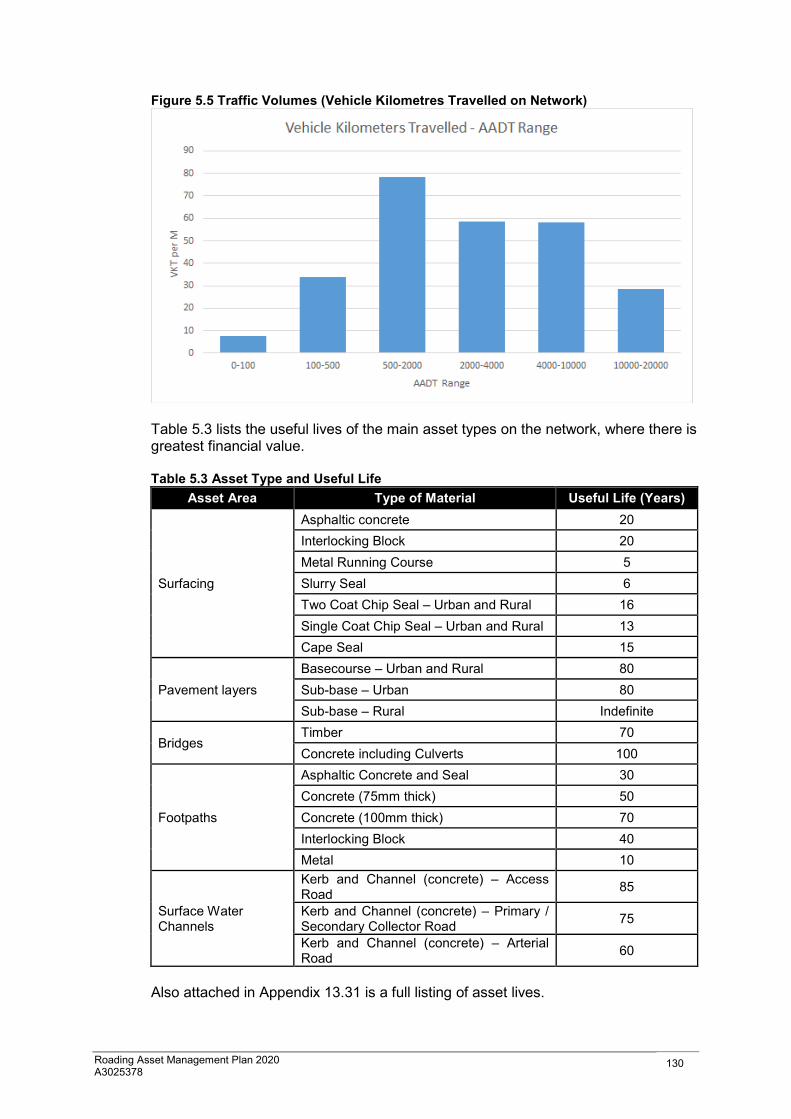
Roading Asset Management Plan 2020 A3025378
130
Figure 5.5 Traffic Volumes (Vehicle Kilometres Travelled on Network)
Table 5.3 lists the useful lives of the main asset types on the network, where there is greatest financial value. Table 5.3 Asset Type and Useful Life
Asset Area Type of Material Useful Life (Years)
Surfacing
Asphaltic concrete 20 Interlocking Block 20 Metal Running Course 5 Slurry Seal 6 Two Coat Chip Seal – Urban and Rural 16 Single Coat Chip Seal – Urban and Rural 13 Cape Seal 15
Pavement layers Basecourse – Urban and Rural 80 Sub-base – Urban 80 Sub-base – Rural Indefinite
Bridges Timber 70 Concrete including Culverts 100
Footpaths
Asphaltic Concrete and Seal 30 Concrete (75mm thick) 50 Concrete (100mm thick) 70 Interlocking Block 40 Metal 10
Surface Water Channels
Kerb and Channel (concrete) – Access Road 85 Kerb and Channel (concrete) – Primary / Secondary Collector Road 75 Kerb and Channel (concrete) – Arterial Road 60
Also attached in Appendix 13.31 is a full listing of asset lives.
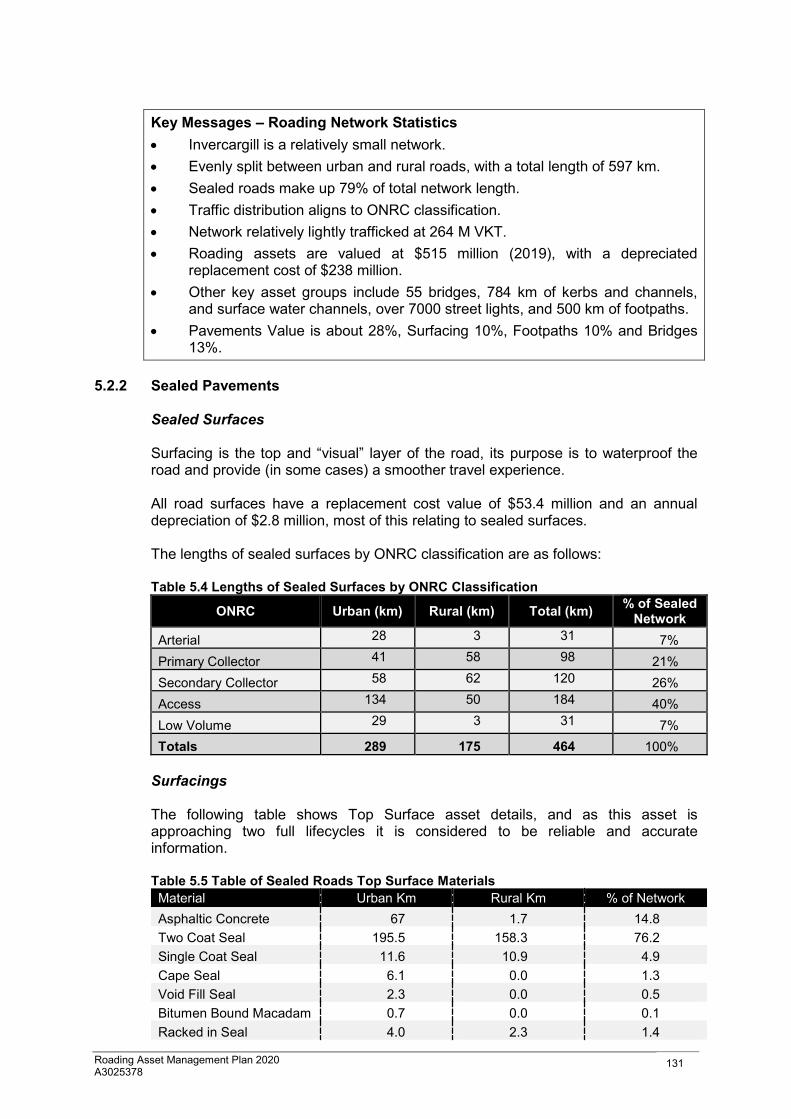
Roading Asset Management Plan 2020 A3025378
131
Key Messages – Roading Network Statistics • Invercargill is a relatively small network. • Evenly split between urban and rural roads, with a total length of 597 km. • Sealed roads make up 79% of total network length. • Traffic distribution aligns to ONRC classification. • Network relatively lightly trafficked at 264 M VKT. • Roading assets are valued at $515 million (2019), with a depreciated
replacement cost of $238 million. • Other key asset groups include 55 bridges, 784 km of kerbs and channels,
and surface water channels, over 7000 street lights, and 500 km of footpaths. • Pavements Value is about 28%, Surfacing 10%, Footpaths 10% and Bridges
13%.
5.2.2 Sealed Pavements
Sealed Surfaces Surfacing is the top and “visual” layer of the road, its purpose is to waterproof the road and provide (in some cases) a smoother travel experience. All road surfaces have a replacement cost value of $53.4 million and an annual depreciation of $2.8 million, most of this relating to sealed surfaces. The lengths of sealed surfaces by ONRC classification are as follows: Table 5.4 Lengths of Sealed Surfaces by ONRC Classification
ONRC Urban (km) Rural (km) Total (km) % of Sealed Network
Arterial 28 3 31 7% Primary Collector 41 58 98 21% Secondary Collector 58 62 120 26% Access 134 50 184 40% Low Volume 29 3 31 7% Totals 289 175 464 100%
Surfacings
The following table shows Top Surface asset details, and as this asset is approaching two full lifecycles it is considered to be reliable and accurate information. Table 5.5 Table of Sealed Roads Top Surface Materials Material Urban Km Rural Km % of Network Asphaltic Concrete 67 1.7 14.8 Two Coat Seal 195.5 158.3 76.2 Single Coat Seal 11.6 10.9 4.9 Cape Seal 6.1 0.0 1.3 Void Fill Seal 2.3 0.0 0.5 Bitumen Bound Macadam 0.7 0.0 0.1 Racked in Seal 4.0 2.3 1.4
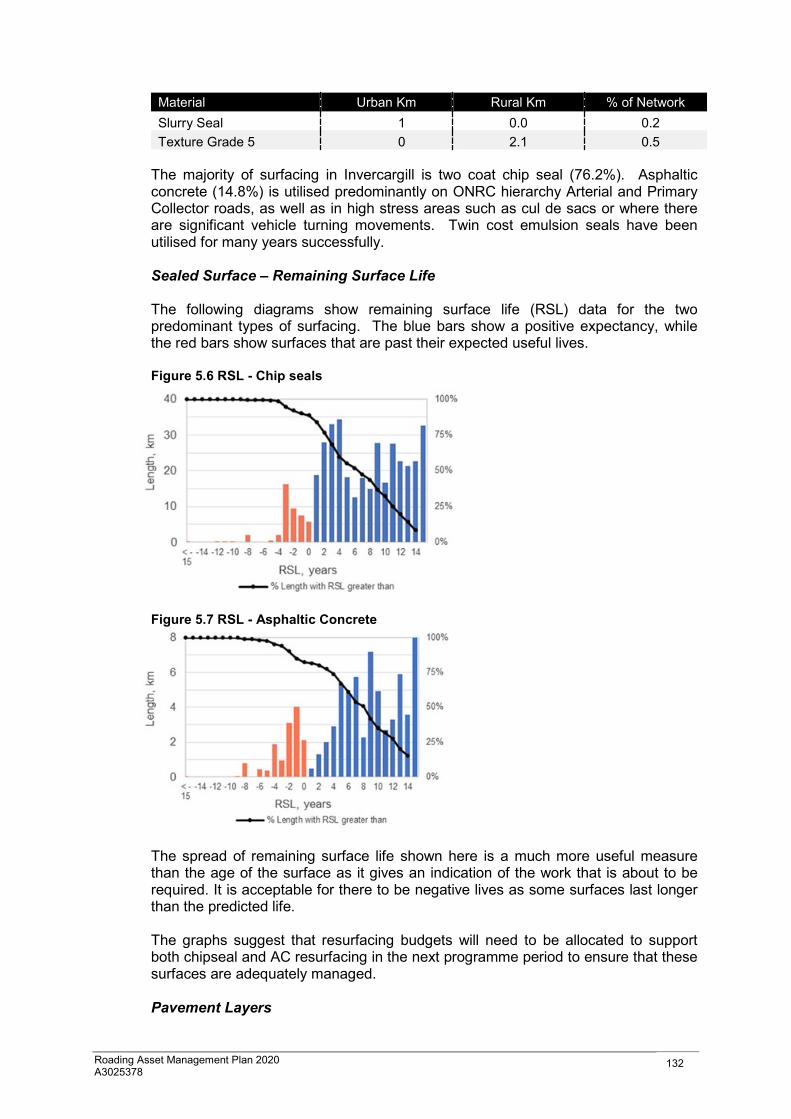
Roading Asset Management Plan 2020 A3025378
132
Material Urban Km Rural Km % of Network Slurry Seal 1 0.0 0.2 Texture Grade 5 0 2.1 0.5
The majority of surfacing in Invercargill is two coat chip seal (76.2%). Asphaltic concrete (14.8%) is utilised predominantly on ONRC hierarchy Arterial and Primary Collector roads, as well as in high stress areas such as cul de sacs or where there are significant vehicle turning movements. Twin cost emulsion seals have been utilised for many years successfully.
Sealed Surface – Remaining Surface Life The following diagrams show remaining surface life (RSL) data for the two predominant types of surfacing. The blue bars show a positive expectancy, while the red bars show surfaces that are past their expected useful lives. Figure 5.6 RSL - Chip seals
Figure 5.7 RSL - Asphaltic Concrete
The spread of remaining surface life shown here is a much more useful measure than the age of the surface as it gives an indication of the work that is about to be required. It is acceptable for there to be negative lives as some surfaces last longer than the predicted life. The graphs suggest that resurfacing budgets will need to be allocated to support both chipseal and AC resurfacing in the next programme period to ensure that these surfaces are adequately managed. Pavement Layers
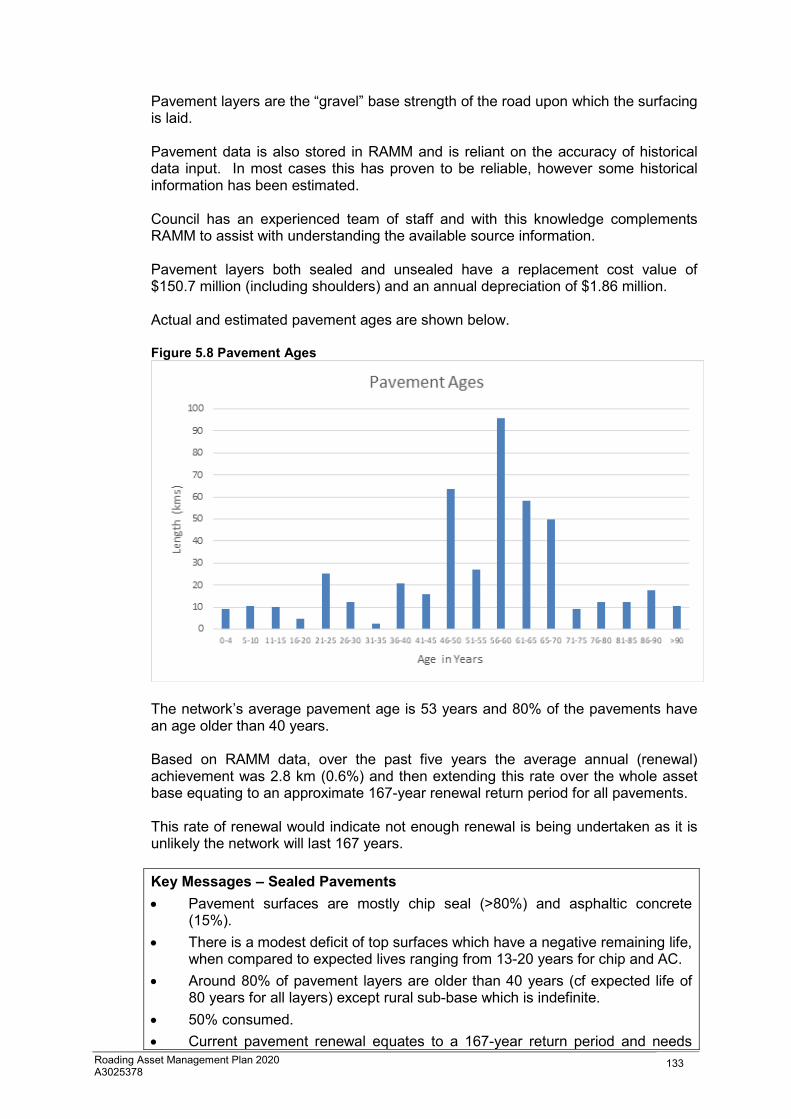
Roading Asset Management Plan 2020 A3025378
133
Pavement layers are the “gravel” base strength of the road upon which the surfacing is laid. Pavement data is also stored in RAMM and is reliant on the accuracy of historical data input. In most cases this has proven to be reliable, however some historical information has been estimated. Council has an experienced team of staff and with this knowledge complements RAMM to assist with understanding the available source information. Pavement layers both sealed and unsealed have a replacement cost value of $150.7 million (including shoulders) and an annual depreciation of $1.86 million. Actual and estimated pavement ages are shown below. Figure 5.8 Pavement Ages
The network’s average pavement age is 53 years and 80% of the pavements have an age older than 40 years. Based on RAMM data, over the past five years the average annual (renewal) achievement was 2.8 km (0.6%) and then extending this rate over the whole asset base equating to an approximate 167-year renewal return period for all pavements. This rate of renewal would indicate not enough renewal is being undertaken as it is unlikely the network will last 167 years. Key Messages – Sealed Pavements • Pavement surfaces are mostly chip seal (>80%) and asphaltic concrete
(15%). • There is a modest deficit of top surfaces which have a negative remaining life,
when compared to expected lives ranging from 13-20 years for chip and AC. • Around 80% of pavement layers are older than 40 years (cf expected life of
80 years for all layers) except rural sub-base which is indefinite. • 50% consumed. • Current pavement renewal equates to a 167-year return period and needs
Roading Asset Management Plan 2020 A3025378
134
careful management and analysis.
5.2.3 Unsealed Pavements Unsealed pavements are an important link in the usability of the network, providing vital connections for users to rural areas. Unsealed roads, although not long compared to other authorities, are a key part of the total network. They provide critical connecting access to the community. A large portion of the unsealed network services areas populated by peri-urban developments. Some residents in these areas seek to have road surfaces of a higher standard and want conditions closer to a sealed environment to limit factors such as dust and wear on vehicles. Unsealed road lengths by ONRC hierarchy are shown below: Table 5.7 Unsealed Road Lengths by ONRC Hierarchy
ONRC Hierarchy Length (km) % Total Network Access 55.1 9.2% Access Low Volume 68.2 11.4% TOTAL 123.3 20.6%
. Unsealed pavements have been performing well and are a relatively low budget and asset value and whilst important, have limited impacts on the asset renewal strategies and are not considered in any further detail. Key Messages – Unsealed Pavements • Unsealed roads play an important role in the total network. • There are around 123 km of unsealed roads. • Peri-urban developments are increasing expectations for seal extensions /
improved service quality. 5.2.4 Kerb and Channel / Surface Water Channels / Drainage Culverts
The Council manages: 546 km of concrete kerbs and channels, and 220 km of water tables, with a
replacement value of $87.2 million. o Condition data is not sufficiently detailed to model accurately but by
valuation it is 62% consumed with annual depreciation of $1.1 million. This suggests a long-term average renewal rate of a similar amount.
o These include kerb and channel, kerb only, mountable kerbs and water tables.
Drainage assets which include sumps and over 700 culverts with a replacement value of $24.1 million and annual depreciation of $300,000. o Drainage culverts have a waterway area of less than 3.4m2. Larger
culverts are categorised as Bridges under NZTA funding requirements. The following figures show details of kerb and channel, and earthen surface water channels. No construction dates were historically available for recording in the database and so in 2002 construction dates were estimated using adjacent pavement construction
Roading Asset Management Plan 2020 A3025378
135
dates. This is an area where more improvement is needed to give greater confidence in the data. Reconstruction data is now entered into RAMM with actual construction dates.
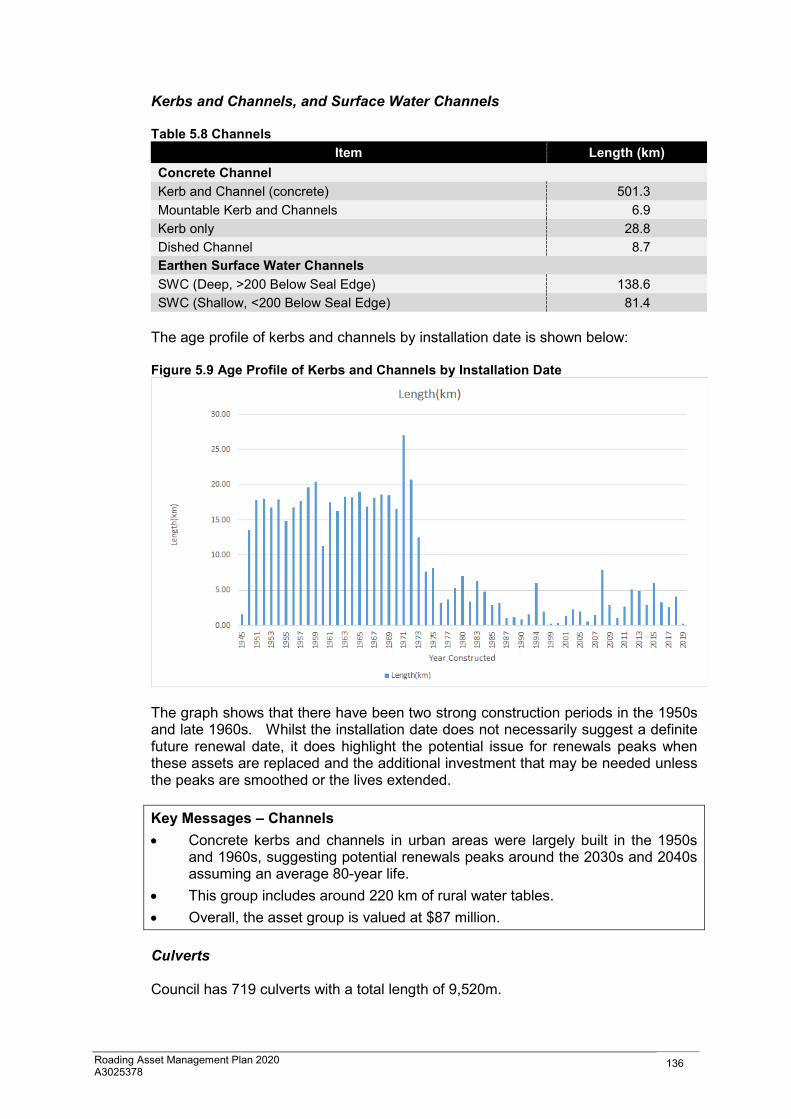
Roading Asset Management Plan 2020 A3025378
136
Kerbs and Channels, and Surface Water Channels Table 5.8 Channels
Item Length (km) Concrete Channel Kerb and Channel (concrete) 501.3 Mountable Kerb and Channels 6.9 Kerb only 28.8 Dished Channel 8.7 Earthen Surface Water Channels SWC (Deep, >200 Below Seal Edge) 138.6 SWC (Shallow, <200 Below Seal Edge) 81.4
The age profile of kerbs and channels by installation date is shown below: Figure 5.9 Age Profile of Kerbs and Channels by Installation Date
The graph shows that there have been two strong construction periods in the 1950s and late 1960s. Whilst the installation date does not necessarily suggest a definite future renewal date, it does highlight the potential issue for renewals peaks when these assets are replaced and the additional investment that may be needed unless the peaks are smoothed or the lives extended. Key Messages – Channels • Concrete kerbs and channels in urban areas were largely built in the 1950s
and 1960s, suggesting potential renewals peaks around the 2030s and 2040s assuming an average 80-year life.
• This group includes around 220 km of rural water tables. • Overall, the asset group is valued at $87 million.
Culverts Council has 719 culverts with a total length of 9,520m.
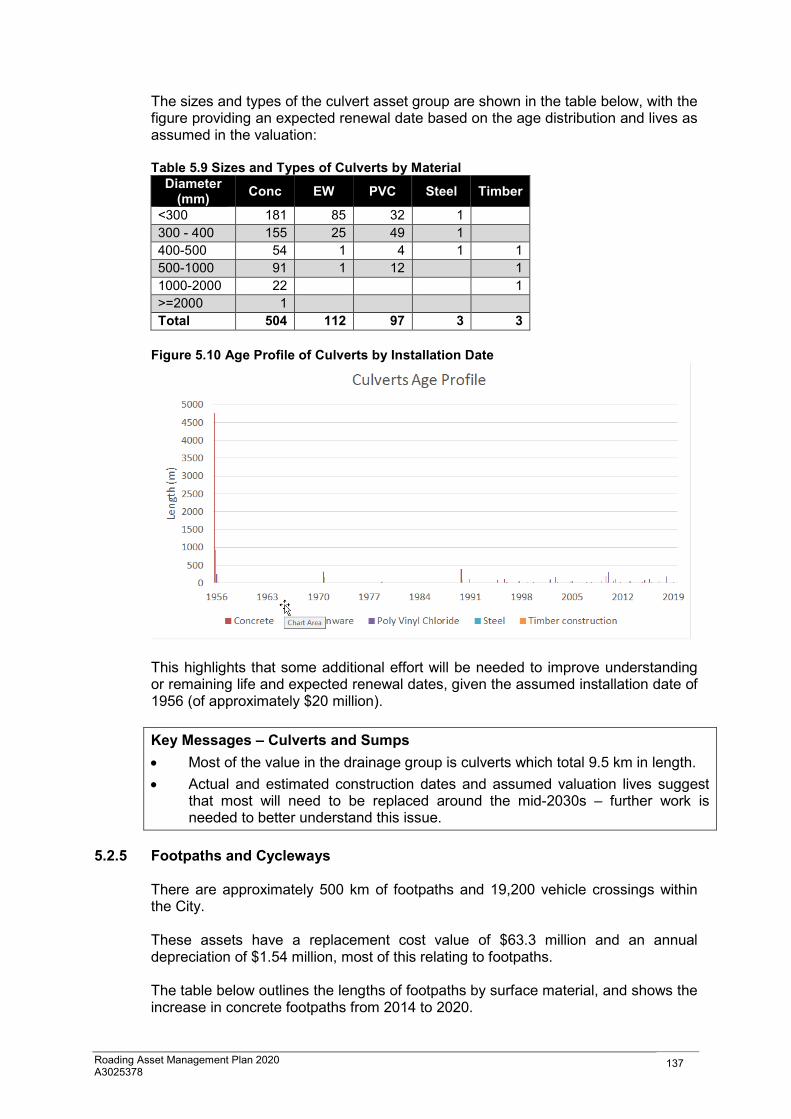
Roading Asset Management Plan 2020 A3025378
137
The sizes and types of the culvert asset group are shown in the table below, with the figure providing an expected renewal date based on the age distribution and lives as assumed in the valuation: Table 5.9 Sizes and Types of Culverts by Material
Diameter (mm) Conc EW PVC Steel Timber
<300 181 85 32 1 300 - 400 155 25 49 1 400-500 54 1 4 1 1 500-1000 91 1 12 1 1000-2000 22 1 >=2000 1 Total 504 112 97 3 3
Figure 5.10 Age Profile of Culverts by Installation Date
This highlights that some additional effort will be needed to improve understanding or remaining life and expected renewal dates, given the assumed installation date of 1956 (of approximately $20 million).
Key Messages – Culverts and Sumps • Most of the value in the drainage group is culverts which total 9.5 km in length. • Actual and estimated construction dates and assumed valuation lives suggest
that most will need to be replaced around the mid-2030s – further work is needed to better understand this issue.
5.2.5 Footpaths and Cycleways
There are approximately 500 km of footpaths and 19,200 vehicle crossings within the City. These assets have a replacement cost value of $63.3 million and an annual depreciation of $1.54 million, most of this relating to footpaths. The table below outlines the lengths of footpaths by surface material, and shows the increase in concrete footpaths from 2014 to 2020.
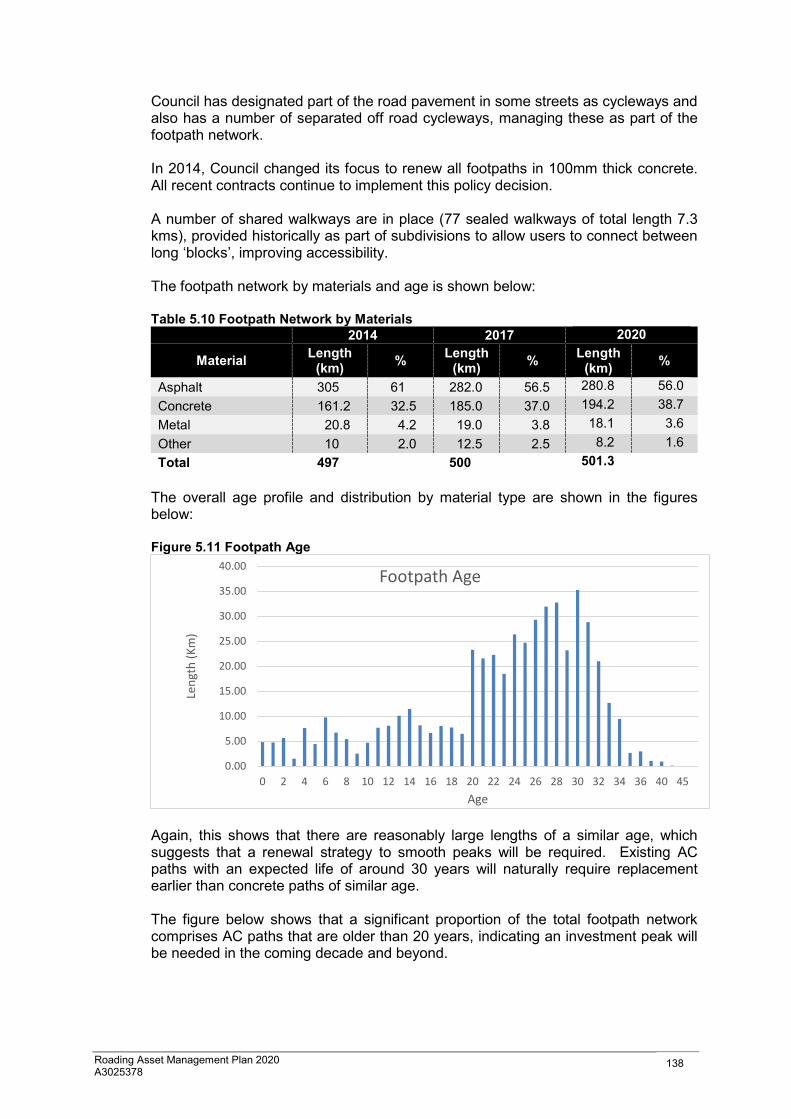
Roading Asset Management Plan 2020 A3025378
138
Council has designated part of the road pavement in some streets as cycleways and also has a number of separated off road cycleways, managing these as part of the footpath network. In 2014, Council changed its focus to renew all footpaths in 100mm thick concrete. All recent contracts continue to implement this policy decision. A number of shared walkways are in place (77 sealed walkways of total length 7.3 kms), provided historically as part of subdivisions to allow users to connect between long ‘blocks’, improving accessibility. The footpath network by materials and age is shown below: Table 5.10 Footpath Network by Materials
2014 2017 2020
Material Length (km) % Length
(km) % Length (km) %
Asphalt 305 61 282.0 56.5 280.8 56.0 Concrete 161.2 32.5 185.0 37.0 194.2 38.7 Metal 20.8 4.2 19.0 3.8 18.1 3.6 Other 10 2.0 12.5 2.5 8.2 1.6 Total 497 500 501.3
The overall age profile and distribution by material type are shown in the figures below: Figure 5.11 Footpath Age
Again, this shows that there are reasonably large lengths of a similar age, which suggests that a renewal strategy to smooth peaks will be required. Existing AC paths with an expected life of around 30 years will naturally require replacement earlier than concrete paths of similar age. The figure below shows that a significant proportion of the total footpath network comprises AC paths that are older than 20 years, indicating an investment peak will be needed in the coming decade and beyond.
0.00
5.00
10.00
15.00
20.00
25.00
30.00
35.00
40.00
0 2 4 6 8 10 12 14 16 18 20 22 24 26 28 30 32 34 36 40 45
Leng
th (K
m)
Age
Footpath Age
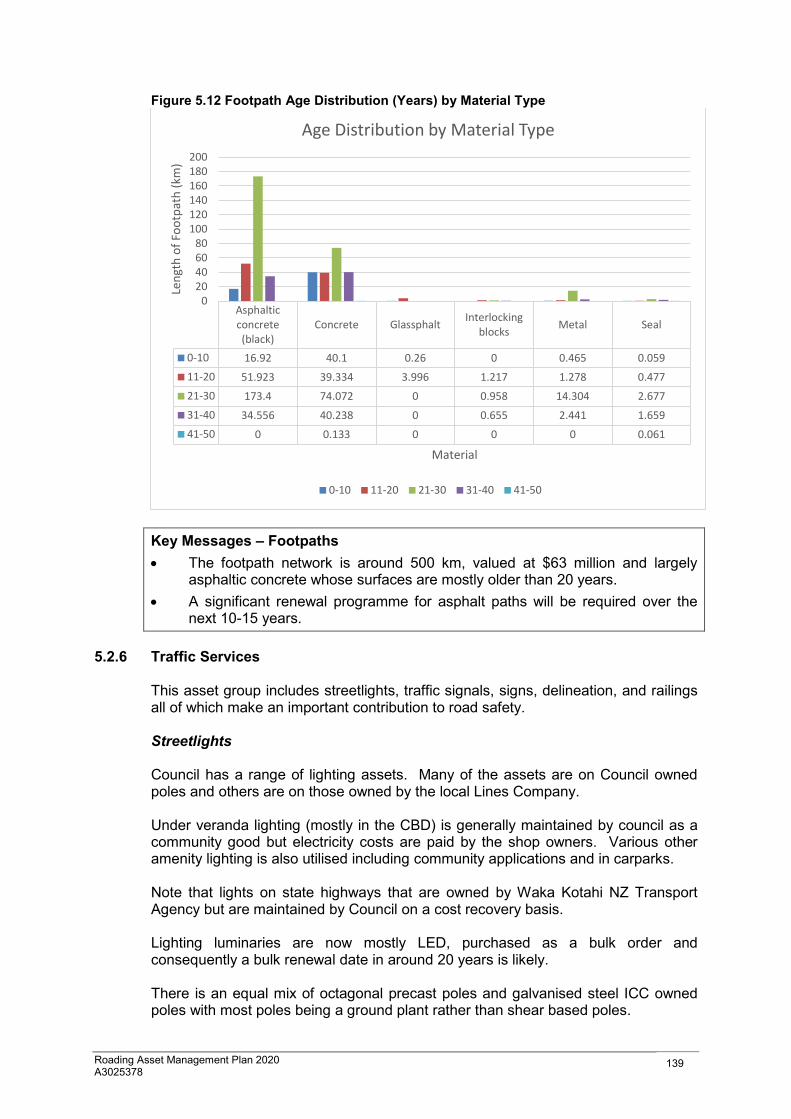
Roading Asset Management Plan 2020 A3025378
139
Figure 5.12 Footpath Age Distribution (Years) by Material Type
Key Messages – Footpaths • The footpath network is around 500 km, valued at $63 million and largely
asphaltic concrete whose surfaces are mostly older than 20 years. • A significant renewal programme for asphalt paths will be required over the
next 10-15 years.
5.2.6 Traffic Services This asset group includes streetlights, traffic signals, signs, delineation, and railings all of which make an important contribution to road safety.
Streetlights Council has a range of lighting assets. Many of the assets are on Council owned poles and others are on those owned by the local Lines Company. Under veranda lighting (mostly in the CBD) is generally maintained by council as a community good but electricity costs are paid by the shop owners. Various other amenity lighting is also utilised including community applications and in carparks. Note that lights on state highways that are owned by Waka Kotahi NZ Transport Agency but are maintained by Council on a cost recovery basis. Lighting luminaries are now mostly LED, purchased as a bulk order and consequently a bulk renewal date in around 20 years is likely. There is an equal mix of octagonal precast poles and galvanised steel ICC owned poles with most poles being a ground plant rather than shear based poles.
Asphalticconcrete(black)
Concrete Glassphalt Interlockingblocks Metal Seal
0‐10 16.92 40.1 0.26 0 0.465 0.05911‐20 51.923 39.334 3.996 1.217 1.278 0.47721‐30 173.4 74.072 0 0.958 14.304 2.67731‐40 34.556 40.238 0 0.655 2.441 1.65941‐50 0 0.133 0 0 0 0.061
020406080
100120140160180200
Leng
th o
f Foo
tpat
h (k
m)
Material
Age Distribution by Material Type
0‐10 11‐20 21‐30 31‐40 41‐50
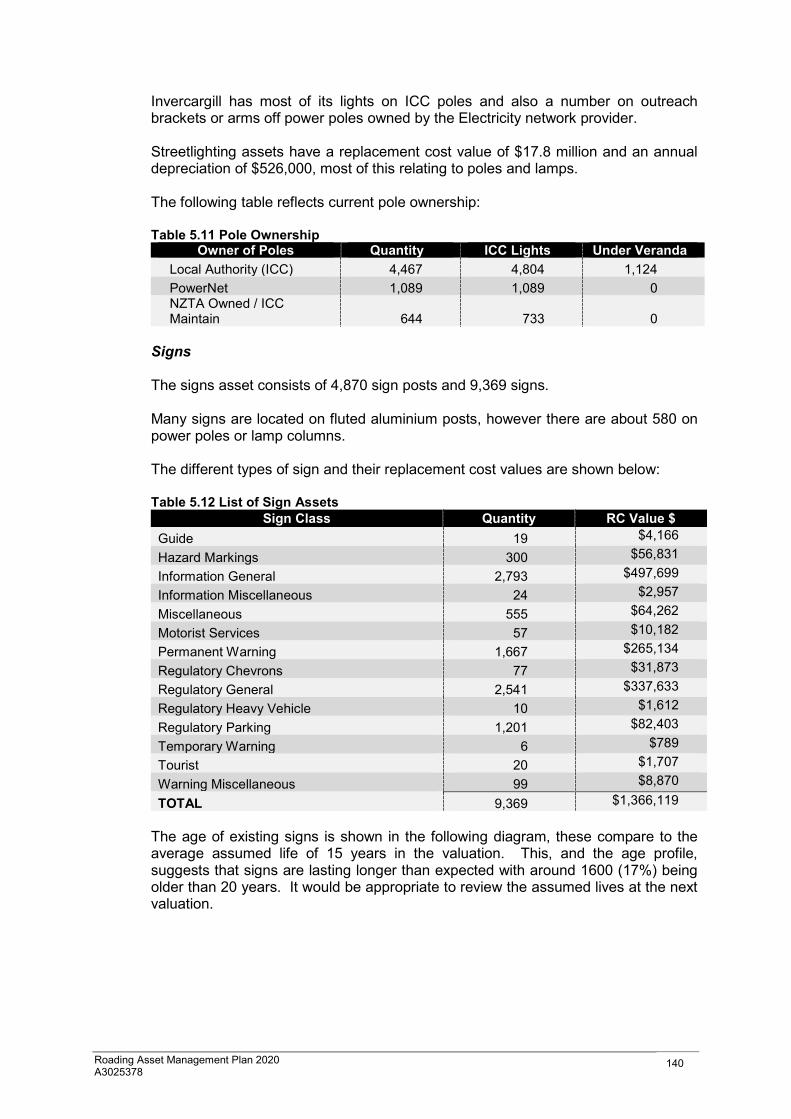
Roading Asset Management Plan 2020 A3025378
140
Invercargill has most of its lights on ICC poles and also a number on outreach brackets or arms off power poles owned by the Electricity network provider. Streetlighting assets have a replacement cost value of $17.8 million and an annual depreciation of $526,000, most of this relating to poles and lamps. The following table reflects current pole ownership: Table 5.11 Pole Ownership
Owner of Poles Quantity ICC Lights Under Veranda Local Authority (ICC) 4,467 4,804 1,124 PowerNet 1,089 1,089 0 NZTA Owned / ICC Maintain 644 733 0
Signs
The signs asset consists of 4,870 sign posts and 9,369 signs. Many signs are located on fluted aluminium posts, however there are about 580 on power poles or lamp columns. The different types of sign and their replacement cost values are shown below: Table 5.12 List of Sign Assets
Sign Class Quantity RC Value $ Guide 19 $4,166 Hazard Markings 300 $56,831 Information General 2,793 $497,699 Information Miscellaneous 24 $2,957 Miscellaneous 555 $64,262 Motorist Services 57 $10,182 Permanent Warning 1,667 $265,134 Regulatory Chevrons 77 $31,873 Regulatory General 2,541 $337,633 Regulatory Heavy Vehicle 10 $1,612 Regulatory Parking 1,201 $82,403 Temporary Warning 6 $789 Tourist 20 $1,707 Warning Miscellaneous 99 $8,870
TOTAL 9,369 $1,366,119 The age of existing signs is shown in the following diagram, these compare to the average assumed life of 15 years in the valuation. This, and the age profile, suggests that signs are lasting longer than expected with around 1600 (17%) being older than 20 years. It would be appropriate to review the assumed lives at the next valuation.
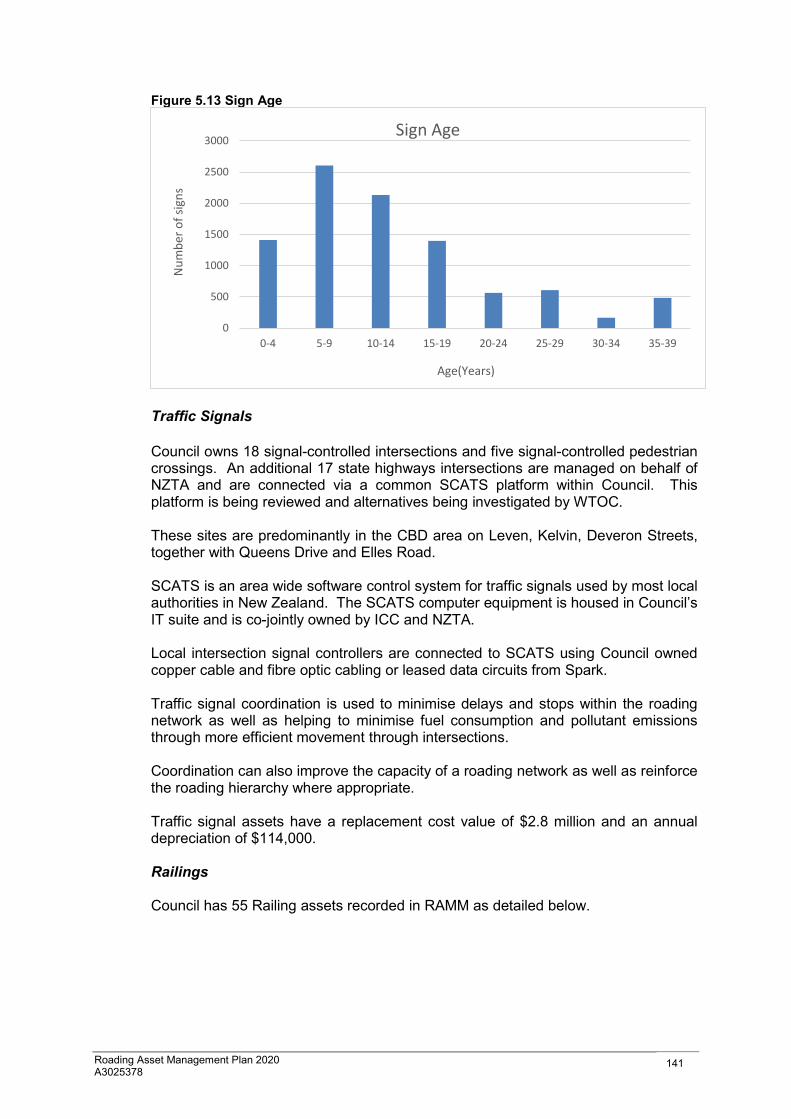
Roading Asset Management Plan 2020 A3025378
141
Figure 5.13 Sign Age
Traffic Signals Council owns 18 signal-controlled intersections and five signal-controlled pedestrian crossings. An additional 17 state highways intersections are managed on behalf of NZTA and are connected via a common SCATS platform within Council. This platform is being reviewed and alternatives being investigated by WTOC. These sites are predominantly in the CBD area on Leven, Kelvin, Deveron Streets, together with Queens Drive and Elles Road. SCATS is an area wide software control system for traffic signals used by most local authorities in New Zealand. The SCATS computer equipment is housed in Council’s IT suite and is co-jointly owned by ICC and NZTA. Local intersection signal controllers are connected to SCATS using Council owned copper cable and fibre optic cabling or leased data circuits from Spark. Traffic signal coordination is used to minimise delays and stops within the roading network as well as helping to minimise fuel consumption and pollutant emissions through more efficient movement through intersections. Coordination can also improve the capacity of a roading network as well as reinforce the roading hierarchy where appropriate. Traffic signal assets have a replacement cost value of $2.8 million and an annual depreciation of $114,000.
Railings Council has 55 Railing assets recorded in RAMM as detailed below.
0
500
1000
1500
2000
2500
3000
0‐4 5‐9 10‐14 15‐19 20‐24 25‐29 30‐34 35‐39
Num
ber o
f sig
ns
Age(Years)
Sign Age
Roading Asset Management Plan 2020 A3025378
142
Figure 5.14 Number of Railings versus Age (Years)
Table 5.13 Railings by Type Railings Type Number Concrete 12 Concrete Post with Steel Tube 1 Guard rail 8 Other 1 Steel Flexbeam 7 Steel or Aluminium 2 Steel W Channel 13 Timber 11
Key Messages – Traffic Services • This group comprises streetlights, signs, traffic signals and railings. • These assets are mostly within expected age bands – although many signs
are older than their theoretical life. • Street light lamps are new LED with low energy consumption.
5.2.7 Structures The Council owns a total of 55 bridges including three large culverts, with a total value of approximately $74.2 million, including the ramps and rip-rap protection on the causeway approaches to the Tiwai Point bridge. Annual depreciation is $923,000, and the economic asset consumption level as measured by DRC is 54%. Culverts included under the schedule of bridges have a waterway area greater than or equal to 3.40 m2 in accordance with NZTA policy. Several bridges are on joint district boundary roads and replacement responsibilities are shared with the Southland District Council. Tiwai Bridge is by far the longest and has the highest single proportion of the replacement cost. It is a 27-span bridge 491m in length with significant causeway accesses. The bridge has had significant repairs undertaken early in its life (30 years) and had a full beams and deck renewal due to a deteriorated post-tensioned slab which had cracked and failed.
10‐19 20‐29 30‐39 40‐49 50‐59 60‐69 70‐79 80‐89Number of
railings 7 8 4 12 9 9 4 2
0
2
4
6
8
10
12
14
Num
ber o
f rai
lings
Age ( Years)
Number of Railings by Age Range
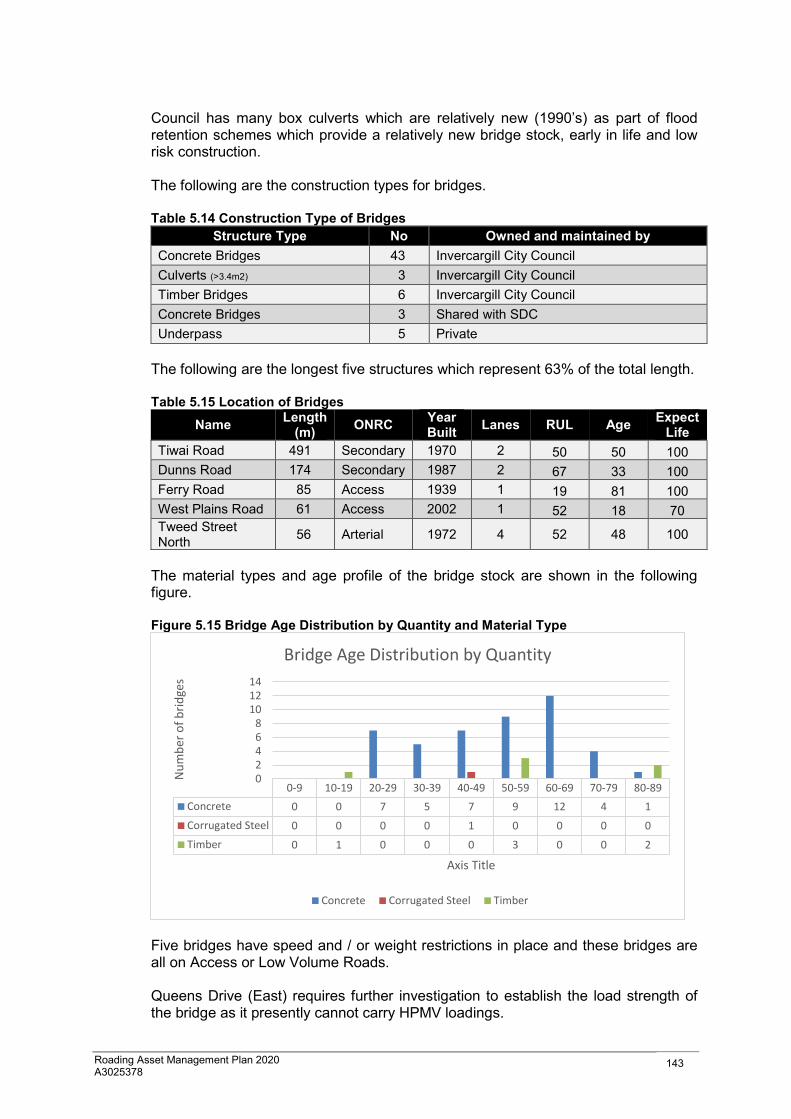
Roading Asset Management Plan 2020 A3025378
143
Council has many box culverts which are relatively new (1990’s) as part of flood retention schemes which provide a relatively new bridge stock, early in life and low risk construction. The following are the construction types for bridges. Table 5.14 Construction Type of Bridges
Structure Type No Owned and maintained by Concrete Bridges 43 Invercargill City Council Culverts (>3.4m2) 3 Invercargill City Council Timber Bridges 6 Invercargill City Council Concrete Bridges 3 Shared with SDC Underpass 5 Private
The following are the longest five structures which represent 63% of the total length. Table 5.15 Location of Bridges
Name Length (m) ONRC Year
Built Lanes RUL Age Expect Life
Tiwai Road 491 Secondary 1970 2 50 50 100 Dunns Road 174 Secondary 1987 2 67 33 100 Ferry Road 85 Access 1939 1 19 81 100 West Plains Road 61 Access 2002 1 52 18 70 Tweed Street North 56 Arterial 1972 4 52 48 100
The material types and age profile of the bridge stock are shown in the following figure. Figure 5.15 Bridge Age Distribution by Quantity and Material Type
Five bridges have speed and / or weight restrictions in place and these bridges are all on Access or Low Volume Roads. Queens Drive (East) requires further investigation to establish the load strength of the bridge as it presently cannot carry HPMV loadings.
0‐9 10‐19 20‐29 30‐39 40‐49 50‐59 60‐69 70‐79 80‐89Concrete 0 0 7 5 7 9 12 4 1Corrugated Steel 0 0 0 0 1 0 0 0 0Timber 0 1 0 0 0 3 0 0 2
02468
101214
Num
ber o
f brid
ges
Axis Title
Bridge Age Distribution by Quantity
Concrete Corrugated Steel Timber
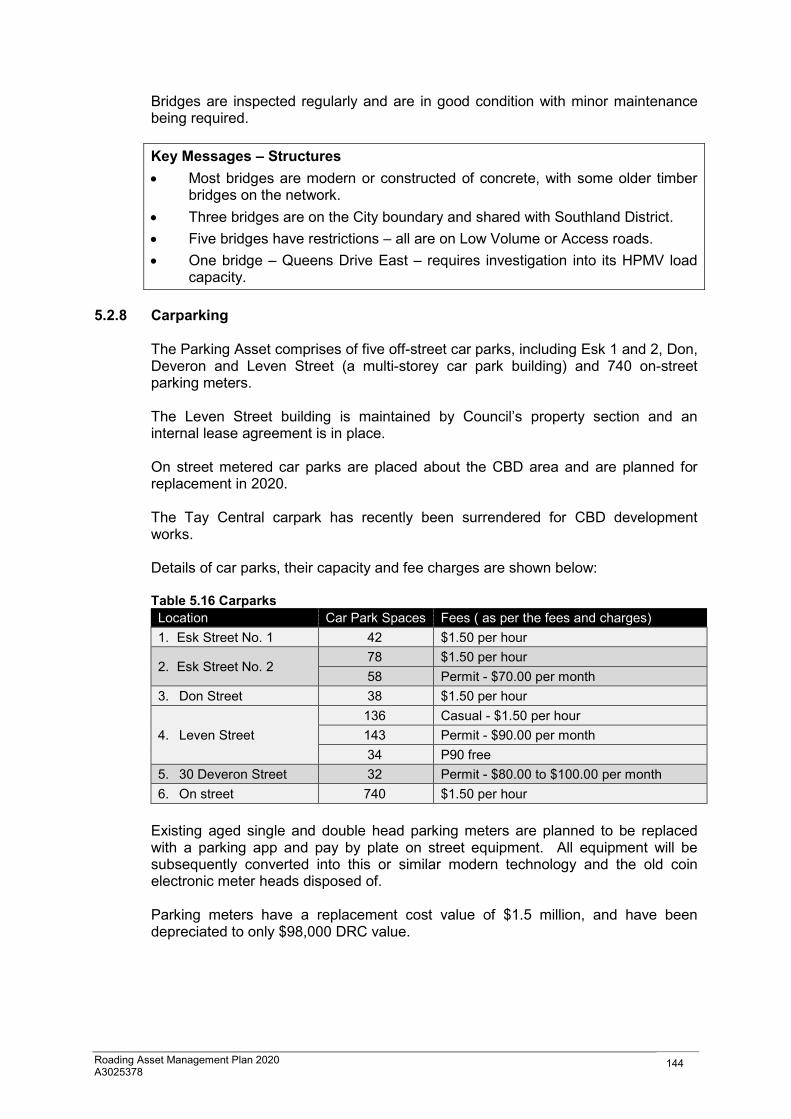
Roading Asset Management Plan 2020 A3025378
144
Bridges are inspected regularly and are in good condition with minor maintenance being required. Key Messages – Structures • Most bridges are modern or constructed of concrete, with some older timber
bridges on the network. • Three bridges are on the City boundary and shared with Southland District. • Five bridges have restrictions – all are on Low Volume or Access roads. • One bridge – Queens Drive East – requires investigation into its HPMV load
capacity.
5.2.8 Carparking The Parking Asset comprises of five off-street car parks, including Esk 1 and 2, Don, Deveron and Leven Street (a multi-storey car park building) and 740 on-street parking meters. The Leven Street building is maintained by Council’s property section and an internal lease agreement is in place. On street metered car parks are placed about the CBD area and are planned for replacement in 2020. The Tay Central carpark has recently been surrendered for CBD development works. Details of car parks, their capacity and fee charges are shown below: Table 5.16 Carparks Location Car Park Spaces Fees ( as per the fees and charges) 1. Esk Street No. 1 42 $1.50 per hour
2. Esk Street No. 2 78 $1.50 per hour 58 Permit - $70.00 per month
3. Don Street 38 $1.50 per hour
4. Leven Street 136 Casual - $1.50 per hour 143 Permit - $90.00 per month 34 P90 free
5. 30 Deveron Street 32 Permit - $80.00 to $100.00 per month 6. On street 740 $1.50 per hour
Existing aged single and double head parking meters are planned to be replaced with a parking app and pay by plate on street equipment. All equipment will be subsequently converted into this or similar modern technology and the old coin electronic meter heads disposed of. Parking meters have a replacement cost value of $1.5 million, and have been depreciated to only $98,000 DRC value.
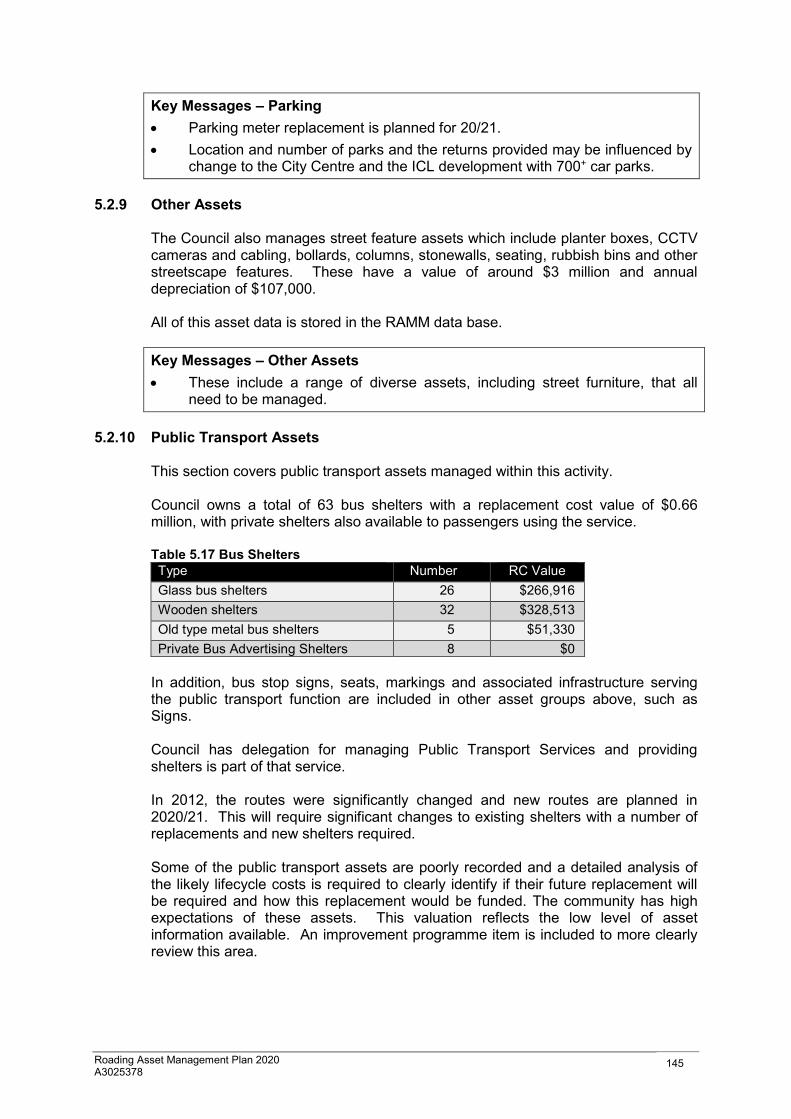
Roading Asset Management Plan 2020 A3025378
145
Key Messages – Parking • Parking meter replacement is planned for 20/21. • Location and number of parks and the returns provided may be influenced by
change to the City Centre and the ICL development with 700+ car parks.
5.2.9 Other Assets The Council also manages street feature assets which include planter boxes, CCTV cameras and cabling, bollards, columns, stonewalls, seating, rubbish bins and other streetscape features. These have a value of around $3 million and annual depreciation of $107,000. All of this asset data is stored in the RAMM data base. Key Messages – Other Assets • These include a range of diverse assets, including street furniture, that all
need to be managed.
5.2.10 Public Transport Assets This section covers public transport assets managed within this activity. Council owns a total of 63 bus shelters with a replacement cost value of $0.66 million, with private shelters also available to passengers using the service. Table 5.17 Bus Shelters Type Number RC Value Glass bus shelters 26 $266,916 Wooden shelters 32 $328,513 Old type metal bus shelters 5 $51,330 Private Bus Advertising Shelters 8 $0
In addition, bus stop signs, seats, markings and associated infrastructure serving the public transport function are included in other asset groups above, such as Signs. Council has delegation for managing Public Transport Services and providing shelters is part of that service. In 2012, the routes were significantly changed and new routes are planned in 2020/21. This will require significant changes to existing shelters with a number of replacements and new shelters required. Some of the public transport assets are poorly recorded and a detailed analysis of the likely lifecycle costs is required to clearly identify if their future replacement will be required and how this replacement would be funded. The community has high expectations of these assets. This valuation reflects the low level of asset information available. An improvement programme item is included to more clearly review this area.
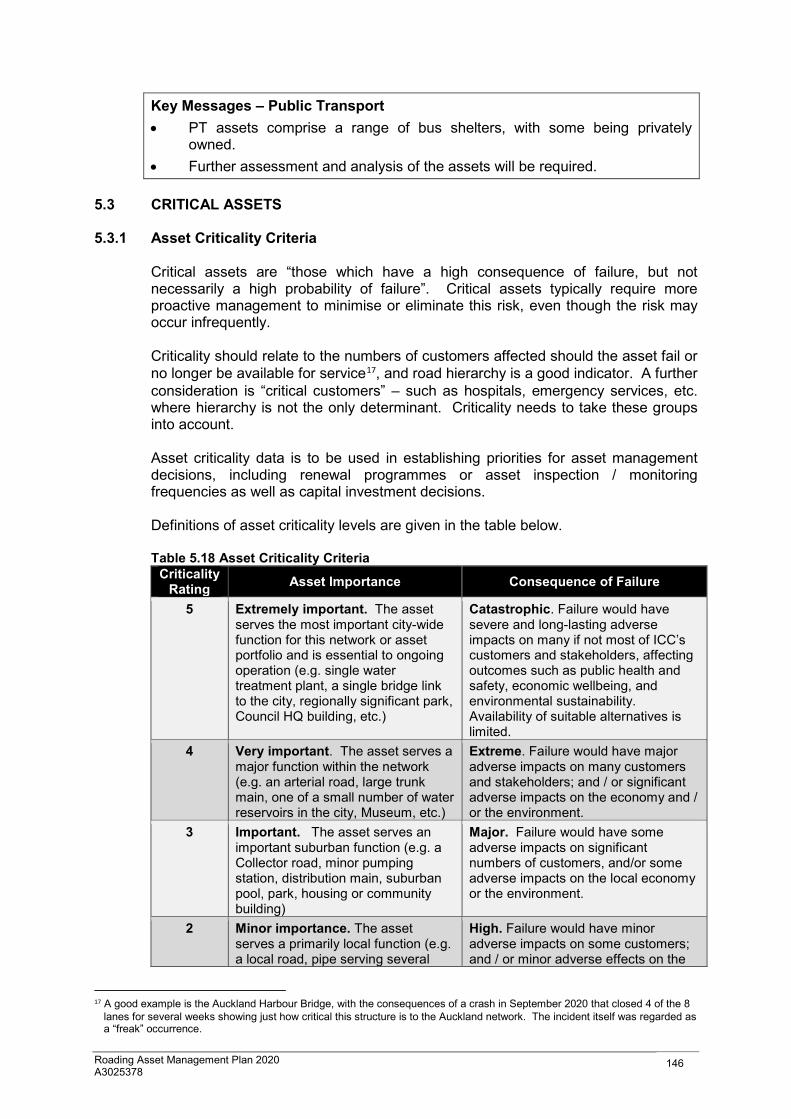
Roading Asset Management Plan 2020 A3025378
146
Key Messages – Public Transport • PT assets comprise a range of bus shelters, with some being privately
owned. • Further assessment and analysis of the assets will be required.
5.3 CRITICAL ASSETS 5.3.1 Asset Criticality Criteria
Critical assets are “those which have a high consequence of failure, but not necessarily a high probability of failure”. Critical assets typically require more proactive management to minimise or eliminate this risk, even though the risk may occur infrequently. Criticality should relate to the numbers of customers affected should the asset fail or no longer be available for service17, and road hierarchy is a good indicator. A further consideration is “critical customers” – such as hospitals, emergency services, etc. where hierarchy is not the only determinant. Criticality needs to take these groups into account. Asset criticality data is to be used in establishing priorities for asset management decisions, including renewal programmes or asset inspection / monitoring frequencies as well as capital investment decisions. Definitions of asset criticality levels are given in the table below. Table 5.18 Asset Criticality Criteria
Criticality Rating Asset Importance Consequence of Failure
5 Extremely important. The asset serves the most important city-wide function for this network or asset portfolio and is essential to ongoing operation (e.g. single water treatment plant, a single bridge link to the city, regionally significant park, Council HQ building, etc.)
Catastrophic. Failure would have severe and long-lasting adverse impacts on many if not most of ICC’s customers and stakeholders, affecting outcomes such as public health and safety, economic wellbeing, and environmental sustainability. Availability of suitable alternatives is limited.
4 Very important. The asset serves a major function within the network (e.g. an arterial road, large trunk main, one of a small number of water reservoirs in the city, Museum, etc.)
Extreme. Failure would have major adverse impacts on many customers and stakeholders; and / or significant adverse impacts on the economy and / or the environment.
3 Important. The asset serves an important suburban function (e.g. a Collector road, minor pumping station, distribution main, suburban pool, park, housing or community building)
Major. Failure would have some adverse impacts on significant numbers of customers, and/or some adverse impacts on the local economy or the environment.
2 Minor importance. The asset serves a primarily local function (e.g. a local road, pipe serving several
High. Failure would have minor adverse impacts on some customers; and / or minor adverse effects on the
17 A good example is the Auckland Harbour Bridge, with the consequences of a crash in September 2020 that closed 4 of the 8
lanes for several weeks showing just how critical this structure is to the Auckland network. The incident itself was regarded as a “freak” occurrence.
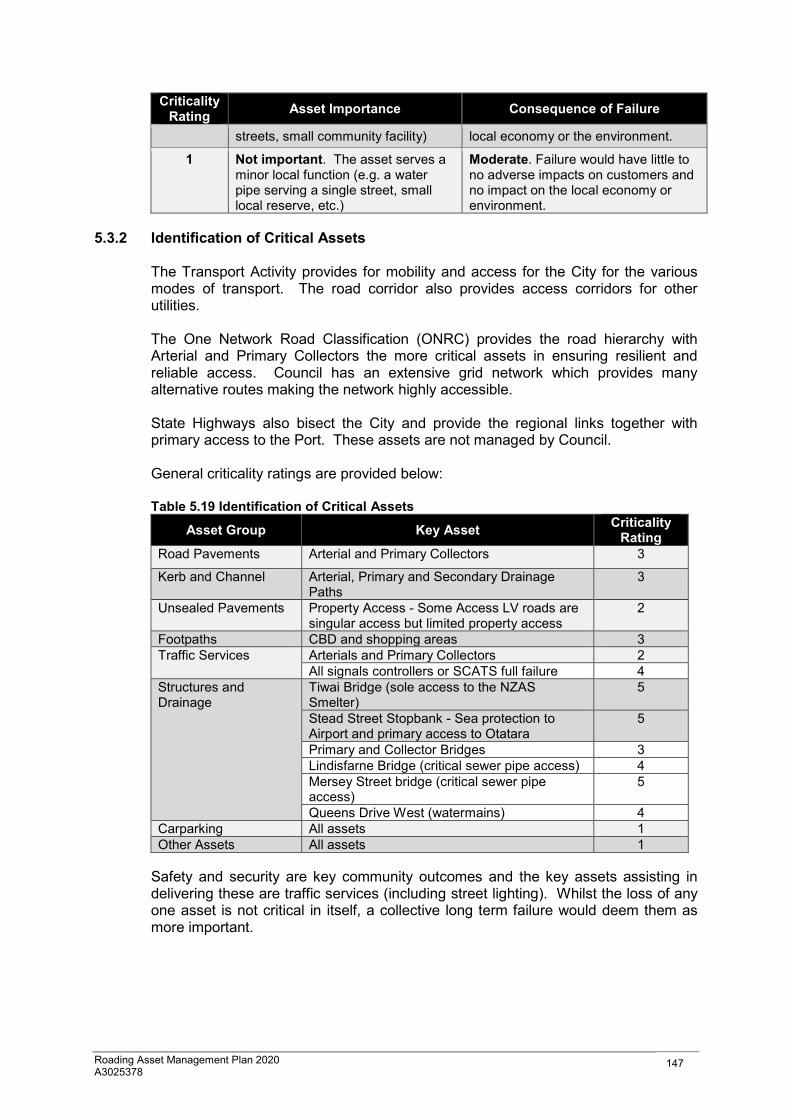
Roading Asset Management Plan 2020 A3025378
147
Criticality Rating Asset Importance Consequence of Failure
streets, small community facility) local economy or the environment.
1 Not important. The asset serves a minor local function (e.g. a water pipe serving a single street, small local reserve, etc.)
Moderate. Failure would have little to no adverse impacts on customers and no impact on the local economy or environment.
5.3.2 Identification of Critical Assets
The Transport Activity provides for mobility and access for the City for the various modes of transport. The road corridor also provides access corridors for other utilities. The One Network Road Classification (ONRC) provides the road hierarchy with Arterial and Primary Collectors the more critical assets in ensuring resilient and reliable access. Council has an extensive grid network which provides many alternative routes making the network highly accessible. State Highways also bisect the City and provide the regional links together with primary access to the Port. These assets are not managed by Council. General criticality ratings are provided below: Table 5.19 Identification of Critical Assets
Asset Group Key Asset Criticality Rating
Road Pavements Arterial and Primary Collectors 3
Kerb and Channel Arterial, Primary and Secondary Drainage Paths
3
Unsealed Pavements Property Access - Some Access LV roads are singular access but limited property access
2
Footpaths CBD and shopping areas 3 Traffic Services Arterials and Primary Collectors 2
All signals controllers or SCATS full failure 4 Structures and Drainage
Tiwai Bridge (sole access to the NZAS Smelter)
5
Stead Street Stopbank - Sea protection to Airport and primary access to Otatara
5
Primary and Collector Bridges 3 Lindisfarne Bridge (critical sewer pipe access) 4 Mersey Street bridge (critical sewer pipe access)
5
Queens Drive West (watermains) 4 Carparking All assets 1 Other Assets All assets 1
Safety and security are key community outcomes and the key assets assisting in delivering these are traffic services (including street lighting). Whilst the loss of any one asset is not critical in itself, a collective long term failure would deem them as more important.
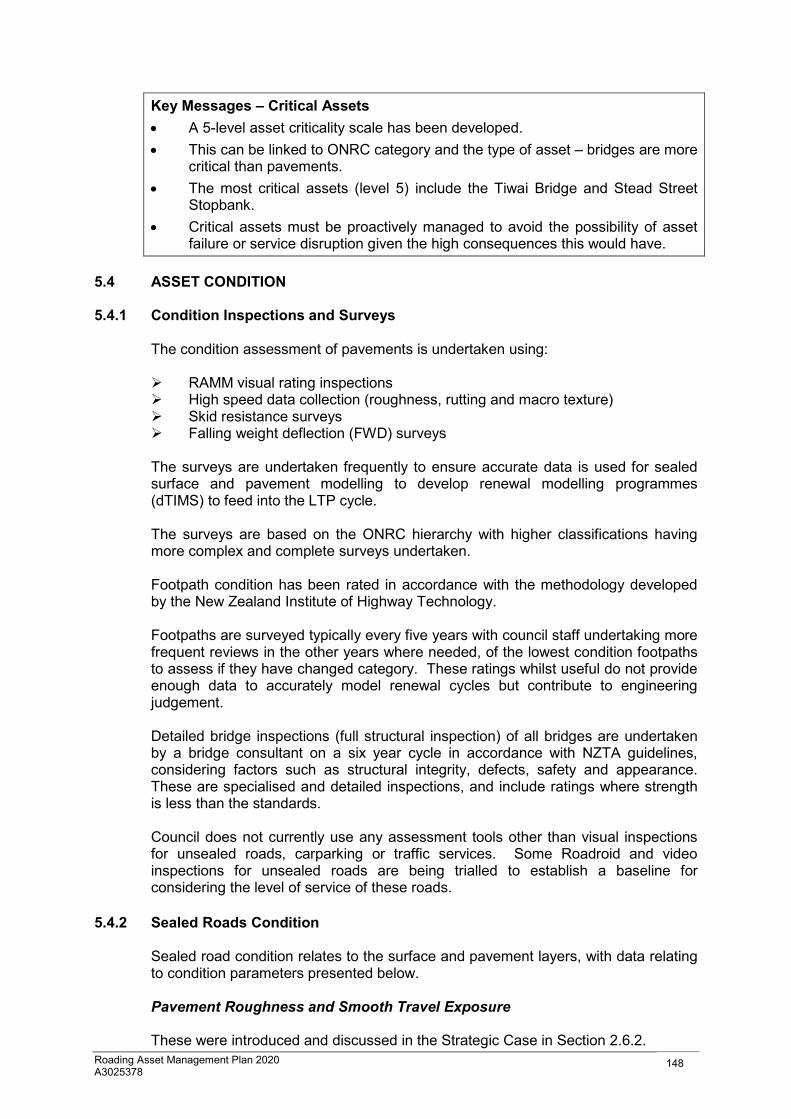
Roading Asset Management Plan 2020 A3025378
148
Key Messages – Critical Assets • A 5-level asset criticality scale has been developed. • This can be linked to ONRC category and the type of asset – bridges are more
critical than pavements. • The most critical assets (level 5) include the Tiwai Bridge and Stead Street
Stopbank. • Critical assets must be proactively managed to avoid the possibility of asset
failure or service disruption given the high consequences this would have.
5.4 ASSET CONDITION 5.4.1 Condition Inspections and Surveys
The condition assessment of pavements is undertaken using: RAMM visual rating inspections High speed data collection (roughness, rutting and macro texture) Skid resistance surveys Falling weight deflection (FWD) surveys The surveys are undertaken frequently to ensure accurate data is used for sealed surface and pavement modelling to develop renewal modelling programmes (dTIMS) to feed into the LTP cycle. The surveys are based on the ONRC hierarchy with higher classifications having more complex and complete surveys undertaken. Footpath condition has been rated in accordance with the methodology developed by the New Zealand Institute of Highway Technology. Footpaths are surveyed typically every five years with council staff undertaking more frequent reviews in the other years where needed, of the lowest condition footpaths to assess if they have changed category. These ratings whilst useful do not provide enough data to accurately model renewal cycles but contribute to engineering judgement. Detailed bridge inspections (full structural inspection) of all bridges are undertaken by a bridge consultant on a six year cycle in accordance with NZTA guidelines, considering factors such as structural integrity, defects, safety and appearance. These are specialised and detailed inspections, and include ratings where strength is less than the standards. Council does not currently use any assessment tools other than visual inspections for unsealed roads, carparking or traffic services. Some Roadroid and video inspections for unsealed roads are being trialled to establish a baseline for considering the level of service of these roads.
5.4.2 Sealed Roads Condition
Sealed road condition relates to the surface and pavement layers, with data relating to condition parameters presented below.
Pavement Roughness and Smooth Travel Exposure These were introduced and discussed in the Strategic Case in Section 2.6.2.
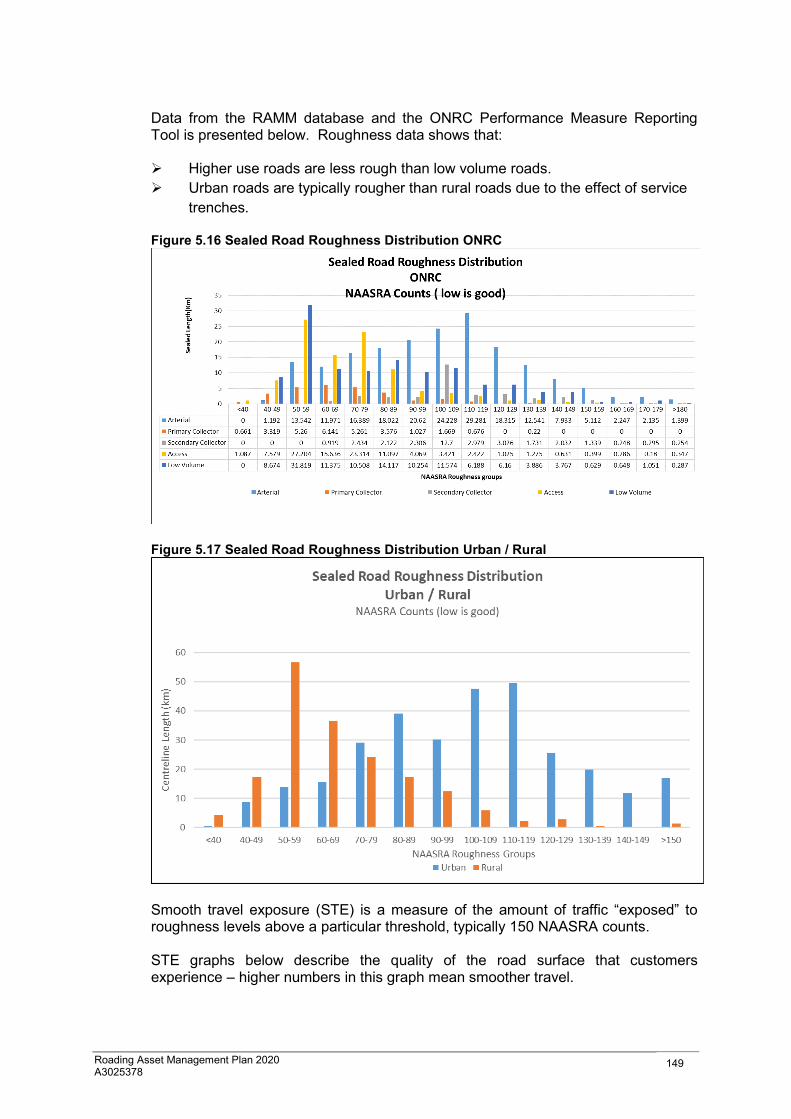
Roading Asset Management Plan 2020 A3025378
149
Data from the RAMM database and the ONRC Performance Measure Reporting Tool is presented below. Roughness data shows that: Higher use roads are less rough than low volume roads. Urban roads are typically rougher than rural roads due to the effect of service
trenches.
Figure 5.16 Sealed Road Roughness Distribution ONRC
Figure 5.17 Sealed Road Roughness Distribution Urban / Rural
Smooth travel exposure (STE) is a measure of the amount of traffic “exposed” to roughness levels above a particular threshold, typically 150 NAASRA counts. STE graphs below describe the quality of the road surface that customers experience – higher numbers in this graph mean smoother travel.
Roading Asset Management Plan 2020 A3025378
150
It can be seen from the STE trends that Invercargill is performing well against its peer groups and similar to national averages, as well as over time and across all hierarchy classes. Peak roughness is also a good indicator and again Invercargill performs well against its peer group. Longer term results show that Invercargill has had well performing assets for many years. However, customer expectations as communicated through the customer survey indicate that residents have an expectation for even smoother roads. Given the trends, the direction is to maintain, not improve. Better education and communication to residents is seen as one way to reduce the expectation gap that still exists and was highlighted in previous plans. Unfortunately, customers focus on specific locations and this is understood to cloud the customer survey results. Figure 5.18 Smooth Travel Exposure
Figure 5.19 Amenity Customer Outcome 2: Peak Roughness - Urban Sealed Roads
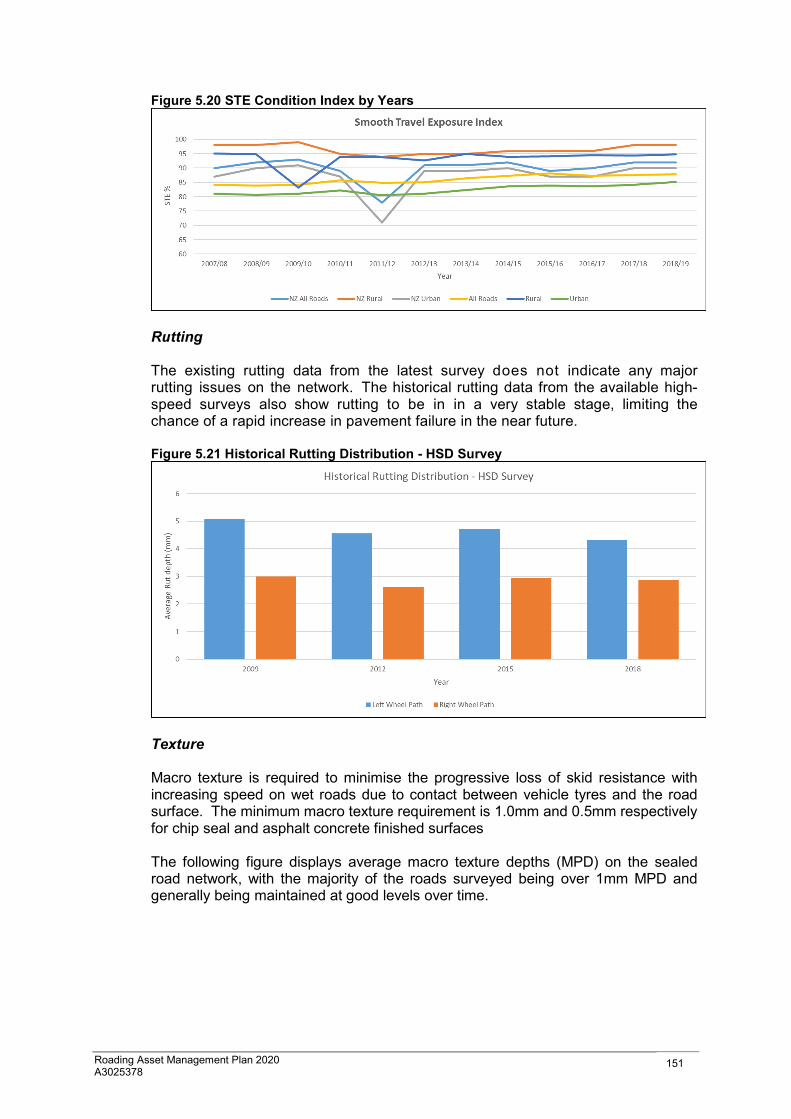
Roading Asset Management Plan 2020 A3025378
151
Figure 5.20 STE Condition Index by Years
Rutting
The existing rutting data from the latest survey does not indicate any major rutting issues on the network. The historical rutting data from the available high-speed surveys also show rutting to be in in a very stable stage, limiting the chance of a rapid increase in pavement failure in the near future. Figure 5.21 Historical Rutting Distribution - HSD Survey
Texture Macro texture is required to minimise the progressive loss of skid resistance with increasing speed on wet roads due to contact between vehicle tyres and the road surface. The minimum macro texture requirement is 1.0mm and 0.5mm respectively for chip seal and asphalt concrete finished surfaces The following figure displays average macro texture depths (MPD) on the sealed road network, with the majority of the roads surveyed being over 1mm MPD and generally being maintained at good levels over time.
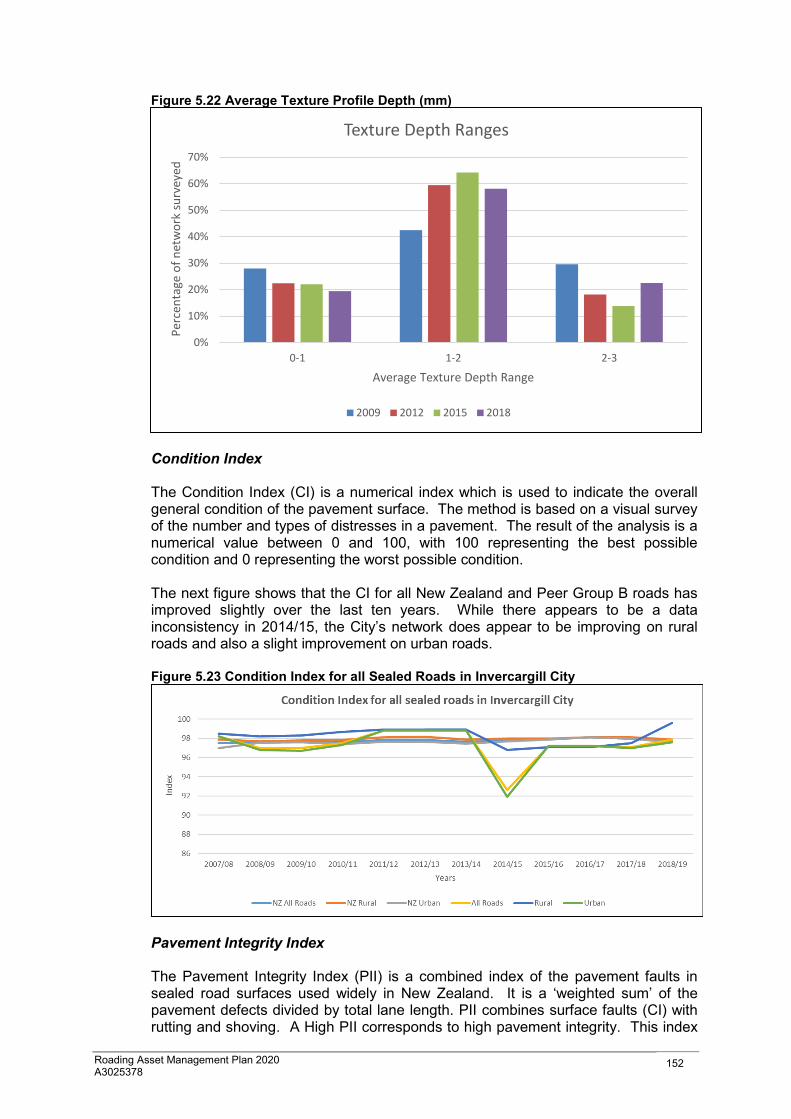
Roading Asset Management Plan 2020 A3025378
152
Figure 5.22 Average Texture Profile Depth (mm)
Condition Index The Condition Index (CI) is a numerical index which is used to indicate the overall general condition of the pavement surface. The method is based on a visual survey of the number and types of distresses in a pavement. The result of the analysis is a numerical value between 0 and 100, with 100 representing the best possible condition and 0 representing the worst possible condition. The next figure shows that the CI for all New Zealand and Peer Group B roads has improved slightly over the last ten years. While there appears to be a data inconsistency in 2014/15, the City’s network does appear to be improving on rural roads and also a slight improvement on urban roads. Figure 5.23 Condition Index for all Sealed Roads in Invercargill City
Pavement Integrity Index The Pavement Integrity Index (PII) is a combined index of the pavement faults in sealed road surfaces used widely in New Zealand. It is a ‘weighted sum’ of the pavement defects divided by total lane length. PII combines surface faults (CI) with rutting and shoving. A High PII corresponds to high pavement integrity. This index
0%
10%
20%
30%
40%
50%
60%
70%
0‐1 1‐2 2‐3
Perc
enta
ge o
f net
wor
k su
rvey
ed
Average Texture Depth Range
Texture Depth Ranges
2009 2012 2015 2018
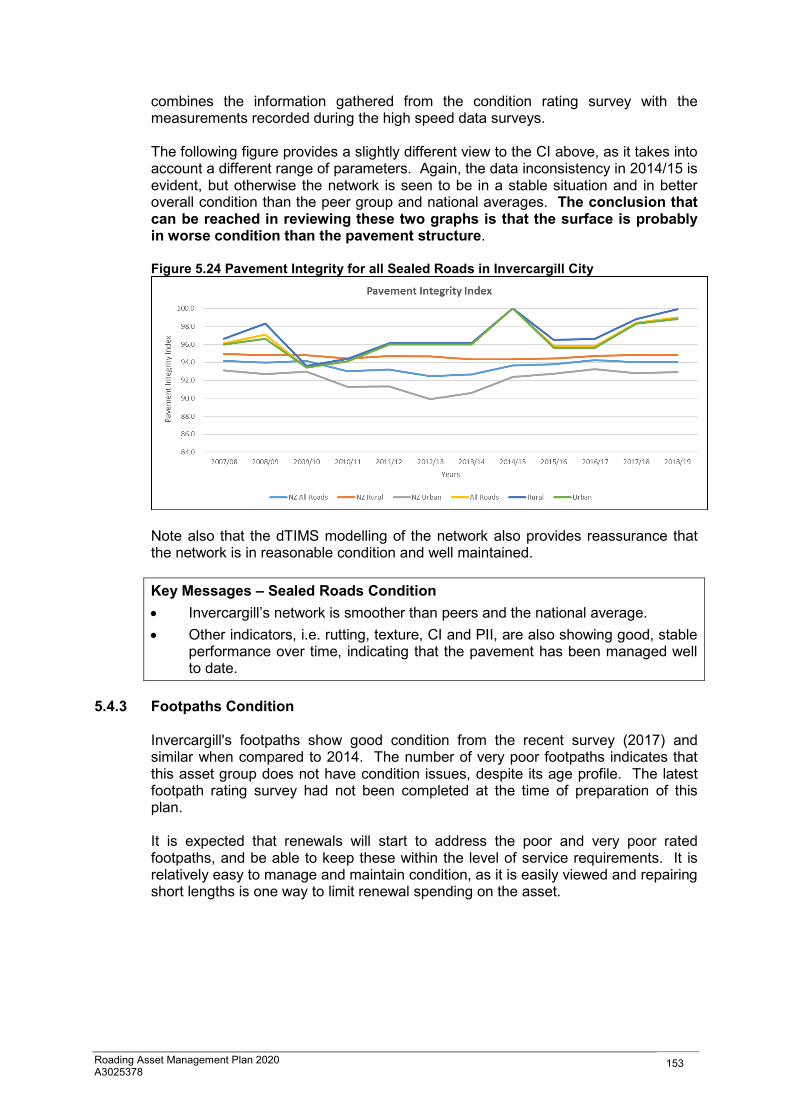
Roading Asset Management Plan 2020 A3025378
153
combines the information gathered from the condition rating survey with the measurements recorded during the high speed data surveys. The following figure provides a slightly different view to the CI above, as it takes into account a different range of parameters. Again, the data inconsistency in 2014/15 is evident, but otherwise the network is seen to be in a stable situation and in better overall condition than the peer group and national averages. The conclusion that can be reached in reviewing these two graphs is that the surface is probably in worse condition than the pavement structure. Figure 5.24 Pavement Integrity for all Sealed Roads in Invercargill City
Note also that the dTIMS modelling of the network also provides reassurance that the network is in reasonable condition and well maintained. Key Messages – Sealed Roads Condition • Invercargill’s network is smoother than peers and the national average. • Other indicators, i.e. rutting, texture, CI and PII, are also showing good, stable
performance over time, indicating that the pavement has been managed well to date.
5.4.3 Footpaths Condition
Invercargill's footpaths show good condition from the recent survey (2017) and similar when compared to 2014. The number of very poor footpaths indicates that this asset group does not have condition issues, despite its age profile. The latest footpath rating survey had not been completed at the time of preparation of this plan. It is expected that renewals will start to address the poor and very poor rated footpaths, and be able to keep these within the level of service requirements. It is relatively easy to manage and maintain condition, as it is easily viewed and repairing short lengths is one way to limit renewal spending on the asset.
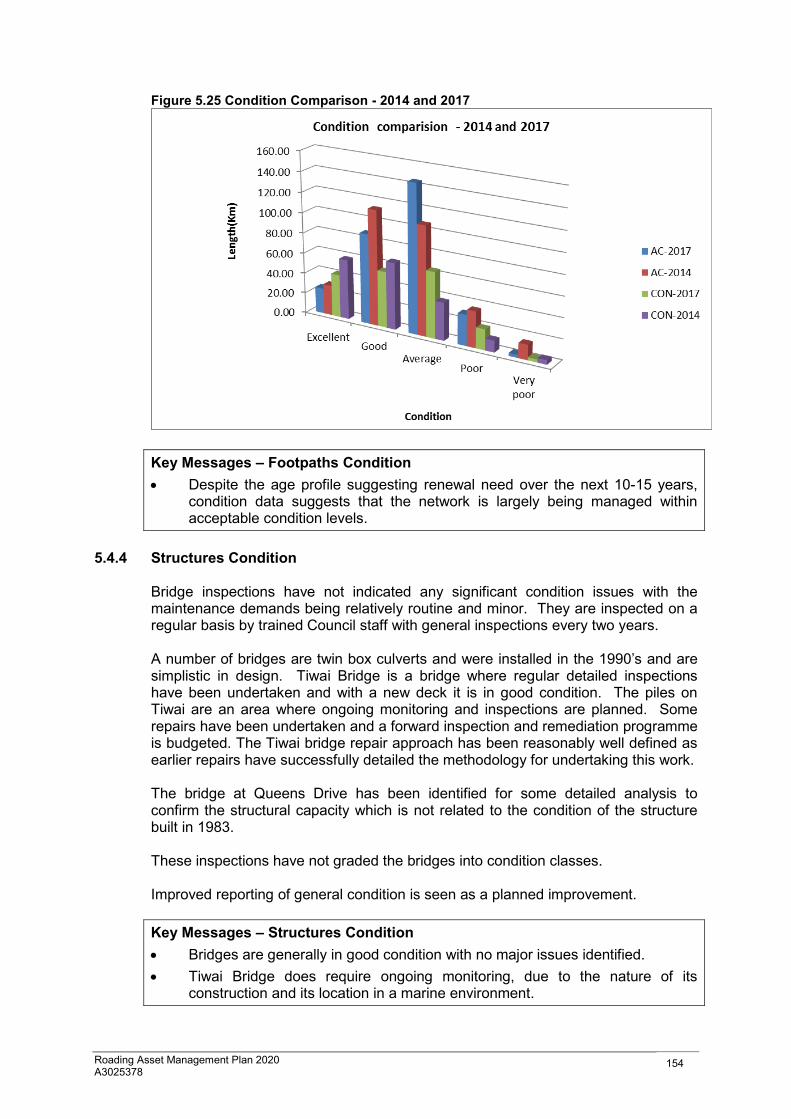
Roading Asset Management Plan 2020 A3025378
154
Figure 5.25 Condition Comparison - 2014 and 2017
Key Messages – Footpaths Condition • Despite the age profile suggesting renewal need over the next 10-15 years,
condition data suggests that the network is largely being managed within acceptable condition levels.
5.4.4 Structures Condition
Bridge inspections have not indicated any significant condition issues with the maintenance demands being relatively routine and minor. They are inspected on a regular basis by trained Council staff with general inspections every two years. A number of bridges are twin box culverts and were installed in the 1990’s and are simplistic in design. Tiwai Bridge is a bridge where regular detailed inspections have been undertaken and with a new deck it is in good condition. The piles on Tiwai are an area where ongoing monitoring and inspections are planned. Some repairs have been undertaken and a forward inspection and remediation programme is budgeted. The Tiwai bridge repair approach has been reasonably well defined as earlier repairs have successfully detailed the methodology for undertaking this work. The bridge at Queens Drive has been identified for some detailed analysis to confirm the structural capacity which is not related to the condition of the structure built in 1983. These inspections have not graded the bridges into condition classes. Improved reporting of general condition is seen as a planned improvement. Key Messages – Structures Condition • Bridges are generally in good condition with no major issues identified. • Tiwai Bridge does require ongoing monitoring, due to the nature of its
construction and its location in a marine environment.
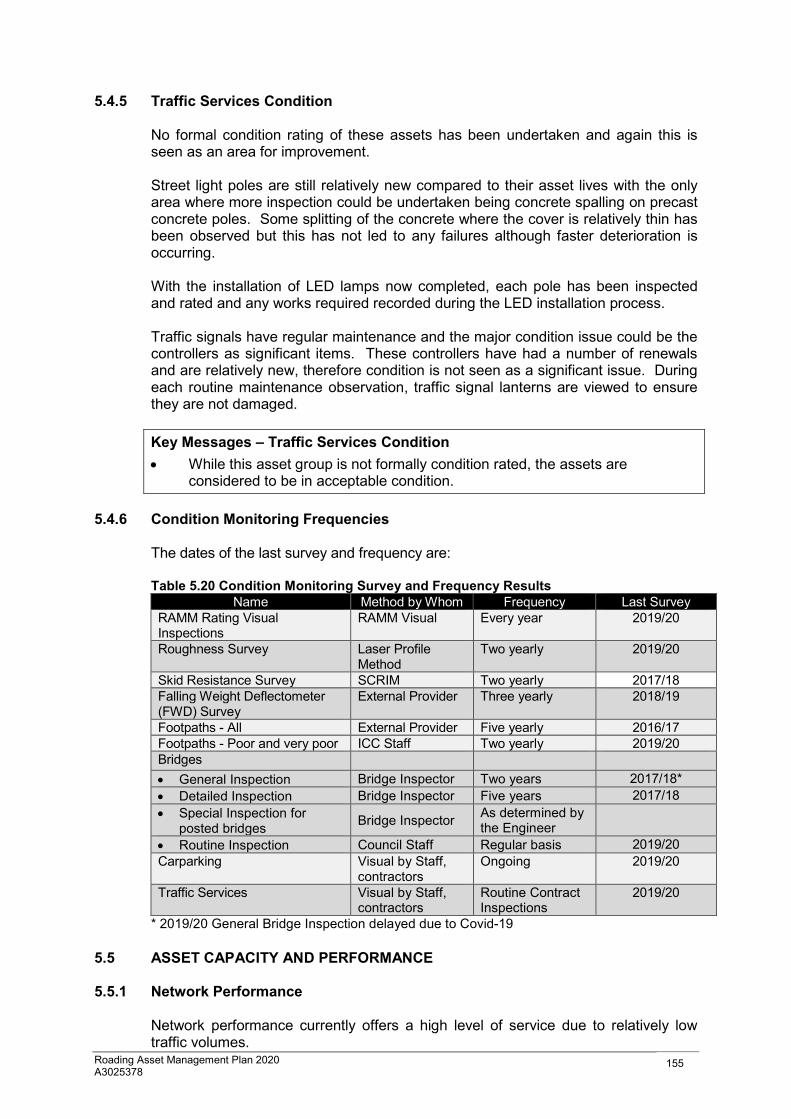
Roading Asset Management Plan 2020 A3025378
155
5.4.5 Traffic Services Condition No formal condition rating of these assets has been undertaken and again this is seen as an area for improvement. Street light poles are still relatively new compared to their asset lives with the only area where more inspection could be undertaken being concrete spalling on precast concrete poles. Some splitting of the concrete where the cover is relatively thin has been observed but this has not led to any failures although faster deterioration is occurring. With the installation of LED lamps now completed, each pole has been inspected and rated and any works required recorded during the LED installation process. Traffic signals have regular maintenance and the major condition issue could be the controllers as significant items. These controllers have had a number of renewals and are relatively new, therefore condition is not seen as a significant issue. During each routine maintenance observation, traffic signal lanterns are viewed to ensure they are not damaged. Key Messages – Traffic Services Condition • While this asset group is not formally condition rated, the assets are
considered to be in acceptable condition.
5.4.6 Condition Monitoring Frequencies The dates of the last survey and frequency are:
Table 5.20 Condition Monitoring Survey and Frequency Results Name Method by Whom Frequency Last Survey
RAMM Rating Visual Inspections
RAMM Visual Every year 2019/20
Roughness Survey Laser Profile Method
Two yearly 2019/20
Skid Resistance Survey SCRIM Two yearly 2017/18 Falling Weight Deflectometer (FWD) Survey
External Provider Three yearly 2018/19
Footpaths - All External Provider Five yearly 2016/17 Footpaths - Poor and very poor ICC Staff Two yearly 2019/20 Bridges • General Inspection Bridge Inspector Two years 2017/18* • Detailed Inspection Bridge Inspector Five years 2017/18 • Special Inspection for
posted bridges Bridge Inspector As determined by the Engineer
• Routine Inspection Council Staff Regular basis 2019/20 Carparking Visual by Staff,
contractors Ongoing 2019/20
Traffic Services Visual by Staff, contractors
Routine Contract Inspections
2019/20
* 2019/20 General Bridge Inspection delayed due to Covid-19
5.5 ASSET CAPACITY AND PERFORMANCE 5.5.1 Network Performance
Network performance currently offers a high level of service due to relatively low traffic volumes.
Roading Asset Management Plan 2020 A3025378
156
Historic traffic modelling has indicated that most intersections operate at a high level of service with the greatest pressures where they join to State Highways (Gabites Porter Modelling Reports 2011). An updated model is an improvement planned to continue to be able to monitor performance. A Network Operating Framework, is being undertaken in conjunction with Waka Kotahi NZ Transport Agency, to establish a clear functional approach for the network, including active transport and public transport modes, and make explaining the ONRC functions of roads clearer to stakeholders. It would also assist with defining priority and providing input to establishing bypass roads and how the traffic, in particular the freight element, can effectively access and pass through Invercargill to the Bluff Port and other commercial areas. This will provide a better 10 year network focus for future plans.
5.5.2 Asset Capacity and Utilisation Pavements
The road network has wide pavements and does not have traffic capacity issue, even at peak periods. The grid network and lane configurations provide capacity well in excess of demand. Travel times and reliability of travel indicate that Invercargill is well serviced by the roading network layout. No problem statement was identified which related to capacity or reliability. Further work is required to monitor pavement strength capacity for heavy vehicles (50 Max and HPMV) as more access is utilised across the network. There has not been too much demand for heavy vehicles on unsealed pavements as good link roads are available, so these pavements have not been overly tested by increased loads. Requests for travel from the transport industry have been mostly achieved. The State Highway provides a key through link for heavy vehicles for the City.
Structures Bridges and culverts have sufficient strength on important transport routes allowing the use of 50Max vehicles across the network and HPMV on selected key corridors to access their destinations.
Drainage Drainage capacity has not been a significant issue and surface flooding has been relatively minimal; where this occurs it is most often associated with detritus over sump and entry grates and a few under sized culverts. Some connections are identified as failing due to age but these are repaired as a maintenance item rather than as a system wide renewal. As stormwater pipe renewals are undertaken, sumps and connections are reviewed and replaced as required. Culverts will need to be monitored as they are a key drainage link in rural areas.
Carparking
Carparking is provided in all CBD areas and utilisation surveys indicate that parking is underutilised except for very short periods in specific locations. The perception of retailers is potentially different but Invercargill has an expectation that a carpark will be available outside any business. The Leven Street Buildings are underutilised by casual parking and this has seen a shift to offer permit spaces to secure income.
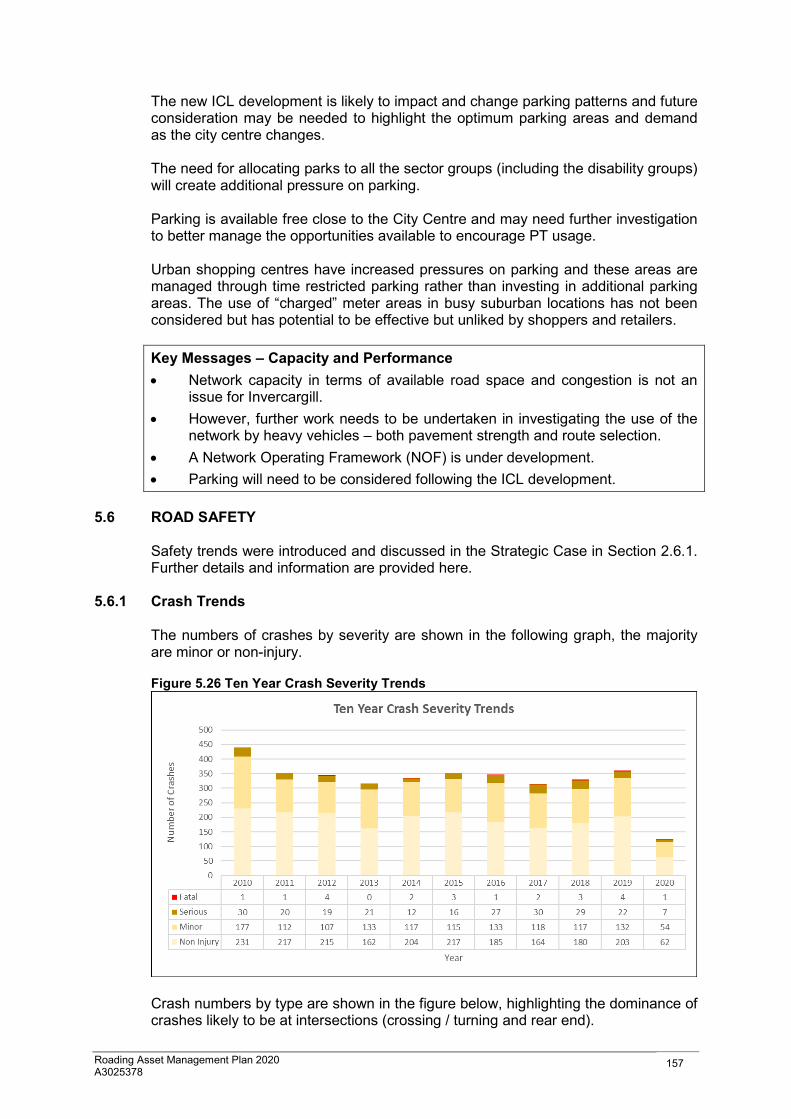
Roading Asset Management Plan 2020 A3025378
157
The new ICL development is likely to impact and change parking patterns and future consideration may be needed to highlight the optimum parking areas and demand as the city centre changes. The need for allocating parks to all the sector groups (including the disability groups) will create additional pressure on parking. Parking is available free close to the City Centre and may need further investigation to better manage the opportunities available to encourage PT usage. Urban shopping centres have increased pressures on parking and these areas are managed through time restricted parking rather than investing in additional parking areas. The use of “charged” meter areas in busy suburban locations has not been considered but has potential to be effective but unliked by shoppers and retailers. Key Messages – Capacity and Performance • Network capacity in terms of available road space and congestion is not an
issue for Invercargill. • However, further work needs to be undertaken in investigating the use of the
network by heavy vehicles – both pavement strength and route selection. • A Network Operating Framework (NOF) is under development. • Parking will need to be considered following the ICL development.
5.6 ROAD SAFETY Safety trends were introduced and discussed in the Strategic Case in Section 2.6.1. Further details and information are provided here.
5.6.1 Crash Trends The numbers of crashes by severity are shown in the following graph, the majority are minor or non-injury.
Figure 5.26 Ten Year Crash Severity Trends
Crash numbers by type are shown in the figure below, highlighting the dominance of crashes likely to be at intersections (crossing / turning and rear end).
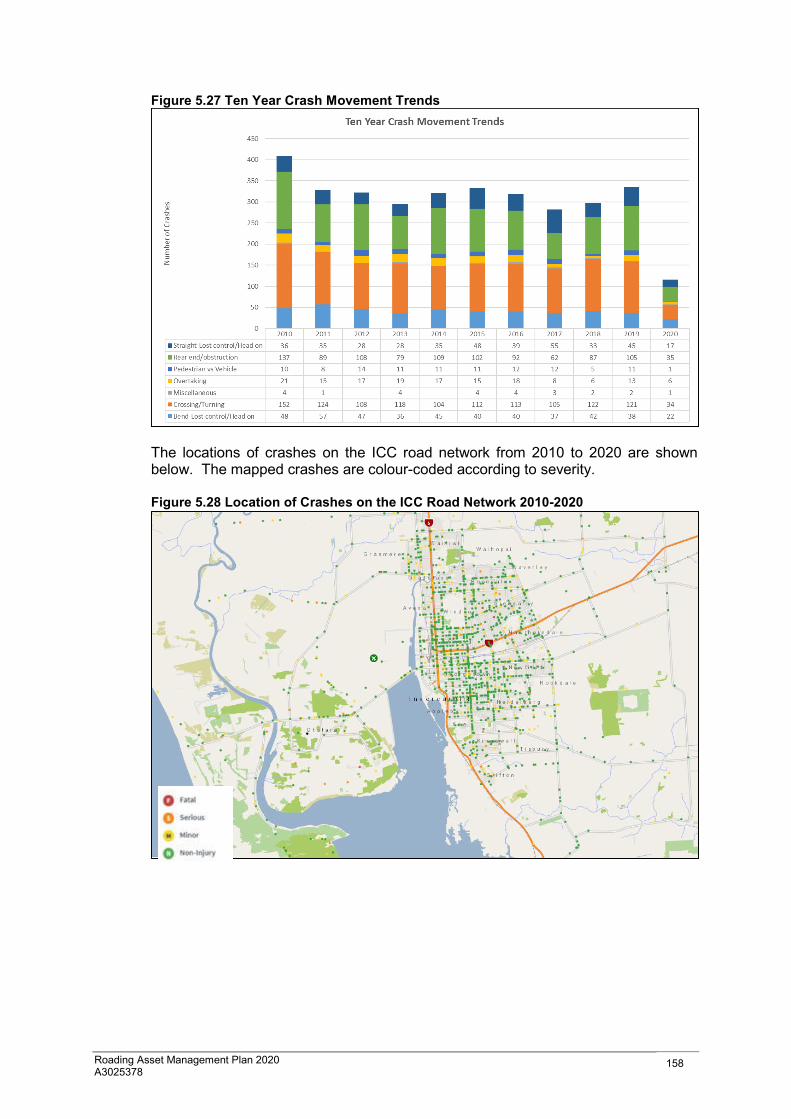
Roading Asset Management Plan 2020 A3025378
158
Figure 5.27 Ten Year Crash Movement Trends
The locations of crashes on the ICC road network from 2010 to 2020 are shown below. The mapped crashes are colour-coded according to severity. Figure 5.28 Location of Crashes on the ICC Road Network 2010-2020
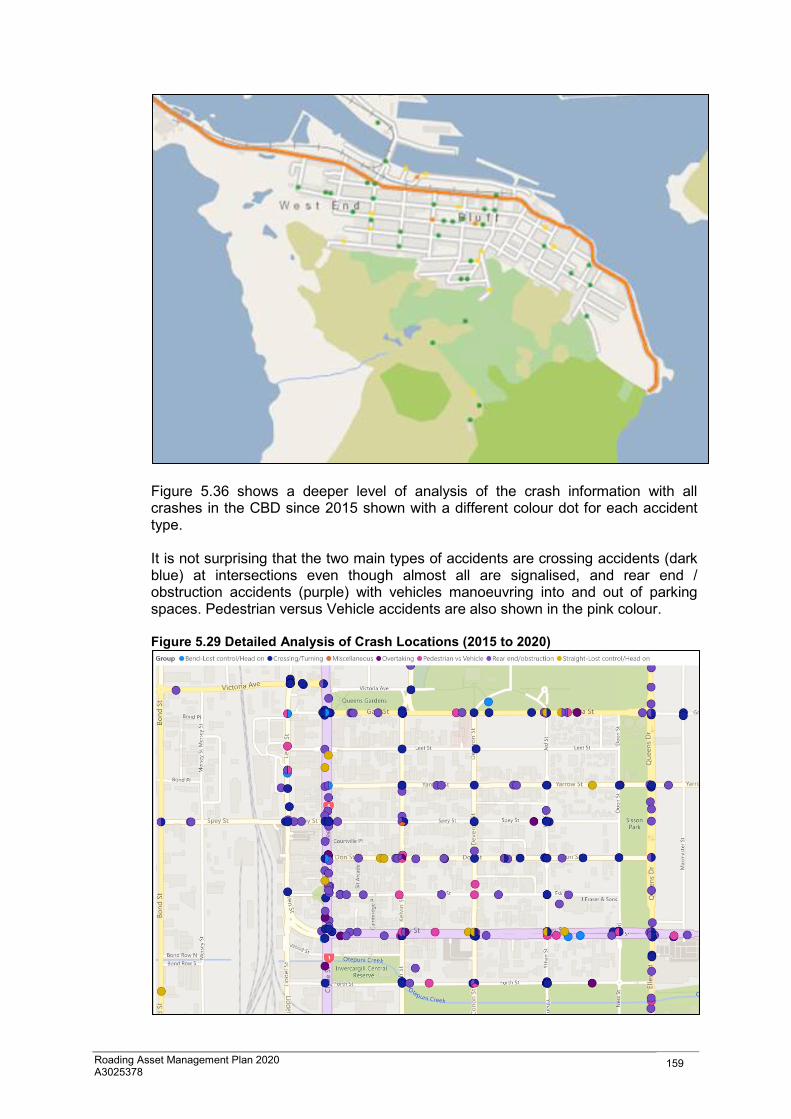
Roading Asset Management Plan 2020 A3025378
159
Figure 5.36 shows a deeper level of analysis of the crash information with all crashes in the CBD since 2015 shown with a different colour dot for each accident type. It is not surprising that the two main types of accidents are crossing accidents (dark blue) at intersections even though almost all are signalised, and rear end / obstruction accidents (purple) with vehicles manoeuvring into and out of parking spaces. Pedestrian versus Vehicle accidents are also shown in the pink colour. Figure 5.29 Detailed Analysis of Crash Locations (2015 to 2020)
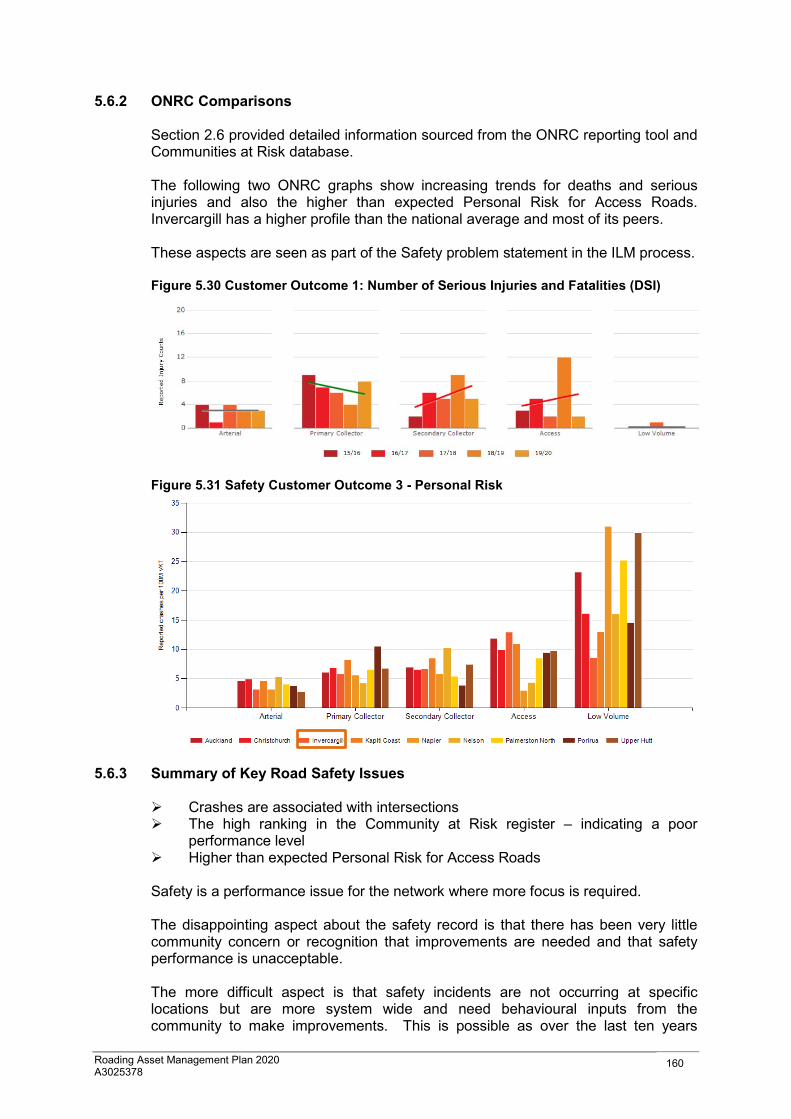
Roading Asset Management Plan 2020 A3025378
160
5.6.2 ONRC Comparisons Section 2.6 provided detailed information sourced from the ONRC reporting tool and Communities at Risk database. The following two ONRC graphs show increasing trends for deaths and serious injuries and also the higher than expected Personal Risk for Access Roads. Invercargill has a higher profile than the national average and most of its peers. These aspects are seen as part of the Safety problem statement in the ILM process. Figure 5.30 Customer Outcome 1: Number of Serious Injuries and Fatalities (DSI)
Figure 5.31 Safety Customer Outcome 3 - Personal Risk
5.6.3 Summary of Key Road Safety Issues Crashes are associated with intersections The high ranking in the Community at Risk register – indicating a poor
performance level Higher than expected Personal Risk for Access Roads Safety is a performance issue for the network where more focus is required. The disappointing aspect about the safety record is that there has been very little community concern or recognition that improvements are needed and that safety performance is unacceptable. The more difficult aspect is that safety incidents are not occurring at specific locations but are more system wide and need behavioural inputs from the community to make improvements. This is possible as over the last ten years
Roading Asset Management Plan 2020 A3025378
161
Invercargill and Southland have improved in young drivers and alcohol, which does indicate with good local and national programmes it can be achieved. The Southland Councils and Waka Kotahi NZ Transport Agency need to focus on the Road to Zero campaign (from GPS 2021) and consider if the Southern Safety Influencing Group remains the appropriate mechanism for change. Key Messages – Road Safety • Additional Road Safety effort and investment is required. • Crashes are distributed throughout the city with an over-representation
associated with intersections. • The City has one of the worst rankings in the country’s Community at Risk
register. • Lack of community concern for Invercargill’s poor safety performance
nationally.
5.7 SUMMARY OF ASSET TRENDS, ISSUES AND CHALLENGES
Key trends which are seen in the network include: The network is well established and well structured. Good alignment exists with ONRC. Journeys are being undertaken on the hierarchy appropriately. Asset condition is reasonable and appropriate to the age and network use. Assets are performing well against the peer group. Financial performance is appropriate compared to peer groups. Pavements are performing appropriately and modelling indicates capacity is
available. Critical assets are generally bridges that support other asset groups. Critical assets are identified and managed. Safety risks are over represented. Some assets have spare capacity.
The key issues include: Safety improvements are needed, particularly at intersections and for
pedestrians and cyclists. Need to continue to manage maintenance and renewals to sustain the
network. A focus is needed to ensure access for heavy vehicle routes and may need to
focus some renewals on ONRC hierarchy where the traffic is directed.
In summary, Invercargill has assets which in most parts are in good condition and are generally being underutilised due to historical layouts but are robust and well managed. The asset approach is to maintain pavements and utilise methods for resurfacing and rehabilitation to minimise costs. Typically these approaches are addressing travel lanes only.
The key challenges include: The need to develop and implement a safety strategy where a community
behavioural change occurs which leads to improved and safer driving habits.
Roading Asset Management Plan 2020 A3025378
162
Safety at intersections is a trend which needs to be owned as a community responsibility and be addressed through further implementing the Safe System Approach.
Focussing on how maintenance and renewal can contribute to improvements is key to making more traction on having better outcomes. Utilising and focusing the Community programmes on the issues and align and collaborate with other Government Agencies (NZ Police, Worksafe, ACC, etc.) to ensure programmes connect and deliver suitable outcomes.
Develop an understanding of when and how technology will impact on the network and be able to respond accordingly, just in time.
The future of vehicles (eV in particular) will change a number of national approaches to congestion and safety but the impacts of these technological advances are unlikely to require significant changes in road layout or construction. As congestion is not an issue, autonomous travel will not deliver short term benefits.
Roading Asset Management Plan 2020 A3025378 163
6. Sustainability, Risk and Resilience 6.1 SUSTAINABILITY
The Local Government Act requires Council to take into account the social, economic and cultural interests of people and communities, the need to maintain and enhance the quality of the environment and the reasonably foreseeable needs of future generations by taking a sustainable development approach. Sustainability can be defined as:
“Development which meets the needs of the present generation without compromising the future generation from meeting their own needs”
(Brundtland Report, 1987). Infrastructure assets ability to influence sustainability outcomes is highest during the planning and design phase. Asset type, location and design can significantly impact sustainability outcomes, for example, accessibility, urban form, land-use, heritage, health and wellbeing. Good planning and design can lead to improved economic and social benefits. The operation of infrastructure has ongoing impacts - particularly as they relate to energy use, and emissions, runoff, noise, light, ecological impacts, safety etc. Operations can provide ongoing employment and economic benefit. The construction of infrastructure impacts on material use, energy, water, waste, etc. Construction can provide employment, with potential to target 'social' procurement. Natural resources for roading projects are still currently available in good quality and at reasonable costs. Council currently does not have specific policy requiring the reuse of removed materials. A negative impact of ongoing renewals is the drawdown of the resource which is either quarried or from river run sources. Each of these areas both require resource consents and their future sustainability will be monitored. Remetalling of unsealed roads is one area where wise use of resources needs to be considered and monitored. The type of materials utilised is also key to the impacts on sustainability.
6.1.1 Social and Cultural
Accessibility and safety are key aspects contributing to sustainability in this area. The ILM process and associated strategic responses are intended to address concerns and improve performance of the transport system in this respect. Roading, as part of the community, will encourage the following to improve safety: Encourage a mode shift to walking and cycling Promote the shift to electric vehicles Encourage the community to manage road risk and utilise safer vehicles Promote behaviour change to driving attitudes in Invercargill
Roading Asset Management Plan 2020 A3025378
164
6.1.2 Environmental
Roading seeks to reduce consumption of resources and the effects of development on the environment. Relevant aspects of sustainable design will be considered and where appropriate incorporated into projects, including but not exclusive to: Minimise materials and waste during construction, particularly those based on
oil or derivatives. Adopt processes to minimise dust generation from unsealed roads. Sustainable materials used in construction and reuse where appropriate. Encourage and promote use of electric vehicles. Climate Change Gases – Carbon footprint. Minimise impacts of stormwater runoff and disposal. Design for adaption and resilience to hazards including climate change. The environmental challenges of managing stormwater run-off are seen as an escalating challenge. Freshwater Plans from the Regional Council will seek to better manage what comes off the road surface and this could introduce additional costs if this is required to be treated. Currently the detritus collected from the streets and stormwater runoff from sumps is expensive to dispose of to landfills and this is becoming a greater cost and concern. Dust from gravel roads is more concerning for residents as it enters water supplies and this leads to unsustainable expectations and desire for roads to be sealed.
6.1.3 Climate Change Responding to the impacts of climate change will be critical in coming years and decades as they become more apparent and intensify. A proactive approach now is necessary to ensure that wherever possible asset improvement projects and renewals that create or replace long-life assets such as bridges, structures, pavements and drainage, consider the long-term trends associated with climate change. Designs should allow for elemental sea level rise or intensification to related hazards such as rainfall wherever possible and practicable.
6.1.4 Economic and Financial
Roading as a significant infrastructural asset looks to provide the desired level of service in the most cost effective manner through the management of assets for present and future customers. The changing demographics of the community will mean that the ability to pay for some will change, so having robust and appropriate activity management in place is essential for Invercargill to remain sustainable. All asset groups will have to work together and act cohesively to ensure success. We do this by: Recognising the consumption of assets and appropriately funding it, at the
right time using the right techniques. Categorising capital versus operational expenditure and understanding how
each influences the community. Undertaking projects which are affordable and can be justified using a Better
Business Case approach. Allocating costs and preparing forecasts over the long-term (30 years or
more).
Roading Asset Management Plan 2020 A3025378
165
Ensuring a whole of life approach is used for all assets. Reporting on financial performance. Procuring resources considering market sustainability utilising best practice
contract smart buyer processes. 6.1.6 Summary of Sustainability Challenges and Issues
Key Issues:
Manage and respond to the impacts of climate change. Encourage the community to manage road risk. Promote behaviour change to driving attitudes in Invercargill. Adopt processes to minimise dust generation from unsealed roads. Minimise impacts of stormwater runoff and disposal. Undertake projects at the right time using a Better Business Case approach.
Key Challenges: Encourage a mode shift to walking and cycling. Encourage the community to manage road risk and utilise safer vehicles. Design for adaption and resilience to hazards including climate change. Recognising the consumption of assets and appropriately funding it, at the
right time. Procuring resources considering market sustainability utilising best practice
contract smart buyer processes.
6.2 RISK
The Council recognises that it is obliged to manage effectively and to review regularly its risks at a strategic, operational and project level. The Council has done this by developing a Risk Management Framework and a range of risk management processes that apply across the organisation. Risk assessment is a major consideration in planning and budgeting processes at all levels within the Council. Risks must be considered and documented as part of the justification for undertaking our activities. Risk assessment and monitoring must form part of the management of operational activities. The Chief Executive and the Council encourage the taking of controlled risks to better improve the effectiveness and efficiency of the services and functions that the Council provides on behalf of the community, provided the resultant risk exposures are acceptable.
6.2.1 Risk Framework / Standard
Council has previously adopted a risk management process that is consistent with Australian/New Zealand Standard AS/NZS ISO 31000:2009 which defines risk assessment and management. The key risk criteria adopted for assessing the consequences of identified risks are: Community Health and Safety. Loss of Service – Extent / Duration. Service Delivery – Customer Impact. Invercargill City Council Financial Impact. Financial Community. Corporate Image and Reputation. Legal Compliance.
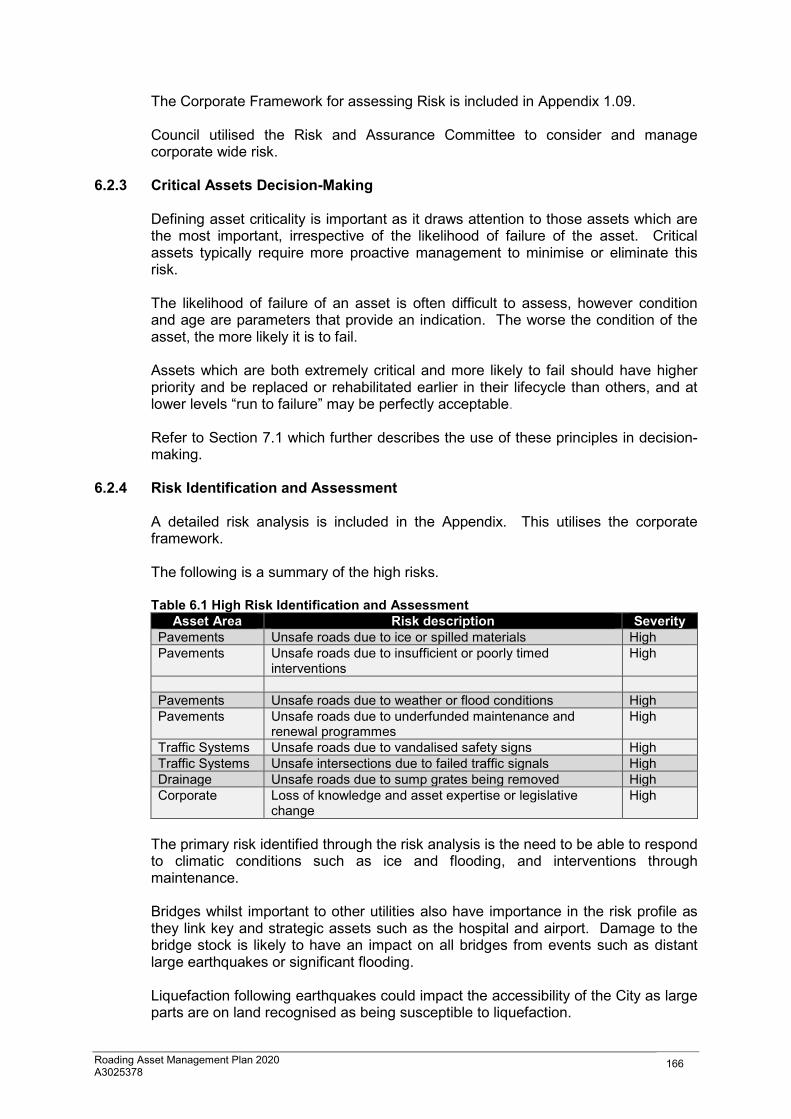
Roading Asset Management Plan 2020 A3025378
166
The Corporate Framework for assessing Risk is included in Appendix 1.09. Council utilised the Risk and Assurance Committee to consider and manage corporate wide risk.
6.2.3 Critical Assets Decision-Making
Defining asset criticality is important as it draws attention to those assets which are the most important, irrespective of the likelihood of failure of the asset. Critical assets typically require more proactive management to minimise or eliminate this risk. The likelihood of failure of an asset is often difficult to assess, however condition and age are parameters that provide an indication. The worse the condition of the asset, the more likely it is to fail. Assets which are both extremely critical and more likely to fail should have higher priority and be replaced or rehabilitated earlier in their lifecycle than others, and at lower levels “run to failure” may be perfectly acceptable. Refer to Section 7.1 which further describes the use of these principles in decision-making.
6.2.4 Risk Identification and Assessment
A detailed risk analysis is included in the Appendix. This utilises the corporate framework. The following is a summary of the high risks. Table 6.1 High Risk Identification and Assessment
Asset Area Risk description Severity Pavements Unsafe roads due to ice or spilled materials High Pavements Unsafe roads due to insufficient or poorly timed
interventions High
Pavements Unsafe roads due to weather or flood conditions High Pavements Unsafe roads due to underfunded maintenance and
renewal programmes High
Traffic Systems Unsafe roads due to vandalised safety signs High Traffic Systems Unsafe intersections due to failed traffic signals High Drainage Unsafe roads due to sump grates being removed High Corporate Loss of knowledge and asset expertise or legislative
change High
The primary risk identified through the risk analysis is the need to be able to respond to climatic conditions such as ice and flooding, and interventions through maintenance. Bridges whilst important to other utilities also have importance in the risk profile as they link key and strategic assets such as the hospital and airport. Damage to the bridge stock is likely to have an impact on all bridges from events such as distant large earthquakes or significant flooding. Liquefaction following earthquakes could impact the accessibility of the City as large parts are on land recognised as being susceptible to liquefaction.
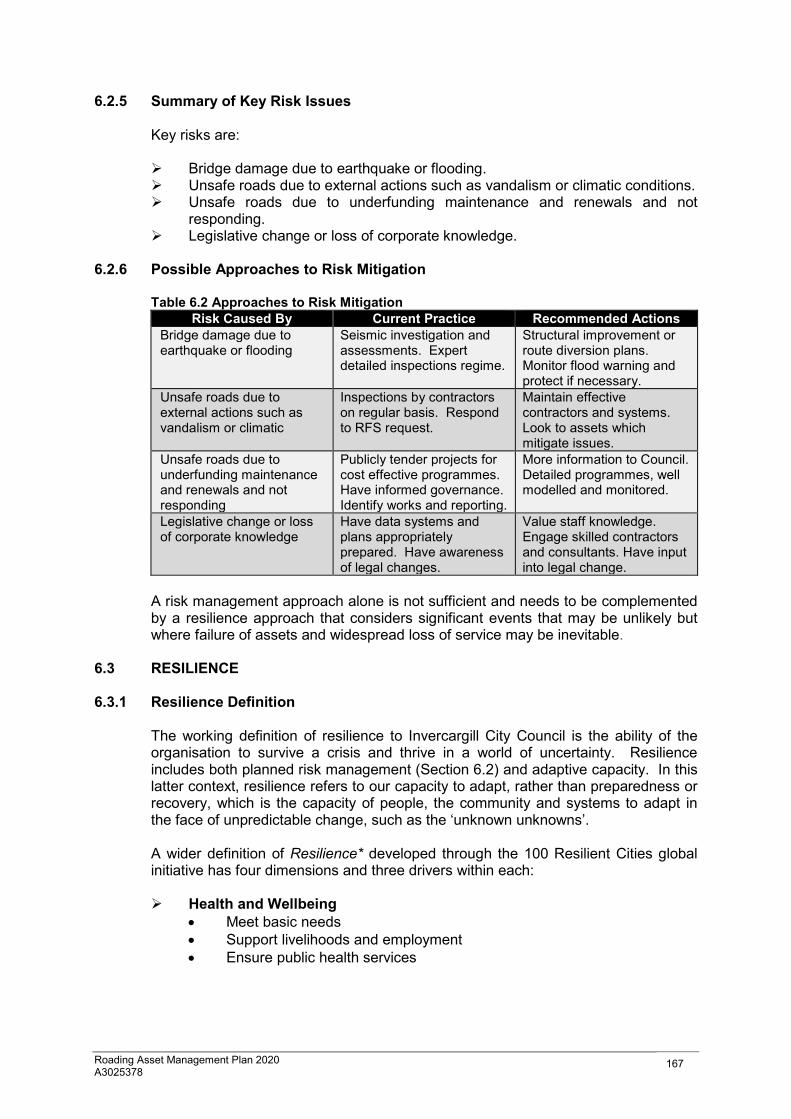
Roading Asset Management Plan 2020 A3025378
167
6.2.5 Summary of Key Risk Issues Key risks are: Bridge damage due to earthquake or flooding. Unsafe roads due to external actions such as vandalism or climatic conditions. Unsafe roads due to underfunding maintenance and renewals and not
responding. Legislative change or loss of corporate knowledge.
6.2.6 Possible Approaches to Risk Mitigation
Table 6.2 Approaches to Risk Mitigation
Risk Caused By Current Practice Recommended Actions Bridge damage due to earthquake or flooding
Seismic investigation and assessments. Expert detailed inspections regime.
Structural improvement or route diversion plans. Monitor flood warning and protect if necessary.
Unsafe roads due to external actions such as vandalism or climatic
Inspections by contractors on regular basis. Respond to RFS request.
Maintain effective contractors and systems. Look to assets which mitigate issues.
Unsafe roads due to underfunding maintenance and renewals and not responding
Publicly tender projects for cost effective programmes. Have informed governance. Identify works and reporting.
More information to Council. Detailed programmes, well modelled and monitored.
Legislative change or loss of corporate knowledge
Have data systems and plans appropriately prepared. Have awareness of legal changes.
Value staff knowledge. Engage skilled contractors and consultants. Have input into legal change.
A risk management approach alone is not sufficient and needs to be complemented by a resilience approach that considers significant events that may be unlikely but where failure of assets and widespread loss of service may be inevitable.
6.3 RESILIENCE
6.3.1 Resilience Definition The working definition of resilience to Invercargill City Council is the ability of the organisation to survive a crisis and thrive in a world of uncertainty. Resilience includes both planned risk management (Section 6.2) and adaptive capacity. In this latter context, resilience refers to our capacity to adapt, rather than preparedness or recovery, which is the capacity of people, the community and systems to adapt in the face of unpredictable change, such as the ‘unknown unknowns’. A wider definition of Resilience* developed through the 100 Resilient Cities global initiative has four dimensions and three drivers within each: Health and Wellbeing
• Meet basic needs • Support livelihoods and employment • Ensure public health services
Roading Asset Management Plan 2020 A3025378
168
Economy and Society • Foster economic prosperity • Ensure social stability, security and justice • Promote cohesive and engaged communities
Infrastructure and Environment
• Provide reliable communication and mobility • Ensure continuity of critical services • Provide and enhance natural and man-made assets
Leadership and Strategy
• Promote leadership and effective management • Empower a broad range of stakeholders • Foster long-term and integrated planning
* http://www.100resilientcities.org/resilience
These attributes provide a useful list for considering the effectiveness of strategies and activities in creating a more resilient city.
6.3.2 Business Continuity and Emergency Response Arrangements Emergency Management Southland (EMS) is a shared service with other Southland Councils that delivers a structured approach to civil defence emergency management (CDEM) as required by legislation. Each Council is responsible to provide trained staff into the team when requested and therefore enabling it to have a wider resource base when necessary. A specifically designed venue has been setup for the operation at Price Street for all the Councils that has three to four full time CDEM staff coordinating the response. Basic continuity planning has been initiated at Invercargill City Council but further development is required to establish a robust and reliable set of response processes. Staff have a good understanding but the processes need to be documented. These are needed to be able to respond and manage Council assets in a sustainable manner in the event of a significant event where potentially all of Southland is affected. Staff have the knowledge, and have participated in national training exercises and understand what is needed. Further robust documentation of process is needed for the future. Basic plans are in place with an agreed establishment process, alternative base location and allocated positions but greater detail is needed. Invercargill has also had a lifelines plan in place for several years. This plan assesses the vulnerability of all lifeline utility infrastructure to natural hazards and identifies where asset strengthening or other reduction measures may be needed. This includes activities such as the seismic strengthening of bridges and structures. The Council continues to work at a Regional level to advance its planning provisions. These plans recognise the isolation that Invercargill could experience in a major event such as the South Island Alpine Fault earthquake, an event that would affect and disrupt the whole South Island and parts of the North Island. Invercargill also is reliant on the State Highways to connect and whilst travel may be possible across the City, most consumable goods (food, fuel, etc) are transported via the State Highway system from Christchurch or Dunedin.
Roading Asset Management Plan 2020 A3025378
169
6.3.3 Current and Desired Resilience Assessment
Resilience is a topic that we are learning more about from events such as the Christchurch, Kaikoura and Wellington earthquakes; Invercargill City Council is seeking to make our organisation and infrastructure more resilient. Resilience will be part of the improvement process planned in 21-24.
No resilience assessment has yet been undertaken relating to roading. Some resilience consideration has been undertaken on part of the insurance portfolio.
6.3.4 Summary of Resilience Issues and Challenges
Key Messages – Risks and Resilience • Further detailed business planning is needed to enable an effective Council
response to emergency events that affect the City, the Southland region, or a more widespread area.
• Resources from EMS provide a Southland-wide response in the event of a civil defence emergency, and are able to support a City-led response if required.
• Southland is isolated and is susceptible to significant natural disaster events. • Invercargill is reliant on the State Highway network to be operable for the
supply of most basic commodities to the city. 6.4 NEGATIVE EFFECTS
There are a number of unavoidable consequences of the Road Network activity which need to be managed to ensure a sustainable service with minimal negative effects. Negative effects that the activity may have on the social, economic, environmental or cultural wellbeing of the community include: The number (and cost) of people killed or injured on roads each year. Effects of poor quality roading assets and personal security when using City’s
roading network. Environmental degradation, delays and detours resulting from new
construction, maintenance and utility works on the local road network. Impacts of major transport infrastructure projects on adjacent residents and
environment such as excessive noise and vibration. Dust nuisance on unsealed roads and the quality of stormwater from roads
that discharges into adjacent coastal or other waters. Hazardous material spills within the road corridor or transport facility. Cost escalations due to oil prices increases and inflation rates. Health and safety risks associated with the construction, maintenance or
operation of transportation infrastructure. The impact on public health from the reliance on cars. Impact on residents due to noise and other effects due to road classification
and use. The economic cost to the community (or to the National or Regional economy)
as a result of road congestion. The extent to which the roading network impacts on the quality of life of a
particular community (or commercial area). Gaseous discharges from motor vehicles including greenhouse gases.
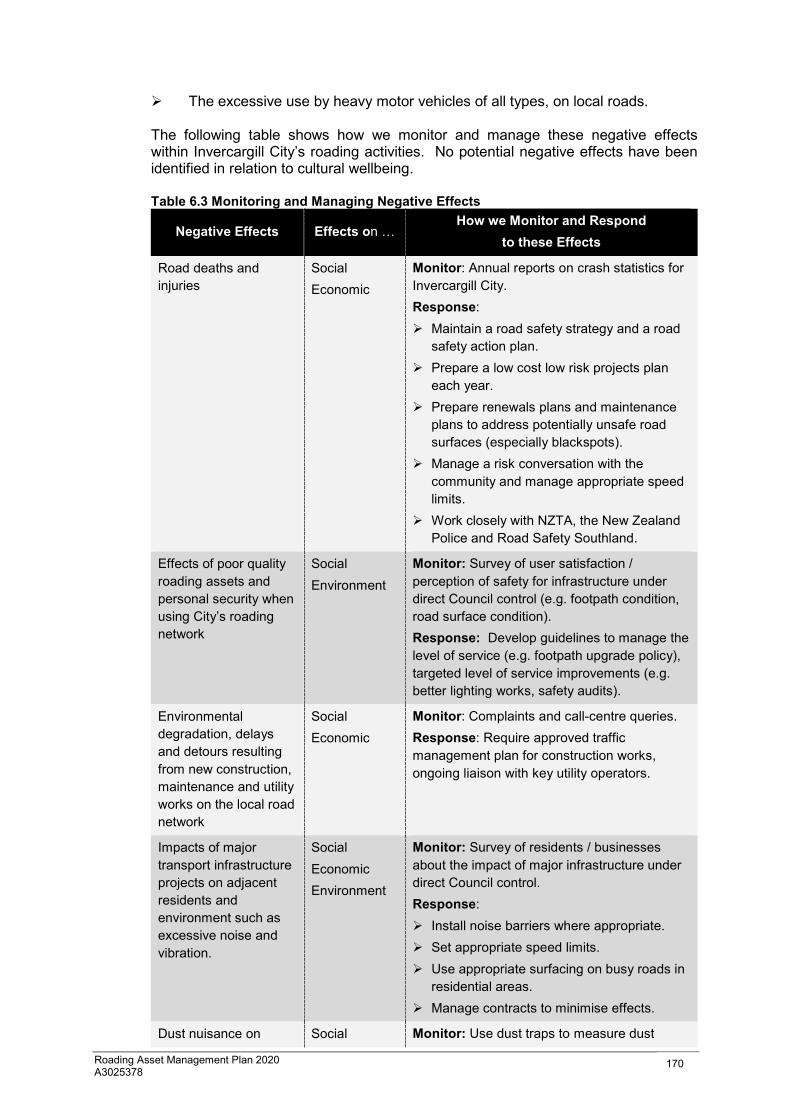
Roading Asset Management Plan 2020 A3025378
170
The excessive use by heavy motor vehicles of all types, on local roads. The following table shows how we monitor and manage these negative effects within Invercargill City’s roading activities. No potential negative effects have been identified in relation to cultural wellbeing. Table 6.3 Monitoring and Managing Negative Effects
Negative Effects Effects on … How we Monitor and Respond
to these Effects
Road deaths and injuries
Social Economic
Monitor: Annual reports on crash statistics for Invercargill City. Response: Maintain a road safety strategy and a road
safety action plan. Prepare a low cost low risk projects plan
each year. Prepare renewals plans and maintenance
plans to address potentially unsafe road surfaces (especially blackspots).
Manage a risk conversation with the community and manage appropriate speed limits.
Work closely with NZTA, the New Zealand Police and Road Safety Southland.
Effects of poor quality roading assets and personal security when using City’s roading network
Social Environment
Monitor: Survey of user satisfaction / perception of safety for infrastructure under direct Council control (e.g. footpath condition, road surface condition). Response: Develop guidelines to manage the level of service (e.g. footpath upgrade policy), targeted level of service improvements (e.g. better lighting works, safety audits).
Environmental degradation, delays and detours resulting from new construction, maintenance and utility works on the local road network
Social Economic
Monitor: Complaints and call-centre queries. Response: Require approved traffic management plan for construction works, ongoing liaison with key utility operators.
Impacts of major transport infrastructure projects on adjacent residents and environment such as excessive noise and vibration.
Social Economic Environment
Monitor: Survey of residents / businesses about the impact of major infrastructure under direct Council control. Response: Install noise barriers where appropriate. Set appropriate speed limits. Use appropriate surfacing on busy roads in
residential areas. Manage contracts to minimise effects.
Dust nuisance on Social Monitor: Use dust traps to measure dust
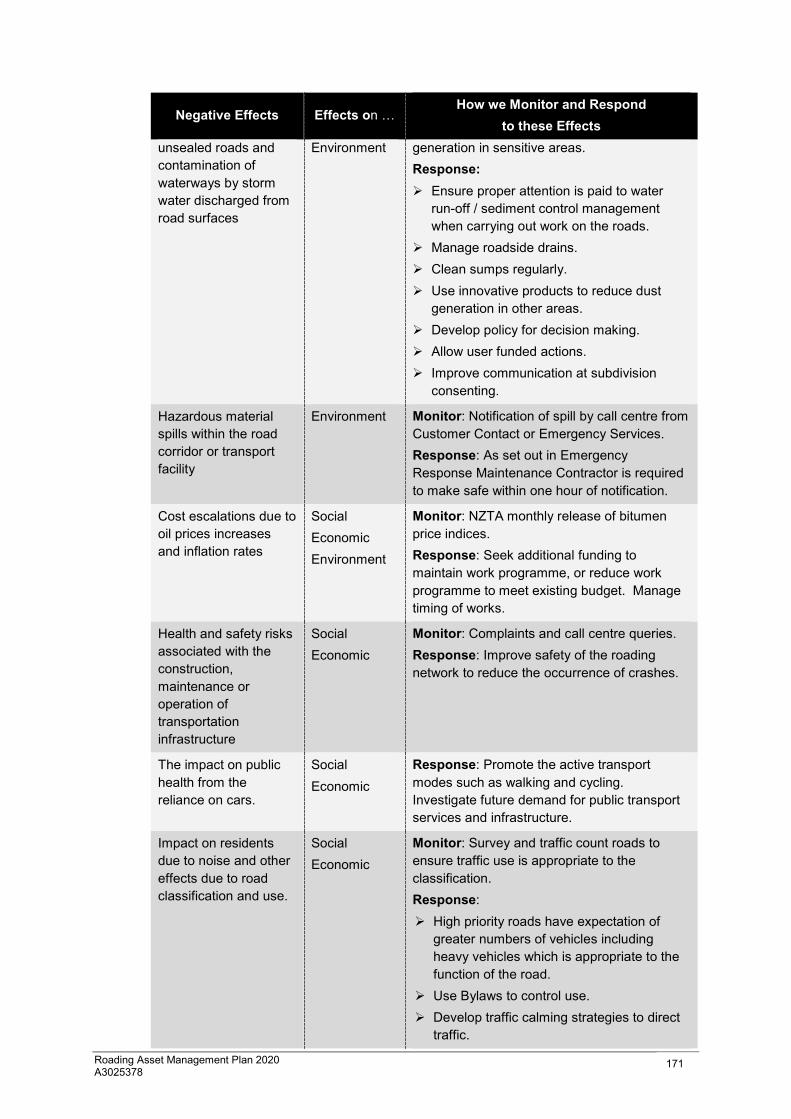
Roading Asset Management Plan 2020 A3025378
171
Negative Effects Effects on … How we Monitor and Respond
to these Effects unsealed roads and contamination of waterways by storm water discharged from road surfaces
Environment generation in sensitive areas. Response: Ensure proper attention is paid to water
run-off / sediment control management when carrying out work on the roads.
Manage roadside drains. Clean sumps regularly. Use innovative products to reduce dust
generation in other areas. Develop policy for decision making. Allow user funded actions. Improve communication at subdivision
consenting.
Hazardous material spills within the road corridor or transport facility
Environment Monitor: Notification of spill by call centre from Customer Contact or Emergency Services. Response: As set out in Emergency Response Maintenance Contractor is required to make safe within one hour of notification.
Cost escalations due to oil prices increases and inflation rates
Social Economic Environment
Monitor: NZTA monthly release of bitumen price indices. Response: Seek additional funding to maintain work programme, or reduce work programme to meet existing budget. Manage timing of works.
Health and safety risks associated with the construction, maintenance or operation of transportation infrastructure
Social Economic
Monitor: Complaints and call centre queries. Response: Improve safety of the roading network to reduce the occurrence of crashes.
The impact on public health from the reliance on cars.
Social Economic
Response: Promote the active transport modes such as walking and cycling. Investigate future demand for public transport services and infrastructure.
Impact on residents due to noise and other effects due to road classification and use.
Social Economic
Monitor: Survey and traffic count roads to ensure traffic use is appropriate to the classification. Response: High priority roads have expectation of
greater numbers of vehicles including heavy vehicles which is appropriate to the function of the road.
Use Bylaws to control use. Develop traffic calming strategies to direct
traffic.
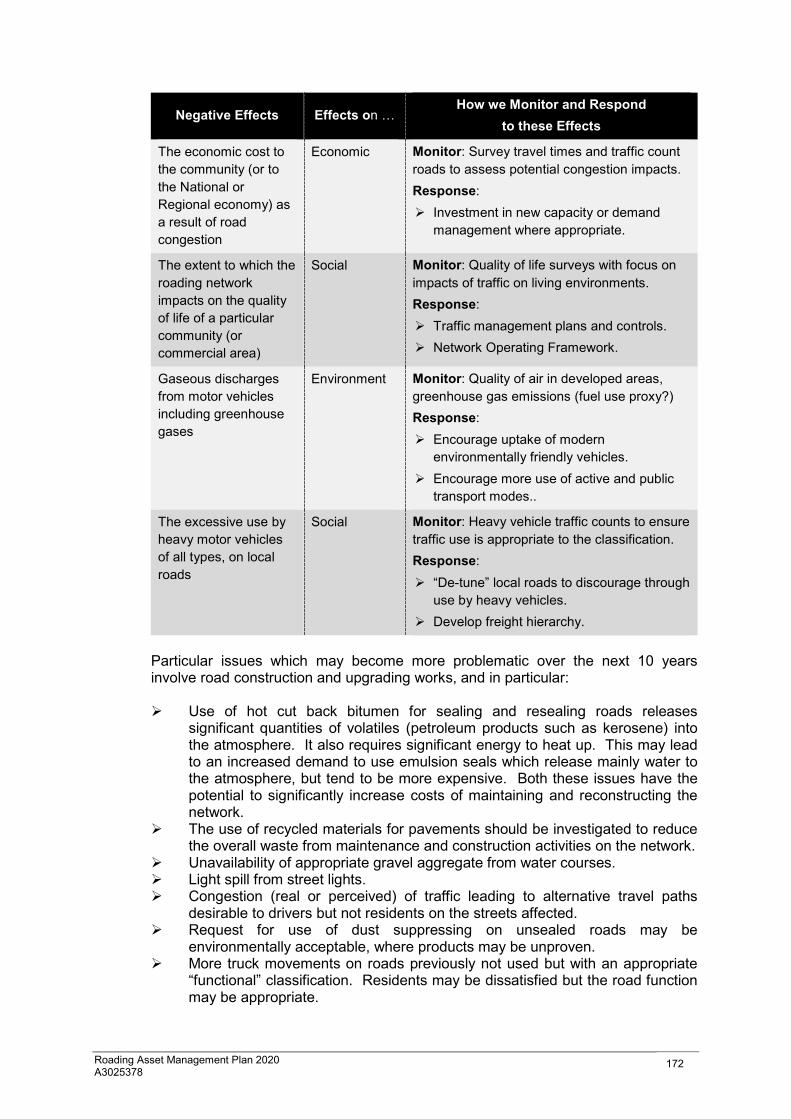
Roading Asset Management Plan 2020 A3025378
172
Negative Effects Effects on … How we Monitor and Respond
to these Effects
The economic cost to the community (or to the National or Regional economy) as a result of road congestion
Economic Monitor: Survey travel times and traffic count roads to assess potential congestion impacts. Response: Investment in new capacity or demand
management where appropriate.
The extent to which the roading network impacts on the quality of life of a particular community (or commercial area)
Social Monitor: Quality of life surveys with focus on impacts of traffic on living environments. Response: Traffic management plans and controls. Network Operating Framework.
Gaseous discharges from motor vehicles including greenhouse gases
Environment Monitor: Quality of air in developed areas, greenhouse gas emissions (fuel use proxy?) Response: Encourage uptake of modern
environmentally friendly vehicles. Encourage more use of active and public
transport modes..
The excessive use by heavy motor vehicles of all types, on local roads
Social Monitor: Heavy vehicle traffic counts to ensure traffic use is appropriate to the classification. Response: “De-tune” local roads to discourage through
use by heavy vehicles. Develop freight hierarchy.
Particular issues which may become more problematic over the next 10 years involve road construction and upgrading works, and in particular: Use of hot cut back bitumen for sealing and resealing roads releases
significant quantities of volatiles (petroleum products such as kerosene) into the atmosphere. It also requires significant energy to heat up. This may lead to an increased demand to use emulsion seals which release mainly water to the atmosphere, but tend to be more expensive. Both these issues have the potential to significantly increase costs of maintaining and reconstructing the network.
The use of recycled materials for pavements should be investigated to reduce the overall waste from maintenance and construction activities on the network.
Unavailability of appropriate gravel aggregate from water courses. Light spill from street lights. Congestion (real or perceived) of traffic leading to alternative travel paths
desirable to drivers but not residents on the streets affected. Request for use of dust suppressing on unsealed roads may be
environmentally acceptable, where products may be unproven. More truck movements on roads previously not used but with an appropriate
“functional” classification. Residents may be dissatisfied but the road function may be appropriate.
Roading Asset Management Plan 2020 A3025378
173
Further environmental difficulties and needs to better manage the capture, treatment and disposal of surface detritus and sump cleaning due to by-products deposited on roads.
Key high-level actions related to the operation of the roading network which can significantly reduce the impacts of these negative effects include: Promote active transport modes such as walking and cycling that reduce
vehicle emissions and improve the health of the Community. Investigate the future demand for public transport services and infrastructure. Improve the safety of the roading network for all road users to reduce the
occurrence of crashes. Improve the roading network to provide a reliable and efficient network for the
movement of people and freight.
Roading Asset Management Plan 2020 A3025378 174
7. Managing Our Activities (Programme Business Case)
7.1 RESPONDING TO THE ISSUES AND CHALLENGES 7.1.1 Strategic Responses
The key problem areas in the Strategic Case relate to: Safety Asset condition and performance Resilience and Climate Change Accessibility The Strategic Responses required can be summarised as: Prudent maintenance and renewal of existing infrastructure to appropriate
standards Justifiable improvements to address safety issues Justifiable improvements to address resilience and climate change issues Justifiable improvements to address accessibility issues Potential responses identified in the Strategic Case are tabulated in Section 0 and linked to the activity and asset classes that follow.
7.1.2 Investment Areas
The roading activity has two areas where investment occurs – subsidised and unsubsidised.
Subsidised Roading NZTA is a co investor with Council through the Land Transport Programme and supports this investment with a Financial Assistance Rate (FAR) currently 54% of the eligible costs and this will reduce to 51% in 2024. Council contributes the remaining costs through rates, and other user pay areas. Works included in this area relate to asset classes – pavements, drainage, traffic services (signs signals lighting, road marking), bridges and structures, some environmental costs (part of sweeping (30% is the subsidised portion), vegetation and pest plant control and mowing), and network management. Within these activities, investment options are considered (where the level of investment is sufficient to be appropriate) to each asset class in this section (e.g. Pavements, Drainage, etc.).
Unsubsidised Roading
This area of the activity, the community funds 100% of the costs through rates or user charging such as carparking or fees. Included in this area are works related to some street features such as seating, sweeping of roads and inner-city footpaths, mowing (other than as above), security cameras, under veranda lighting and amenity maintenance.
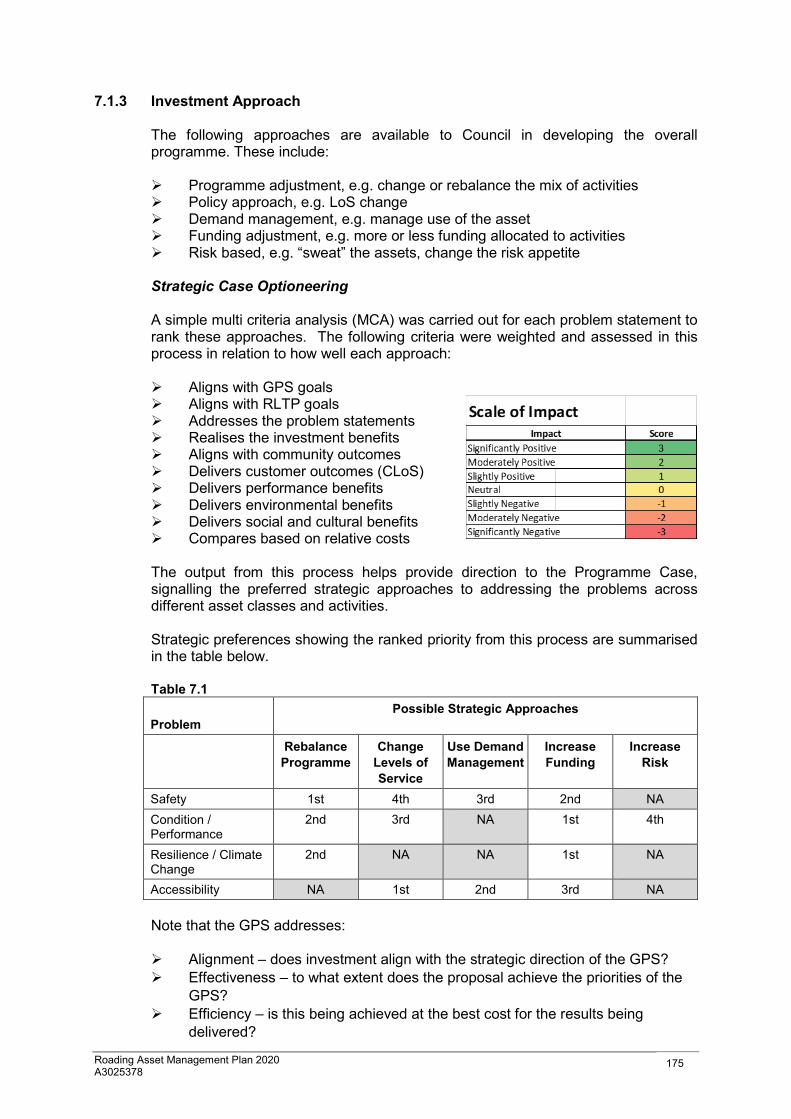
Roading Asset Management Plan 2020 A3025378
175
7.1.3 Investment Approach The following approaches are available to Council in developing the overall programme. These include: Programme adjustment, e.g. change or rebalance the mix of activities Policy approach, e.g. LoS change Demand management, e.g. manage use of the asset Funding adjustment, e.g. more or less funding allocated to activities Risk based, e.g. “sweat” the assets, change the risk appetite Strategic Case Optioneering A simple multi criteria analysis (MCA) was carried out for each problem statement to rank these approaches. The following criteria were weighted and assessed in this process in relation to how well each approach: Aligns with GPS goals Aligns with RLTP goals Addresses the problem statements Realises the investment benefits Aligns with community outcomes Delivers customer outcomes (CLoS) Delivers performance benefits Delivers environmental benefits Delivers social and cultural benefits Compares based on relative costs The output from this process helps provide direction to the Programme Case, signalling the preferred strategic approaches to addressing the problems across different asset classes and activities. Strategic preferences showing the ranked priority from this process are summarised in the table below. Table 7.1 Problem
Possible Strategic Approaches
Rebalance Programme
Change Levels of Service
Use Demand Management
Increase Funding
Increase Risk
Safety 1st 4th 3rd 2nd NA Condition / Performance
2nd 3rd NA 1st 4th
Resilience / Climate Change
2nd NA NA 1st NA
Accessibility NA 1st 2nd 3rd NA Note that the GPS addresses: Alignment – does investment align with the strategic direction of the GPS? Effectiveness – to what extent does the proposal achieve the priorities of the
GPS? Efficiency – is this being achieved at the best cost for the results being
delivered?
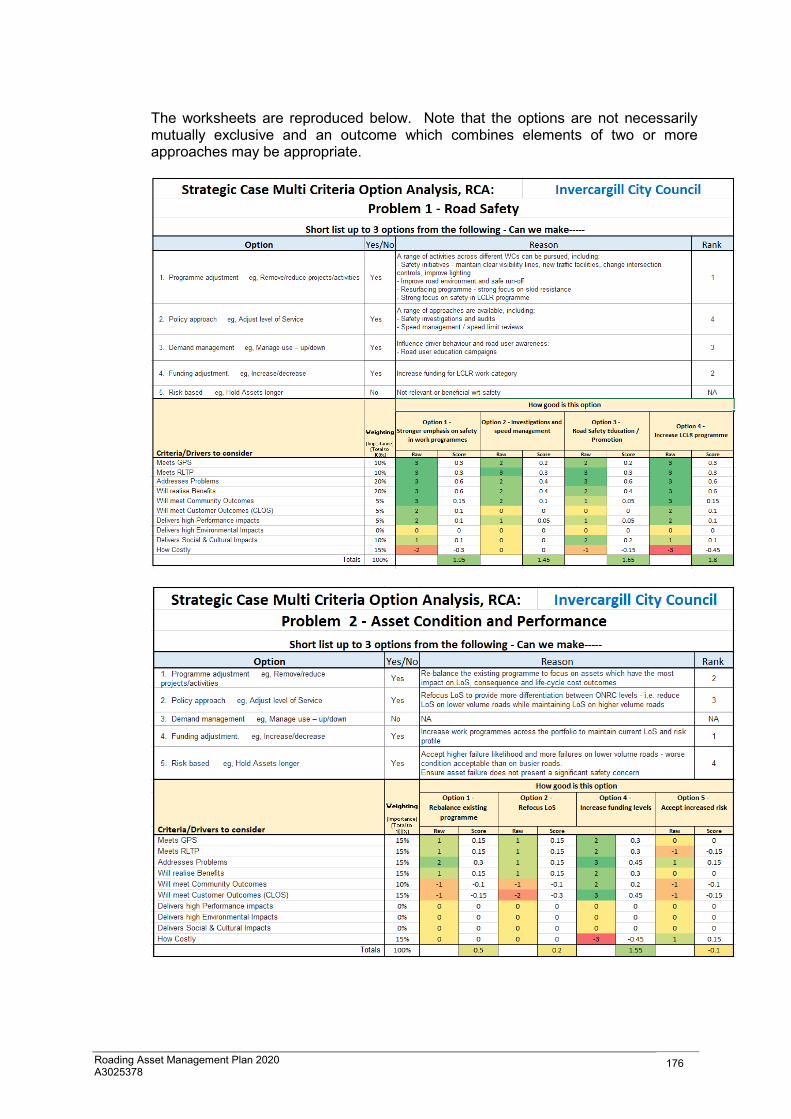
Roading Asset Management Plan 2020 A3025378
176
The worksheets are reproduced below. Note that the options are not necessarily mutually exclusive and an outcome which combines elements of two or more approaches may be appropriate.
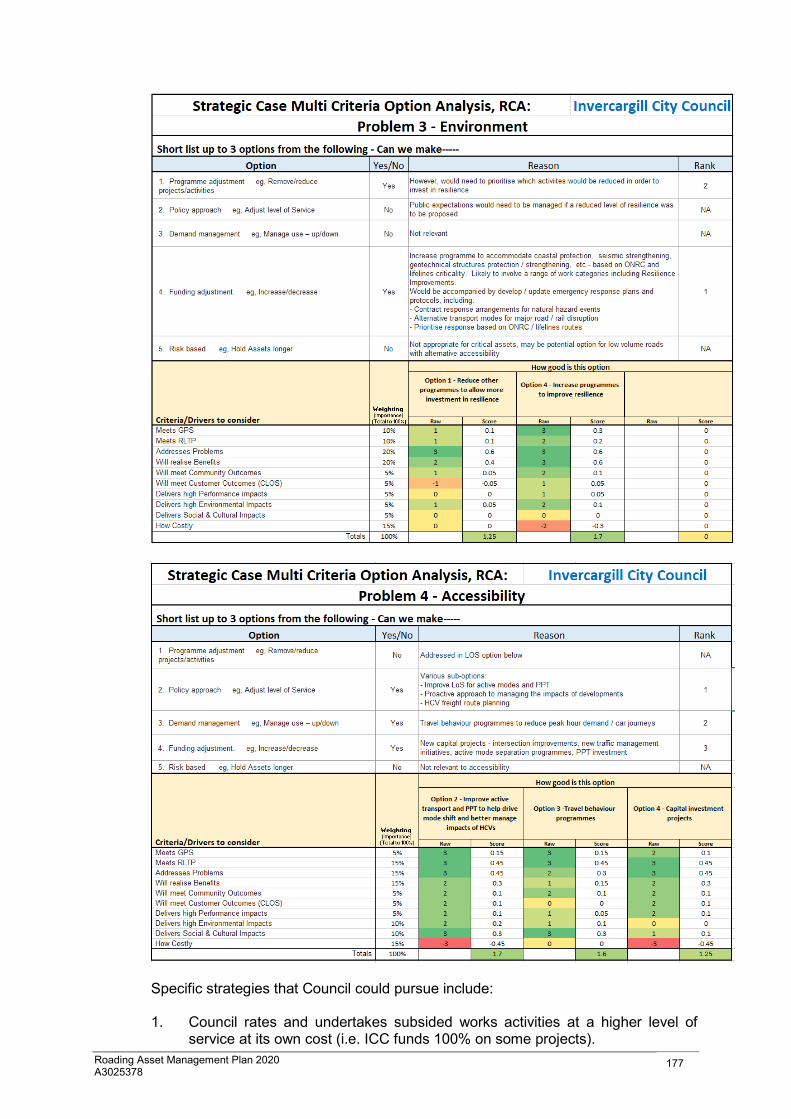
Roading Asset Management Plan 2020 A3025378
177
Specific strategies that Council could pursue include: 1. Council rates and undertakes subsided works activities at a higher level of
service at its own cost (i.e. ICC funds 100% on some projects).
Roading Asset Management Plan 2020 A3025378
178
2. Council specifically direct revenue generating areas (e.g. carparking) to offset
other expenditure.
3. Investment at higher budget levels (e.g. pavement renewals) for improvement focused outcomes where investment can be justified by a BBC.
4. Community focused investment where funding is from others or as co-
founders (e.g. a bridge may provide access for limited parties or similar).
5. Risk driven investment (“worst first”) – where Council looks to corporately only invest where the risk is the highest and have corporate prioritisation (at roading or across all assets).
6. Environmentally driven investment – where Council focuses more heavily and
allocates funding based on environmental issues which may or may not align with the GPS or other strategic outcomes.
7. Politically focused investment where investment is based on a development
strategy which has community support but may not be supported by the business case approach.
8. For carparking – options which could include (but not included in this AMP):
a. Provide in-house delivery b. Provide asset and externally manage enforcement
Each of these approaches may be appropriate to either subsidised or non-subsidised activities. Waka Kotahi NZ Transport Agency co invests with councils and they have a national approach which outlines the process and outcomes (e.g. business case approach, IAF, etc) where they are willing and able to participate in projects and activities.
7.1.4 Programme Case Evaluation
Optioneering Approach
This process is aligned with the current REG approach for assessing problems and ranking options using a multi-criteria analysis approach. Note that Waka Kotahi NZ Transport Agency has its own Investment Assessment Framework which they will utilise on a programme level (rather than asset) to determine their level of investment. Furthermore, all subsidised activities need to comply with the Transport Agency’s procedural and monitoring requirements. The Programme Business Case process develops and recommends programmes to operate, maintain, renew, and ultimately dispose of transport assets whilst delivering service to transport users and the Invercargill community. An important aspect is the selection of optimised investment levels for renewal. Sealed road pavements have the largest impact on the overall investment level, and there is significant variability across different investment levels. Hence, significant analysis effort is focused on Pavements in this AMP. The optioneering process adopted is as follows:
Where appropriate to the scale and complexity of an asset or activity class,
identify possible options for formulating the programme. These should, as a
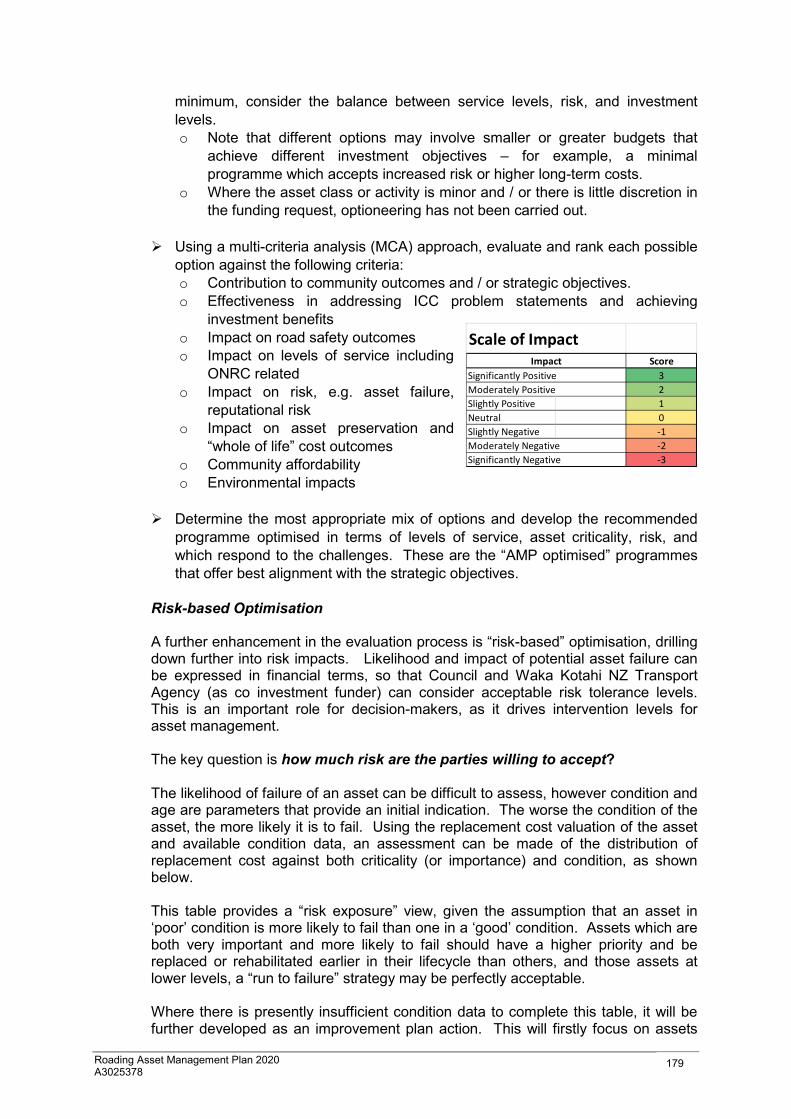
Roading Asset Management Plan 2020 A3025378
179
Scale of ImpactScore
Significantly Positive 3Moderately Positive 2Slightly Positive 1Neutral 0Slightly Negative ‐1Moderately Negative ‐2Significantly Negative ‐3
Impact
minimum, consider the balance between service levels, risk, and investment levels. o Note that different options may involve smaller or greater budgets that
achieve different investment objectives – for example, a minimal programme which accepts increased risk or higher long-term costs.
o Where the asset class or activity is minor and / or there is little discretion in the funding request, optioneering has not been carried out.
Using a multi-criteria analysis (MCA) approach, evaluate and rank each possible option against the following criteria: o Contribution to community outcomes and / or strategic objectives. o Effectiveness in addressing ICC problem statements and achieving
investment benefits o Impact on road safety outcomes o Impact on levels of service including
ONRC related o Impact on risk, e.g. asset failure,
reputational risk o Impact on asset preservation and
“whole of life” cost outcomes o Community affordability o Environmental impacts
Determine the most appropriate mix of options and develop the recommended
programme optimised in terms of levels of service, asset criticality, risk, and which respond to the challenges. These are the “AMP optimised” programmes that offer best alignment with the strategic objectives.
Risk-based Optimisation
A further enhancement in the evaluation process is “risk-based” optimisation, drilling down further into risk impacts. Likelihood and impact of potential asset failure can be expressed in financial terms, so that Council and Waka Kotahi NZ Transport Agency (as co investment funder) can consider acceptable risk tolerance levels. This is an important role for decision-makers, as it drives intervention levels for asset management. The key question is how much risk are the parties willing to accept? The likelihood of failure of an asset can be difficult to assess, however condition and age are parameters that provide an initial indication. The worse the condition of the asset, the more likely it is to fail. Using the replacement cost valuation of the asset and available condition data, an assessment can be made of the distribution of replacement cost against both criticality (or importance) and condition, as shown below. This table provides a “risk exposure” view, given the assumption that an asset in ‘poor’ condition is more likely to fail than one in a ‘good’ condition. Assets which are both very important and more likely to fail should have a higher priority and be replaced or rehabilitated earlier in their lifecycle than others, and those assets at lower levels, a “run to failure” strategy may be perfectly acceptable. Where there is presently insufficient condition data to complete this table, it will be further developed as an improvement plan action. This will firstly focus on assets
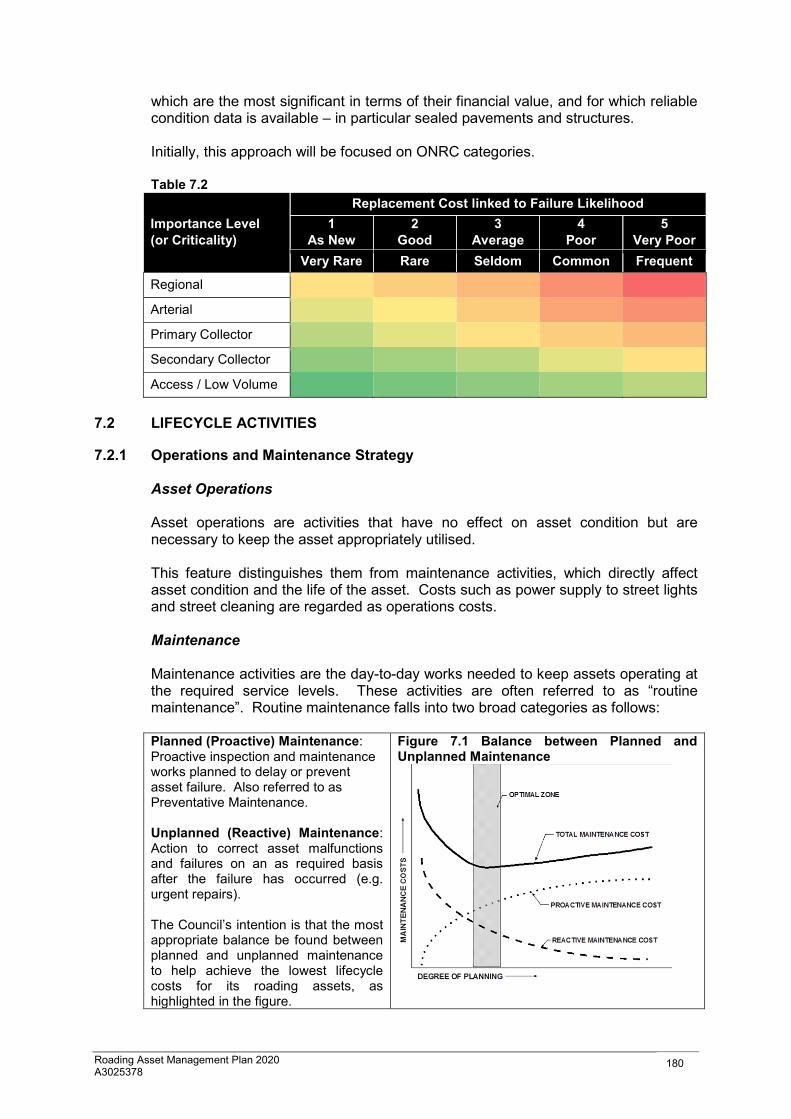
Roading Asset Management Plan 2020 A3025378
180
which are the most significant in terms of their financial value, and for which reliable condition data is available – in particular sealed pavements and structures. Initially, this approach will be focused on ONRC categories. Table 7.2
Importance Level (or Criticality)
Replacement Cost linked to Failure Likelihood 1
As New 2
Good 3
Average 4
Poor 5
Very Poor Very Rare Rare Seldom Common Frequent
Regional
Arterial
Primary Collector
Secondary Collector
Access / Low Volume 7.2 LIFECYCLE ACTIVITIES 7.2.1 Operations and Maintenance Strategy
Asset Operations
Asset operations are activities that have no effect on asset condition but are necessary to keep the asset appropriately utilised. This feature distinguishes them from maintenance activities, which directly affect asset condition and the life of the asset. Costs such as power supply to street lights and street cleaning are regarded as operations costs.
Maintenance Maintenance activities are the day-to-day works needed to keep assets operating at the required service levels. These activities are often referred to as “routine maintenance”. Routine maintenance falls into two broad categories as follows: Planned (Proactive) Maintenance: Proactive inspection and maintenance works planned to delay or prevent asset failure. Also referred to as Preventative Maintenance. Unplanned (Reactive) Maintenance: Action to correct asset malfunctions and failures on an as required basis after the failure has occurred (e.g. urgent repairs). The Council’s intention is that the most appropriate balance be found between planned and unplanned maintenance to help achieve the lowest lifecycle costs for its roading assets, as highlighted in the figure.
Figure 7.1 Balance between Planned and Unplanned Maintenance
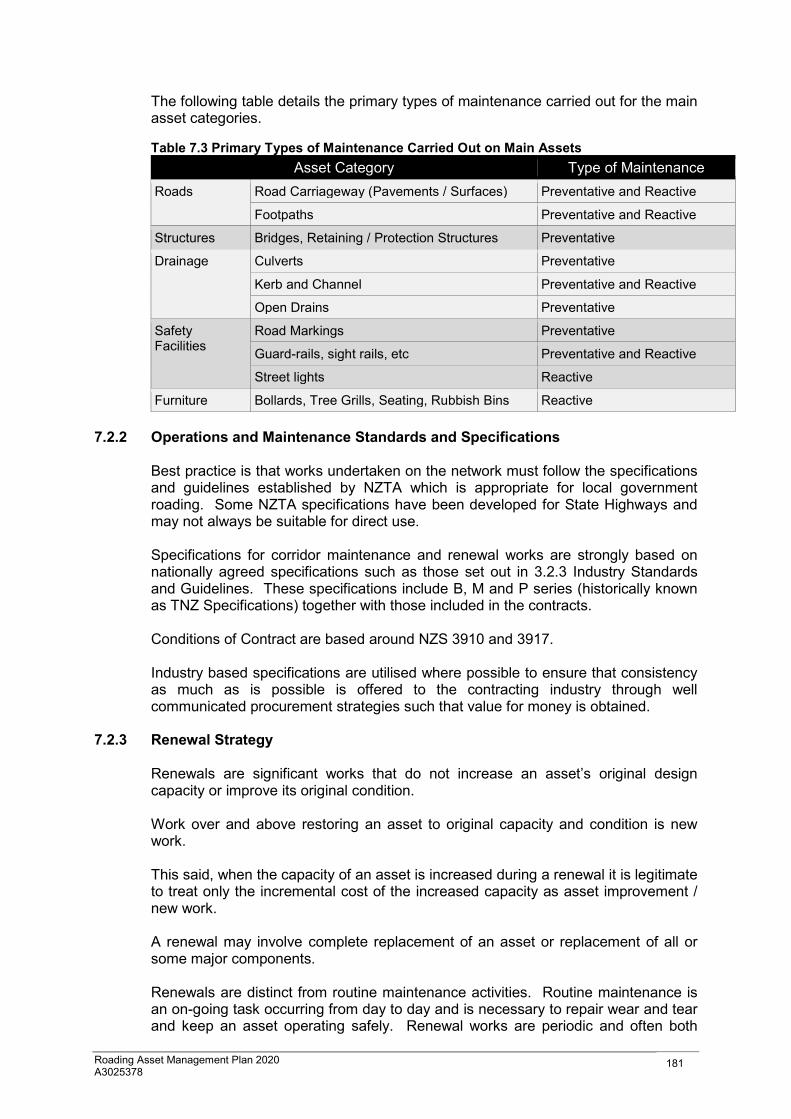
Roading Asset Management Plan 2020 A3025378
181
The following table details the primary types of maintenance carried out for the main asset categories. Table 7.3 Primary Types of Maintenance Carried Out on Main Assets
Asset Category Type of Maintenance Roads Road Carriageway (Pavements / Surfaces) Preventative and Reactive
Footpaths Preventative and Reactive
Structures Bridges, Retaining / Protection Structures Preventative
Drainage Culverts Preventative
Kerb and Channel Preventative and Reactive
Open Drains Preventative
Safety Facilities
Road Markings Preventative
Guard-rails, sight rails, etc Preventative and Reactive
Street lights Reactive
Furniture Bollards, Tree Grills, Seating, Rubbish Bins Reactive
7.2.2 Operations and Maintenance Standards and Specifications Best practice is that works undertaken on the network must follow the specifications and guidelines established by NZTA which is appropriate for local government roading. Some NZTA specifications have been developed for State Highways and may not always be suitable for direct use. Specifications for corridor maintenance and renewal works are strongly based on nationally agreed specifications such as those set out in 3.2.3 Industry Standards and Guidelines. These specifications include B, M and P series (historically known as TNZ Specifications) together with those included in the contracts. Conditions of Contract are based around NZS 3910 and 3917. Industry based specifications are utilised where possible to ensure that consistency as much as is possible is offered to the contracting industry through well communicated procurement strategies such that value for money is obtained.
7.2.3 Renewal Strategy Renewals are significant works that do not increase an asset’s original design capacity or improve its original condition. Work over and above restoring an asset to original capacity and condition is new work. This said, when the capacity of an asset is increased during a renewal it is legitimate to treat only the incremental cost of the increased capacity as asset improvement / new work. A renewal may involve complete replacement of an asset or replacement of all or some major components. Renewals are distinct from routine maintenance activities. Routine maintenance is an on-going task occurring from day to day and is necessary to repair wear and tear and keep an asset operating safely. Renewal works are periodic and often both
Roading Asset Management Plan 2020 A3025378
182
expensive and extensive; they restore the service potential of the asset consumed by normal use. Asset renewal is undertaken when an asset, or a significant component of an asset, has reached the end of its economic life. Renewals are normally considered at the level to which components are split for valuation purposes. Work that restores the structural integrity of components, e.g. repair of concrete spalling on a bridge, is therefore a maintenance activity and an owning and operating cost as defined by PBE IPSAS 1718. Renewal work therefore includes: Renewal and rehabilitation of existing assets to their original size and capacity
that does not necessarily increase, but maintains, the level of service provided by the assets;
Replacement of an entire component of an asset with a new one of equivalent size, capacity or a modern engineering equivalent of obsolete or obsolescent technology; and
Replacement component of a new work that increases the capacity of an asset; i.e. that portion of an upgrading work that restores the asset to its original size and capacity, and no more.
Examples of renewals include: Resurfacing of sealed and unsealed carriageways. Over-laying existing pavements with a new structural layer. Extensive excavation of existing structural layers and their replacement with
new material. Replacement of kerb and channel, footpaths, streetlights, etc. at the end of
their useful lives. Renewals expenditure levels are set and adjusted on the following basis: The age profile of roading and footpath assets. The condition profile of the assets. Ongoing maintenance requirements and costs. The life expectancies of individual asset components. The levels of service being delivered by the assets, in comparison to those
expected and required. The willingness of the NZTA to meet its share of the costs. The ability of the Council to fund the balance of costs after NZTA’s
contribution is considered. Failure to maintain an adequate cyclic asset replacement programme will result in a decline in the overall standard and performance of the asset or asset components. This generally leads to increasing costs of ownership and use, unless the component is abandoned and withdrawn from service, which is rarely practical or possible.
18 NZ Public Benefit Entity International Public Sector Accounting Standard 17 Property, Plant and Equipment
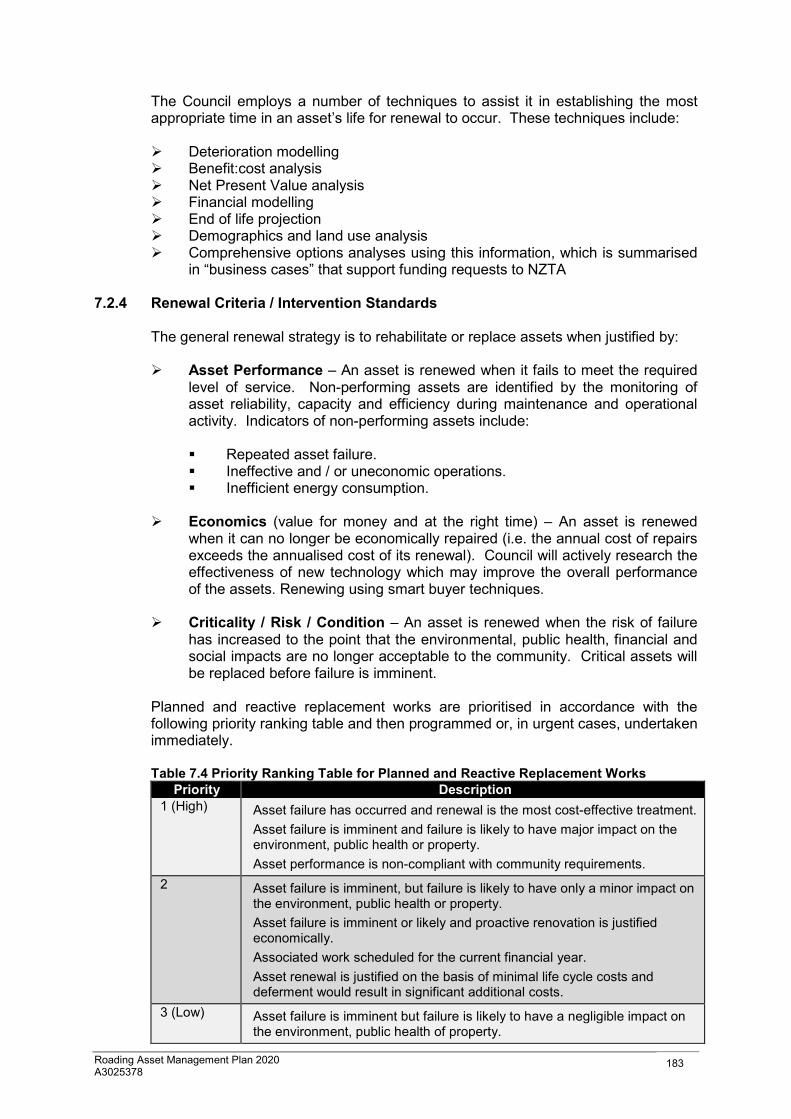
Roading Asset Management Plan 2020 A3025378
183
The Council employs a number of techniques to assist it in establishing the most appropriate time in an asset’s life for renewal to occur. These techniques include: Deterioration modelling Benefit:cost analysis Net Present Value analysis Financial modelling End of life projection Demographics and land use analysis Comprehensive options analyses using this information, which is summarised
in “business cases” that support funding requests to NZTA
7.2.4 Renewal Criteria / Intervention Standards
The general renewal strategy is to rehabilitate or replace assets when justified by: Asset Performance – An asset is renewed when it fails to meet the required
level of service. Non-performing assets are identified by the monitoring of asset reliability, capacity and efficiency during maintenance and operational activity. Indicators of non-performing assets include: Repeated asset failure. Ineffective and / or uneconomic operations. Inefficient energy consumption.
Economics (value for money and at the right time) – An asset is renewed
when it can no longer be economically repaired (i.e. the annual cost of repairs exceeds the annualised cost of its renewal). Council will actively research the effectiveness of new technology which may improve the overall performance of the assets. Renewing using smart buyer techniques.
Criticality / Risk / Condition – An asset is renewed when the risk of failure
has increased to the point that the environmental, public health, financial and social impacts are no longer acceptable to the community. Critical assets will be replaced before failure is imminent.
Planned and reactive replacement works are prioritised in accordance with the following priority ranking table and then programmed or, in urgent cases, undertaken immediately. Table 7.4 Priority Ranking Table for Planned and Reactive Replacement Works
Priority Description 1 (High) Asset failure has occurred and renewal is the most cost-effective treatment.
Asset failure is imminent and failure is likely to have major impact on the environment, public health or property. Asset performance is non-compliant with community requirements.
2 Asset failure is imminent, but failure is likely to have only a minor impact on the environment, public health or property. Asset failure is imminent or likely and proactive renovation is justified economically. Associated work scheduled for the current financial year. Asset renewal is justified on the basis of minimal life cycle costs and deferment would result in significant additional costs.
3 (Low) Asset failure is imminent but failure is likely to have a negligible impact on the environment, public health of property.
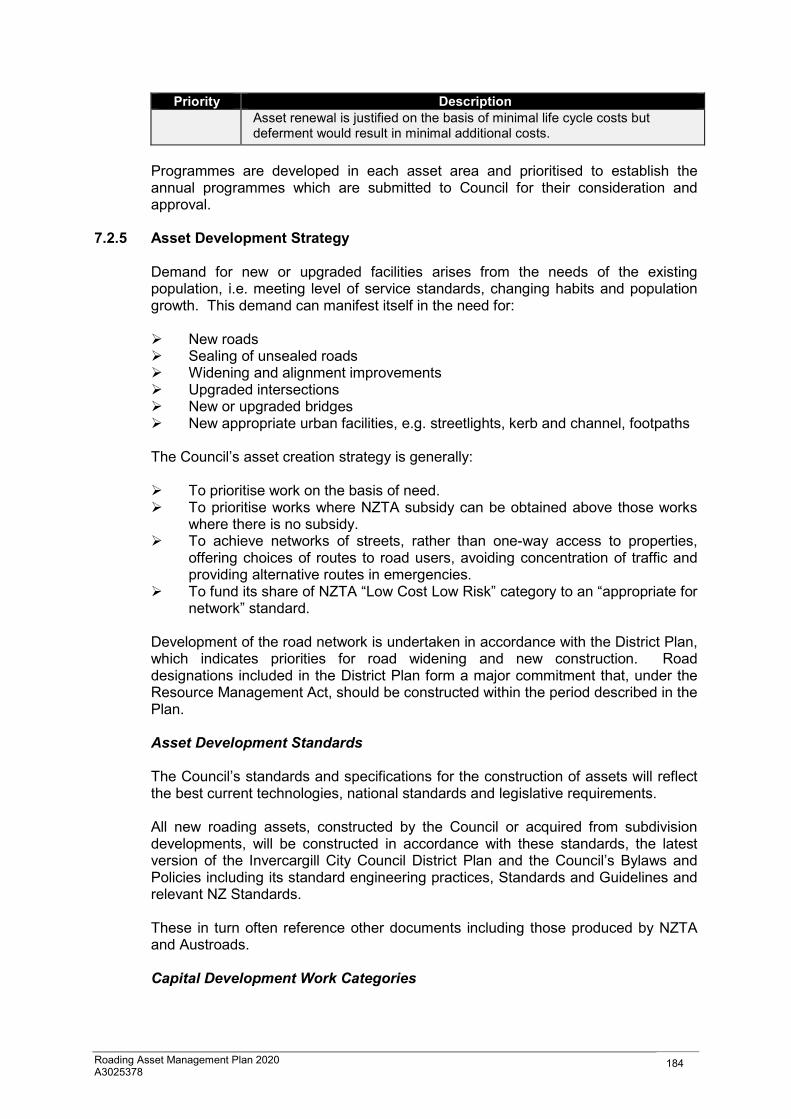
Roading Asset Management Plan 2020 A3025378
184
Priority Description Asset renewal is justified on the basis of minimal life cycle costs but deferment would result in minimal additional costs.
Programmes are developed in each asset area and prioritised to establish the annual programmes which are submitted to Council for their consideration and approval.
7.2.5 Asset Development Strategy Demand for new or upgraded facilities arises from the needs of the existing population, i.e. meeting level of service standards, changing habits and population growth. This demand can manifest itself in the need for: New roads Sealing of unsealed roads Widening and alignment improvements Upgraded intersections New or upgraded bridges New appropriate urban facilities, e.g. streetlights, kerb and channel, footpaths The Council’s asset creation strategy is generally: To prioritise work on the basis of need. To prioritise works where NZTA subsidy can be obtained above those works
where there is no subsidy. To achieve networks of streets, rather than one-way access to properties,
offering choices of routes to road users, avoiding concentration of traffic and providing alternative routes in emergencies.
To fund its share of NZTA “Low Cost Low Risk” category to an “appropriate for network” standard.
Development of the road network is undertaken in accordance with the District Plan, which indicates priorities for road widening and new construction. Road designations included in the District Plan form a major commitment that, under the Resource Management Act, should be constructed within the period described in the Plan.
Asset Development Standards
The Council’s standards and specifications for the construction of assets will reflect the best current technologies, national standards and legislative requirements. All new roading assets, constructed by the Council or acquired from subdivision developments, will be constructed in accordance with these standards, the latest version of the Invercargill City Council District Plan and the Council’s Bylaws and Policies including its standard engineering practices, Standards and Guidelines and relevant NZ Standards. These in turn often reference other documents including those produced by NZTA and Austroads.
Capital Development Work Categories
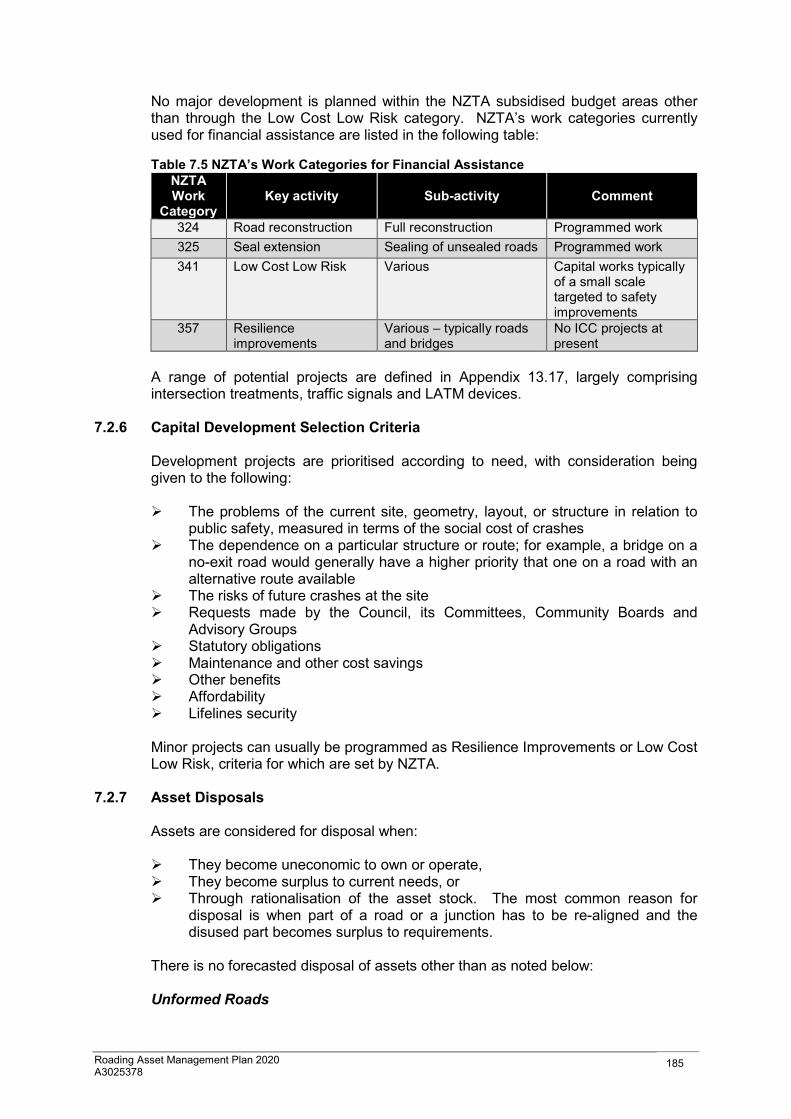
Roading Asset Management Plan 2020 A3025378
185
No major development is planned within the NZTA subsidised budget areas other than through the Low Cost Low Risk category. NZTA’s work categories currently used for financial assistance are listed in the following table: Table 7.5 NZTA’s Work Categories for Financial Assistance
NZTA Work
Category Key activity Sub-activity Comment
324 Road reconstruction Full reconstruction Programmed work 325 Seal extension Sealing of unsealed roads Programmed work 341 Low Cost Low Risk Various Capital works typically
of a small scale targeted to safety improvements
357 Resilience improvements
Various – typically roads and bridges
No ICC projects at present
A range of potential projects are defined in Appendix 13.17, largely comprising intersection treatments, traffic signals and LATM devices.
7.2.6 Capital Development Selection Criteria Development projects are prioritised according to need, with consideration being given to the following: The problems of the current site, geometry, layout, or structure in relation to
public safety, measured in terms of the social cost of crashes The dependence on a particular structure or route; for example, a bridge on a
no-exit road would generally have a higher priority that one on a road with an alternative route available
The risks of future crashes at the site Requests made by the Council, its Committees, Community Boards and
Advisory Groups Statutory obligations Maintenance and other cost savings Other benefits Affordability Lifelines security Minor projects can usually be programmed as Resilience Improvements or Low Cost Low Risk, criteria for which are set by NZTA.
7.2.7 Asset Disposals Assets are considered for disposal when: They become uneconomic to own or operate, They become surplus to current needs, or Through rationalisation of the asset stock. The most common reason for
disposal is when part of a road or a junction has to be re-aligned and the disused part becomes surplus to requirements.
There is no forecasted disposal of assets other than as noted below:
Unformed Roads
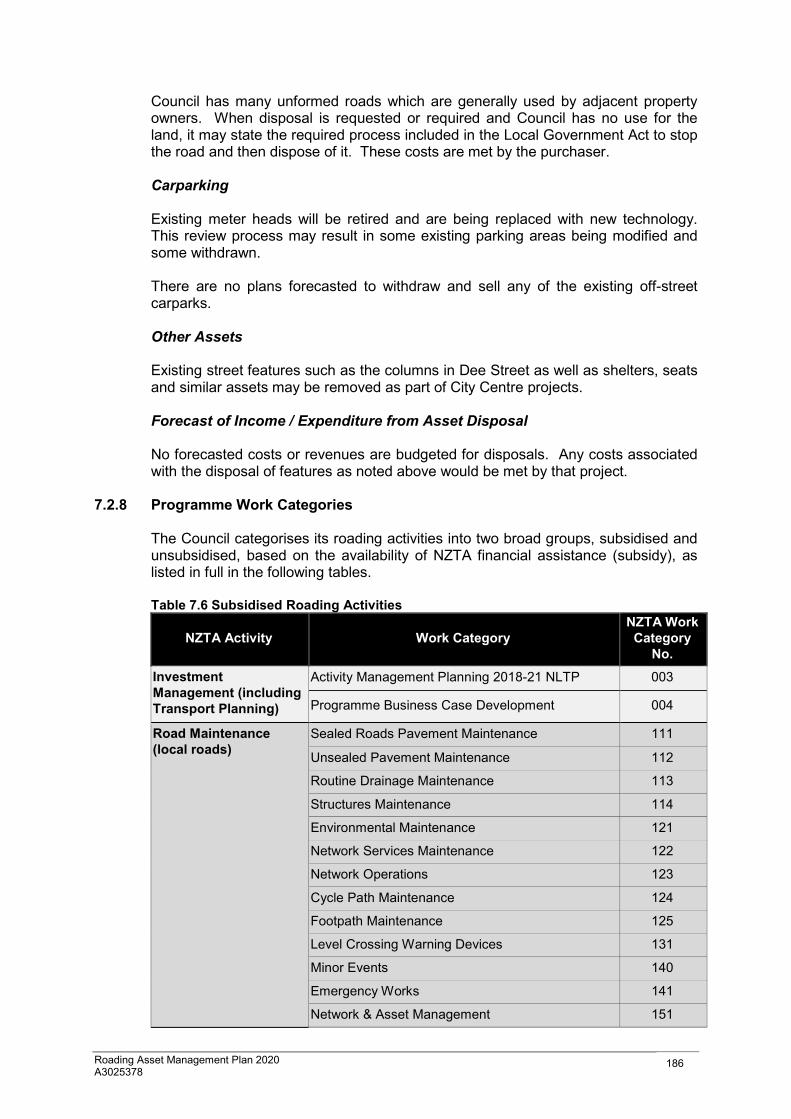
Roading Asset Management Plan 2020 A3025378
186
Council has many unformed roads which are generally used by adjacent property owners. When disposal is requested or required and Council has no use for the land, it may state the required process included in the Local Government Act to stop the road and then dispose of it. These costs are met by the purchaser.
Carparking Existing meter heads will be retired and are being replaced with new technology. This review process may result in some existing parking areas being modified and some withdrawn. There are no plans forecasted to withdraw and sell any of the existing off-street carparks.
Other Assets Existing street features such as the columns in Dee Street as well as shelters, seats and similar assets may be removed as part of City Centre projects.
Forecast of Income / Expenditure from Asset Disposal No forecasted costs or revenues are budgeted for disposals. Any costs associated with the disposal of features as noted above would be met by that project.
7.2.8 Programme Work Categories
The Council categorises its roading activities into two broad groups, subsidised and unsubsidised, based on the availability of NZTA financial assistance (subsidy), as listed in full in the following tables. Table 7.6 Subsidised Roading Activities
NZTA Activity Work Category NZTA Work Category
No. Investment Management (including Transport Planning)
Activity Management Planning 2018-21 NLTP 003
Programme Business Case Development 004
Road Maintenance (local roads)
Sealed Roads Pavement Maintenance 111
Unsealed Pavement Maintenance 112
Routine Drainage Maintenance 113
Structures Maintenance 114
Environmental Maintenance 121
Network Services Maintenance 122
Network Operations 123
Cycle Path Maintenance 124
Footpath Maintenance 125
Level Crossing Warning Devices 131
Minor Events 140
Emergency Works 141
Network & Asset Management 151
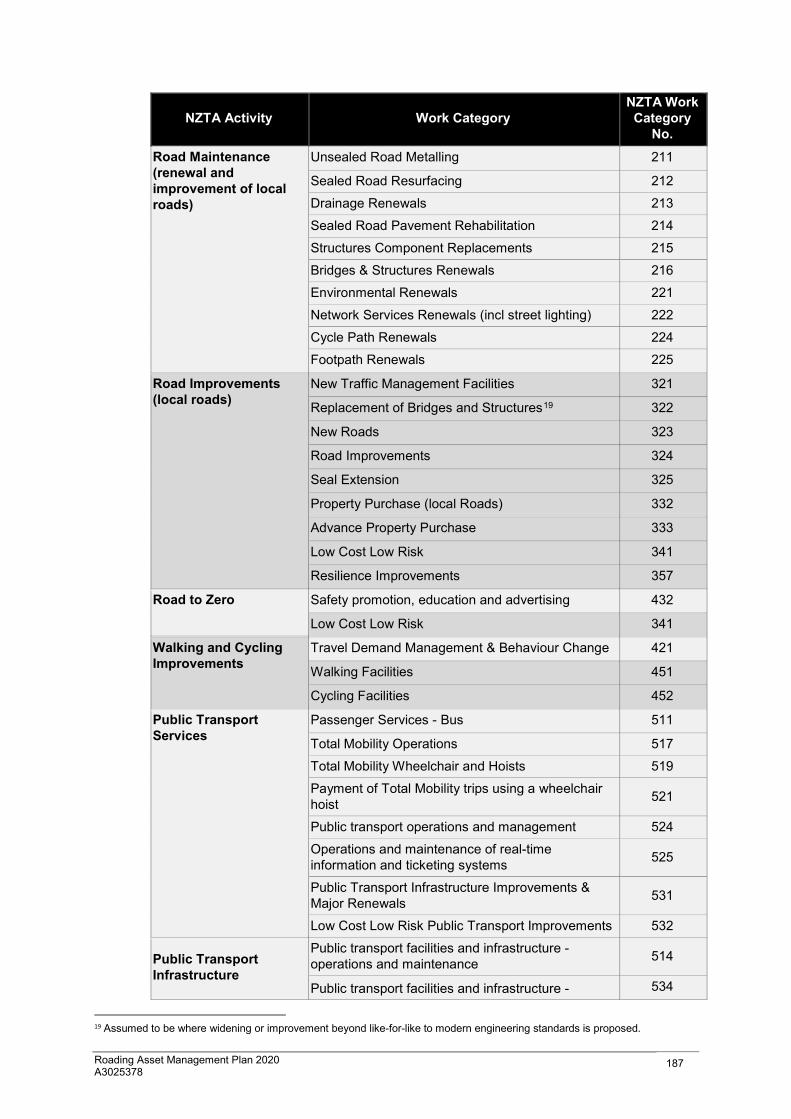
Roading Asset Management Plan 2020 A3025378
187
NZTA Activity Work Category NZTA Work Category
No. Road Maintenance (renewal and improvement of local roads)
Unsealed Road Metalling 211
Sealed Road Resurfacing 212 Drainage Renewals 213 Sealed Road Pavement Rehabilitation 214 Structures Component Replacements 215 Bridges & Structures Renewals 216 Environmental Renewals 221 Network Services Renewals (incl street lighting) 222 Cycle Path Renewals 224 Footpath Renewals 225
Road Improvements (local roads)
New Traffic Management Facilities 321
Replacement of Bridges and Structures19 322
New Roads 323
Road Improvements 324
Seal Extension 325
Property Purchase (local Roads) 332
Advance Property Purchase 333
Low Cost Low Risk 341
Resilience Improvements 357
Road to Zero Safety promotion, education and advertising 432
Low Cost Low Risk 341
Walking and Cycling Improvements
Travel Demand Management & Behaviour Change 421
Walking Facilities 451
Cycling Facilities 452
Public Transport Services
Passenger Services - Bus 511
Total Mobility Operations 517 Total Mobility Wheelchair and Hoists 519 Payment of Total Mobility trips using a wheelchair hoist 521
Public transport operations and management 524 Operations and maintenance of real-time information and ticketing systems 525
Public Transport Infrastructure Improvements & Major Renewals 531
Low Cost Low Risk Public Transport Improvements 532
Public Transport Infrastructure
Public transport facilities and infrastructure - operations and maintenance 514
Public transport facilities and infrastructure - 534
19 Assumed to be where widening or improvement beyond like-for-like to modern engineering standards is proposed.
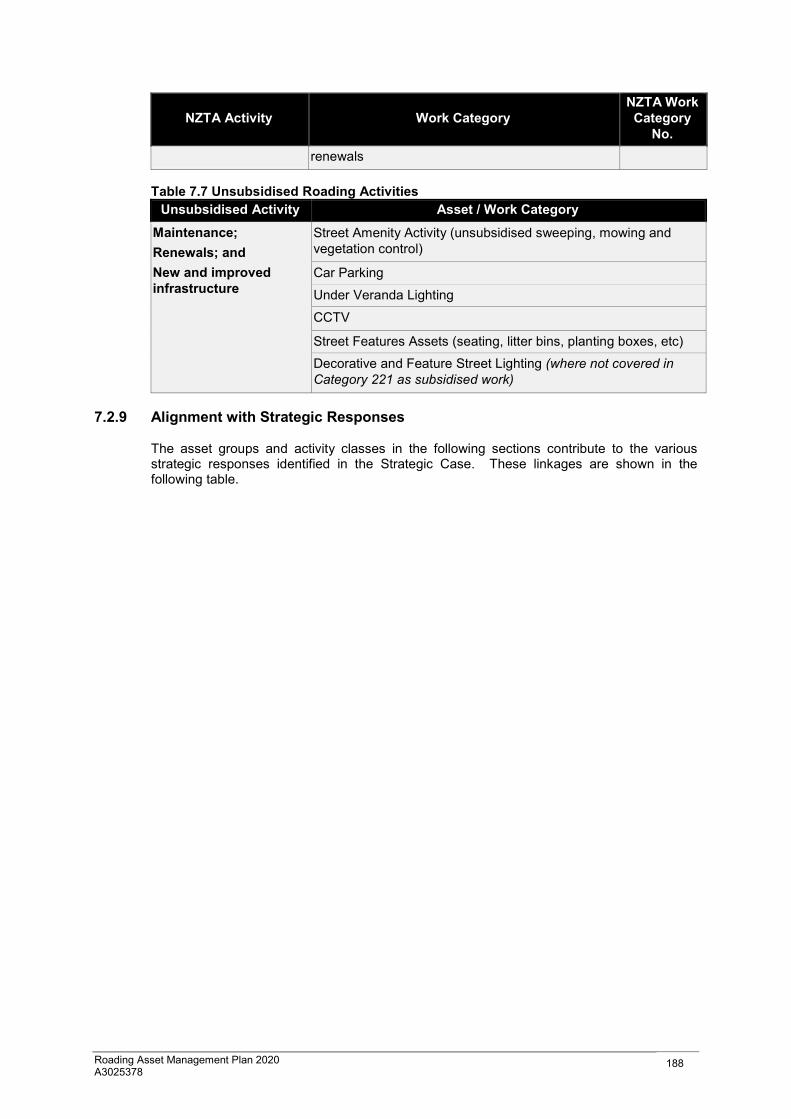
Roading Asset Management Plan 2020 A3025378
188
NZTA Activity Work Category NZTA Work Category
No. renewals
Table 7.7 Unsubsidised Roading Activities
Unsubsidised Activity Asset / Work Category Maintenance; Renewals; and New and improved infrastructure
Street Amenity Activity (unsubsidised sweeping, mowing and vegetation control)
Car Parking Under Veranda Lighting CCTV
Street Features Assets (seating, litter bins, planting boxes, etc) Decorative and Feature Street Lighting (where not covered in Category 221 as subsidised work)
7.2.9 Alignment with Strategic Responses
The asset groups and activity classes in the following sections contribute to the various strategic responses identified in the Strategic Case. These linkages are shown in the following table.
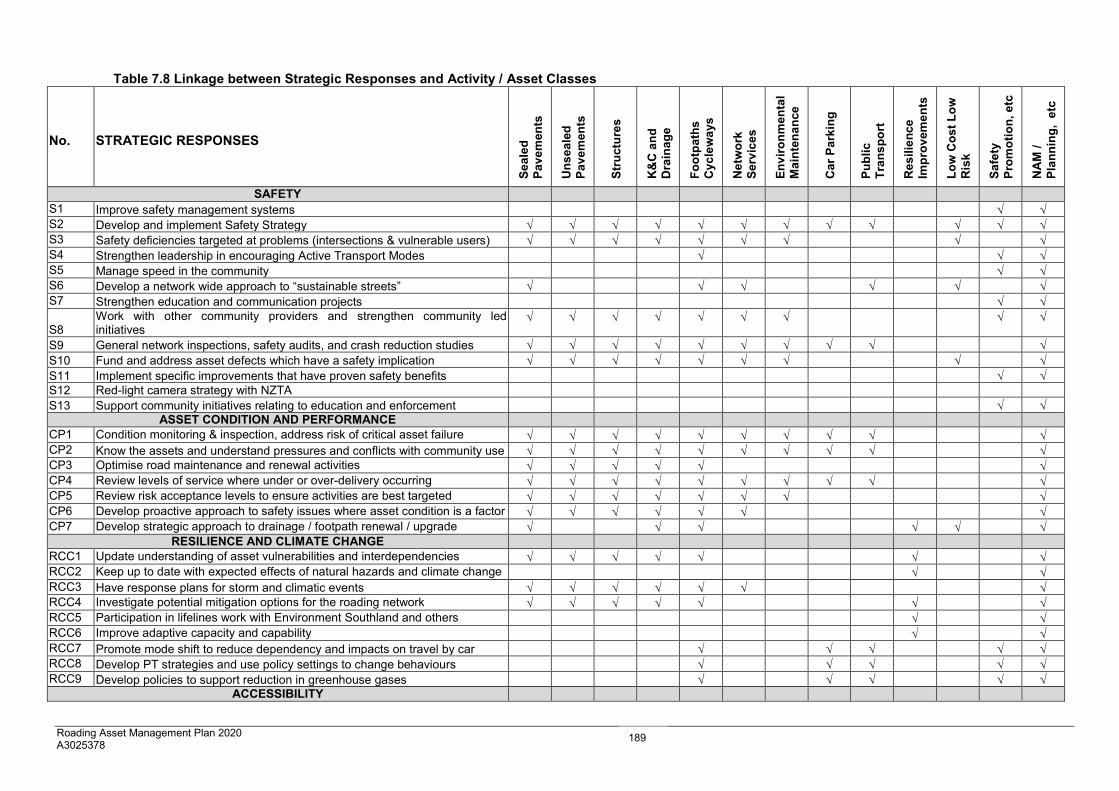
Roading Asset Management Plan 2020 A3025378 189
Table 7.8 Linkage between Strategic Responses and Activity / Asset Classes No.
STRATEGIC RESPONSES
Seal
ed
Pave
men
ts
Uns
eale
d Pa
vem
ents
Stru
ctur
es
K&
C a
nd
Dra
inag
e
Foot
path
s C
ycle
way
s
Net
wor
k Se
rvic
es
Envi
ronm
enta
l M
aint
enan
ce
Car
Par
king
Publ
ic
Tran
spor
t
Res
ilien
ce
Impr
ovem
ents
Low
Cos
t Low
R
isk
Safe
ty
Prom
otio
n, e
tc
NA
M /
Plan
ning
, et
c
SAFETY S1 Improve safety management systems √ √ S2 Develop and implement Safety Strategy √ √ √ √ √ √ √ √ √ √ √ √ S3 Safety deficiencies targeted at problems (intersections & vulnerable users) √ √ √ √ √ √ √ √ √ S4 Strengthen leadership in encouraging Active Transport Modes √ √ √ S5 Manage speed in the community √ √ S6 Develop a network wide approach to “sustainable streets” √ √ √ √ √ √ S7 Strengthen education and communication projects √ √
S8 Work with other community providers and strengthen community led initiatives
√ √ √ √ √ √ √ √ √
S9 General network inspections, safety audits, and crash reduction studies √ √ √ √ √ √ √ √ √ √ S10 Fund and address asset defects which have a safety implication √ √ √ √ √ √ √ √ √ S11 Implement specific improvements that have proven safety benefits √ √ S12 Red-light camera strategy with NZTA S13 Support community initiatives relating to education and enforcement √ √
ASSET CONDITION AND PERFORMANCE CP1 Condition monitoring & inspection, address risk of critical asset failure √ √ √ √ √ √ √ √ √ √ CP2 Know the assets and understand pressures and conflicts with community use √ √ √ √ √ √ √ √ √ √ CP3 Optimise road maintenance and renewal activities √ √ √ √ √ √ CP4 Review levels of service where under or over-delivery occurring √ √ √ √ √ √ √ √ √ √ CP5 Review risk acceptance levels to ensure activities are best targeted √ √ √ √ √ √ √ √ CP6 Develop proactive approach to safety issues where asset condition is a factor √ √ √ √ √ √ √ CP7 Develop strategic approach to drainage / footpath renewal / upgrade √ √ √ √ √ √
RESILIENCE AND CLIMATE CHANGE RCC1 Update understanding of asset vulnerabilities and interdependencies √ √ √ √ √ √ √ RCC2 Keep up to date with expected effects of natural hazards and climate change √ √ RCC3 Have response plans for storm and climatic events √ √ √ √ √ √ √ RCC4 Investigate potential mitigation options for the roading network √ √ √ √ √ √ √ RCC5 Participation in lifelines work with Environment Southland and others √ √ RCC6 Improve adaptive capacity and capability √ √ RCC7 Promote mode shift to reduce dependency and impacts on travel by car √ √ √ √ √ RCC8 Develop PT strategies and use policy settings to change behaviours √ √ √ √ √ RCC9 Develop policies to support reduction in greenhouse gases √ √ √ √ √
ACCESSIBILITY
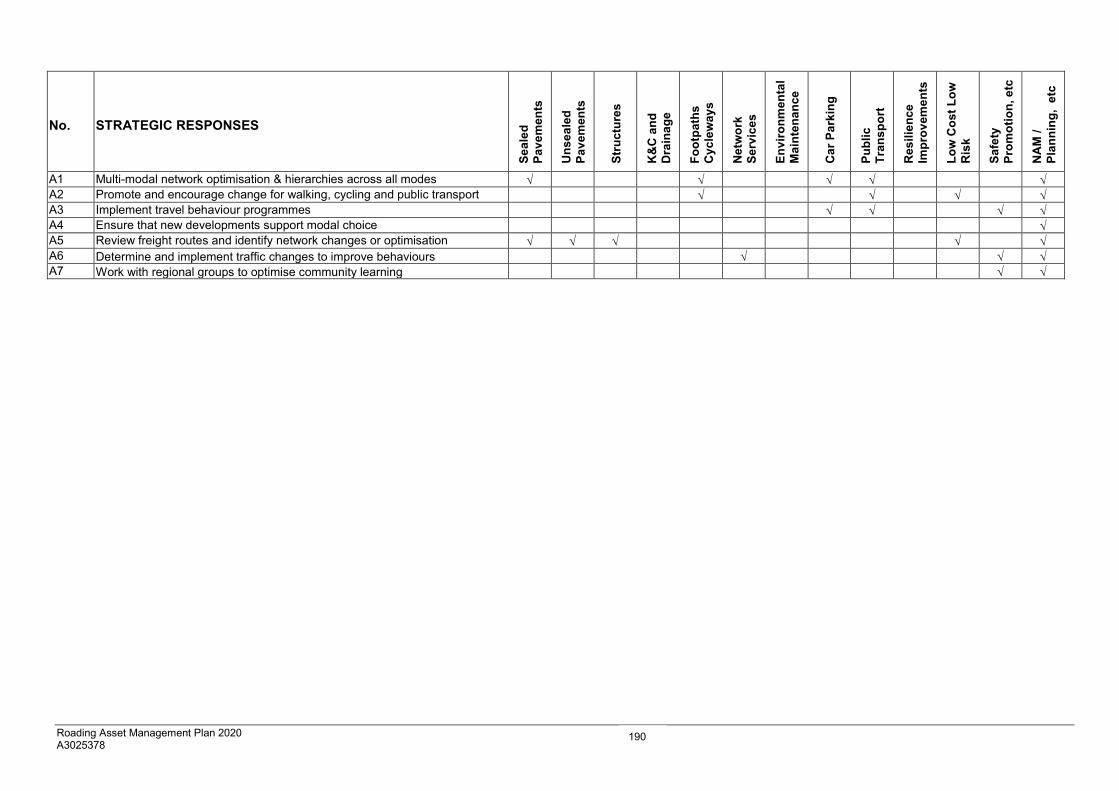
Roading Asset Management Plan 2020 A3025378
190
No.
STRATEGIC RESPONSES
Seal
ed
Pave
men
ts
Uns
eale
d Pa
vem
ents
Stru
ctur
es
K&
C a
nd
Dra
inag
e
Foot
path
s C
ycle
way
s
Net
wor
k Se
rvic
es
Envi
ronm
enta
l M
aint
enan
ce
Car
Par
king
Publ
ic
Tran
spor
t
Res
ilien
ce
Impr
ovem
ents
Low
Cos
t Low
R
isk
Safe
ty
Prom
otio
n, e
tc
NA
M /
Plan
ning
, et
c
A1 Multi-modal network optimisation & hierarchies across all modes √ √ √ √ √ A2 Promote and encourage change for walking, cycling and public transport √ √ √ √ A3 Implement travel behaviour programmes √ √ √ √ A4 Ensure that new developments support modal choice √ A5 Review freight routes and identify network changes or optimisation √ √ √ √ √ A6 Determine and implement traffic changes to improve behaviours √ √ √ A7 Work with regional groups to optimise community learning √ √
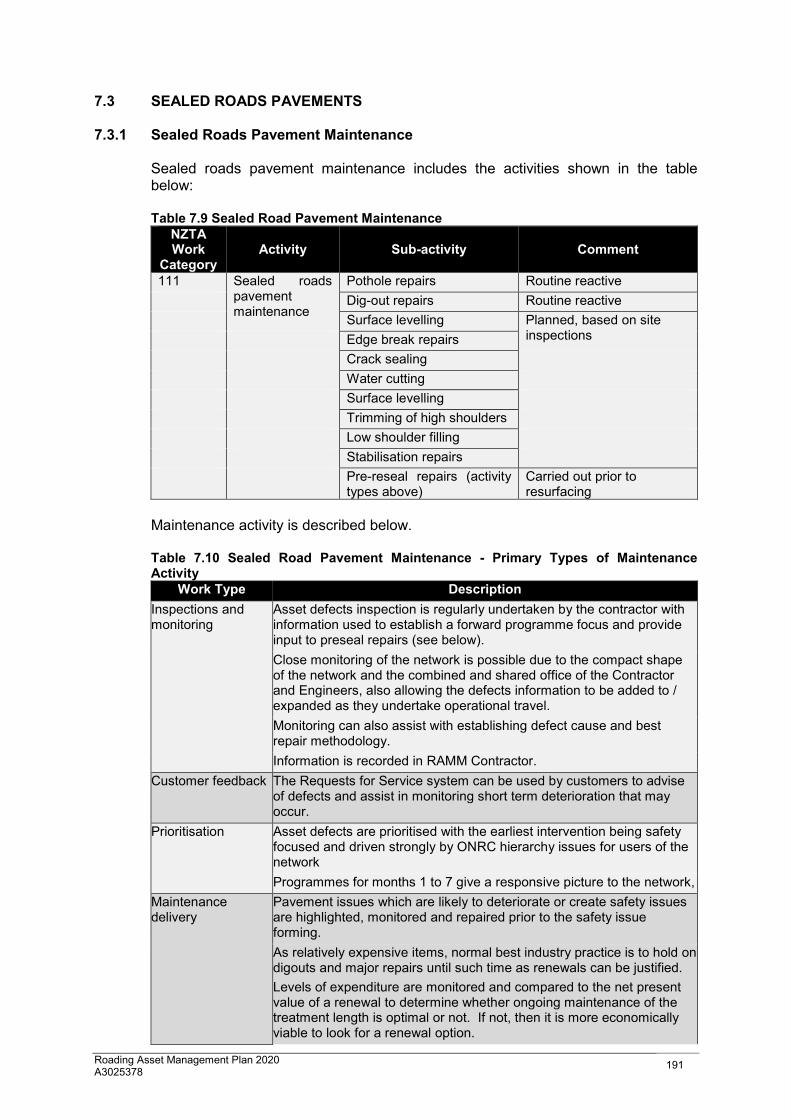
Roading Asset Management Plan 2020 A3025378 191
7.3 SEALED ROADS PAVEMENTS
7.3.1 Sealed Roads Pavement Maintenance Sealed roads pavement maintenance includes the activities shown in the table below: Table 7.9 Sealed Road Pavement Maintenance
NZTA Work
Category Activity Sub-activity Comment
111 Sealed roads pavement maintenance
Pothole repairs Routine reactive Dig-out repairs Routine reactive Surface levelling Planned, based on site
inspections Edge break repairs Crack sealing Water cutting Surface levelling Trimming of high shoulders Low shoulder filling Stabilisation repairs Pre-reseal repairs (activity
types above) Carried out prior to resurfacing
Maintenance activity is described below. Table 7.10 Sealed Road Pavement Maintenance - Primary Types of Maintenance Activity
Work Type Description Inspections and monitoring
Asset defects inspection is regularly undertaken by the contractor with information used to establish a forward programme focus and provide input to preseal repairs (see below). Close monitoring of the network is possible due to the compact shape of the network and the combined and shared office of the Contractor and Engineers, also allowing the defects information to be added to / expanded as they undertake operational travel. Monitoring can also assist with establishing defect cause and best repair methodology. Information is recorded in RAMM Contractor.
Customer feedback The Requests for Service system can be used by customers to advise of defects and assist in monitoring short term deterioration that may occur.
Prioritisation Asset defects are prioritised with the earliest intervention being safety focused and driven strongly by ONRC hierarchy issues for users of the network Programmes for months 1 to 7 give a responsive picture to the network,
Maintenance delivery
Pavement issues which are likely to deteriorate or create safety issues are highlighted, monitored and repaired prior to the safety issue forming. As relatively expensive items, normal best industry practice is to hold on digouts and major repairs until such time as renewals can be justified. Levels of expenditure are monitored and compared to the net present value of a renewal to determine whether ongoing maintenance of the treatment length is optimal or not. If not, then it is more economically viable to look for a renewal option.
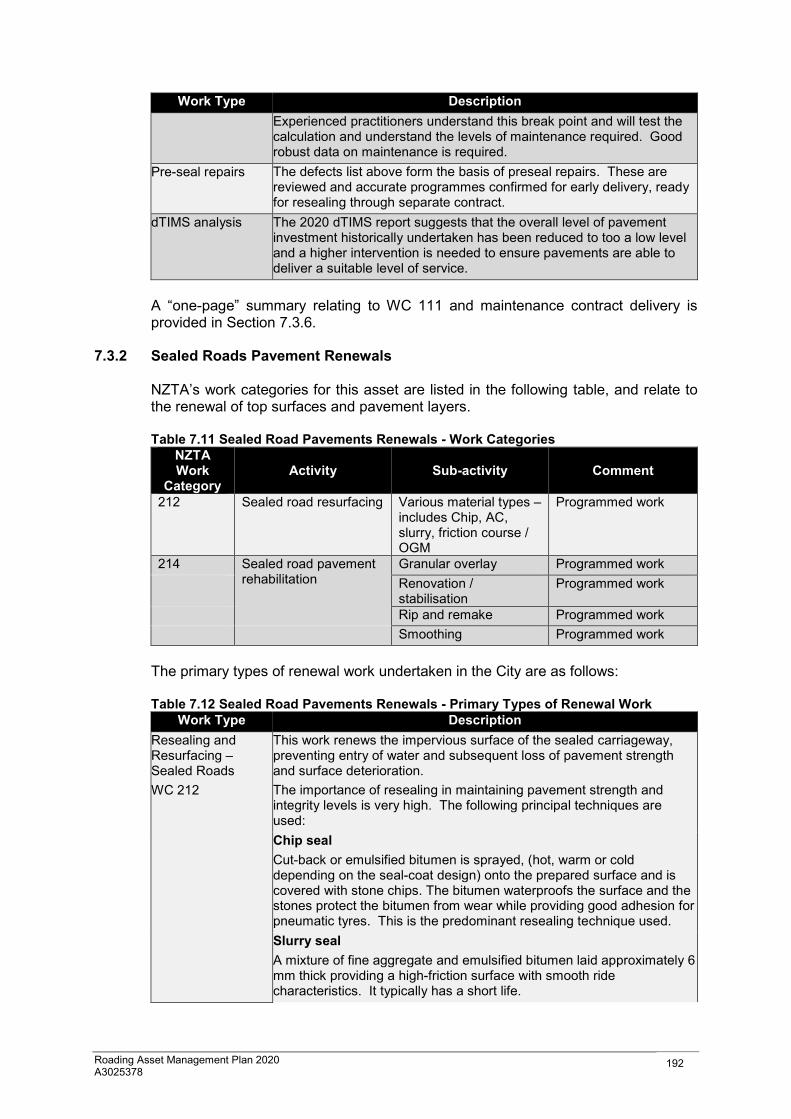
Roading Asset Management Plan 2020 A3025378
192
Work Type Description Experienced practitioners understand this break point and will test the calculation and understand the levels of maintenance required. Good robust data on maintenance is required.
Pre-seal repairs The defects list above form the basis of preseal repairs. These are reviewed and accurate programmes confirmed for early delivery, ready for resealing through separate contract.
dTIMS analysis The 2020 dTIMS report suggests that the overall level of pavement investment historically undertaken has been reduced to too a low level and a higher intervention is needed to ensure pavements are able to deliver a suitable level of service.
A “one-page” summary relating to WC 111 and maintenance contract delivery is provided in Section 7.3.6.
7.3.2 Sealed Roads Pavement Renewals
NZTA’s work categories for this asset are listed in the following table, and relate to the renewal of top surfaces and pavement layers. Table 7.11 Sealed Road Pavements Renewals - Work Categories
NZTA Work
Category Activity Sub-activity Comment
212 Sealed road resurfacing Various material types – includes Chip, AC, slurry, friction course / OGM
Programmed work
214 Sealed road pavement rehabilitation
Granular overlay Programmed work Renovation /
stabilisation Programmed work
Rip and remake Programmed work Smoothing Programmed work
The primary types of renewal work undertaken in the City are as follows: Table 7.12 Sealed Road Pavements Renewals - Primary Types of Renewal Work
Work Type Description Resealing and Resurfacing – Sealed Roads WC 212
This work renews the impervious surface of the sealed carriageway, preventing entry of water and subsequent loss of pavement strength and surface deterioration. The importance of resealing in maintaining pavement strength and integrity levels is very high. The following principal techniques are used: Chip seal Cut-back or emulsified bitumen is sprayed, (hot, warm or cold depending on the seal-coat design) onto the prepared surface and is covered with stone chips. The bitumen waterproofs the surface and the stones protect the bitumen from wear while providing good adhesion for pneumatic tyres. This is the predominant resealing technique used. Slurry seal A mixture of fine aggregate and emulsified bitumen laid approximately 6 mm thick providing a high-friction surface with smooth ride characteristics. It typically has a short life.
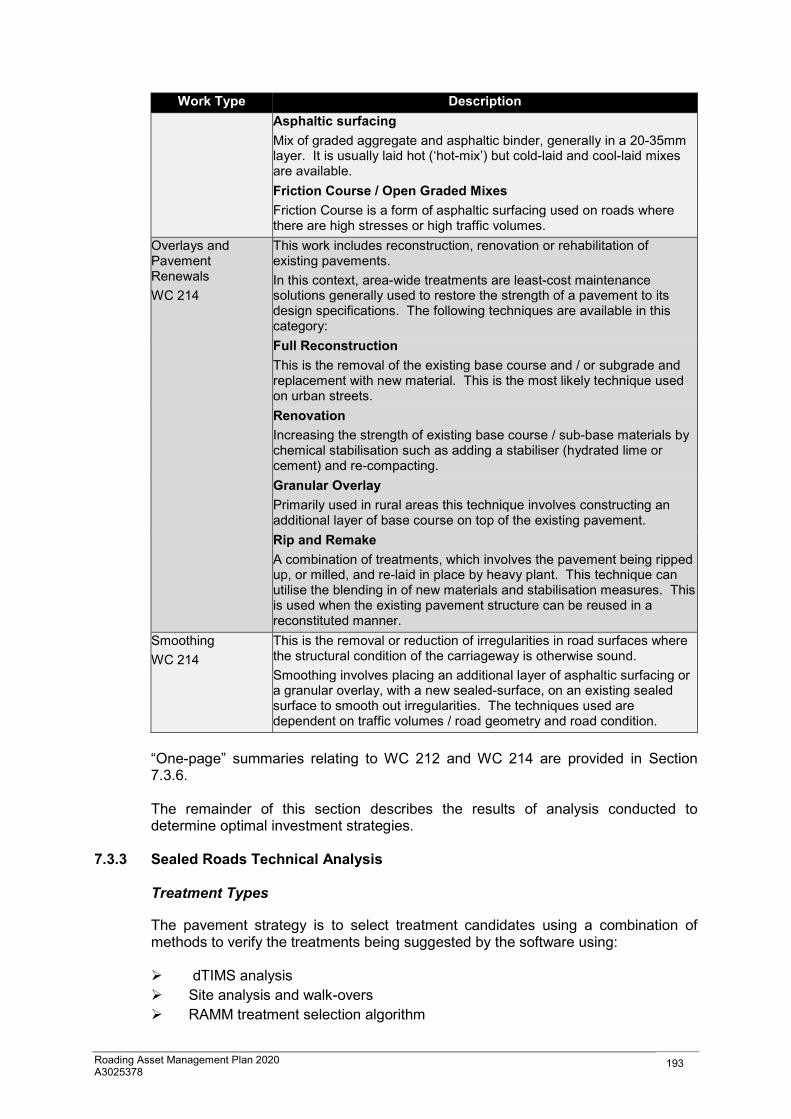
Roading Asset Management Plan 2020 A3025378
193
Work Type Description Asphaltic surfacing Mix of graded aggregate and asphaltic binder, generally in a 20-35mm layer. It is usually laid hot (‘hot-mix’) but cold-laid and cool-laid mixes are available. Friction Course / Open Graded Mixes Friction Course is a form of asphaltic surfacing used on roads where there are high stresses or high traffic volumes.
Overlays and Pavement Renewals WC 214
This work includes reconstruction, renovation or rehabilitation of existing pavements. In this context, area-wide treatments are least-cost maintenance solutions generally used to restore the strength of a pavement to its design specifications. The following techniques are available in this category: Full Reconstruction This is the removal of the existing base course and / or subgrade and replacement with new material. This is the most likely technique used on urban streets. Renovation Increasing the strength of existing base course / sub-base materials by chemical stabilisation such as adding a stabiliser (hydrated lime or cement) and re-compacting. Granular Overlay Primarily used in rural areas this technique involves constructing an additional layer of base course on top of the existing pavement. Rip and Remake A combination of treatments, which involves the pavement being ripped up, or milled, and re-laid in place by heavy plant. This technique can utilise the blending in of new materials and stabilisation measures. This is used when the existing pavement structure can be reused in a reconstituted manner.
Smoothing WC 214
This is the removal or reduction of irregularities in road surfaces where the structural condition of the carriageway is otherwise sound. Smoothing involves placing an additional layer of asphaltic surfacing or a granular overlay, with a new sealed-surface, on an existing sealed surface to smooth out irregularities. The techniques used are dependent on traffic volumes / road geometry and road condition.
“One-page” summaries relating to WC 212 and WC 214 are provided in Section 7.3.6. The remainder of this section describes the results of analysis conducted to determine optimal investment strategies.
7.3.3 Sealed Roads Technical Analysis Treatment Types
The pavement strategy is to select treatment candidates using a combination of methods to verify the treatments being suggested by the software using: dTIMS analysis Site analysis and walk-overs RAMM treatment selection algorithm
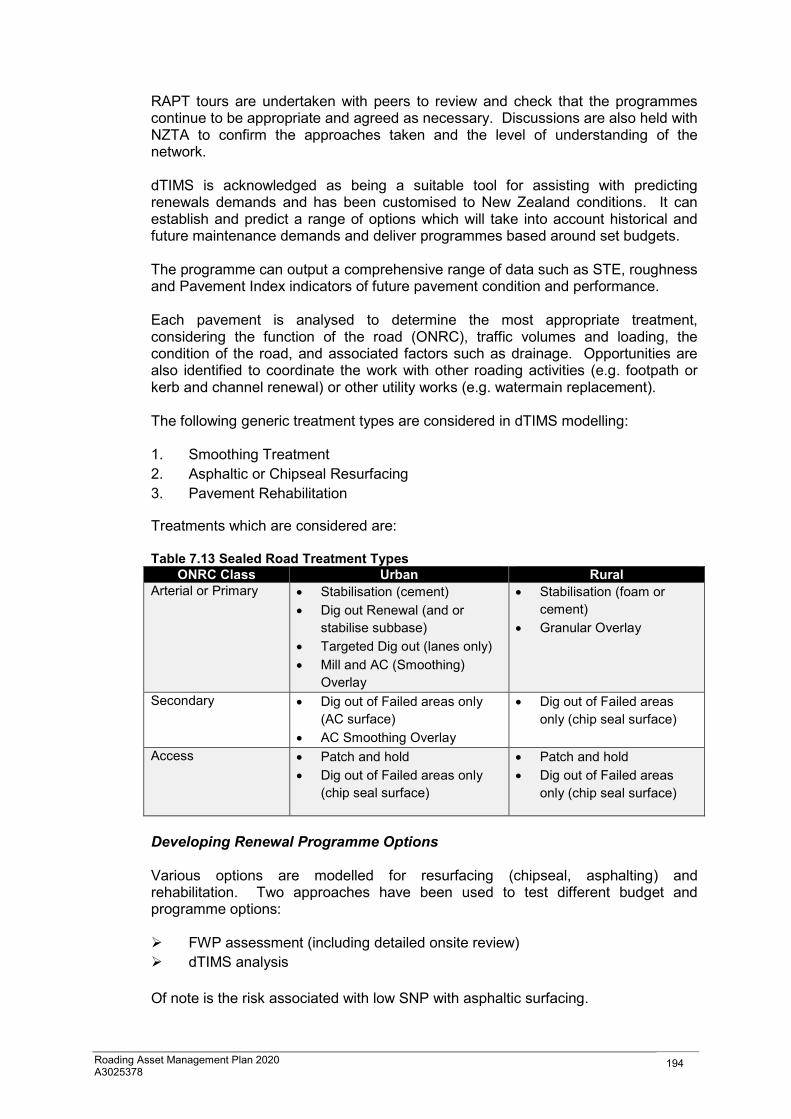
Roading Asset Management Plan 2020 A3025378
194
RAPT tours are undertaken with peers to review and check that the programmes continue to be appropriate and agreed as necessary. Discussions are also held with NZTA to confirm the approaches taken and the level of understanding of the network. dTIMS is acknowledged as being a suitable tool for assisting with predicting renewals demands and has been customised to New Zealand conditions. It can establish and predict a range of options which will take into account historical and future maintenance demands and deliver programmes based around set budgets. The programme can output a comprehensive range of data such as STE, roughness and Pavement Index indicators of future pavement condition and performance. Each pavement is analysed to determine the most appropriate treatment, considering the function of the road (ONRC), traffic volumes and loading, the condition of the road, and associated factors such as drainage. Opportunities are also identified to coordinate the work with other roading activities (e.g. footpath or kerb and channel renewal) or other utility works (e.g. watermain replacement). The following generic treatment types are considered in dTIMS modelling: 1. Smoothing Treatment 2. Asphaltic or Chipseal Resurfacing 3. Pavement Rehabilitation
Treatments which are considered are: Table 7.13 Sealed Road Treatment Types
ONRC Class Urban Rural Arterial or Primary • Stabilisation (cement)
• Dig out Renewal (and or stabilise subbase)
• Targeted Dig out (lanes only) • Mill and AC (Smoothing)
Overlay
• Stabilisation (foam or cement)
• Granular Overlay
Secondary • Dig out of Failed areas only (AC surface)
• AC Smoothing Overlay
• Dig out of Failed areas only (chip seal surface)
Access • Patch and hold • Dig out of Failed areas only
(chip seal surface)
• Patch and hold • Dig out of Failed areas
only (chip seal surface)
Developing Renewal Programme Options
Various options are modelled for resurfacing (chipseal, asphalting) and rehabilitation. Two approaches have been used to test different budget and programme options: FWP assessment (including detailed onsite review) dTIMS analysis Of note is the risk associated with low SNP with asphaltic surfacing.
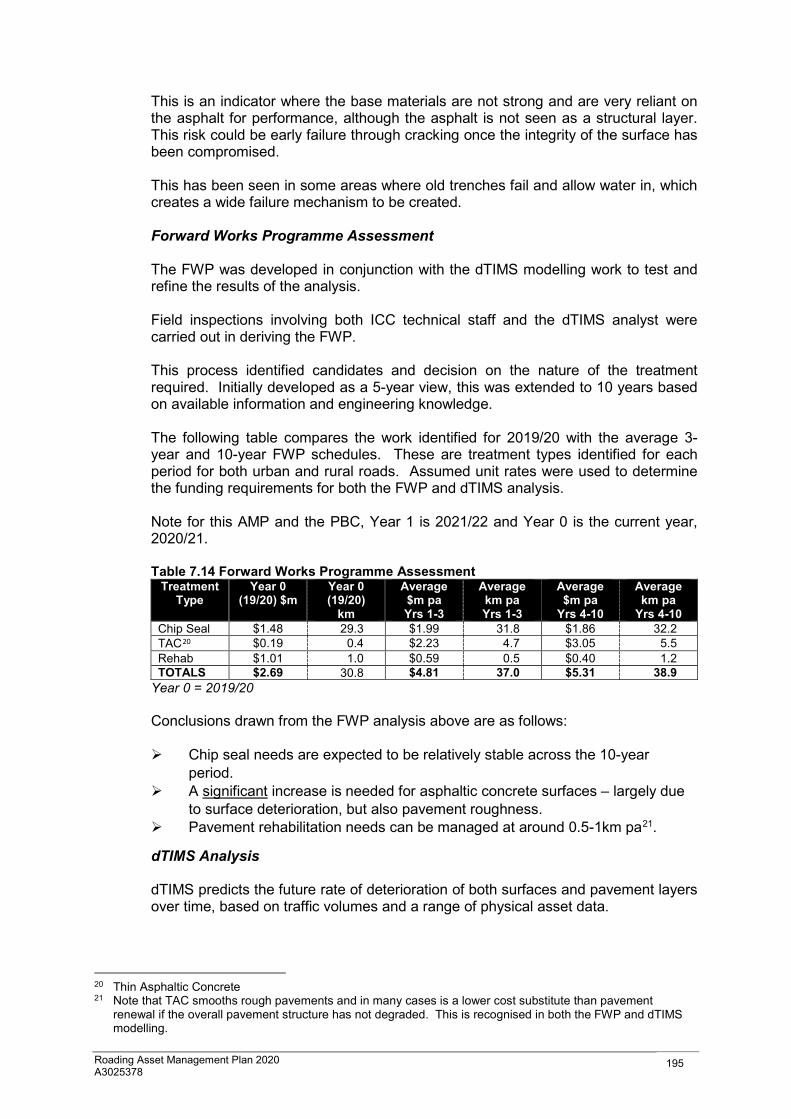
Roading Asset Management Plan 2020 A3025378
195
This is an indicator where the base materials are not strong and are very reliant on the asphalt for performance, although the asphalt is not seen as a structural layer. This risk could be early failure through cracking once the integrity of the surface has been compromised. This has been seen in some areas where old trenches fail and allow water in, which creates a wide failure mechanism to be created.
Forward Works Programme Assessment The FWP was developed in conjunction with the dTIMS modelling work to test and refine the results of the analysis. Field inspections involving both ICC technical staff and the dTIMS analyst were carried out in deriving the FWP. This process identified candidates and decision on the nature of the treatment required. Initially developed as a 5-year view, this was extended to 10 years based on available information and engineering knowledge. The following table compares the work identified for 2019/20 with the average 3-year and 10-year FWP schedules. These are treatment types identified for each period for both urban and rural roads. Assumed unit rates were used to determine the funding requirements for both the FWP and dTIMS analysis. Note for this AMP and the PBC, Year 1 is 2021/22 and Year 0 is the current year, 2020/21. Table 7.14 Forward Works Programme Assessment
Treatment Type
Year 0 (19/20) $m
Year 0 (19/20)
km
Average $m pa Yrs 1-3
Average km pa Yrs 1-3
Average $m pa
Yrs 4-10
Average km pa
Yrs 4-10 Chip Seal $1.48 29.3 $1.99 31.8 $1.86 32.2 TAC20 $0.19 0.4 $2.23 4.7 $3.05 5.5 Rehab $1.01 1.0 $0.59 0.5 $0.40 1.2 TOTALS $2.69 30.8 $4.81 37.0 $5.31 38.9
Year 0 = 2019/20
Conclusions drawn from the FWP analysis above are as follows: Chip seal needs are expected to be relatively stable across the 10-year
period. A significant increase is needed for asphaltic concrete surfaces – largely due
to surface deterioration, but also pavement roughness. Pavement rehabilitation needs can be managed at around 0.5-1km pa21.
dTIMS Analysis
dTIMS predicts the future rate of deterioration of both surfaces and pavement layers over time, based on traffic volumes and a range of physical asset data.
20 Thin Asphaltic Concrete 21 Note that TAC smooths rough pavements and in many cases is a lower cost substitute than pavement
renewal if the overall pavement structure has not degraded. This is recognised in both the FWP and dTIMS modelling.
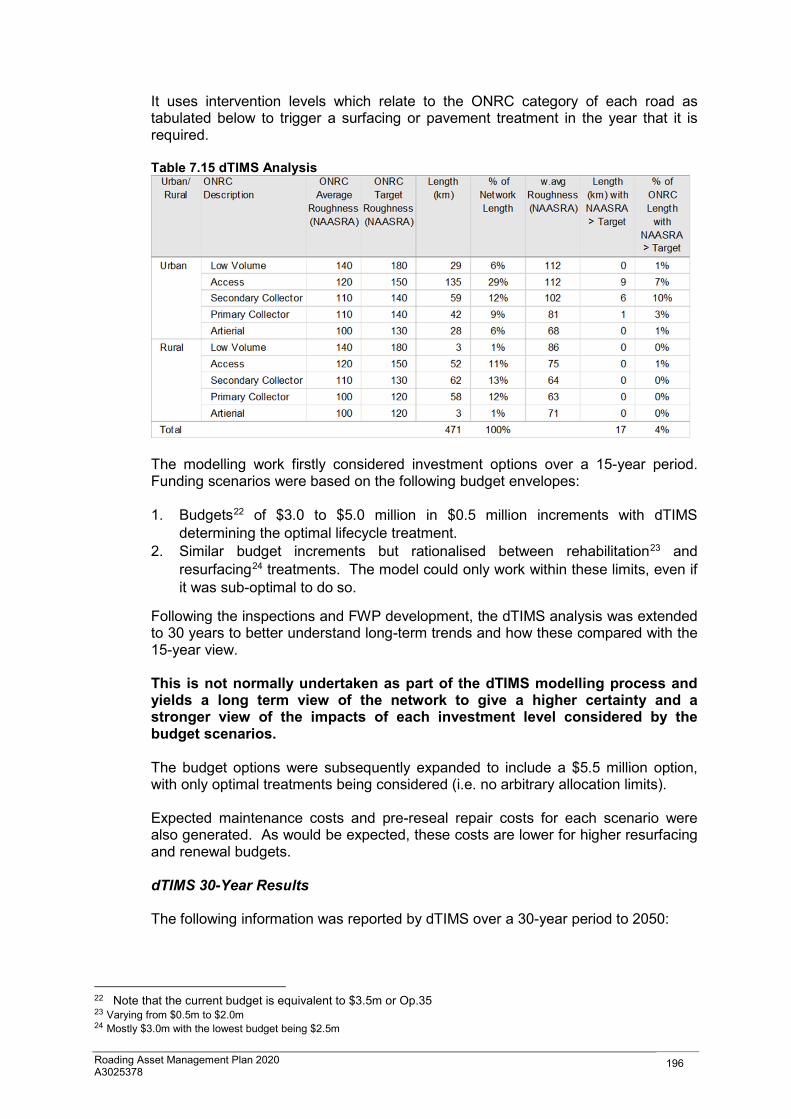
Roading Asset Management Plan 2020 A3025378
196
It uses intervention levels which relate to the ONRC category of each road as tabulated below to trigger a surfacing or pavement treatment in the year that it is required.
Table 7.15 dTIMS Analysis
The modelling work firstly considered investment options over a 15-year period. Funding scenarios were based on the following budget envelopes:
1. Budgets22 of $3.0 to $5.0 million in $0.5 million increments with dTIMS
determining the optimal lifecycle treatment. 2. Similar budget increments but rationalised between rehabilitation23 and
resurfacing24 treatments. The model could only work within these limits, even if it was sub-optimal to do so.
Following the inspections and FWP development, the dTIMS analysis was extended to 30 years to better understand long-term trends and how these compared with the 15-year view. This is not normally undertaken as part of the dTIMS modelling process and yields a long term view of the network to give a higher certainty and a stronger view of the impacts of each investment level considered by the budget scenarios. The budget options were subsequently expanded to include a $5.5 million option, with only optimal treatments being considered (i.e. no arbitrary allocation limits). Expected maintenance costs and pre-reseal repair costs for each scenario were also generated. As would be expected, these costs are lower for higher resurfacing and renewal budgets. dTIMS 30-Year Results The following information was reported by dTIMS over a 30-year period to 2050:
22 Note that the current budget is equivalent to $3.5m or Op.35 23 Varying from $0.5m to $2.0m 24 Mostly $3.0m with the lowest budget being $2.5m
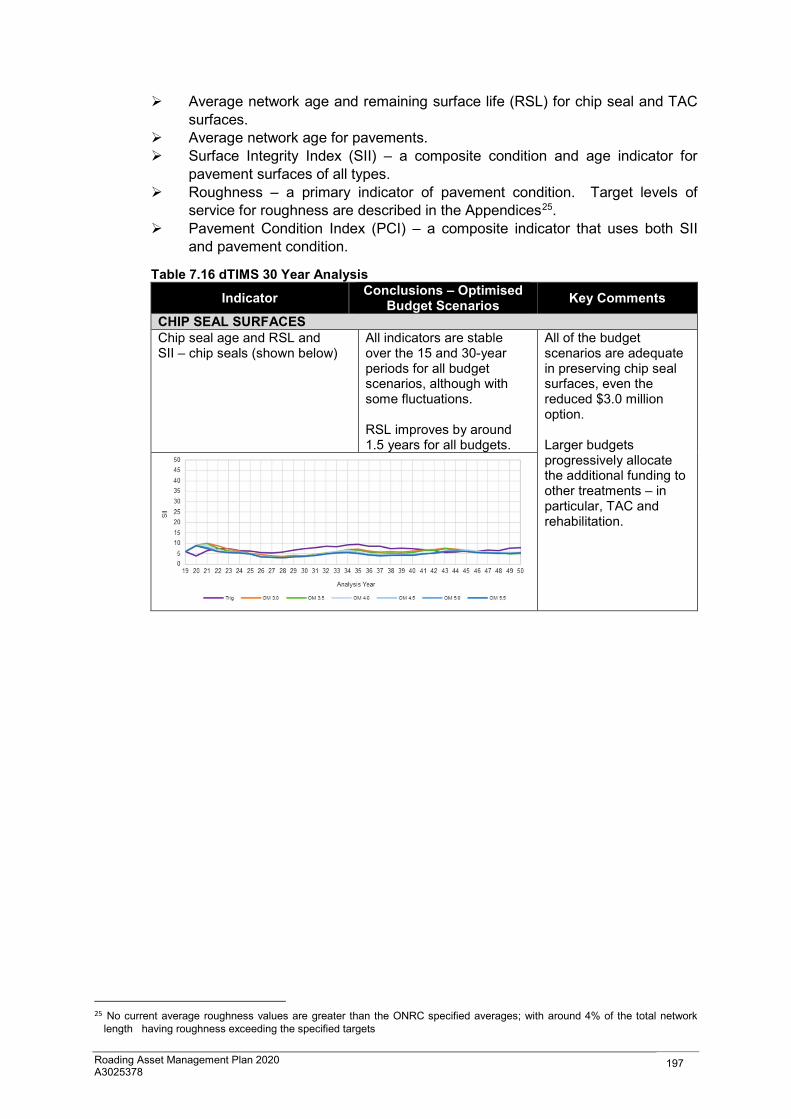
Roading Asset Management Plan 2020 A3025378
197
Average network age and remaining surface life (RSL) for chip seal and TAC surfaces.
Average network age for pavements. Surface Integrity Index (SII) – a composite condition and age indicator for
pavement surfaces of all types. Roughness – a primary indicator of pavement condition. Target levels of
service for roughness are described in the Appendices25. Pavement Condition Index (PCI) – a composite indicator that uses both SII
and pavement condition.
Table 7.16 dTIMS 30 Year Analysis Indicator Conclusions – Optimised
Budget Scenarios Key Comments CHIP SEAL SURFACES Chip seal age and RSL and SII – chip seals (shown below)
All indicators are stable over the 15 and 30-year periods for all budget scenarios, although with some fluctuations. RSL improves by around 1.5 years for all budgets.
All of the budget scenarios are adequate in preserving chip seal surfaces, even the reduced $3.0 million option. Larger budgets progressively allocate the additional funding to other treatments – in particular, TAC and rehabilitation.
25 No current average roughness values are greater than the ONRC specified averages; with around 4% of the total network
length having roughness exceeding the specified targets
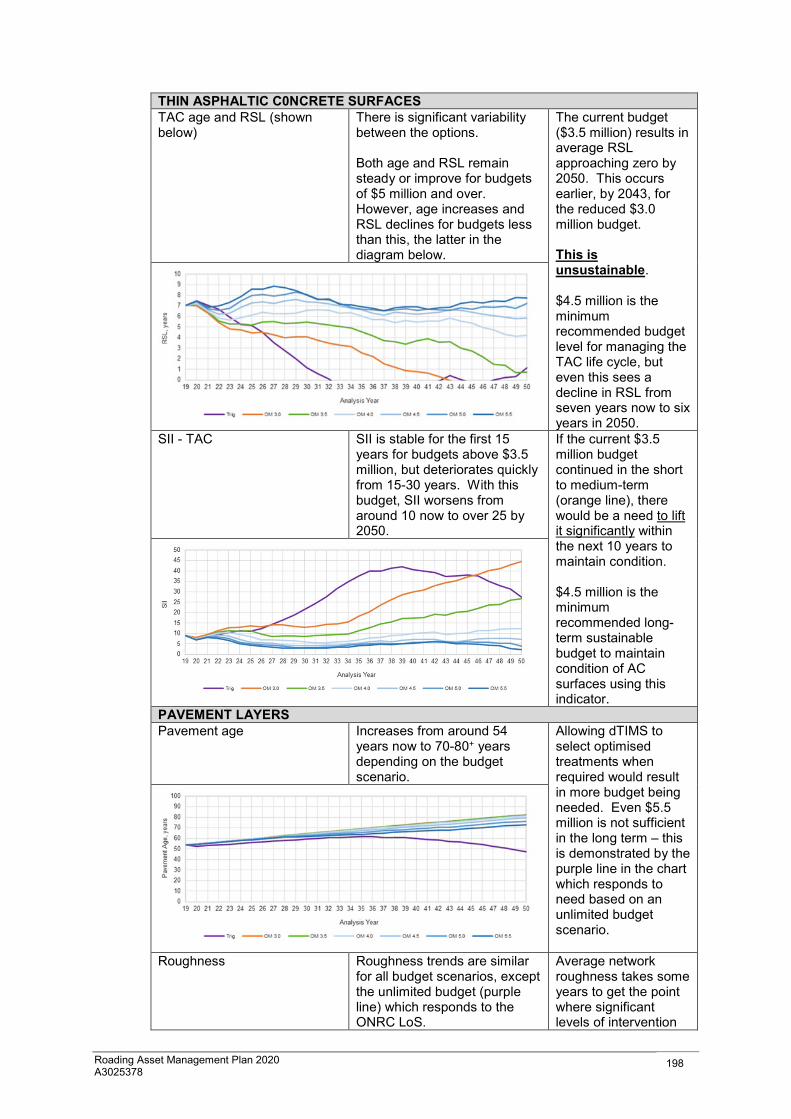
Roading Asset Management Plan 2020 A3025378
198
THIN ASPHALTIC C0NCRETE SURFACES TAC age and RSL (shown below)
There is significant variability between the options. Both age and RSL remain steady or improve for budgets of $5 million and over. However, age increases and RSL declines for budgets less than this, the latter in the diagram below.
The current budget ($3.5 million) results in average RSL approaching zero by 2050. This occurs earlier, by 2043, for the reduced $3.0 million budget. This is unsustainable. $4.5 million is the minimum recommended budget level for managing the TAC life cycle, but even this sees a decline in RSL from seven years now to six years in 2050.
SII - TAC SII is stable for the first 15 years for budgets above $3.5 million, but deteriorates quickly from 15-30 years. With this budget, SII worsens from around 10 now to over 25 by 2050.
If the current $3.5 million budget continued in the short to medium-term (orange line), there would be a need to lift it significantly within the next 10 years to maintain condition. $4.5 million is the minimum recommended long-term sustainable budget to maintain condition of AC surfaces using this indicator.
PAVEMENT LAYERS Pavement age Increases from around 54
years now to 70-80+ years depending on the budget scenario.
Allowing dTIMS to select optimised treatments when required would result in more budget being needed. Even $5.5 million is not sufficient in the long term – this is demonstrated by the purple line in the chart which responds to need based on an unlimited budget scenario.
Roughness Roughness trends are similar
for all budget scenarios, except the unlimited budget (purple line) which responds to the ONRC LoS.
Average network roughness takes some years to get the point where significant levels of intervention
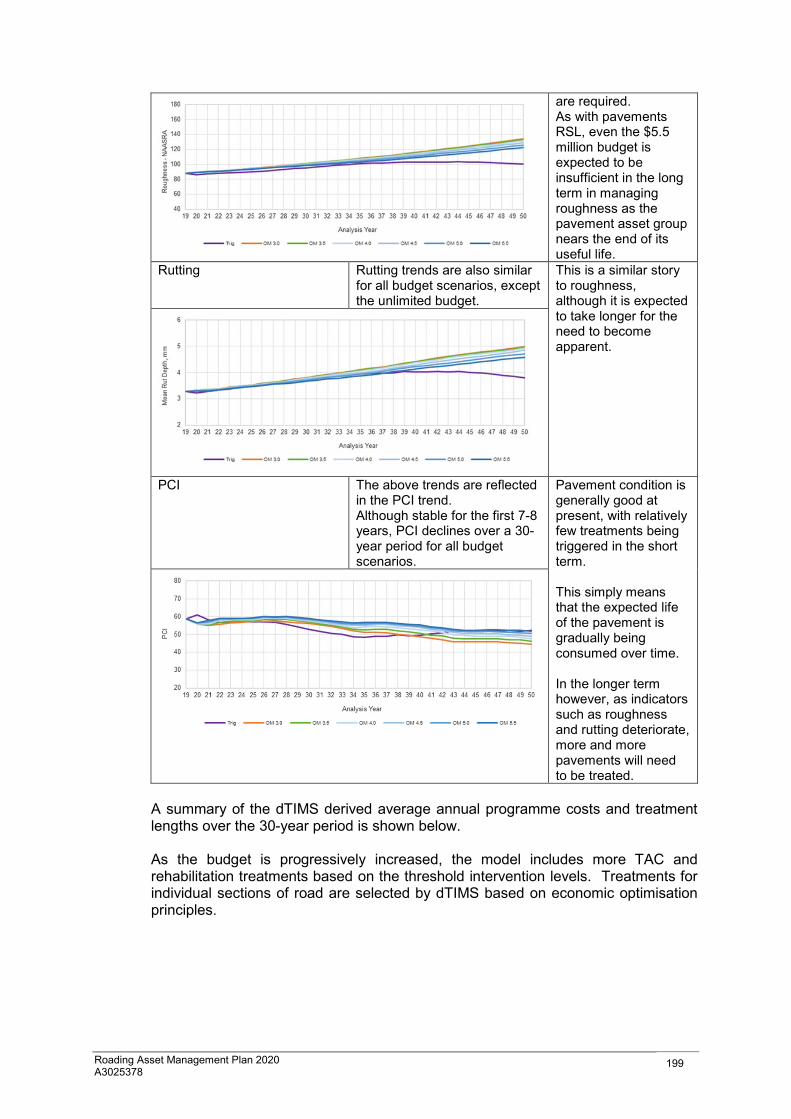
Roading Asset Management Plan 2020 A3025378
199
are required. As with pavements RSL, even the $5.5 million budget is expected to be insufficient in the long term in managing roughness as the pavement asset group nears the end of its useful life.
Rutting Rutting trends are also similar for all budget scenarios, except the unlimited budget.
This is a similar story to roughness, although it is expected to take longer for the need to become apparent.
PCI The above trends are reflected
in the PCI trend. Although stable for the first 7-8 years, PCI declines over a 30-year period for all budget scenarios.
Pavement condition is generally good at present, with relatively few treatments being triggered in the short term. This simply means that the expected life of the pavement is gradually being consumed over time. In the longer term however, as indicators such as roughness and rutting deteriorate, more and more pavements will need to be treated.
A summary of the dTIMS derived average annual programme costs and treatment lengths over the 30-year period is shown below. As the budget is progressively increased, the model includes more TAC and rehabilitation treatments based on the threshold intervention levels. Treatments for individual sections of road are selected by dTIMS based on economic optimisation principles.
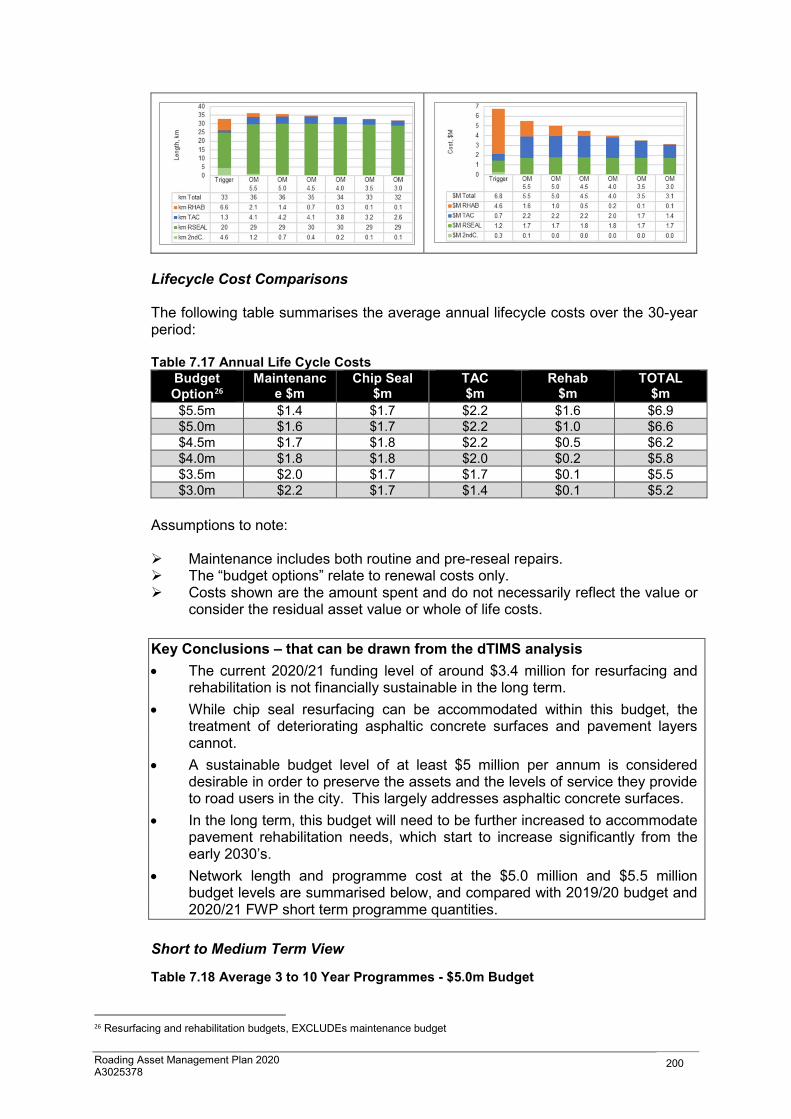
Roading Asset Management Plan 2020 A3025378
200
Lifecycle Cost Comparisons
The following table summarises the average annual lifecycle costs over the 30-year period:
Table 7.17 Annual Life Cycle Costs
Budget Option26
Maintenance $m
Chip Seal $m
TAC $m
Rehab $m
TOTAL $m
$5.5m $1.4 $1.7 $2.2 $1.6 $6.9 $5.0m $1.6 $1.7 $2.2 $1.0 $6.6 $4.5m $1.7 $1.8 $2.2 $0.5 $6.2 $4.0m $1.8 $1.8 $2.0 $0.2 $5.8 $3.5m $2.0 $1.7 $1.7 $0.1 $5.5 $3.0m $2.2 $1.7 $1.4 $0.1 $5.2
Assumptions to note:
Maintenance includes both routine and pre-reseal repairs. The “budget options” relate to renewal costs only. Costs shown are the amount spent and do not necessarily reflect the value or
consider the residual asset value or whole of life costs.
Key Conclusions – that can be drawn from the dTIMS analysis • The current 2020/21 funding level of around $3.4 million for resurfacing and
rehabilitation is not financially sustainable in the long term. • While chip seal resurfacing can be accommodated within this budget, the
treatment of deteriorating asphaltic concrete surfaces and pavement layers cannot.
• A sustainable budget level of at least $5 million per annum is considered desirable in order to preserve the assets and the levels of service they provide to road users in the city. This largely addresses asphaltic concrete surfaces.
• In the long term, this budget will need to be further increased to accommodate pavement rehabilitation needs, which start to increase significantly from the early 2030’s.
• Network length and programme cost at the $5.0 million and $5.5 million budget levels are summarised below, and compared with 2019/20 budget and 2020/21 FWP short term programme quantities.
Short to Medium Term View
Table 7.18 Average 3 to 10 Year Programmes - $5.0m Budget
26 Resurfacing and rehabilitation budgets, EXCLUDEs maintenance budget
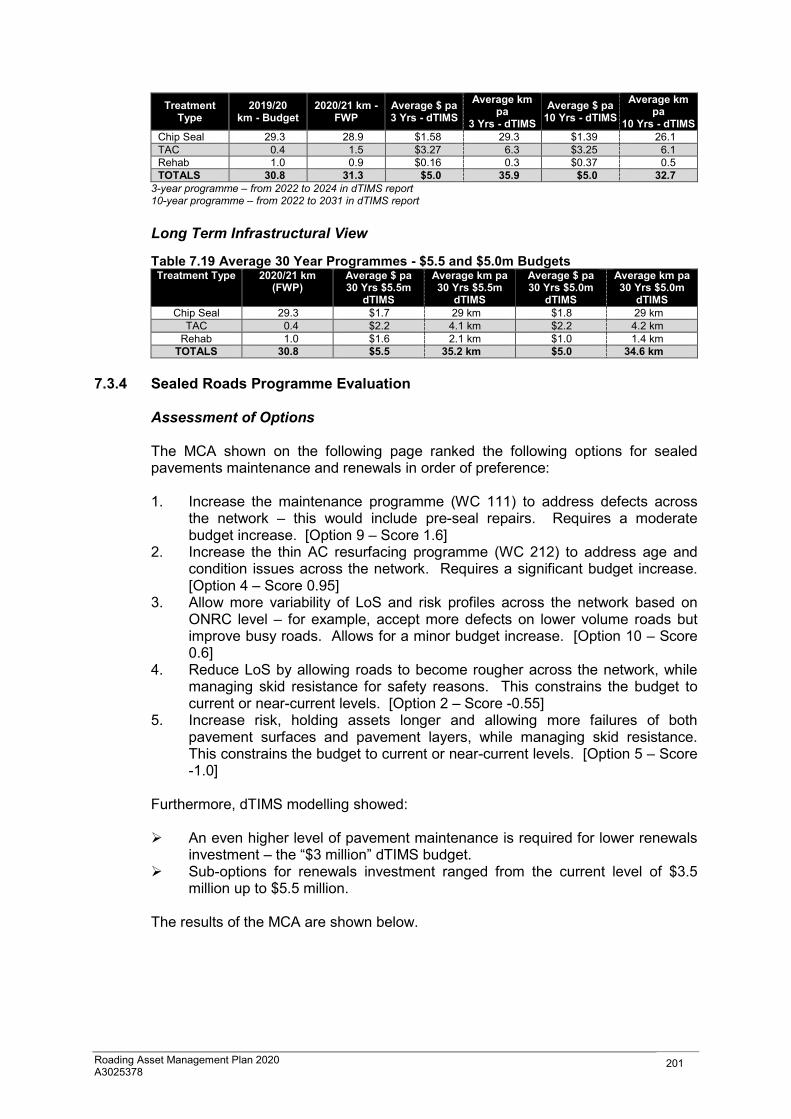
Roading Asset Management Plan 2020 A3025378
201
Treatment Type
2019/20 km - Budget
2020/21 km - FWP
Average $ pa 3 Yrs - dTIMS
Average km pa
3 Yrs - dTIMS Average $ pa
10 Yrs - dTIMS Average km
pa 10 Yrs - dTIMS
Chip Seal 29.3 28.9 $1.58 29.3 $1.39 26.1 TAC 0.4 1.5 $3.27 6.3 $3.25 6.1 Rehab 1.0 0.9 $0.16 0.3 $0.37 0.5 TOTALS 30.8 31.3 $5.0 35.9 $5.0 32.7
3-year programme – from 2022 to 2024 in dTIMS report 10-year programme – from 2022 to 2031 in dTIMS report
Long Term Infrastructural View
Table 7.19 Average 30 Year Programmes - $5.5 and $5.0m Budgets Treatment Type 2020/21 km
(FWP) Average $ pa 30 Yrs $5.5m
dTIMS
Average km pa 30 Yrs $5.5m
dTIMS
Average $ pa 30 Yrs $5.0m
dTIMS
Average km pa 30 Yrs $5.0m
dTIMS Chip Seal 29.3 $1.7 29 km $1.8 29 km
TAC 0.4 $2.2 4.1 km $2.2 4.2 km Rehab 1.0 $1.6 2.1 km $1.0 1.4 km
TOTALS 30.8 $5.5 35.2 km $5.0 34.6 km 7.3.4 Sealed Roads Programme Evaluation
Assessment of Options
The MCA shown on the following page ranked the following options for sealed pavements maintenance and renewals in order of preference: 1. Increase the maintenance programme (WC 111) to address defects across
the network – this would include pre-seal repairs. Requires a moderate budget increase. [Option 9 – Score 1.6]
2. Increase the thin AC resurfacing programme (WC 212) to address age and condition issues across the network. Requires a significant budget increase. [Option 4 – Score 0.95]
3. Allow more variability of LoS and risk profiles across the network based on ONRC level – for example, accept more defects on lower volume roads but improve busy roads. Allows for a minor budget increase. [Option 10 – Score 0.6]
4. Reduce LoS by allowing roads to become rougher across the network, while managing skid resistance for safety reasons. This constrains the budget to current or near-current levels. [Option 2 – Score -0.55]
5. Increase risk, holding assets longer and allowing more failures of both pavement surfaces and pavement layers, while managing skid resistance. This constrains the budget to current or near-current levels. [Option 5 – Score -1.0]
Furthermore, dTIMS modelling showed: An even higher level of pavement maintenance is required for lower renewals
investment – the “$3 million” dTIMS budget. Sub-options for renewals investment ranged from the current level of $3.5
million up to $5.5 million. The results of the MCA are shown below.
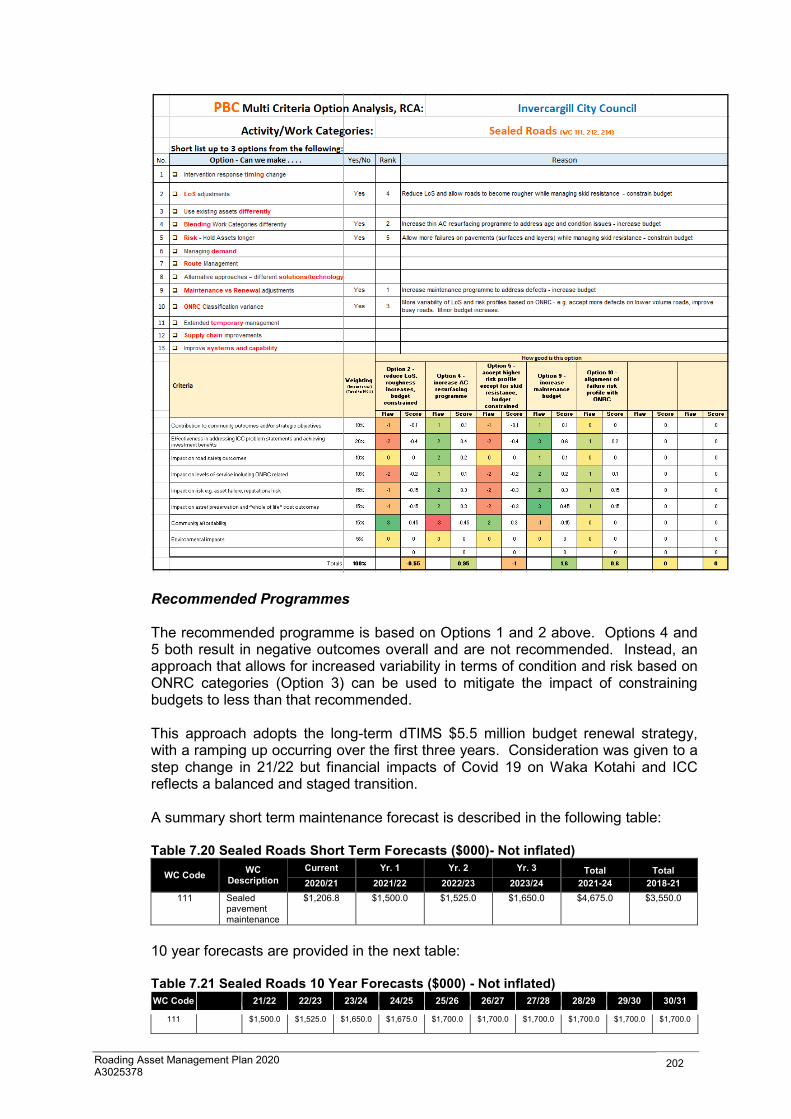
Roading Asset Management Plan 2020 A3025378
202
Recommended Programmes The recommended programme is based on Options 1 and 2 above. Options 4 and 5 both result in negative outcomes overall and are not recommended. Instead, an approach that allows for increased variability in terms of condition and risk based on ONRC categories (Option 3) can be used to mitigate the impact of constraining budgets to less than that recommended. This approach adopts the long-term dTIMS $5.5 million budget renewal strategy, with a ramping up occurring over the first three years. Consideration was given to a step change in 21/22 but financial impacts of Covid 19 on Waka Kotahi and ICC reflects a balanced and staged transition. A summary short term maintenance forecast is described in the following table: Table 7.20 Sealed Roads Short Term Forecasts ($000)- Not inflated)
WC Code WC Description
Current Yr. 1 Yr. 2 Yr. 3 Total Total 2020/21 2021/22 2022/23 2023/24 2021-24 2018-21
111 Sealed pavement maintenance
$1,206.8 $1,500.0 $1,525.0 $1,650.0 $4,675.0 $3,550.0
10 year forecasts are provided in the next table: Table 7.21 Sealed Roads 10 Year Forecasts ($000) - Not inflated) WC Code 21/22 22/23 23/24 24/25 25/26 26/27 27/28 28/29 29/30 30/31
111 $1,500.0 $1,525.0 $1,650.0 $1,675.0 $1,700.0 $1,700.0 $1,700.0 $1,700.0 $1,700.0 $1,700.0
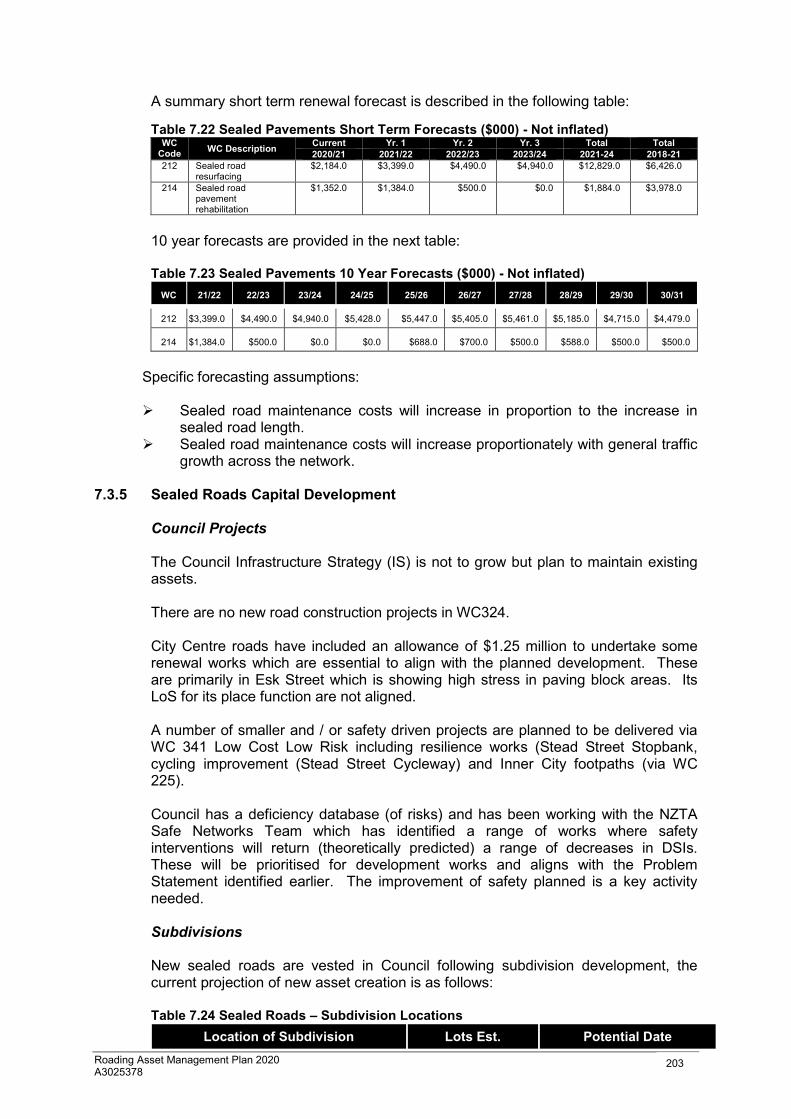
Roading Asset Management Plan 2020 A3025378
203
A summary short term renewal forecast is described in the following table: Table 7.22 Sealed Pavements Short Term Forecasts ($000) - Not inflated)
WC Code WC Description Current Yr. 1 Yr. 2 Yr. 3 Total Total
2020/21 2021/22 2022/23 2023/24 2021-24 2018-21 212 Sealed road
resurfacing $2,184.0 $3,399.0 $4,490.0 $4,940.0 $12,829.0 $6,426.0
214 Sealed road pavement rehabilitation
$1,352.0 $1,384.0 $500.0 $0.0 $1,884.0 $3,978.0
10 year forecasts are provided in the next table: Table 7.23 Sealed Pavements 10 Year Forecasts ($000) - Not inflated)
WC 21/22 22/23 23/24 24/25 25/26 26/27 27/28 28/29 29/30 30/31
212 $3,399.0 $4,490.0 $4,940.0 $5,428.0 $5,447.0 $5,405.0 $5,461.0 $5,185.0 $4,715.0 $4,479.0
214 $1,384.0 $500.0 $0.0 $0.0 $688.0 $700.0 $500.0 $588.0 $500.0 $500.0
Specific forecasting assumptions: Sealed road maintenance costs will increase in proportion to the increase in
sealed road length. Sealed road maintenance costs will increase proportionately with general traffic
growth across the network.
7.3.5 Sealed Roads Capital Development
Council Projects The Council Infrastructure Strategy (IS) is not to grow but plan to maintain existing assets. There are no new road construction projects in WC324. City Centre roads have included an allowance of $1.25 million to undertake some renewal works which are essential to align with the planned development. These are primarily in Esk Street which is showing high stress in paving block areas. Its LoS for its place function are not aligned. A number of smaller and / or safety driven projects are planned to be delivered via WC 341 Low Cost Low Risk including resilience works (Stead Street Stopbank, cycling improvement (Stead Street Cycleway) and Inner City footpaths (via WC 225). Council has a deficiency database (of risks) and has been working with the NZTA Safe Networks Team which has identified a range of works where safety interventions will return (theoretically predicted) a range of decreases in DSIs. These will be prioritised for development works and aligns with the Problem Statement identified earlier. The improvement of safety planned is a key activity needed.
Subdivisions New sealed roads are vested in Council following subdivision development, the current projection of new asset creation is as follows: Table 7.24 Sealed Roads – Subdivision Locations
Location of Subdivision Lots Est. Potential Date
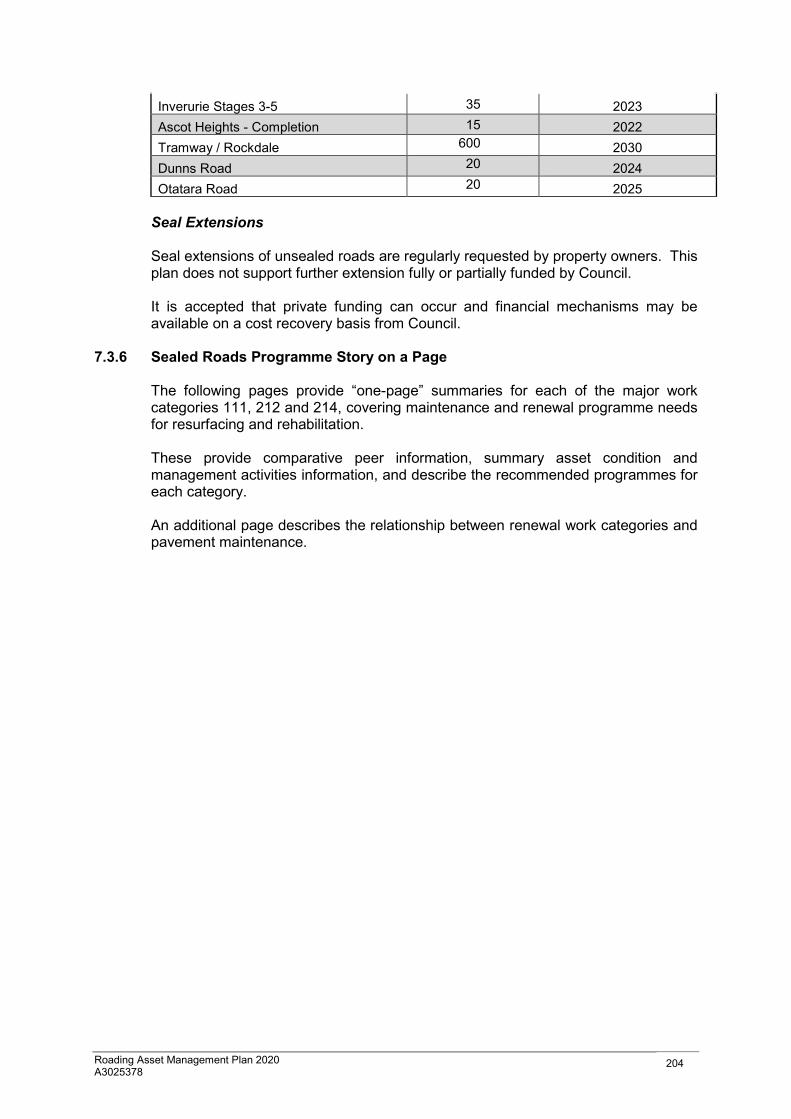
Roading Asset Management Plan 2020 A3025378
204
Inverurie Stages 3-5 35 2023 Ascot Heights - Completion 15 2022 Tramway / Rockdale 600 2030 Dunns Road 20 2024 Otatara Road 20 2025
Seal Extensions
Seal extensions of unsealed roads are regularly requested by property owners. This plan does not support further extension fully or partially funded by Council. It is accepted that private funding can occur and financial mechanisms may be available on a cost recovery basis from Council.
7.3.6 Sealed Roads Programme Story on a Page
The following pages provide “one-page” summaries for each of the major work categories 111, 212 and 214, covering maintenance and renewal programme needs for resurfacing and rehabilitation. These provide comparative peer information, summary asset condition and management activities information, and describe the recommended programmes for each category. An additional page describes the relationship between renewal work categories and pavement maintenance.
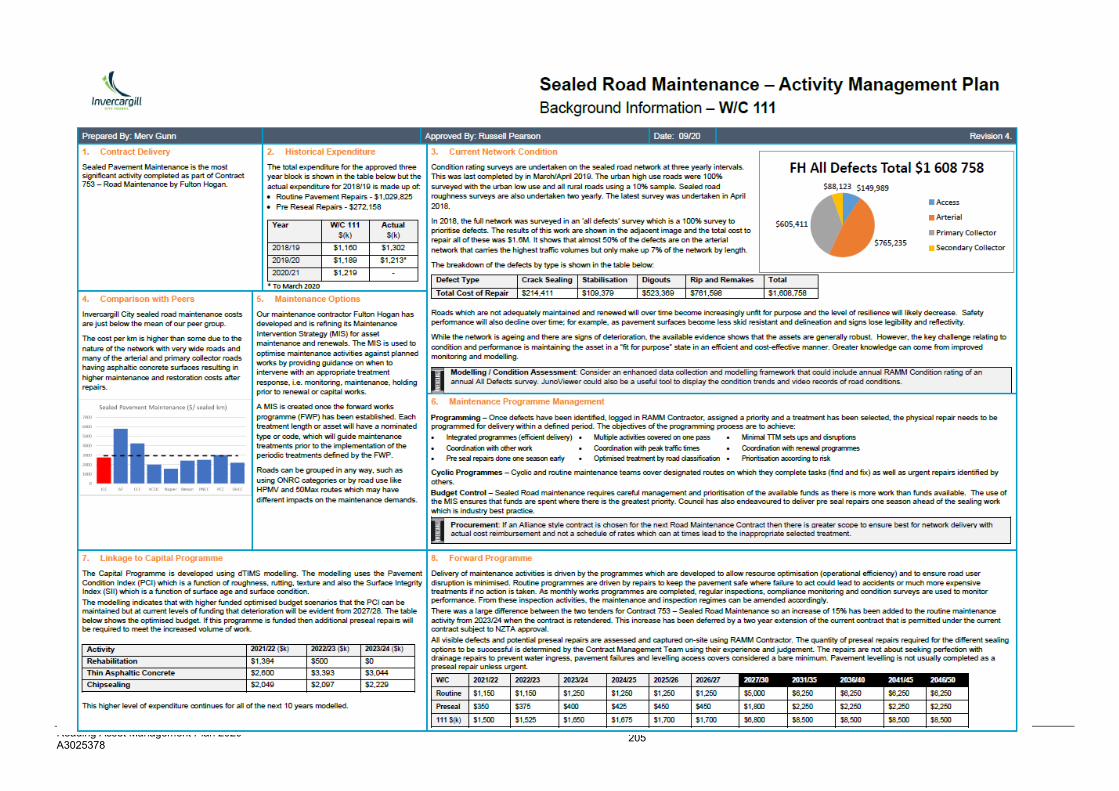
Roading Asset Management Plan 2020 A3025378 205
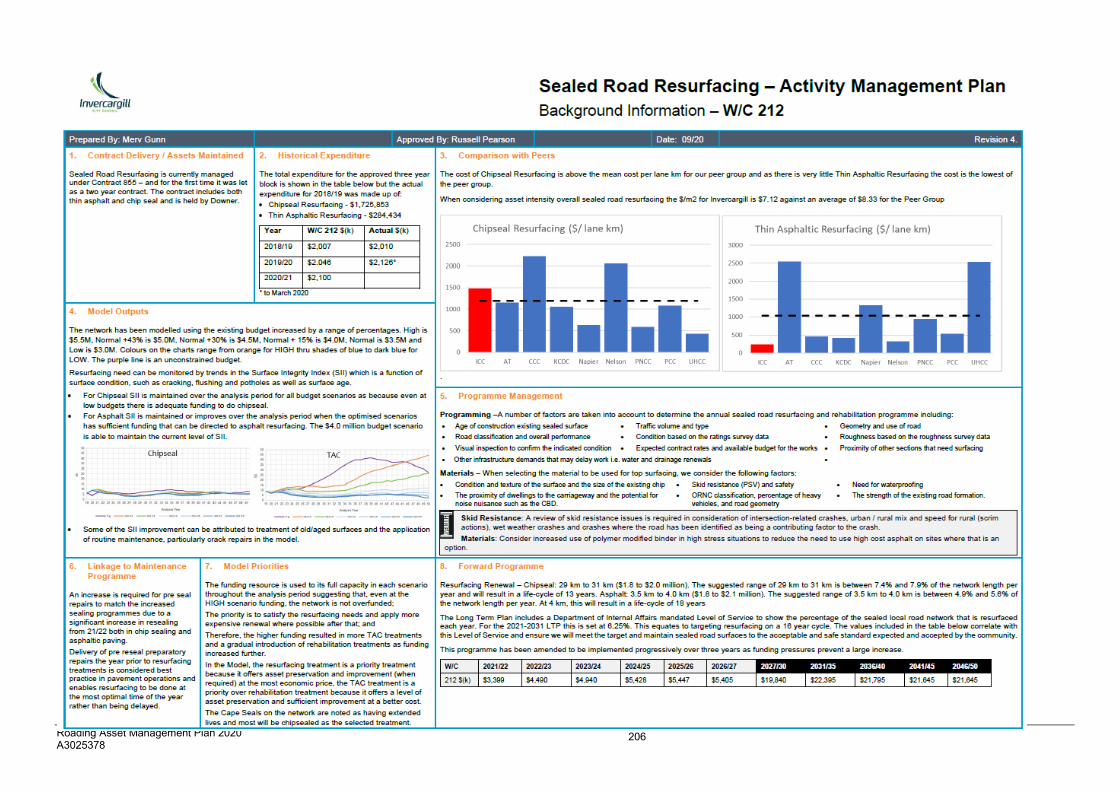
Roading Asset Management Plan 2020 A3025378
206
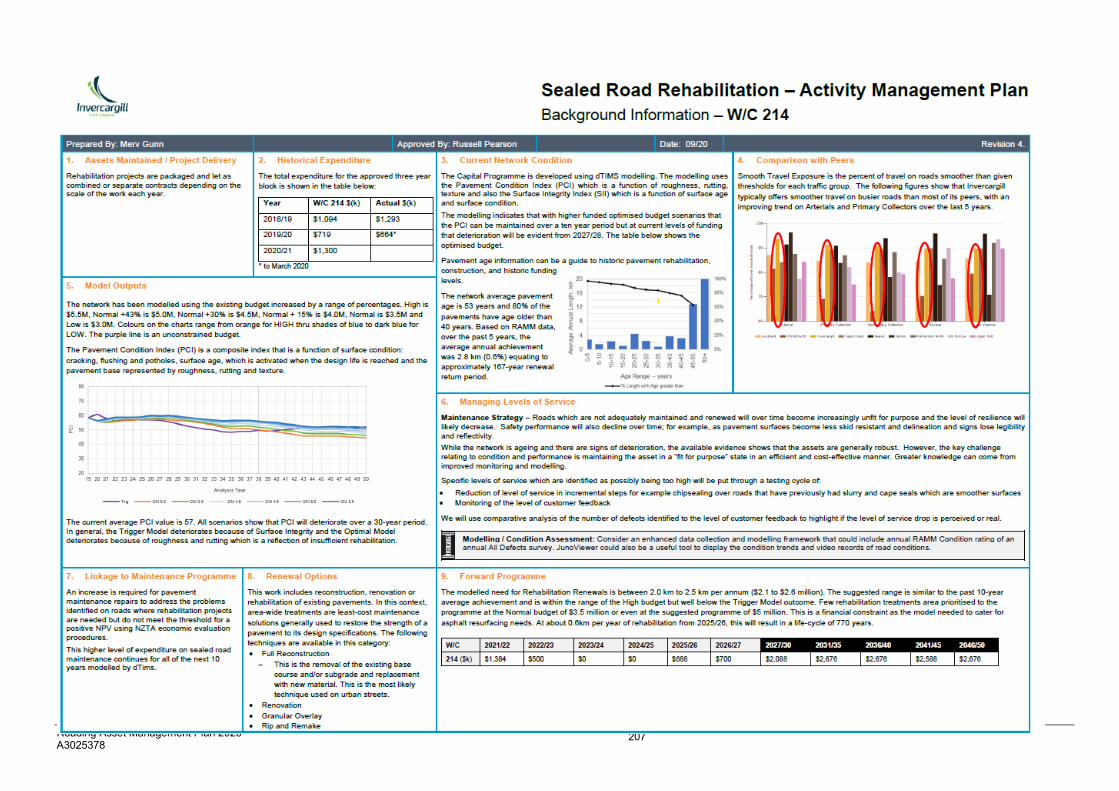
Roading Asset Management Plan 2020 A3025378
207
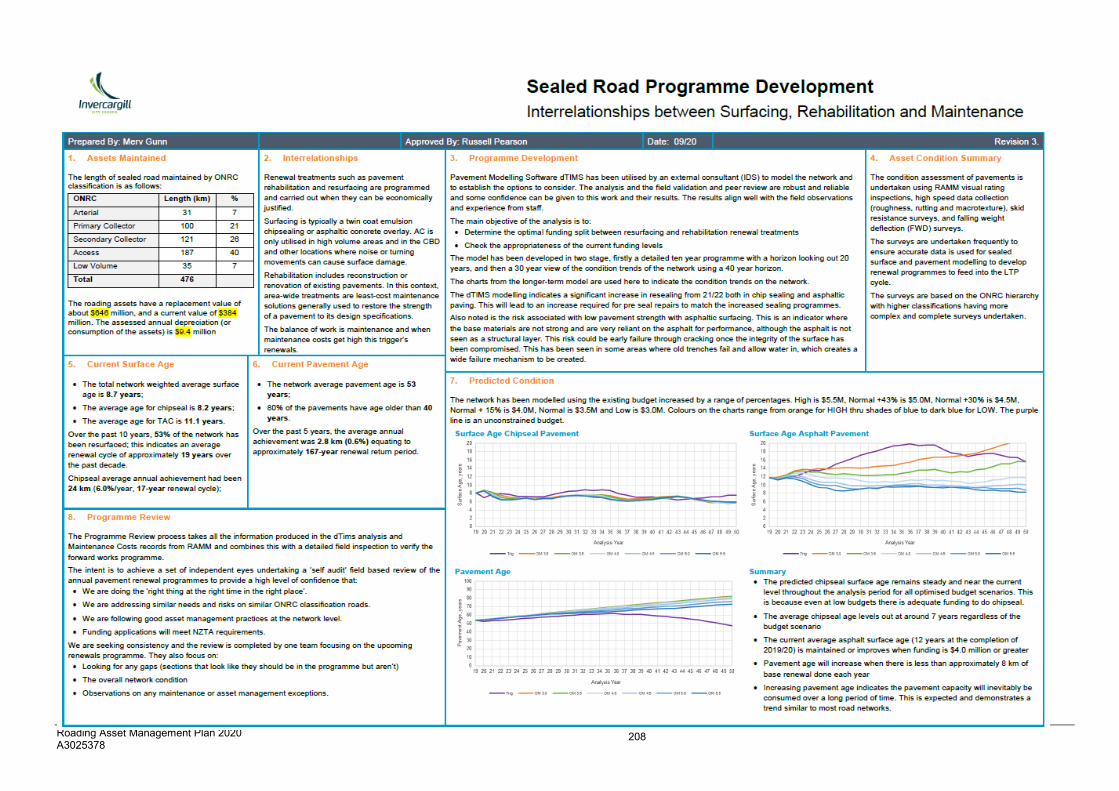
Roading Asset Management Plan 2020 A3025378
208
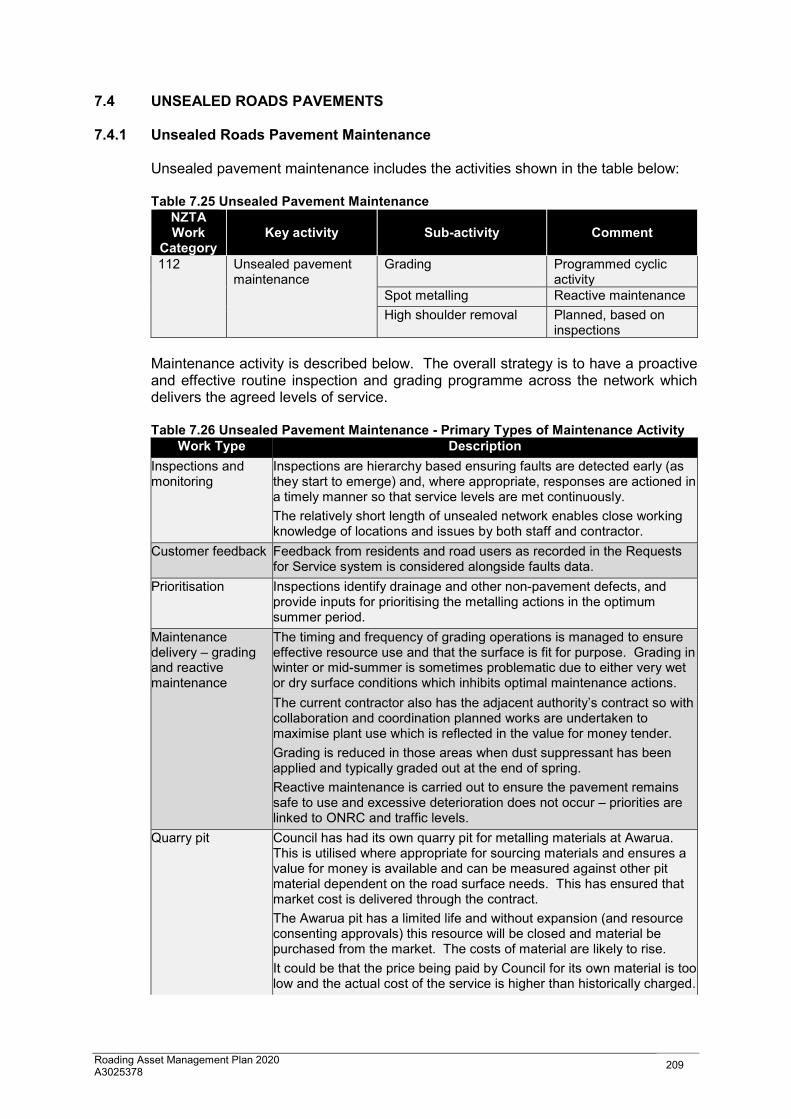
Roading Asset Management Plan 2020 A3025378 209
7.4 UNSEALED ROADS PAVEMENTS
7.4.1 Unsealed Roads Pavement Maintenance Unsealed pavement maintenance includes the activities shown in the table below: Table 7.25 Unsealed Pavement Maintenance
NZTA Work
Category Key activity Sub-activity Comment
112 Unsealed pavement maintenance
Grading Programmed cyclic activity
Spot metalling Reactive maintenance High shoulder removal Planned, based on
inspections Maintenance activity is described below. The overall strategy is to have a proactive and effective routine inspection and grading programme across the network which delivers the agreed levels of service. Table 7.26 Unsealed Pavement Maintenance - Primary Types of Maintenance Activity
Work Type Description Inspections and monitoring
Inspections are hierarchy based ensuring faults are detected early (as they start to emerge) and, where appropriate, responses are actioned in a timely manner so that service levels are met continuously. The relatively short length of unsealed network enables close working knowledge of locations and issues by both staff and contractor.
Customer feedback Feedback from residents and road users as recorded in the Requests for Service system is considered alongside faults data.
Prioritisation Inspections identify drainage and other non-pavement defects, and provide inputs for prioritising the metalling actions in the optimum summer period.
Maintenance delivery – grading and reactive maintenance
The timing and frequency of grading operations is managed to ensure effective resource use and that the surface is fit for purpose. Grading in winter or mid-summer is sometimes problematic due to either very wet or dry surface conditions which inhibits optimal maintenance actions. The current contractor also has the adjacent authority’s contract so with collaboration and coordination planned works are undertaken to maximise plant use which is reflected in the value for money tender. Grading is reduced in those areas when dust suppressant has been applied and typically graded out at the end of spring. Reactive maintenance is carried out to ensure the pavement remains safe to use and excessive deterioration does not occur – priorities are linked to ONRC and traffic levels.
Quarry pit Council has had its own quarry pit for metalling materials at Awarua. This is utilised where appropriate for sourcing materials and ensures a value for money is available and can be measured against other pit material dependent on the road surface needs. This has ensured that market cost is delivered through the contract. The Awarua pit has a limited life and without expansion (and resource consenting approvals) this resource will be closed and material be purchased from the market. The costs of material are likely to rise. It could be that the price being paid by Council for its own material is too low and the actual cost of the service is higher than historically charged.
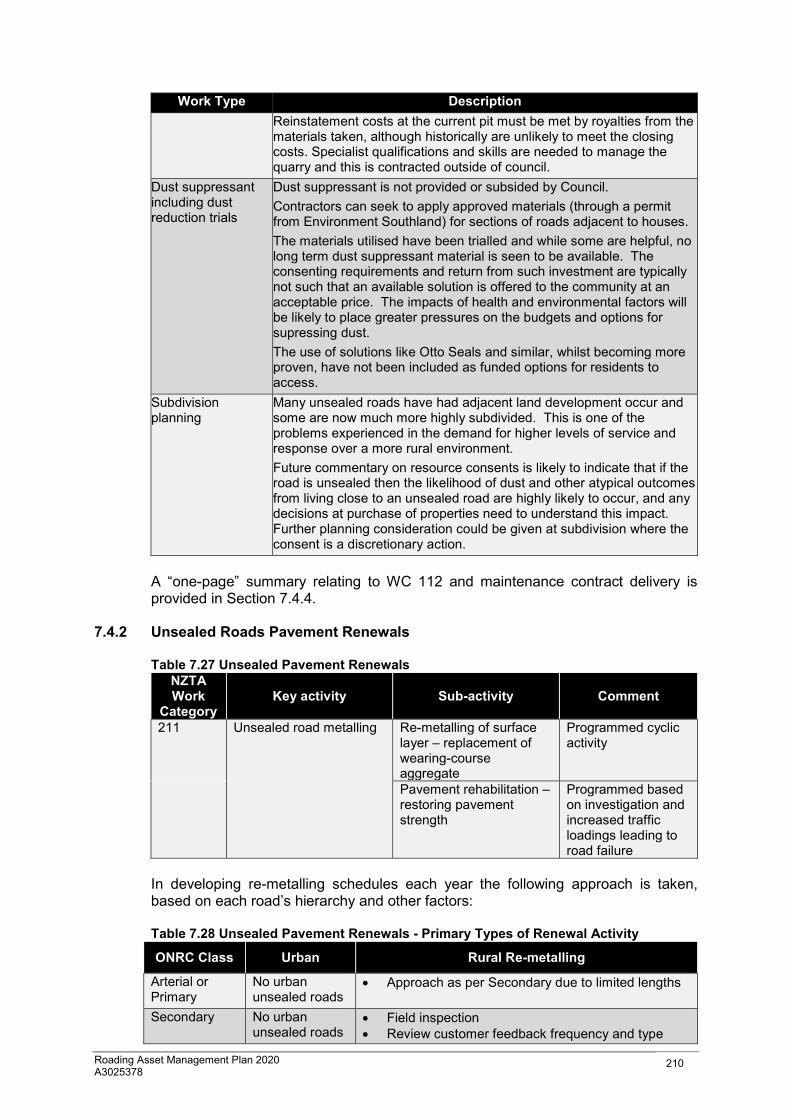
Roading Asset Management Plan 2020 A3025378
210
Work Type Description Reinstatement costs at the current pit must be met by royalties from the
materials taken, although historically are unlikely to meet the closing costs. Specialist qualifications and skills are needed to manage the quarry and this is contracted outside of council.
Dust suppressant including dust reduction trials
Dust suppressant is not provided or subsided by Council. Contractors can seek to apply approved materials (through a permit from Environment Southland) for sections of roads adjacent to houses. The materials utilised have been trialled and while some are helpful, no long term dust suppressant material is seen to be available. The consenting requirements and return from such investment are typically not such that an available solution is offered to the community at an acceptable price. The impacts of health and environmental factors will be likely to place greater pressures on the budgets and options for supressing dust. The use of solutions like Otto Seals and similar, whilst becoming more proven, have not been included as funded options for residents to access.
Subdivision planning
Many unsealed roads have had adjacent land development occur and some are now much more highly subdivided. This is one of the problems experienced in the demand for higher levels of service and response over a more rural environment. Future commentary on resource consents is likely to indicate that if the road is unsealed then the likelihood of dust and other atypical outcomes from living close to an unsealed road are highly likely to occur, and any decisions at purchase of properties need to understand this impact. Further planning consideration could be given at subdivision where the consent is a discretionary action.
A “one-page” summary relating to WC 112 and maintenance contract delivery is provided in Section 7.4.4.
7.4.2 Unsealed Roads Pavement Renewals
Table 7.27 Unsealed Pavement Renewals
NZTA Work
Category Key activity Sub-activity Comment
211 Unsealed road metalling Re-metalling of surface layer – replacement of wearing-course aggregate
Programmed cyclic activity
Pavement rehabilitation – restoring pavement strength
Programmed based on investigation and increased traffic loadings leading to road failure
In developing re-metalling schedules each year the following approach is taken, based on each road’s hierarchy and other factors: Table 7.28 Unsealed Pavement Renewals - Primary Types of Renewal Activity
ONRC Class Urban Rural Re-metalling
Arterial or Primary
No urban unsealed roads
• Approach as per Secondary due to limited lengths
Secondary No urban unsealed roads
• Field inspection • Review customer feedback frequency and type
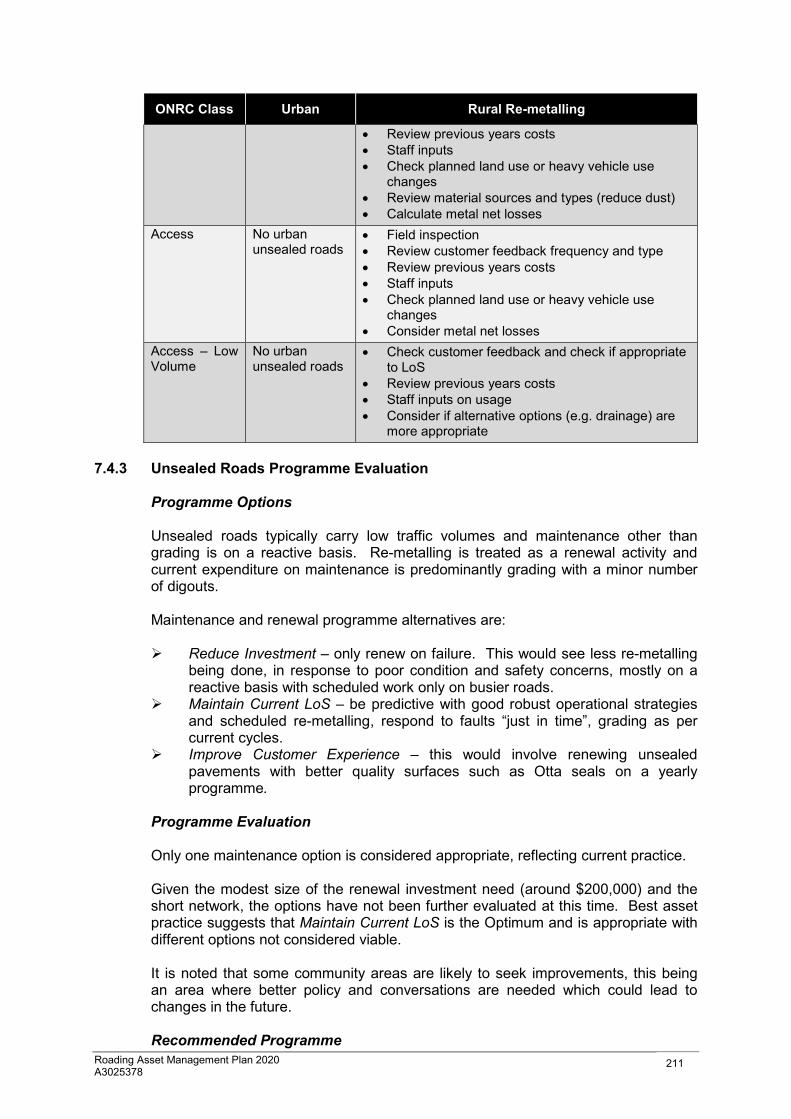
Roading Asset Management Plan 2020 A3025378
211
ONRC Class Urban Rural Re-metalling
• Review previous years costs • Staff inputs • Check planned land use or heavy vehicle use
changes • Review material sources and types (reduce dust) • Calculate metal net losses
Access No urban unsealed roads
• Field inspection • Review customer feedback frequency and type • Review previous years costs • Staff inputs • Check planned land use or heavy vehicle use
changes • Consider metal net losses
Access – Low Volume
No urban unsealed roads
• Check customer feedback and check if appropriate to LoS
• Review previous years costs • Staff inputs on usage • Consider if alternative options (e.g. drainage) are
more appropriate 7.4.3 Unsealed Roads Programme Evaluation
Programme Options
Unsealed roads typically carry low traffic volumes and maintenance other than grading is on a reactive basis. Re-metalling is treated as a renewal activity and current expenditure on maintenance is predominantly grading with a minor number of digouts. Maintenance and renewal programme alternatives are: Reduce Investment – only renew on failure. This would see less re-metalling
being done, in response to poor condition and safety concerns, mostly on a reactive basis with scheduled work only on busier roads.
Maintain Current LoS – be predictive with good robust operational strategies and scheduled re-metalling, respond to faults “just in time”, grading as per current cycles.
Improve Customer Experience – this would involve renewing unsealed pavements with better quality surfaces such as Otta seals on a yearly programme.
Programme Evaluation
Only one maintenance option is considered appropriate, reflecting current practice. Given the modest size of the renewal investment need (around $200,000) and the short network, the options have not been further evaluated at this time. Best asset practice suggests that Maintain Current LoS is the Optimum and is appropriate with different options not considered viable. It is noted that some community areas are likely to seek improvements, this being an area where better policy and conversations are needed which could lead to changes in the future.
Recommended Programme
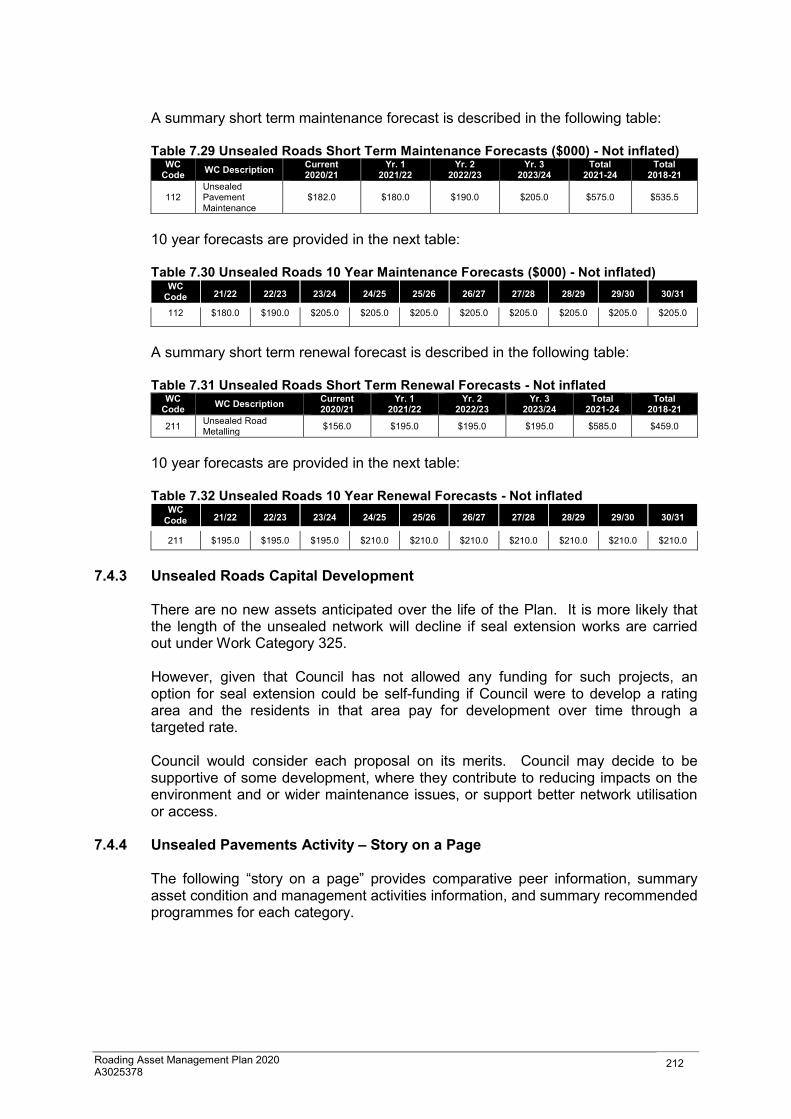
Roading Asset Management Plan 2020 A3025378
212
A summary short term maintenance forecast is described in the following table: Table 7.29 Unsealed Roads Short Term Maintenance Forecasts ($000) - Not inflated)
WC Code WC Description Current
2020/21 Yr. 1
2021/22 Yr. 2
2022/23 Yr. 3
2023/24 Total
2021-24 Total
2018-21
112 Unsealed Pavement Maintenance
$182.0 $180.0 $190.0 $205.0 $575.0 $535.5
10 year forecasts are provided in the next table: Table 7.30 Unsealed Roads 10 Year Maintenance Forecasts ($000) - Not inflated)
WC Code 21/22 22/23 23/24 24/25 25/26 26/27 27/28 28/29 29/30 30/31
112 $180.0 $190.0 $205.0 $205.0 $205.0 $205.0 $205.0 $205.0 $205.0 $205.0
A summary short term renewal forecast is described in the following table: Table 7.31 Unsealed Roads Short Term Renewal Forecasts - Not inflated
WC Code WC Description Current
2020/21 Yr. 1
2021/22 Yr. 2
2022/23 Yr. 3
2023/24 Total
2021-24 Total
2018-21
211 Unsealed Road Metalling $156.0 $195.0 $195.0 $195.0 $585.0 $459.0
10 year forecasts are provided in the next table: Table 7.32 Unsealed Roads 10 Year Renewal Forecasts - Not inflated
WC Code 21/22 22/23 23/24 24/25 25/26 26/27 27/28 28/29 29/30 30/31
211 $195.0 $195.0 $195.0 $210.0 $210.0 $210.0 $210.0 $210.0 $210.0 $210.0
7.4.3 Unsealed Roads Capital Development
There are no new assets anticipated over the life of the Plan. It is more likely that the length of the unsealed network will decline if seal extension works are carried out under Work Category 325. However, given that Council has not allowed any funding for such projects, an option for seal extension could be self-funding if Council were to develop a rating area and the residents in that area pay for development over time through a targeted rate. Council would consider each proposal on its merits. Council may decide to be supportive of some development, where they contribute to reducing impacts on the environment and or wider maintenance issues, or support better network utilisation or access.
7.4.4 Unsealed Pavements Activity – Story on a Page The following “story on a page” provides comparative peer information, summary asset condition and management activities information, and summary recommended programmes for each category.
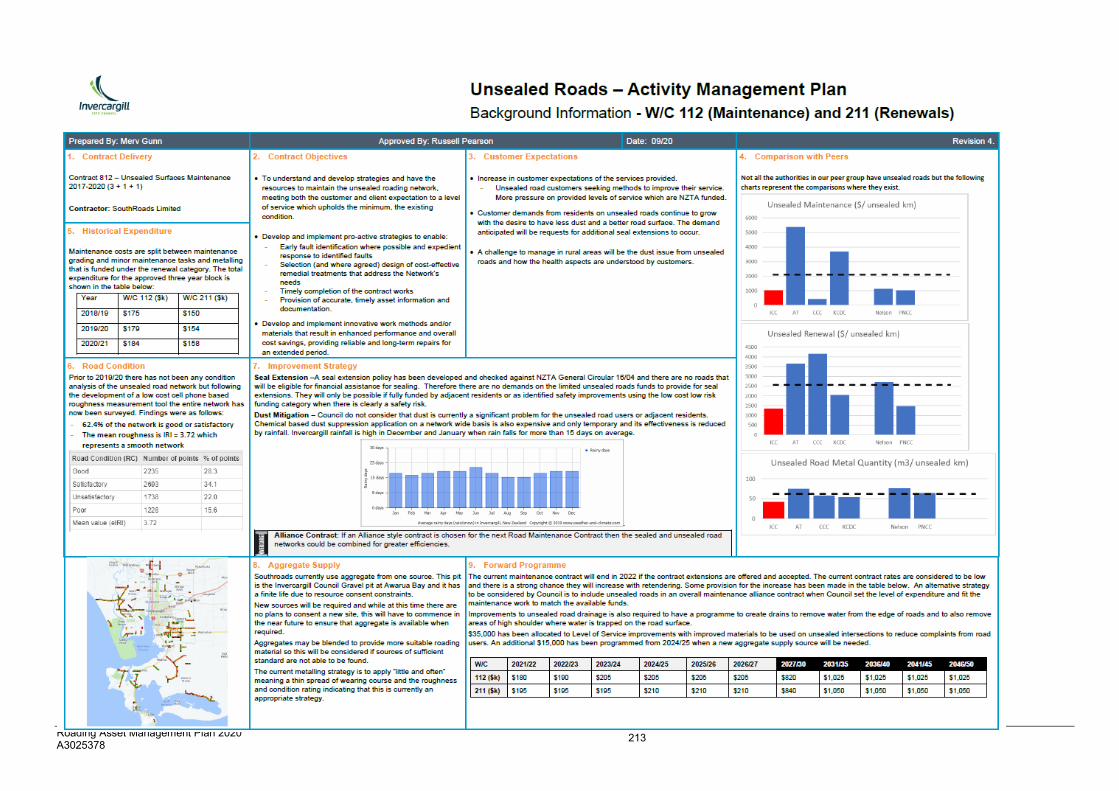
Roading Asset Management Plan 2020 A3025378 213
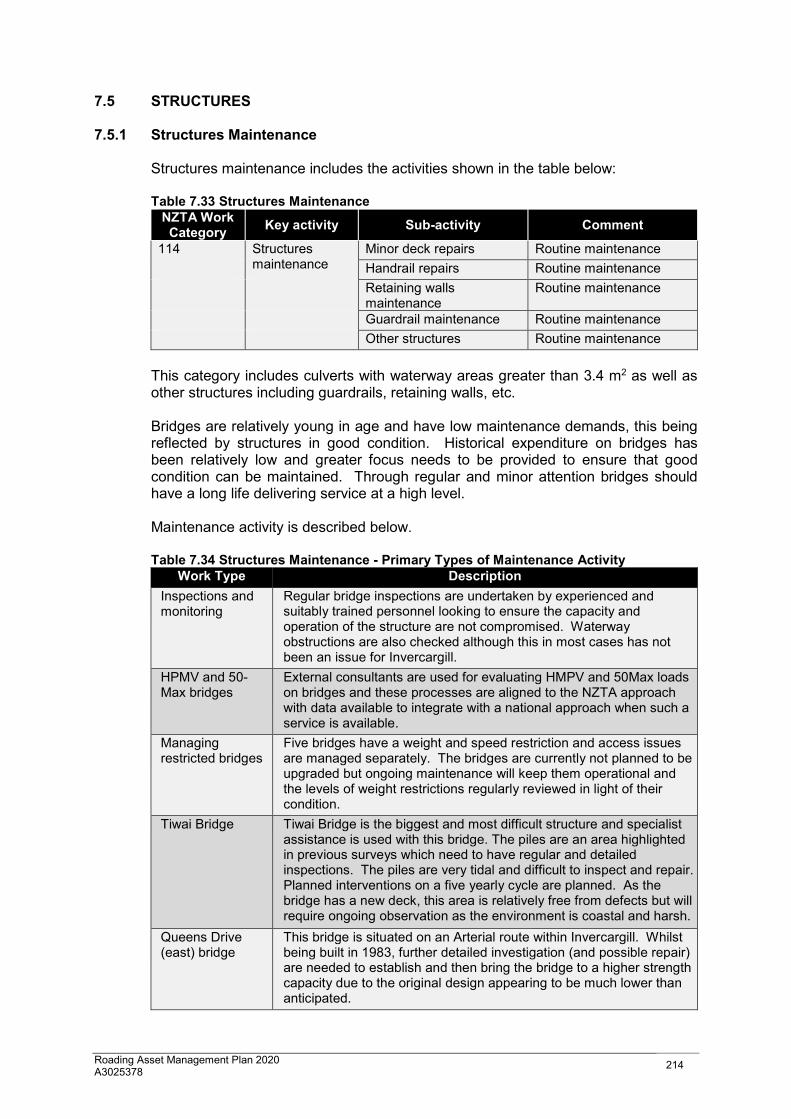
Roading Asset Management Plan 2020 A3025378 214
7.5 STRUCTURES
7.5.1 Structures Maintenance Structures maintenance includes the activities shown in the table below: Table 7.33 Structures Maintenance
NZTA Work Category Key activity Sub-activity Comment
114 Structures maintenance
Minor deck repairs Routine maintenance Handrail repairs Routine maintenance
Retaining walls maintenance
Routine maintenance
Guardrail maintenance Routine maintenance Other structures Routine maintenance
This category includes culverts with waterway areas greater than 3.4 m2 as well as other structures including guardrails, retaining walls, etc. Bridges are relatively young in age and have low maintenance demands, this being reflected by structures in good condition. Historical expenditure on bridges has been relatively low and greater focus needs to be provided to ensure that good condition can be maintained. Through regular and minor attention bridges should have a long life delivering service at a high level. Maintenance activity is described below. Table 7.34 Structures Maintenance - Primary Types of Maintenance Activity
Work Type Description Inspections and monitoring
Regular bridge inspections are undertaken by experienced and suitably trained personnel looking to ensure the capacity and operation of the structure are not compromised. Waterway obstructions are also checked although this in most cases has not been an issue for Invercargill.
HPMV and 50-Max bridges
External consultants are used for evaluating HMPV and 50Max loads on bridges and these processes are aligned to the NZTA approach with data available to integrate with a national approach when such a service is available.
Managing restricted bridges
Five bridges have a weight and speed restriction and access issues are managed separately. The bridges are currently not planned to be upgraded but ongoing maintenance will keep them operational and the levels of weight restrictions regularly reviewed in light of their condition.
Tiwai Bridge Tiwai Bridge is the biggest and most difficult structure and specialist assistance is used with this bridge. The piles are an area highlighted in previous surveys which need to have regular and detailed inspections. The piles are very tidal and difficult to inspect and repair. Planned interventions on a five yearly cycle are planned. As the bridge has a new deck, this area is relatively free from defects but will require ongoing observation as the environment is coastal and harsh.
Queens Drive (east) bridge
This bridge is situated on an Arterial route within Invercargill. Whilst being built in 1983, further detailed investigation (and possible repair) are needed to establish and then bring the bridge to a higher strength capacity due to the original design appearing to be much lower than anticipated.
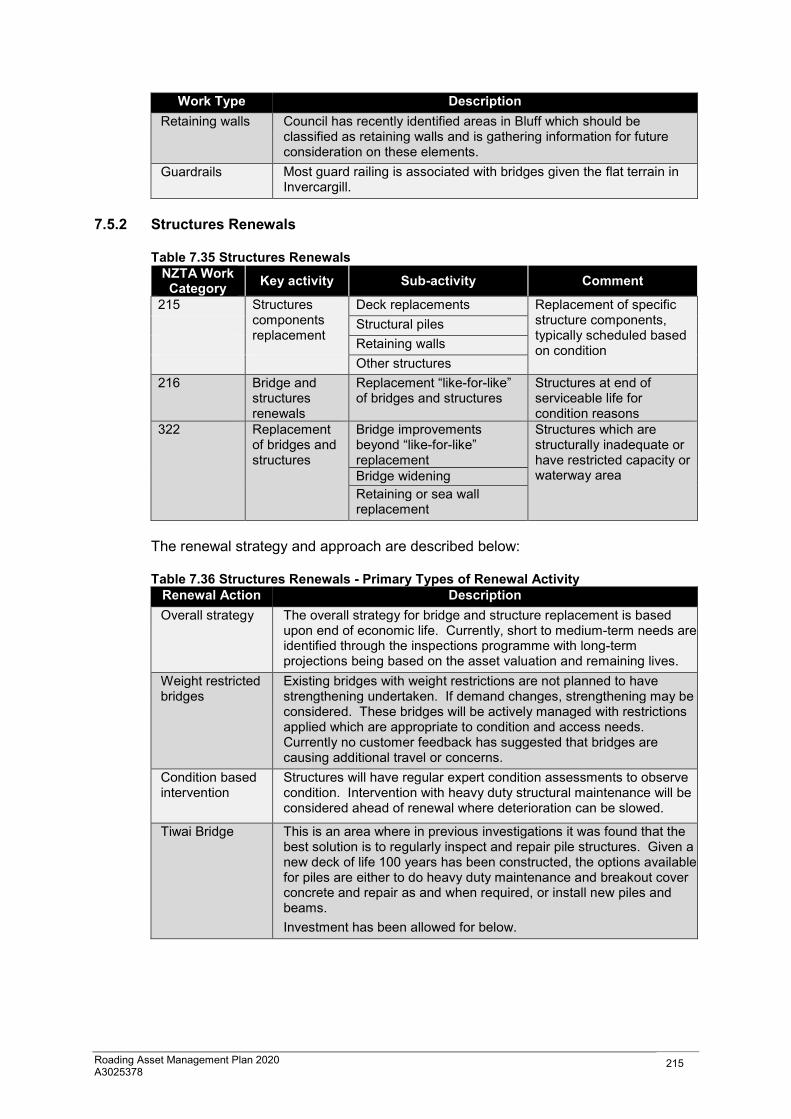
Roading Asset Management Plan 2020 A3025378
215
Work Type Description Retaining walls Council has recently identified areas in Bluff which should be
classified as retaining walls and is gathering information for future consideration on these elements.
Guardrails Most guard railing is associated with bridges given the flat terrain in Invercargill.
7.5.2 Structures Renewals
Table 7.35 Structures Renewals
NZTA Work Category Key activity Sub-activity Comment
215 Structures components replacement
Deck replacements Replacement of specific structure components, typically scheduled based on condition
Structural piles Retaining walls Other structures 216 Bridge and
structures renewals
Replacement “like-for-like” of bridges and structures
Structures at end of serviceable life for condition reasons
322 Replacement of bridges and structures
Bridge improvements beyond “like-for-like” replacement
Structures which are structurally inadequate or have restricted capacity or waterway area Bridge widening
Retaining or sea wall replacement
The renewal strategy and approach are described below: Table 7.36 Structures Renewals - Primary Types of Renewal Activity
Renewal Action Description Overall strategy The overall strategy for bridge and structure replacement is based
upon end of economic life. Currently, short to medium-term needs are identified through the inspections programme with long-term projections being based on the asset valuation and remaining lives.
Weight restricted bridges
Existing bridges with weight restrictions are not planned to have strengthening undertaken. If demand changes, strengthening may be considered. These bridges will be actively managed with restrictions applied which are appropriate to condition and access needs. Currently no customer feedback has suggested that bridges are causing additional travel or concerns.
Condition based intervention
Structures will have regular expert condition assessments to observe condition. Intervention with heavy duty structural maintenance will be considered ahead of renewal where deterioration can be slowed.
Tiwai Bridge This is an area where in previous investigations it was found that the best solution is to regularly inspect and repair pile structures. Given a new deck of life 100 years has been constructed, the options available for piles are either to do heavy duty maintenance and breakout cover concrete and repair as and when required, or install new piles and beams. Investment has been allowed for below.
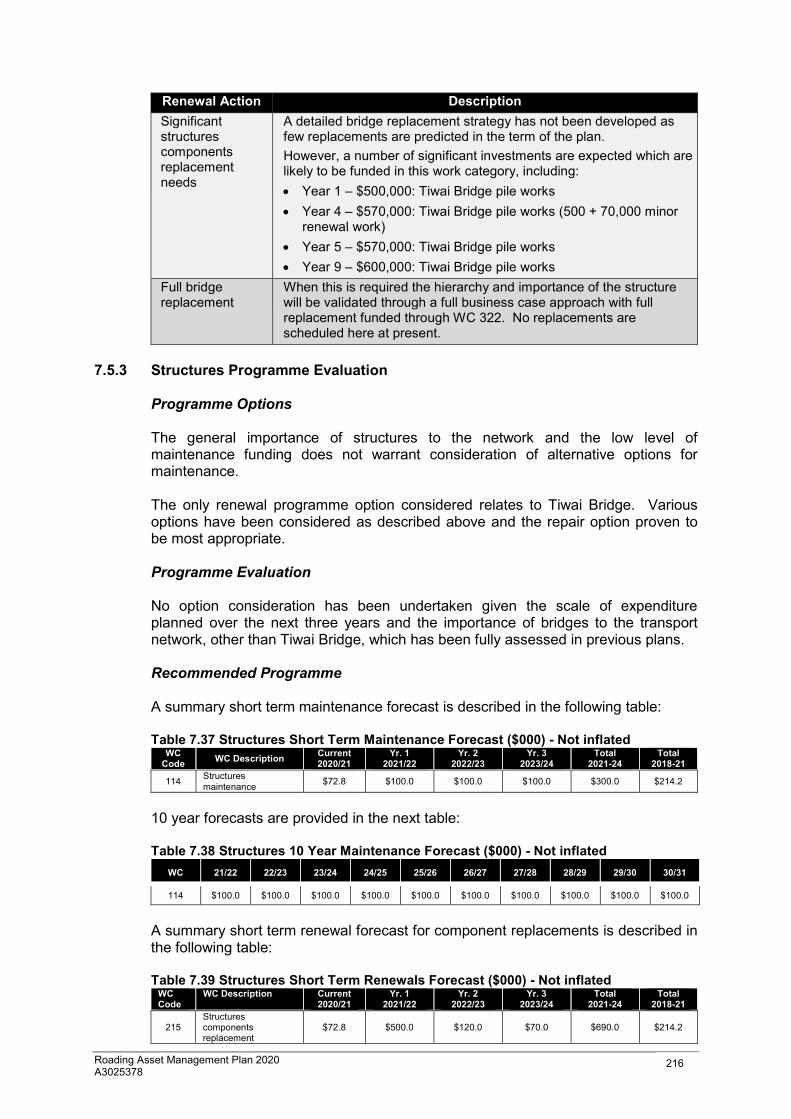
Roading Asset Management Plan 2020 A3025378
216
Renewal Action Description Significant structures components replacement needs
A detailed bridge replacement strategy has not been developed as few replacements are predicted in the term of the plan. However, a number of significant investments are expected which are likely to be funded in this work category, including: • Year 1 – $500,000: Tiwai Bridge pile works • Year 4 – $570,000: Tiwai Bridge pile works (500 + 70,000 minor renewal work) • Year 5 – $570,000: Tiwai Bridge pile works • Year 9 – $600,000: Tiwai Bridge pile works
Full bridge replacement
When this is required the hierarchy and importance of the structure will be validated through a full business case approach with full replacement funded through WC 322. No replacements are scheduled here at present.
7.5.3 Structures Programme Evaluation
Programme Options
The general importance of structures to the network and the low level of maintenance funding does not warrant consideration of alternative options for maintenance. The only renewal programme option considered relates to Tiwai Bridge. Various options have been considered as described above and the repair option proven to be most appropriate.
Programme Evaluation No option consideration has been undertaken given the scale of expenditure planned over the next three years and the importance of bridges to the transport network, other than Tiwai Bridge, which has been fully assessed in previous plans.
Recommended Programme A summary short term maintenance forecast is described in the following table: Table 7.37 Structures Short Term Maintenance Forecast ($000) - Not inflated
WC Code WC Description Current
2020/21 Yr. 1
2021/22 Yr. 2
2022/23 Yr. 3
2023/24 Total
2021-24 Total
2018-21
114 Structures maintenance $72.8 $100.0 $100.0 $100.0 $300.0 $214.2
10 year forecasts are provided in the next table: Table 7.38 Structures 10 Year Maintenance Forecast ($000) - Not inflated
WC 21/22 22/23 23/24 24/25 25/26 26/27 27/28 28/29 29/30 30/31
114 $100.0 $100.0 $100.0 $100.0 $100.0 $100.0 $100.0 $100.0 $100.0 $100.0
A summary short term renewal forecast for component replacements is described in the following table: Table 7.39 Structures Short Term Renewals Forecast ($000) - Not inflated
WC Code
WC Description Current 2020/21
Yr. 1 2021/22
Yr. 2 2022/23
Yr. 3 2023/24
Total 2021-24
Total 2018-21
215 Structures components replacement
$72.8 $500.0 $120.0 $70.0 $690.0 $214.2
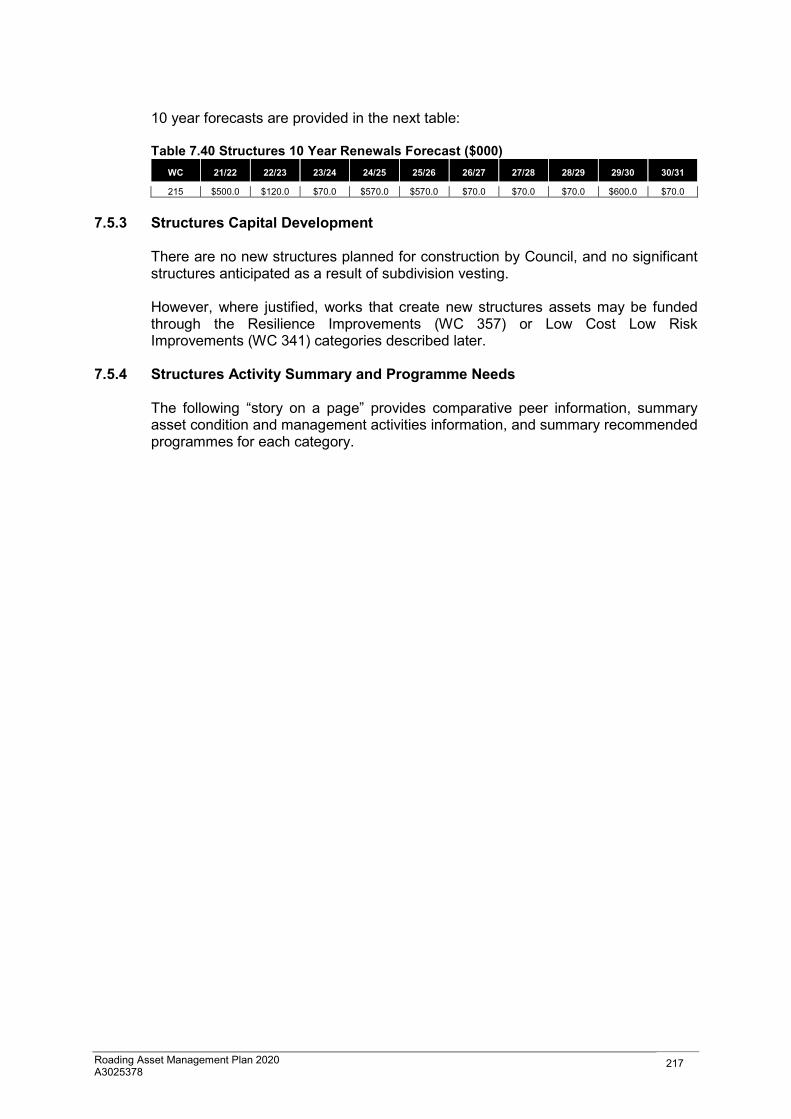
Roading Asset Management Plan 2020 A3025378
217
10 year forecasts are provided in the next table: Table 7.40 Structures 10 Year Renewals Forecast ($000)
WC 21/22 22/23 23/24 24/25 25/26 26/27 27/28 28/29 29/30 30/31
215 $500.0 $120.0 $70.0 $570.0 $570.0 $70.0 $70.0 $70.0 $600.0 $70.0
7.5.3 Structures Capital Development
There are no new structures planned for construction by Council, and no significant structures anticipated as a result of subdivision vesting. However, where justified, works that create new structures assets may be funded through the Resilience Improvements (WC 357) or Low Cost Low Risk Improvements (WC 341) categories described later.
7.5.4 Structures Activity Summary and Programme Needs The following “story on a page” provides comparative peer information, summary asset condition and management activities information, and summary recommended programmes for each category.
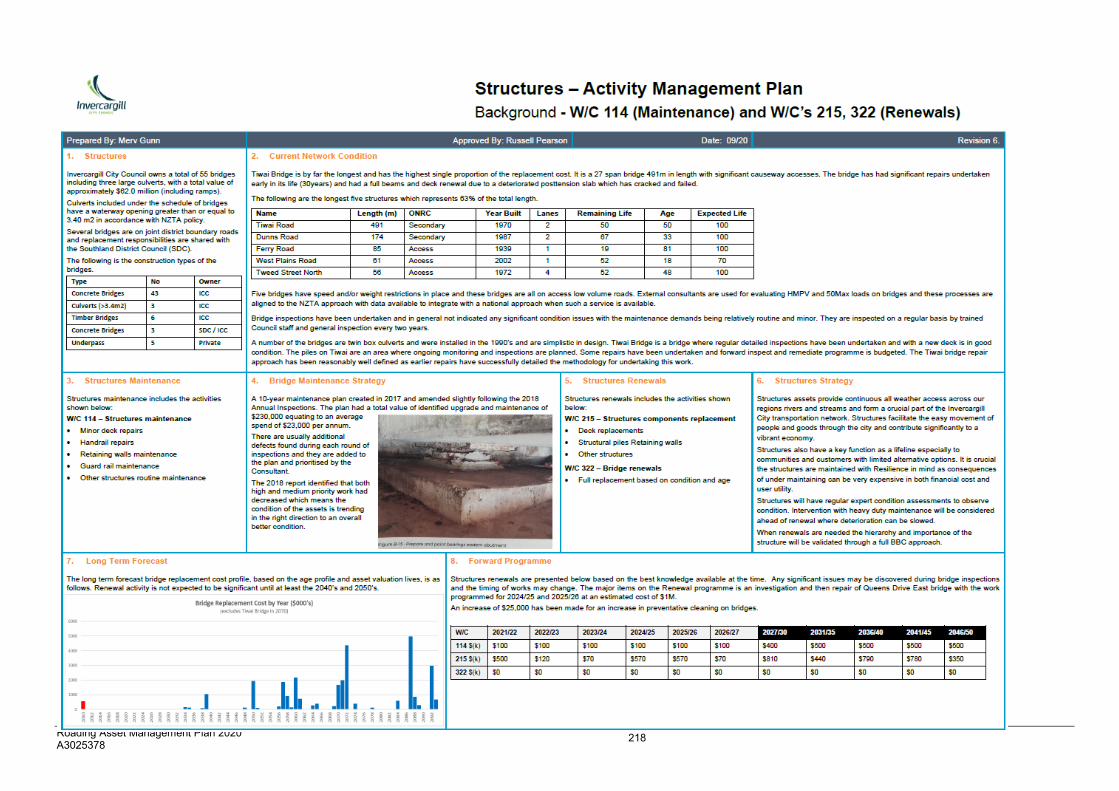
Roading Asset Management Plan 2020 A3025378 218
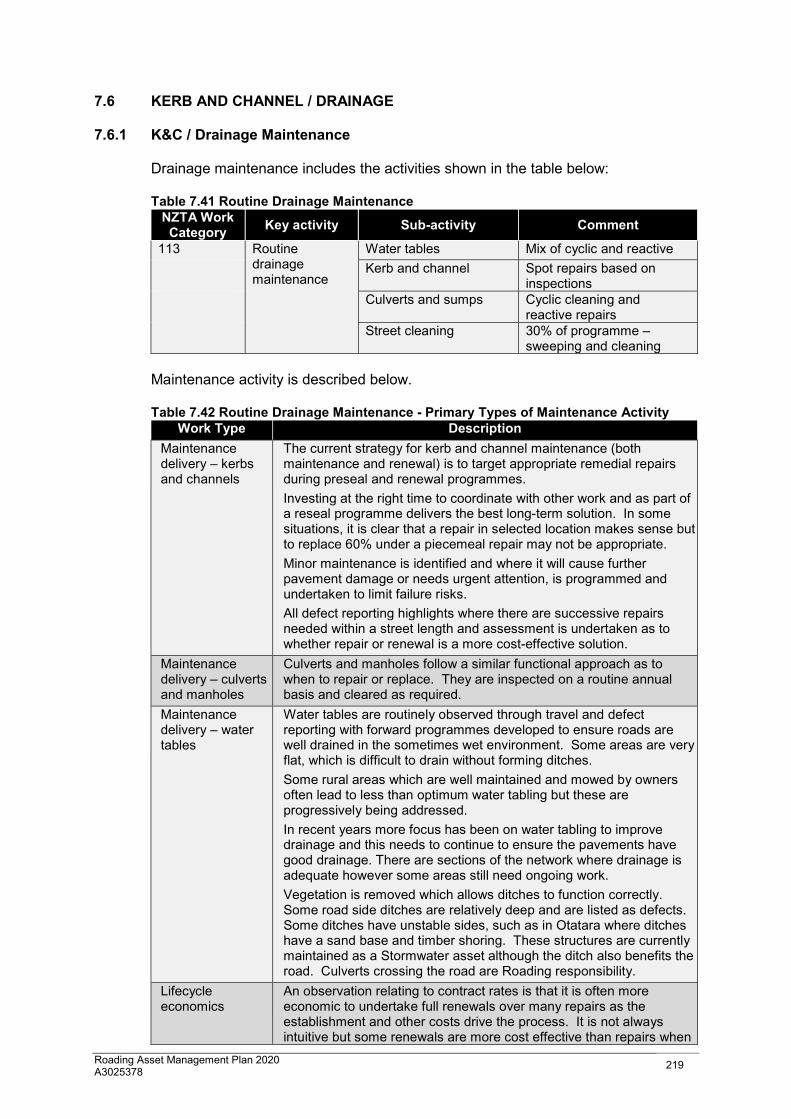
Roading Asset Management Plan 2020 A3025378 219
7.6 KERB AND CHANNEL / DRAINAGE
7.6.1 K&C / Drainage Maintenance Drainage maintenance includes the activities shown in the table below: Table 7.41 Routine Drainage Maintenance
NZTA Work Category Key activity Sub-activity Comment
113 Routine drainage maintenance
Water tables Mix of cyclic and reactive Kerb and channel Spot repairs based on
inspections Culverts and sumps Cyclic cleaning and
reactive repairs Street cleaning 30% of programme –
sweeping and cleaning Maintenance activity is described below. Table 7.42 Routine Drainage Maintenance - Primary Types of Maintenance Activity
Work Type Description Maintenance delivery – kerbs and channels
The current strategy for kerb and channel maintenance (both maintenance and renewal) is to target appropriate remedial repairs during preseal and renewal programmes. Investing at the right time to coordinate with other work and as part of a reseal programme delivers the best long-term solution. In some situations, it is clear that a repair in selected location makes sense but to replace 60% under a piecemeal repair may not be appropriate. Minor maintenance is identified and where it will cause further pavement damage or needs urgent attention, is programmed and undertaken to limit failure risks. All defect reporting highlights where there are successive repairs needed within a street length and assessment is undertaken as to whether repair or renewal is a more cost-effective solution.
Maintenance delivery – culverts and manholes
Culverts and manholes follow a similar functional approach as to when to repair or replace. They are inspected on a routine annual basis and cleared as required.
Maintenance delivery – water tables
Water tables are routinely observed through travel and defect reporting with forward programmes developed to ensure roads are well drained in the sometimes wet environment. Some areas are very flat, which is difficult to drain without forming ditches. Some rural areas which are well maintained and mowed by owners often lead to less than optimum water tabling but these are progressively being addressed. In recent years more focus has been on water tabling to improve drainage and this needs to continue to ensure the pavements have good drainage. There are sections of the network where drainage is adequate however some areas still need ongoing work. Vegetation is removed which allows ditches to function correctly. Some road side ditches are relatively deep and are listed as defects. Some ditches have unstable sides, such as in Otatara where ditches have a sand base and timber shoring. These structures are currently maintained as a Stormwater asset although the ditch also benefits the road. Culverts crossing the road are Roading responsibility.
Lifecycle economics
An observation relating to contract rates is that it is often more economic to undertake full renewals over many repairs as the establishment and other costs drive the process. It is not always intuitive but some renewals are more cost effective than repairs when
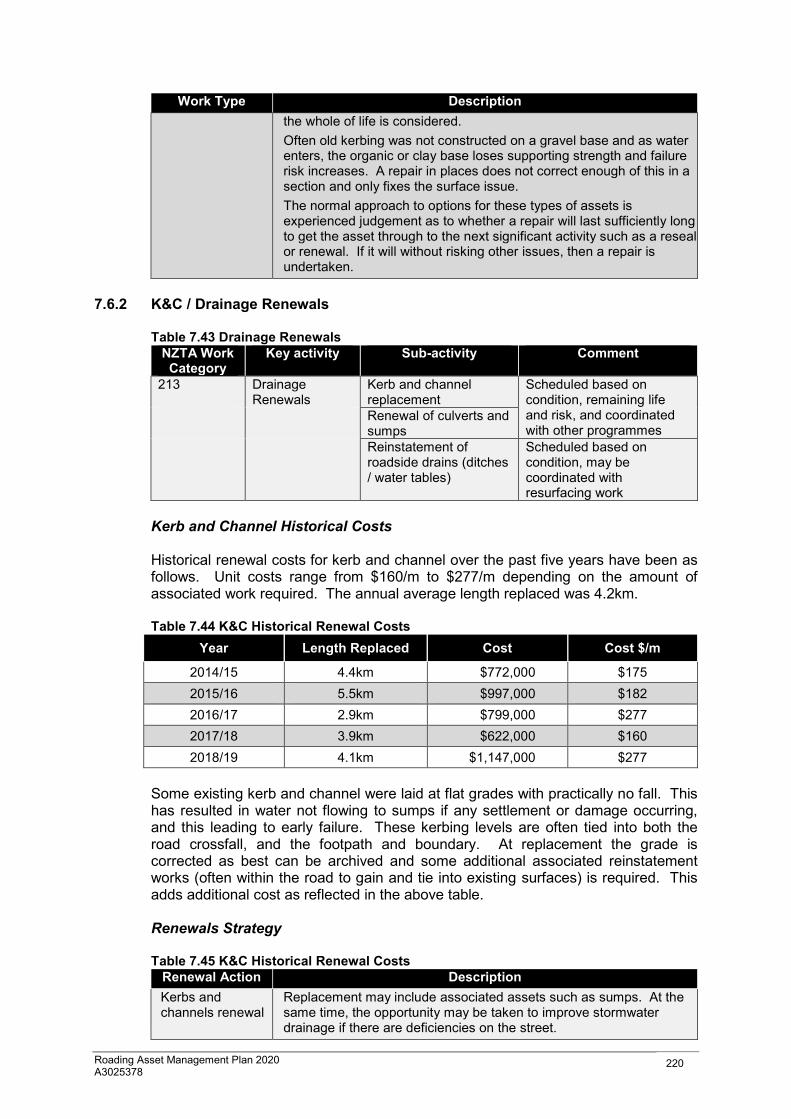
Roading Asset Management Plan 2020 A3025378
220
Work Type Description the whole of life is considered. Often old kerbing was not constructed on a gravel base and as water enters, the organic or clay base loses supporting strength and failure risk increases. A repair in places does not correct enough of this in a section and only fixes the surface issue. The normal approach to options for these types of assets is experienced judgement as to whether a repair will last sufficiently long to get the asset through to the next significant activity such as a reseal or renewal. If it will without risking other issues, then a repair is undertaken.
7.6.2 K&C / Drainage Renewals
Table 7.43 Drainage Renewals
NZTA Work Category
Key activity Sub-activity Comment
213 Drainage Renewals
Kerb and channel replacement
Scheduled based on condition, remaining life and risk, and coordinated with other programmes
Renewal of culverts and sumps
Reinstatement of roadside drains (ditches / water tables)
Scheduled based on condition, may be coordinated with resurfacing work
Kerb and Channel Historical Costs
Historical renewal costs for kerb and channel over the past five years have been as follows. Unit costs range from $160/m to $277/m depending on the amount of associated work required. The annual average length replaced was 4.2km. Table 7.44 K&C Historical Renewal Costs
Year Length Replaced Cost Cost $/m
2014/15 4.4km $772,000 $175 2015/16 5.5km $997,000 $182 2016/17 2.9km $799,000 $277 2017/18 3.9km $622,000 $160 2018/19 4.1km $1,147,000 $277
Some existing kerb and channel were laid at flat grades with practically no fall. This has resulted in water not flowing to sumps if any settlement or damage occurring, and this leading to early failure. These kerbing levels are often tied into both the road crossfall, and the footpath and boundary. At replacement the grade is corrected as best can be archived and some additional associated reinstatement works (often within the road to gain and tie into existing surfaces) is required. This adds additional cost as reflected in the above table.
Renewals Strategy Table 7.45 K&C Historical Renewal Costs
Renewal Action Description Kerbs and channels renewal
Replacement may include associated assets such as sumps. At the same time, the opportunity may be taken to improve stormwater drainage if there are deficiencies on the street.
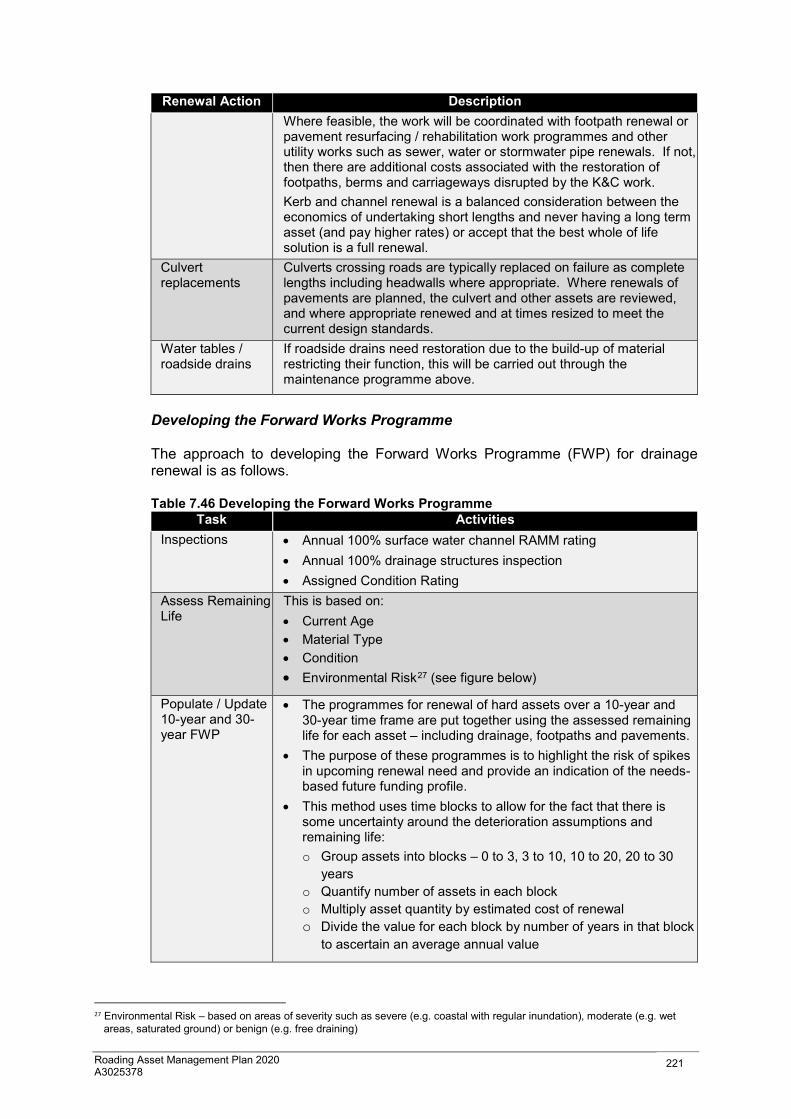
Roading Asset Management Plan 2020 A3025378
221
Renewal Action Description Where feasible, the work will be coordinated with footpath renewal or pavement resurfacing / rehabilitation work programmes and other utility works such as sewer, water or stormwater pipe renewals. If not, then there are additional costs associated with the restoration of footpaths, berms and carriageways disrupted by the K&C work. Kerb and channel renewal is a balanced consideration between the economics of undertaking short lengths and never having a long term asset (and pay higher rates) or accept that the best whole of life solution is a full renewal.
Culvert replacements
Culverts crossing roads are typically replaced on failure as complete lengths including headwalls where appropriate. Where renewals of pavements are planned, the culvert and other assets are reviewed, and where appropriate renewed and at times resized to meet the current design standards.
Water tables / roadside drains
If roadside drains need restoration due to the build-up of material restricting their function, this will be carried out through the maintenance programme above.
Developing the Forward Works Programme
The approach to developing the Forward Works Programme (FWP) for drainage renewal is as follows. Table 7.46 Developing the Forward Works Programme
Task Activities Inspections • Annual 100% surface water channel RAMM rating
• Annual 100% drainage structures inspection • Assigned Condition Rating
Assess Remaining Life
This is based on: • Current Age • Material Type • Condition • Environmental Risk27 (see figure below)
Populate / Update 10-year and 30-year FWP
• The programmes for renewal of hard assets over a 10-year and 30-year time frame are put together using the assessed remaining life for each asset – including drainage, footpaths and pavements.
• The purpose of these programmes is to highlight the risk of spikes in upcoming renewal need and provide an indication of the needs-based future funding profile.
• This method uses time blocks to allow for the fact that there is some uncertainty around the deterioration assumptions and remaining life: o Group assets into blocks – 0 to 3, 3 to 10, 10 to 20, 20 to 30
years o Quantify number of assets in each block o Multiply asset quantity by estimated cost of renewal o Divide the value for each block by number of years in that block
to ascertain an average annual value
27 Environmental Risk – based on areas of severity such as severe (e.g. coastal with regular inundation), moderate (e.g. wet
areas, saturated ground) or benign (e.g. free draining)
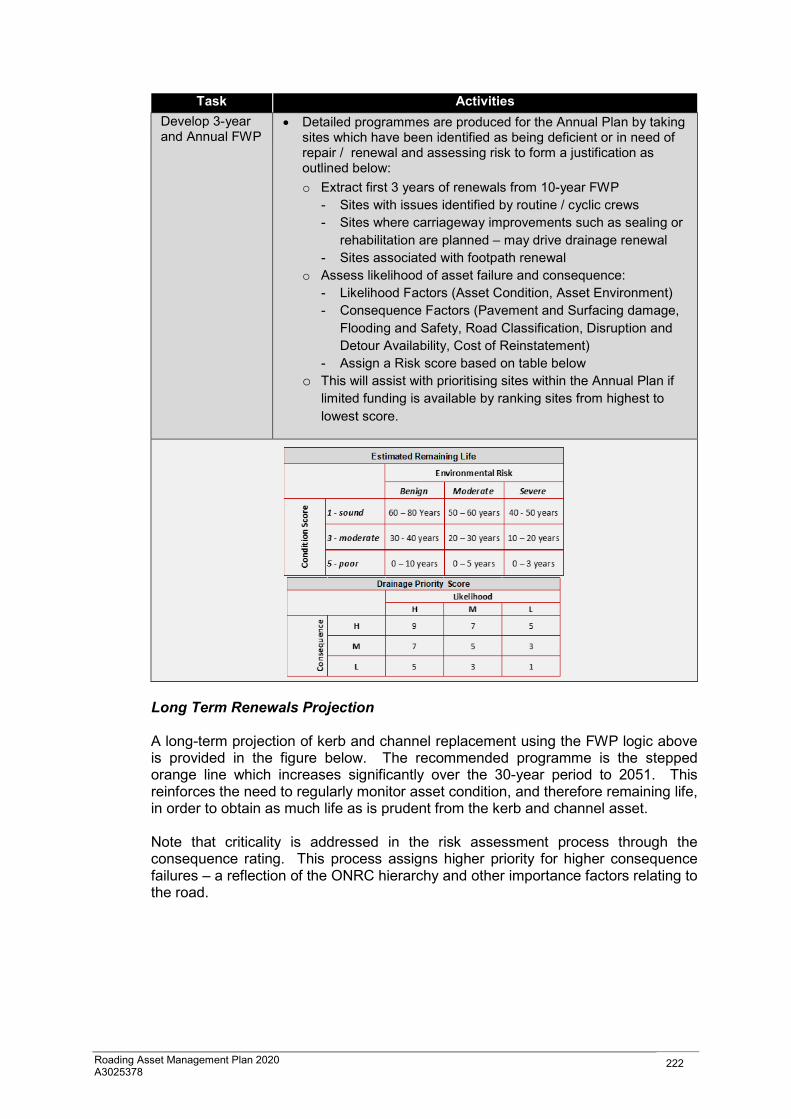
Roading Asset Management Plan 2020 A3025378
222
Task Activities Develop 3-year and Annual FWP
• Detailed programmes are produced for the Annual Plan by taking sites which have been identified as being deficient or in need of repair / renewal and assessing risk to form a justification as outlined below: o Extract first 3 years of renewals from 10-year FWP
- Sites with issues identified by routine / cyclic crews - Sites where carriageway improvements such as sealing or
rehabilitation are planned – may drive drainage renewal - Sites associated with footpath renewal
o Assess likelihood of asset failure and consequence: - Likelihood Factors (Asset Condition, Asset Environment) - Consequence Factors (Pavement and Surfacing damage,
Flooding and Safety, Road Classification, Disruption and Detour Availability, Cost of Reinstatement)
- Assign a Risk score based on table below o This will assist with prioritising sites within the Annual Plan if
limited funding is available by ranking sites from highest to lowest score.
Long Term Renewals Projection A long-term projection of kerb and channel replacement using the FWP logic above is provided in the figure below. The recommended programme is the stepped orange line which increases significantly over the 30-year period to 2051. This reinforces the need to regularly monitor asset condition, and therefore remaining life, in order to obtain as much life as is prudent from the kerb and channel asset. Note that criticality is addressed in the risk assessment process through the consequence rating. This process assigns higher priority for higher consequence failures – a reflection of the ONRC hierarchy and other importance factors relating to the road.
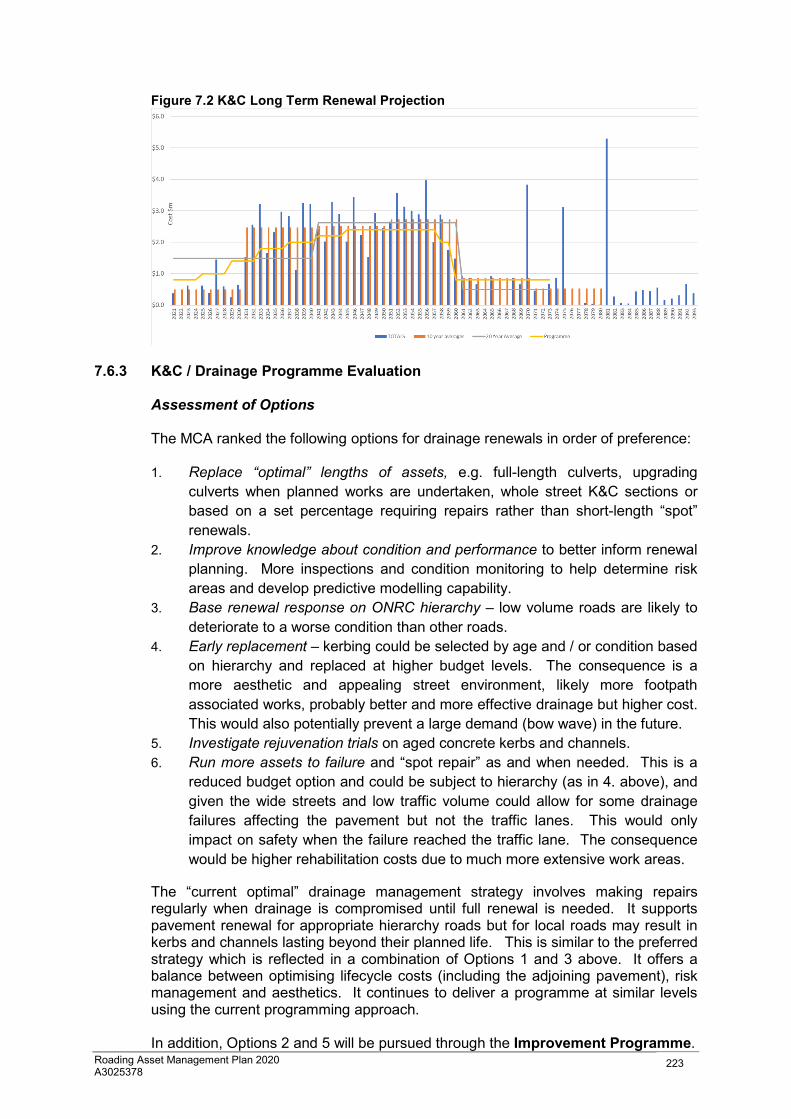
Roading Asset Management Plan 2020 A3025378
223
Figure 7.2 K&C Long Term Renewal Projection
7.6.3 K&C / Drainage Programme Evaluation
Assessment of Options
The MCA ranked the following options for drainage renewals in order of preference: 1. Replace “optimal” lengths of assets, e.g. full-length culverts, upgrading
culverts when planned works are undertaken, whole street K&C sections or based on a set percentage requiring repairs rather than short-length “spot” renewals.
2. Improve knowledge about condition and performance to better inform renewal planning. More inspections and condition monitoring to help determine risk areas and develop predictive modelling capability.
3. Base renewal response on ONRC hierarchy – low volume roads are likely to deteriorate to a worse condition than other roads.
4. Early replacement – kerbing could be selected by age and / or condition based on hierarchy and replaced at higher budget levels. The consequence is a more aesthetic and appealing street environment, likely more footpath associated works, probably better and more effective drainage but higher cost. This would also potentially prevent a large demand (bow wave) in the future.
5. Investigate rejuvenation trials on aged concrete kerbs and channels. 6. Run more assets to failure and “spot repair” as and when needed. This is a
reduced budget option and could be subject to hierarchy (as in 4. above), and given the wide streets and low traffic volume could allow for some drainage failures affecting the pavement but not the traffic lanes. This would only impact on safety when the failure reached the traffic lane. The consequence would be higher rehabilitation costs due to much more extensive work areas.
The “current optimal” drainage management strategy involves making repairs regularly when drainage is compromised until full renewal is needed. It supports pavement renewal for appropriate hierarchy roads but for local roads may result in kerbs and channels lasting beyond their planned life. This is similar to the preferred strategy which is reflected in a combination of Options 1 and 3 above. It offers a balance between optimising lifecycle costs (including the adjoining pavement), risk management and aesthetics. It continues to deliver a programme at similar levels using the current programming approach. In addition, Options 2 and 5 will be pursued through the Improvement Programme.
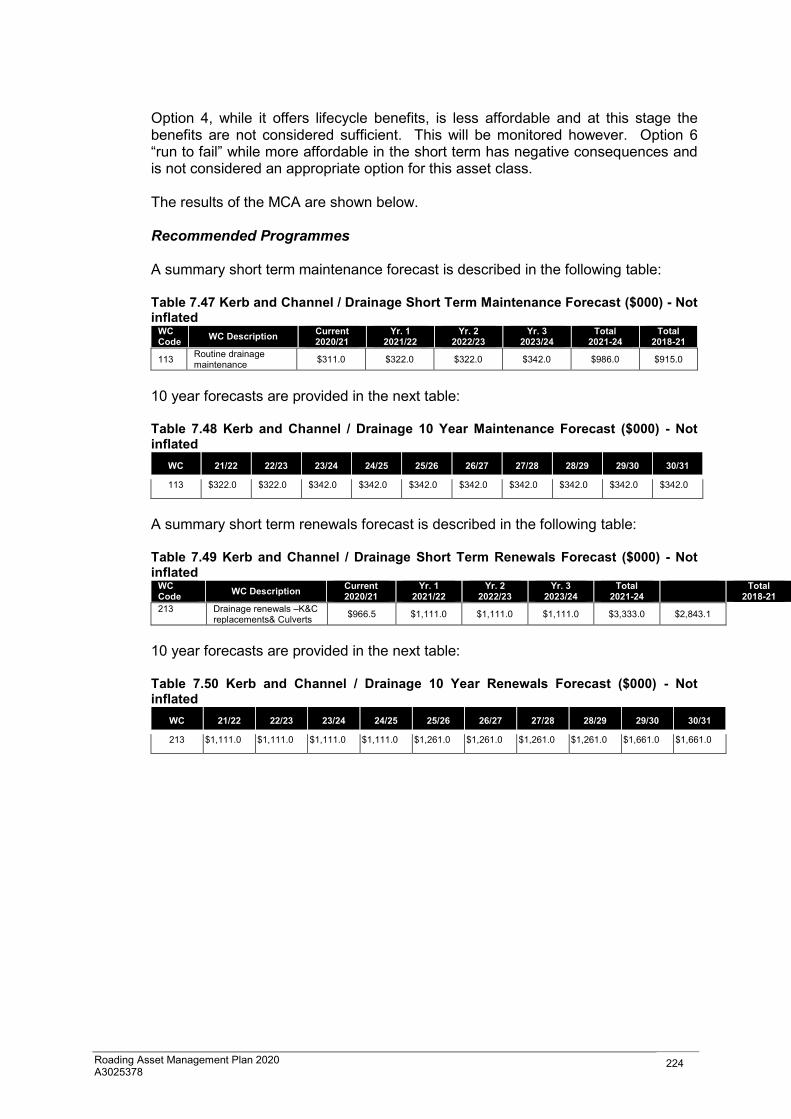
Roading Asset Management Plan 2020 A3025378
224
Option 4, while it offers lifecycle benefits, is less affordable and at this stage the benefits are not considered sufficient. This will be monitored however. Option 6 “run to fail” while more affordable in the short term has negative consequences and is not considered an appropriate option for this asset class. The results of the MCA are shown below.
Recommended Programmes A summary short term maintenance forecast is described in the following table: Table 7.47 Kerb and Channel / Drainage Short Term Maintenance Forecast ($000) - Not inflated
WC Code WC Description Current
2020/21 Yr. 1
2021/22 Yr. 2
2022/23 Yr. 3
2023/24 Total
2021-24 Total
2018-21
113 Routine drainage maintenance $311.0 $322.0 $322.0 $342.0 $986.0 $915.0
10 year forecasts are provided in the next table: Table 7.48 Kerb and Channel / Drainage 10 Year Maintenance Forecast ($000) - Not inflated
WC 21/22 22/23 23/24 24/25 25/26 26/27 27/28 28/29 29/30 30/31
113 $322.0 $322.0 $342.0 $342.0 $342.0 $342.0 $342.0 $342.0 $342.0 $342.0
A summary short term renewals forecast is described in the following table:
Table 7.49 Kerb and Channel / Drainage Short Term Renewals Forecast ($000) - Not inflated
WC Code WC Description Current
2020/21 Yr. 1
2021/22 Yr. 2
2022/23 Yr. 3
2023/24 Total
2021-24 Total
2018-21 213 Drainage renewals –K&C
replacements& Culverts $966.5 $1,111.0 $1,111.0 $1,111.0 $3,333.0 $2,843.1
10 year forecasts are provided in the next table: Table 7.50 Kerb and Channel / Drainage 10 Year Renewals Forecast ($000) - Not inflated
WC 21/22 22/23 23/24 24/25 25/26 26/27 27/28 28/29 29/30 30/31
213 $1,111.0 $1,111.0 $1,111.0 $1,111.0 $1,261.0 $1,261.0 $1,261.0 $1,261.0 $1,661.0 $1,661.0
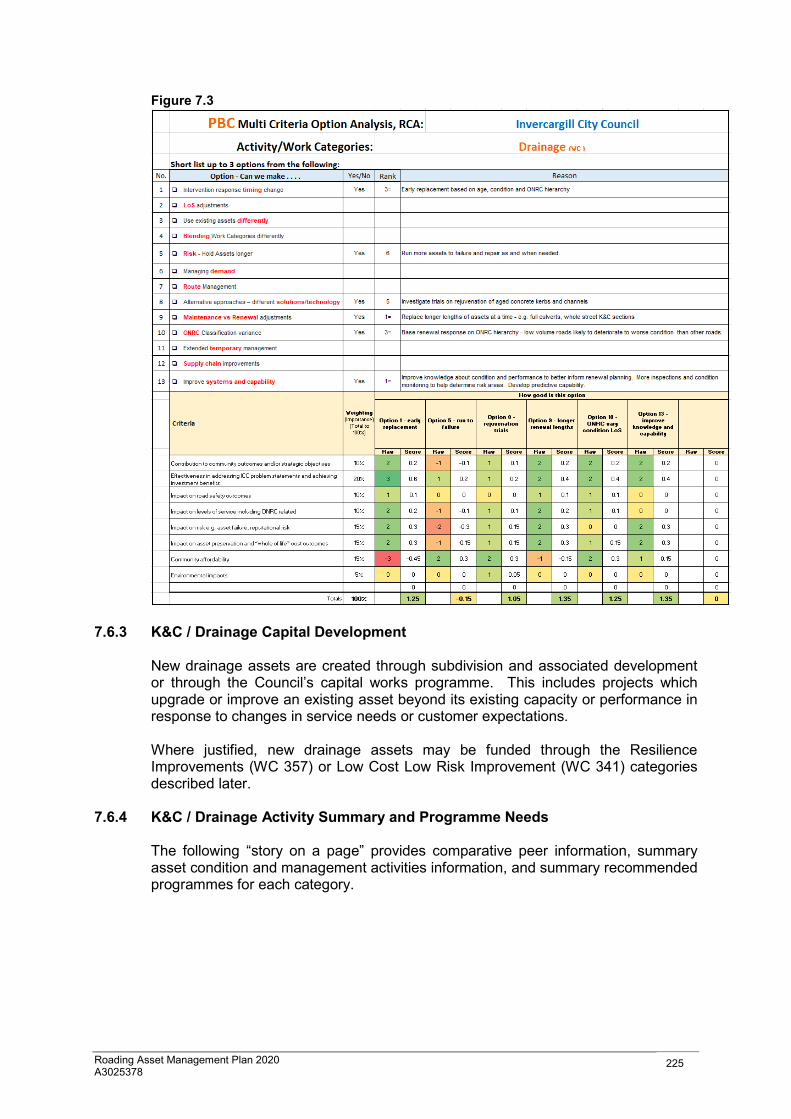
Roading Asset Management Plan 2020 A3025378
225
Figure 7.3
7.6.3 K&C / Drainage Capital Development New drainage assets are created through subdivision and associated development or through the Council’s capital works programme. This includes projects which upgrade or improve an existing asset beyond its existing capacity or performance in response to changes in service needs or customer expectations. Where justified, new drainage assets may be funded through the Resilience Improvements (WC 357) or Low Cost Low Risk Improvement (WC 341) categories described later.
7.6.4 K&C / Drainage Activity Summary and Programme Needs The following “story on a page” provides comparative peer information, summary asset condition and management activities information, and summary recommended programmes for each category.
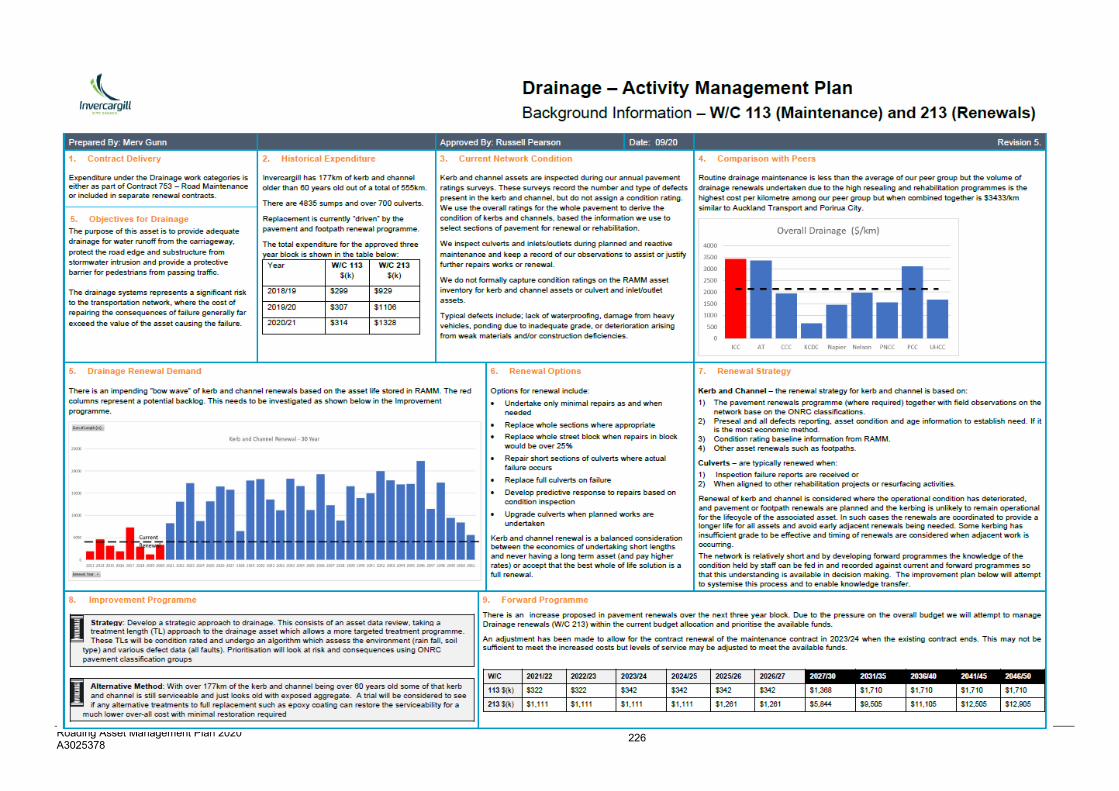
Roading Asset Management Plan 2020 A3025378 226
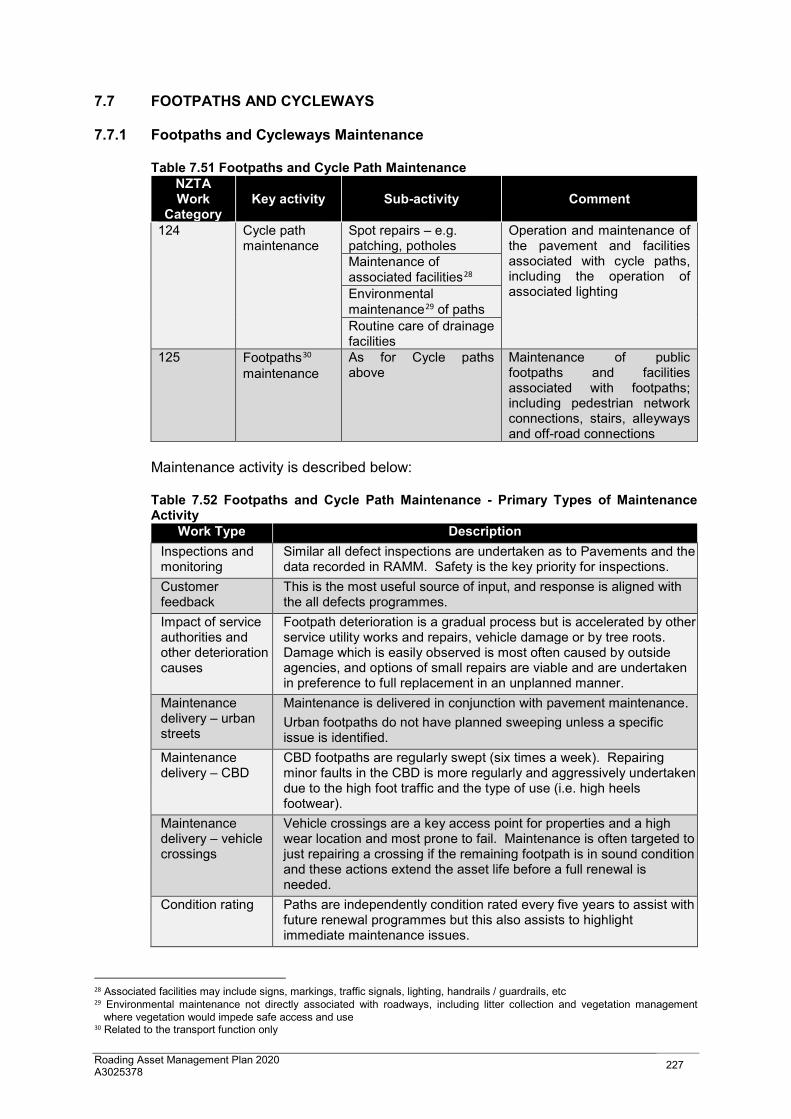
Roading Asset Management Plan 2020 A3025378 227
7.7 FOOTPATHS AND CYCLEWAYS
7.7.1 Footpaths and Cycleways Maintenance Table 7.51 Footpaths and Cycle Path Maintenance
NZTA Work
Category Key activity Sub-activity Comment
124 Cycle path maintenance
Spot repairs – e.g. patching, potholes
Operation and maintenance of the pavement and facilities associated with cycle paths, including the operation of associated lighting
Maintenance of associated facilities28 Environmental maintenance29 of paths Routine care of drainage facilities
125 Footpaths30 maintenance
As for Cycle paths above
Maintenance of public footpaths and facilities associated with footpaths; including pedestrian network connections, stairs, alleyways and off-road connections
Maintenance activity is described below: Table 7.52 Footpaths and Cycle Path Maintenance - Primary Types of Maintenance Activity
Work Type Description Inspections and monitoring
Similar all defect inspections are undertaken as to Pavements and the data recorded in RAMM. Safety is the key priority for inspections.
Customer feedback
This is the most useful source of input, and response is aligned with the all defects programmes.
Impact of service authorities and other deterioration causes
Footpath deterioration is a gradual process but is accelerated by other service utility works and repairs, vehicle damage or by tree roots. Damage which is easily observed is most often caused by outside agencies, and options of small repairs are viable and are undertaken in preference to full replacement in an unplanned manner.
Maintenance delivery – urban streets
Maintenance is delivered in conjunction with pavement maintenance. Urban footpaths do not have planned sweeping unless a specific issue is identified.
Maintenance delivery – CBD
CBD footpaths are regularly swept (six times a week). Repairing minor faults in the CBD is more regularly and aggressively undertaken due to the high foot traffic and the type of use (i.e. high heels footwear).
Maintenance delivery – vehicle crossings
Vehicle crossings are a key access point for properties and a high wear location and most prone to fail. Maintenance is often targeted to just repairing a crossing if the remaining footpath is in sound condition and these actions extend the asset life before a full renewal is needed.
Condition rating Paths are independently condition rated every five years to assist with future renewal programmes but this also assists to highlight immediate maintenance issues.
28 Associated facilities may include signs, markings, traffic signals, lighting, handrails / guardrails, etc 29 Environmental maintenance not directly associated with roadways, including litter collection and vegetation management
where vegetation would impede safe access and use 30 Related to the transport function only
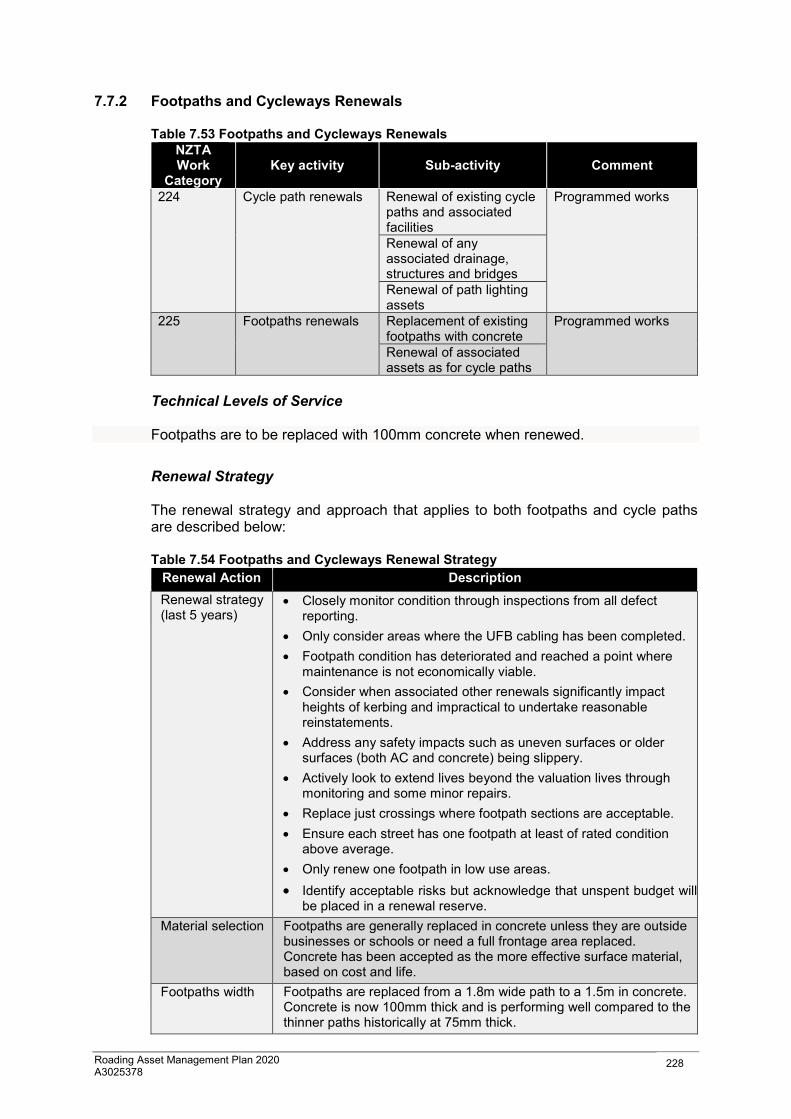
Roading Asset Management Plan 2020 A3025378
228
7.7.2 Footpaths and Cycleways Renewals Table 7.53 Footpaths and Cycleways Renewals
NZTA Work
Category Key activity Sub-activity Comment
224 Cycle path renewals Renewal of existing cycle paths and associated facilities
Programmed works
Renewal of any associated drainage, structures and bridges Renewal of path lighting assets
225 Footpaths renewals Replacement of existing footpaths with concrete
Programmed works
Renewal of associated assets as for cycle paths
Technical Levels of Service Footpaths are to be replaced with 100mm concrete when renewed. Renewal Strategy The renewal strategy and approach that applies to both footpaths and cycle paths are described below: Table 7.54 Footpaths and Cycleways Renewal Strategy
Renewal Action Description Renewal strategy (last 5 years)
• Closely monitor condition through inspections from all defect reporting.
• Only consider areas where the UFB cabling has been completed. • Footpath condition has deteriorated and reached a point where
maintenance is not economically viable. • Consider when associated other renewals significantly impact
heights of kerbing and impractical to undertake reasonable reinstatements.
• Address any safety impacts such as uneven surfaces or older surfaces (both AC and concrete) being slippery.
• Actively look to extend lives beyond the valuation lives through monitoring and some minor repairs.
• Replace just crossings where footpath sections are acceptable. • Ensure each street has one footpath at least of rated condition
above average. • Only renew one footpath in low use areas. • Identify acceptable risks but acknowledge that unspent budget will
be placed in a renewal reserve. Material selection Footpaths are generally replaced in concrete unless they are outside
businesses or schools or need a full frontage area replaced. Concrete has been accepted as the more effective surface material, based on cost and life.
Footpaths width Footpaths are replaced from a 1.8m wide path to a 1.5m in concrete. Concrete is now 100mm thick and is performing well compared to the thinner paths historically at 75mm thick.
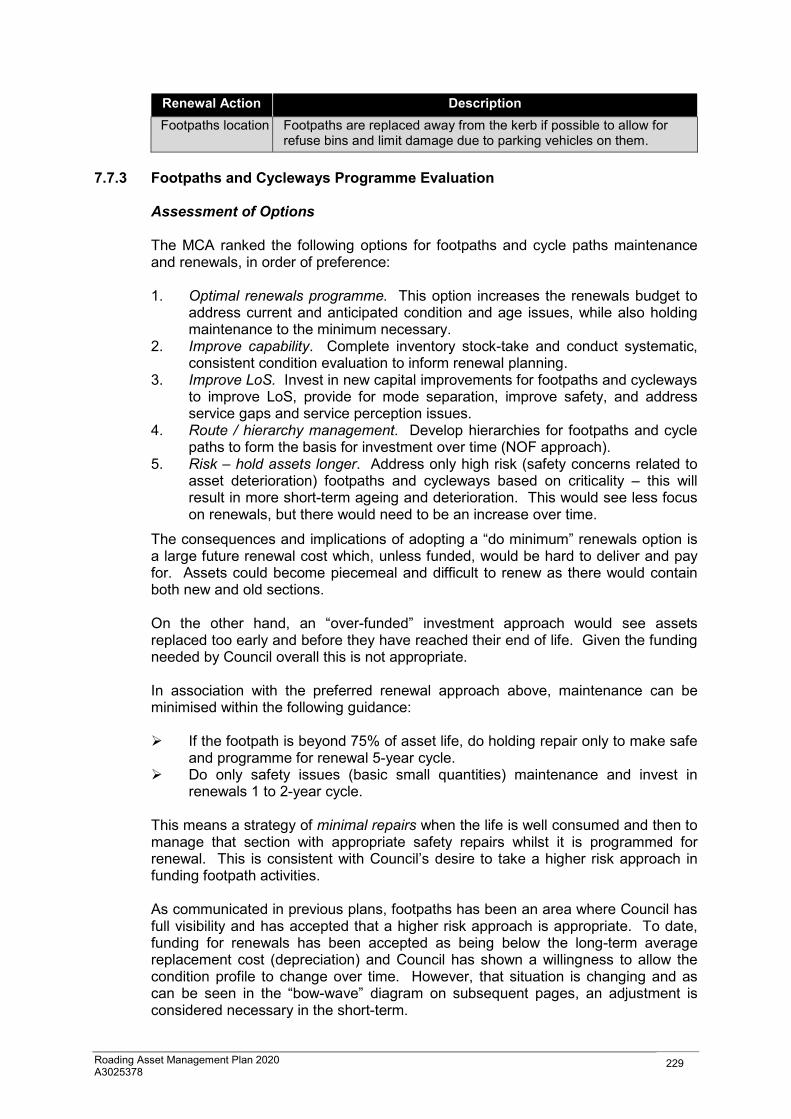
Roading Asset Management Plan 2020 A3025378
229
Renewal Action Description Footpaths location Footpaths are replaced away from the kerb if possible to allow for
refuse bins and limit damage due to parking vehicles on them.
7.7.3 Footpaths and Cycleways Programme Evaluation
Assessment of Options The MCA ranked the following options for footpaths and cycle paths maintenance and renewals, in order of preference: 1. Optimal renewals programme. This option increases the renewals budget to
address current and anticipated condition and age issues, while also holding maintenance to the minimum necessary.
2. Improve capability. Complete inventory stock-take and conduct systematic, consistent condition evaluation to inform renewal planning.
3. Improve LoS. Invest in new capital improvements for footpaths and cycleways to improve LoS, provide for mode separation, improve safety, and address service gaps and service perception issues.
4. Route / hierarchy management. Develop hierarchies for footpaths and cycle paths to form the basis for investment over time (NOF approach).
5. Risk – hold assets longer. Address only high risk (safety concerns related to asset deterioration) footpaths and cycleways based on criticality – this will result in more short-term ageing and deterioration. This would see less focus on renewals, but there would need to be an increase over time.
The consequences and implications of adopting a “do minimum” renewals option is a large future renewal cost which, unless funded, would be hard to deliver and pay for. Assets could become piecemeal and difficult to renew as there would contain both new and old sections. On the other hand, an “over-funded” investment approach would see assets replaced too early and before they have reached their end of life. Given the funding needed by Council overall this is not appropriate. In association with the preferred renewal approach above, maintenance can be minimised within the following guidance: If the footpath is beyond 75% of asset life, do holding repair only to make safe
and programme for renewal 5-year cycle. Do only safety issues (basic small quantities) maintenance and invest in
renewals 1 to 2-year cycle. This means a strategy of minimal repairs when the life is well consumed and then to manage that section with appropriate safety repairs whilst it is programmed for renewal. This is consistent with Council’s desire to take a higher risk approach in funding footpath activities. As communicated in previous plans, footpaths has been an area where Council has full visibility and has accepted that a higher risk approach is appropriate. To date, funding for renewals has been accepted as being below the long-term average replacement cost (depreciation) and Council has shown a willingness to allow the condition profile to change over time. However, that situation is changing and as can be seen in the “bow-wave” diagram on subsequent pages, an adjustment is considered necessary in the short-term.
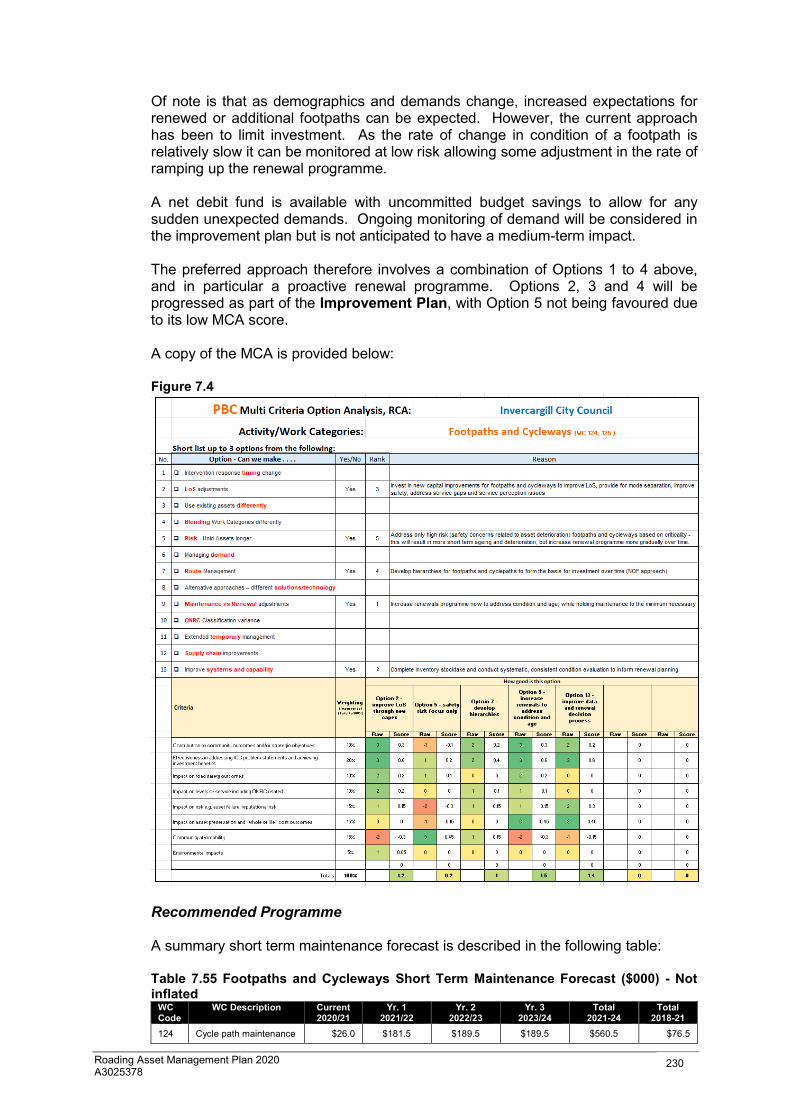
Roading Asset Management Plan 2020 A3025378
230
Of note is that as demographics and demands change, increased expectations for renewed or additional footpaths can be expected. However, the current approach has been to limit investment. As the rate of change in condition of a footpath is relatively slow it can be monitored at low risk allowing some adjustment in the rate of ramping up the renewal programme. A net debit fund is available with uncommitted budget savings to allow for any sudden unexpected demands. Ongoing monitoring of demand will be considered in the improvement plan but is not anticipated to have a medium-term impact. The preferred approach therefore involves a combination of Options 1 to 4 above, and in particular a proactive renewal programme. Options 2, 3 and 4 will be progressed as part of the Improvement Plan, with Option 5 not being favoured due to its low MCA score. A copy of the MCA is provided below: Figure 7.4
Recommended Programme A summary short term maintenance forecast is described in the following table: Table 7.55 Footpaths and Cycleways Short Term Maintenance Forecast ($000) - Not inflated
WC Code
WC Description Current 2020/21
Yr. 1 2021/22
Yr. 2 2022/23
Yr. 3 2023/24
Total 2021-24
Total 2018-21
124 Cycle path maintenance $26.0 $181.5 $189.5 $189.5 $560.5 $76.5
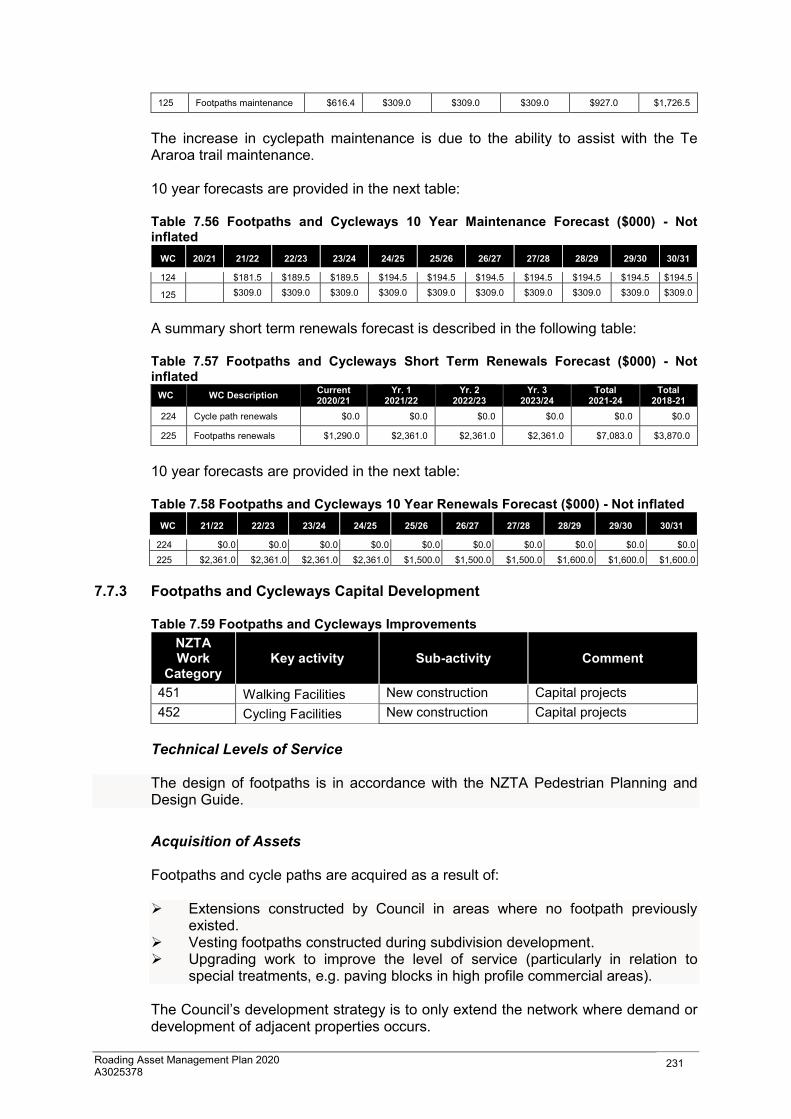
Roading Asset Management Plan 2020 A3025378
231
125 Footpaths maintenance $616.4 $309.0 $309.0 $309.0 $927.0 $1,726.5
The increase in cyclepath maintenance is due to the ability to assist with the Te Araroa trail maintenance. 10 year forecasts are provided in the next table: Table 7.56 Footpaths and Cycleways 10 Year Maintenance Forecast ($000) - Not inflated
WC 20/21 21/22 22/23 23/24 24/25 25/26 26/27 27/28 28/29 29/30 30/31
124 $181.5 $189.5 $189.5 $194.5 $194.5 $194.5 $194.5 $194.5 $194.5 $194.5
125 $309.0 $309.0 $309.0 $309.0 $309.0 $309.0 $309.0 $309.0 $309.0 $309.0
A summary short term renewals forecast is described in the following table: Table 7.57 Footpaths and Cycleways Short Term Renewals Forecast ($000) - Not inflated
WC WC Description Current 2020/21
Yr. 1 2021/22
Yr. 2 2022/23
Yr. 3 2023/24
Total 2021-24
Total 2018-21
224 Cycle path renewals $0.0 $0.0 $0.0 $0.0 $0.0 $0.0
225 Footpaths renewals $1,290.0 $2,361.0 $2,361.0 $2,361.0 $7,083.0 $3,870.0
10 year forecasts are provided in the next table: Table 7.58 Footpaths and Cycleways 10 Year Renewals Forecast ($000) - Not inflated
WC 21/22 22/23 23/24 24/25 25/26 26/27 27/28 28/29 29/30 30/31
224 $0.0 $0.0 $0.0 $0.0 $0.0 $0.0 $0.0 $0.0 $0.0 $0.0 225 $2,361.0 $2,361.0 $2,361.0 $2,361.0 $1,500.0 $1,500.0 $1,500.0 $1,600.0 $1,600.0 $1,600.0
7.7.3 Footpaths and Cycleways Capital Development
Table 7.59 Footpaths and Cycleways Improvements
NZTA Work
Category Key activity Sub-activity Comment
451 Walking Facilities New construction Capital projects 452 Cycling Facilities New construction Capital projects
Technical Levels of Service
The design of footpaths is in accordance with the NZTA Pedestrian Planning and
Design Guide.
Acquisition of Assets Footpaths and cycle paths are acquired as a result of: Extensions constructed by Council in areas where no footpath previously
existed. Vesting footpaths constructed during subdivision development. Upgrading work to improve the level of service (particularly in relation to
special treatments, e.g. paving blocks in high profile commercial areas). The Council’s development strategy is to only extend the network where demand or development of adjacent properties occurs.
Roading Asset Management Plan 2020 A3025378
232
Minimal footpath development is planned for each year as some existing gravel footpaths may get upgraded as properties are built or footpath connections between existing paths are required. Footpath extensions are ranked using the following criteria (in order of importance): Pedestrian safety Pedestrian generators – schools, shops, etc Road hierarchy Operating speed of adjoining road, as indicated by speed limit Where justified, new assets may be funded through the Low Cost Low Risk Improvement (WC 341) category described later. The active mode transition required will identify areas within the existing network where the expectations (in particular safety) are not being met. These gaps or deficiencies will be prioritised, typically via LCLR and funded as and when budgets are available. Other works likely are to better manage cycling on State Highways (primarily SH6) or within the city centre. Again these works will be funded via LCLR.
7.7.4 Footpaths and Cycleways Activity Summary and Programme Needs The following “story on a page” provides comparative peer information, summary asset condition and management activities information, and summary recommended programmes for each category.
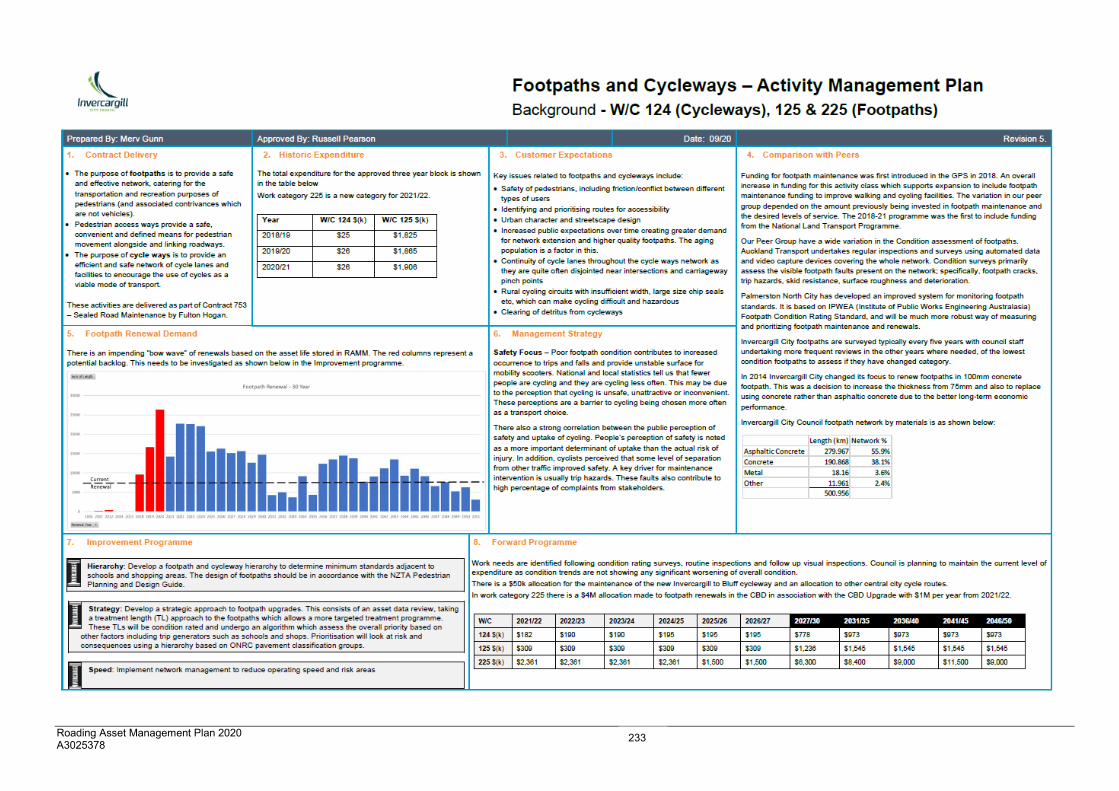
Roading Asset Management Plan 2020 A3025378 233
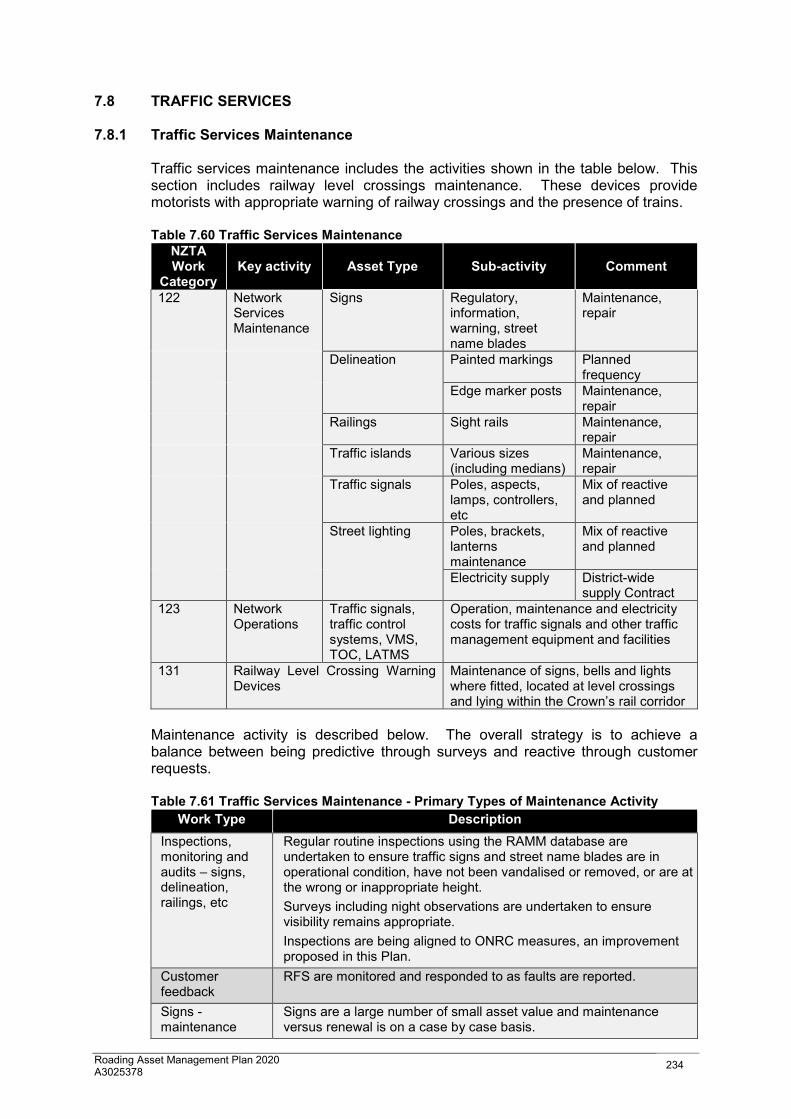
Roading Asset Management Plan 2020 A3025378 234
7.8 TRAFFIC SERVICES
7.8.1 Traffic Services Maintenance Traffic services maintenance includes the activities shown in the table below. This section includes railway level crossings maintenance. These devices provide motorists with appropriate warning of railway crossings and the presence of trains. Table 7.60 Traffic Services Maintenance
NZTA Work
Category Key activity Asset Type Sub-activity Comment
122 Network Services Maintenance
Signs Regulatory, information, warning, street name blades
Maintenance, repair
Delineation Painted markings Planned frequency
Edge marker posts Maintenance, repair
Railings Sight rails Maintenance, repair
Traffic islands Various sizes (including medians)
Maintenance, repair
Traffic signals Poles, aspects, lamps, controllers, etc
Mix of reactive and planned
Street lighting Poles, brackets, lanterns maintenance
Mix of reactive and planned
Electricity supply District-wide supply Contract
123 Network Operations
Traffic signals, traffic control systems, VMS, TOC, LATMS
Operation, maintenance and electricity costs for traffic signals and other traffic management equipment and facilities
131 Railway Level Crossing Warning Devices
Maintenance of signs, bells and lights where fitted, located at level crossings and lying within the Crown’s rail corridor
Maintenance activity is described below. The overall strategy is to achieve a balance between being predictive through surveys and reactive through customer requests. Table 7.61 Traffic Services Maintenance - Primary Types of Maintenance Activity
Work Type Description Inspections, monitoring and audits – signs, delineation, railings, etc
Regular routine inspections using the RAMM database are undertaken to ensure traffic signs and street name blades are in operational condition, have not been vandalised or removed, or are at the wrong or inappropriate height. Surveys including night observations are undertaken to ensure visibility remains appropriate. Inspections are being aligned to ONRC measures, an improvement proposed in this Plan.
Customer feedback
RFS are monitored and responded to as faults are reported.
Signs - maintenance
Signs are a large number of small asset value and maintenance versus renewal is on a case by case basis.
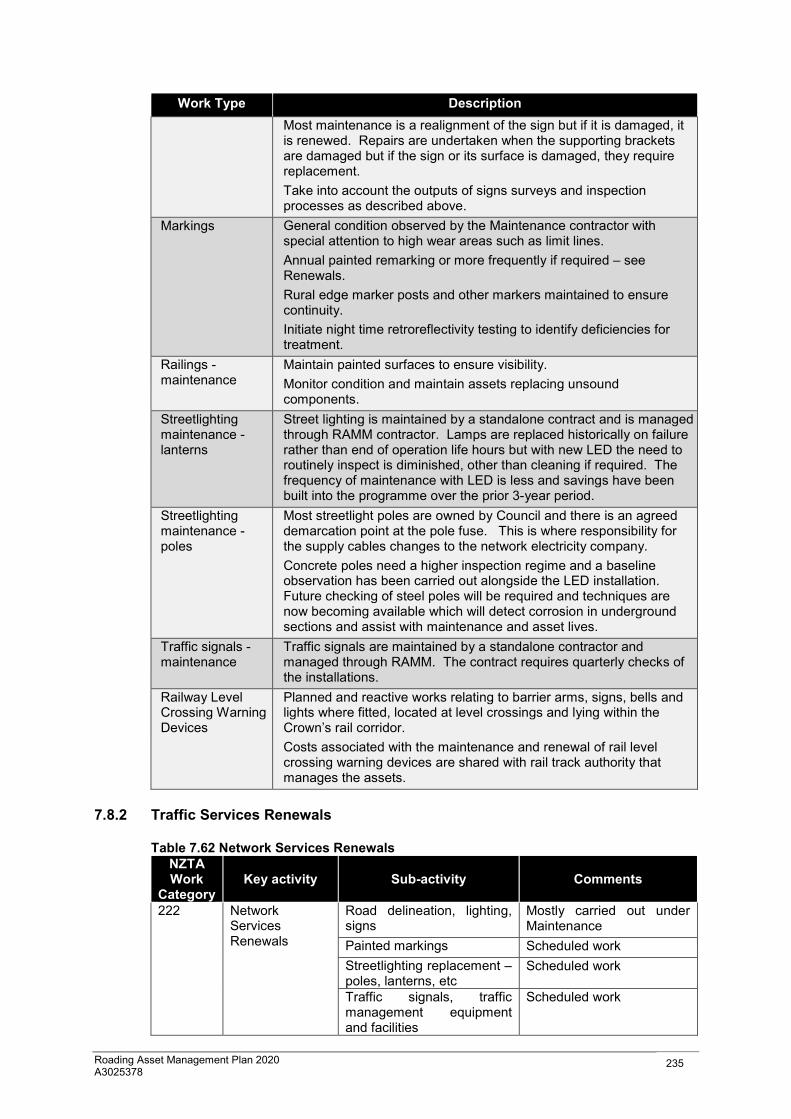
Roading Asset Management Plan 2020 A3025378
235
Work Type Description Most maintenance is a realignment of the sign but if it is damaged, it is renewed. Repairs are undertaken when the supporting brackets are damaged but if the sign or its surface is damaged, they require replacement. Take into account the outputs of signs surveys and inspection processes as described above.
Markings General condition observed by the Maintenance contractor with special attention to high wear areas such as limit lines. Annual painted remarking or more frequently if required – see Renewals. Rural edge marker posts and other markers maintained to ensure continuity. Initiate night time retroreflectivity testing to identify deficiencies for treatment.
Railings - maintenance
Maintain painted surfaces to ensure visibility. Monitor condition and maintain assets replacing unsound components.
Streetlighting maintenance - lanterns
Street lighting is maintained by a standalone contract and is managed through RAMM contractor. Lamps are replaced historically on failure rather than end of operation life hours but with new LED the need to routinely inspect is diminished, other than cleaning if required. The frequency of maintenance with LED is less and savings have been built into the programme over the prior 3-year period.
Streetlighting maintenance - poles
Most streetlight poles are owned by Council and there is an agreed demarcation point at the pole fuse. This is where responsibility for the supply cables changes to the network electricity company. Concrete poles need a higher inspection regime and a baseline observation has been carried out alongside the LED installation. Future checking of steel poles will be required and techniques are now becoming available which will detect corrosion in underground sections and assist with maintenance and asset lives.
Traffic signals - maintenance
Traffic signals are maintained by a standalone contractor and managed through RAMM. The contract requires quarterly checks of the installations.
Railway Level Crossing Warning Devices
Planned and reactive works relating to barrier arms, signs, bells and lights where fitted, located at level crossings and lying within the Crown’s rail corridor. Costs associated with the maintenance and renewal of rail level crossing warning devices are shared with rail track authority that manages the assets.
7.8.2 Traffic Services Renewals
Table 7.62 Network Services Renewals
NZTA Work
Category Key activity Sub-activity Comments
222 Network Services Renewals
Road delineation, lighting, signs
Mostly carried out under Maintenance
Painted markings Scheduled work Streetlighting replacement – poles, lanterns, etc
Scheduled work
Traffic signals, traffic management equipment and facilities
Scheduled work
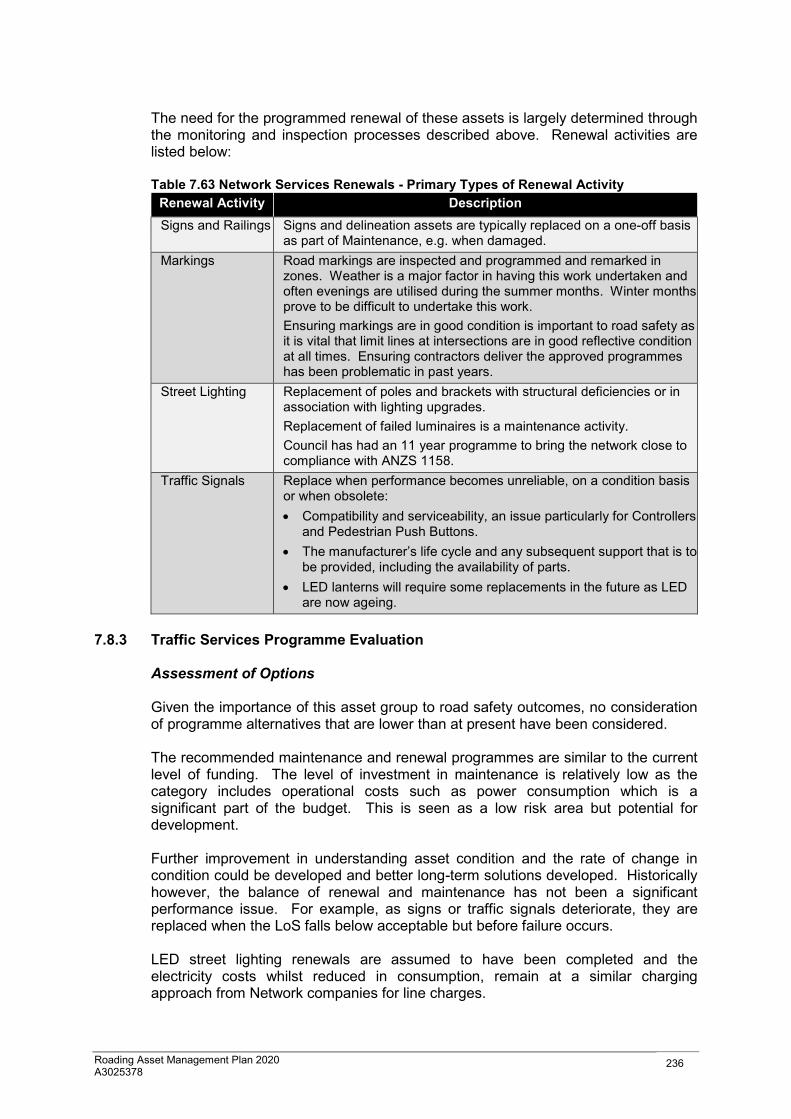
Roading Asset Management Plan 2020 A3025378
236
The need for the programmed renewal of these assets is largely determined through the monitoring and inspection processes described above. Renewal activities are listed below: Table 7.63 Network Services Renewals - Primary Types of Renewal Activity
Renewal Activity Description Signs and Railings Signs and delineation assets are typically replaced on a one-off basis
as part of Maintenance, e.g. when damaged. Markings Road markings are inspected and programmed and remarked in
zones. Weather is a major factor in having this work undertaken and often evenings are utilised during the summer months. Winter months prove to be difficult to undertake this work. Ensuring markings are in good condition is important to road safety as it is vital that limit lines at intersections are in good reflective condition at all times. Ensuring contractors deliver the approved programmes has been problematic in past years.
Street Lighting Replacement of poles and brackets with structural deficiencies or in association with lighting upgrades. Replacement of failed luminaires is a maintenance activity. Council has had an 11 year programme to bring the network close to compliance with ANZS 1158.
Traffic Signals Replace when performance becomes unreliable, on a condition basis or when obsolete: • Compatibility and serviceability, an issue particularly for Controllers
and Pedestrian Push Buttons. • The manufacturer’s life cycle and any subsequent support that is to
be provided, including the availability of parts. • LED lanterns will require some replacements in the future as LED
are now ageing. 7.8.3 Traffic Services Programme Evaluation
Assessment of Options
Given the importance of this asset group to road safety outcomes, no consideration of programme alternatives that are lower than at present have been considered. The recommended maintenance and renewal programmes are similar to the current level of funding. The level of investment in maintenance is relatively low as the category includes operational costs such as power consumption which is a significant part of the budget. This is seen as a low risk area but potential for development. Further improvement in understanding asset condition and the rate of change in condition could be developed and better long-term solutions developed. Historically however, the balance of renewal and maintenance has not been a significant performance issue. For example, as signs or traffic signals deteriorate, they are replaced when the LoS falls below acceptable but before failure occurs. LED street lighting renewals are assumed to have been completed and the electricity costs whilst reduced in consumption, remain at a similar charging approach from Network companies for line charges.
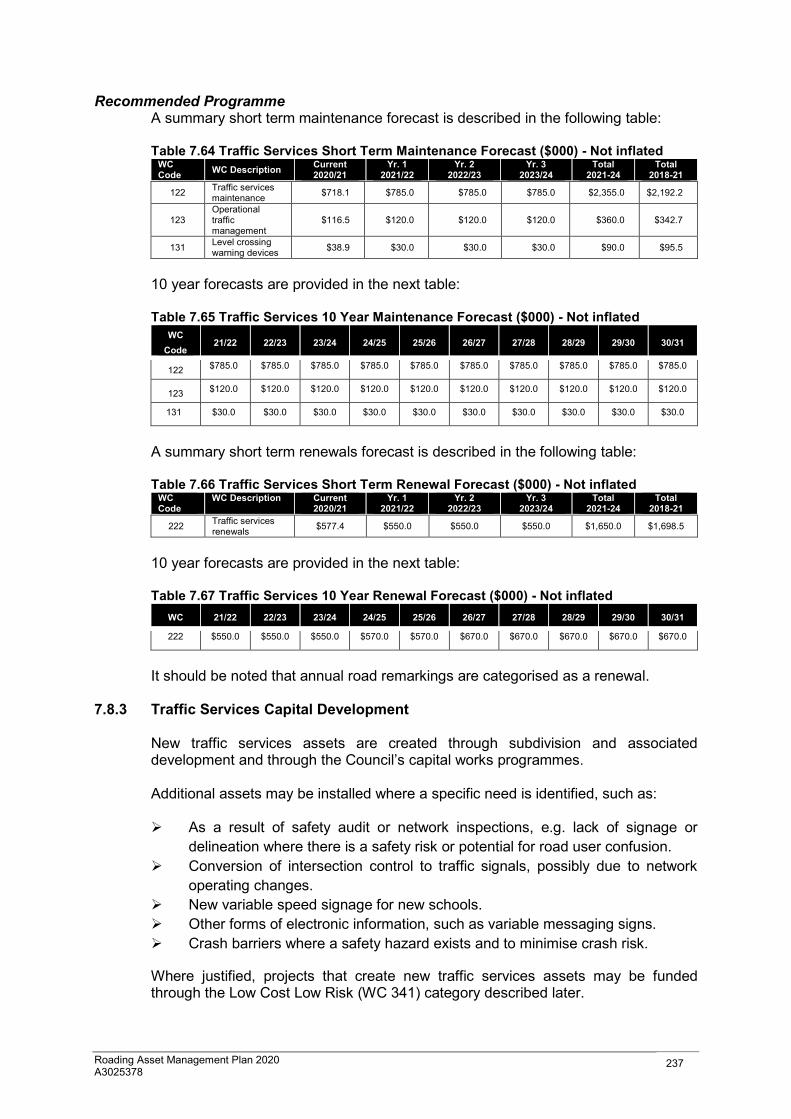
Roading Asset Management Plan 2020 A3025378
237
Recommended Programme A summary short term maintenance forecast is described in the following table: Table 7.64 Traffic Services Short Term Maintenance Forecast ($000) - Not inflated
WC Code WC Description Current
2020/21 Yr. 1
2021/22 Yr. 2
2022/23 Yr. 3
2023/24 Total
2021-24 Total
2018-21
122 Traffic services maintenance $718.1 $785.0 $785.0 $785.0 $2,355.0 $2,192.2
123 Operational traffic management
$116.5 $120.0 $120.0 $120.0 $360.0 $342.7
131 Level crossing warning devices $38.9 $30.0 $30.0 $30.0 $90.0 $95.5
10 year forecasts are provided in the next table: Table 7.65 Traffic Services 10 Year Maintenance Forecast ($000) - Not inflated
WC Code
21/22 22/23 23/24 24/25 25/26 26/27 27/28 28/29 29/30 30/31
122 $785.0 $785.0 $785.0 $785.0 $785.0 $785.0 $785.0 $785.0 $785.0 $785.0
123 $120.0 $120.0 $120.0 $120.0 $120.0 $120.0 $120.0 $120.0 $120.0 $120.0
131 $30.0 $30.0 $30.0 $30.0 $30.0 $30.0 $30.0 $30.0 $30.0 $30.0
A summary short term renewals forecast is described in the following table: Table 7.66 Traffic Services Short Term Renewal Forecast ($000) - Not inflated
WC Code
WC Description Current 2020/21
Yr. 1 2021/22
Yr. 2 2022/23
Yr. 3 2023/24
Total 2021-24
Total 2018-21
222 Traffic services renewals $577.4 $550.0 $550.0 $550.0 $1,650.0 $1,698.5
10 year forecasts are provided in the next table: Table 7.67 Traffic Services 10 Year Renewal Forecast ($000) - Not inflated
WC 21/22 22/23 23/24 24/25 25/26 26/27 27/28 28/29 29/30 30/31
222 $550.0 $550.0 $550.0 $570.0 $570.0 $670.0 $670.0 $670.0 $670.0 $670.0
It should be noted that annual road remarkings are categorised as a renewal.
7.8.3 Traffic Services Capital Development New traffic services assets are created through subdivision and associated development and through the Council’s capital works programmes. Additional assets may be installed where a specific need is identified, such as: As a result of safety audit or network inspections, e.g. lack of signage or
delineation where there is a safety risk or potential for road user confusion. Conversion of intersection control to traffic signals, possibly due to network
operating changes. New variable speed signage for new schools. Other forms of electronic information, such as variable messaging signs. Crash barriers where a safety hazard exists and to minimise crash risk.
Where justified, projects that create new traffic services assets may be funded through the Low Cost Low Risk (WC 341) category described later.
Roading Asset Management Plan 2020 A3025378
238
7.8.4 Traffic Services Activity Summary and Programme Needs The following “story on a page” provides comparative peer information, summary asset condition and management activities information, and summary recommended programmes for each category.
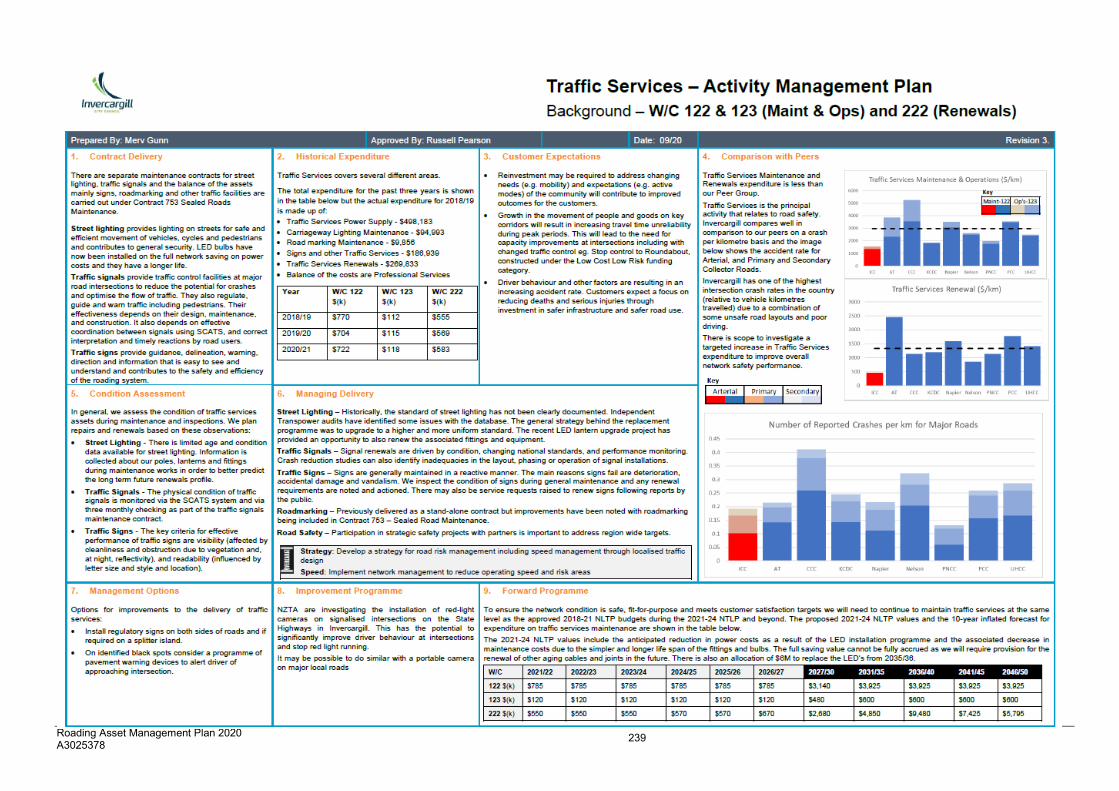
Roading Asset Management Plan 2020 A3025378 239
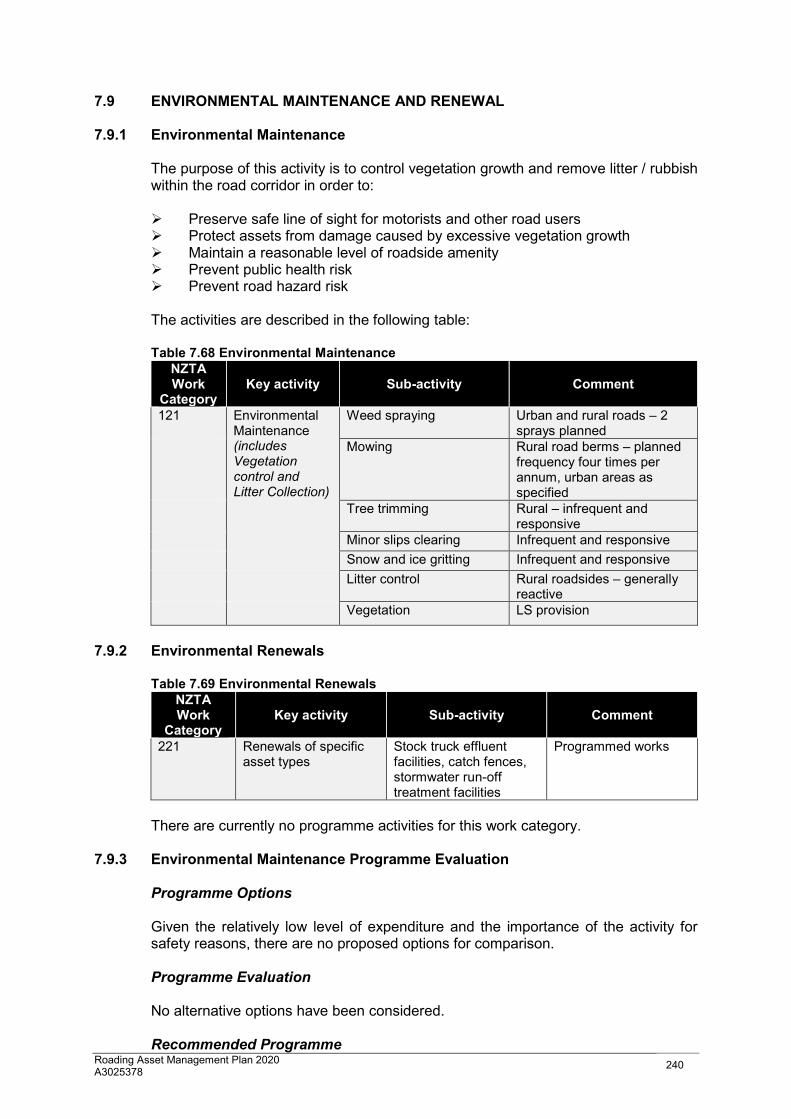
Roading Asset Management Plan 2020 A3025378 240
7.9 ENVIRONMENTAL MAINTENANCE AND RENEWAL
7.9.1 Environmental Maintenance The purpose of this activity is to control vegetation growth and remove litter / rubbish within the road corridor in order to: Preserve safe line of sight for motorists and other road users Protect assets from damage caused by excessive vegetation growth Maintain a reasonable level of roadside amenity Prevent public health risk Prevent road hazard risk The activities are described in the following table:
Table 7.68 Environmental Maintenance
NZTA Work
Category Key activity Sub-activity Comment
121 Environmental Maintenance (includes Vegetation control and Litter Collection)
Weed spraying Urban and rural roads – 2 sprays planned
Mowing Rural road berms – planned frequency four times per annum, urban areas as specified
Tree trimming Rural – infrequent and responsive
Minor slips clearing Infrequent and responsive Snow and ice gritting Infrequent and responsive Litter control Rural roadsides – generally
reactive Vegetation LS provision
7.9.2 Environmental Renewals
Table 7.69 Environmental Renewals
NZTA Work
Category Key activity Sub-activity Comment
221 Renewals of specific asset types
Stock truck effluent facilities, catch fences, stormwater run-off treatment facilities
Programmed works
There are currently no programme activities for this work category.
7.9.3 Environmental Maintenance Programme Evaluation
Programme Options
Given the relatively low level of expenditure and the importance of the activity for safety reasons, there are no proposed options for comparison.
Programme Evaluation No alternative options have been considered.
Recommended Programme
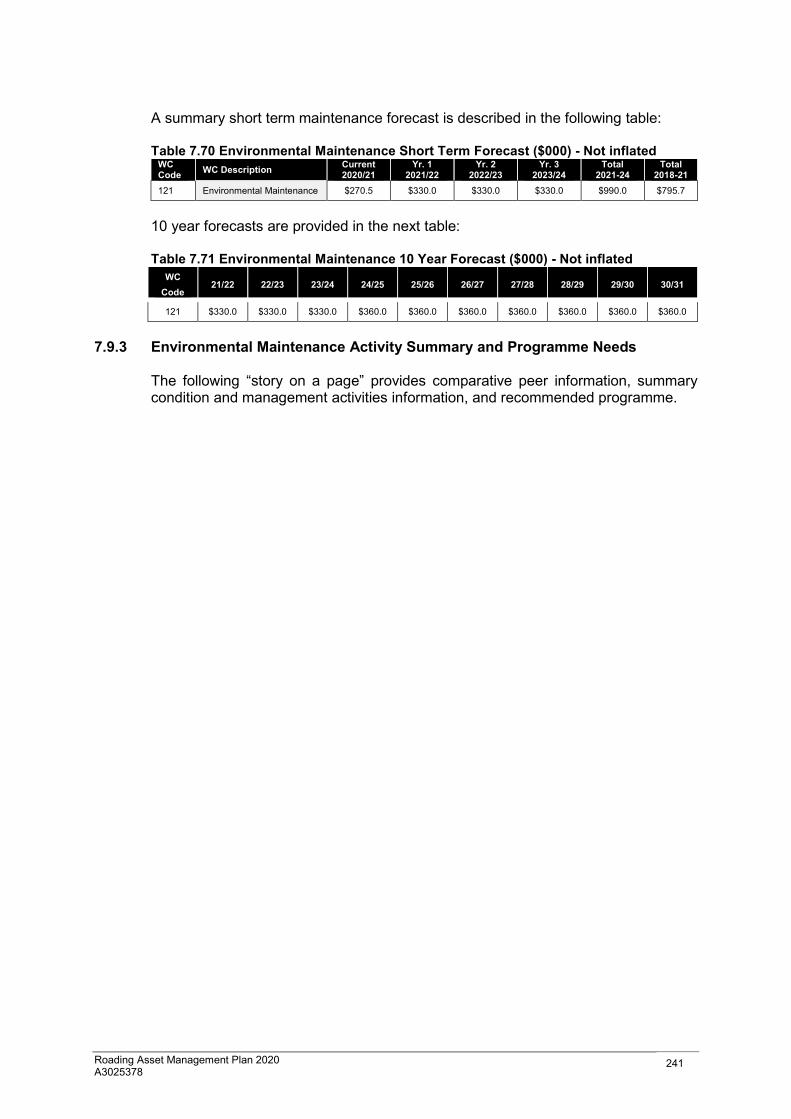
Roading Asset Management Plan 2020 A3025378
241
A summary short term maintenance forecast is described in the following table: Table 7.70 Environmental Maintenance Short Term Forecast ($000) - Not inflated
WC Code WC Description Current
2020/21 Yr. 1
2021/22 Yr. 2
2022/23 Yr. 3
2023/24 Total
2021-24 Total
2018-21 121 Environmental Maintenance $270.5 $330.0 $330.0 $330.0 $990.0 $795.7
10 year forecasts are provided in the next table: Table 7.71 Environmental Maintenance 10 Year Forecast ($000) - Not inflated
WC Code
21/22 22/23 23/24 24/25 25/26 26/27 27/28 28/29 29/30 30/31
121 $330.0 $330.0 $330.0 $360.0 $360.0 $360.0 $360.0 $360.0 $360.0 $360.0
7.9.3 Environmental Maintenance Activity Summary and Programme Needs
The following “story on a page” provides comparative peer information, summary condition and management activities information, and recommended programme.
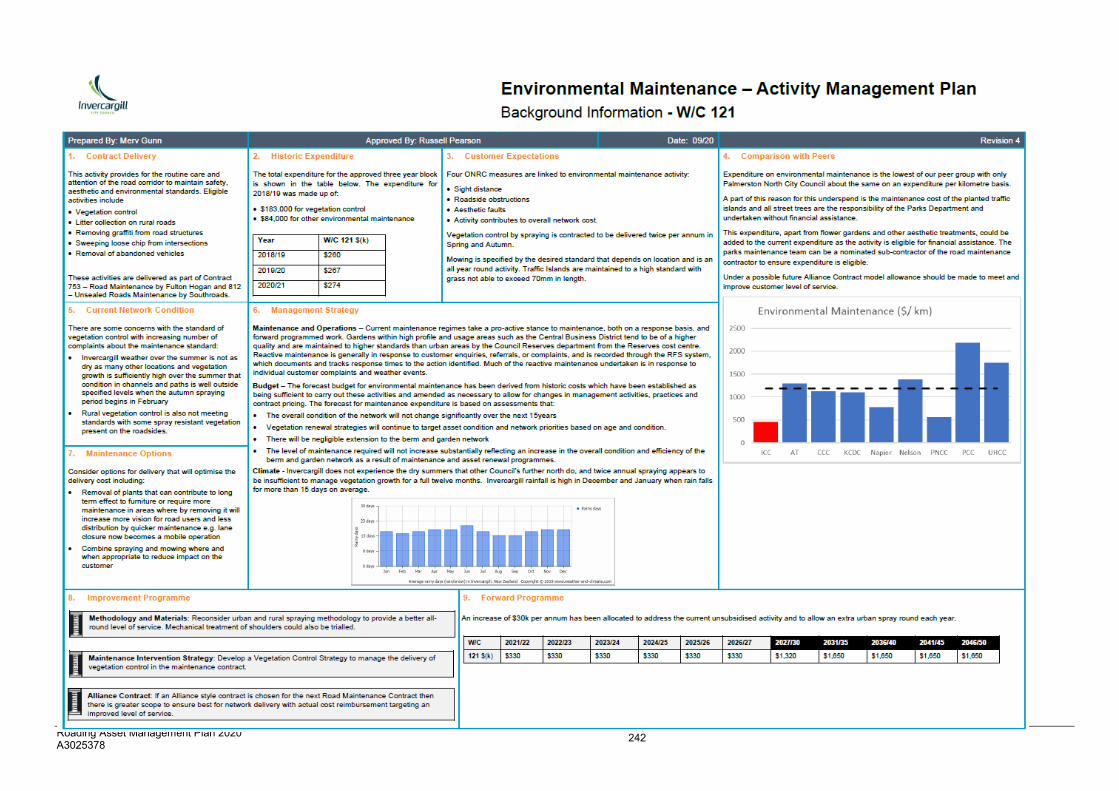
Roading Asset Management Plan 2020 A3025378 242
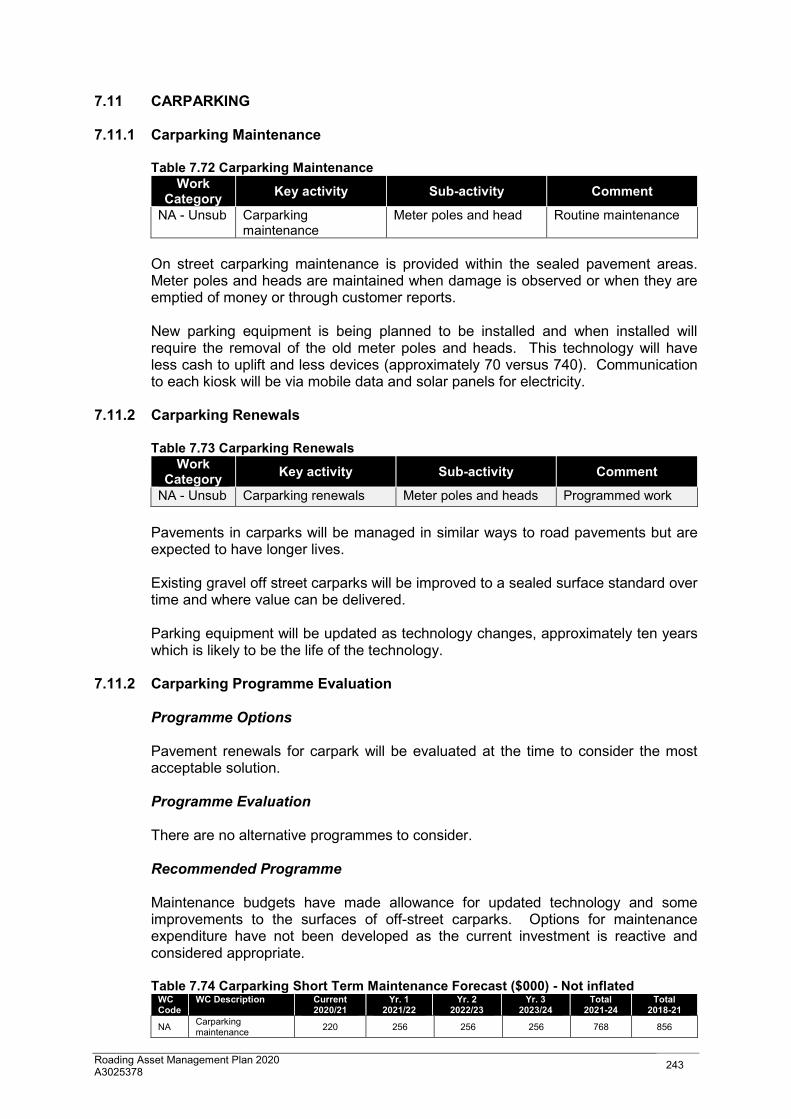
Roading Asset Management Plan 2020 A3025378 243
7.11 CARPARKING
7.11.1 Carparking Maintenance
Table 7.72 Carparking Maintenance Work
Category Key activity Sub-activity Comment
NA - Unsub Carparking maintenance
Meter poles and head Routine maintenance
On street carparking maintenance is provided within the sealed pavement areas. Meter poles and heads are maintained when damage is observed or when they are emptied of money or through customer reports. New parking equipment is being planned to be installed and when installed will require the removal of the old meter poles and heads. This technology will have less cash to uplift and less devices (approximately 70 versus 740). Communication to each kiosk will be via mobile data and solar panels for electricity.
7.11.2 Carparking Renewals
Table 7.73 Carparking Renewals Work
Category Key activity Sub-activity Comment
NA - Unsub Carparking renewals Meter poles and heads Programmed work Pavements in carparks will be managed in similar ways to road pavements but are expected to have longer lives. Existing gravel off street carparks will be improved to a sealed surface standard over time and where value can be delivered. Parking equipment will be updated as technology changes, approximately ten years which is likely to be the life of the technology.
7.11.2 Carparking Programme Evaluation
Programme Options Pavement renewals for carpark will be evaluated at the time to consider the most acceptable solution.
Programme Evaluation There are no alternative programmes to consider.
Recommended Programme Maintenance budgets have made allowance for updated technology and some improvements to the surfaces of off-street carparks. Options for maintenance expenditure have not been developed as the current investment is reactive and considered appropriate. Table 7.74 Carparking Short Term Maintenance Forecast ($000) - Not inflated
WC Code
WC Description Current 2020/21
Yr. 1 2021/22
Yr. 2 2022/23
Yr. 3 2023/24
Total 2021-24
Total 2018-21
NA Carparking maintenance 220 256 256 256 768 856
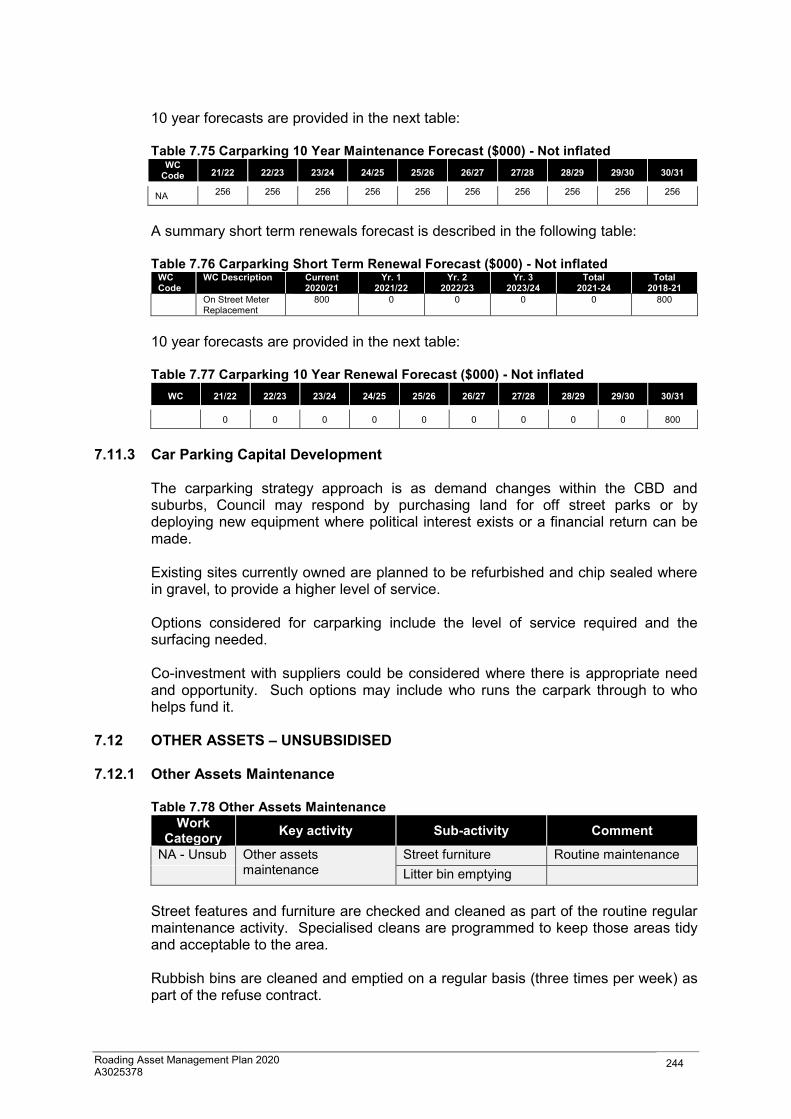
Roading Asset Management Plan 2020 A3025378
244
10 year forecasts are provided in the next table: Table 7.75 Carparking 10 Year Maintenance Forecast ($000) - Not inflated
WC Code 21/22 22/23 23/24 24/25 25/26 26/27 27/28 28/29 29/30 30/31
NA 256 256 256 256 256 256 256 256 256 256
A summary short term renewals forecast is described in the following table: Table 7.76 Carparking Short Term Renewal Forecast ($000) - Not inflated
WC Code
WC Description Current 2020/21
Yr. 1 2021/22
Yr. 2 2022/23
Yr. 3 2023/24
Total 2021-24
Total 2018-21
On Street Meter Replacement
800 0 0 0 0 800
10 year forecasts are provided in the next table: Table 7.77 Carparking 10 Year Renewal Forecast ($000) - Not inflated
WC 21/22 22/23 23/24 24/25 25/26 26/27 27/28 28/29 29/30 30/31
0 0 0 0 0 0 0 0 0 800
7.11.3 Car Parking Capital Development
The carparking strategy approach is as demand changes within the CBD and suburbs, Council may respond by purchasing land for off street parks or by deploying new equipment where political interest exists or a financial return can be made. Existing sites currently owned are planned to be refurbished and chip sealed where in gravel, to provide a higher level of service. Options considered for carparking include the level of service required and the surfacing needed. Co-investment with suppliers could be considered where there is appropriate need and opportunity. Such options may include who runs the carpark through to who helps fund it.
7.12 OTHER ASSETS – UNSUBSIDISED
7.12.1 Other Assets Maintenance
Table 7.78 Other Assets Maintenance Work
Category Key activity Sub-activity Comment
NA - Unsub Other assets maintenance
Street furniture Routine maintenance Litter bin emptying
Street features and furniture are checked and cleaned as part of the routine regular maintenance activity. Specialised cleans are programmed to keep those areas tidy and acceptable to the area. Rubbish bins are cleaned and emptied on a regular basis (three times per week) as part of the refuse contract.
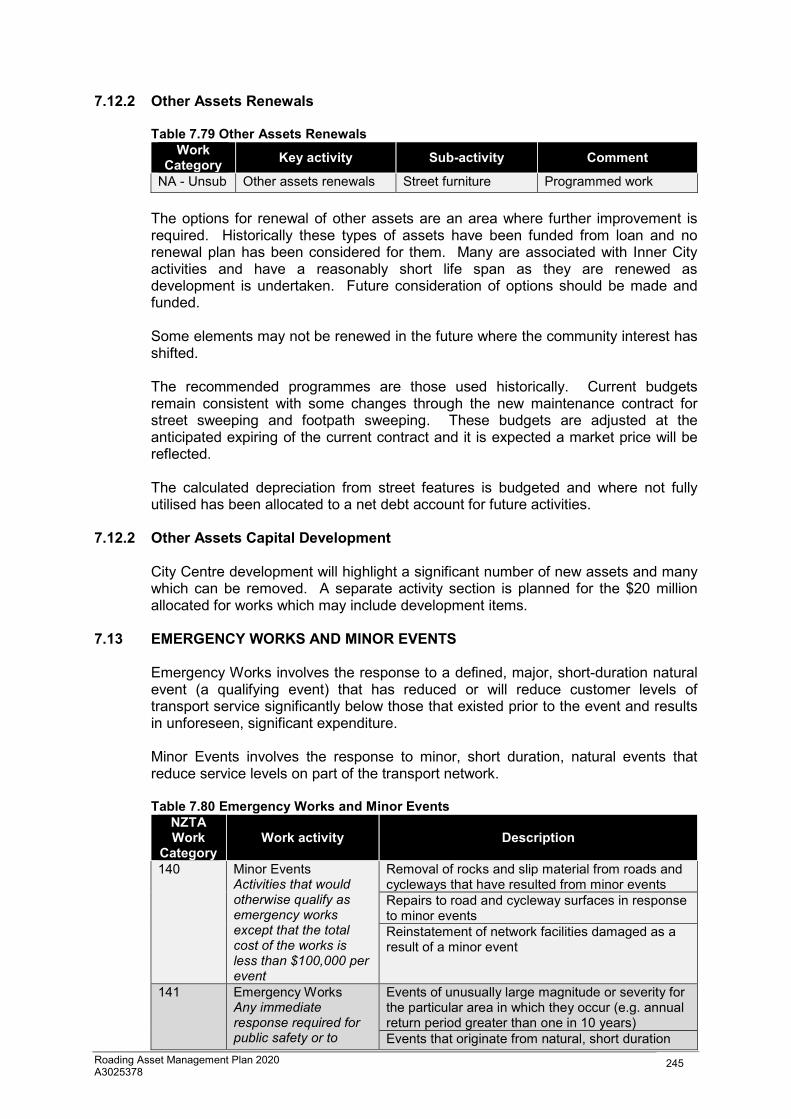
Roading Asset Management Plan 2020 A3025378
245
7.12.2 Other Assets Renewals
Table 7.79 Other Assets Renewals Work
Category Key activity Sub-activity Comment
NA - Unsub Other assets renewals Street furniture Programmed work The options for renewal of other assets are an area where further improvement is required. Historically these types of assets have been funded from loan and no renewal plan has been considered for them. Many are associated with Inner City activities and have a reasonably short life span as they are renewed as development is undertaken. Future consideration of options should be made and funded. Some elements may not be renewed in the future where the community interest has shifted. The recommended programmes are those used historically. Current budgets remain consistent with some changes through the new maintenance contract for street sweeping and footpath sweeping. These budgets are adjusted at the anticipated expiring of the current contract and it is expected a market price will be reflected. The calculated depreciation from street features is budgeted and where not fully utilised has been allocated to a net debt account for future activities.
7.12.2 Other Assets Capital Development City Centre development will highlight a significant number of new assets and many which can be removed. A separate activity section is planned for the $20 million allocated for works which may include development items.
7.13 EMERGENCY WORKS AND MINOR EVENTS
Emergency Works involves the response to a defined, major, short-duration natural event (a qualifying event) that has reduced or will reduce customer levels of transport service significantly below those that existed prior to the event and results in unforeseen, significant expenditure. Minor Events involves the response to minor, short duration, natural events that reduce service levels on part of the transport network. Table 7.80 Emergency Works and Minor Events
NZTA Work
Category Work activity Description
140 Minor Events Activities that would otherwise qualify as emergency works except that the total cost of the works is less than $100,000 per event
Removal of rocks and slip material from roads and cycleways that have resulted from minor events Repairs to road and cycleway surfaces in response to minor events Reinstatement of network facilities damaged as a result of a minor event
141 Emergency Works Any immediate response required for public safety or to
Events of unusually large magnitude or severity for the particular area in which they occur (e.g. annual return period greater than one in 10 years) Events that originate from natural, short duration
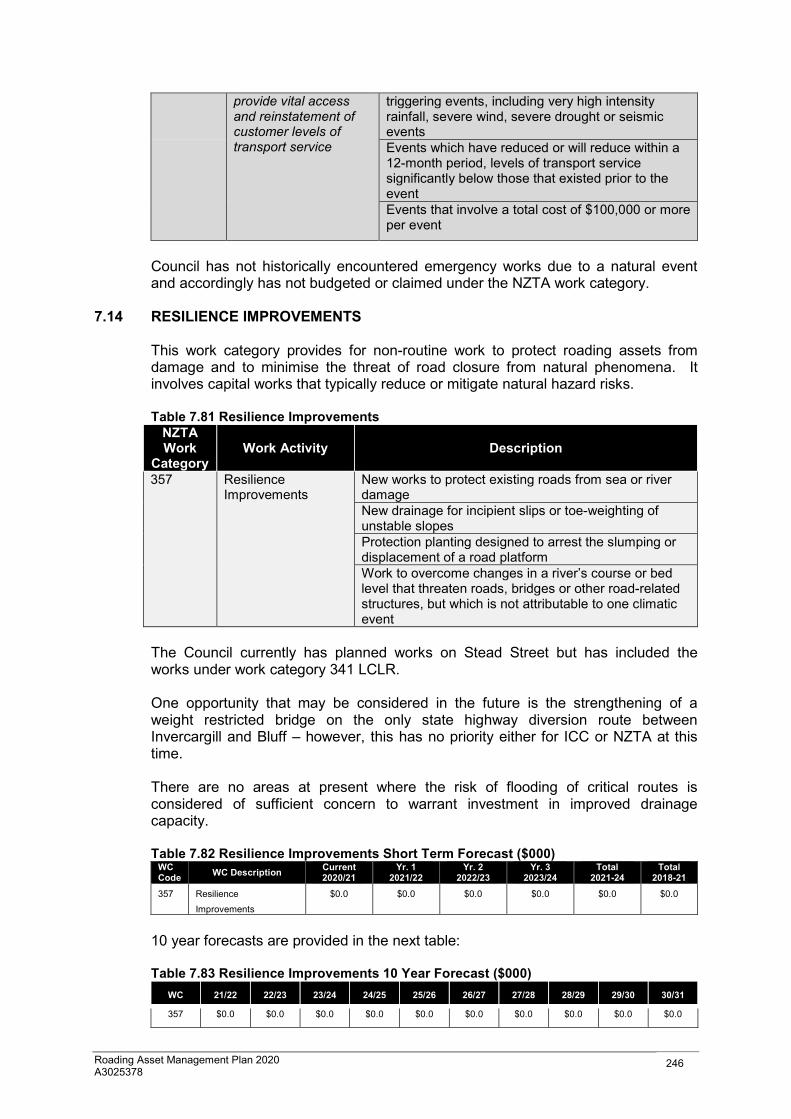
Roading Asset Management Plan 2020 A3025378
246
provide vital access and reinstatement of customer levels of transport service
triggering events, including very high intensity rainfall, severe wind, severe drought or seismic events Events which have reduced or will reduce within a 12-month period, levels of transport service significantly below those that existed prior to the event Events that involve a total cost of $100,000 or more per event
Council has not historically encountered emergency works due to a natural event and accordingly has not budgeted or claimed under the NZTA work category.
7.14 RESILIENCE IMPROVEMENTS
This work category provides for non-routine work to protect roading assets from damage and to minimise the threat of road closure from natural phenomena. It involves capital works that typically reduce or mitigate natural hazard risks. Table 7.81 Resilience Improvements
NZTA Work
Category Work Activity Description
357 Resilience Improvements
New works to protect existing roads from sea or river damage New drainage for incipient slips or toe-weighting of unstable slopes Protection planting designed to arrest the slumping or displacement of a road platform Work to overcome changes in a river’s course or bed level that threaten roads, bridges or other road-related structures, but which is not attributable to one climatic event
The Council currently has planned works on Stead Street but has included the works under work category 341 LCLR. One opportunity that may be considered in the future is the strengthening of a weight restricted bridge on the only state highway diversion route between Invercargill and Bluff – however, this has no priority either for ICC or NZTA at this time. There are no areas at present where the risk of flooding of critical routes is considered of sufficient concern to warrant investment in improved drainage capacity. Table 7.82 Resilience Improvements Short Term Forecast ($000)
WC Code WC Description Current
2020/21 Yr. 1
2021/22 Yr. 2
2022/23 Yr. 3
2023/24 Total
2021-24 Total
2018-21 357 Resilience
Improvements $0.0 $0.0 $0.0 $0.0 $0.0 $0.0
10 year forecasts are provided in the next table: Table 7.83 Resilience Improvements 10 Year Forecast ($000)
WC 21/22 22/23 23/24 24/25 25/26 26/27 27/28 28/29 29/30 30/31
357 $0.0 $0.0 $0.0 $0.0 $0.0 $0.0 $0.0 $0.0 $0.0 $0.0
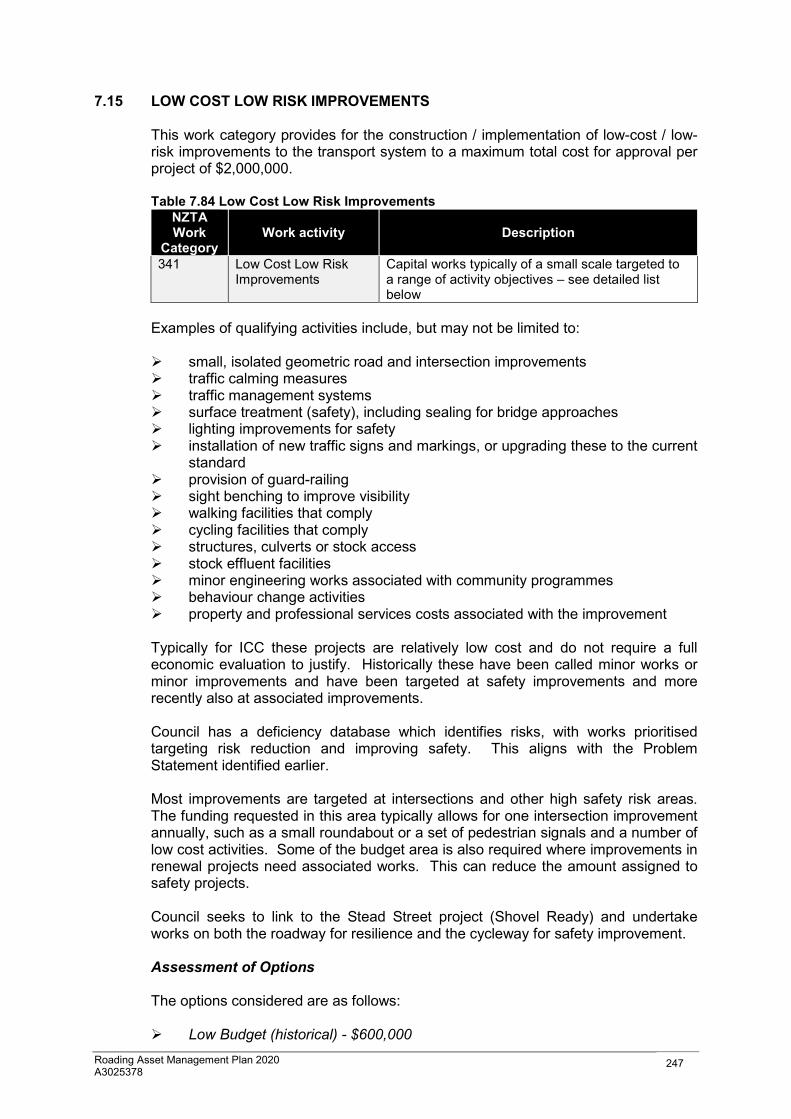
Roading Asset Management Plan 2020 A3025378
247
7.15 LOW COST LOW RISK IMPROVEMENTS This work category provides for the construction / implementation of low-cost / low-risk improvements to the transport system to a maximum total cost for approval per project of $2,000,000. Table 7.84 Low Cost Low Risk Improvements
NZTA Work
Category Work activity Description
341 Low Cost Low Risk Improvements
Capital works typically of a small scale targeted to a range of activity objectives – see detailed list below
Examples of qualifying activities include, but may not be limited to: small, isolated geometric road and intersection improvements traffic calming measures traffic management systems surface treatment (safety), including sealing for bridge approaches lighting improvements for safety installation of new traffic signs and markings, or upgrading these to the current
standard provision of guard-railing sight benching to improve visibility walking facilities that comply cycling facilities that comply structures, culverts or stock access stock effluent facilities minor engineering works associated with community programmes behaviour change activities property and professional services costs associated with the improvement Typically for ICC these projects are relatively low cost and do not require a full economic evaluation to justify. Historically these have been called minor works or minor improvements and have been targeted at safety improvements and more recently also at associated improvements. Council has a deficiency database which identifies risks, with works prioritised targeting risk reduction and improving safety. This aligns with the Problem Statement identified earlier. Most improvements are targeted at intersections and other high safety risk areas. The funding requested in this area typically allows for one intersection improvement annually, such as a small roundabout or a set of pedestrian signals and a number of low cost activities. Some of the budget area is also required where improvements in renewal projects need associated works. This can reduce the amount assigned to safety projects. Council seeks to link to the Stead Street project (Shovel Ready) and undertake works on both the roadway for resilience and the cycleway for safety improvement.
Assessment of Options The options considered are as follows: Low Budget (historical) - $600,000
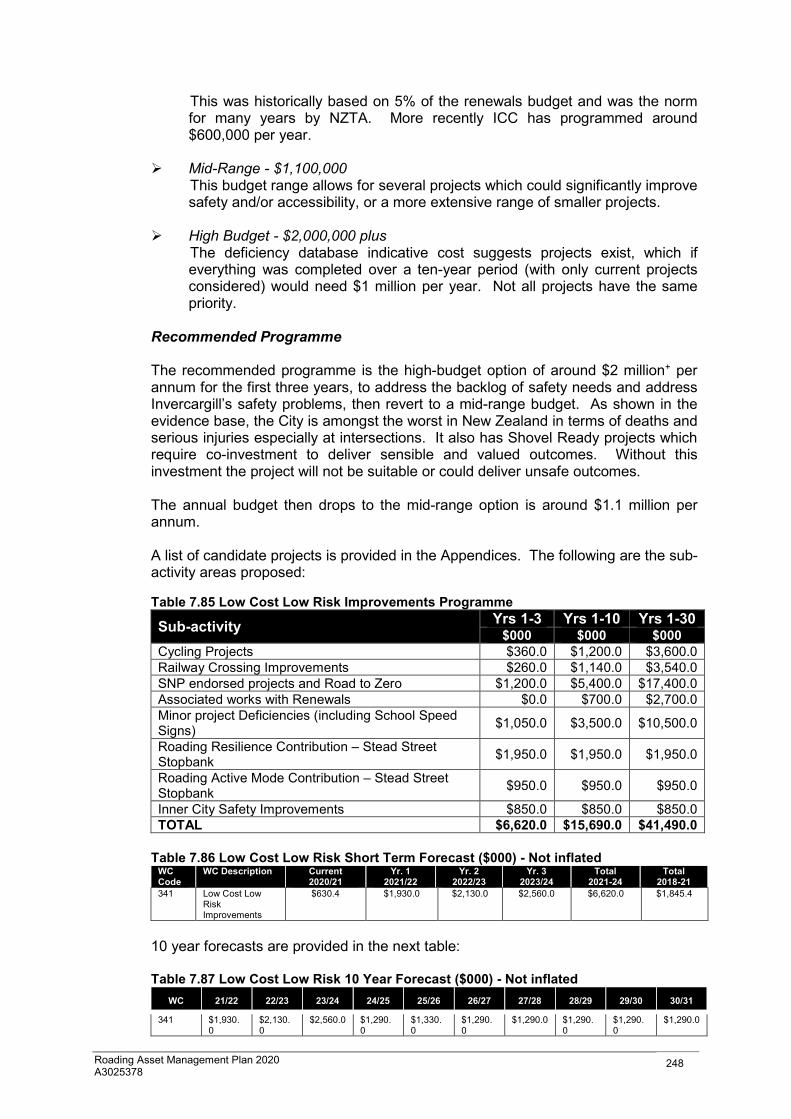
Roading Asset Management Plan 2020 A3025378
248
This was historically based on 5% of the renewals budget and was the norm for many years by NZTA. More recently ICC has programmed around $600,000 per year.
Mid-Range - $1,100,000 This budget range allows for several projects which could significantly improve
safety and/or accessibility, or a more extensive range of smaller projects. High Budget - $2,000,000 plus The deficiency database indicative cost suggests projects exist, which if
everything was completed over a ten-year period (with only current projects considered) would need $1 million per year. Not all projects have the same priority.
Recommended Programme
The recommended programme is the high-budget option of around $2 million+ per annum for the first three years, to address the backlog of safety needs and address Invercargill’s safety problems, then revert to a mid-range budget. As shown in the evidence base, the City is amongst the worst in New Zealand in terms of deaths and serious injuries especially at intersections. It also has Shovel Ready projects which require co-investment to deliver sensible and valued outcomes. Without this investment the project will not be suitable or could deliver unsafe outcomes. The annual budget then drops to the mid-range option is around $1.1 million per annum. A list of candidate projects is provided in the Appendices. The following are the sub-activity areas proposed: Table 7.85 Low Cost Low Risk Improvements Programme
Sub-activity Yrs 1-3 Yrs 1-10 Yrs 1-30 $000 $000 $000
Cycling Projects $360.0 $1,200.0 $3,600.0 Railway Crossing Improvements $260.0 $1,140.0 $3,540.0 SNP endorsed projects and Road to Zero $1,200.0 $5,400.0 $17,400.0 Associated works with Renewals $0.0 $700.0 $2,700.0 Minor project Deficiencies (including School Speed Signs) $1,050.0 $3,500.0 $10,500.0
Roading Resilience Contribution – Stead Street Stopbank $1,950.0 $1,950.0 $1,950.0
Roading Active Mode Contribution – Stead Street Stopbank $950.0 $950.0 $950.0
Inner City Safety Improvements $850.0 $850.0 $850.0 TOTAL $6,620.0 $15,690.0 $41,490.0
Table 7.86 Low Cost Low Risk Short Term Forecast ($000) - Not inflated
WC Code
WC Description Current 2020/21
Yr. 1 2021/22
Yr. 2 2022/23
Yr. 3 2023/24
Total 2021-24
Total 2018-21
341 Low Cost Low Risk Improvements
$630.4 $1,930.0 $2,130.0 $2,560.0 $6,620.0 $1,845.4
10 year forecasts are provided in the next table: Table 7.87 Low Cost Low Risk 10 Year Forecast ($000) - Not inflated
WC 21/22 22/23 23/24 24/25 25/26 26/27 27/28 28/29 29/30 30/31
341 $1,930.0
$2,130.0
$2,560.0 $1,290.0
$1,330.0
$1,290.0
$1,290.0 $1,290.0
$1,290.0
$1,290.0
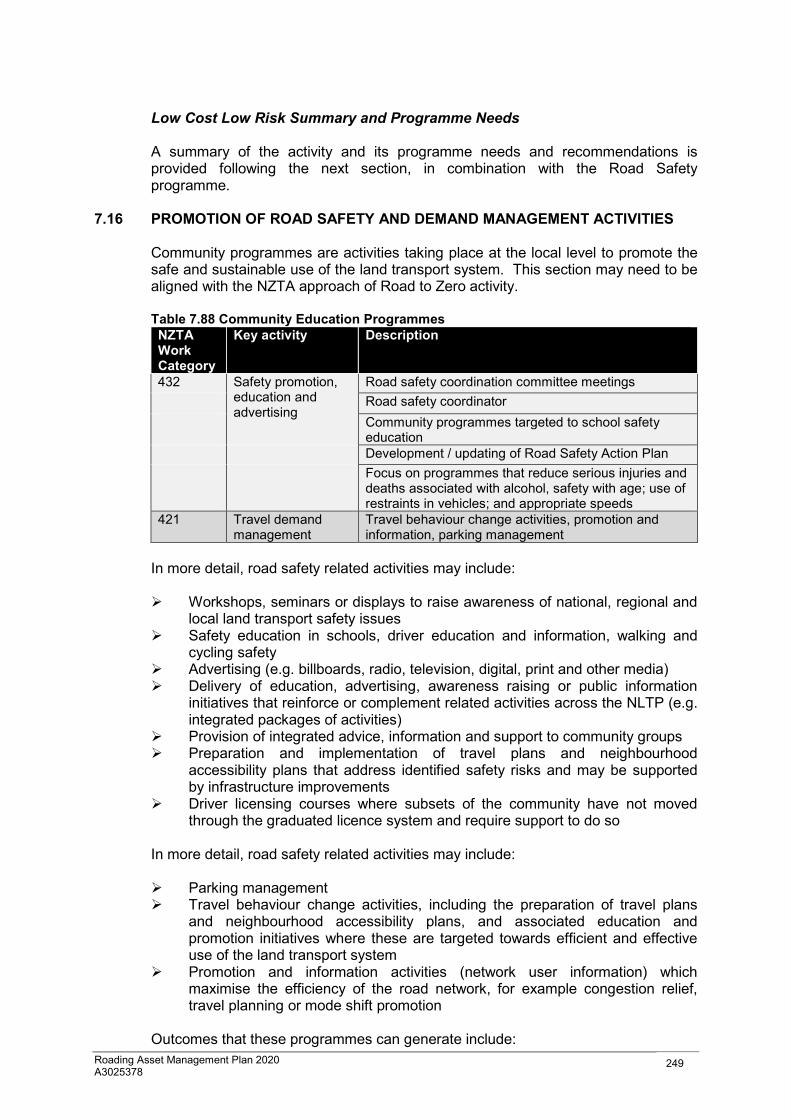
Roading Asset Management Plan 2020 A3025378
249
Low Cost Low Risk Summary and Programme Needs A summary of the activity and its programme needs and recommendations is provided following the next section, in combination with the Road Safety programme.
7.16 PROMOTION OF ROAD SAFETY AND DEMAND MANAGEMENT ACTIVITIES
Community programmes are activities taking place at the local level to promote the safe and sustainable use of the land transport system. This section may need to be aligned with the NZTA approach of Road to Zero activity. Table 7.88 Community Education Programmes NZTA Work Category
Key activity Description
432 Safety promotion, education and advertising
Road safety coordination committee meetings Road safety coordinator Community programmes targeted to school safety
education Development / updating of Road Safety Action Plan Focus on programmes that reduce serious injuries and
deaths associated with alcohol, safety with age; use of restraints in vehicles; and appropriate speeds
421 Travel demand management
Travel behaviour change activities, promotion and information, parking management
In more detail, road safety related activities may include: Workshops, seminars or displays to raise awareness of national, regional and
local land transport safety issues Safety education in schools, driver education and information, walking and
cycling safety Advertising (e.g. billboards, radio, television, digital, print and other media) Delivery of education, advertising, awareness raising or public information
initiatives that reinforce or complement related activities across the NLTP (e.g. integrated packages of activities)
Provision of integrated advice, information and support to community groups Preparation and implementation of travel plans and neighbourhood
accessibility plans that address identified safety risks and may be supported by infrastructure improvements
Driver licensing courses where subsets of the community have not moved through the graduated licence system and require support to do so
In more detail, road safety related activities may include: Parking management Travel behaviour change activities, including the preparation of travel plans
and neighbourhood accessibility plans, and associated education and promotion initiatives where these are targeted towards efficient and effective use of the land transport system
Promotion and information activities (network user information) which maximise the efficiency of the road network, for example congestion relief, travel planning or mode shift promotion
Outcomes that these programmes can generate include:
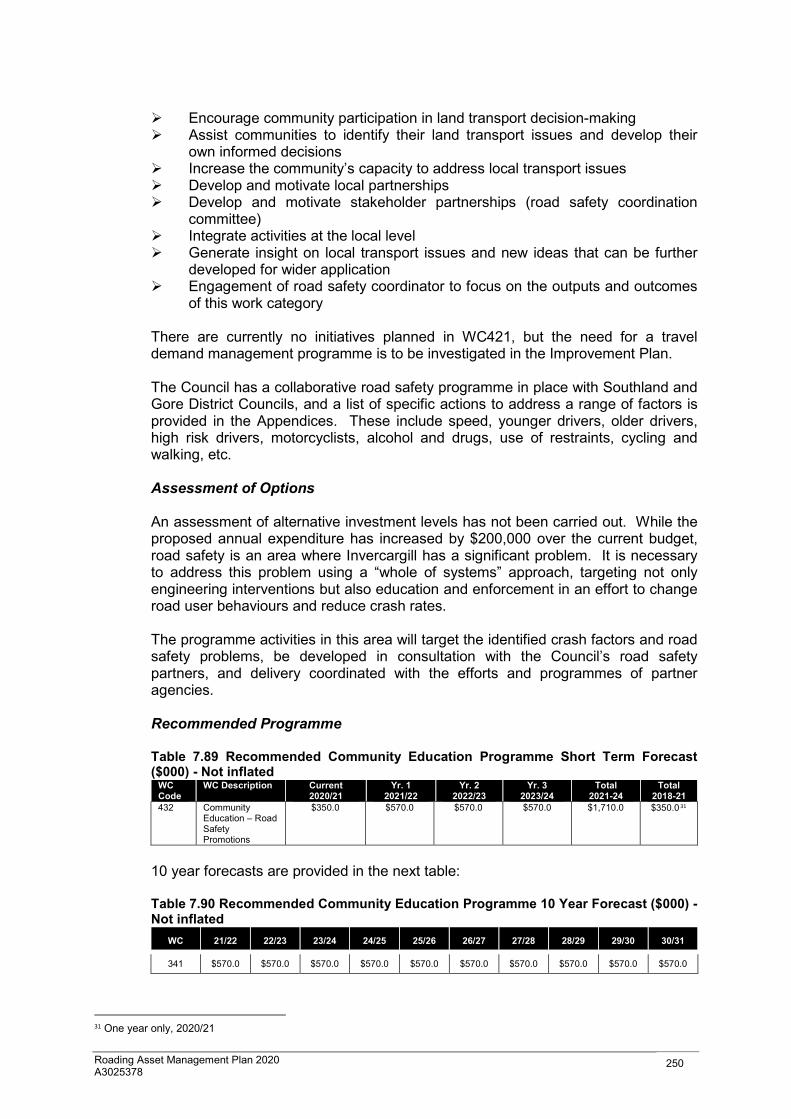
Roading Asset Management Plan 2020 A3025378
250
Encourage community participation in land transport decision-making Assist communities to identify their land transport issues and develop their
own informed decisions Increase the community’s capacity to address local transport issues Develop and motivate local partnerships Develop and motivate stakeholder partnerships (road safety coordination
committee) Integrate activities at the local level Generate insight on local transport issues and new ideas that can be further
developed for wider application Engagement of road safety coordinator to focus on the outputs and outcomes
of this work category There are currently no initiatives planned in WC421, but the need for a travel demand management programme is to be investigated in the Improvement Plan. The Council has a collaborative road safety programme in place with Southland and Gore District Councils, and a list of specific actions to address a range of factors is provided in the Appendices. These include speed, younger drivers, older drivers, high risk drivers, motorcyclists, alcohol and drugs, use of restraints, cycling and walking, etc.
Assessment of Options An assessment of alternative investment levels has not been carried out. While the proposed annual expenditure has increased by $200,000 over the current budget, road safety is an area where Invercargill has a significant problem. It is necessary to address this problem using a “whole of systems” approach, targeting not only engineering interventions but also education and enforcement in an effort to change road user behaviours and reduce crash rates. The programme activities in this area will target the identified crash factors and road safety problems, be developed in consultation with the Council’s road safety partners, and delivery coordinated with the efforts and programmes of partner agencies.
Recommended Programme
Table 7.89 Recommended Community Education Programme Short Term Forecast ($000) - Not inflated
WC Code
WC Description Current 2020/21
Yr. 1 2021/22
Yr. 2 2022/23
Yr. 3 2023/24
Total 2021-24
Total 2018-21
432 Community Education – Road Safety Promotions
$350.0 $570.0 $570.0 $570.0 $1,710.0 $350.031
10 year forecasts are provided in the next table: Table 7.90 Recommended Community Education Programme 10 Year Forecast ($000) - Not inflated
WC 21/22 22/23 23/24 24/25 25/26 26/27 27/28 28/29 29/30 30/31
341 $570.0 $570.0 $570.0 $570.0 $570.0 $570.0 $570.0 $570.0 $570.0 $570.0
31 One year only, 2020/21
Roading Asset Management Plan 2020 A3025378
251
Road Safety Promotion and Education Summary and Programme Needs A summary of road safety programme needs and recommendations is provided below, in combination with the Low Cost Low Risk programme.
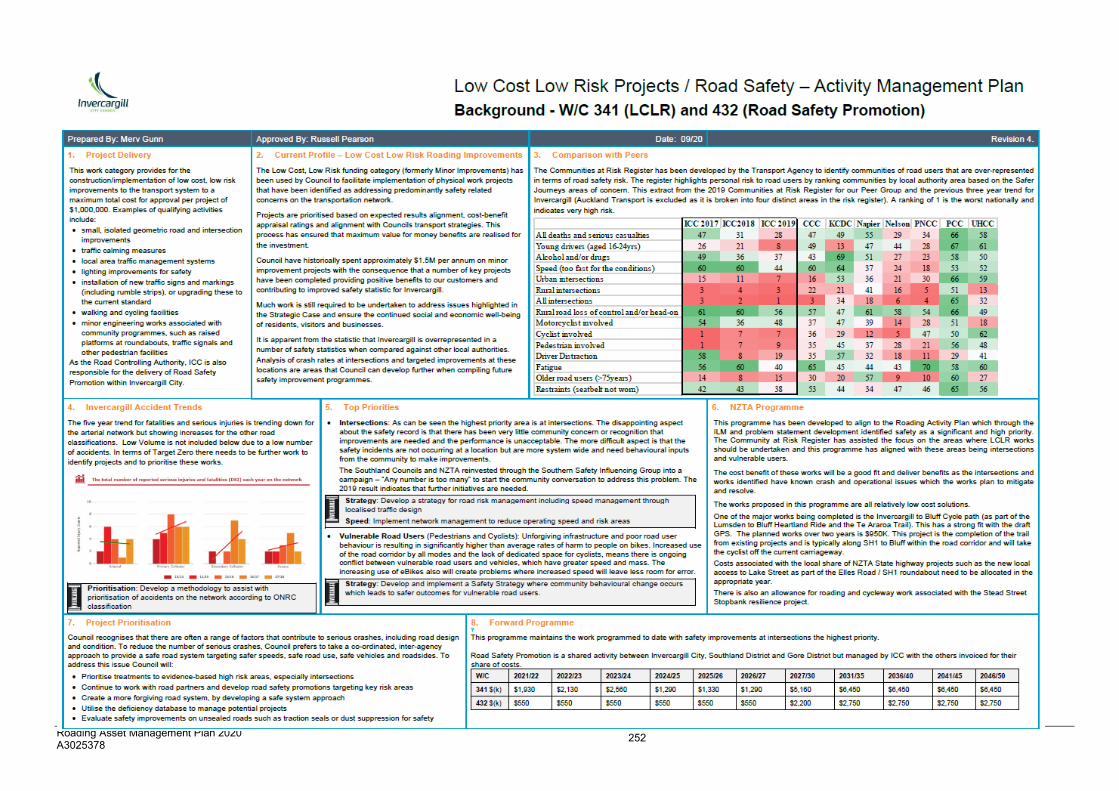
Roading Asset Management Plan 2020 A3025378 252
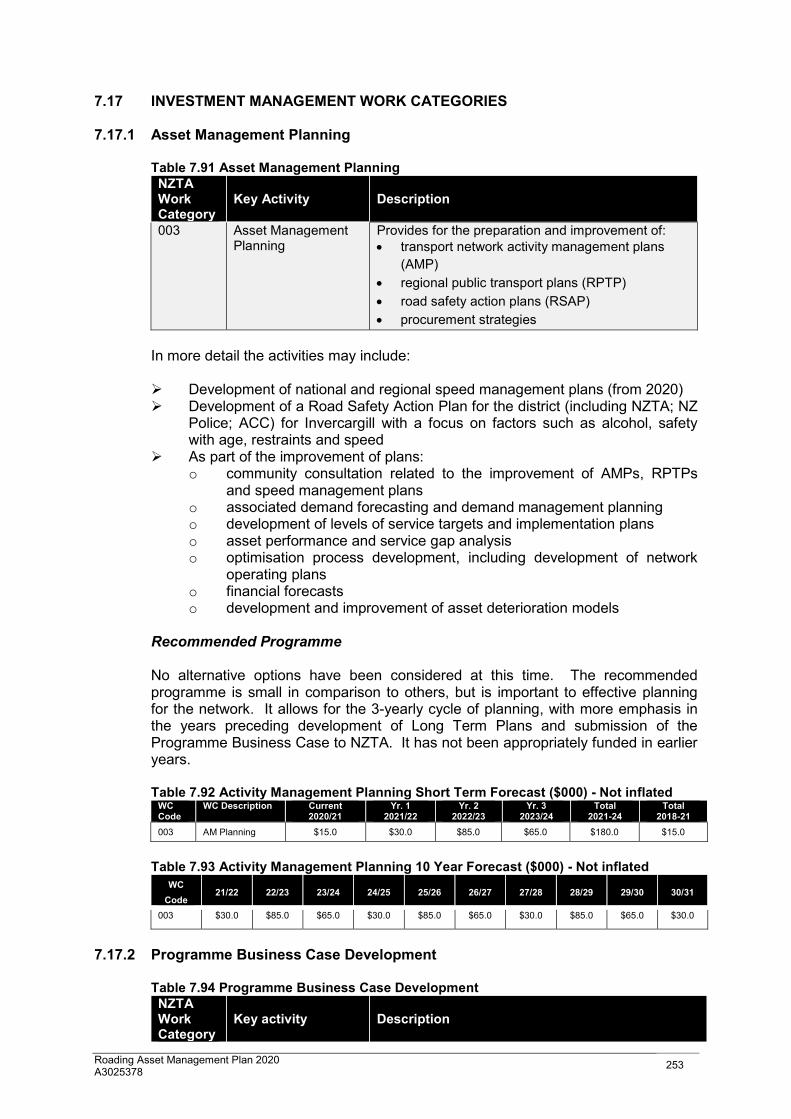
Roading Asset Management Plan 2020 A3025378 253
7.17 INVESTMENT MANAGEMENT WORK CATEGORIES
7.17.1 Asset Management Planning
Table 7.91 Asset Management Planning NZTA Work Category
Key Activity Description
003 Asset Management Planning
Provides for the preparation and improvement of: • transport network activity management plans
(AMP) • regional public transport plans (RPTP) • road safety action plans (RSAP) • procurement strategies
In more detail the activities may include: Development of national and regional speed management plans (from 2020) Development of a Road Safety Action Plan for the district (including NZTA; NZ
Police; ACC) for Invercargill with a focus on factors such as alcohol, safety with age, restraints and speed
As part of the improvement of plans: o community consultation related to the improvement of AMPs, RPTPs
and speed management plans o associated demand forecasting and demand management planning o development of levels of service targets and implementation plans o asset performance and service gap analysis o optimisation process development, including development of network
operating plans o financial forecasts o development and improvement of asset deterioration models
Recommended Programme
No alternative options have been considered at this time. The recommended programme is small in comparison to others, but is important to effective planning for the network. It allows for the 3-yearly cycle of planning, with more emphasis in the years preceding development of Long Term Plans and submission of the Programme Business Case to NZTA. It has not been appropriately funded in earlier years. Table 7.92 Activity Management Planning Short Term Forecast ($000) - Not inflated
WC Code
WC Description Current 2020/21
Yr. 1 2021/22
Yr. 2 2022/23
Yr. 3 2023/24
Total 2021-24
Total 2018-21
003 AM Planning $15.0 $30.0 $85.0 $65.0 $180.0 $15.0
Table 7.93 Activity Management Planning 10 Year Forecast ($000) - Not inflated
WC Code
21/22 22/23 23/24 24/25 25/26 26/27 27/28 28/29 29/30 30/31
003 $30.0 $85.0 $65.0 $30.0 $85.0 $65.0 $30.0 $85.0 $65.0 $30.0
7.17.2 Programme Business Case Development
Table 7.94 Programme Business Case Development NZTA Work Category
Key activity Description
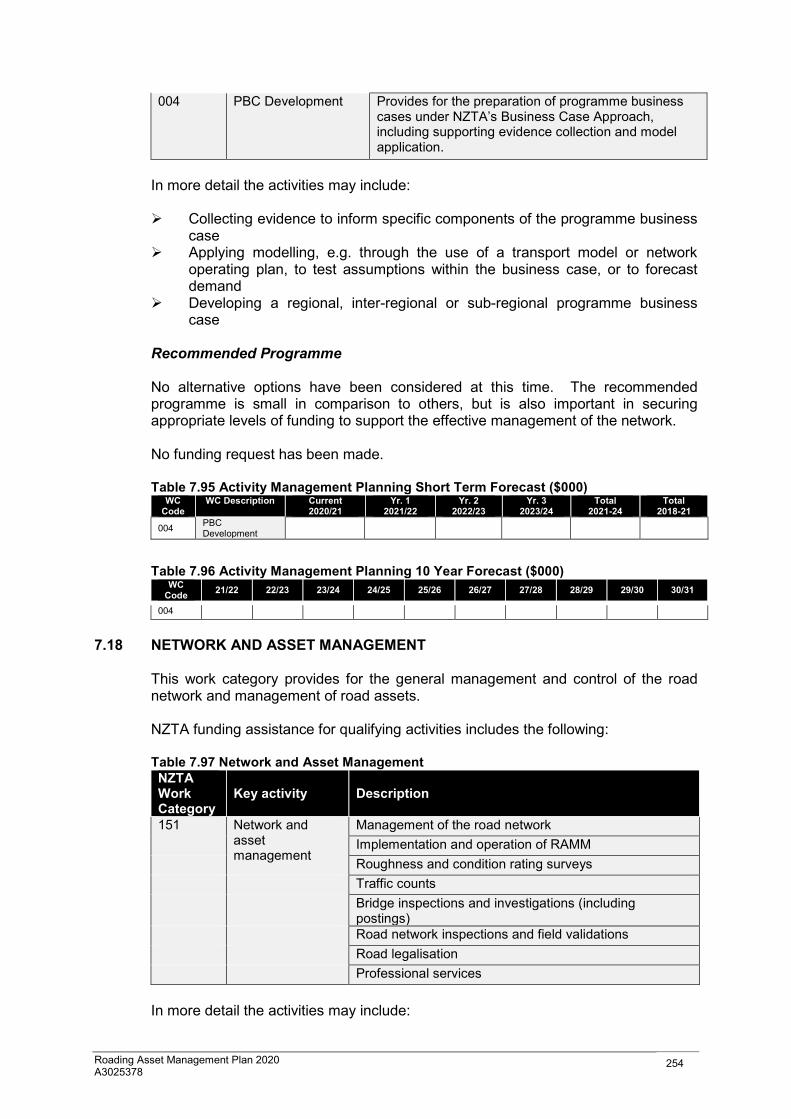
Roading Asset Management Plan 2020 A3025378
254
004 PBC Development Provides for the preparation of programme business cases under NZTA’s Business Case Approach, including supporting evidence collection and model application.
In more detail the activities may include: Collecting evidence to inform specific components of the programme business
case Applying modelling, e.g. through the use of a transport model or network
operating plan, to test assumptions within the business case, or to forecast demand
Developing a regional, inter-regional or sub-regional programme business case
Recommended Programme
No alternative options have been considered at this time. The recommended programme is small in comparison to others, but is also important in securing appropriate levels of funding to support the effective management of the network. No funding request has been made. Table 7.95 Activity Management Planning Short Term Forecast ($000)
WC Code
WC Description Current 2020/21
Yr. 1 2021/22
Yr. 2 2022/23
Yr. 3 2023/24
Total 2021-24
Total 2018-21
004 PBC Development
Table 7.96 Activity Management Planning 10 Year Forecast ($000) WC
Code 21/22 22/23 23/24 24/25 25/26 26/27 27/28 28/29 29/30 30/31
004
7.18 NETWORK AND ASSET MANAGEMENT
This work category provides for the general management and control of the road network and management of road assets. NZTA funding assistance for qualifying activities includes the following: Table 7.97 Network and Asset Management NZTA Work Category
Key activity Description
151 Network and asset management
Management of the road network Implementation and operation of RAMM
Roughness and condition rating surveys Traffic counts Bridge inspections and investigations (including
postings) Road network inspections and field validations Road legalisation Professional services
In more detail the activities may include:
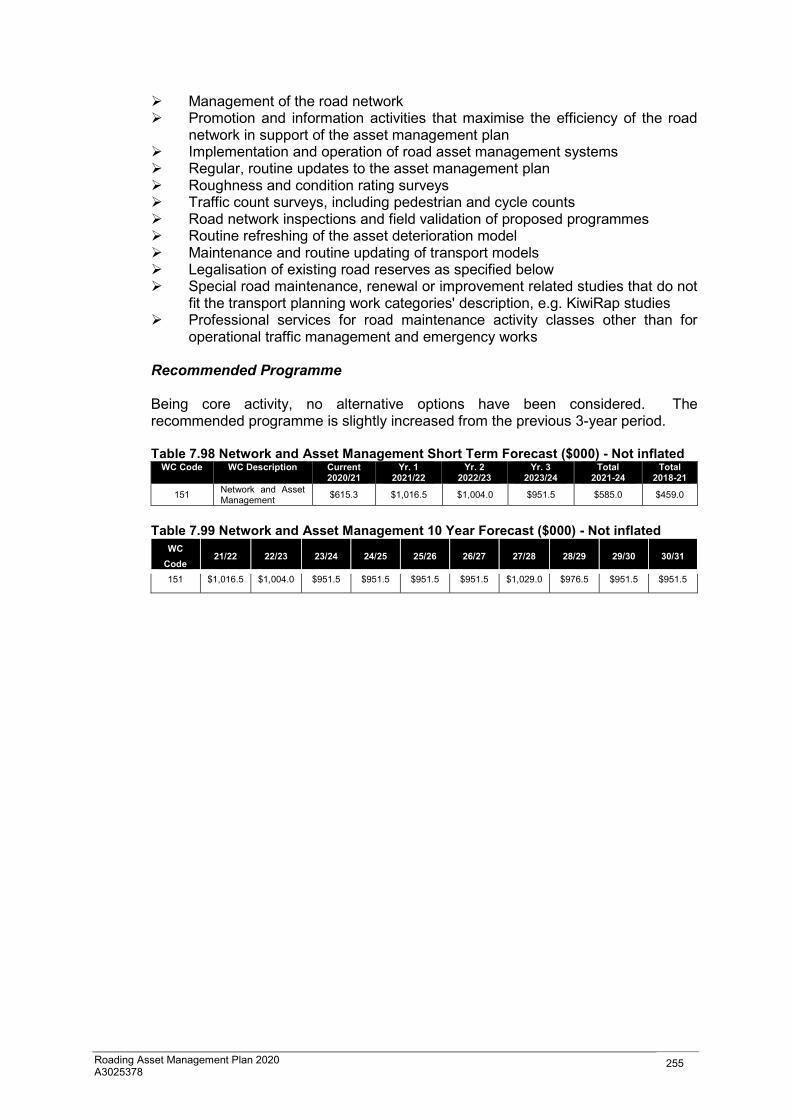
Roading Asset Management Plan 2020 A3025378
255
Management of the road network Promotion and information activities that maximise the efficiency of the road
network in support of the asset management plan Implementation and operation of road asset management systems Regular, routine updates to the asset management plan Roughness and condition rating surveys Traffic count surveys, including pedestrian and cycle counts Road network inspections and field validation of proposed programmes Routine refreshing of the asset deterioration model Maintenance and routine updating of transport models Legalisation of existing road reserves as specified below Special road maintenance, renewal or improvement related studies that do not
fit the transport planning work categories' description, e.g. KiwiRap studies Professional services for road maintenance activity classes other than for
operational traffic management and emergency works
Recommended Programme Being core activity, no alternative options have been considered. The recommended programme is slightly increased from the previous 3-year period. Table 7.98 Network and Asset Management Short Term Forecast ($000) - Not inflated
WC Code WC Description Current 2020/21
Yr. 1 2021/22
Yr. 2 2022/23
Yr. 3 2023/24
Total 2021-24
Total 2018-21
151 Network and Asset Management $615.3 $1,016.5 $1,004.0 $951.5 $585.0 $459.0
Table 7.99 Network and Asset Management 10 Year Forecast ($000) - Not inflated
WC Code
21/22 22/23 23/24 24/25 25/26 26/27 27/28 28/29 29/30 30/31
151 $1,016.5 $1,004.0 $951.5 $951.5 $951.5 $951.5 $1,029.0 $976.5 $951.5 $951.5
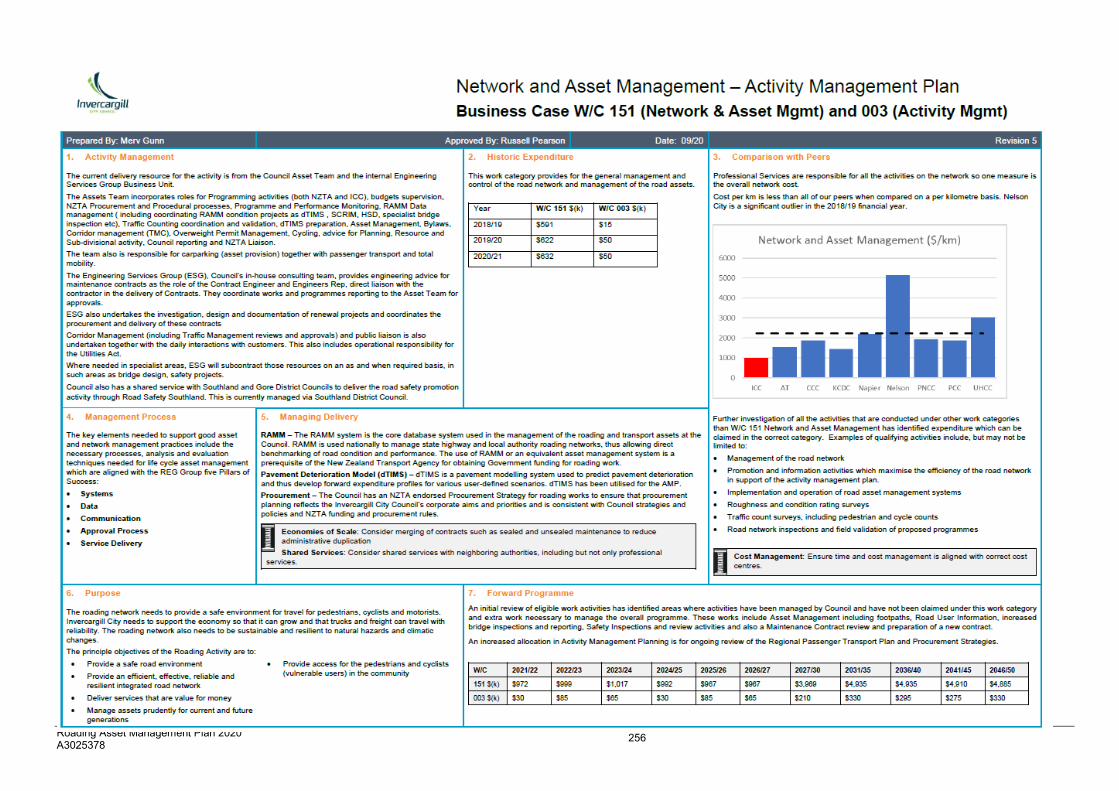
Roading Asset Management Plan 2020 A3025378 256
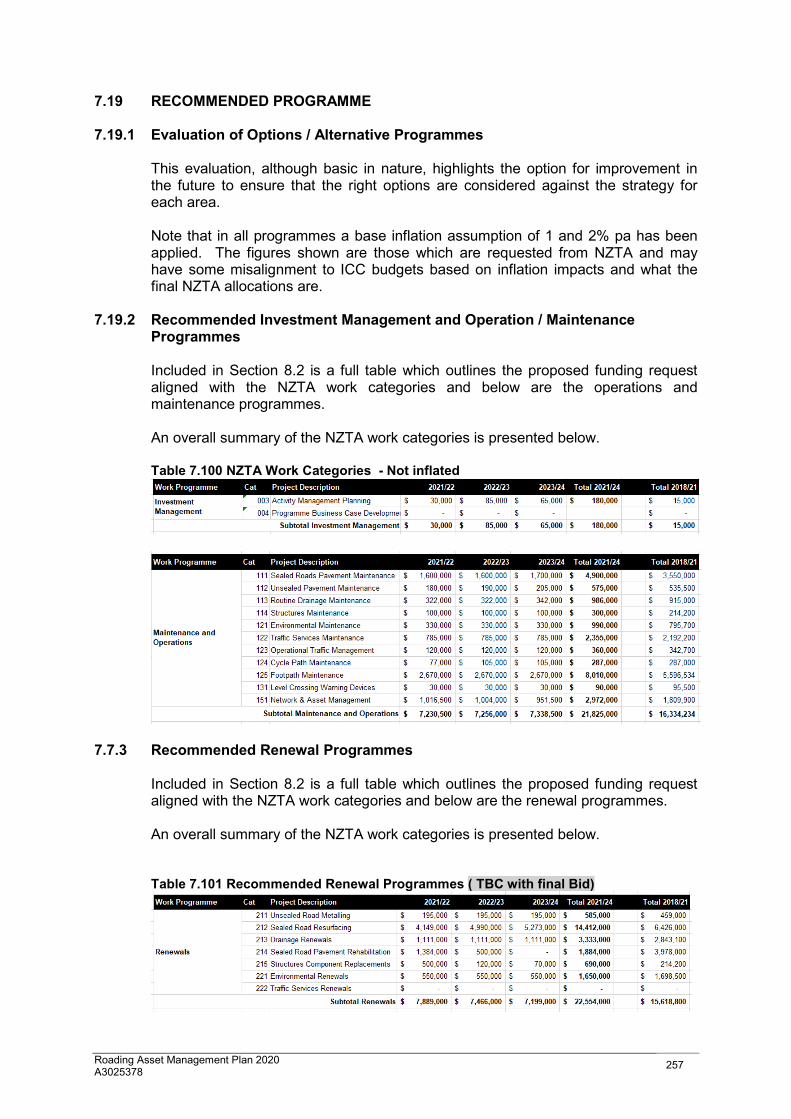
Roading Asset Management Plan 2020 A3025378 257
7.19 RECOMMENDED PROGRAMME 7.19.1 Evaluation of Options / Alternative Programmes
This evaluation, although basic in nature, highlights the option for improvement in the future to ensure that the right options are considered against the strategy for each area. Note that in all programmes a base inflation assumption of 1 and 2% pa has been applied. The figures shown are those which are requested from NZTA and may have some misalignment to ICC budgets based on inflation impacts and what the final NZTA allocations are.
7.19.2 Recommended Investment Management and Operation / Maintenance
Programmes Included in Section 8.2 is a full table which outlines the proposed funding request aligned with the NZTA work categories and below are the operations and maintenance programmes. An overall summary of the NZTA work categories is presented below. Table 7.100 NZTA Work Categories - Not inflated
7.7.3 Recommended Renewal Programmes
Included in Section 8.2 is a full table which outlines the proposed funding request aligned with the NZTA work categories and below are the renewal programmes. An overall summary of the NZTA work categories is presented below. Table 7.101 Recommended Renewal Programmes ( TBC with final Bid)
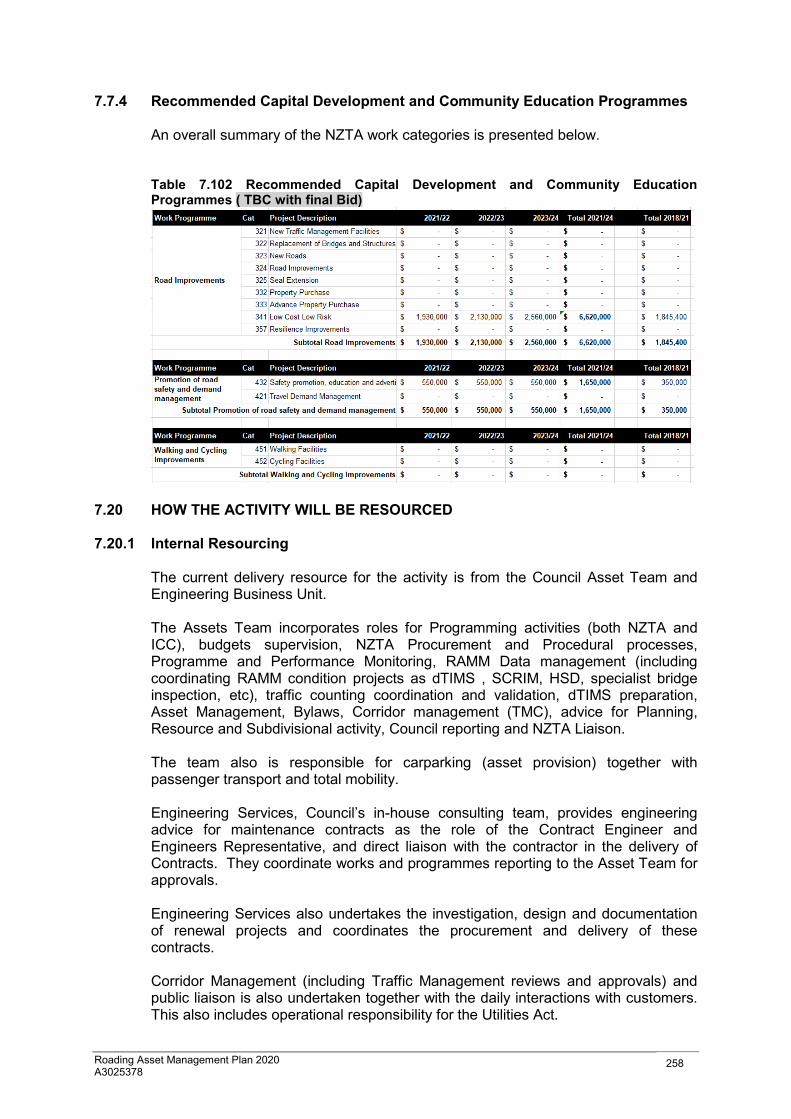
Roading Asset Management Plan 2020 A3025378
258
7.7.4 Recommended Capital Development and Community Education Programmes An overall summary of the NZTA work categories is presented below. Table 7.102 Recommended Capital Development and Community Education Programmes ( TBC with final Bid)
7.20 HOW THE ACTIVITY WILL BE RESOURCED 7.20.1 Internal Resourcing
The current delivery resource for the activity is from the Council Asset Team and Engineering Business Unit. The Assets Team incorporates roles for Programming activities (both NZTA and ICC), budgets supervision, NZTA Procurement and Procedural processes, Programme and Performance Monitoring, RAMM Data management (including coordinating RAMM condition projects as dTIMS , SCRIM, HSD, specialist bridge inspection, etc), traffic counting coordination and validation, dTIMS preparation, Asset Management, Bylaws, Corridor management (TMC), advice for Planning, Resource and Subdivisional activity, Council reporting and NZTA Liaison. The team also is responsible for carparking (asset provision) together with passenger transport and total mobility. Engineering Services, Council’s in-house consulting team, provides engineering advice for maintenance contracts as the role of the Contract Engineer and Engineers Representative, and direct liaison with the contractor in the delivery of Contracts. They coordinate works and programmes reporting to the Asset Team for approvals. Engineering Services also undertakes the investigation, design and documentation of renewal projects and coordinates the procurement and delivery of these contracts. Corridor Management (including Traffic Management reviews and approvals) and public liaison is also undertaken together with the daily interactions with customers. This also includes operational responsibility for the Utilities Act.
Roading Asset Management Plan 2020 A3025378
259
Where needed in specialist areas, Engineering Services will subcontract those resources on an as and when required basis in such areas as bridge design and safety projects. Council also has a shared service with Southland and Gore District Councils to deliver the road safety promotion activity through Road Safety Southland. This is currently managed via Southland District Council.
7.20.2 Procurement Strategy Council has an approved Procurement Strategy which is attached in Appendix 13.30. Council procures its physical works contracts via the open tender market. The maintenance contracts are: Road Corridor Maintenance (which includes all sealed pavements, pavement,
signs, kerb and channel, drainage, road marking, footpaths, bus shelters and carparks, etc)
Unsealed Corridor Maintenance Streetlight Maintenance Traffic Signals Maintenance Renewals contracts are typically offered on an annual basis for: Resurfacing – Chipsealing and Asphaltic Concrete Individual or group Rehabilitation Projects Low Cost Low Risk Projects (or via the maintenance contract) Specific Street lighting or Traffic Signal Projects
Council wishes to obtain products and services in an open, fair and transparent manner. The Objectives are: Council must be sure it is receiving “Best Value for Money”. Council will package the delivery of the roading programmes such that a
suitable and sustainable environment occurs, and contracts are offered ensuring competitive, responsive and efficient bids are received.
Council will procure services considering cost, quality and risk whilst meeting legislative requirements (using approved delivery models outlined in the New Zealand Transport Agency Procurement Manual) approved for a staged delivery model.
Professional services will be undertaken utilising in-house skills wherever appropriate.
Procurement must be consistent and fair where suppliers wish to engage with Council to provide their services or goods.
Council will procure services to maintain markets (where appropriate) so that the services it requires are readily available, both now and in the future, and are provided at a sustainable and fair value.
Council will endeavour to ensure providers are willingly engaged in a competitive process and work to establishing adequately available resources.
Processes will follow systems which are easy to document, robust and able to be reviewed whilst not placing unfair or excessive demands on suppliers.
The delivery model appropriate for the Invercargill City Council is the staged model.
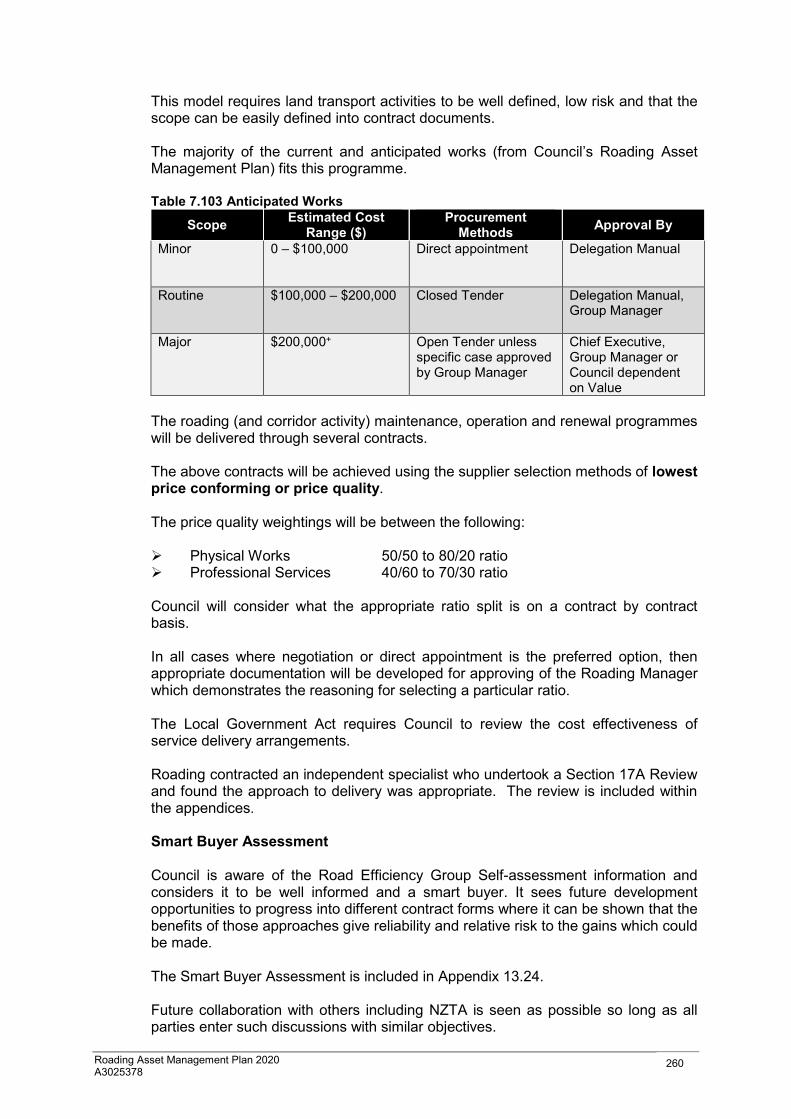
Roading Asset Management Plan 2020 A3025378
260
This model requires land transport activities to be well defined, low risk and that the scope can be easily defined into contract documents. The majority of the current and anticipated works (from Council’s Roading Asset Management Plan) fits this programme. Table 7.103 Anticipated Works
Scope Estimated Cost Range ($)
Procurement Methods Approval By
Minor 0 – $100,000 Direct appointment Delegation Manual
Routine $100,000 – $200,000 Closed Tender Delegation Manual, Group Manager
Major $200,000+ Open Tender unless specific case approved by Group Manager
Chief Executive, Group Manager or Council dependent on Value
The roading (and corridor activity) maintenance, operation and renewal programmes will be delivered through several contracts. The above contracts will be achieved using the supplier selection methods of lowest price conforming or price quality. The price quality weightings will be between the following: Physical Works 50/50 to 80/20 ratio Professional Services 40/60 to 70/30 ratio Council will consider what the appropriate ratio split is on a contract by contract basis. In all cases where negotiation or direct appointment is the preferred option, then appropriate documentation will be developed for approving of the Roading Manager which demonstrates the reasoning for selecting a particular ratio. The Local Government Act requires Council to review the cost effectiveness of service delivery arrangements. Roading contracted an independent specialist who undertook a Section 17A Review and found the approach to delivery was appropriate. The review is included within the appendices. Smart Buyer Assessment Council is aware of the Road Efficiency Group Self-assessment information and considers it to be well informed and a smart buyer. It sees future development opportunities to progress into different contract forms where it can be shown that the benefits of those approaches give reliability and relative risk to the gains which could be made. The Smart Buyer Assessment is included in Appendix 13.24. Future collaboration with others including NZTA is seen as possible so long as all parties enter such discussions with similar objectives.
Roading Asset Management Plan 2020 A3025378 261
8. Financial Management 8.1. OVERVIEW
The Local Government Act 2002 requires local authorities to manage their finances “prudently and in a manner that promotes the current and future interests of the community”. This implies compliance with Generally Accepted Accounting Practice (GAAP). Of particular relevance is Financial Reporting International Accounting Standard (PBE IPSAS17) New Zealand equivalent to “Accounting for Property, Plant and Equipment”. In determining how activities will be funded, local authorities are required to take the following into consideration: The contribution to the achievement of Community Outcomes (strategic
alignment) Beneficiaries of each activity (beneficiary / user pays principles) The period over which benefits from the activity will occur (intergenerational
equity issues) The costs and benefits of funding the activity compared to other activities (cost
/ benefit, prioritisation principles) The impact of funding the activity on the wellbeing of the community (ability to
pay principles) Asset Management Plans provide the basis for meeting these requirements for infrastructure based activities.
8.2 FINANCIAL SUMMARY – WHAT THE ACTIVITY COSTS
The following section outlines the budgeted cost, however since NZTA co-invests to a significant level in Roading, these costs are also separated out for some clarity. Council is developing a new financial system and reshaping cost centres to align to this new technology which will give better alignment with the Council and NZTA budgeting areas. Details of individual cost centre level activity are available but not included in the Plan. Appended are budgets for activities at the normal management and reporting levels. Budgets shown include the impacts of inflation over the period of the plan.
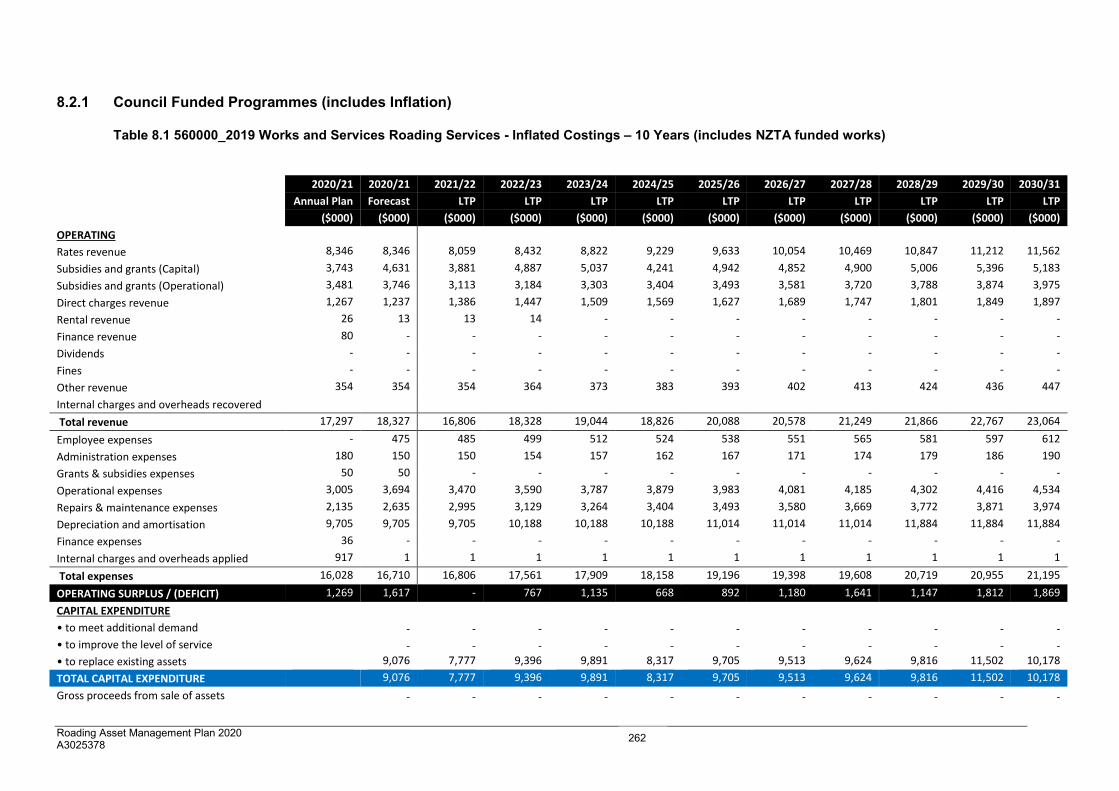
Roading Asset Management Plan 2020 A3025378 262
8.2.1 Council Funded Programmes (includes Inflation)
Table 8.1 560000_2019 Works and Services Roading Services - Inflated Costings – 10 Years (includes NZTA funded works)
2020/21 2020/21 2021/22 2022/23 2023/24 2024/25 2025/26 2026/27 2027/28 2028/29 2029/30 2030/31
Annual Plan Forecast LTP LTP LTP LTP LTP LTP LTP LTP LTP LTP
($000) ($000) ($000) ($000) ($000) ($000) ($000) ($000) ($000) ($000) ($000) ($000) OPERATING Rates revenue 8,346 8,346 8,059 8,432 8,822 9,229 9,633 10,054 10,469 10,847 11,212 11,562 Subsidies and grants (Capital) 3,743 4,631 3,881 4,887 5,037 4,241 4,942 4,852 4,900 5,006 5,396 5,183 Subsidies and grants (Operational) 3,481 3,746 3,113 3,184 3,303 3,404 3,493 3,581 3,720 3,788 3,874 3,975 Direct charges revenue 1,267 1,237 1,386 1,447 1,509 1,569 1,627 1,689 1,747 1,801 1,849 1,897 Rental revenue 26 13 13 14 ‐ ‐ ‐ ‐ ‐ ‐ ‐ ‐ Finance revenue 80 ‐ ‐ ‐ ‐ ‐ ‐ ‐ ‐ ‐ ‐ ‐ Dividends ‐ ‐ ‐ ‐ ‐ ‐ ‐ ‐ ‐ ‐ ‐ ‐ Fines ‐ ‐ ‐ ‐ ‐ ‐ ‐ ‐ ‐ ‐ ‐ ‐ Other revenue 354 354 354 364 373 383 393 402 413 424 436 447 Internal charges and overheads recovered Total revenue 17,297 18,327 16,806 18,328 19,044 18,826 20,088 20,578 21,249 21,866 22,767 23,064 Employee expenses ‐ 475 485 499 512 524 538 551 565 581 597 612 Administration expenses 180 150 150 154 157 162 167 171 174 179 186 190 Grants & subsidies expenses 50 50 ‐ ‐ ‐ ‐ ‐ ‐ ‐ ‐ ‐ ‐ Operational expenses 3,005 3,694 3,470 3,590 3,787 3,879 3,983 4,081 4,185 4,302 4,416 4,534 Repairs & maintenance expenses 2,135 2,635 2,995 3,129 3,264 3,404 3,493 3,580 3,669 3,772 3,871 3,974 Depreciation and amortisation 9,705 9,705 9,705 10,188 10,188 10,188 11,014 11,014 11,014 11,884 11,884 11,884 Finance expenses 36 ‐ ‐ ‐ ‐ ‐ ‐ ‐ ‐ ‐ ‐ ‐ Internal charges and overheads applied 917 1 1 1 1 1 1 1 1 1 1 1 Total expenses 16,028 16,710 16,806 17,561 17,909 18,158 19,196 19,398 19,608 20,719 20,955 21,195 OPERATING SURPLUS / (DEFICIT) 1,269 1,617 ‐ 767 1,135 668 892 1,180 1,641 1,147 1,812 1,869 CAPITAL EXPENDITURE • to meet additional demand ‐ ‐ ‐ ‐ ‐ ‐ ‐ ‐ ‐ ‐ ‐ • to improve the level of service ‐ ‐ ‐ ‐ ‐ ‐ ‐ ‐ ‐ ‐ ‐ • to replace existing assets 9,076 7,777 9,396 9,891 8,317 9,705 9,513 9,624 9,816 11,502 10,178 TOTAL CAPITAL EXPENDITURE 9,076 7,777 9,396 9,891 8,317 9,705 9,513 9,624 9,816 11,502 10,178 Gross proceeds from sale of assets ‐ ‐ ‐ ‐ ‐ ‐ ‐ ‐ ‐ ‐ ‐
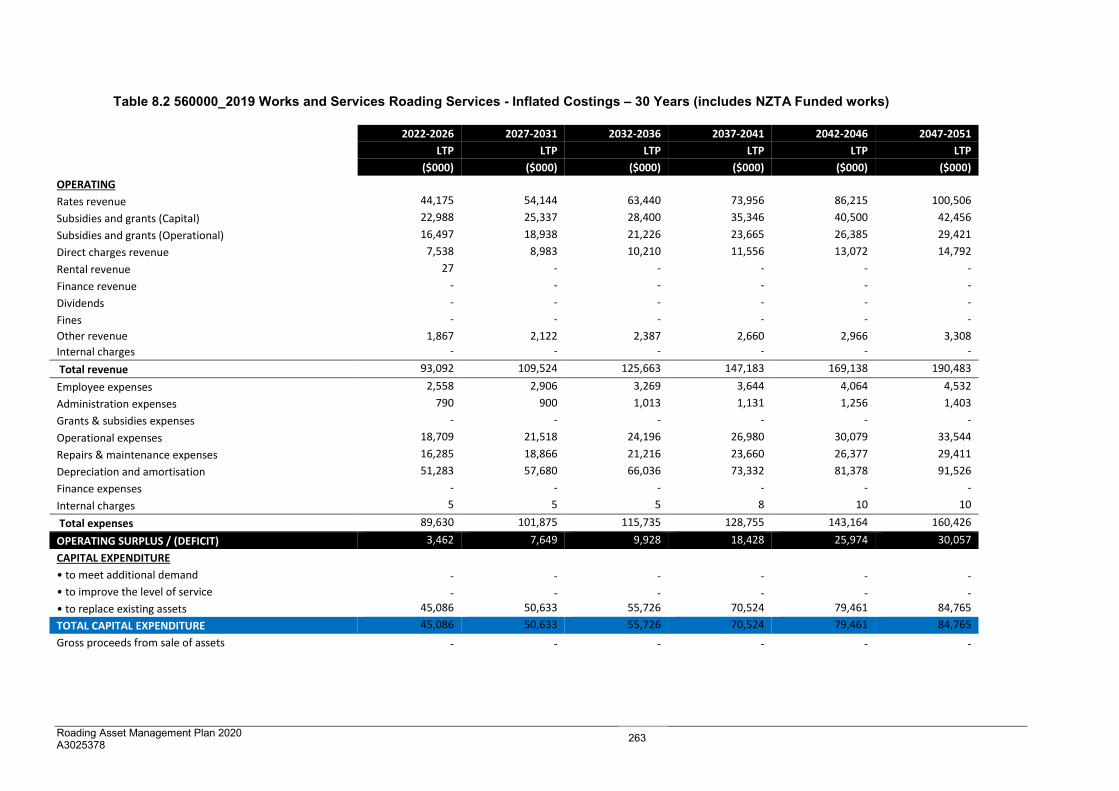
Roading Asset Management Plan 2020 A3025378 263
Table 8.2 560000_2019 Works and Services Roading Services - Inflated Costings – 30 Years (includes NZTA Funded works)
2022-2026 2027-2031 2032-2036 2037-2041 2042-2046 2047-2051
LTP LTP LTP LTP LTP LTP
($000) ($000) ($000) ($000) ($000) ($000) OPERATING Rates revenue 44,175 54,144 63,440 73,956 86,215 100,506 Subsidies and grants (Capital) 22,988 25,337 28,400 35,346 40,500 42,456 Subsidies and grants (Operational) 16,497 18,938 21,226 23,665 26,385 29,421 Direct charges revenue 7,538 8,983 10,210 11,556 13,072 14,792 Rental revenue 27 ‐ ‐ ‐ ‐ ‐ Finance revenue ‐ ‐ ‐ ‐ ‐ ‐ Dividends ‐ ‐ ‐ ‐ ‐ ‐ Fines ‐ ‐ ‐ ‐ ‐ ‐ Other revenue 1,867 2,122 2,387 2,660 2,966 3,308 Internal charges ‐ ‐ ‐ ‐ ‐ ‐ Total revenue 93,092 109,524 125,663 147,183 169,138 190,483 Employee expenses 2,558 2,906 3,269 3,644 4,064 4,532 Administration expenses 790 900 1,013 1,131 1,256 1,403 Grants & subsidies expenses ‐ ‐ ‐ ‐ ‐ ‐ Operational expenses 18,709 21,518 24,196 26,980 30,079 33,544 Repairs & maintenance expenses 16,285 18,866 21,216 23,660 26,377 29,411 Depreciation and amortisation 51,283 57,680 66,036 73,332 81,378 91,526 Finance expenses ‐ ‐ ‐ ‐ ‐ ‐ Internal charges 5 5 5 8 10 10 Total expenses 89,630 101,875 115,735 128,755 143,164 160,426 OPERATING SURPLUS / (DEFICIT) 3,462 7,649 9,928 18,428 25,974 30,057 CAPITAL EXPENDITURE • to meet additional demand ‐ ‐ ‐ ‐ ‐ ‐ • to improve the level of service ‐ ‐ ‐ ‐ ‐ ‐ • to replace existing assets 45,086 50,633 55,726 70,524 79,461 84,765 TOTAL CAPITAL EXPENDITURE 45,086 50,633 55,726 70,524 79,461 84,765 Gross proceeds from sale of assets ‐ ‐ ‐ ‐ ‐ ‐
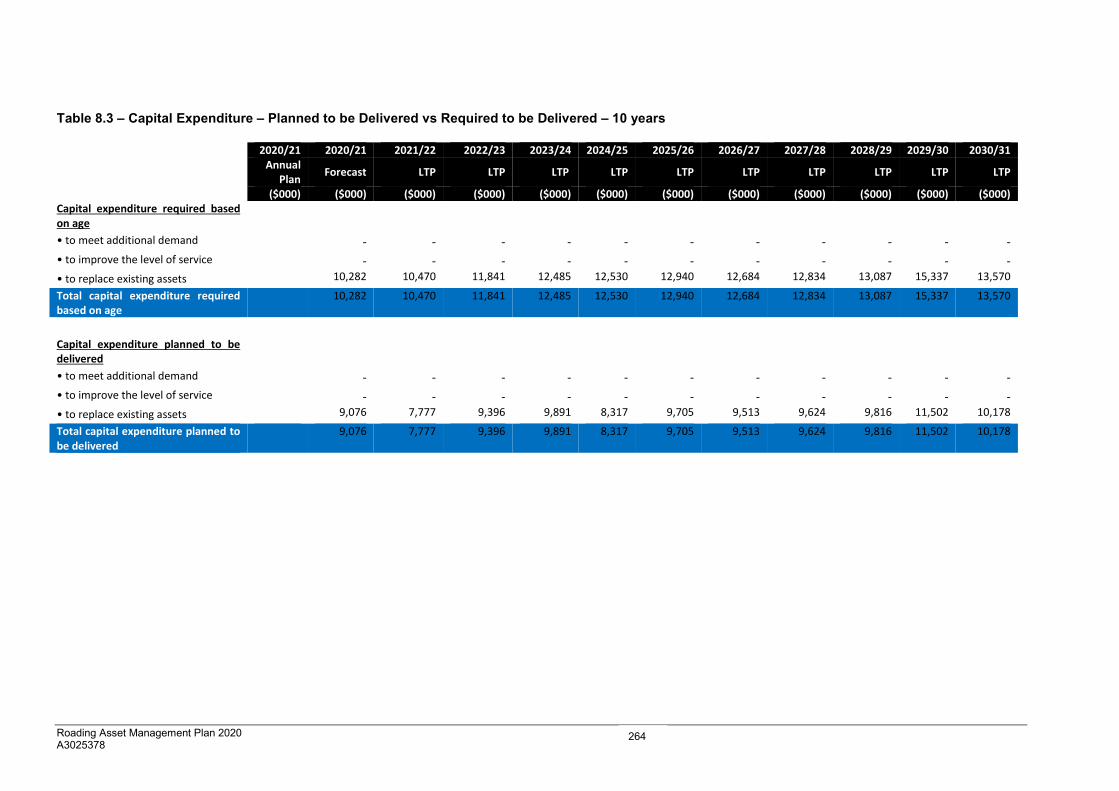
Roading Asset Management Plan 2020 A3025378
264
Table 8.3 – Capital Expenditure – Planned to be Delivered vs Required to be Delivered – 10 years 2020/21 2020/21 2021/22 2022/23 2023/24 2024/25 2025/26 2026/27 2027/28 2028/29 2029/30 2030/31
Annual
Plan Forecast LTP LTP LTP LTP LTP LTP LTP LTP LTP LTP
($000) ($000) ($000) ($000) ($000) ($000) ($000) ($000) ($000) ($000) ($000) ($000) Capital expenditure required based on age • to meet additional demand ‐ ‐ ‐ ‐ ‐ ‐ ‐ ‐ ‐ ‐ ‐ • to improve the level of service ‐ ‐ ‐ ‐ ‐ ‐ ‐ ‐ ‐ ‐ ‐ • to replace existing assets 10,282 10,470 11,841 12,485 12,530 12,940 12,684 12,834 13,087 15,337 13,570
Total capital expenditure required based on age
10,282 10,470 11,841 12,485 12,530 12,940 12,684 12,834 13,087 15,337 13,570
Capital expenditure planned to be delivered • to meet additional demand ‐ ‐ ‐ ‐ ‐ ‐ ‐ ‐ ‐ ‐ ‐ • to improve the level of service ‐ ‐ ‐ ‐ ‐ ‐ ‐ ‐ ‐ ‐ ‐ • to replace existing assets 9,076 7,777 9,396 9,891 8,317 9,705 9,513 9,624 9,816 11,502 10,178
Total capital expenditure planned to be delivered
9,076 7,777 9,396 9,891 8,317 9,705 9,513 9,624 9,816 11,502 10,178
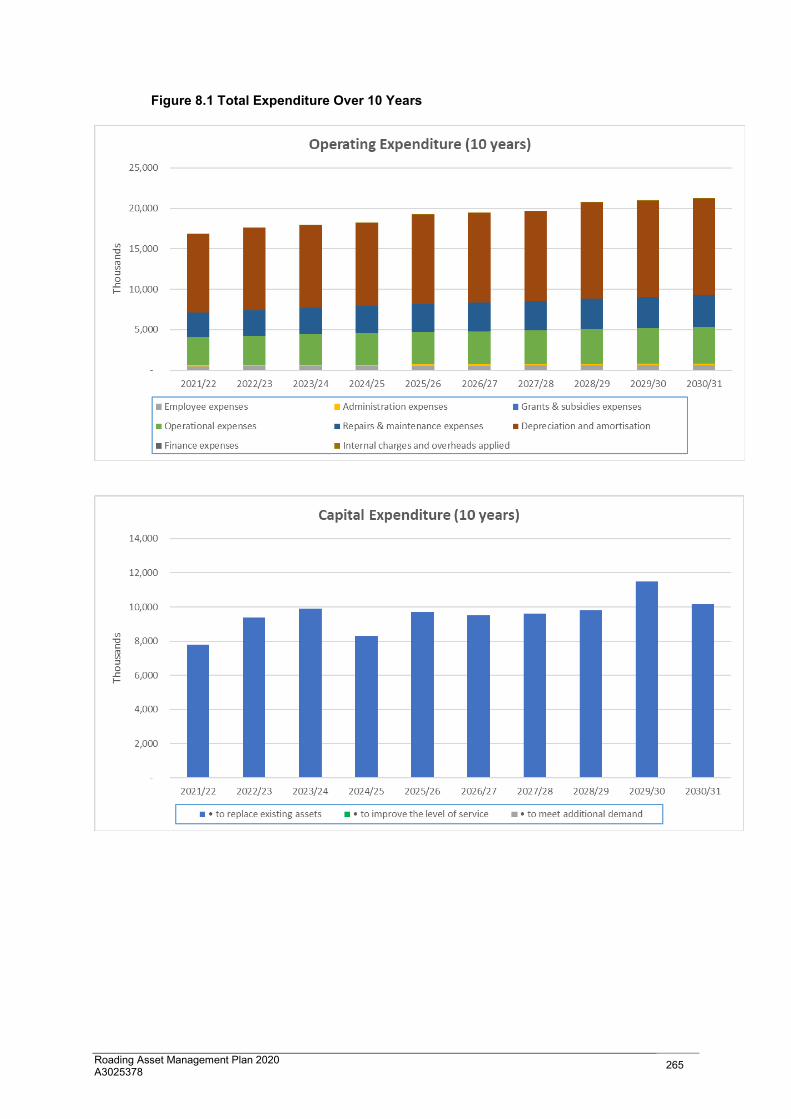
Roading Asset Management Plan 2020 A3025378 265
Figure 8.1 Total Expenditure Over 10 Years
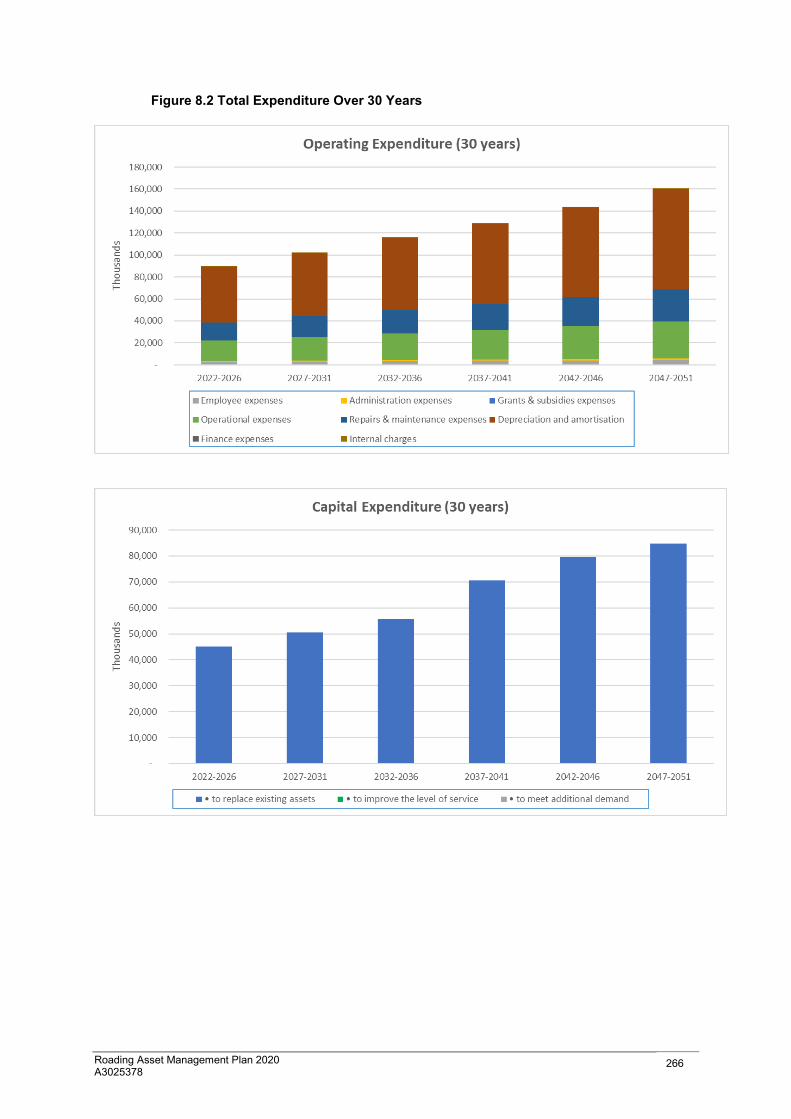
Roading Asset Management Plan 2020 A3025378
266
Figure 8.2 Total Expenditure Over 30 Years
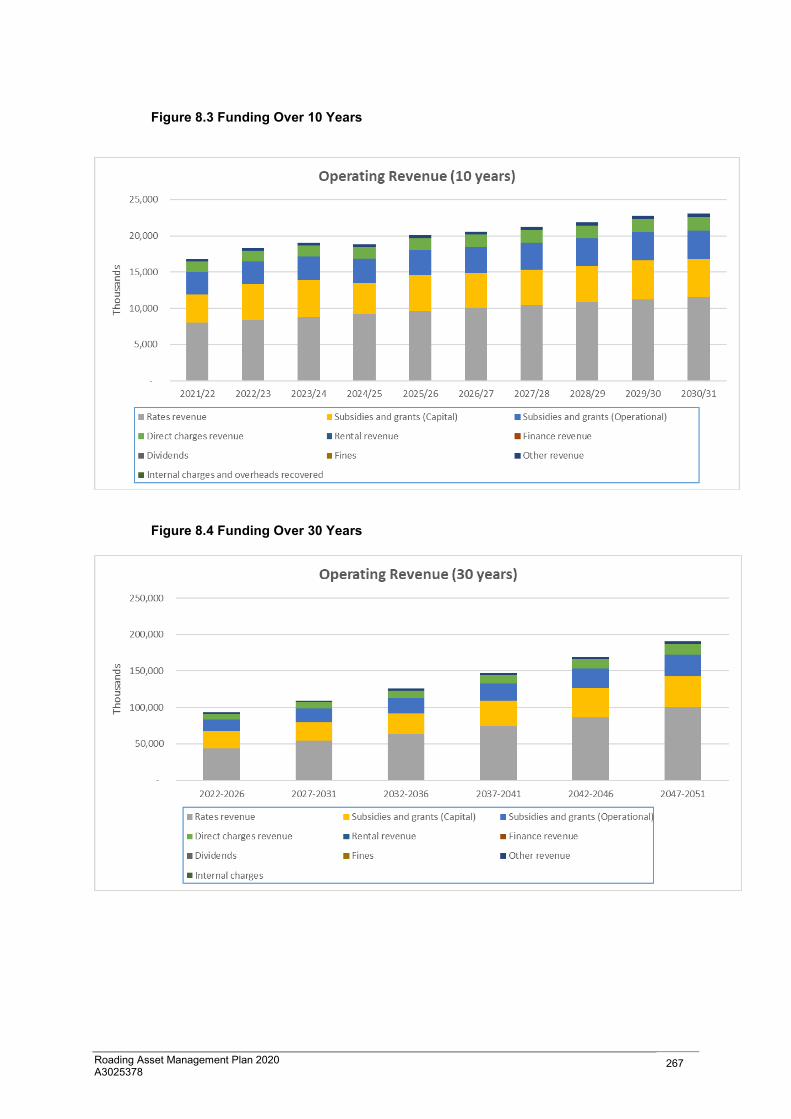
Roading Asset Management Plan 2020 A3025378
267
Figure 8.3 Funding Over 10 Years
Figure 8.4 Funding Over 30 Years
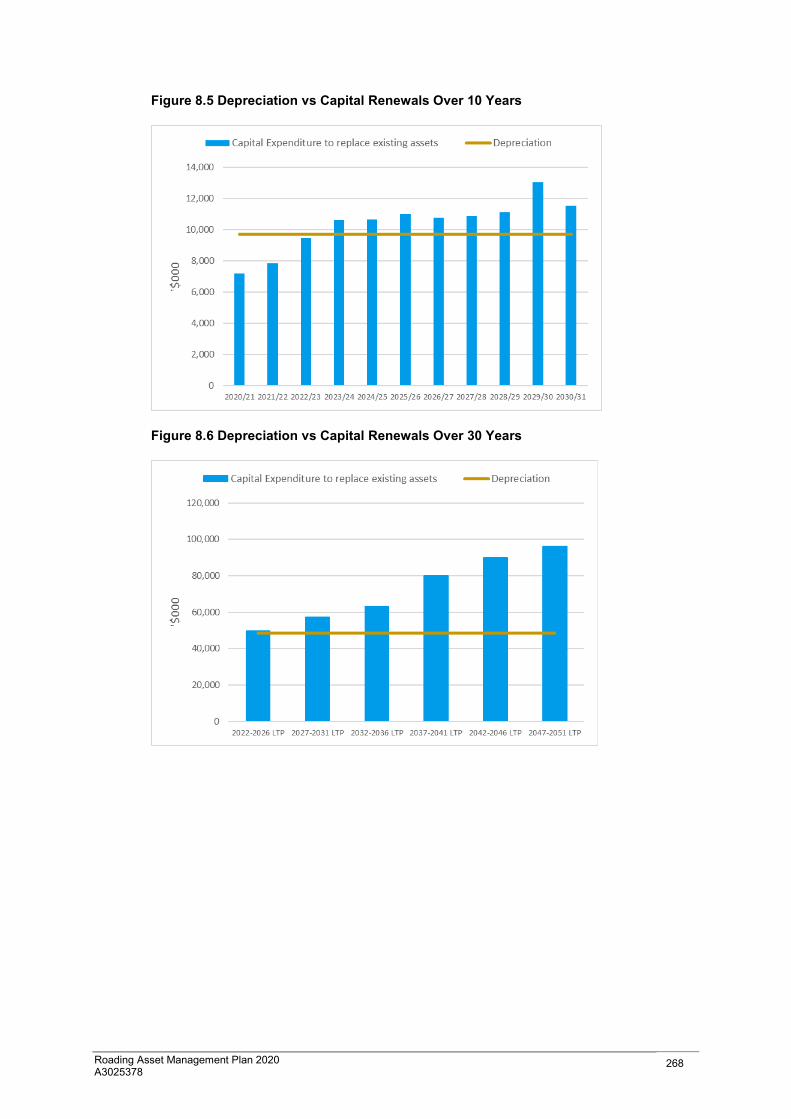
Roading Asset Management Plan 2020 A3025378
268
Figure 8.5 Depreciation vs Capital Renewals Over 10 Years
Figure 8.6 Depreciation vs Capital Renewals Over 30 Years
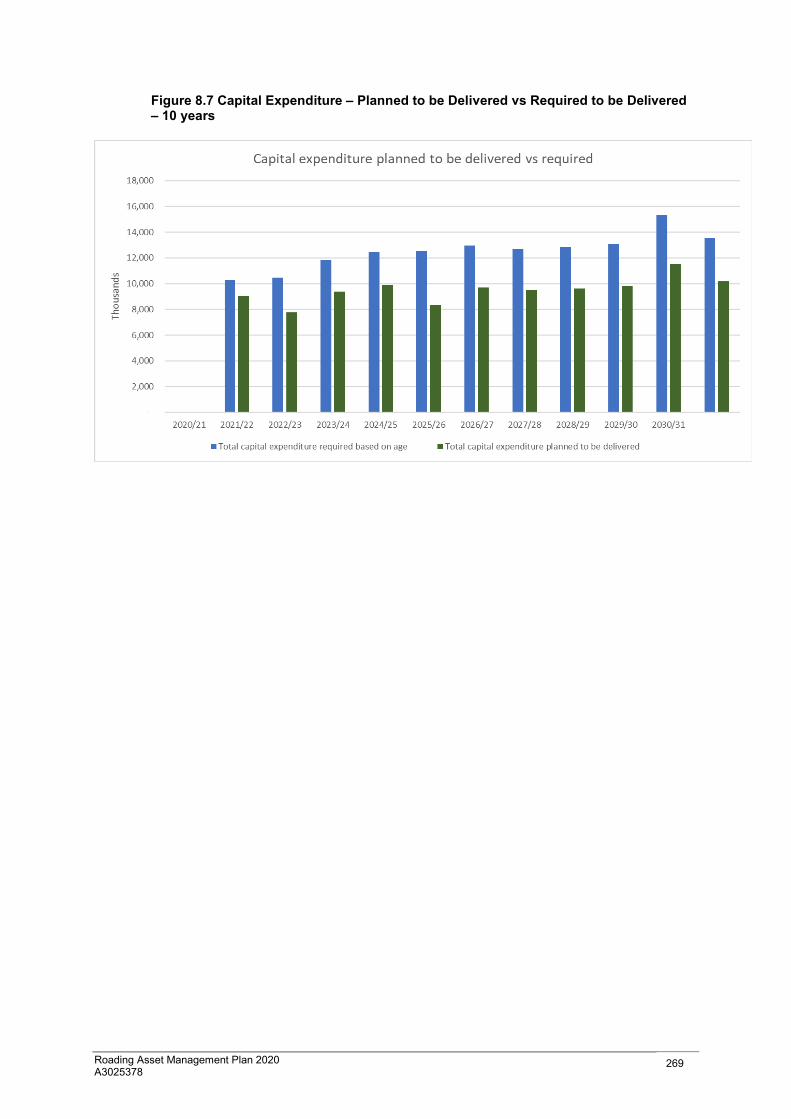
Roading Asset Management Plan 2020 A3025378
269
Figure 8.7 Capital Expenditure – Planned to be Delivered vs Required to be Delivered – 10 years
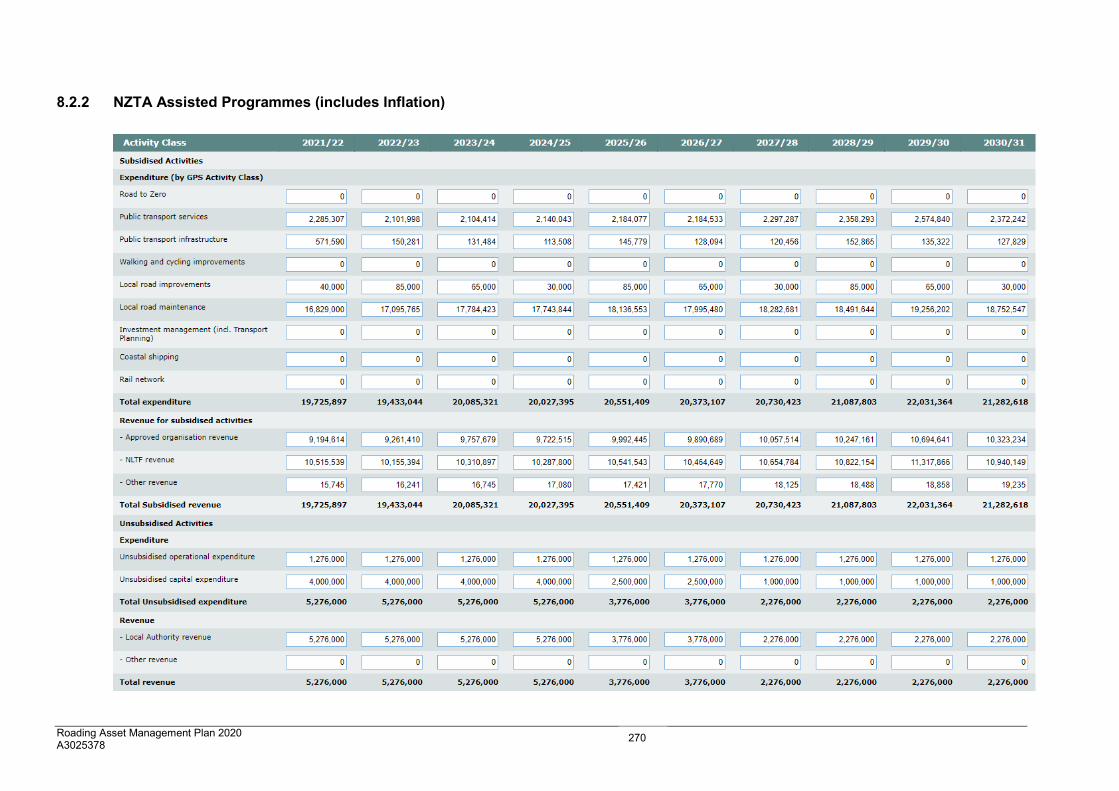
Roading Asset Management Plan 2020 A3025378 270
8.2.2 NZTA Assisted Programmes (includes Inflation)
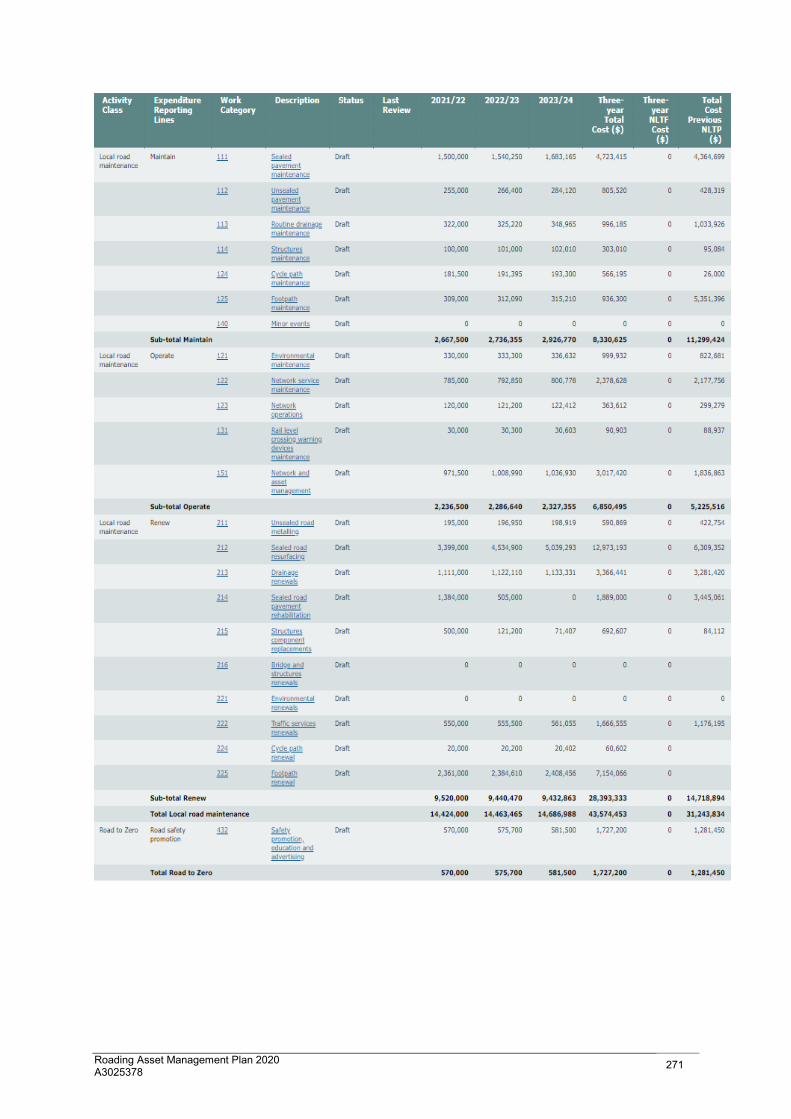
Roading Asset Management Plan 2020 A3025378 271
Roading Asset Management Plan 2020 A3025378 272
The above tables are drawn from the Council’s Accounting and Budgeting system and from Waka Kotahi _NZ TIO. The New Zealand Transport Agency requires councils to prepare budgets for submission for the Regional Land Transport Programme (RLTP) which is funded from the National Land Transport Programme (NLTP). NZTA co invests with Council at a Financial Assistance Rate (FAR). This rate will reduce during this plan from 53% to 51%. Each 1% presents around $90,000 additional Council funding to maintain the same level of activity. The following table sets out the funding included in Council budgets but arranged in terms of the funding work categories used by NZTA. Further descriptions of these categories can be found at https://www.nzta.govt.nz/roads-and-rail/road-efficiency-group/resources/ . The data is presented in a different manner but has the same core inputs. The values shown include inflation (approximately 1.0% annually for next three years then 2.0% for the balance of the works programme). NZTA approve investment in an agreed programme on a three yearly cycle. NZTA have a number of processes which are utilised to consider programmes which include frameworks for prioritising programmes such as the Investment Prioritisation Method for the 2021-24 which will replace the current Investment Assessment Framework (IAF). These can be found on the NZTA website.
8.2.3 Programme Implications
Council approved budgets in January 2021. 8.3 FINANCIAL POLICIES
Council must ensure that each years projected operating revenues are set at a level sufficient to meet the years projected operating expenses. The Revenue and Financing Policy states Council’s policy on the funding of its operating and capital expenditure and the sources of those funds. Council for each activity must give consideration to who benefits from the activity and the appropriate level of private versus public benefit when funding the activity. Public benefit is gained from having access to activities provided by Council. Private benefit is gained from receiving goods or services provided by Council, i.e. a building consent for work carried out by private residents.
8.4 HOW WE PAY FOR THE ACTIVITY
The following sources of funding have been used by Council: General Rate Fees and Charges Other sources of funding Loans and Reserves
Council will within the Financial Strategy define how Roading is paid for and the following table is that from 2018-21. Council is considering using general rates rather than targeted rates. This will be updated if the rating policy is changed.
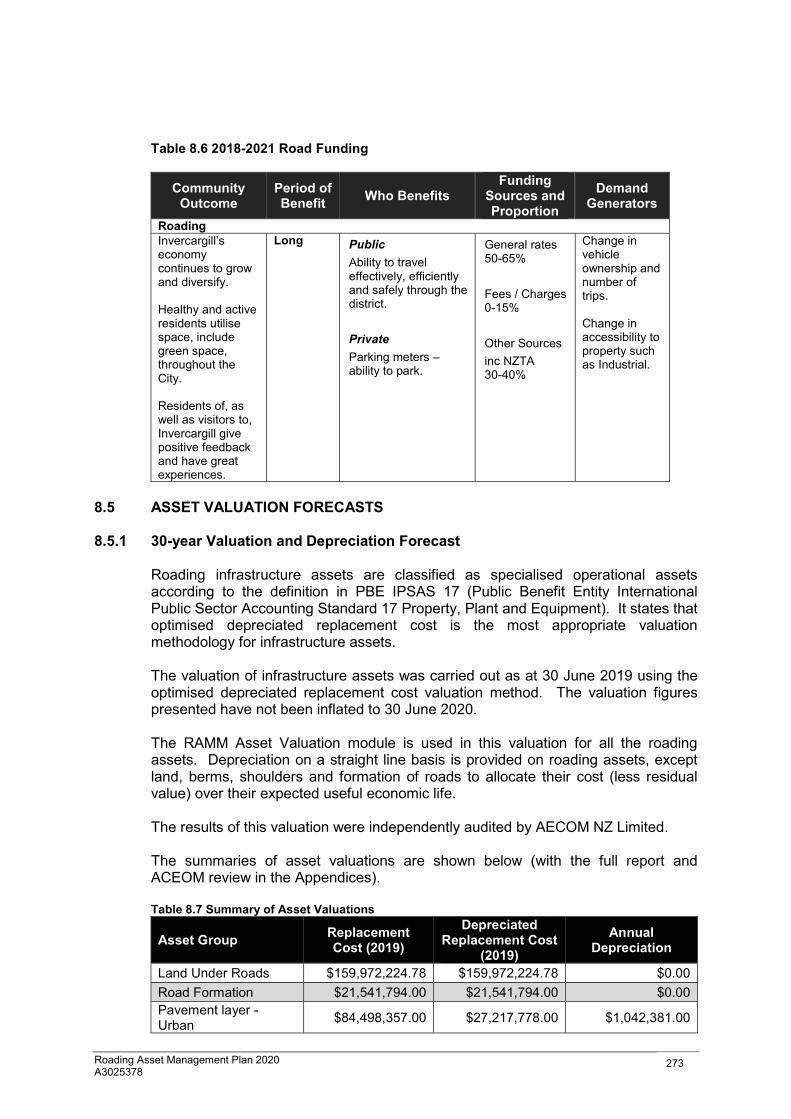
Roading Asset Management Plan 2020 A3025378
273
Table 8.6 2018-2021 Road Funding
Community Outcome
Period of Benefit Who Benefits
Funding Sources and Proportion
Demand Generators
Roading Invercargill’s economy continues to grow and diversify. Healthy and active residents utilise space, include green space, throughout the City. Residents of, as well as visitors to, Invercargill give positive feedback and have great experiences.
Long Public Ability to travel effectively, efficiently and safely through the district. Private Parking meters – ability to park.
General rates 50-65% Fees / Charges 0-15% Other Sources inc NZTA 30-40%
Change in vehicle ownership and number of trips. Change in accessibility to property such as Industrial.
8.5 ASSET VALUATION FORECASTS 8.5.1 30-year Valuation and Depreciation Forecast
Roading infrastructure assets are classified as specialised operational assets according to the definition in PBE IPSAS 17 (Public Benefit Entity International Public Sector Accounting Standard 17 Property, Plant and Equipment). It states that optimised depreciated replacement cost is the most appropriate valuation methodology for infrastructure assets. The valuation of infrastructure assets was carried out as at 30 June 2019 using the optimised depreciated replacement cost valuation method. The valuation figures presented have not been inflated to 30 June 2020. The RAMM Asset Valuation module is used in this valuation for all the roading assets. Depreciation on a straight line basis is provided on roading assets, except land, berms, shoulders and formation of roads to allocate their cost (less residual value) over their expected useful economic life. The results of this valuation were independently audited by AECOM NZ Limited. The summaries of asset valuations are shown below (with the full report and ACEOM review in the Appendices).
Table 8.7 Summary of Asset Valuations
Asset Group Replacement Cost (2019)
Depreciated Replacement Cost
(2019) Annual
Depreciation
Land Under Roads $159,972,224.78 $159,972,224.78 $0.00 Road Formation $21,541,794.00 $21,541,794.00 $0.00 Pavement layer - Urban $84,498,357.00 $27,217,778.00 $1,042,381.00
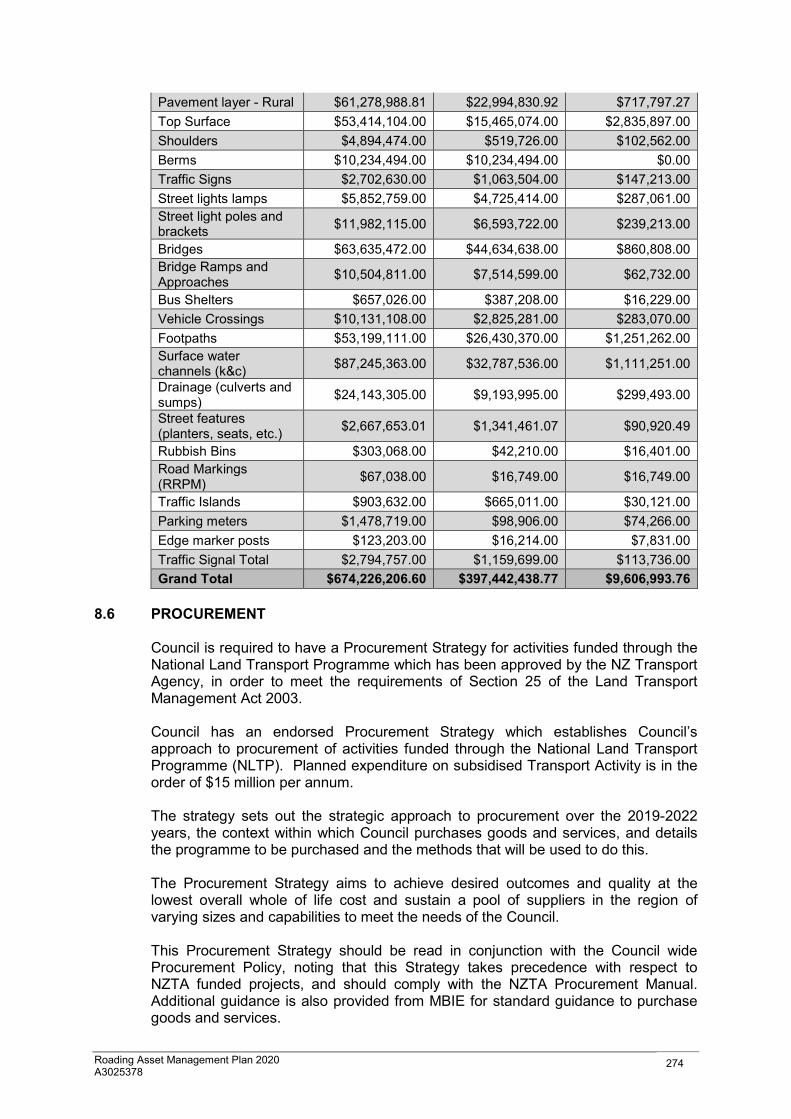
Roading Asset Management Plan 2020 A3025378
274
Pavement layer - Rural $61,278,988.81 $22,994,830.92 $717,797.27 Top Surface $53,414,104.00 $15,465,074.00 $2,835,897.00 Shoulders $4,894,474.00 $519,726.00 $102,562.00 Berms $10,234,494.00 $10,234,494.00 $0.00 Traffic Signs $2,702,630.00 $1,063,504.00 $147,213.00 Street lights lamps $5,852,759.00 $4,725,414.00 $287,061.00 Street light poles and brackets $11,982,115.00 $6,593,722.00 $239,213.00
Bridges $63,635,472.00 $44,634,638.00 $860,808.00 Bridge Ramps and Approaches $10,504,811.00 $7,514,599.00 $62,732.00
Bus Shelters $657,026.00 $387,208.00 $16,229.00 Vehicle Crossings $10,131,108.00 $2,825,281.00 $283,070.00 Footpaths $53,199,111.00 $26,430,370.00 $1,251,262.00 Surface water channels (k&c) $87,245,363.00 $32,787,536.00 $1,111,251.00
Drainage (culverts and sumps) $24,143,305.00 $9,193,995.00 $299,493.00
Street features (planters, seats, etc.) $2,667,653.01 $1,341,461.07 $90,920.49
Rubbish Bins $303,068.00 $42,210.00 $16,401.00 Road Markings (RRPM) $67,038.00 $16,749.00 $16,749.00
Traffic Islands $903,632.00 $665,011.00 $30,121.00 Parking meters $1,478,719.00 $98,906.00 $74,266.00 Edge marker posts $123,203.00 $16,214.00 $7,831.00 Traffic Signal Total $2,794,757.00 $1,159,699.00 $113,736.00 Grand Total $674,226,206.60 $397,442,438.77 $9,606,993.76
8.6 PROCUREMENT
Council is required to have a Procurement Strategy for activities funded through the National Land Transport Programme which has been approved by the NZ Transport Agency, in order to meet the requirements of Section 25 of the Land Transport Management Act 2003. Council has an endorsed Procurement Strategy which establishes Council’s approach to procurement of activities funded through the National Land Transport Programme (NLTP). Planned expenditure on subsidised Transport Activity is in the order of $15 million per annum. The strategy sets out the strategic approach to procurement over the 2019-2022 years, the context within which Council purchases goods and services, and details the programme to be purchased and the methods that will be used to do this. The Procurement Strategy aims to achieve desired outcomes and quality at the lowest overall whole of life cost and sustain a pool of suppliers in the region of varying sizes and capabilities to meet the needs of the Council. This Procurement Strategy should be read in conjunction with the Council wide Procurement Policy, noting that this Strategy takes precedence with respect to NZTA funded projects, and should comply with the NZTA Procurement Manual. Additional guidance is also provided from MBIE for standard guidance to purchase goods and services.
Roading Asset Management Plan 2020 A3025378
275
The Principles of the Procurement Strategy are: 1. To attain value for money, to plan and manage for great results 2. To encourage competitive and efficient markets 3. To enable fair competition, to be fair to all suppliers and get the best results for
everyone 4. To play by the rules and operate an efficient procurement process Maintenance contracts in the past provide a balance between price and quality, and use either Prequalification or Price / Quality supplier selection methods. The methods used to procure capital projects will differ depending on the size of the project, but will be Lowest Price or Price / Quality. Council maintains an in-house professional services capability to deliver services to achieve best value for money. Additional professional services are sometimes required and will be procured following the guidelines of the NZTA Procurement Manual. A Smart Buyer Assessment has been undertaken and included in Appendices 13-24. Council’s score of 62 suggests our Council has embraced the Smart Buyer principles but can still improve (2017 assessment of 59). Key improvements are better liaison with the industry and stronger governance understanding and alignment with Smart Buyer approach. RCAs must be both efficient and effective managers of their road assets and smart buyers of the services they require. These issues strongly relate to the concept of ‘smart procurement’ with a balanced focus across: 1. Economy – through securing (or supporting) the provision of products,
materials and expertise at the quality, in the volumes and at the times and locations required, at the lowest price.
2. Efficiency – through the processes used, including standard documentation and contracting forms selected for achieving best cost / quality and outcomes; and knowledge of the product / materials and supplier market applied.
3. Effectiveness – taking opportunities for changing from traditional products and materials by maintaining support for innovation in the nature and characteristics of products and materials, and for a strong supplier market.
The impact of raising the capability will include reduced supplier selection process costs, better management of risk and more objective assessment of performance for use in future supplier selection processes. The contracting industry has provided useful analysis of the characteristics of a smart buyer. Smart buyers have: An improved understanding of costs that better inform their decision making
process An understanding of the impact delivery models and supplier selection criteria
can have on the value of contracts Robust forward work programmes that are communicated to the industry and
supported by budgets that allows the work to be completed Knowledge of the network to determine treatments required based on physical
evidence and supported by knowledge of the costs involved
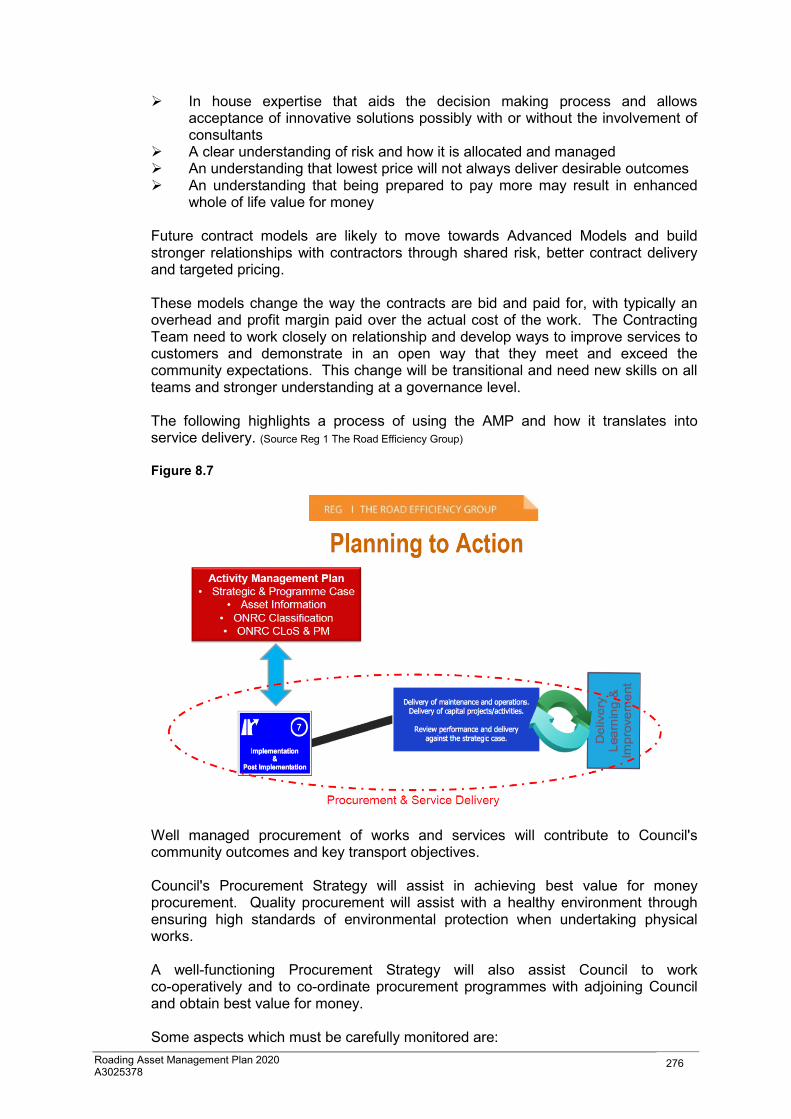
Roading Asset Management Plan 2020 A3025378
276
In house expertise that aids the decision making process and allows acceptance of innovative solutions possibly with or without the involvement of consultants
A clear understanding of risk and how it is allocated and managed An understanding that lowest price will not always deliver desirable outcomes An understanding that being prepared to pay more may result in enhanced
whole of life value for money Future contract models are likely to move towards Advanced Models and build stronger relationships with contractors through shared risk, better contract delivery and targeted pricing. These models change the way the contracts are bid and paid for, with typically an overhead and profit margin paid over the actual cost of the work. The Contracting Team need to work closely on relationship and develop ways to improve services to customers and demonstrate in an open way that they meet and exceed the community expectations. This change will be transitional and need new skills on all teams and stronger understanding at a governance level. The following highlights a process of using the AMP and how it translates into service delivery. (Source Reg 1 The Road Efficiency Group) Figure 8.7
Well managed procurement of works and services will contribute to Council's community outcomes and key transport objectives. Council's Procurement Strategy will assist in achieving best value for money procurement. Quality procurement will assist with a healthy environment through ensuring high standards of environmental protection when undertaking physical works. A well-functioning Procurement Strategy will also assist Council to work co-operatively and to co-ordinate procurement programmes with adjoining Council and obtain best value for money. Some aspects which must be carefully monitored are:
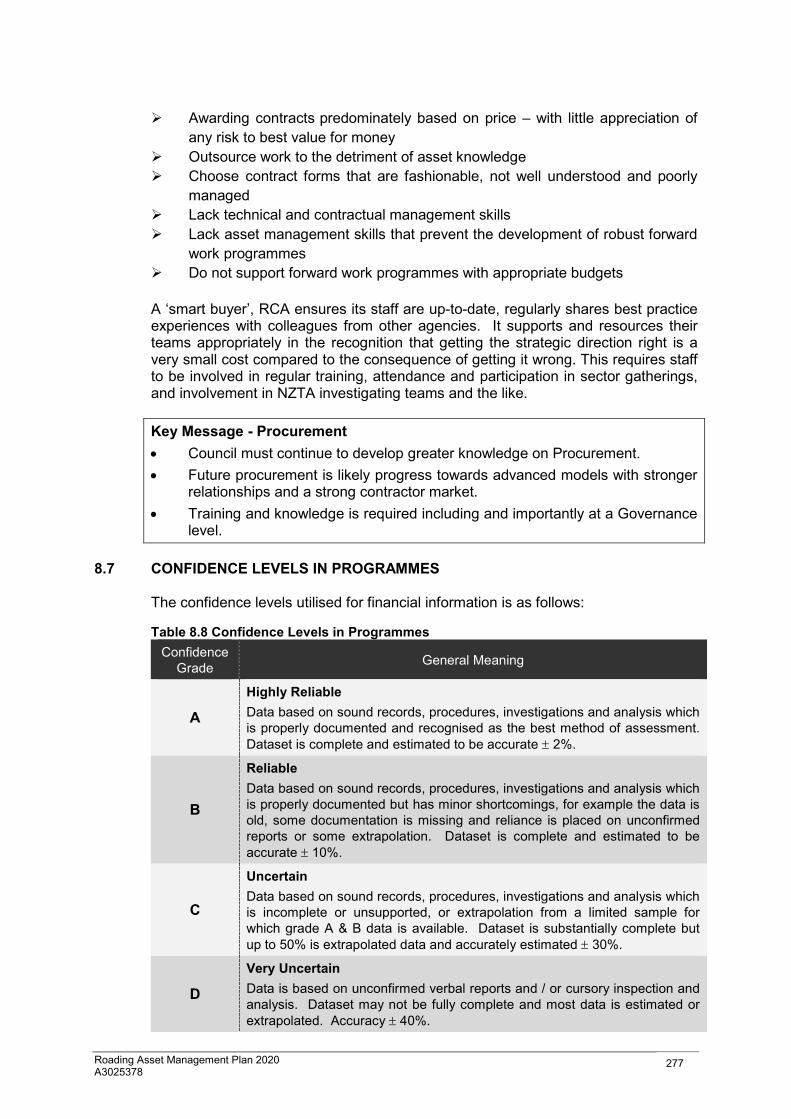
Roading Asset Management Plan 2020 A3025378
277
Awarding contracts predominately based on price – with little appreciation of
any risk to best value for money Outsource work to the detriment of asset knowledge Choose contract forms that are fashionable, not well understood and poorly
managed Lack technical and contractual management skills Lack asset management skills that prevent the development of robust forward
work programmes Do not support forward work programmes with appropriate budgets A ‘smart buyer’, RCA ensures its staff are up-to-date, regularly shares best practice experiences with colleagues from other agencies. It supports and resources their teams appropriately in the recognition that getting the strategic direction right is a very small cost compared to the consequence of getting it wrong. This requires staff to be involved in regular training, attendance and participation in sector gatherings, and involvement in NZTA investigating teams and the like. Key Message - Procurement • Council must continue to develop greater knowledge on Procurement. • Future procurement is likely progress towards advanced models with stronger
relationships and a strong contractor market. • Training and knowledge is required including and importantly at a Governance
level.
8.7 CONFIDENCE LEVELS IN PROGRAMMES The confidence levels utilised for financial information is as follows:
Table 8.8 Confidence Levels in Programmes
Confidence Grade General Meaning
A Highly Reliable Data based on sound records, procedures, investigations and analysis which is properly documented and recognised as the best method of assessment. Dataset is complete and estimated to be accurate ± 2%.
B
Reliable Data based on sound records, procedures, investigations and analysis which is properly documented but has minor shortcomings, for example the data is old, some documentation is missing and reliance is placed on unconfirmed reports or some extrapolation. Dataset is complete and estimated to be accurate ± 10%.
C
Uncertain Data based on sound records, procedures, investigations and analysis which is incomplete or unsupported, or extrapolation from a limited sample for which grade A & B data is available. Dataset is substantially complete but up to 50% is extrapolated data and accurately estimated ± 30%.
D Very Uncertain Data is based on unconfirmed verbal reports and / or cursory inspection and analysis. Dataset may not be fully complete and most data is estimated or extrapolated. Accuracy ± 40%.
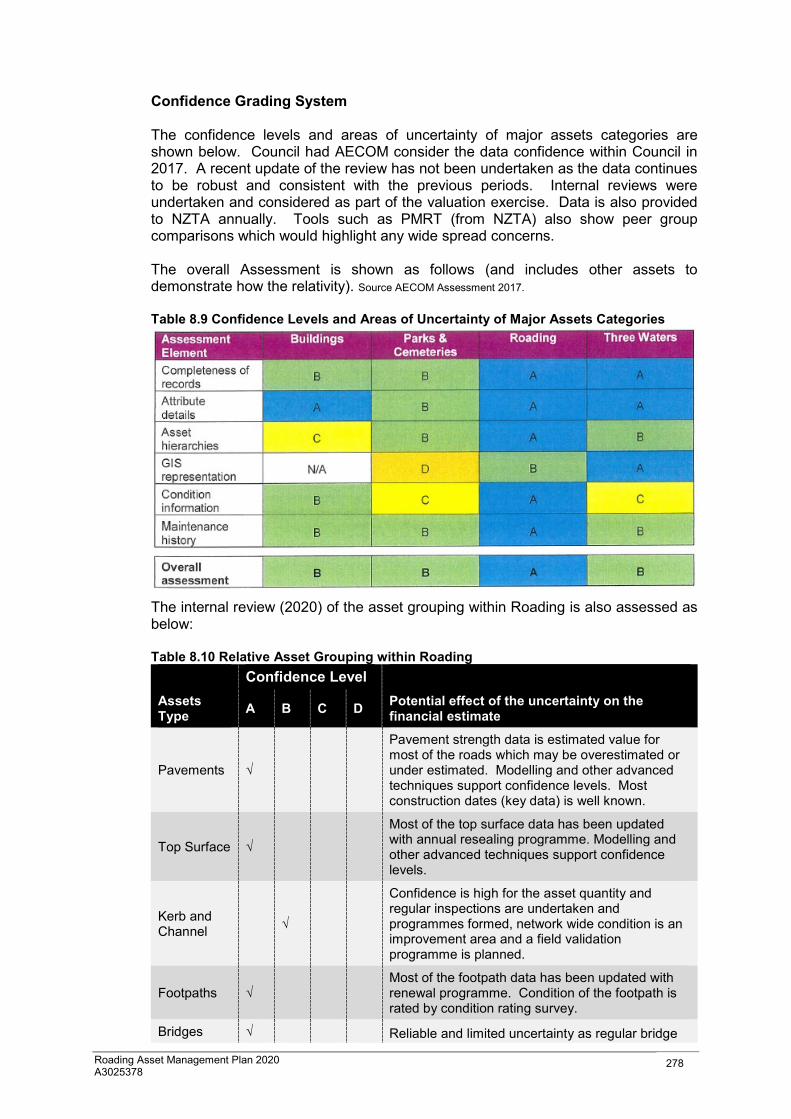
Roading Asset Management Plan 2020 A3025378
278
Confidence Grading System
The confidence levels and areas of uncertainty of major assets categories are shown below. Council had AECOM consider the data confidence within Council in 2017. A recent update of the review has not been undertaken as the data continues to be robust and consistent with the previous periods. Internal reviews were undertaken and considered as part of the valuation exercise. Data is also provided to NZTA annually. Tools such as PMRT (from NZTA) also show peer group comparisons which would highlight any wide spread concerns. The overall Assessment is shown as follows (and includes other assets to demonstrate how the relativity). Source AECOM Assessment 2017.
Table 8.9 Confidence Levels and Areas of Uncertainty of Major Assets Categories
The internal review (2020) of the asset grouping within Roading is also assessed as below: Table 8.10 Relative Asset Grouping within Roading Confidence Level Assets Type A B C D Potential effect of the uncertainty on the
financial estimate
Pavements √
Pavement strength data is estimated value for most of the roads which may be overestimated or under estimated. Modelling and other advanced techniques support confidence levels. Most construction dates (key data) is well known.
Top Surface √
Most of the top surface data has been updated with annual resealing programme. Modelling and other advanced techniques support confidence levels.
Kerb and Channel √
Confidence is high for the asset quantity and regular inspections are undertaken and programmes formed, network wide condition is an improvement area and a field validation programme is planned.
Footpaths √ Most of the footpath data has been updated with renewal programme. Condition of the footpath is rated by condition rating survey.
Bridges √ Reliable and limited uncertainty as regular bridge
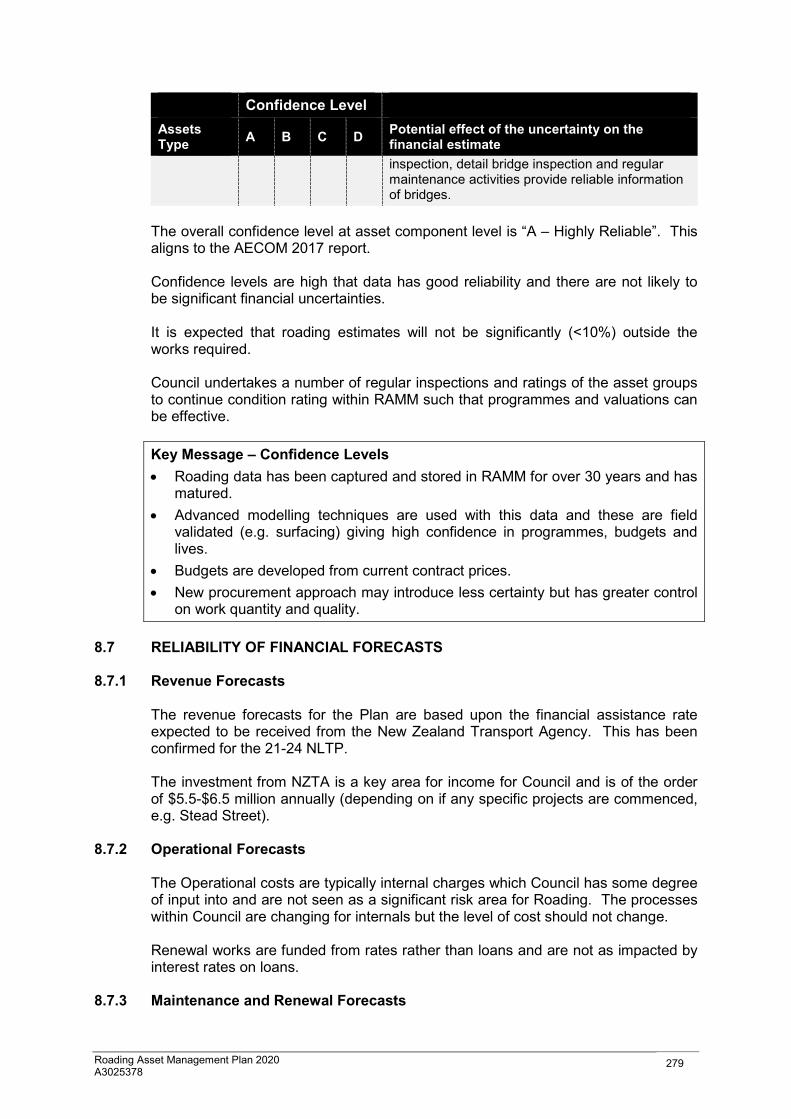
Roading Asset Management Plan 2020 A3025378
279
Confidence Level Assets Type A B C D Potential effect of the uncertainty on the
financial estimate inspection, detail bridge inspection and regular maintenance activities provide reliable information of bridges.
The overall confidence level at asset component level is “A – Highly Reliable”. This aligns to the AECOM 2017 report. Confidence levels are high that data has good reliability and there are not likely to be significant financial uncertainties. It is expected that roading estimates will not be significantly (<10%) outside the works required. Council undertakes a number of regular inspections and ratings of the asset groups to continue condition rating within RAMM such that programmes and valuations can be effective. Key Message – Confidence Levels • Roading data has been captured and stored in RAMM for over 30 years and has
matured. • Advanced modelling techniques are used with this data and these are field
validated (e.g. surfacing) giving high confidence in programmes, budgets and lives.
• Budgets are developed from current contract prices. • New procurement approach may introduce less certainty but has greater control
on work quantity and quality. 8.7 RELIABILITY OF FINANCIAL FORECASTS 8.7.1 Revenue Forecasts
The revenue forecasts for the Plan are based upon the financial assistance rate expected to be received from the New Zealand Transport Agency. This has been confirmed for the 21-24 NLTP. The investment from NZTA is a key area for income for Council and is of the order of $5.5-$6.5 million annually (depending on if any specific projects are commenced, e.g. Stead Street).
8.7.2 Operational Forecasts
The Operational costs are typically internal charges which Council has some degree of input into and are not seen as a significant risk area for Roading. The processes within Council are changing for internals but the level of cost should not change. Renewal works are funded from rates rather than loans and are not as impacted by interest rates on loans.
8.7.3 Maintenance and Renewal Forecasts
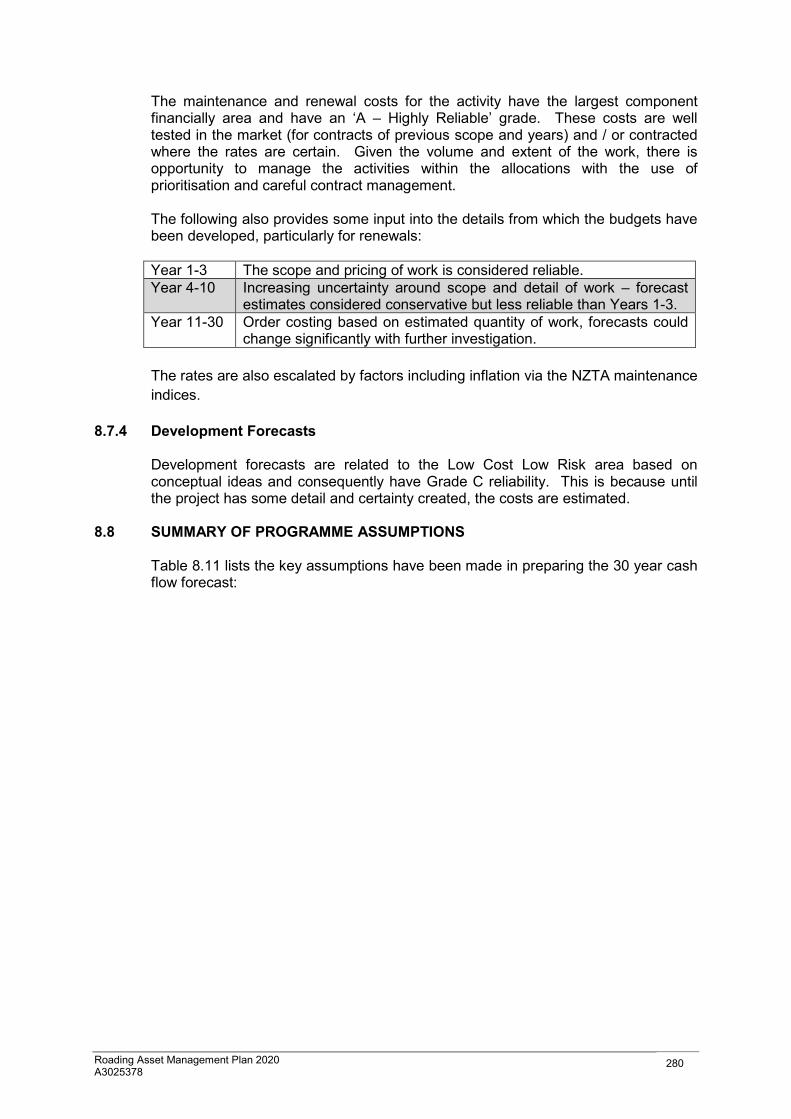
Roading Asset Management Plan 2020 A3025378
280
The maintenance and renewal costs for the activity have the largest component financially area and have an ‘A – Highly Reliable’ grade. These costs are well tested in the market (for contracts of previous scope and years) and / or contracted where the rates are certain. Given the volume and extent of the work, there is opportunity to manage the activities within the allocations with the use of prioritisation and careful contract management. The following also provides some input into the details from which the budgets have been developed, particularly for renewals: Year 1-3 The scope and pricing of work is considered reliable. Year 4-10 Increasing uncertainty around scope and detail of work – forecast
estimates considered conservative but less reliable than Years 1-3. Year 11-30 Order costing based on estimated quantity of work, forecasts could
change significantly with further investigation. The rates are also escalated by factors including inflation via the NZTA maintenance indices.
8.7.4 Development Forecasts
Development forecasts are related to the Low Cost Low Risk area based on conceptual ideas and consequently have Grade C reliability. This is because until the project has some detail and certainty created, the costs are estimated.
8.8 SUMMARY OF PROGRAMME ASSUMPTIONS
Table 8.11 lists the key assumptions have been made in preparing the 30 year cash flow forecast:
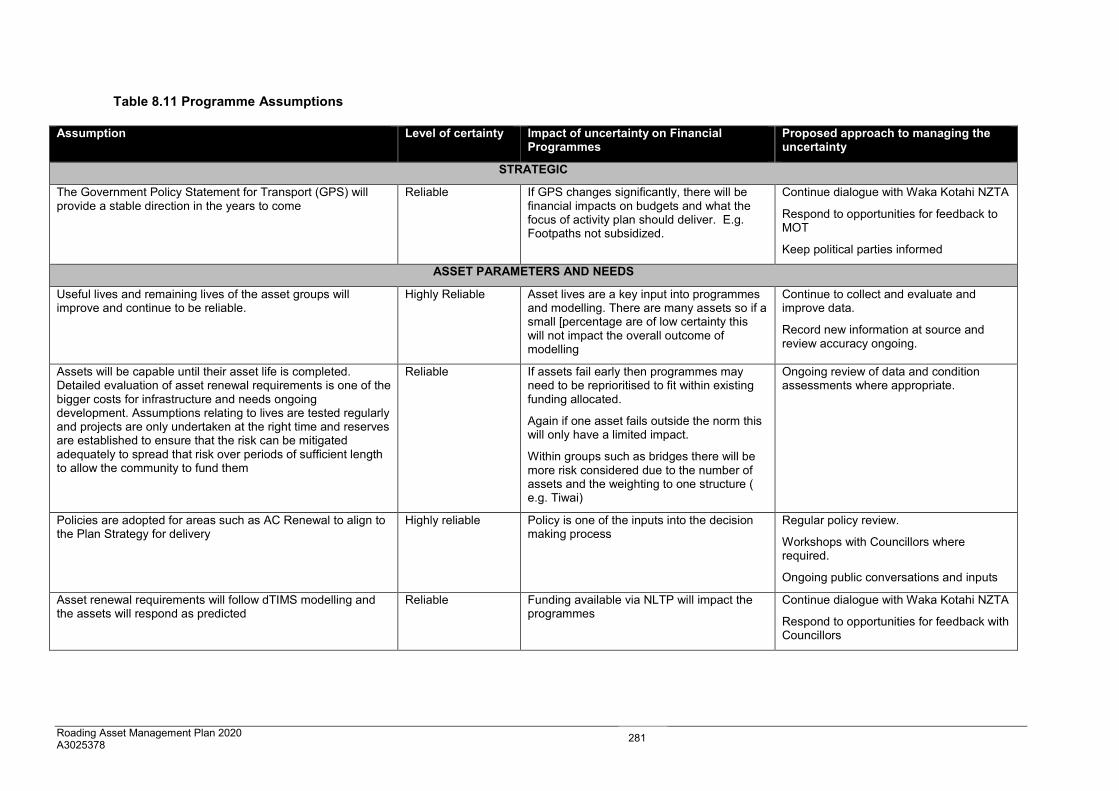
Roading Asset Management Plan 2020 A3025378 281
Table 8.11 Programme Assumptions
Assumption Level of certainty Impact of uncertainty on Financial Programmes
Proposed approach to managing the uncertainty
STRATEGIC
The Government Policy Statement for Transport (GPS) will provide a stable direction in the years to come
Reliable If GPS changes significantly, there will be financial impacts on budgets and what the focus of activity plan should deliver. E.g. Footpaths not subsidized.
Continue dialogue with Waka Kotahi NZTA
Respond to opportunities for feedback to MOT
Keep political parties informed
ASSET PARAMETERS AND NEEDS
Useful lives and remaining lives of the asset groups will improve and continue to be reliable.
Highly Reliable Asset lives are a key input into programmes and modelling. There are many assets so if a small [percentage are of low certainty this will not impact the overall outcome of modelling
Continue to collect and evaluate and improve data.
Record new information at source and review accuracy ongoing.
Assets will be capable until their asset life is completed. Detailed evaluation of asset renewal requirements is one of the bigger costs for infrastructure and needs ongoing development. Assumptions relating to lives are tested regularly and projects are only undertaken at the right time and reserves are established to ensure that the risk can be mitigated adequately to spread that risk over periods of sufficient length to allow the community to fund them
Reliable If assets fail early then programmes may need to be reprioritised to fit within existing funding allocated.
Again if one asset fails outside the norm this will only have a limited impact.
Within groups such as bridges there will be more risk considered due to the number of assets and the weighting to one structure ( e.g. Tiwai)
Ongoing review of data and condition assessments where appropriate.
Policies are adopted for areas such as AC Renewal to align to the Plan Strategy for delivery
Highly reliable Policy is one of the inputs into the decision making process
Regular policy review.
Workshops with Councillors where required.
Ongoing public conversations and inputs
Asset renewal requirements will follow dTIMS modelling and the assets will respond as predicted
Reliable Funding available via NLTP will impact the programmes
Continue dialogue with Waka Kotahi NZTA
Respond to opportunities for feedback with Councillors
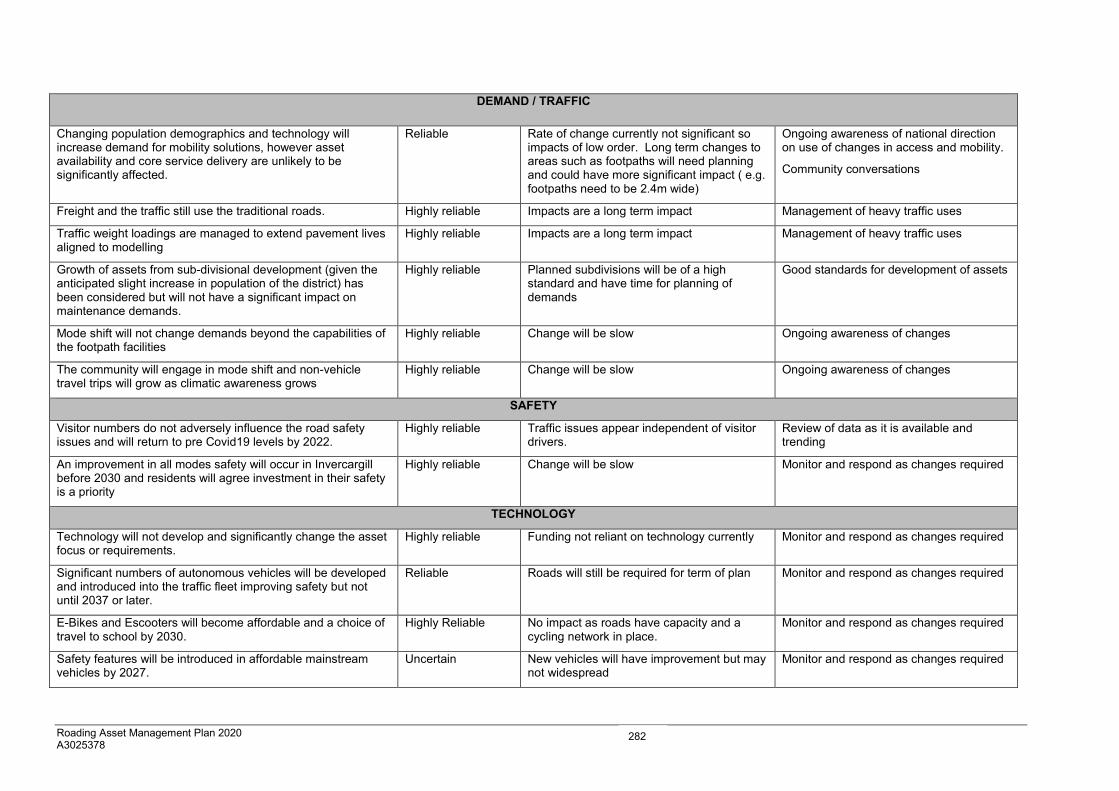
Roading Asset Management Plan 2020 A3025378
282
DEMAND / TRAFFIC
Changing population demographics and technology will increase demand for mobility solutions, however asset availability and core service delivery are unlikely to be significantly affected.
Reliable Rate of change currently not significant so impacts of low order. Long term changes to areas such as footpaths will need planning and could have more significant impact ( e.g. footpaths need to be 2.4m wide)
Ongoing awareness of national direction on use of changes in access and mobility.
Community conversations
Freight and the traffic still use the traditional roads. Highly reliable Impacts are a long term impact Management of heavy traffic uses
Traffic weight loadings are managed to extend pavement lives aligned to modelling
Highly reliable Impacts are a long term impact Management of heavy traffic uses
Growth of assets from sub-divisional development (given the anticipated slight increase in population of the district) has been considered but will not have a significant impact on maintenance demands.
Highly reliable Planned subdivisions will be of a high standard and have time for planning of demands
Good standards for development of assets
Mode shift will not change demands beyond the capabilities of the footpath facilities
Highly reliable Change will be slow Ongoing awareness of changes
The community will engage in mode shift and non-vehicle travel trips will grow as climatic awareness grows
Highly reliable Change will be slow Ongoing awareness of changes
SAFETY
Visitor numbers do not adversely influence the road safety issues and will return to pre Covid19 levels by 2022.
Highly reliable Traffic issues appear independent of visitor drivers.
Review of data as it is available and trending
An improvement in all modes safety will occur in Invercargill before 2030 and residents will agree investment in their safety is a priority
Highly reliable Change will be slow Monitor and respond as changes required
TECHNOLOGY
Technology will not develop and significantly change the asset focus or requirements.
Highly reliable Funding not reliant on technology currently Monitor and respond as changes required
Significant numbers of autonomous vehicles will be developed and introduced into the traffic fleet improving safety but not until 2037 or later.
Reliable Roads will still be required for term of plan Monitor and respond as changes required
E-Bikes and Escooters will become affordable and a choice of travel to school by 2030.
Highly Reliable No impact as roads have capacity and a cycling network in place.
Monitor and respond as changes required
Safety features will be introduced in affordable mainstream vehicles by 2027.
Uncertain New vehicles will have improvement but may not widespread
Monitor and respond as changes required
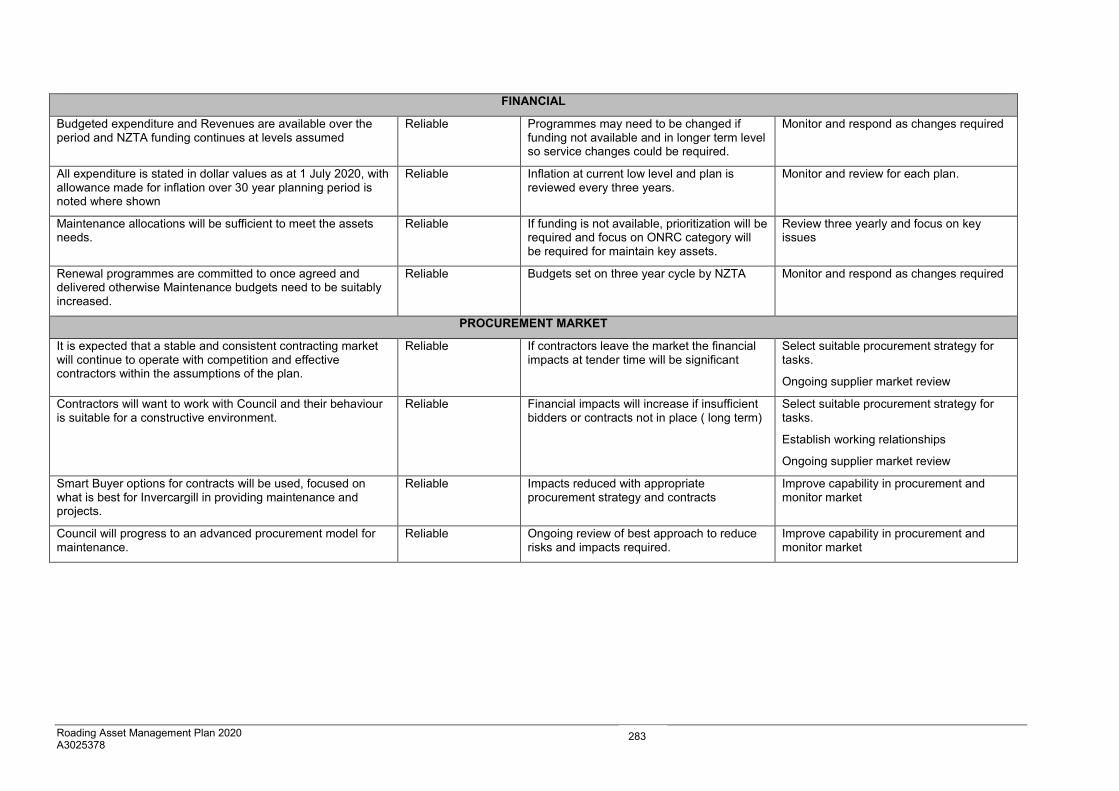
Roading Asset Management Plan 2020 A3025378
283
FINANCIAL
Budgeted expenditure and Revenues are available over the period and NZTA funding continues at levels assumed
Reliable Programmes may need to be changed if funding not available and in longer term level so service changes could be required.
Monitor and respond as changes required
All expenditure is stated in dollar values as at 1 July 2020, with allowance made for inflation over 30 year planning period is noted where shown
Reliable Inflation at current low level and plan is reviewed every three years.
Monitor and review for each plan.
Maintenance allocations will be sufficient to meet the assets needs.
Reliable If funding is not available, prioritization will be required and focus on ONRC category will be required for maintain key assets.
Review three yearly and focus on key issues
Renewal programmes are committed to once agreed and delivered otherwise Maintenance budgets need to be suitably increased.
Reliable Budgets set on three year cycle by NZTA Monitor and respond as changes required
PROCUREMENT MARKET
It is expected that a stable and consistent contracting market will continue to operate with competition and effective contractors within the assumptions of the plan.
Reliable If contractors leave the market the financial impacts at tender time will be significant
Select suitable procurement strategy for tasks.
Ongoing supplier market review
Contractors will want to work with Council and their behaviour is suitable for a constructive environment.
Reliable Financial impacts will increase if insufficient bidders or contracts not in place ( long term)
Select suitable procurement strategy for tasks.
Establish working relationships
Ongoing supplier market review
Smart Buyer options for contracts will be used, focused on what is best for Invercargill in providing maintenance and projects.
Reliable Impacts reduced with appropriate procurement strategy and contracts
Improve capability in procurement and monitor market
Council will progress to an advanced procurement model for maintenance.
Reliable Ongoing review of best approach to reduce risks and impacts required.
Improve capability in procurement and monitor market
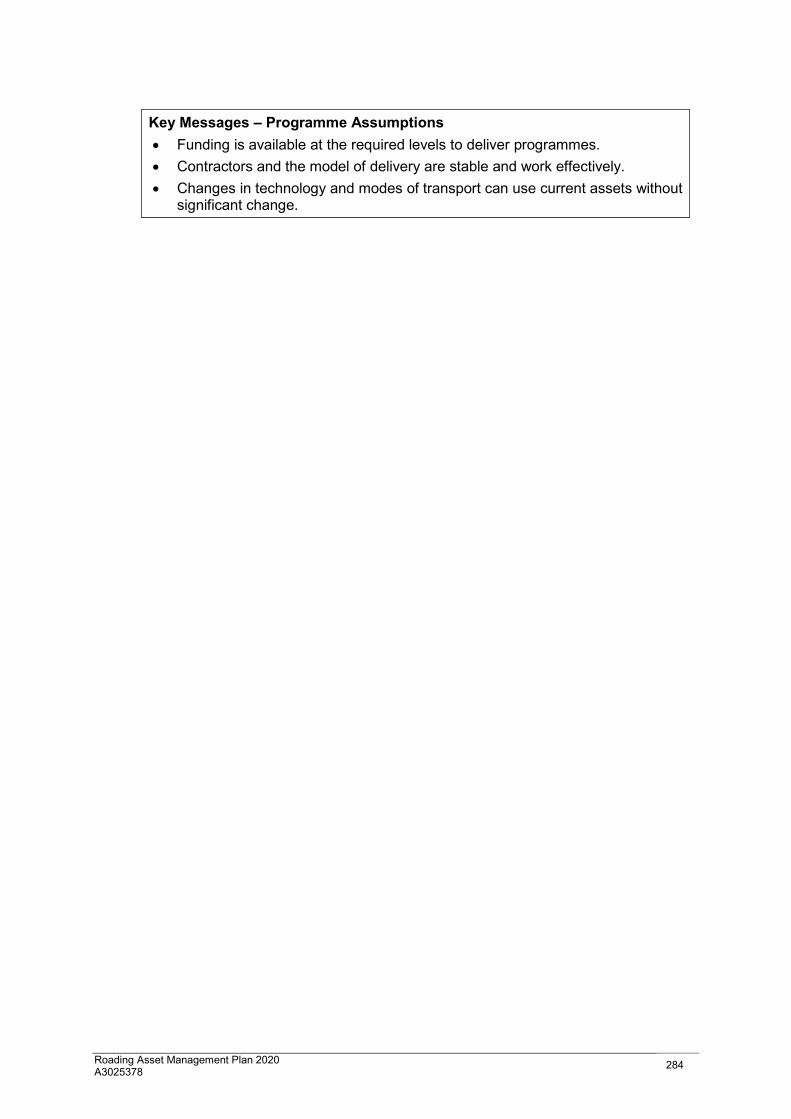
Roading Asset Management Plan 2020 A3025378 284
Key Messages – Programme Assumptions • Funding is available at the required levels to deliver programmes. • Contractors and the model of delivery are stable and work effectively. • Changes in technology and modes of transport can use current assets without
significant change.
Roading Asset Management Plan 2020 A3025378
285
9. DELIVERING AND MONITORING THE PROGRAMME
9.1 PROGRAMME GOVERNANCE AND REPORTING
Council operates on a four week cycle with three committees meeting and a full Council meeting. The committees are Infrastructural Services; Performance, Policy and Partnerships; and Risk and Assurance. These committees have delegated powers to accept and resolve. This reporting process ensures accountability to Councillors and allows for transparency to the public. Further to the three committees, there are additional sub-committees such as Audit and Risk that meets regularly to discuss issues relating to the Annual Report, Annual Plan, Long Term Plan processes and any other audit related issues. The Bluff Community Board is established and reports to Council on behalf of the Bluff area. Council provides direction to this committee and has a representative sitting on this board.
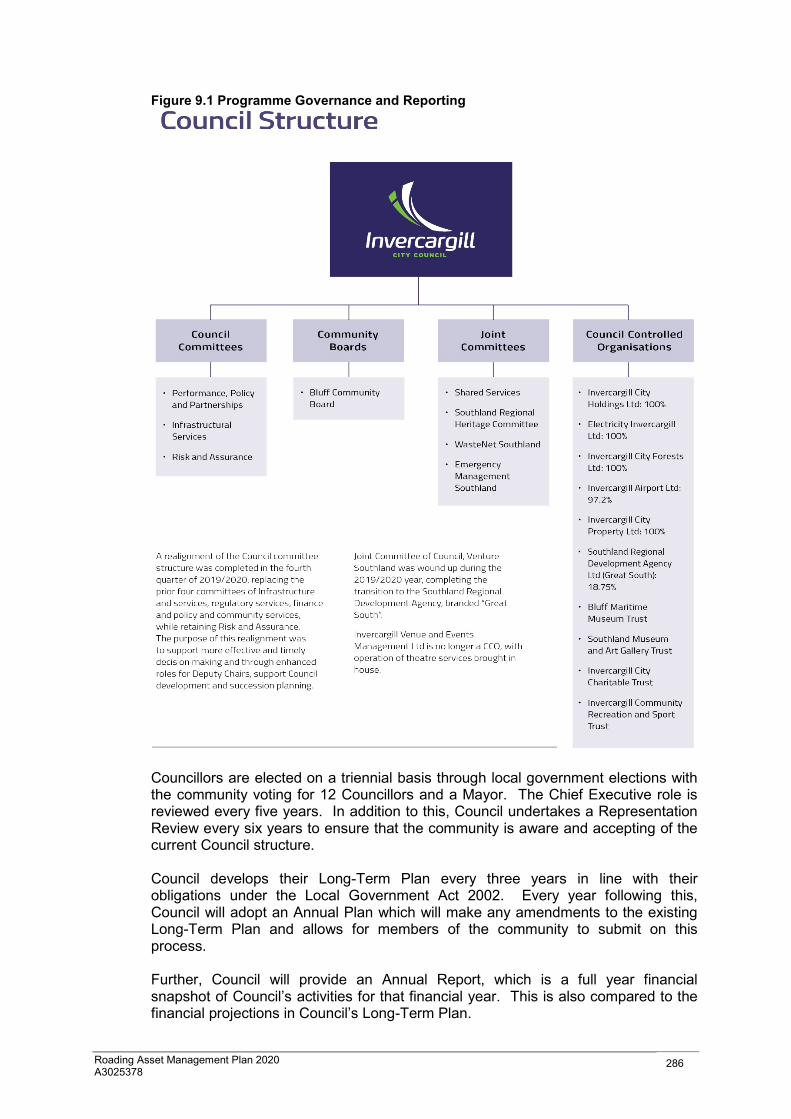
Roading Asset Management Plan 2020 A3025378
286
Figure 9.1 Programme Governance and Reporting
Councillors are elected on a triennial basis through local government elections with the community voting for 12 Councillors and a Mayor. The Chief Executive role is reviewed every five years. In addition to this, Council undertakes a Representation Review every six years to ensure that the community is aware and accepting of the current Council structure. Council develops their Long-Term Plan every three years in line with their obligations under the Local Government Act 2002. Every year following this, Council will adopt an Annual Plan which will make any amendments to the existing Long-Term Plan and allows for members of the community to submit on this process. Further, Council will provide an Annual Report, which is a full year financial snapshot of Council’s activities for that financial year. This is also compared to the financial projections in Council’s Long-Term Plan.
Roading Asset Management Plan 2020 A3025378
287
9.2 STAKEHOLDER ENGAGEMENT AND COMMUNICATIONS
Council currently utilises a number of methods to engage in consultation with members of the community. Council has a number of ways where the community are engaged with information on projects or on bylaws and other regulatory functions and these include: Reports to Council Committee Meetings Attending Community Board Meetings Meeting with Councillors and Community Board chairpersons. Performance Monitoring in Council agendas Letters to residents effected by works Letters to residents requesting actions or information Face to Face meetings with residents Telephone conversations with resident Responding to Facebook questions Email or letters responding to RFS request through Council websites Meetings and presentations with Community Groups Advertisements on Councils Community Noticeboard ( in local paper) Messages on Council website and Facebook ( Word on the Street) Conversations with families and friends Attendance and participation at Regional Transport Committee Attendance and participation at Technical Advisory Group of the RTC Forum and conference attendance ( REG and other Technical Groups) Presentation to other professional groups
The formal communication of performance is delivered through four weekly committee reports and via the annual report. Each project has its own specific needs to communicate and Council is continuing to develop ways to communicate better with our stakeholders and target audiences. The Local Government Act 2002 states specific methods of consultation to be utilised by Council for certain processes and where these are required they are followed such as in road stopping or bylaw consultation.
9.3 BUSINESS PROCESSES
The management structure of the Invercargill City Council regarding road maintenance and capital project delivery is as follows:
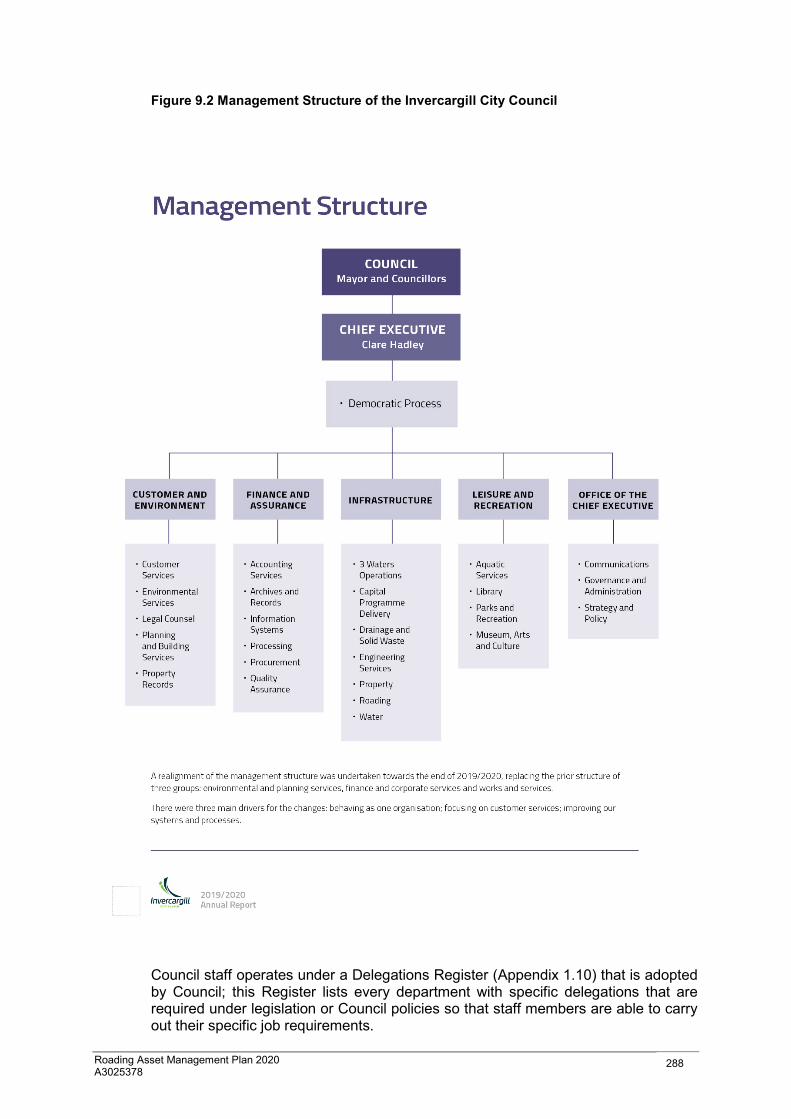
Roading Asset Management Plan 2020 A3025378
288
Figure 9.2 Management Structure of the Invercargill City Council
Council staff operates under a Delegations Register (Appendix 1.10) that is adopted by Council; this Register lists every department with specific delegations that are required under legislation or Council policies so that staff members are able to carry out their specific job requirements.
Roading Asset Management Plan 2020 A3025378
289
Roading Specific Processes Most costs for roading come to charge via a contract claim prepared by the contractor and submitted electronically via RAMM on a shared management platform. Each task is assigned a dispatch created through the contract which follows through the management process and links to key assets giving whole of life information. Current contracts have a strong element of measure and value approach, and the costs are established by the contractor inputting the quantity of work. Some items used are lump sum. Each procurement is considered on the best value for money and aligned to the roading strategy. Claims need to have confidence that they are appropriate and internal checks are made to validate claims. The processes are robust and is fully trackable and has audit facilities in the software. NZTA undertake Financial and Procedural Audits. Financial Summary Costs for Roading are prepared on a monthly basis with an accrual of the contract costs and a set of financial statements from which NZTA claims are considered and then made. These are available by the 5th business day, giving early visibility of monthly costs. This is followed by the actual costs following the 20th of the month business run. This process has been established to control and understand costs rather than wait a further three weeks for the actual costs. This ensures NZTA claims are timely and accurate. Accruals are possible as contractors claims are lodged for claim via RAMM within three business days. The current accounting system is being updated and the processes will be developed. RAMM is a common platform between Council and Contractor, and greater cost transparency is available. Quarterly Financial reports are provided to the appropriate Committee and to Council. These accounts are at departmental levels with further detail being available upon request. Council’s new systems will look to add additional value to these processes but most of the value lies within the joint operational platform of RAMM linking to assets for analysis. These systems are not typically available to other assets groups.
9.4 INFORMATION SYSTEMS AND DATA
RAMM RAMM is a software product of RAMM Software Limited and has been benchmarked as the national road asset management software system for over 25 years. Recently the company has been sold to international owners. The RAMM inventory system provides a comprehensive suite of data management tools for pavement, footpaths, kerb and channel, bridges, street lights, signs, crossings, features, traffic facilities and storm water drainage assets.
Roading Asset Management Plan 2020 A3025378
290
RAMM stores: Roads condition data collected from visual assessments of pavements, kerb
and channel and footpaths. Roughness data from Roughness survey SCRIM skid resistance data from SCRIM survey Pavement strength, traffic volume and traffic composition data GIS output and reporting
ONRC classifications are stored in RAMM as the primary source. Asset Inventory RAMM comes standard with many asset types that can be prescribed for the network. Additionally, user defined assets can be defined if the standard set is insufficient. Asset Valuation Council uses the RAMM Asset Valuation module to calculate and store RC, DRC and annual depreciation values. The software is accepted as best practice in roading but has some areas where development would be advantageous. RAMM Works Manager The RAMM module (previously Contractor) is utilised by both Contractor and Council to manage the maintenance task on a common platform. Dispatches are uploaded from the RFS systems, with some being directly managed and received by the contractor. These are then assigned by priority to programmes, submitted for approach, work start and other process attached, completed and signed off, and payment requested and approved within the module. Maintenance costs are linked to assets and transferred to RAMM inventory for use in other modules.
Treatment Selection Algorithm RAMM has a treatment selection function which analyses the absolute values of defects and distress data in a costing algorithm which takes into account the faults measured, carriageway roughness, traffic volumes and maintenance cost to determine overall costs of alternative treatments and an optimal programme of works.
RAMM GIS RAMM software system has a strong GIS platform to visualise, question, analyse, interpret and understand RAMM data. dTIMS dTIMS CT is a customizable framework application for asset management and is used for advanced asset pavement and resurfacing deterioration modelling, and seamlessly combines data management and asset analysis into one centralized application.
A typical dTIMS CT analysis consists of two steps – Generating Strategies and Optimization. Generating Strategies constructs a list of strategies for each road
Roading Asset Management Plan 2020 A3025378
291
element and Optimization chooses one strategy from the list for each element so that an objective function is achieved while not violating established constraints.
This analysis generates a list of feasible strategies and programmes for each infrastructure element in the database and predicts the future conditions of the elements.
Deficiency Database Council has a deficiency ‘database’ which is utilised to prioritise safety works in the Low Cost Low Risk budget area (previously known as minor improvement budgets). Council will, during the Plan, participate in revisiting the Safety Management System (SMS) across the region. NZTA has also been developing software for its Safer Networks Programme (pipeline tools) on a GIS platform and it is expected that this will be a shared medium. A key component of this process is the identification and recording of hazards and safety deficiencies in the network. Hazards (e.g. possible flooding in severe storms) can only be managed when they occur and need to be distinguished from deficiencies (which can be improved or eliminated). Once deficiencies have been identified, they can either be rectified as part of a maintenance contract or considered for improvement through a prioritisation process based on their safety risk. Geographical Information Systems (GIS) Council has a corporate software suite to graphically determine and understand where Council facilities or assets are located. This includes geocoding our data, putting it on a map, and symbolizing it in ways that can help visualize and understand the data. Infor Pathway Infor delivers a comprehensive software platform offering of integrated functionality for managing council related business processes including: Customer Service and People Management - central name / address
register and customer request management. Land and Property Management - administration tools to assist with land
and property management. Revenue Management - capabilities such as rates accounting, property
valuations, debtors and water billing. Infor Public Sector (IPS) IPS is used by Council to manage its piped network and building assets but not used by Roading. TechOne
Roading Asset Management Plan 2020 A3025378
292
Council has recently implemented a new financial suite and its capabilities will assist with financial management, budget and reporting. Objective (called BURT) Delivers an Electronic Document and Records Management (EDRMS) service across all of Council providing information management processes and business process automation with robust security, version control and audit management to ensure Council complies with recordkeeping standards; this reduces the risk associated with managing information in multiple locations
9.5 PROGRAMME PERFORMANCE MONITORING AND REVIEW 9.5.1 Monitoring Approach
Council has shifted its governance reporting focus to a quarterly basis which includes forecasting expenditure for an 18 month window. The financial performance, key performance indicators and levels of service are monitored and measured against those from the Long-Term Plan, as well as any measures that are provided from the relevant ministry which monitors the activity, such as the Department of Internal Affairs. As noted in Section 8, Roading utilises a monthly accrual and reporting process to have a much tighter financial control over expenditure and be able to see what costs are at an early stage. This allows for informed decisions to be made to ensure programmes are delivered to budget and the right decisions have information available to support them. Two approaches to reports have historically been used, however the new system is more closely aligned to NZTA work categories. This will assist with the NZTA claiming process as well as ensure only the correct expenditure is allocated to subsidised works. Procedural audits are undertaken by NZTA and have had favourable reviews. Council is developing further internal audit process for corporate risk management Quarterly forecasting is required by Council and NZTA (Performance Monitor). All Council systems are focused on costs issues, and some care is required for budgeting and claiming to ensure that the correct amounts are recovered and that where appropriate the maximum claims are made from NZTA. Reports from ONRC are included within the Appendix 13.07 and Appendix 13.08.
9.5.2 Frequency of Review
The performance measures are published yearly in the Annual Report with commentary from Managers as to the level of service against the estimated measure.
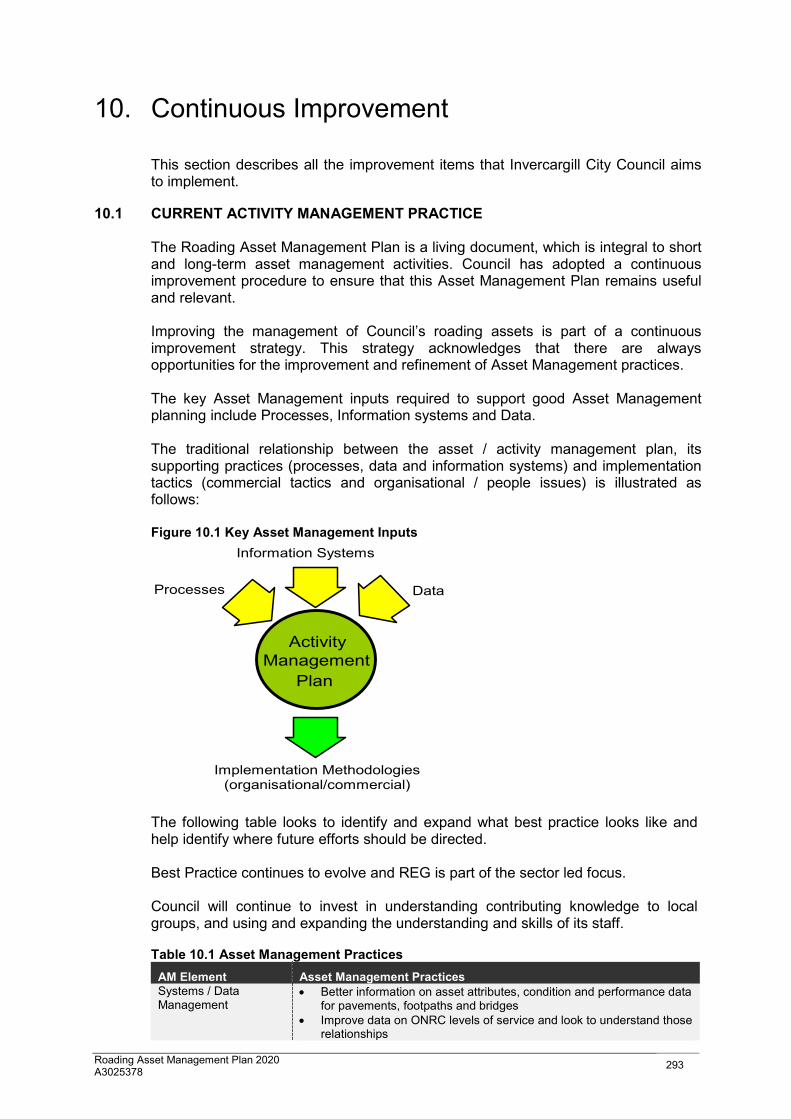
Roading Asset Management Plan 2020 A3025378 293
10. Continuous Improvement This section describes all the improvement items that Invercargill City Council aims to implement.
10.1 CURRENT ACTIVITY MANAGEMENT PRACTICE
The Roading Asset Management Plan is a living document, which is integral to short and long-term asset management activities. Council has adopted a continuous improvement procedure to ensure that this Asset Management Plan remains useful and relevant. Improving the management of Council’s roading assets is part of a continuous improvement strategy. This strategy acknowledges that there are always opportunities for the improvement and refinement of Asset Management practices.
The key Asset Management inputs required to support good Asset Management planning include Processes, Information systems and Data.
The traditional relationship between the asset / activity management plan, its supporting practices (processes, data and information systems) and implementation tactics (commercial tactics and organisational / people issues) is illustrated as follows: Figure 10.1 Key Asset Management Inputs
Activity Management
Plan
Processes Data
Implementation Methodologies (organisational/commercial)
Information Systems
The following table looks to identify and expand what best practice looks like and help identify where future efforts should be directed. Best Practice continues to evolve and REG is part of the sector led focus. Council will continue to invest in understanding contributing knowledge to local groups, and using and expanding the understanding and skills of its staff.
Table 10.1 Asset Management Practices
AM Element Asset Management Practices Systems / Data Management
• Better information on asset attributes, condition and performance data for pavements, footpaths and bridges
• Improve data on ONRC levels of service and look to understand those relationships
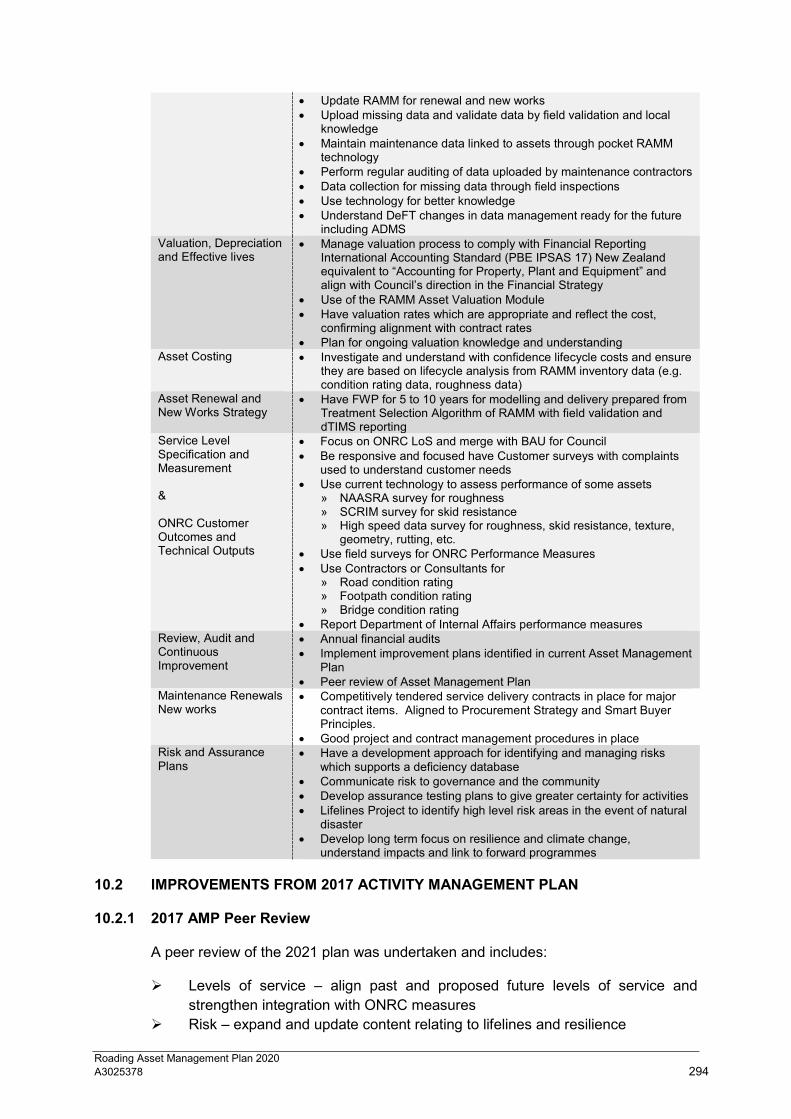
Roading Asset Management Plan 2020 A3025378 294
• Update RAMM for renewal and new works • Upload missing data and validate data by field validation and local
knowledge • Maintain maintenance data linked to assets through pocket RAMM
technology • Perform regular auditing of data uploaded by maintenance contractors • Data collection for missing data through field inspections • Use technology for better knowledge • Understand DeFT changes in data management ready for the future
including ADMS Valuation, Depreciation and Effective lives
• Manage valuation process to comply with Financial Reporting International Accounting Standard (PBE IPSAS 17) New Zealand equivalent to “Accounting for Property, Plant and Equipment” and align with Council’s direction in the Financial Strategy
• Use of the RAMM Asset Valuation Module • Have valuation rates which are appropriate and reflect the cost,
confirming alignment with contract rates • Plan for ongoing valuation knowledge and understanding
Asset Costing • Investigate and understand with confidence lifecycle costs and ensure they are based on lifecycle analysis from RAMM inventory data (e.g. condition rating data, roughness data)
Asset Renewal and New Works Strategy
• Have FWP for 5 to 10 years for modelling and delivery prepared from Treatment Selection Algorithm of RAMM with field validation and dTIMS reporting
Service Level Specification and Measurement & ONRC Customer Outcomes and Technical Outputs
• Focus on ONRC LoS and merge with BAU for Council • Be responsive and focused have Customer surveys with complaints
used to understand customer needs • Use current technology to assess performance of some assets
» NAASRA survey for roughness » SCRIM survey for skid resistance » High speed data survey for roughness, skid resistance, texture,
geometry, rutting, etc. • Use field surveys for ONRC Performance Measures • Use Contractors or Consultants for
» Road condition rating » Footpath condition rating » Bridge condition rating
• Report Department of Internal Affairs performance measures Review, Audit and Continuous Improvement
• Annual financial audits • Implement improvement plans identified in current Asset Management
Plan • Peer review of Asset Management Plan
Maintenance Renewals New works
• Competitively tendered service delivery contracts in place for major contract items. Aligned to Procurement Strategy and Smart Buyer Principles.
• Good project and contract management procedures in place Risk and Assurance Plans
• Have a development approach for identifying and managing risks which supports a deficiency database
• Communicate risk to governance and the community • Develop assurance testing plans to give greater certainty for activities • Lifelines Project to identify high level risk areas in the event of natural
disaster • Develop long term focus on resilience and climate change,
understand impacts and link to forward programmes 10.2 IMPROVEMENTS FROM 2017 ACTIVITY MANAGEMENT PLAN 10.2.1 2017 AMP Peer Review
A peer review of the 2021 plan was undertaken and includes: Levels of service – align past and proposed future levels of service and
strengthen integration with ONRC measures Risk – expand and update content relating to lifelines and resilience
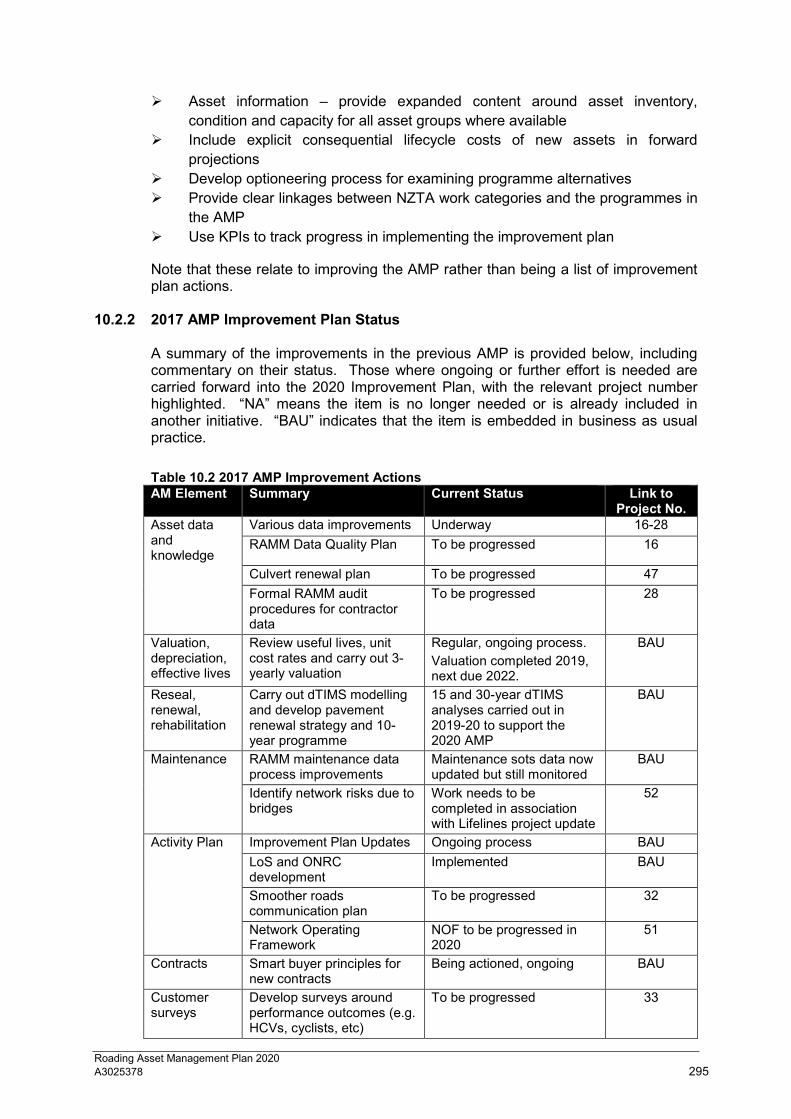
Roading Asset Management Plan 2020 A3025378 295
Asset information – provide expanded content around asset inventory, condition and capacity for all asset groups where available
Include explicit consequential lifecycle costs of new assets in forward projections
Develop optioneering process for examining programme alternatives Provide clear linkages between NZTA work categories and the programmes in
the AMP Use KPIs to track progress in implementing the improvement plan
Note that these relate to improving the AMP rather than being a list of improvement plan actions.
10.2.2 2017 AMP Improvement Plan Status A summary of the improvements in the previous AMP is provided below, including commentary on their status. Those where ongoing or further effort is needed are carried forward into the 2020 Improvement Plan, with the relevant project number highlighted. “NA” means the item is no longer needed or is already included in another initiative. “BAU” indicates that the item is embedded in business as usual practice.
Table 10.2 2017 AMP Improvement Actions AM Element Summary Current Status Link to
Project No. Asset data and knowledge
Various data improvements Underway 16-28 RAMM Data Quality Plan To be progressed 16
Culvert renewal plan To be progressed 47 Formal RAMM audit
procedures for contractor data
To be progressed 28
Valuation, depreciation, effective lives
Review useful lives, unit cost rates and carry out 3-yearly valuation
Regular, ongoing process. Valuation completed 2019, next due 2022.
BAU
Reseal, renewal, rehabilitation
Carry out dTIMS modelling and develop pavement renewal strategy and 10-year programme
15 and 30-year dTIMS analyses carried out in 2019-20 to support the 2020 AMP
BAU
Maintenance RAMM maintenance data process improvements
Maintenance sots data now updated but still monitored
BAU
Identify network risks due to bridges
Work needs to be completed in association with Lifelines project update
52
Activity Plan Improvement Plan Updates Ongoing process BAU LoS and ONRC development
Implemented BAU
Smoother roads communication plan
To be progressed 32
Network Operating Framework
NOF to be progressed in 2020
51
Contracts Smart buyer principles for new contracts
Being actioned, ongoing BAU
Customer surveys
Develop surveys around performance outcomes (e.g. HCVs, cyclists, etc)
To be progressed 33
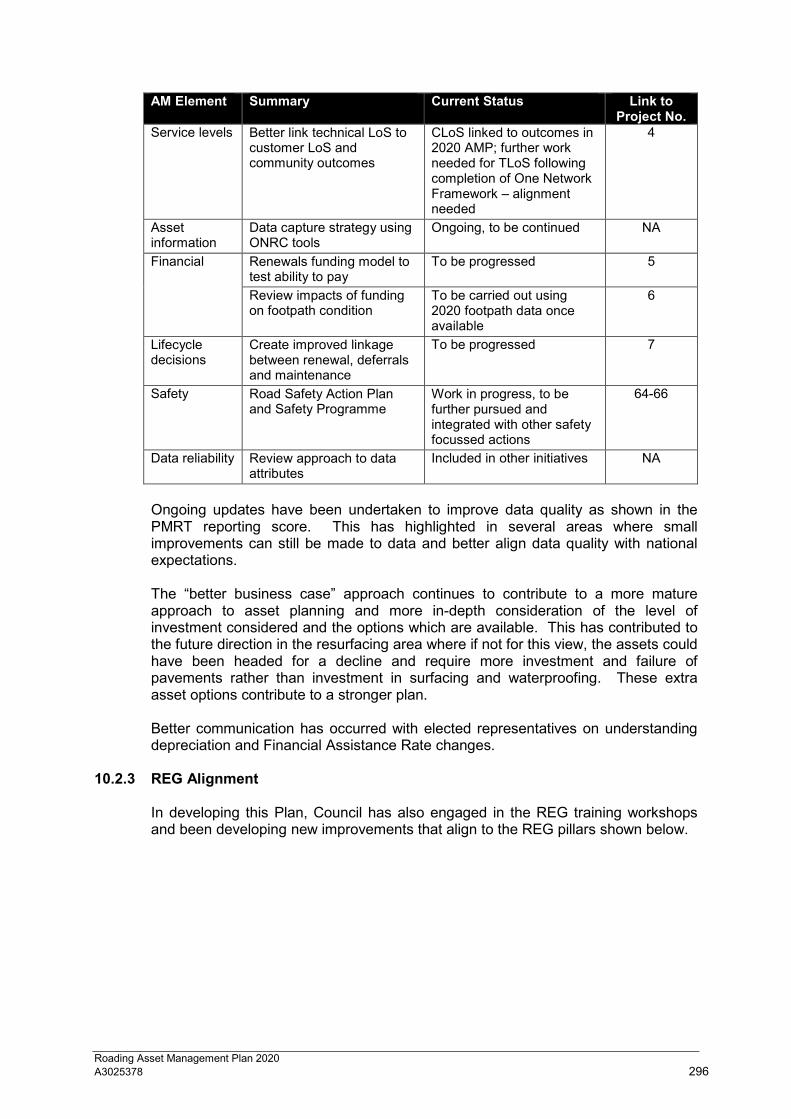
Roading Asset Management Plan 2020 A3025378 296
AM Element Summary Current Status Link to Project No.
Service levels Better link technical LoS to customer LoS and community outcomes
CLoS linked to outcomes in 2020 AMP; further work needed for TLoS following completion of One Network Framework – alignment needed
4
Asset information
Data capture strategy using ONRC tools
Ongoing, to be continued NA
Financial Renewals funding model to test ability to pay
To be progressed 5
Review impacts of funding on footpath condition
To be carried out using 2020 footpath data once available
6
Lifecycle decisions
Create improved linkage between renewal, deferrals and maintenance
To be progressed 7
Safety Road Safety Action Plan and Safety Programme
Work in progress, to be further pursued and integrated with other safety focussed actions
64-66
Data reliability Review approach to data attributes
Included in other initiatives NA
Ongoing updates have been undertaken to improve data quality as shown in the PMRT reporting score. This has highlighted in several areas where small improvements can still be made to data and better align data quality with national expectations. The “better business case” approach continues to contribute to a more mature approach to asset planning and more in-depth consideration of the level of investment considered and the options which are available. This has contributed to the future direction in the resurfacing area where if not for this view, the assets could have been headed for a decline and require more investment and failure of pavements rather than investment in surfacing and waterproofing. These extra asset options contribute to a stronger plan. Better communication has occurred with elected representatives on understanding depreciation and Financial Assistance Rate changes.
10.2.3 REG Alignment In developing this Plan, Council has also engaged in the REG training workshops and been developing new improvements that align to the REG pillars shown below.
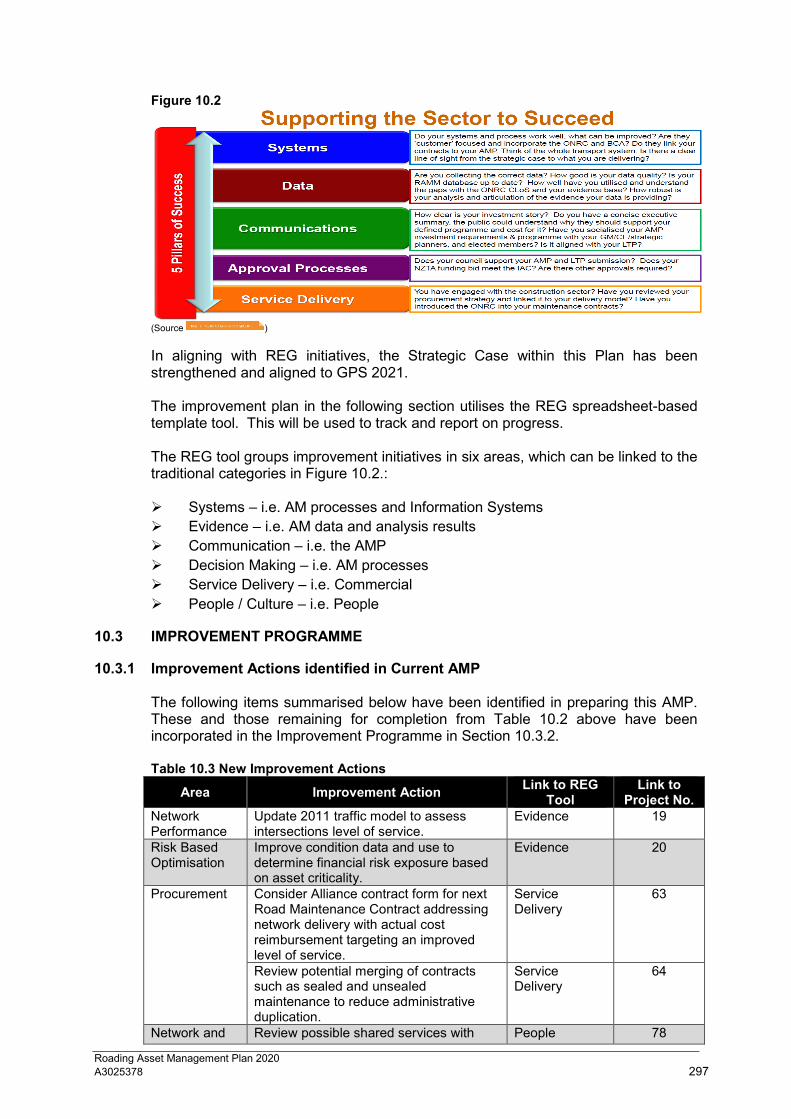
Roading Asset Management Plan 2020 A3025378 297
Figure 10.2
(Source ) In aligning with REG initiatives, the Strategic Case within this Plan has been strengthened and aligned to GPS 2021. The improvement plan in the following section utilises the REG spreadsheet-based template tool. This will be used to track and report on progress. The REG tool groups improvement initiatives in six areas, which can be linked to the traditional categories in Figure 10.2.: Systems – i.e. AM processes and Information Systems Evidence – i.e. AM data and analysis results Communication – i.e. the AMP Decision Making – i.e. AM processes Service Delivery – i.e. Commercial People / Culture – i.e. People
10.3 IMPROVEMENT PROGRAMME
10.3.1 Improvement Actions identified in Current AMP The following items summarised below have been identified in preparing this AMP. These and those remaining for completion from Table 10.2 above have been incorporated in the Improvement Programme in Section 10.3.2. Table 10.3 New Improvement Actions
Area Improvement Action Link to REG Tool
Link to Project No.
Network Performance
Update 2011 traffic model to assess intersections level of service.
Evidence 19
Risk Based Optimisation
Improve condition data and use to determine financial risk exposure based on asset criticality.
Evidence 20
Procurement Consider Alliance contract form for next Road Maintenance Contract addressing network delivery with actual cost reimbursement targeting an improved level of service.
Service Delivery
63
Review potential merging of contracts such as sealed and unsealed maintenance to reduce administrative duplication.
Service Delivery
64
Network and Review possible shared services with People 78
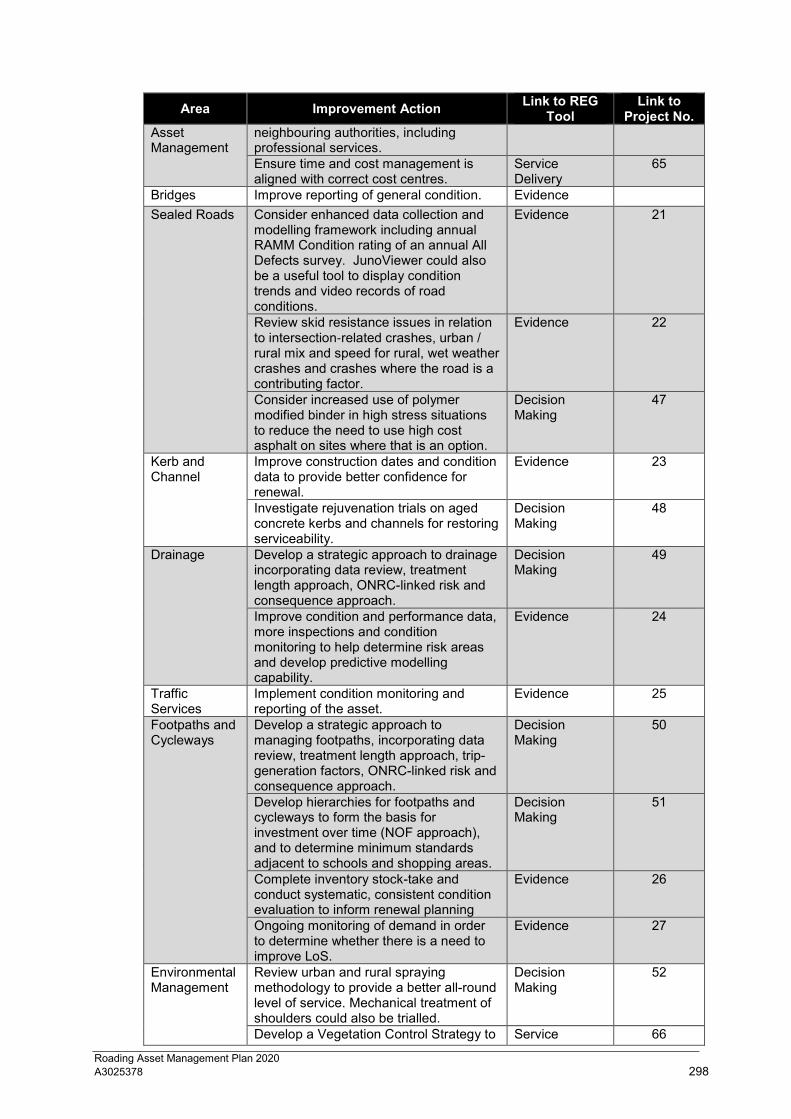
Roading Asset Management Plan 2020 A3025378 298
Area Improvement Action Link to REG Tool
Link to Project No.
Asset Management
neighbouring authorities, including professional services. Ensure time and cost management is aligned with correct cost centres.
Service Delivery
65
Bridges Improve reporting of general condition. Evidence Sealed Roads Consider enhanced data collection and
modelling framework including annual RAMM Condition rating of an annual All Defects survey. JunoViewer could also be a useful tool to display condition trends and video records of road conditions.
Evidence 21
Review skid resistance issues in relation to intersection‐related crashes, urban / rural mix and speed for rural, wet weather crashes and crashes where the road is a contributing factor.
Evidence 22
Consider increased use of polymer modified binder in high stress situations to reduce the need to use high cost asphalt on sites where that is an option.
Decision Making
47
Kerb and Channel
Improve construction dates and condition data to provide better confidence for renewal.
Evidence 23
Investigate rejuvenation trials on aged concrete kerbs and channels for restoring serviceability.
Decision Making
48
Drainage Develop a strategic approach to drainage incorporating data review, treatment length approach, ONRC-linked risk and consequence approach.
Decision Making
49
Improve condition and performance data, more inspections and condition monitoring to help determine risk areas and develop predictive modelling capability.
Evidence 24
Traffic Services
Implement condition monitoring and reporting of the asset.
Evidence 25
Footpaths and Cycleways
Develop a strategic approach to managing footpaths, incorporating data review, treatment length approach, trip-generation factors, ONRC-linked risk and consequence approach.
Decision Making
50
Develop hierarchies for footpaths and cycleways to form the basis for investment over time (NOF approach), and to determine minimum standards adjacent to schools and shopping areas.
Decision Making
51
Complete inventory stock-take and conduct systematic, consistent condition evaluation to inform renewal planning
Evidence 26
Ongoing monitoring of demand in order to determine whether there is a need to improve LoS.
Evidence 27
Environmental Management
Review urban and rural spraying methodology to provide a better all-round level of service. Mechanical treatment of shoulders could also be trialled.
Decision Making
52
Develop a Vegetation Control Strategy to Service 66
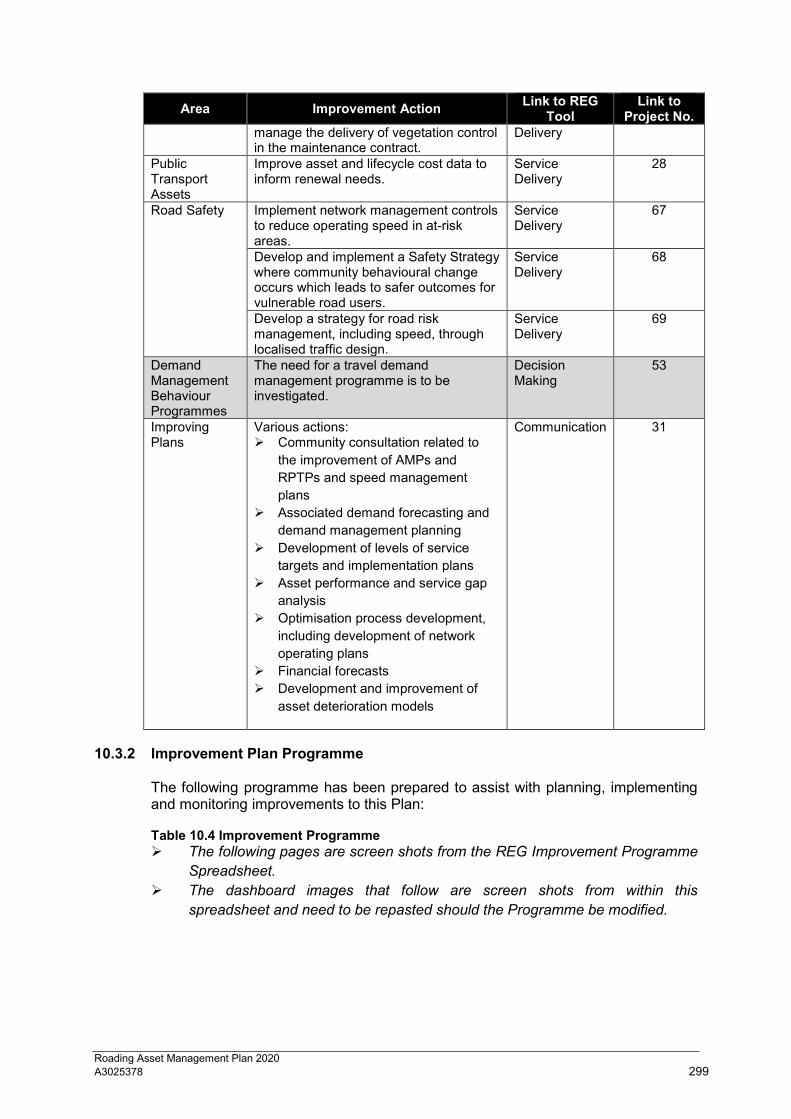
Roading Asset Management Plan 2020 A3025378 299
Area Improvement Action Link to REG Tool
Link to Project No.
manage the delivery of vegetation control in the maintenance contract.
Delivery
Public Transport Assets
Improve asset and lifecycle cost data to inform renewal needs.
Service Delivery
28
Road Safety Implement network management controls to reduce operating speed in at-risk areas.
Service Delivery
67
Develop and implement a Safety Strategy where community behavioural change occurs which leads to safer outcomes for vulnerable road users.
Service Delivery
68
Develop a strategy for road risk management, including speed, through localised traffic design.
Service Delivery
69
Demand Management Behaviour Programmes
The need for a travel demand management programme is to be investigated.
Decision Making
53
Improving Plans
Various actions: Community consultation related to
the improvement of AMPs and RPTPs and speed management plans
Associated demand forecasting and demand management planning
Development of levels of service targets and implementation plans
Asset performance and service gap analysis
Optimisation process development, including development of network operating plans
Financial forecasts Development and improvement of
asset deterioration models
Communication 31
10.3.2 Improvement Plan Programme
The following programme has been prepared to assist with planning, implementing and monitoring improvements to this Plan: Table 10.4 Improvement Programme The following pages are screen shots from the REG Improvement Programme
Spreadsheet. The dashboard images that follow are screen shots from within this
spreadsheet and need to be repasted should the Programme be modified.
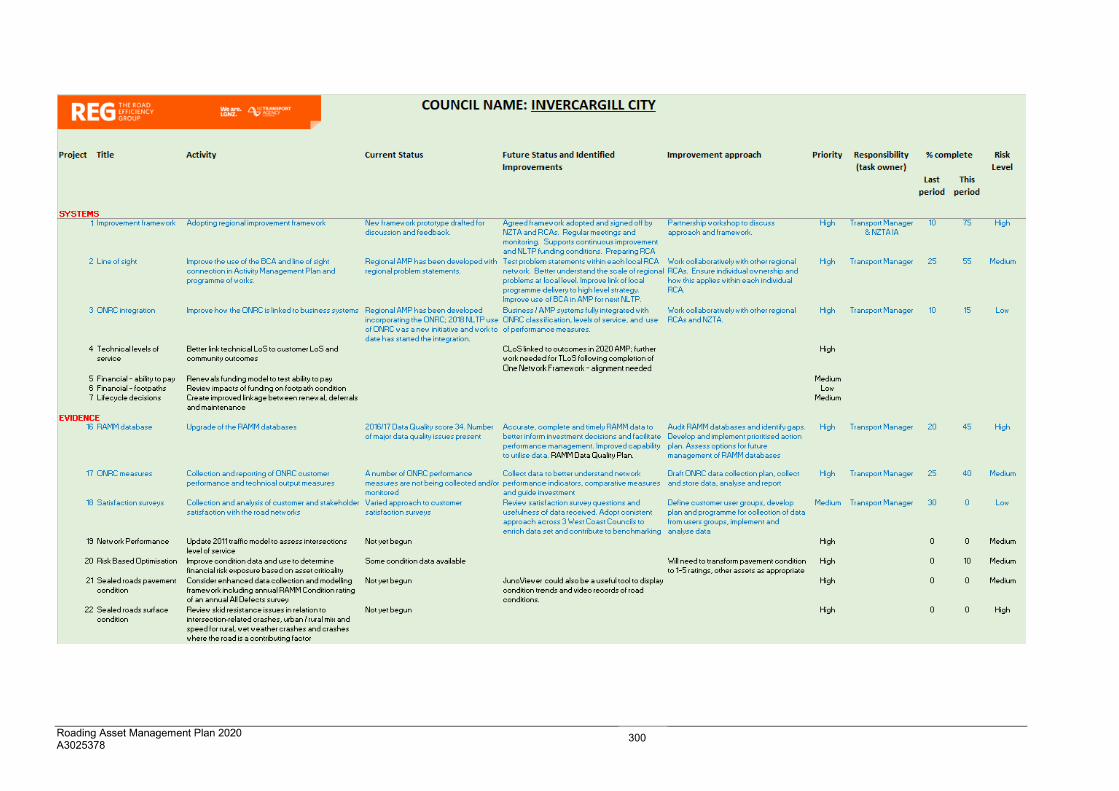
Roading Asset Management Plan 2020 A3025378 300
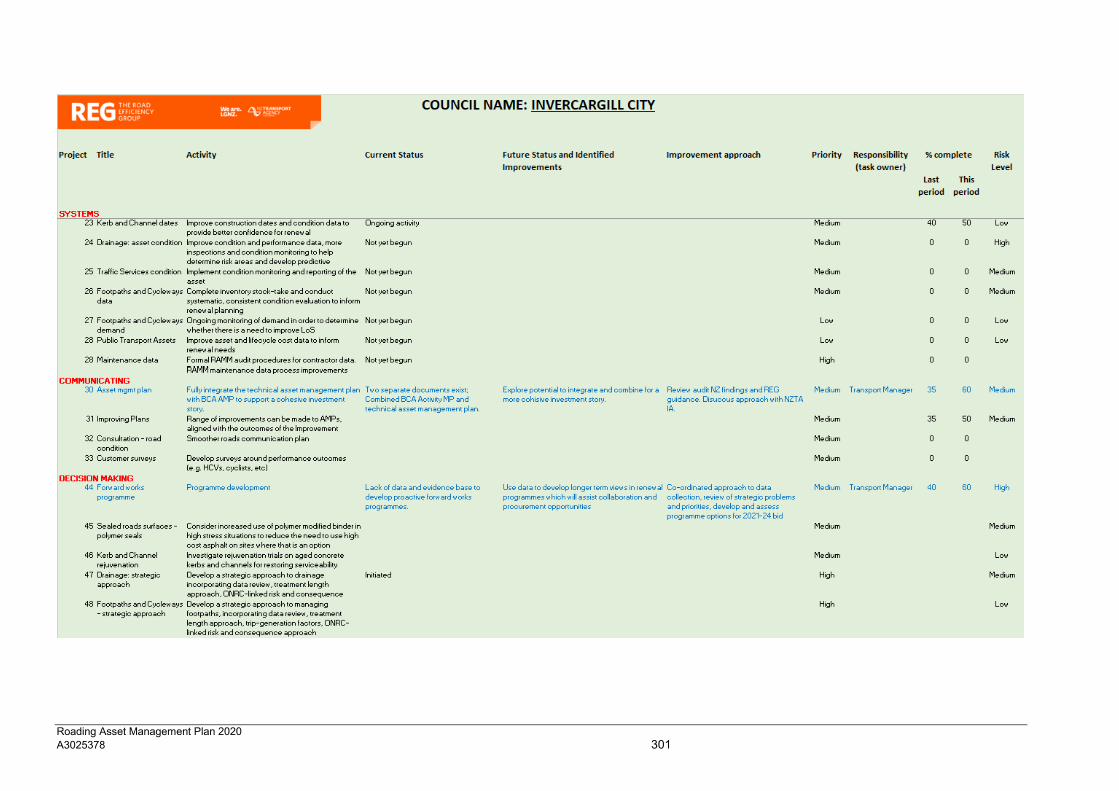
Roading Asset Management Plan 2020 A3025378 301
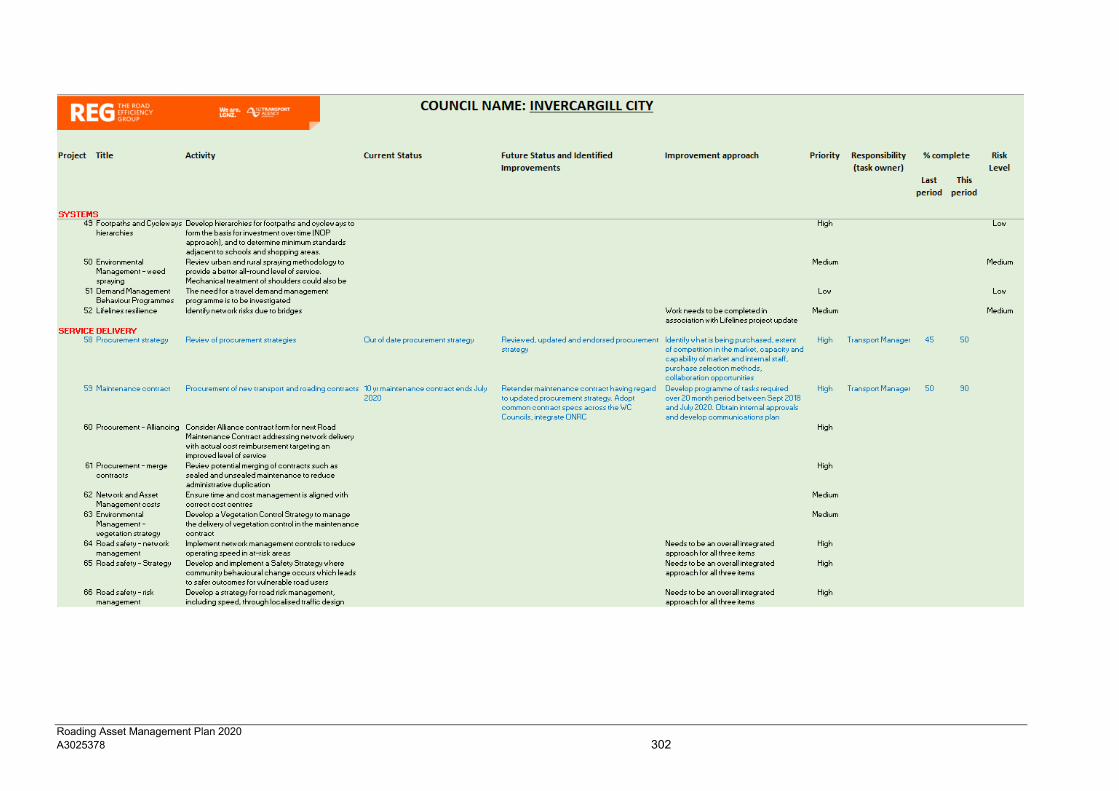
Roading Asset Management Plan 2020 A3025378 302
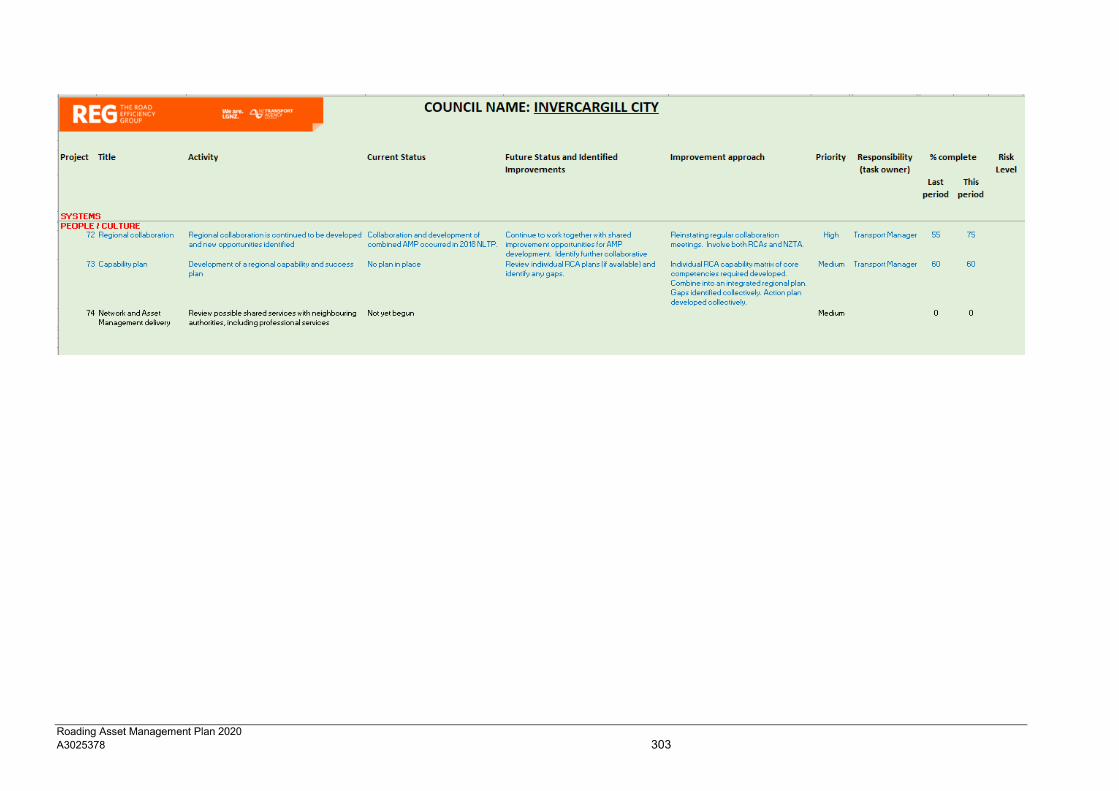
Roading Asset Management Plan 2020 A3025378 303
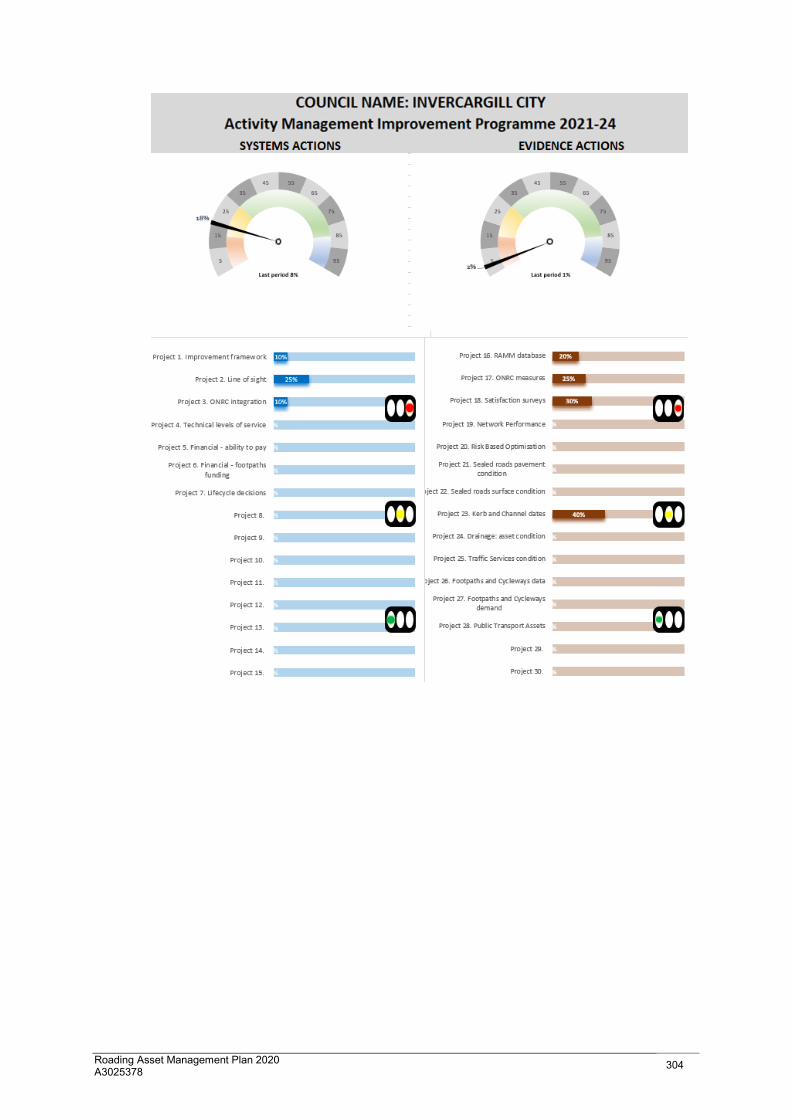
Roading Asset Management Plan 2020 A3025378 304
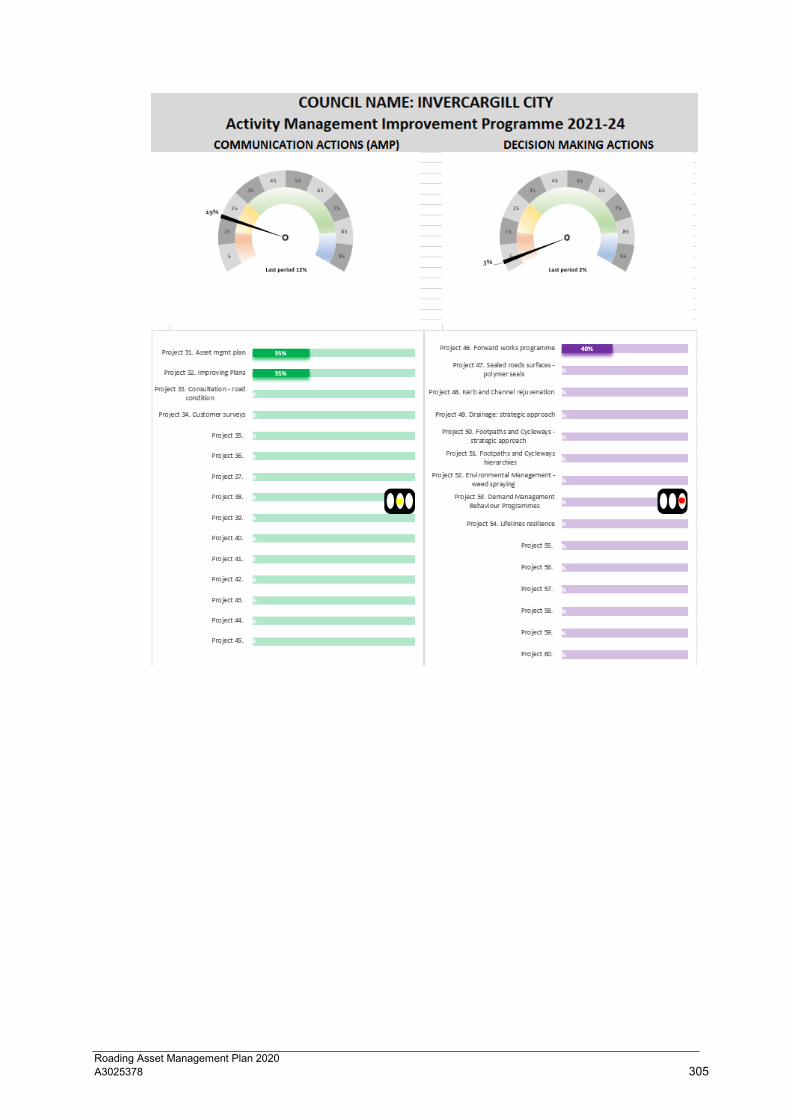
Roading Asset Management Plan 2020 A3025378 305
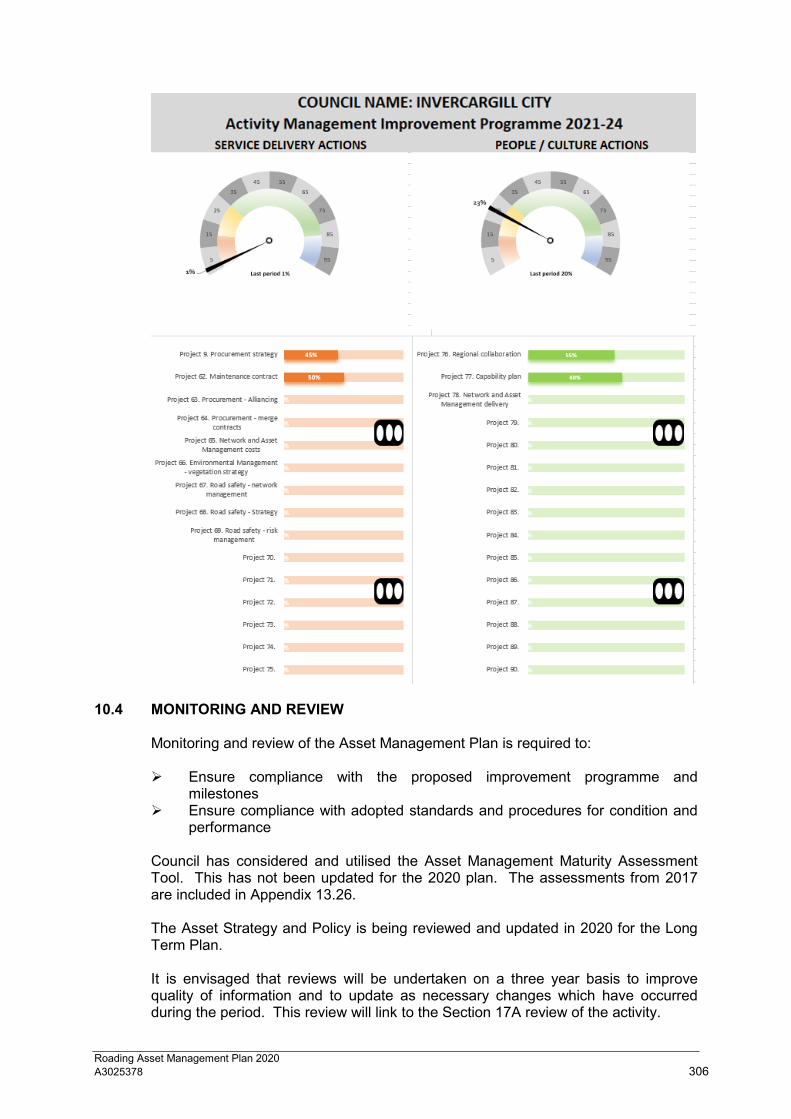
Roading Asset Management Plan 2020 A3025378 306
10.4 MONITORING AND REVIEW
Monitoring and review of the Asset Management Plan is required to: Ensure compliance with the proposed improvement programme and
milestones Ensure compliance with adopted standards and procedures for condition and
performance
Council has considered and utilised the Asset Management Maturity Assessment Tool. This has not been updated for the 2020 plan. The assessments from 2017 are included in Appendix 13.26. The Asset Strategy and Policy is being reviewed and updated in 2020 for the Long Term Plan. It is envisaged that reviews will be undertaken on a three year basis to improve quality of information and to update as necessary changes which have occurred during the period. This review will link to the Section 17A review of the activity.
Roading Asset Management Plan 2020 A3025378 307
To ensure the plan remains useful and relevant, the following ongoing process of asset management plan monitoring and activity review will be undertaken: Revisions of the Asset Management Plan following consultation and adoption
of the Long Term Plan. Review the Plan following NZTA advice on funding levels. Annually review and report on the progress of the Plan and associated
Improvement Programme. Internal Audits of asset management information to ensure the integrity and
cost-effectiveness of data collected. Periodic audits undertaken by external auditors to measure asset
management performance against “best practice”.
The annual review includes: Update of appropriate financial and valuation information when required. Update of funding implications and any asset condition generated from asset
management information systems. Update of status of the Improvement Programme. Set forward programmes for the Asset Plan development. Consider if customer service surveys are needed for information on assets.
The three yearly reviews include:
Undertake a Section 1 review of the delivery structure. Review of alignment of Asset Management Plan to organisational
management plan objectives, and required service levels. Review of structure and content of Asset Management Plan to incorporate
development of improved asset management philosophy and techniques. Update of valuation information on a three yearly basis. Alignment of the Plan with the NLTP. Review of the Organisation Structure to align with advances in the Better
Business Case approach.
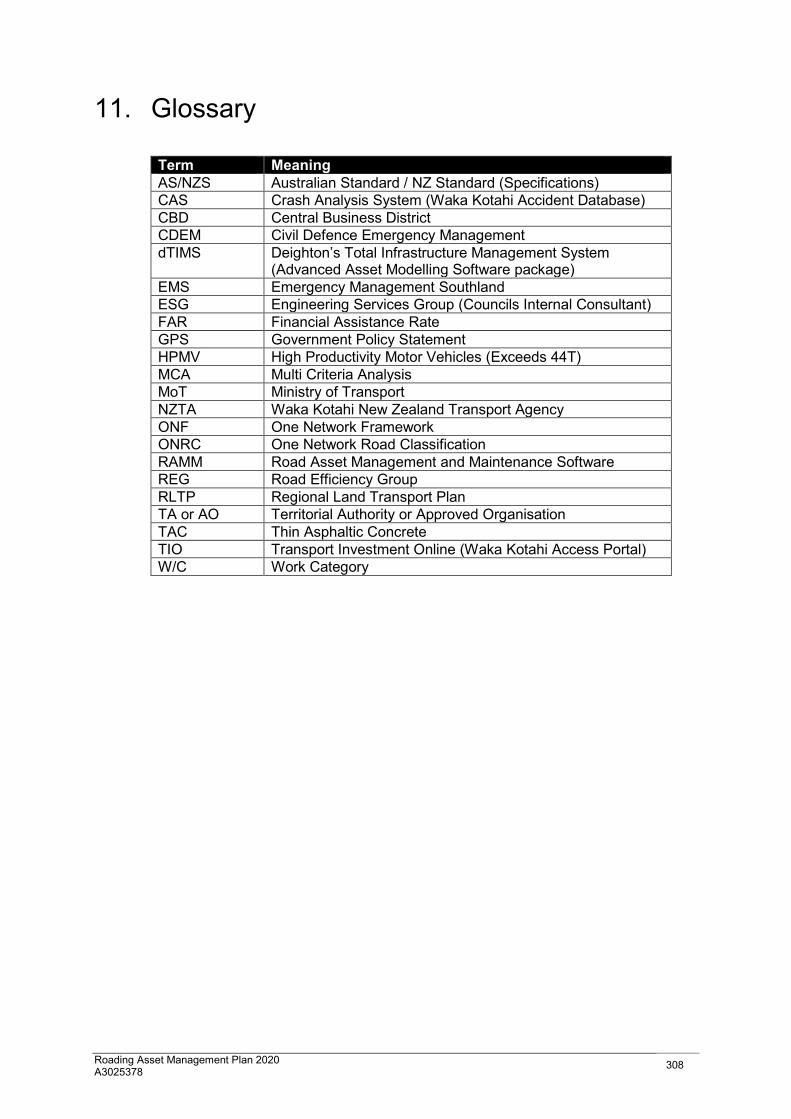
Roading Asset Management Plan 2020 A3025378 308
11. Glossary Term Meaning AS/NZS Australian Standard / NZ Standard (Specifications) CAS Crash Analysis System (Waka Kotahi Accident Database) CBD Central Business District CDEM Civil Defence Emergency Management dTIMS Deighton’s Total Infrastructure Management System
(Advanced Asset Modelling Software package) EMS Emergency Management Southland ESG Engineering Services Group (Councils Internal Consultant) FAR Financial Assistance Rate GPS Government Policy Statement HPMV High Productivity Motor Vehicles (Exceeds 44T) MCA Multi Criteria Analysis MoT Ministry of Transport NZTA Waka Kotahi New Zealand Transport Agency ONF One Network Framework ONRC One Network Road Classification RAMM Road Asset Management and Maintenance Software REG Road Efficiency Group RLTP Regional Land Transport Plan TA or AO Territorial Authority or Approved Organisation TAC Thin Asphaltic Concrete TIO Transport Investment Online (Waka Kotahi Access Portal) W/C Work Category
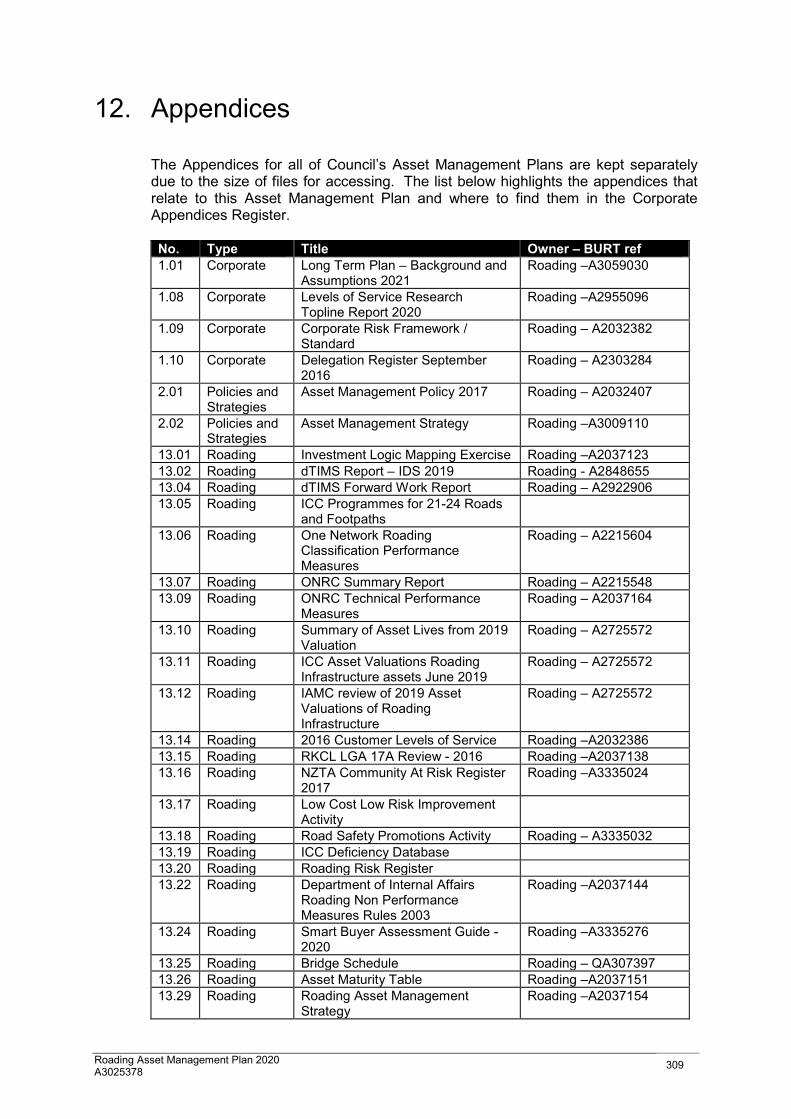
Roading Asset Management Plan 2020 A3025378 309
12. Appendices The Appendices for all of Council’s Asset Management Plans are kept separately due to the size of files for accessing. The list below highlights the appendices that relate to this Asset Management Plan and where to find them in the Corporate Appendices Register.
No. Type Title Owner – BURT ref 1.01 Corporate Long Term Plan – Background and
Assumptions 2021 Roading –A3059030
1.08 Corporate Levels of Service Research Topline Report 2020
Roading –A2955096
1.09 Corporate Corporate Risk Framework / Standard
Roading – A2032382
1.10 Corporate Delegation Register September 2016
Roading – A2303284
2.01 Policies and Strategies
Asset Management Policy 2017 Roading – A2032407
2.02 Policies and Strategies
Asset Management Strategy Roading –A3009110
13.01 Roading Investment Logic Mapping Exercise Roading –A2037123 13.02 Roading dTIMS Report – IDS 2019 Roading - A2848655 13.04 Roading dTIMS Forward Work Report Roading – A2922906 13.05 Roading ICC Programmes for 21-24 Roads
and Footpaths
13.06 Roading One Network Roading Classification Performance Measures
Roading – A2215604
13.07 Roading ONRC Summary Report Roading – A2215548 13.09 Roading ONRC Technical Performance
Measures Roading – A2037164
13.10 Roading Summary of Asset Lives from 2019 Valuation
Roading – A2725572
13.11 Roading ICC Asset Valuations Roading Infrastructure assets June 2019
Roading – A2725572
13.12 Roading IAMC review of 2019 Asset Valuations of Roading Infrastructure
Roading – A2725572
13.14 Roading 2016 Customer Levels of Service Roading –A2032386 13.15 Roading RKCL LGA 17A Review - 2016 Roading –A2037138 13.16 Roading NZTA Community At Risk Register
2017 Roading –A3335024
13.17 Roading Low Cost Low Risk Improvement Activity
13.18 Roading Road Safety Promotions Activity Roading – A3335032 13.19 Roading ICC Deficiency Database 13.20 Roading Roading Risk Register 13.22 Roading Department of Internal Affairs
Roading Non Performance Measures Rules 2003
Roading –A2037144
13.24 Roading Smart Buyer Assessment Guide - 2020
Roading –A3335276
13.25 Roading Bridge Schedule Roading – QA307397 13.26 Roading Asset Maturity Table Roading –A2037151 13.29 Roading Roading Asset Management
Strategy Roading –A2037154
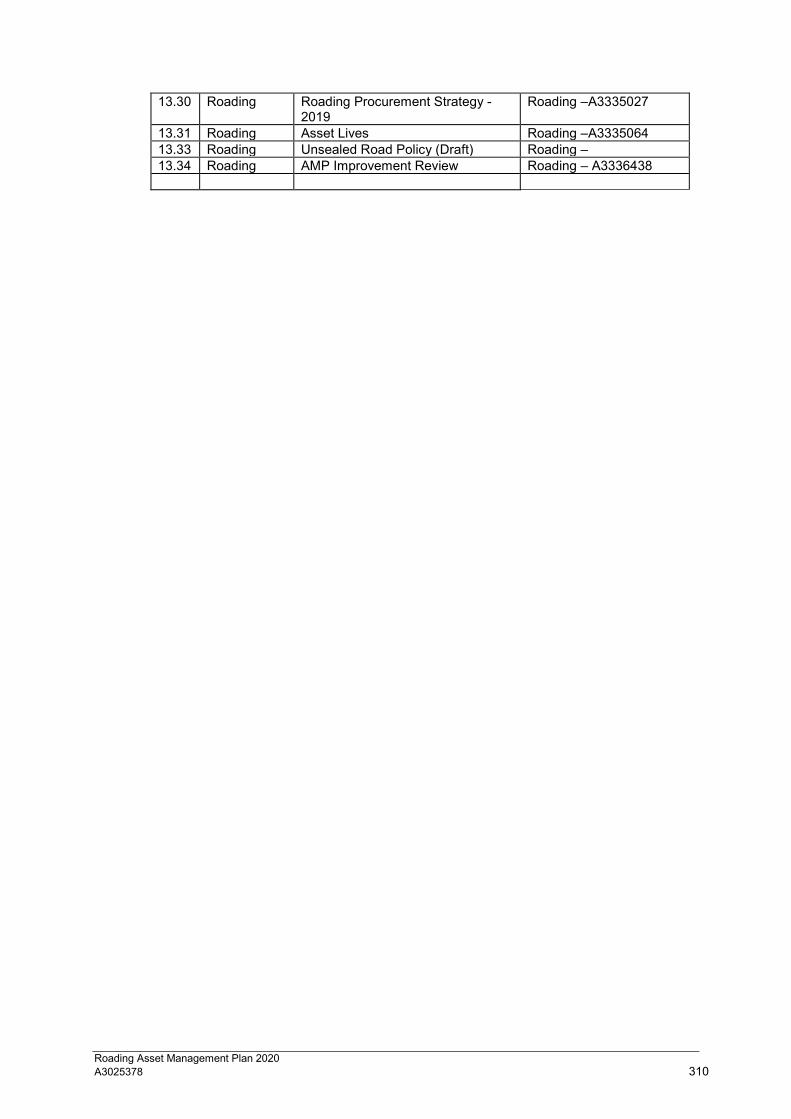
Roading Asset Management Plan 2020 A3025378 310
13.30 Roading Roading Procurement Strategy - 2019
Roading –A3335027
13.31 Roading Asset Lives Roading –A3335064 13.33 Roading Unsealed Road Policy (Draft) Roading – 13.34 Roading AMP Improvement Review Roading – A3336438
Related Documents