ROAD SAFETY STATISTICS-NEED FOR DATA DRIVEN &TARGETED ROAD SAFETY INTERVENTIONS.

Welcome message from author
This document is posted to help you gain knowledge. Please leave a comment to let me know what you think about it! Share it to your friends and learn new things together.
Transcript
ROAD SAFETY STATISTICS-NEED FOR DATA DRIVEN &TARGETED ROAD SAFETY INTERVENTIONS.

In the year 2013 a total of 3218 persons were fatally injured as a result of road crashes. This is compared to a total figure of 2907
in the year 2014. This represented a total decline of 9.66%.
2013 2014 Variance
3218 Fatally injured 2907 Fatally injured -9.66%

THE NUMBER OF ROAD FATALITIES SINCE 2005( Source- Kenya Police)
2005 2006 2007 2008 2009 2010 2011 2012 2013 2014
PEDESTRIANS 1242 1253 1370 1630 1755 1434 1545 1549 1482 1340
DRIVERS 251 291 273 326 435 307 289 290 284 268
PASSENGERS 590 715 840 592 1036 738 824 745 810 642
P/PASSENGERS 96 112 127 138 221 126 156 124 157 162
P/CYCLIST 310 310 276 352 322 240 173 127 134 104
M/CYCLIST 44 34 35 111 263 200 315 306 324 391
TOTAL 2533 2715 2921 3149 4032 3045 3302 3141 3218 2907

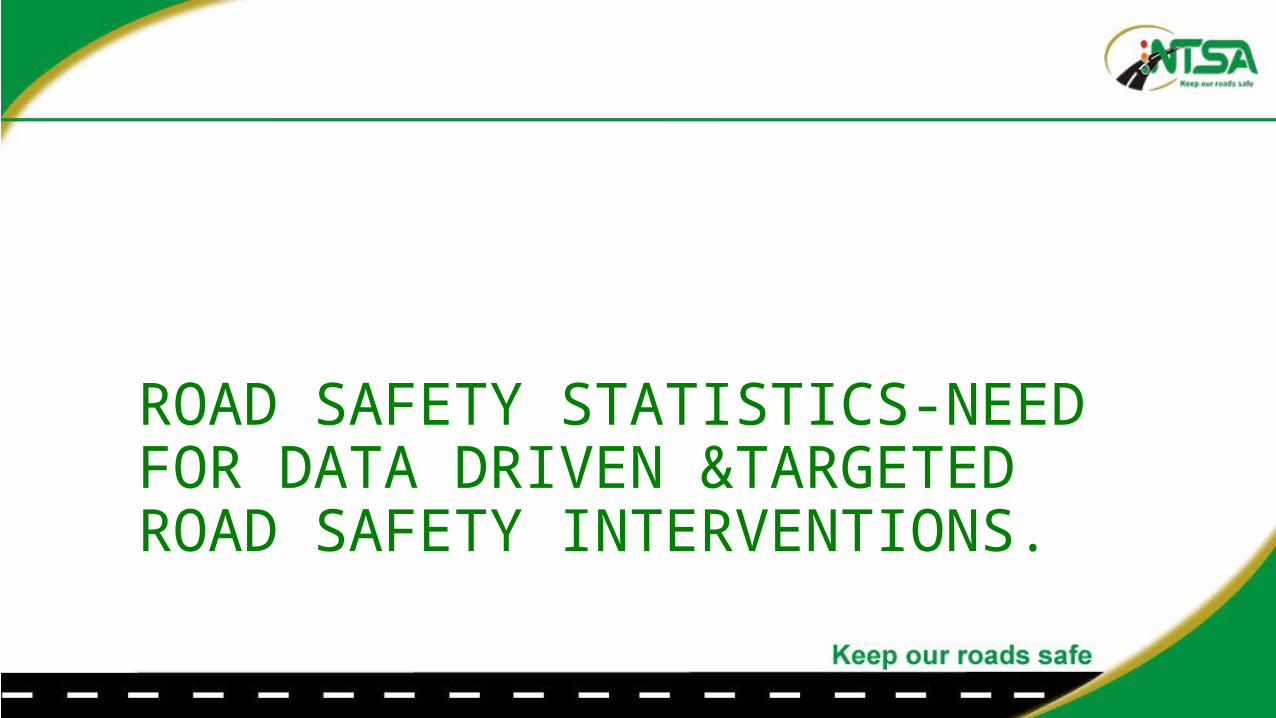
COMPARISON OF FATALITIES (UPTO 08 APRIL 2014/2015) 2015 2014 %VARPEDESTRIANS 44 335 2.69
DRIVERS 85 66 28.8
PASSENGERS 182 172 5.81
PILLION PASSENGERS 60 38 57.9
PEDAL CYCLISTS 19 22 -13.6
MOTORCYCLISTS 114 101 12.9
TOTAL 804 734 9.5
Comparative Bar Chart showing the Fatalities of 2014/2015 upto 08 APRIL
PEDESTRIANS DRIVERS PASSENGERS PILLION PASSENGERS PEDAL CYCLISTS MOTORCYCLISTS
2015 344 85 182 60 19 114
2014 335 66 172 38 22 101
344
85
182
60
19
114
335
66
172
3822
101
8-Apr2015 2014
CLASSSES OF VICTIMS
FATA
LITI
ES

Pie Chart comparison of fatalities of 2014/2015(Upto 08 April of each year)
Upto APRIL 08 2015 Upto APRIL 08 2014
PEDESTRIANS43%
DRIVERS11%
PASSENGERS23%
PILLION PASSENGERS7%
PEDAL CYCLISTS
2%
MO-TORCY-CLISTS
14%
PEDESTRIANS46%
DRIVERS9%
PASSENGERS23%
PILLION PAS-SEN-GERS
5%
PEDAL CYCLISTS
3%
MO-TORCY-CLISTS
14%

INJURIES COMPARISON OF 2014/15 UPTO 08 MARCH
FATAL SERIOUS SLIGHT FATAL SERIOUS SLIGHT FATAL SERIOUS SLIGHT FATAL SERIOUS SLIGHT FATAL SERIOUS SLIGHT FATAL SERIOUS SLIGHT PEDESTRIANS DRIVERS PASSENGERS PILLION PASS PEDAL CYC M/CYCLISTS
0
100
200
300
400
500
600
700
800
900
335 331
54 66
132
54
172
551
716
38
126
4822 34
11
101
185
35
344
246
80 85
14091
182
522
845
60 7533 19 16 3
114140
35
1 Jan-8 April 2014 1 Jan-8 April 2015

24 HOUR DISTRIBUTION OF FATAL CRASHES
0 5 10 15 20 25 300
50
100
150
200
250
Distribution of Fatal Crashes victims according to time-2014
Time in 24 hours
No.
of v
ictim
s

• Most of fatal road traffic Crashes occur at between 1800 HRS to 2200 hours.• Reasons:• Reduced enforcement during these times?• High speed traffic ?• Motorcycles operate in the midst of darkens with no right
gear –reflective jackets hence not seen by fast flowing traffic ? • Pedestrians cross at the non designated areas and
easily get knocked by speeding vehicles?• Drunken Driving, Drunken Riding and Drunken Walking?

Distribution across the year in the last 3 years
JAN FEB MARCH APRIL MAY JUNE JULY AUG SEPT OCT NOV DEC0
50
100
150
200
250
300
350
Distribution of fatal crashes across the calenderyear in the last 3 years.
2012 2013 2014
Month
No.
of F
taliti
es

Comments• April 2014 was the time with lowest recorded
crashes in the last 3 years• General peak of road traffic crashes in the months
of Dec-Jan, August, and April in 2012 and 2013.This roughly translates to holidays.
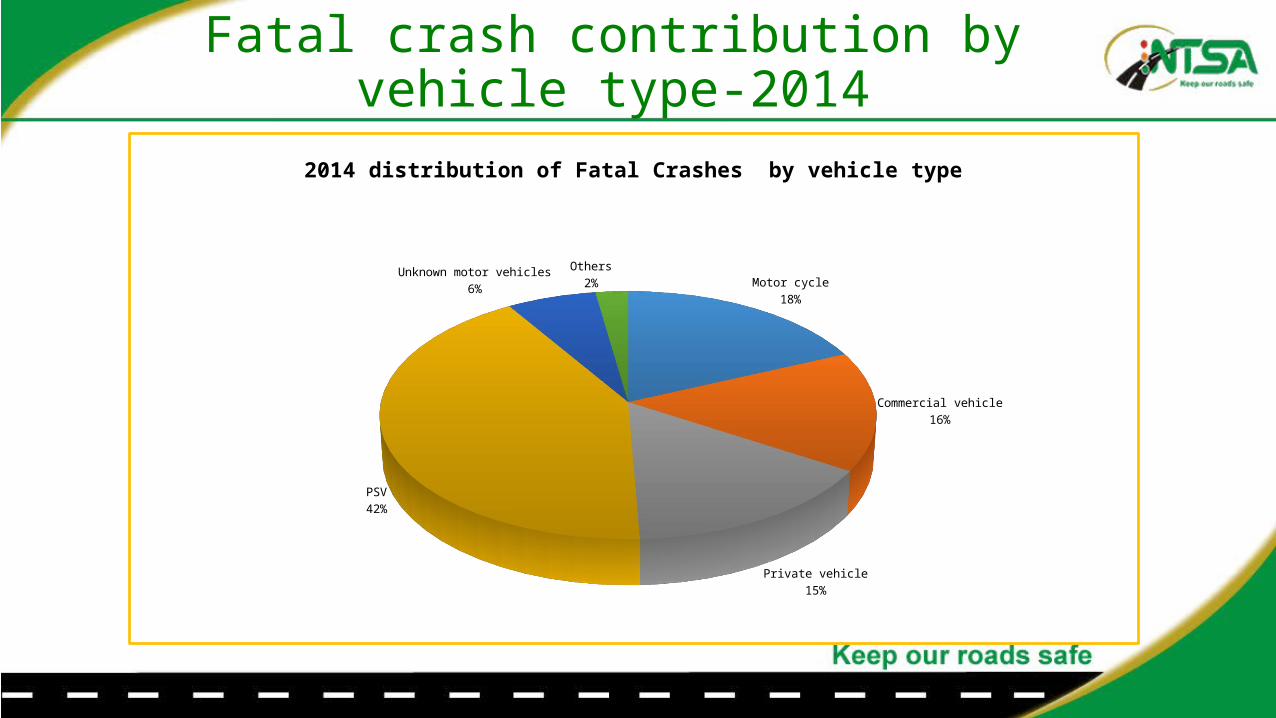
Fatal crash contribution by vehicle type-2014
Motor cycle18%
Commercial vehicle16%
Private vehicle15%
PSV42%
Unknown motor vehicles6%
Others2%
2014 distribution of Fatal Crashes by vehicle type

Vehicle Type..• PSV contributes to fatal Road Crashes more than
any vehicle type• Followed by Motorcycles! And noted to be
increasing over the last few years• Combined contributions of motorcycles and PSV is
60%.• The followed by HCV and Private at 16% and 15 %
respectively.
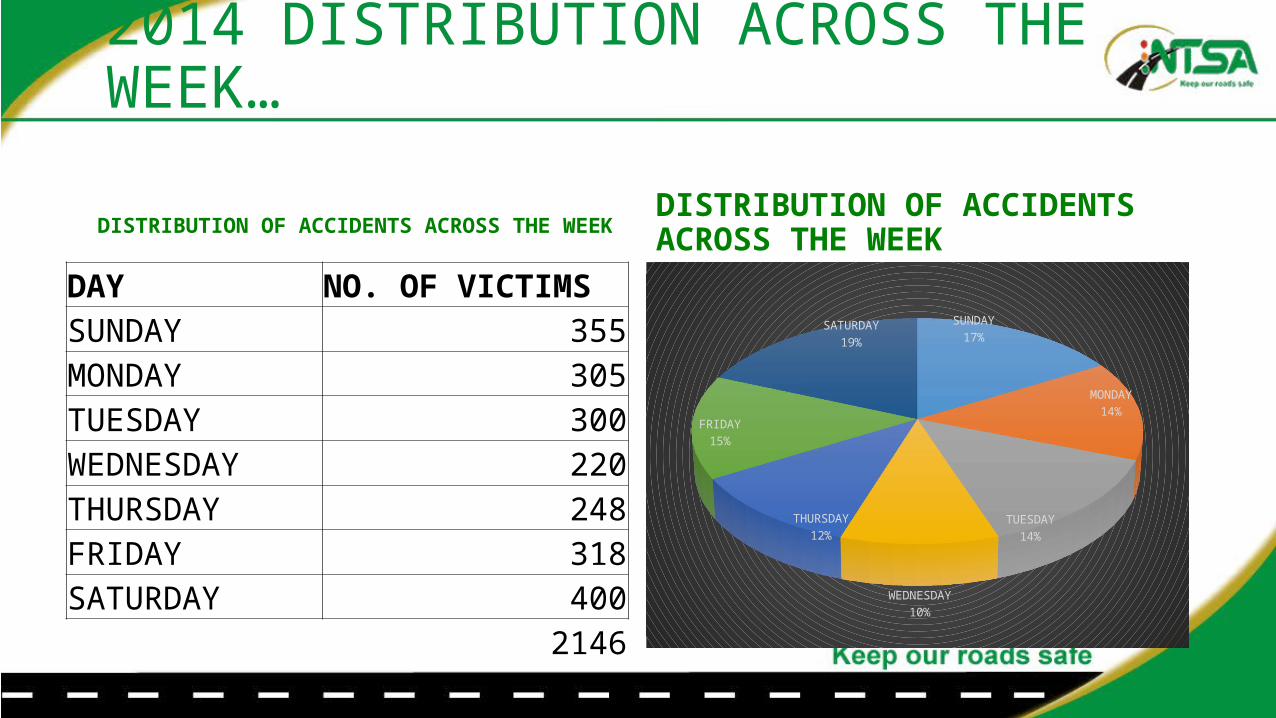
2014 DISTRIBUTION ACROSS THE WEEK…
DISTRIBUTION OF ACCIDENTS ACROSS THE WEEK
DAY NO. OF VICTIMSSUNDAY 355MONDAY 305TUESDAY 300WEDNESDAY 220THURSDAY 248FRIDAY 318SATURDAY 400
2146
DISTRIBUTION OF ACCIDENTS ACROSS THE WEEK
SUNDAY17%
MONDAY14%
TUESDAY14%
WEDNESDAY10%
THURSDAY12%
FRIDAY15%
SATURDAY19%
ACROSS THE WEEK…• Saturday has the highest fatalities followed by
Sunday.• Weekend contributes the highest number of
fatalities with a combined figure of 35 %• Friday contributes 15% and Monday 14%.• Possible Reasons:
• High Travel numbers during this time hence increased exposure
• High Speed travel especially on the highways• Drink Driving, Drink Walking, Drink Riding..• Reduced enforcement.
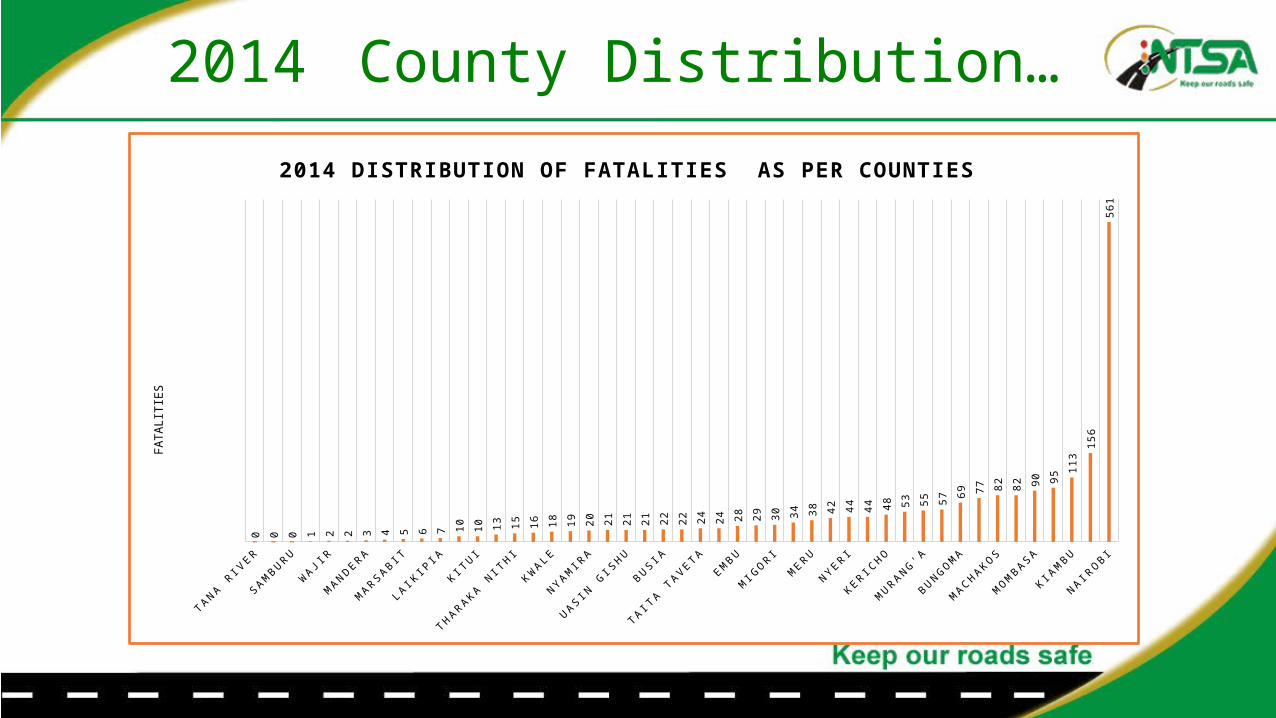
2014 County Distribution…
TANA RI V
ER
L AMU
SAMB UR U
TU RK ANA
WAJ I R
EL G EYO MAR AK W
ET
MAND ER A
WEST P
OK OT
MAR SAB I T
I SI O
L O
L A I KI P
I A
G AR I SSA
K I TU I
N YAND AR UA
TH AR AK A NI T
H I
B AR I NG O
K WAL E
V I HI G
A
NYAMI R
A
TR ANS NZO I A
UAS I N G
I SH U
NAND I
B U S I A
H OMA B
AY
TA I TA T
AVETAK I S
I I
EMB U
B OMET
MI G
OR I
K A J I AD O
MER U
S I AYA
NYER I
K I RI N
YAG A
K ER I CH O
NAR OK
MUR ANG 'A
K I LI F
I
B UNG OMA
K AK AMEG A
MAC H AK OS
MAK UEN I
MOM
B ASA
K I SU M
U
K I AM
B U
NAK UR U
NAI ROB I
0 0 0 1 2 2 3 4 5 6 7 10 10 13 15 16 18 19 20 21 21 21 22 22 24 24 28 29 30 34 38 42 44 44 48 53 55 57
69 77 82 82 90 95
113
156
561
2014 DISTRIBUTION OF FATALITIES AS PER COUNTIES FA
TALI
TIES

Top 10 Counties -2014
KILIFI4% BUNGOMA
5%KAKAMEGA
6%
MACHAKOS6%
MAKUENI6%
MOMBASA7%
KISUMU7%
KIAMBU8%NAKURU
11%
NAIROBI41%
2014 Top 10 Counties Contributing To Fatalities

High risk roads -2014Nakuru FATALITIES • Eldoret Nakuru 33• Nairobi Nakuru 35
Nairobi• North Airport Road 18• Eaastern By Pass 28• Jogoo Road 30• Ngong Road 13• Mbagathi way 8• Waiyaki way 50• Mombasa Road 77• Thika Super Highway 66
Machakos• Nairobi Mombasa Road 26• Machakos Kitui 8

561 Fatal Injury in NBI in 2014
ROAD FATALITIES North Airport Road 18Eaastern By Pass 28Jogoo Road 30Ngong Road 13Mbagathi way 8Waiyaki way 50Mombasa Road 77Thika Super Highway 66Rest of NBI roads 271

Nairobi roads and RTI• 8 main roads in Nairobi contribute more than half
of the fatalities in Nairobi in 2014• Need to have measures targeted on these roads in
a sustainable way• With the completion of the other high speed and
high impact roads in Nairobi(by passes etc), there is a risk of increased serious and fatal injuries • The planned removal of the round about in Nairobi
is a potential area which fatal and serious injury may increase..

Distribution by Gender
Male51%
Female11%
Unknown38%
2014 Distribution By Sex
Male Female Unknown
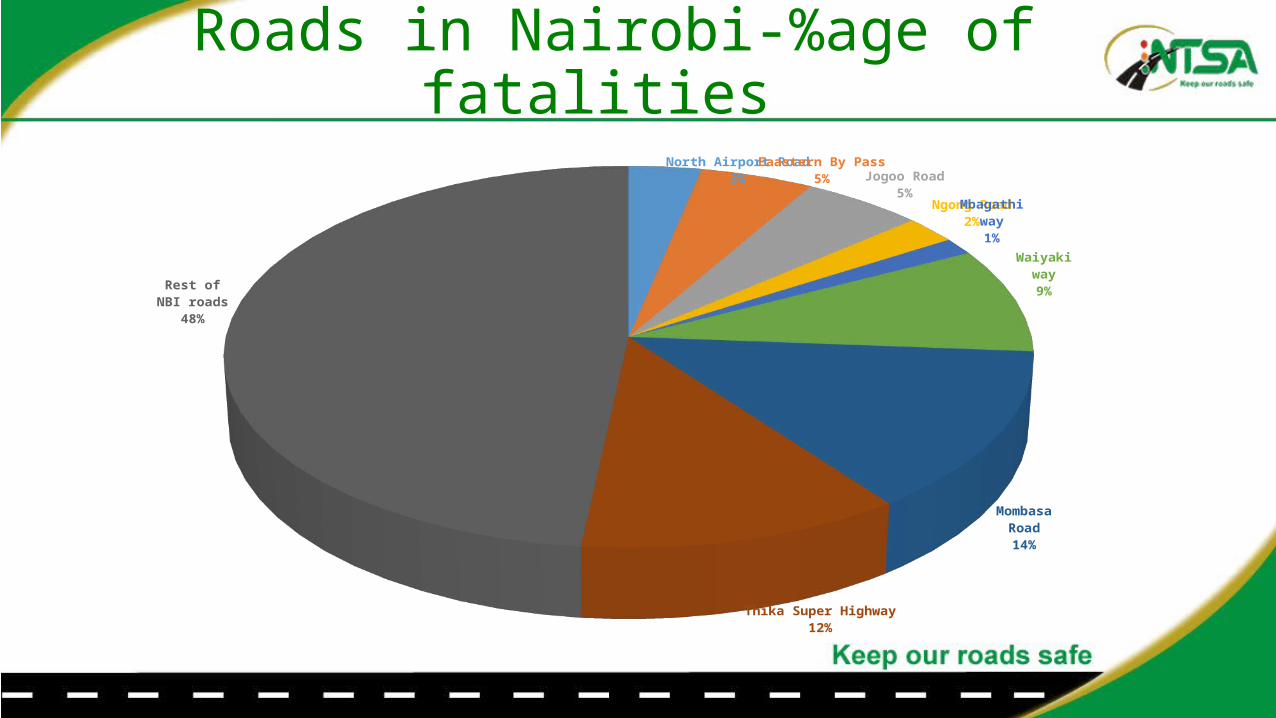
Roads in Nairobi-%age of fatalities North Airport Road
3%Eaastern By Pass
5%Jogoo Road
5%Ngong Road
2%Mbagathi way1%
Waiyaki way9%
Mombasa Road14%
Thika Super Highway12%
Rest of NBI roads48%
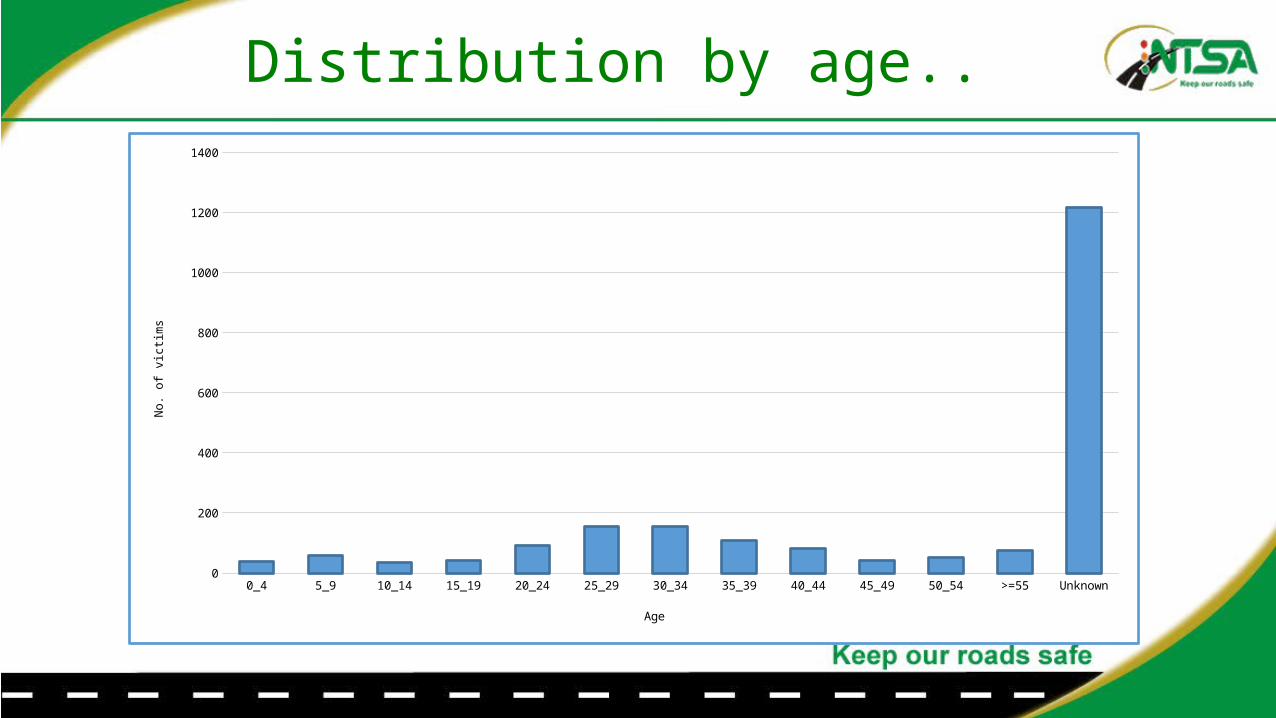
Distribution by age..
0_4 5_9 10_14 15_19 20_24 25_29 30_34 35_39 40_44 45_49 50_54 >=55 Unknown0
200
400
600
800
1000
1200
1400
Age
No.
of v
ictim
s
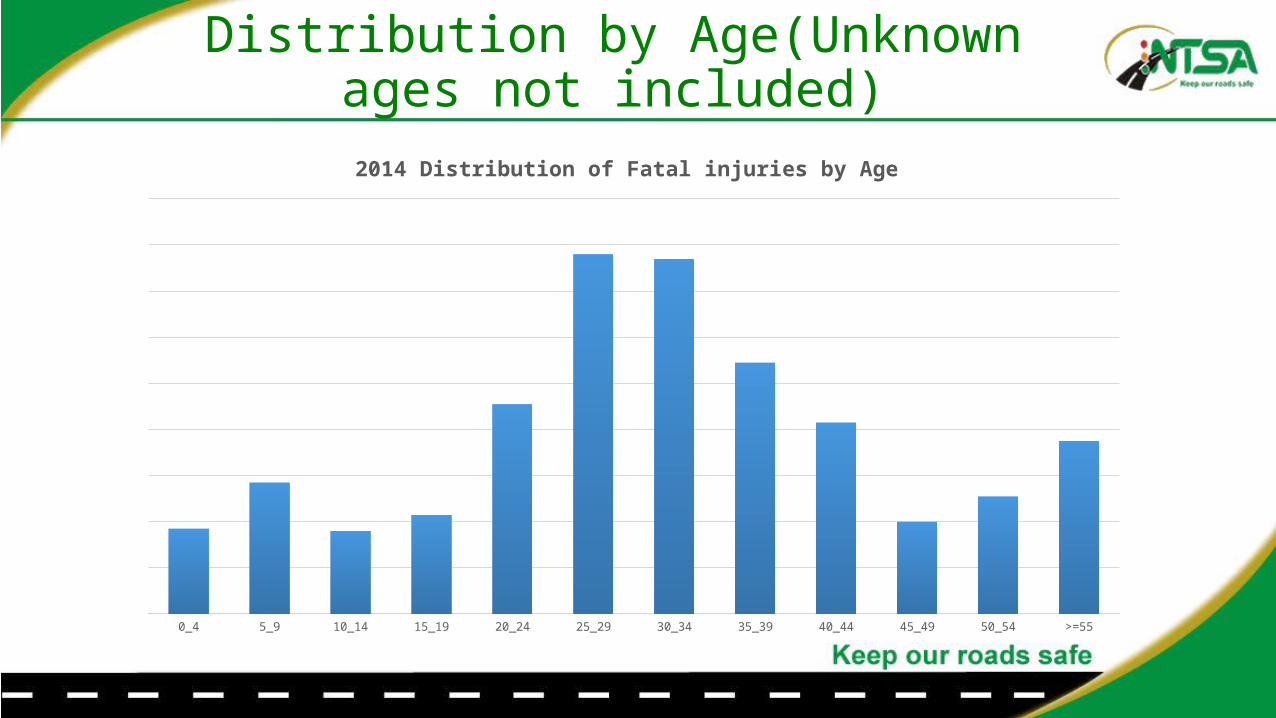
Distribution by Age(Unknown ages not included)
0_4 5_9 10_14 15_19 20_24 25_29 30_34 35_39 40_44 45_49 50_54 >=55
2014 Distribution of Fatal injuries by Age
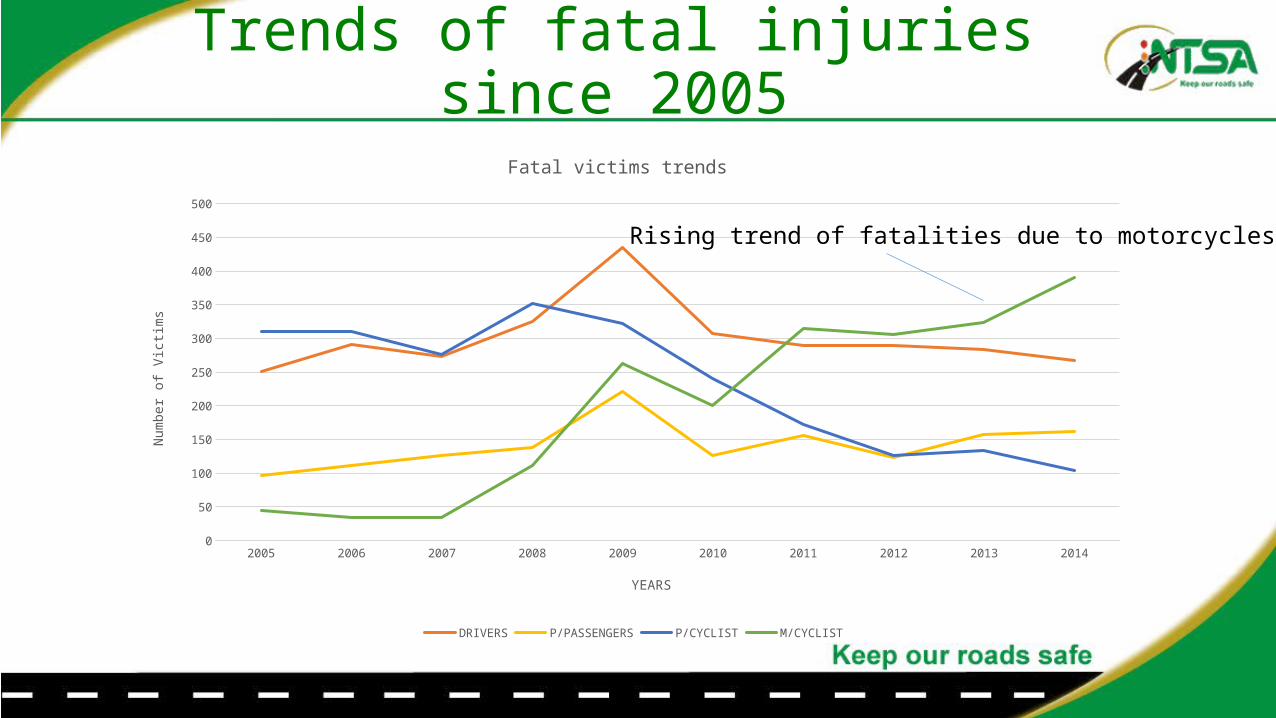
Trends of fatal injuries since 2005
2005 2006 2007 2008 2009 2010 2011 2012 2013 20140
50
100
150
200
250
300
350
400
450
500
Fatal victims trends
DRIVERS P/PASSENGERS P/CYCLIST M/CYCLIST
YEARS
Num
ber o
f Victi
ms
Rising trend of fatalities due to motorcycles.

Fatality trends of motorcycles and pedal cycles
2005 2006 2007 2008 2009 2010 2011 2012 2013 20140
50
100
150
200
250
300
350
400
450
Relationship between deaths due to pedal cyclistcs and fatalities due to motorcyclists in the last 10 years
P/CYCLIST M/CYCLIST
YEARS
Num
ber o
f Victi
ms
CONCLUSIONS• Need to have data driven interventions and
programmes• Data shows there is potential to have targeted
interventions based on• Vehicle Type• Victims/Road User Type• Time of the Day• Time of the Week• Month of the year• High Risk Roads• County/area• Gender of the Road User• Age of the road users
Thank you
Related Documents