Road safety lecture, University of Brescia, 26 th October 2011 1/40 Road safety data and indicators Prof. Dr. Péter Holló KTI Institute for Transport Sciences Non- profit Ltd. Széchenyi István University

Road safety data and indicators Prof. Dr. Péter Holló
Dec 30, 2015
Road safety data and indicators Prof. Dr. Péter Holló KTI Institute for Transport Sciences Non-profit Ltd. Széchenyi István University. Content. 1.)Some basic considerations 2.)Road safety assessment 3 . )Road safety performance indicators according to main risk factors - PowerPoint PPT Presentation
Welcome message from author
This document is posted to help you gain knowledge. Please leave a comment to let me know what you think about it! Share it to your friends and learn new things together.
Transcript
Road safety lecture, University of Brescia, 26th October 2011 1/40
Road safety data and indicators
Prof. Dr. Péter Holló
KTI Institute for Transport Sciences Non-profit Ltd.Széchenyi István University
Road safety lecture, University of Brescia, 26th October 2011 2/40
Content
1.) Some basic considerations
2.) Road safety assessment
3.) Road safety performance indicators according to main risk factors
3.1. alcohol related accidents 3.2. safety belt and child restraints 3.3. speed 3.4. child injury prevention from road accidents
4.) Conclusions

Road safety lecture, University of Brescia, 26th October 2011 3/40
Content
5.) Remarks on the data set
6.) Remarks to the questionnaire
7.) Conclusions
8.) Some details of the road safety
assessment
9.) How to go further?
Road safety lecture, University of Brescia, 26th October 2011 4/40
1. Some basic considerations
Task of this WP 5 (Evaluation, monitoring):
- to monitor (follow-up) the implementation of the local rs programme
- to evaluate the effects
We do not deal with comparison and ranking of countries or pilot areas.

Road safety lecture, University of Brescia, 26th October 2011 5/40
1. Some basic considerations /2
We would like to monitor the (hopefully positive) changes and to prove the benefits arising from programme implementation.In order to be able to do this we have to repeat the situational assessment after the implementation of the programme.(So-called “before-after” comparison).
It is clear that only the numbers of accidents/victims and the exposure data are not enough.
We have to evaluate the efforts taken in order to improve the road safety situation.
Therefore we need rs performance indicators too.
Road safety lecture, University of Brescia, 26th October 2011 6/40
1. Some basic considerations /3
At this moment we have only national performance indicators.In this project we need local performance indicators.These can be measured, observed or collected.The methodology of performance indicators can be found in: ETSC publications (www.etsc.eu) SafetyNet project. (www.erso.eu)* Road Safety Observatory of EU (www.erso.eu) PIN project of ETSC (www.etsc.eu)
* theory and practice (manual for data collection)
Road safety lecture, University of Brescia, 26th October 2011 7/40
2. Road safety assessment
what are the realistic indicators to monitor?what are the realistic indicators to use for evaluation?
The main risk factors:alcohol related road crashessafety belt and child restrainsspeedchild injury prevention from road
crashes, etc.
Road safety lecture, University of Brescia, 26th October 2011 8/40
3. Road safety performance indicators (SPIs) according to main risk factors
3.1 alcohol related accidentsIn the SafetyNet project the following SPIs have been proposed on alcohol and drugs:
1. Number and percentage of severe and fatal Injuries resulting from road accidents
involving at least one active road user impaired by psychoactive substance.
2. Percentage of fatalities resulting from accidents involving at least one driver impaired by alcohol.
3. Percentage of fatalities resulting from accidents involving at least one driver impaired by drugs other than alcohol.(See details on http://erso.swov.nl/data/content/spis_on_alcohol_and_drugs.htm)

Road safety lecture, University of Brescia, 26th October 2011 9/40
3. Road safety performance indicators (SPIs) according to main risk factors/2
3.2. safety belt and child restraintsInternational or regional comparisons of protective systems’ usage rates are important tools for recognising deficiencies, setting priorities and stimulating efforts at political level.

Road safety lecture, University of Brescia, 26th October 2011 10/40
3. Road safety performance indicators (SPIs) according to main risk factors/3
The suggested SPIs in the SafetyNet project:1. Daytime wearing rates of safety belts
in front seatsin rear seatschild restraint use in passenger cars (for different vehicle categories)
2. Daytime wearing rates of crash helmetscyclistsmoped ridersmotorcyclists
(See details on: http://erso.swov.nl/data/content/spis_on_protective_systems.htm)

Road safety lecture, University of Brescia, 26th October 2011 11/40
3. Road safety performance indicators (SPIs) according to main risk factors/4
3.3. SpeedThe SPIs developed here, are: mean speed, standard deviation, 85% speed % of drivers exceeding the speed limit(for different road types, vehicle types, periods of day and periods of week, i.e. weekdays and weekends.)
(See details on: http://erso.swov.nl/data/content/spis_on_speed.htm)Speed is of basic importance from the point of view of vulnerable road users as well (also important area in SOL)
Road safety lecture, University of Brescia, 26th October 2011 12/40
3. Road safety performance indicators (SPIs) according to main risk factors/5
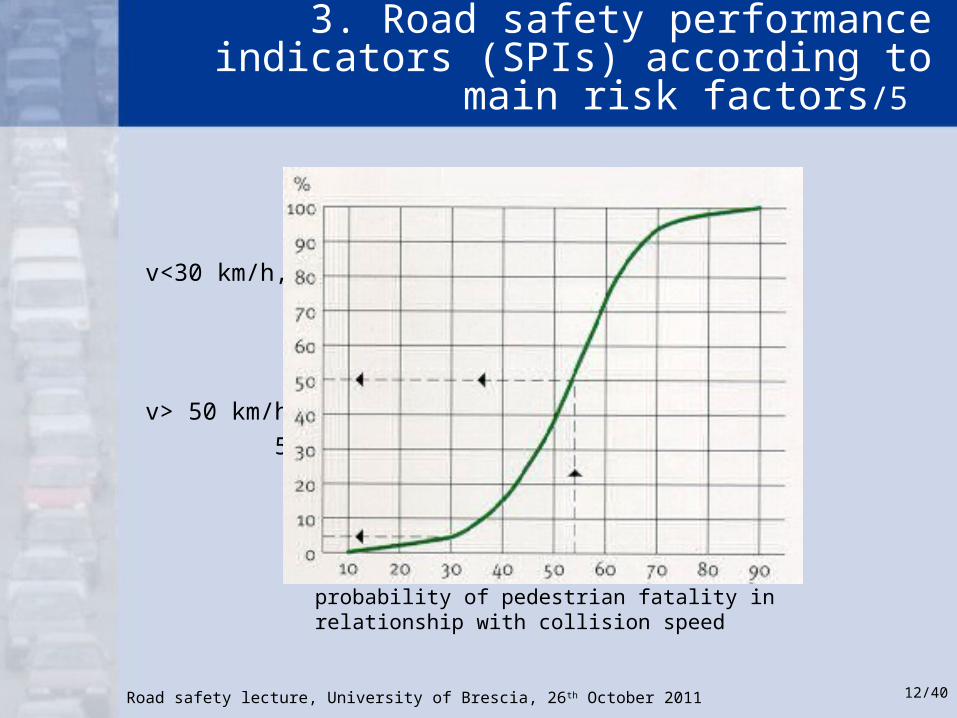
v<30 km/h,
5%
v> 50 km/h,
50%
probability of pedestrian fatality inrelationship with collision speed
Road safety lecture, University of Brescia, 26th October 2011 13/40
3. Road safety performance indicators (SPIs) according to main risk factors/6
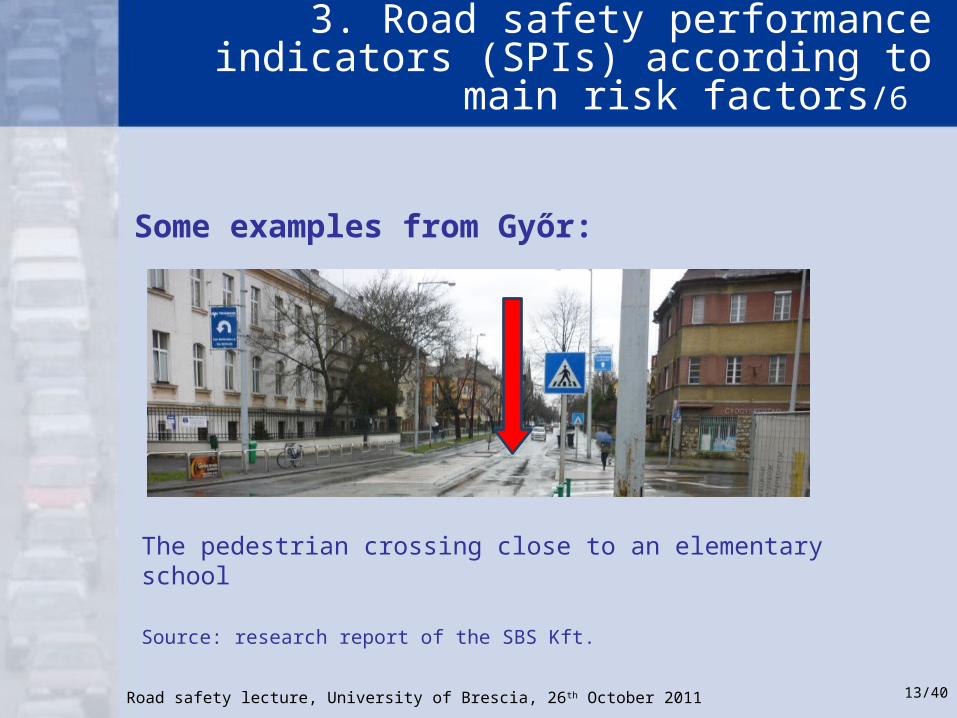
The pedestrian crossing close to an elementary school
Source: research report of the SBS Kft.
Some examples from Győr:
Road safety lecture, University of Brescia, 26th October 2011 14/40
3. Road safety performance indicators (SPIs) according to main risk factors/7
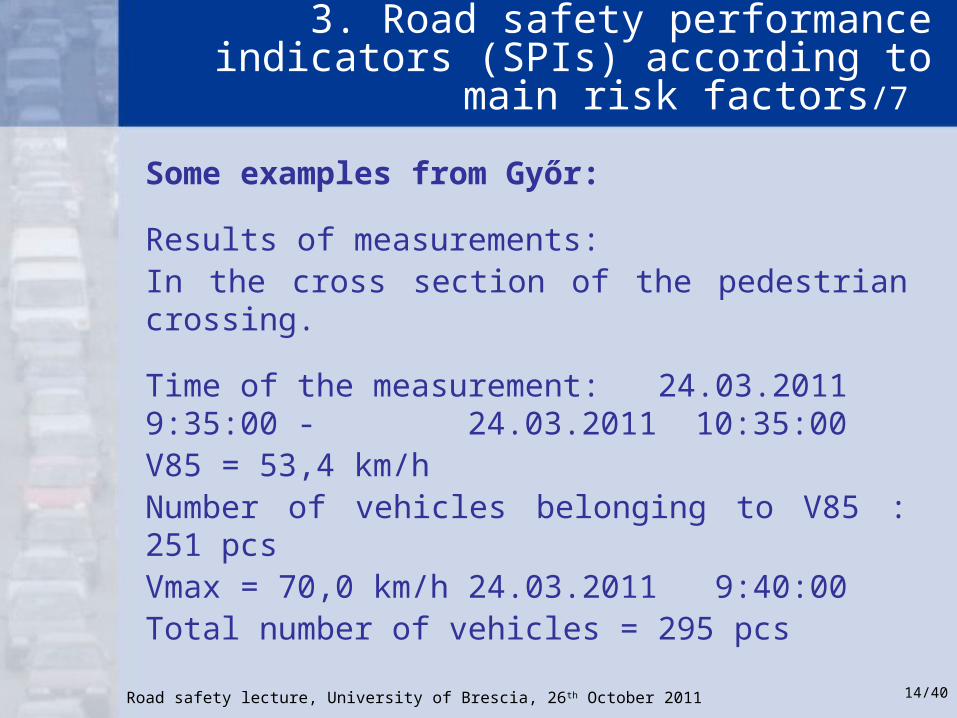
Some examples from Győr:
Results of measurements:In the cross section of the pedestrian crossing.
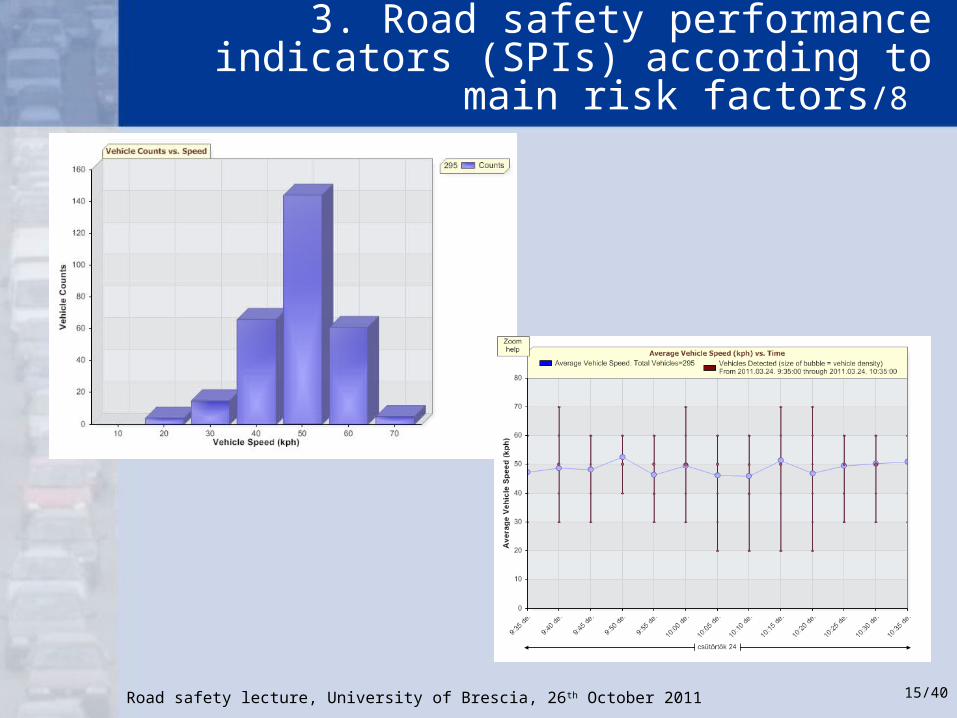
Time of the measurement: 24.03.2011 9:35:00 - 24.03.2011 10:35:00V85 = 53,4 km/hNumber of vehicles belonging to V85 : 251 pcsVmax = 70,0 km/h 24.03.2011 9:40:00Total number of vehicles = 295 pcs
Road safety lecture, University of Brescia, 26th October 2011 15/40
3. Road safety performance indicators (SPIs) according to main risk factors/8
Road safety lecture, University of Brescia, 26th October 2011 16/40
3. Road safety performance indicators (SPIs) according to main risk factors/9
Speed measurement results are available at the police too, but we need measurements in the free traffic flow first of all.Not only the speed level is important from the point of view of safety, but the speed distribution too. (Homogeneity)In traffic engineering the 85% speed is used. (The speed under which 85 percent of traffic is travelling).The aim is not only to decrease the speed level, but the great speed differences too, in other words to reach a more homogeneous speed distribution.

Road safety lecture, University of Brescia, 26th October 2011 17/40
3. Road safety performance indicators (SPIs) according to main risk factors/10
3.4. child injury prevention from road accidents
In the “Hungarian National Action Plan on Child and Youth Safety” the following indicators are used to monitor the improvement of the road traffic safety of children (0-14 years of age):1. The rate of serious and fatal injuries resulting
from road traffic accidents in the 0-14 age group, by age group and role
2. The percentage of children travelling in child safety seat, by age group
3. The percentage of children using safety belts, by age group

Road safety lecture, University of Brescia, 26th October 2011 18/40
3. Road safety performance indicators (SPIs) according to main risk factors/11
4. The percentage of children wearing protective helmets, by age group
5. The percentage of children wearing reflective vests when cycling, by age group
Road safety lecture, University of Brescia, 26th October 2011 19/40
4. Conclusions
The main aim of SOL is the capacity development, the improvement of the human factor (education, campaigns, etc.)Therefore the behaviour oriented performance indicators are of basic importance, such as:
- safety belt wearing rates- percentage of drivers who are exceeding the speed limit- percentage of drivers who take part in traffic under the influence of alcohol

Road safety lecture, University of Brescia, 26th October 2011 20/40
4. Conclusions /2
Important further indicators could be:
- number of drivers punished for speeding - number of drivers punished for drinking and driving- number of drivers punished for non-wearing of the safety belts or non using the child restraints, etc.
(National data are available in ETSC publications)
Road safety lecture, University of Brescia, 26th October 2011 21/40
5. Remarks on the basic data set
• The suggested indicators for evaluation of the local RS programmes have already been elaborated.
• Their details were reported in my two last presentations (WP5 update – Evaluation, monitoring, Warsaw, 1-3 March 2011, Road Safety assessment: risk factors and indicators, Munich, 12 May 2011)
• It is obvious that we have to use the same indicators at the end of the project as before the programme implementation.(Before – after comparison)
Road safety lecture, University of Brescia, 26th October 2011 22/40
5. Remarks on the basic data set /2
• The present set of indicators for the road safety assessment have been elaborated in close cooperation with ITS.
• The present set of indicators is a compromise between the perfect solution (theory) and the given possibilities (practice, deadline)
• Unfortunately some data are lacking or are not available in the necessary form.
Road safety lecture, University of Brescia, 26th October 2011 23/40
6. Remarks to the questionnaire
1) It is not clear what does “collisions” mean? Fact: everyone creates new definitions. Suggestion: we should use the definitions of international databases or international literature. For example, in connection with collisions one can speak about single-vehicle or multi-vehicle accidents.2) The “collisions” could be entirely different. Suggestion: accident types have to be used. For example: head-on collisions, rear-end collisions, etc.3) The pedestrian accidents are also collisions between motor vehicle and pedestrian.

Road safety lecture, University of Brescia, 26th October 2011 24/40
6. Remarks to the questionnaire /2
As risk indicator the mortality rate (killed/100 000 inhabitants) has been selected.Fact: this indicator alone cannot be used for international comparison without distortion.
Not the number of inhabitants but the level of motorisation (motor vehicles /1000 inhabitants) is decisive from the point of view of road safety. This indicator does not take into consideration the level of motorisation.
(Unfortunately ETSC uses only this indicator for international comparisons)
The mortality rate can be used for the “measurement” of the development. In form of time series it is a reasonable indicator.
Road safety lecture, University of Brescia, 26th October 2011 25/40
6. Remarks to the questionnaire /3
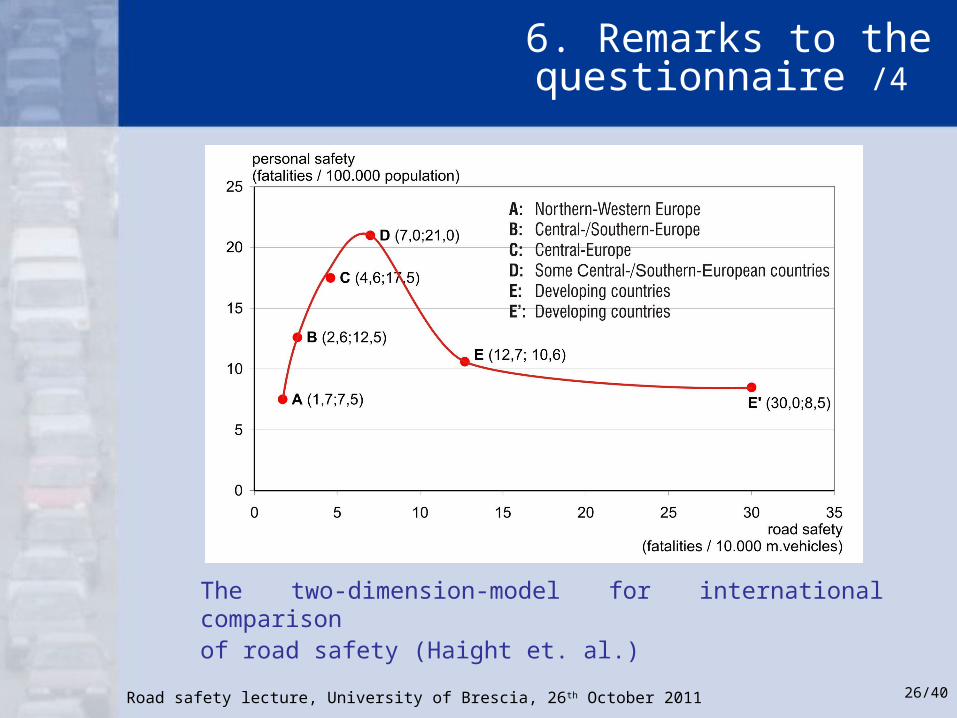
Suggestion: the mortality rate has to be used together with the fatality rate (killed/10 000 motor vehicles)
This “two-dimension-model” (elaborated by Haight et al.) is very simple and takes into account the level of motorisation,too.
Road safety lecture, University of Brescia, 26th October 2011 26/40
6. Remarks to the questionnaire /4
The two-dimension-model for international comparison of road safety (Haight et. al.)
Road safety lecture, University of Brescia, 26th October 2011 27/40
6. Remarks to the questionnaire /5
As fatality risk, killed/106 vehicle-km has been selected.
Fact: From theoretical point of view it is the best indicator. Vehicle-kilometres are the “best” exposure data. In other parts of the
questionnaire number of inhabitants and number of motor vehicles are used as exposure
data. The problem is that in a region or in a town these data cannot express the real
exposure. This is true especially in case of high percentage of transit traffic (e.g. Győr)

Road safety lecture, University of Brescia, 26th October 2011 28/40
6. Remarks to the questionnaire /6
It is easy to understand that not only local residents and not only locally registered motor vehicles are travelling in a region or in a town.
Therefore it would be necessary to collect (to measure or to estimate) reliable vehicle-kilometres for the local network.
It is a complicated and expensive task but its implementation necessarily arises in the future.

Road safety lecture, University of Brescia, 26th October 2011 29/40
7. Conclusions
• The present set of road safety indicators represents a compromise between the possibilities and real circumstances.
• This set of indicators can be used for the evaluation of local RS programmes.
• During the implementation of the programme and first of all, in the future the “package” of indicators should be further elaborated.
• This set is only the basic one, additional indicators can also be used for the evaluation.
Road safety lecture, University of Brescia, 26th October 2011 30/40
8. Some details of the roadsafety assessment
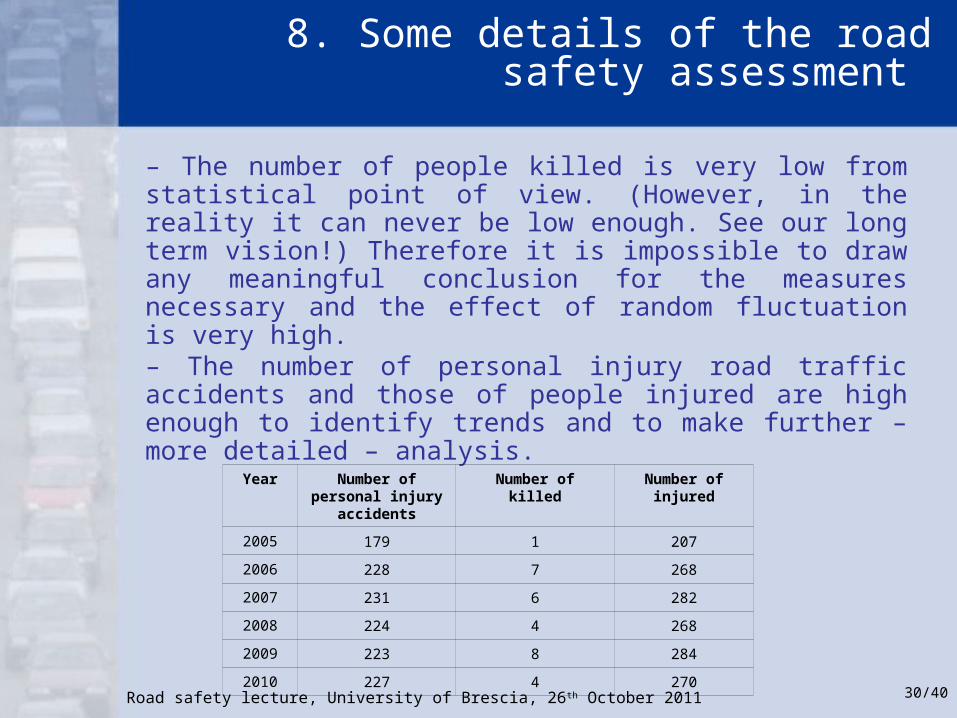
– The number of people killed is very low from statistical point of view. (However, in the reality it can never be low enough. See our long term vision!) Therefore it is impossible to draw any meaningful conclusion for the measures necessary and the effect of random fluctuation is very high.– The number of personal injury road traffic accidents and those of people injured are high enough to identify trends and to make further – more detailed – analysis.
Year Number of personal injury accidents
Number of killed Number of injured
2005 179 1 207
2006 228 7 268
2007 231 6 282
2008 224 4 268
2009 223 8 284
2010 227 4 270
Road safety lecture, University of Brescia, 26th October 2011 31/40
8. Some details of the road safety assessment /2
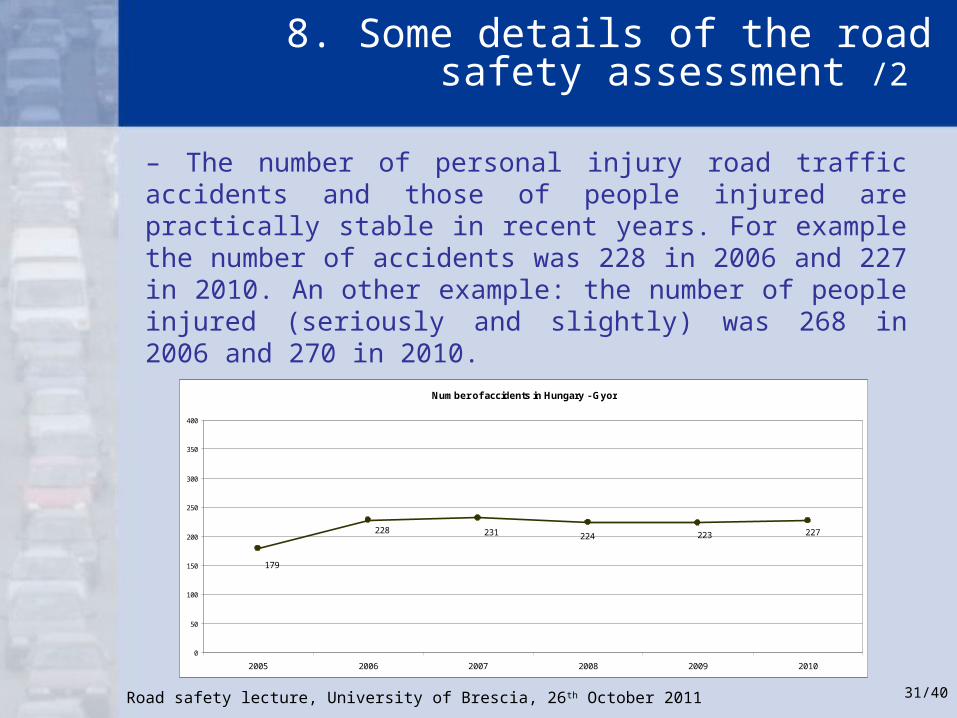
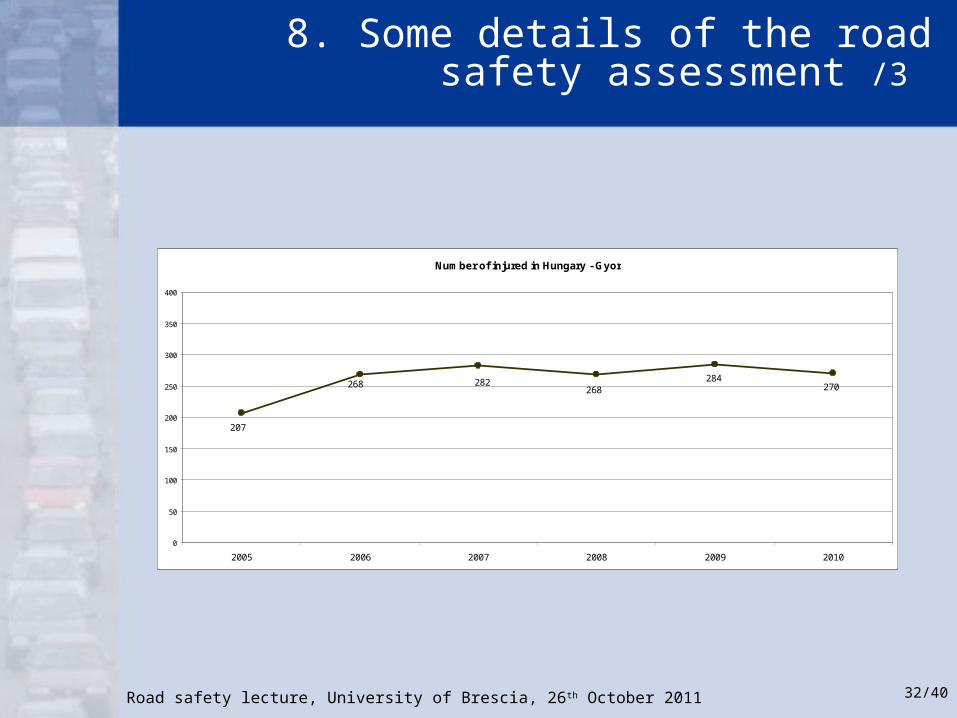
– The number of personal injury road traffic accidents and those of people injured are practically stable in recent years. For example the number of accidents was 228 in 2006 and 227 in 2010. An other example: the number of people injured (seriously and slightly) was 268 in 2006 and 270 in 2010.
Number of accidents in Hungary - Gyor
228
179
231 224 223 227
0
50
100
150
200
250
300
350
400
2005 2006 2007 2008 2009 2010
Road safety lecture, University of Brescia, 26th October 2011 32/40
8. Some details of the road safety assessment /3
Number of injured in Hungary - Gyor
270284
268282268
207
0
50
100
150
200
250
300
350
400
2005 2006 2007 2008 2009 2010

Road safety lecture, University of Brescia, 26th October 2011 33/40
8. Some details of the road safety assessment /4
– This stability means that the main aim of the local road safety strategy could only be to significantly decrease the number of personal injury road traffic accidents and those of people injured.
– To identify the main target areas, we have to analyse the numbers of accidents and people injured according to the most important circumstances (mode of traffic, age group, cause of accident, time of the day, location of accident, etc.)
Road safety lecture, University of Brescia, 26th October 2011 34/40
8. Some details of the road safety assessment /5
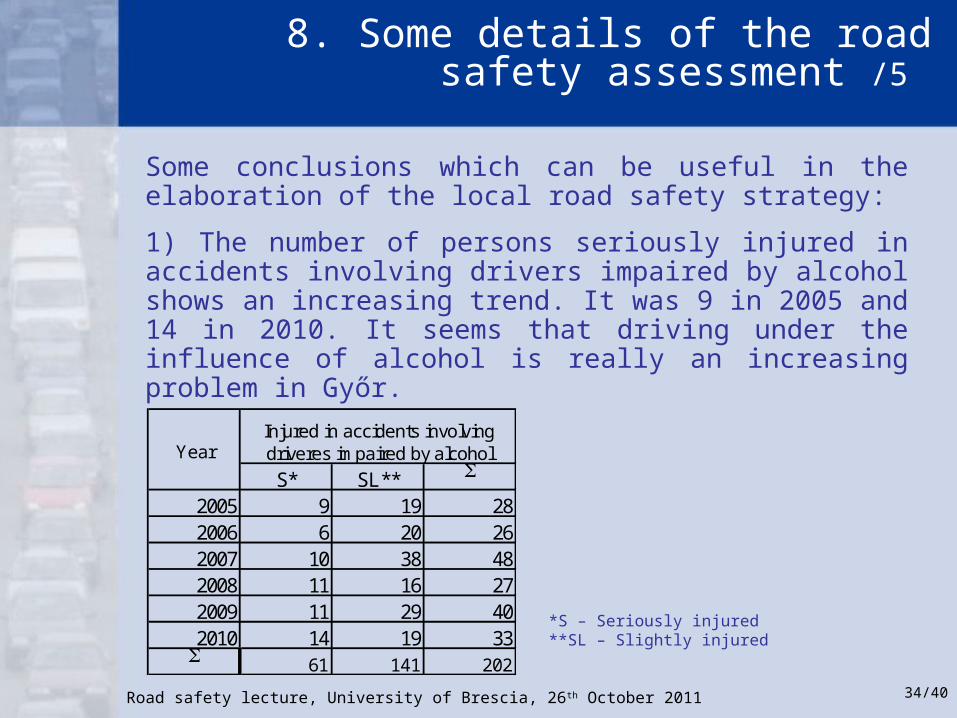
Some conclusions which can be useful in the elaboration of the local road safety strategy:
1) The number of persons seriously injured in accidents involving drivers impaired by alcohol shows an increasing trend. It was 9 in 2005 and 14 in 2010. It seems that driving under the influence of alcohol is really an increasing problem in Győr.
*S – Seriously injured**SL – Slightly injured
S* SL** S
2005 9 19 282006 6 20 262007 10 38 482008 11 16 272009 11 29 402010 14 19 33
S 61 141 202
Injured in accidents involving driveres impaired by alcoholYear

Road safety lecture, University of Brescia, 26th October 2011 35/40
8. Some details of the road safety assessment /6
2) Between 2005 and 2010 the most seriously injured people were car occupants (127) and pedestrians (112). The number of seriously injured cyclists was also high (101) in this period. All this means that the more effective protection of -car occupants -pedestrians, and -cyclists is necessary for the future.
*S – Seriously injured**SL – Slightly injured
Injured by road users group
S* SL** S S* SL** S S* SL** S S* SL** S2005 23 19 42 17 67 84 11 5 16 10 26 362006 28 30 58 20 78 98 8 7 15 21 29 50
2007 21 33 54 25 102 127 4 9 13 21 29 50
2008 13 27 40 20 101 121 12 9 21 13 31 44
2009 11 19 30 26 110 136 3 12 15 14 35 492010 16 22 38 19 88 107 4 9 13 22 42 64S 112 150 262 127 546 673 42 51 93 101 192 293
injured pedestrians
injured in passangers
cars
injured motorcyclists
injured bicyclistsYear
Road safety lecture, University of Brescia, 26th October 2011 36/40
8. Some details of the road safety assessment /7
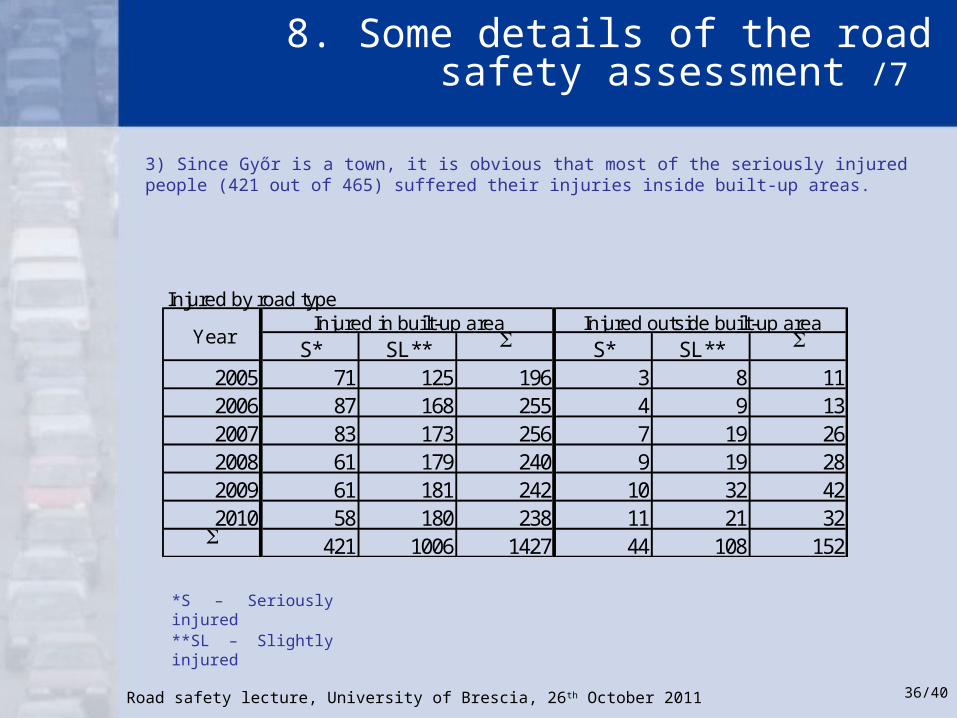
3) Since Győr is a town, it is obvious that most of the seriously injured people (421 out of 465) suffered their injuries inside built-up areas.
*S – Seriously injured**SL – Slightly injured
Injured by road type
S* SL** S S* SL** S
2005 71 125 196 3 8 112006 87 168 255 4 9 132007 83 173 256 7 19 262008 61 179 240 9 19 282009 61 181 242 10 32 422010 58 180 238 11 21 32
S 421 1006 1427 44 108 152
YearInjured in built-up area Injured outside built-up area
Road safety lecture, University of Brescia, 26th October 2011 37/40
8. Some details of the road safety assessment /8
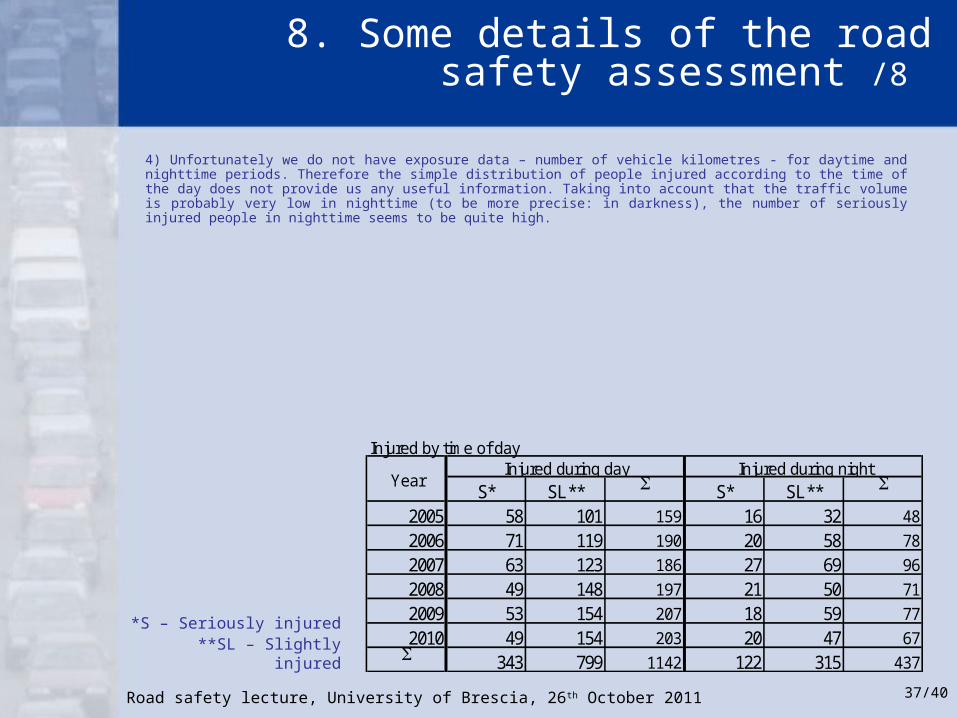
4) Unfortunately we do not have exposure data – number of vehicle kilometres - for daytime and nighttime periods. Therefore the simple distribution of people injured according to the time of the day does not provide us any useful information. Taking into account that the traffic volume is probably very low in nighttime (to be more precise: in darkness), the number of seriously injured people in nighttime seems to be quite high.
*S – Seriously injured**SL – Slightly injured
Injured by time of day
S* SL** S S* SL** S
2005 58 101 159 16 32 48
2006 71 119 190 20 58 78
2007 63 123 186 27 69 96
2008 49 148 197 21 50 71
2009 53 154 207 18 59 77
2010 49 154 203 20 47 67S 343 799 1142 122 315 437
Injured during nightYear
Injured during day

Road safety lecture, University of Brescia, 26th October 2011 38/40
8. Some details of the road safety assessment /9
5) These age group intervals are used in the statistics but some of them are too big compared to others. For example the age group 25-64 is too big compared to the 15-17, or the 10-14. It means that the statistical weight of this age group will be much higher than those of others which can be misleading.6) In spite of remark 5, it can be clearly seen that the age group 65- is the target group among pedestrians. In other words, most of the seriously injured pedestrians (44 people) are older than 65 years.
*S – Seriously injured**SL – Slightly injured
Injured by age - pedestrians
S* SL** S S* SL** S S* SL** S S* SL** S S* SL** S S* SL** S S* SL** S S* SL** S
2005 1 1 2 2 4 5 5 2 1 3 7 8 15 12 2 14 23 19 42
2006 1 3 4 1 1 2 3 4 7 1 5 6 4 5 9 7 8 15 11 4 15 28 30 58
2007 2 2 1 4 5 4 2 6 2 2 1 2 3 9 12 21 6 9 15 21 33 54
2008 1 1 1 1 1 3 4 1 4 5 1 2 3 4 15 19 5 2 7 13 27 40
2009 1 1 2 1 2 3 1 1 1 2 3 2 7 9 5 7 12 11 19 30
2010 3 3 1 2 3 3 3 10 10 20 5 4 9 16 22 38S 1 6 7 4 10 14 11 13 24 4 18 22 9 15 24 39 60 99 44 28 72 112 150 262
S15-17 65-0-5 18-24 25-646-9 10-14Year
Road safety lecture, University of Brescia, 26th October 2011 39/40
8. Some details of the road safety assessment /10
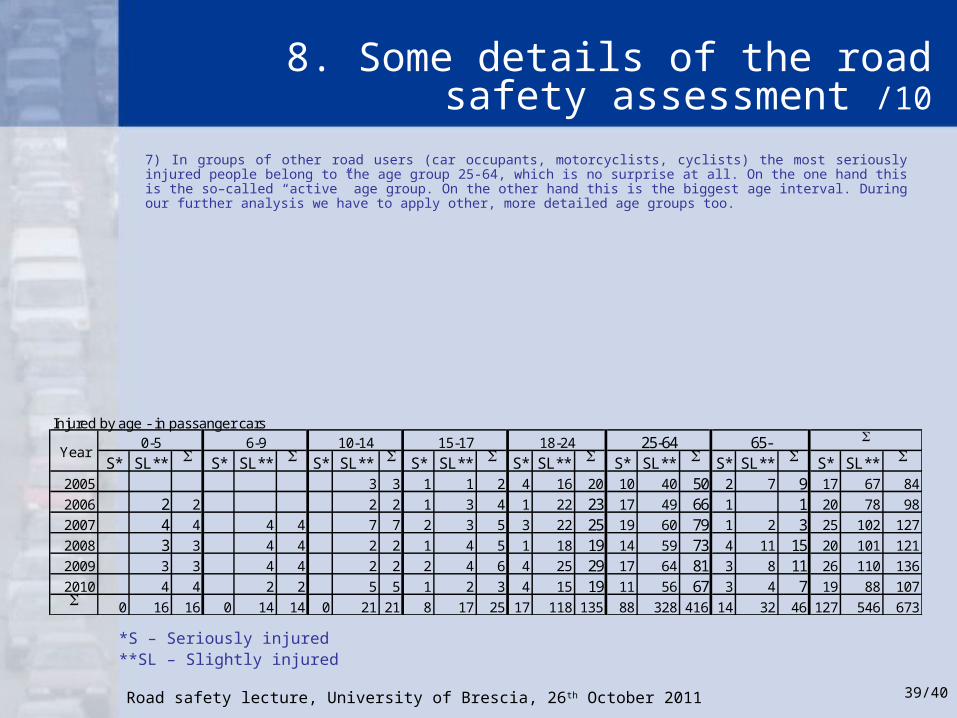
7) In groups of other road users (car occupants, motorcyclists, cyclists) the most seriously injured people belong to the age group 25-64, which is no surprise at all. On the one hand this is the so–called “active” age group. On the other hand this is the biggest age interval. During our further analysis we have to apply other, more detailed age groups too.
*S – Seriously injured**SL – Slightly injured
Injured by age - in passanger cars
S* SL** S S* SL** S S* SL** S S* SL** S S* SL** S S* SL** S S* SL** S S* SL** S
2005 3 3 1 1 2 4 16 20 10 40 50 2 7 9 17 67 84
2006 2 2 2 2 1 3 4 1 22 23 17 49 66 1 1 20 78 98
2007 4 4 4 4 7 7 2 3 5 3 22 25 19 60 79 1 2 3 25 102 127
2008 3 3 4 4 2 2 1 4 5 1 18 19 14 59 73 4 11 15 20 101 121
2009 3 3 4 4 2 2 2 4 6 4 25 29 17 64 81 3 8 11 26 110 136
2010 4 4 2 2 5 5 1 2 3 4 15 19 11 56 67 3 4 7 19 88 107S 0 16 16 0 14 14 0 21 21 8 17 25 17 118 135 88 328 416 14 32 46 127 546 673
S0-5 6-9 10-14 15-17 18-24 25-64 65-Year

Road safety lecture, University of Brescia, 26th October 2011 40/40
9. How to go further?
These analyses are only the first steps.
The further – more detailed – analysis, the identification of the main aims of the local road safety programme can only be carried out in close co-operation with the local experts, stakeholders.
To begin of this activity was the main aim of the workshop in Győr organised on 16th September.

Road safety lecture, University of Brescia, 26th October 2011 41/40
Thank youfor your attention !
Prof. Dr. Péter HOLLÓ – [email protected]
Related Documents