RNA-Seq Analysis and De Novo Transcriptome Assembly of Jerusalem Artichoke (Helianthus tuberosus Linne) Won Yong Jung 1,2. , Sang Sook Lee 1. , Chul Wook Kim 2 , Hyun-Soon Kim 1 , Sung Ran Min 1 , Jae Sun Moon 1 , Suk-Yoon Kwon 1 , Jae-Heung Jeon 1 *, Hye Sun Cho 1 * 1 Plant Systems Engineering Research Center, Korea Research Institute of Bioscience and Biotechnology, Daejeon, Korea, 2 Animal Material Engineering, Gyeongnam National University of Science and Technology, Jinju, Korea Abstract Jerusalem artichoke (Helianthus tuberosus L.) has long been cultivated as a vegetable and as a source of fructans (inulin) for pharmaceutical applications in diabetes and obesity prevention. However, transcriptomic and genomic data for Jerusalem artichoke remain scarce. In this study, Illumina RNA sequencing (RNA-Seq) was performed on samples from Jerusalem artichoke leaves, roots, stems and two different tuber tissues (early and late tuber development). Data were used for de novo assembly and characterization of the transcriptome. In total 206,215,632 paired-end reads were generated. These were assembled into 66,322 loci with 272,548 transcripts. Loci were annotated by querying against the NCBI non-redundant, Phytozome and UniProt databases, and 40,215 loci were homologous to existing database sequences. Gene Ontology terms were assigned to 19,848 loci, 15,434 loci were matched to 25 Clusters of Eukaryotic Orthologous Groups classifications, and 11,844 loci were classified into 142 Kyoto Encyclopedia of Genes and Genomes pathways. The assembled loci also contained 10,778 potential simple sequence repeats. The newly assembled transcriptome was used to identify loci with tissue-specific differential expression patterns. In total, 670 loci exhibited tissue-specific expression, and a subset of these were confirmed using RT-PCR and qRT-PCR. Gene expression related to inulin biosynthesis in tuber tissue was also investigated. Exsiting genetic and genomic data for H. tuberosus are scarce. The sequence resources developed in this study will enable the analysis of thousands of transcripts and will thus accelerate marker-assisted breeding studies and studies of inulin biosynthesis in Jerusalem artichoke. Citation: Jung WY, Lee SS, Kim CW, Kim H-S, Min SR, et al. (2014) RNA-Seq Analysis and De Novo Transcriptome Assembly of Jerusalem Artichoke (Helianthus tuberosus Linne). PLoS ONE 9(11): e111982. doi:10.1371/journal.pone.0111982 Editor: Hao Sun, The Chinese University of Hong Kong, Hong Kong Received May 9, 2014; Accepted October 9, 2014; Published November 6, 2014 Copyright: ß 2014 Jung et al. This is an open-access article distributed under the terms of the Creative Commons Attribution License, which permits unrestricted use, distribution, and reproduction in any medium, provided the original author and source are credited. Data Availability: The authors confirm that all data underlying the findings are fully available without restriction. All relevant data are within the paper and its Supporting Information files. Funding: This work was supported by KRIBB Research Initiative Program, The Cabbage Genomics assisted breeding supporting center (CGsC) research programs funded by the Ministry for Food, Agriculture, Forestry and Fisheries of the Korean Government, The Next Generation of Bio Green 21 Project, The National Center for GM Crops (PJ009043) from RDA to HSC, and Bio-industry Technology Development Program (No.310006-5), Ministry for Food, Agriculture, Forestry and Fisheries, Republic of Korea to J-HJ. The funders had no role in study design, data collection and analysis, decision to publish, or preparation of the manuscript. Competing Interests: The authors have declared that no competing interests exist. * Email: [email protected] (J-HJ); [email protected] (HSC) . These authors contributed equally to this work. Introduction The sunflower species Jerusalem artichoke (Helianthus tuber- osus L.), in the family Asteraceae of the order Asterales, has been cultivated as a vegetable, a fodder crop, and a source of inulin for food and industrial purposes [1–4]. Jerusalem artichoke, which has been cultivated since the 17 th century, can grow well in nutritionally poor soil and has good resistance to frost and plant diseases [5,6]. In the early 1900s, systematic breeding programs began to explore the use of H. tuberosus tubers for industrial applications such as the production of ethanol [4]. Jerusalem artichoke is a hexaploid with 102 chromosomes (2n = 6 6= 102) [7] that is thought to have originated in the north-central U.S., although the exact origins remain a subject of debate [8,9]. Despite its cultural and economic significance, few studies have investigated the genetic origins of Jerusalem artichoke and its various cultivars. A recent study assessed the origin of Jerusalem artichoke using genome skimming [10], a new technique for assembling and analyzing the complete plastome, partial mito- chondrial genome, and nuclear ribosomal DNA genomes. This analysis showed that the genome of Jerusalem artichoke was not derived from Helianthus annuus (an annual) but instead originated from perennial sunflowers through hybridization of the tetraploid Hairy Sunflower (Helianthus hirsutus) with the diploid Sawtooth Sunflower (Helianthus grosseserratus). [11,12]. These results indicate that H. tuberosus is an alloploid species, having a set of chromosomes from each progenitor and double the chromosome number of the two parental species. Many members of the Asteraceae family accumulate fructans (fructose polymers) in underground storage organs [13]. On such fructan is, inulin, which is stored in the vacuole in approximately 15% of flowering plant species [14]. Jerusalem artichoke and chicory (Cichorium intybus L.) are the most important cultivated sources of inulin [15–17]. Inulin molecules are much smaller than starch molecules, and have 2270 linked fructose moieties terminated by a glucose residue [7]. The average number of fructose subunits depends on the species, production conditions, and developmental timing [18]. Inulin has many uses in the PLOS ONE | www.plosone.org 1 November 2014 | Volume 9 | Issue 11 | e111982

Welcome message from author
This document is posted to help you gain knowledge. Please leave a comment to let me know what you think about it! Share it to your friends and learn new things together.
Transcript
RNA-Seq Analysis and De Novo Transcriptome Assemblyof Jerusalem Artichoke (Helianthus tuberosus Linne)Won Yong Jung1,2., Sang Sook Lee1., Chul Wook Kim2, Hyun-Soon Kim1, Sung Ran Min1, Jae Sun Moon1,
Suk-Yoon Kwon1, Jae-Heung Jeon1*, Hye Sun Cho1*
1 Plant Systems Engineering Research Center, Korea Research Institute of Bioscience and Biotechnology, Daejeon, Korea, 2 Animal Material Engineering, Gyeongnam
National University of Science and Technology, Jinju, Korea
Abstract
Jerusalem artichoke (Helianthus tuberosus L.) has long been cultivated as a vegetable and as a source of fructans (inulin) forpharmaceutical applications in diabetes and obesity prevention. However, transcriptomic and genomic data for Jerusalemartichoke remain scarce. In this study, Illumina RNA sequencing (RNA-Seq) was performed on samples from Jerusalemartichoke leaves, roots, stems and two different tuber tissues (early and late tuber development). Data were used forde novo assembly and characterization of the transcriptome. In total 206,215,632 paired-end reads were generated. Thesewere assembled into 66,322 loci with 272,548 transcripts. Loci were annotated by querying against the NCBI non-redundant,Phytozome and UniProt databases, and 40,215 loci were homologous to existing database sequences. Gene Ontology termswere assigned to 19,848 loci, 15,434 loci were matched to 25 Clusters of Eukaryotic Orthologous Groups classifications, and11,844 loci were classified into 142 Kyoto Encyclopedia of Genes and Genomes pathways. The assembled loci also contained10,778 potential simple sequence repeats. The newly assembled transcriptome was used to identify loci with tissue-specificdifferential expression patterns. In total, 670 loci exhibited tissue-specific expression, and a subset of these were confirmedusing RT-PCR and qRT-PCR. Gene expression related to inulin biosynthesis in tuber tissue was also investigated. Exsitinggenetic and genomic data for H. tuberosus are scarce. The sequence resources developed in this study will enable theanalysis of thousands of transcripts and will thus accelerate marker-assisted breeding studies and studies of inulinbiosynthesis in Jerusalem artichoke.
Citation: Jung WY, Lee SS, Kim CW, Kim H-S, Min SR, et al. (2014) RNA-Seq Analysis and De Novo Transcriptome Assembly of Jerusalem Artichoke (Helianthustuberosus Linne). PLoS ONE 9(11): e111982. doi:10.1371/journal.pone.0111982
Editor: Hao Sun, The Chinese University of Hong Kong, Hong Kong
Received May 9, 2014; Accepted October 9, 2014; Published November 6, 2014
Copyright: � 2014 Jung et al. This is an open-access article distributed under the terms of the Creative Commons Attribution License, which permitsunrestricted use, distribution, and reproduction in any medium, provided the original author and source are credited.
Data Availability: The authors confirm that all data underlying the findings are fully available without restriction. All relevant data are within the paper and itsSupporting Information files.
Funding: This work was supported by KRIBB Research Initiative Program, The Cabbage Genomics assisted breeding supporting center (CGsC) research programsfunded by the Ministry for Food, Agriculture, Forestry and Fisheries of the Korean Government, The Next Generation of Bio Green 21 Project, The National Centerfor GM Crops (PJ009043) from RDA to HSC, and Bio-industry Technology Development Program (No.310006-5), Ministry for Food, Agriculture, Forestry andFisheries, Republic of Korea to J-HJ. The funders had no role in study design, data collection and analysis, decision to publish, or preparation of the manuscript.
Competing Interests: The authors have declared that no competing interests exist.
* Email: [email protected] (J-HJ); [email protected] (HSC)
. These authors contributed equally to this work.
Introduction
The sunflower species Jerusalem artichoke (Helianthus tuber-osus L.), in the family Asteraceae of the order Asterales, has been
cultivated as a vegetable, a fodder crop, and a source of inulin for
food and industrial purposes [1–4]. Jerusalem artichoke, which has
been cultivated since the 17th century, can grow well in
nutritionally poor soil and has good resistance to frost and plant
diseases [5,6]. In the early 1900s, systematic breeding programs
began to explore the use of H. tuberosus tubers for industrial
applications such as the production of ethanol [4]. Jerusalem
artichoke is a hexaploid with 102 chromosomes (2n = 66= 102)
[7] that is thought to have originated in the north-central U.S.,
although the exact origins remain a subject of debate [8,9].
Despite its cultural and economic significance, few studies have
investigated the genetic origins of Jerusalem artichoke and its
various cultivars. A recent study assessed the origin of Jerusalem
artichoke using genome skimming [10], a new technique for
assembling and analyzing the complete plastome, partial mito-
chondrial genome, and nuclear ribosomal DNA genomes. This
analysis showed that the genome of Jerusalem artichoke was not
derived from Helianthus annuus (an annual) but instead
originated from perennial sunflowers through hybridization of
the tetraploid Hairy Sunflower (Helianthus hirsutus) with the
diploid Sawtooth Sunflower (Helianthus grosseserratus). [11,12].
These results indicate that H. tuberosus is an alloploid species,
having a set of chromosomes from each progenitor and double the
chromosome number of the two parental species.
Many members of the Asteraceae family accumulate fructans
(fructose polymers) in underground storage organs [13]. On such
fructan is, inulin, which is stored in the vacuole in approximately
15% of flowering plant species [14]. Jerusalem artichoke and
chicory (Cichorium intybus L.) are the most important cultivated
sources of inulin [15–17]. Inulin molecules are much smaller than
starch molecules, and have 2270 linked fructose moieties
terminated by a glucose residue [7]. The average number of
fructose subunits depends on the species, production conditions,
and developmental timing [18]. Inulin has many uses in the
PLOS ONE | www.plosone.org 1 November 2014 | Volume 9 | Issue 11 | e111982
production of food [19,20], and pharmaceuticals [21–23], and can
be used as a storage carbohydrate for bioethanol production [24].
The inulin produced by Jerusalem artichoke is therefore a
commercially valuable resource [7].
Recent advances in next-generation sequencing technology
have enabled gene discovery, analysis of gene content, and
measurement of gene expression in non-model organisms that lack
a published genome sequence. For example, transcriptome
sequencing can be used for genome-wide determination of
absolute transcript levels, identification of transcripts, and
delineation of transcript structure (including 59 and 39 ends,
introns, and exons) [25–28]. Transcriptome sequencing can also
identify genetic variations such as, single nucleotide polymor-
phisms (SNPs) and simple sequence repeats (SSRs) [29]. In recent
years, RNA-Seq analysis has facilitated transcriptome character-
ization in hundreds of plant species lacking sequenced genomes
[30–34].
In this study, we used RNA-Seq technology to develop the first
H. tuberosus transcriptome dataset. De novo transcriptome
sequencing was performed on RNA from five different Htuberosus tissues. We identified 66,322 loci, annotated 40,215
loci, and mapped 11,844 loci to 237 Kyoto Encyclopedia of Genes
and Genomes (KEGG) pathways. We also identified 670 tissue-
specific candidate loci and 10,778 SSRs. This novel dataset will be
an important resource in the further genetic characterization of
Jerusalem artichoke and will be particularly valuable in marker-
assisted breeding and investigation of traits related to inulin
biosynthesis.
Materials and Methods
2.1 Plant Materials and RNA IsolationA widely-cultivated Jerusalem artichoke cultivar, Purple Jer-
usalem Artichoke (PJA), was used for transcriptome analysis. PJA
tubers were planted in January 2012 and were grown under
normal conditions until harvesting. Stems, leaves, and tubers
(stages 1 and 2; tuber1 and tuber2, respectively) were collected 6
months after planting. To avoid contamination with pathogen,
roots were collected from in vitro-cultivated PJA. Tissues were
snap-frozen in nitrogen upon harvest and were stored at 280uCuntil further processing. Total RNAs were extracted using Trizol
Reagent (Invitrogen, Carlsbad, CA, USA), and were then treated
with DNase I (Fermentas, Pittsburgh, PA, USA) according to the
manufacturers’ instructions. The OD260/230 ratio was deter-
mined using a NanoDrop ND-1000 Spectrophotometer (Thermo
Fisher Scientific, Wilmington, DE, USA) and was used for
assessment of RNA quality and purity.
2.2 Transcriptome SequencingAn equal amount of total RNA from each tissue was pooled for
transcriptome sequencing in order to obtain a comprehensive
range of transcripts. Poly(A)+ RNAs were purified from the pooled
total RNA (20 mg) using oligo(dT) Dynabeads. Impurities were
removed from the hybridized sample using a series of low-salt
washes. First-strand cDNAs were synthesized using oligo(dT)
primers. RNA was then degraded with RNase H (Invitrogen,
Carlsbad, CA, USA) and second-strand cDNA were synthesized
using DNA polymerase I (New England BioLabs, Ipswich, MA,
USA). Double-stranded cDNAs were randomly fragmented using
a nebulizer. The fragments were then repaired and extended at
the 39 end by addition of a single adenine, and different adapters
were ligated to the 59 and 39 ends. The ligated fragments were
separated on a gel, and fragments of ,200 bp were isolated. After
amplification by polymerase chain reaction (PCR), fragments were
separated using electrophoresis, purified, and subjected to Illumina
HiSeq2000 sequencing. Raw sequence data were generated by the
Illumina analysis pipeline. Sequence data are deposited in the
NCBI Sequence Read Archive (SRA, http://www.ncbi.nlm.nih.
gov/Traces/sra) under study number PRJNA258432.
2.3 De novo Transcriptome AssemblyRaw sequence data were filtered using standard RNA-Seq
parameters. Briefly, low-quality and N-base reads were trimmed
from the raw reads and reads were filtered by Phred quality score
(Q$20 for all bases) and read length ($25 bp). The 39 ends of the
clean reads were trimmed to form five sets of reads from the five
different tissues. These datasets were then pooled and assembled
using de novo assemblers (Velvet v1.2.07 [35] and Oases v0.2.08
[36]) based on the de Bruijn graph algorithm. Reads were
assembled into contigs at distinct k-mer values (45, 51, 53, 55, 57,
59, 61, 63, 65, 67, 69 and 75) using Velvet. Contigs at each k-mer
value were assembled into transcripts using Oases. Finally, the
transcripts assembled at k-mer values 63 and 65 were merged
using Oases with a minimum length of 200 bp and other default
settings. Hash length (k-mer = 65) was considered for selection of
the optimal de novo assembly as described previously [37]. The
cleaned reads were also assembled using Trinity release_2011-11-
26 [38] with k-mer of 25, minimum k-mer coverage of 1. Default
settings were used for all other parameters. The performance of
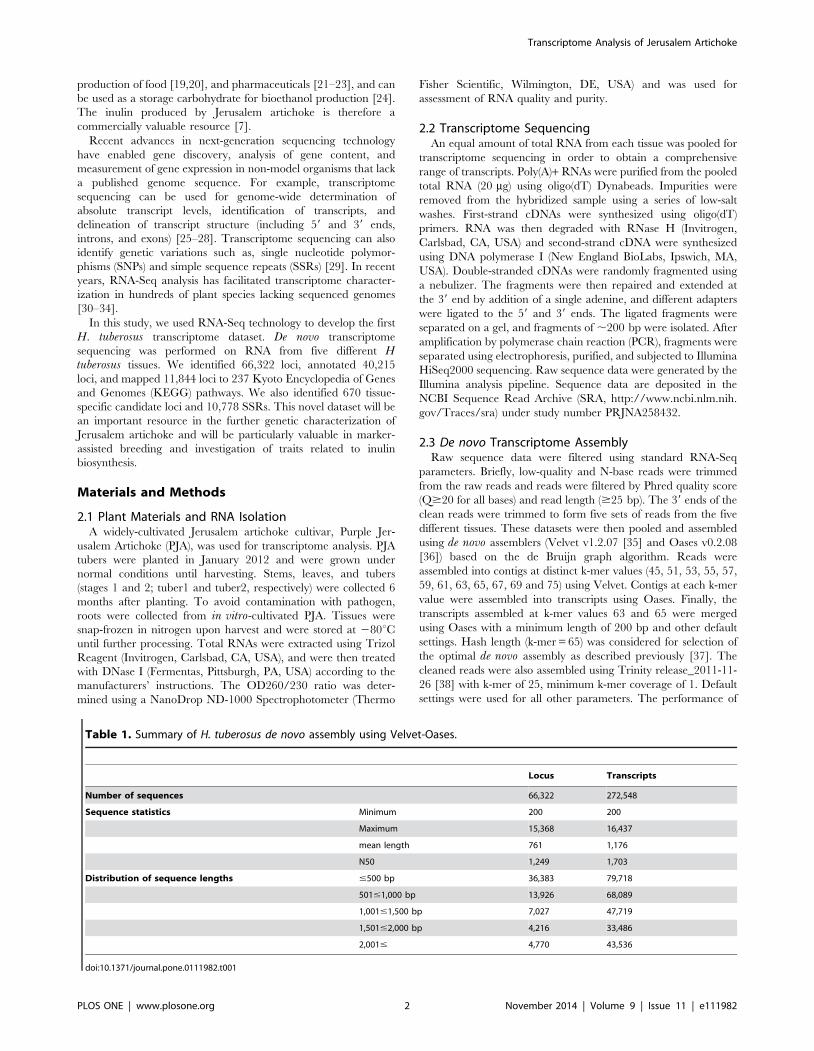
Table 1. Summary of H. tuberosus de novo assembly using Velvet-Oases.
Locus Transcripts
Number of sequences 66,322 272,548
Sequence statistics Minimum 200 200
Maximum 15,368 16,437
mean length 761 1,176
N50 1,249 1,703
Distribution of sequence lengths #500 bp 36,383 79,718
501#1,000 bp 13,926 68,089
1,001#1,500 bp 7,027 47,719
1,501#2,000 bp 4,216 33,486
2,001# 4,770 43,536
doi:10.1371/journal.pone.0111982.t001
Transcriptome Analysis of Jerusalem Artichoke
PLOS ONE | www.plosone.org 2 November 2014 | Volume 9 | Issue 11 | e111982
the two assembly tools was assessed at N50 value, mean length,
maximum length and transcript number. Data sets produced using
Velvet-Oases were selected for subsequent analyses. Singletons
and the longest sequence in each cluster were designated as loci
and were then translated in all six frames. Putative transcripts were
validated by comparison with gene sequences in the Phytozyme
database (http://www.phytozyme.net/) using BLASTX (E-value
#1E-05, BLAST v.2.2.28+). In addition, the assembled loci were
compared with expressed sequence tag (EST) sequences from H.tuberosus (a total of 40,388 ESTs) and H. annus (a total of 134,474
ESTs) in NCBI GenBank (ftp://ftp.ncbi.nih.gov/pub/TraceDB/
helianthus_tuberosus/ and http://www.ncbi.nlm.nih.gov/Taxonomy/
Browser/wwwtax.cgi?id=4232, respectively) using BLASTN [39]
with an E-value cut-off of 1E-20.
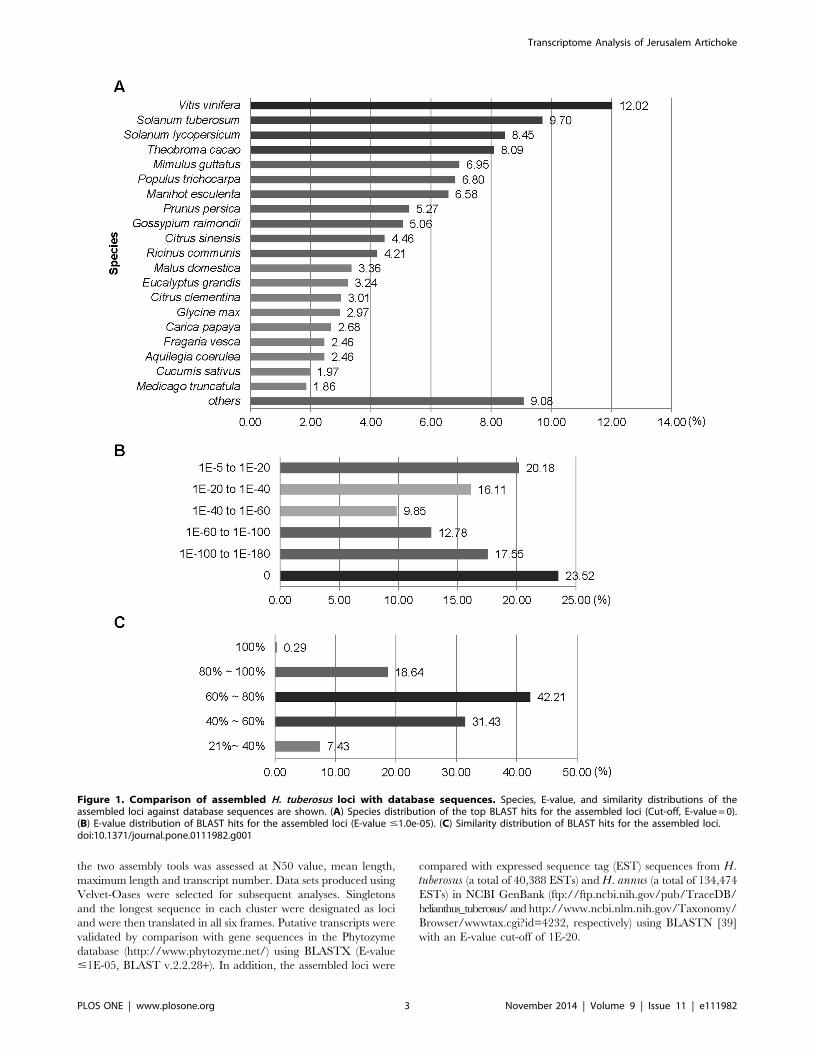
Figure 1. Comparison of assembled H. tuberosus loci with database sequences. Species, E-value, and similarity distributions of theassembled loci against database sequences are shown. (A) Species distribution of the top BLAST hits for the assembled loci (Cut-off, E-value = 0).(B) E-value distribution of BLAST hits for the assembled loci (E-value #1.0e-05). (C) Similarity distribution of BLAST hits for the assembled loci.doi:10.1371/journal.pone.0111982.g001
Transcriptome Analysis of Jerusalem Artichoke
PLOS ONE | www.plosone.org 3 November 2014 | Volume 9 | Issue 11 | e111982
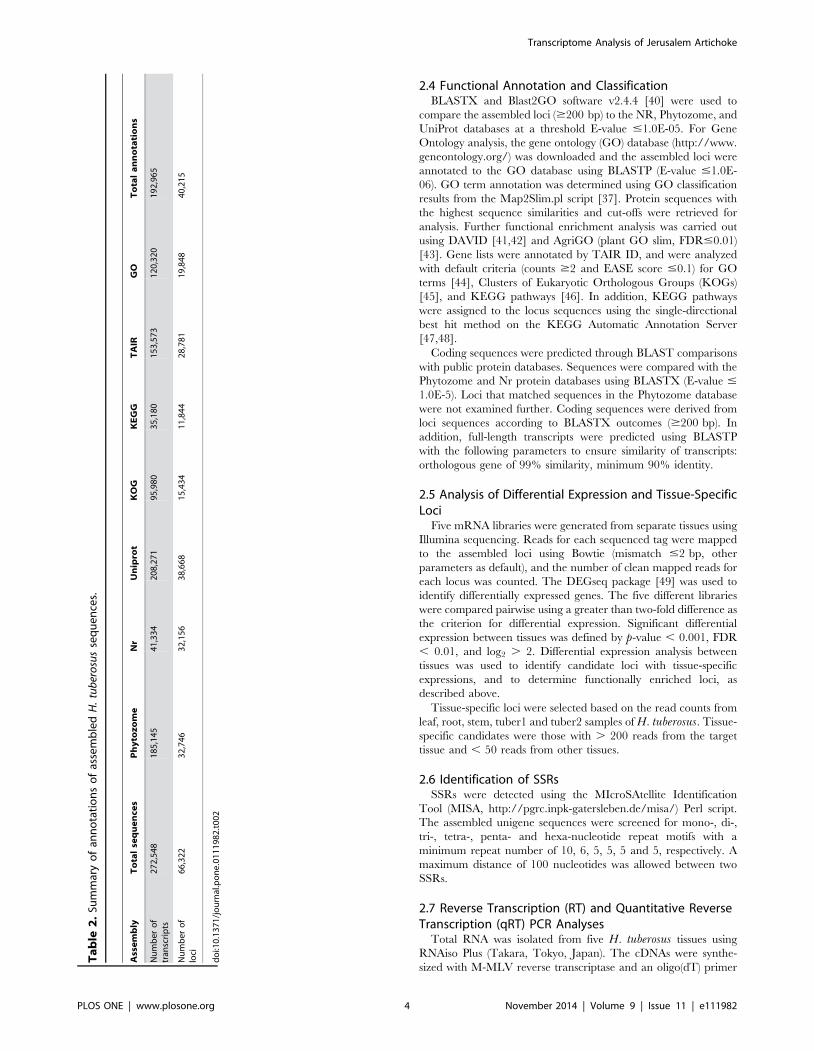
2.4 Functional Annotation and ClassificationBLASTX and Blast2GO software v2.4.4 [40] were used to
compare the assembled loci ($200 bp) to the NR, Phytozome, and
UniProt databases at a threshold E-value #1.0E-05. For Gene
Ontology analysis, the gene ontology (GO) database (http://www.
geneontology.org/) was downloaded and the assembled loci were
annotated to the GO database using BLASTP (E-value #1.0E-
06). GO term annotation was determined using GO classification
results from the Map2Slim.pl script [37]. Protein sequences with
the highest sequence similarities and cut-offs were retrieved for
analysis. Further functional enrichment analysis was carried out
using DAVID [41,42] and AgriGO (plant GO slim, FDR#0.01)
[43]. Gene lists were annotated by TAIR ID, and were analyzed
with default criteria (counts $2 and EASE score #0.1) for GO
terms [44], Clusters of Eukaryotic Orthologous Groups (KOGs)
[45], and KEGG pathways [46]. In addition, KEGG pathways
were assigned to the locus sequences using the single-directional
best hit method on the KEGG Automatic Annotation Server
[47,48].
Coding sequences were predicted through BLAST comparisons
with public protein databases. Sequences were compared with the
Phytozome and Nr protein databases using BLASTX (E-value #
1.0E-5). Loci that matched sequences in the Phytozome database
were not examined further. Coding sequences were derived from
loci sequences according to BLASTX outcomes ($200 bp). In
addition, full-length transcripts were predicted using BLASTP
with the following parameters to ensure similarity of transcripts:
orthologous gene of 99% similarity, minimum 90% identity.
2.5 Analysis of Differential Expression and Tissue-SpecificLoci
Five mRNA libraries were generated from separate tissues using
Illumina sequencing. Reads for each sequenced tag were mapped
to the assembled loci using Bowtie (mismatch #2 bp, other
parameters as default), and the number of clean mapped reads for
each locus was counted. The DEGseq package [49] was used to
identify differentially expressed genes. The five different libraries
were compared pairwise using a greater than two-fold difference as
the criterion for differential expression. Significant differential
expression between tissues was defined by p-value , 0.001, FDR
, 0.01, and log2 . 2. Differential expression analysis between
tissues was used to identify candidate loci with tissue-specific
expressions, and to determine functionally enriched loci, as
described above.
Tissue-specific loci were selected based on the read counts from
leaf, root, stem, tuber1 and tuber2 samples of H. tuberosus. Tissue-
specific candidates were those with . 200 reads from the target
tissue and , 50 reads from other tissues.
2.6 Identification of SSRsSSRs were detected using the MIcroSAtellite Identification
Tool (MISA, http://pgrc.inpk-gatersleben.de/misa/) Perl script.
The assembled unigene sequences were screened for mono-, di-,
tri-, tetra-, penta- and hexa-nucleotide repeat motifs with a
minimum repeat number of 10, 6, 5, 5, 5 and 5, respectively. A
maximum distance of 100 nucleotides was allowed between two
SSRs.
2.7 Reverse Transcription (RT) and Quantitative ReverseTranscription (qRT) PCR Analyses
Total RNA was isolated from five H. tuberosus tissues using
RNAiso Plus (Takara, Tokyo, Japan). The cDNAs were synthe-
sized with M-MLV reverse transcriptase and an oligo(dT) primer
Ta
ble
2.
Sum
mar
yo
fan
no
tati
on
so
fas
sem
ble
dH
.tu
ber
osu
sse
qu
en
ces.
Ass
em
bly
To
tal
seq
ue
nce
sP
hy
toz
om
eN
rU
nip
rot
KO
GK
EG
GT
AIR
GO
To
tal
an
no
tati
on
s
Nu
mb
er
of
tran
scri
pts
27
2,5
48
18
5,1
45
41
,33
42
08
,27
19
5,9
80
35
,18
01
53
,57
31
20
,32
01
92
,96
5
Nu
mb
er
of
loci
66
,32
23
2,7
46
32
,15
63
8,6
68
15
,43
41
1,8
44
28
,78
11
9,8
48
40
,21
5
do
i:10
.13
71
/jo
urn
al.p
on
e.0
11
19
82
.t0
02
Transcriptome Analysis of Jerusalem Artichoke
PLOS ONE | www.plosone.org 4 November 2014 | Volume 9 | Issue 11 | e111982
in a 20 mL volume according to the manufacturer’s instructions
(Invitrogen, Carlsbad, CA, USA). Twenty putative tissue-specific
genes (five per tissue type), were selected for RT-PCR. Quanti-
tative RT-PCR was performed in 10 mL reactions containing
gene-specific primers, 1 mL cDNA as template, and SYBR Premix
Ex Taq. Reactions were performed using a CFX96 Real-Time
PCR system (BioRad, Hercules, CA, USA). The thermal profile
for qRT-PCR was as follows: 3 min at 95uC, followed by 40 cycles
each consisting of 95uC for 25 sec, 60uC for 25 sec and 72uC for
25 sec. Primer specificities and the formation of primer-dimers
were monitored by dissociation curve analysis. The expression
level of H. tuberosus Actin2 (HtActin2) was used as an internal
standard for normalization of cDNA template quantity. RT-PCR
and qRT-PCR reactions were performed in triplicate.
Results and Discussion
3.1 RNA-sequencing and de novo TranscriptomeAssembly of H. tuberosus
Total RNAs were isolated from five different tissues of the PJA
cultivar: leaves, stems, roots, tuberous initial stage 1 (tuber1) and
mature stage 2 (tuber2). The extracted RNAs were then mixed in
equal proportions for mRNA isolation, fragmentation, cDNA
synthesis, and sequencing. RNA sequencing with the Illumina
Hiseq2000 produced 244,101,906 paired-end 101 bp reads
corresponding to more than 24.4 billion base pairs of sequence.
The raw reads were subjected to quality control using FastQC,
and reads were trimmed (Table S1). The total number of high-
quality reads was 206,215,632, and these contained a total of
16,675,072,220 nucleotides. Of these, 68.37% reached a strict
quality score threshold of Q $20 bases and read length $25 bp,
and these were used for de novo assembly [31].
The clean RAN-Seq reads were assembled de novo into contigs
using two assemblers with optimal parameters. First, the reads
were assembled using Velvet-Oases (k-mer = 65) [35,36] to reduce
redundancy and generate longer sequences: 66,322 loci and
272,548 transcripts with lengths $200 bp were produced. Second,
the reads were assembled using the Trinity program [38]: 246,155
transcripts with lengths $200 bp were produced. A comparison of
transcript length distribution between the two assemblies is shown
in Figure S1. Overall, the mean length, maximum length, and
N50 were longer for the Velvet-Oases assembled sequences than
for the Trinity assembled sequences and we therefore used the
Velvet-Oases assembly for subsequent analyses.
The sequences assembled by Velvet-Oases were $200 bp and
had an average length of 761 bp (a total of 4,083,193,637 bp),
N50 length of 1,249 bp, and maximal length of 15,368 bp.
Transcript sequences were also $200 bp and had an average
length of 1,176 bp (a total of 16,675,072,220 bp), N50 length of
1,703 bp, and maximal length of 16,437 bp (Table 1). A
substantial number of transcripts (124,741) had lengths . 1 kb.
These transcripts were clustered, resulting in 66,322 loci that
included 16,013 loci (24.1%) . 1 kb in length (Table 1). The
assembled sequences are deposited at http://112.220.192.2/htu
and are summarized in Table S2. In summary, we generated
genome-wide locus sequences of H. tuberosus, a resource that will
promote functional genomics approaches in Jerusalem artichoke.
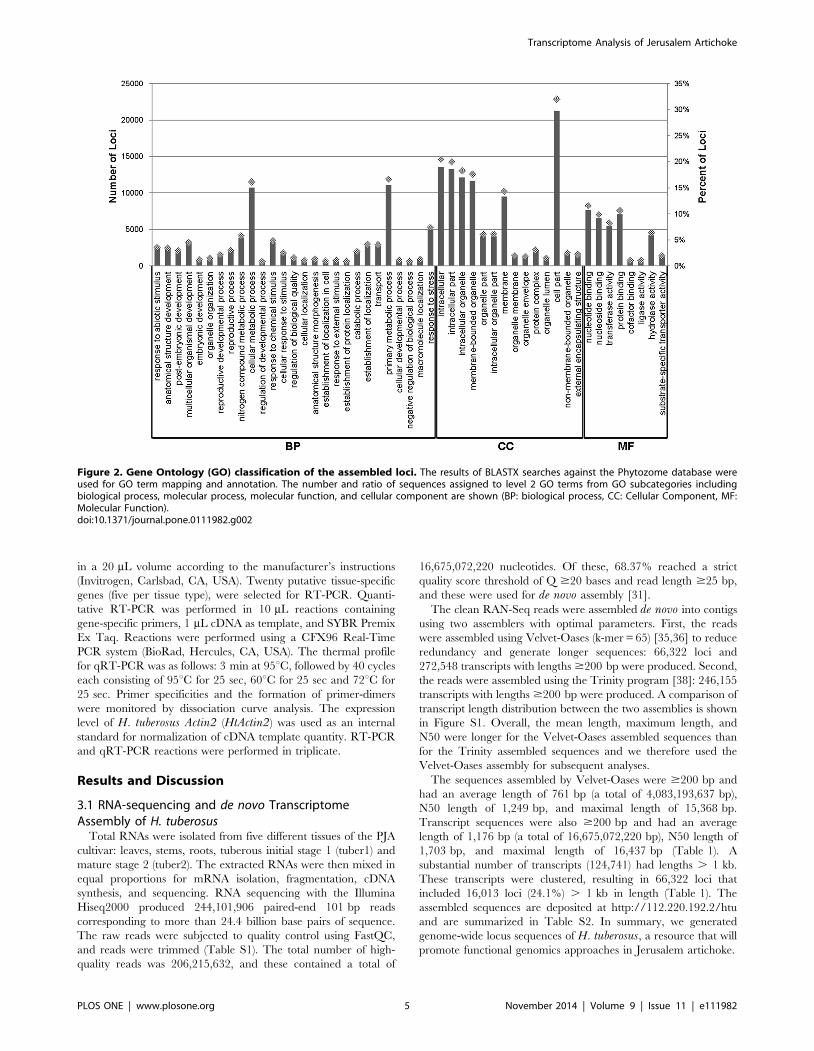
Figure 2. Gene Ontology (GO) classification of the assembled loci. The results of BLASTX searches against the Phytozome database wereused for GO term mapping and annotation. The number and ratio of sequences assigned to level 2 GO terms from GO subcategories includingbiological process, molecular process, molecular function, and cellular component are shown (BP: biological process, CC: Cellular Component, MF:Molecular Function).doi:10.1371/journal.pone.0111982.g002
Transcriptome Analysis of Jerusalem Artichoke
PLOS ONE | www.plosone.org 5 November 2014 | Volume 9 | Issue 11 | e111982
3.2 Validation of Assembled Loci Against PublicallyAvailable ESTs from H. tuberosus
We used publically available EST data to validate the loci
identified by our RNA-Seq and assembly. Sequence information
for ESTs from H. tuberosus was retrived from the NCBI GenBank
database (most recently accessed in January, 2014). BLASTN
analysis of the assembled loci was performed against the H.tuberosus ESTs (40,388 ESTs) and the best hit for each locus was
selected. Of the H. tuberosus ESTs, 35,402 sequences (87.65%)
matched a locus from our assembly, but no match was found for
4,986 ESTs (12.35%). Most of the loci with hit matched the ESTs
with good coverage and assembly quality (Figure S2A). Of our
66,322 loci, 52,174 loci showed no BLAST hits to the H. tuberosusESTs and were thus considered to be putative transcripts newly-
identified by our RNA-Seq analysis.
Transcriptome information is not available for the direct
progenitors of H. tuberosus, Helianthus hirsutus and Helianthusgrosseserratus; however, a curated unigene collection for sunflower
(Helianthus annuus L.) was recently generated by EST assembly
analysis [50]. We used BLASTN to compare our assembled H.tuberosus loci against the ESTs of H. annuus and found that
81.04% of H. annuus ESTs (108,984 out of 134,474) had matches
among the H. tuberosus loci (Figure S2B).
3.3 Functional Annotation of H. tuberosus LociAfter filtering out short-length and low-quality sequences, we
used our assembled locus sequences to perform similarity searches
against public protein databases (Phytozome [51] Nr [52], and
UniProt [53]). Firstly, we searched all six frame translations of our
loci against the Phytozyme protein database using BLASTX
(E-value #1.0E-05). Database matches were found for 32,746 loci
(49.4%). The unmatched loci were further analyzed against the
NCBI non-redundant (Nr) and UniProt database. Additionally,
databases were searched using BLASTN and BLASTX to identify
homologous genes. Overall, 40,215 loci (60.64%) matched
significantly similar sequences within the databases. The 39.36%
of sequences (26,107 loci) without hits may represent novel loci
specific to H. tuberosus. Alternatively, these sequences may have
been too short to produce significant hits. Similar search outcomes
have been observed in previous non-model plant studies [54–56]
(Table 2). Based on the top BLASTX hits against the Phytozome
database, H. tuberosus loci were most similar to sequences from
Vitis vinifera (3,556 loci, 12.02%) followed by Solanum tuberosum(2,869 loci, 9.7%) and Solanum lycopersicum (2,500 loci, 8.45%)
(Figure 1A). The E-value distribution of the top matches showed
that 23.52% of the sequences had an extremely high E-value score
(E-value = 0) and 76.48% of the homologous sequences had values
in the range 1.0E-0521.0E-180 (Figure 1B). The similarity
distribution showed that 18.93% of these sequences had similar-
ities greater than 80%, 42.21% had similarities of 60%280%, and
38.86% had similarities , 60% (Figure 1C).
Loci with matches in the protein databases were examined
further. The translated the coding sequences of these loci had
$90% identity with the matched sequences. Of the annotated
40,215 loci, 10,066 contained a putative full-length transcript (with
39 and 59 untranslated regions). BLAST analysis using those loci
indicated that information from other species was sufficient to
allow annotation of the H. tuberosus loci.
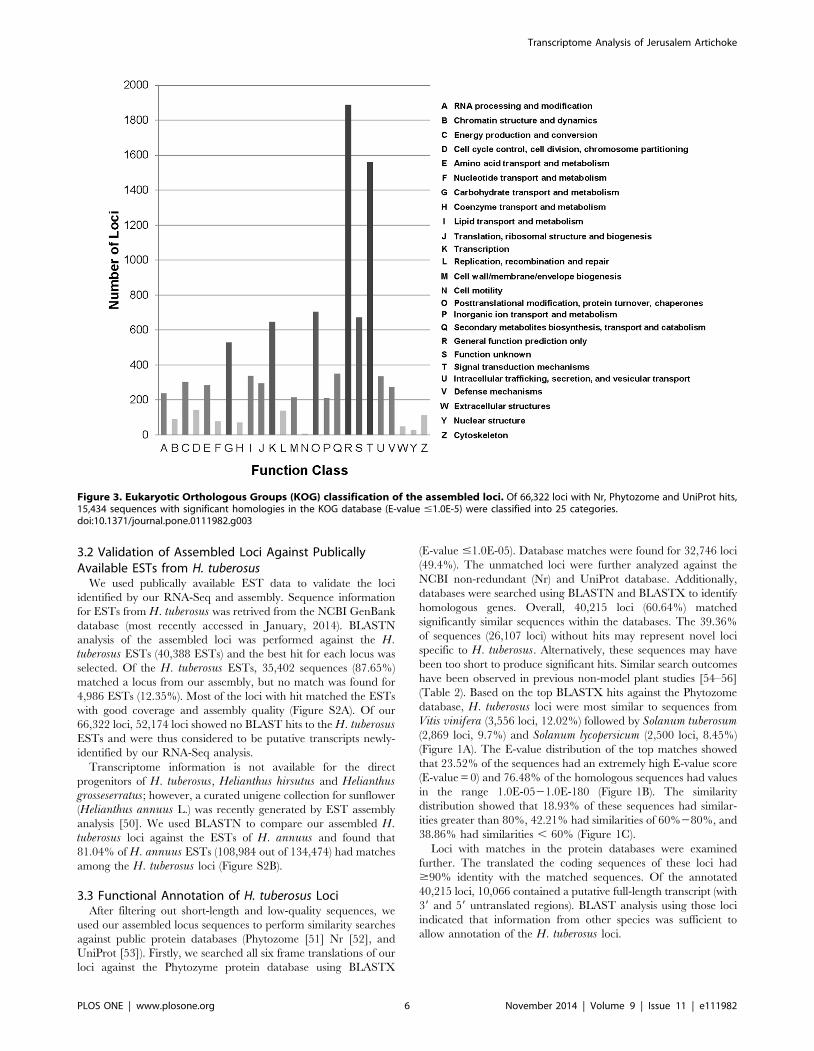
Figure 3. Eukaryotic Orthologous Groups (KOG) classification of the assembled loci. Of 66,322 loci with Nr, Phytozome and UniProt hits,15,434 sequences with significant homologies in the KOG database (E-value #1.0E-5) were classified into 25 categories.doi:10.1371/journal.pone.0111982.g003
Transcriptome Analysis of Jerusalem Artichoke
PLOS ONE | www.plosone.org 6 November 2014 | Volume 9 | Issue 11 | e111982
3.4 Classification of H. tuberosus LociWe used GO term enrichment analysis to classify the functions
of the assembled H. tuberosus loci [44]. The BLASTX similarity
search results for the 66,322 H. tuberosus loci were imported into
the Phytozome database for GO mapping and annotation with
TAIR information. Sequence annotations associated with 19,848
loci (29.93%) were categorized into the three main GO ontologies:
biological process (BP), cellular component (CC), and molecular
function (MF) (Figure 2). In total, 7,589, 8,685 and 8,510 loci were
assigned GO terms from the BP, CC, and MF categories,
respectively. The GO terms were summarized into 49 subcatego-
ries with GO classifications at level 2. In the BP category, the
dominant subcategories assigned to H. tuberosus loci were as
follows: ‘Primary metabolic process’ (15.19%), ‘Cellular metabolic
process’ (14.75%), ‘Response to stress’ (6.76%), ‘Nitrogen com-
pound metabolic process’ (5.33%) and ‘multicellular organismal
development’ (4.08%). In the CC category, ‘Cell part’ (21.61%),
‘Intracellular’ (13.81%), ‘Intracellular part’ (13.49%), ‘Intracellular
organelle’ (12.33%), and ‘Membrane-bounded organelle’ (11.89%)
were the dominant subcategories. Finally, ‘Nucleotide binding’
(22.12%), ‘Protein binding’ (20.45%), ‘Nucleoside binding’
(18.94%), ‘Transferase activity’ (15.80%), and ‘Hydrolase activity’
(12.17%) were dominant in the MF category. These annotations
indicated that extensive membrane metabolic activity occurred in
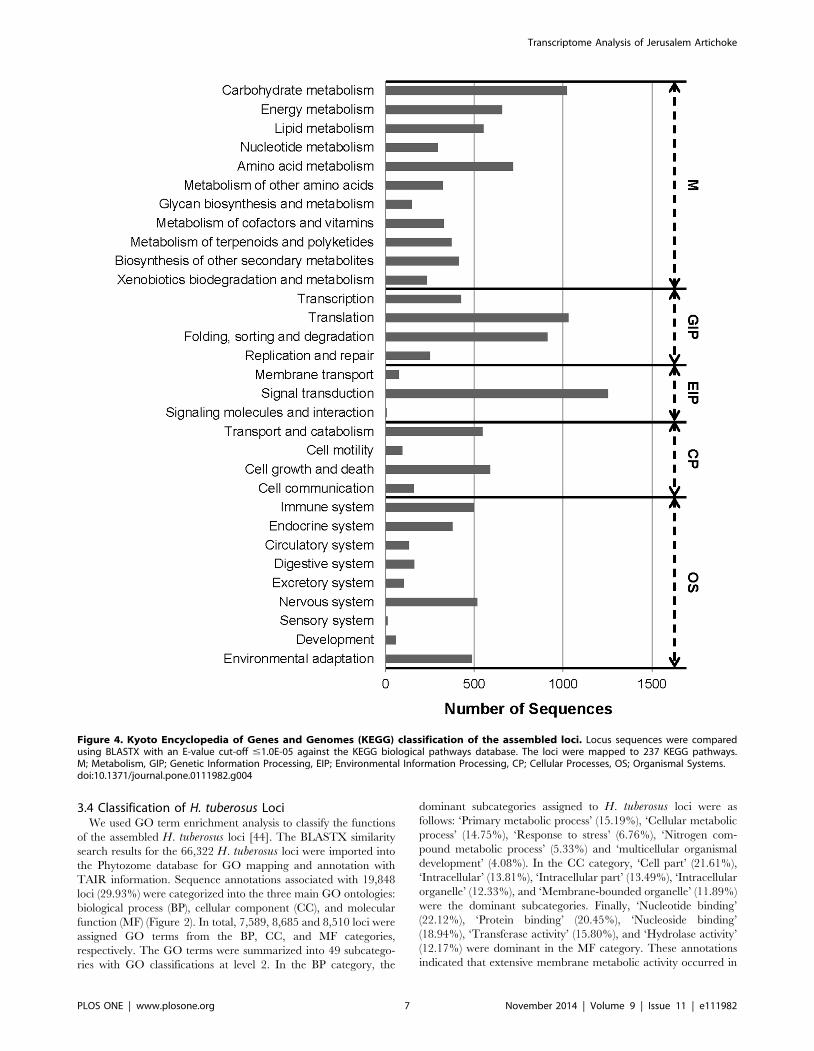
Figure 4. Kyoto Encyclopedia of Genes and Genomes (KEGG) classification of the assembled loci. Locus sequences were comparedusing BLASTX with an E-value cut-off #1.0E-05 against the KEGG biological pathways database. The loci were mapped to 237 KEGG pathways.M; Metabolism, GIP; Genetic Information Processing, EIP; Environmental Information Processing, CP; Cellular Processes, OS; Organismal Systems.doi:10.1371/journal.pone.0111982.g004
Transcriptome Analysis of Jerusalem Artichoke
PLOS ONE | www.plosone.org 7 November 2014 | Volume 9 | Issue 11 | e111982
H. tuberous in the sampled tissues. The loci were analyzed further
for GO-category enrichment relative to Plant GO slim categories
using AgriGO [43]. The H. tuberosus loci contained 71
significantly enriched (FDR # 0.01) functional GO terms in the
BP category, including top five terms (‘‘cellular process’’,
GO:0009987; ‘‘cellular metabolic process’’, GO:0044237; ‘‘met-
abolic process’’, GO:0008152, ‘‘primary metabolic process’’,
GO:0044238, and ‘‘response to stimulus’’, GO:0050896, respec-
tively). The GO term ‘‘cellular, macromolecule, nitrogen com-
pound and primary metabolic process’’ was highly enriched
(FDR#1.0E-40), and enriched daughter terms included ‘‘nucleo-
base, nucleoside, nucleotide and nucleic acid metabolic process’’
(GO:0006139), ‘‘cellular macromolecule metabolic process’’
(GO:0044260), ‘‘macromolecule modification’’ (GO:0043412),
‘‘carbohydrate metabolic process’’ (GO:0005975; including sever-
al loci with fructan 1,2-beta-fructan 1-fructosyltransferase, inver-
tase, hexokinase, sucrose synthase, sucrose phosphate synthase,
starch synthase, starch branching enzyme, and beta glucosidase
sequences), and ‘‘cellular biosynthetic process’’ (GO:00044249;
sucrose 1F-beta-D-fructosyltransferase). These results suggest that
gene expression in H. tuberosus is geared towards carbohydrate
metabolism, cellular biosynthetic processes, and macromolecule
modification functions. This expression enrichment concurs with
biosynthetic analysis results indicating that inulin accumulation
occurs at the time of tuber initiation [4,19]. An additional enriched
GO term was ‘‘protein modification process’’ (GO:0006464). This
included loci with cyclophilin, FKBP-type peptidyl-prolyl cis-trans
isomerase, CONSTANS-like 4, heat shock protein 7, chaperones
protein chaperone, and transferase sequences. As in the MF
category, loci were associated with 16 significantly enriched GO
terms. These included the level two terms ‘‘catalytic activity’’
(GO:0003824), ‘‘binding’’ (GO:0005488), ‘‘transporter activity’’
(GO:0005215), and ‘‘receptor activity’’ (GO:0004872), the level
three terms ‘‘protein binding’’ (GO:0005515), ‘‘transferase activ-
ity’’ (GO:0016740), and ‘‘hydrolase activity’’ (GO:0016787), and
the level four terms ‘‘transferase activity, transferring phosphorus-
containing groups’’ (GO:0016772) and ‘‘hydrolase activity, acting
on acid anhydrides’’ (GO:0016817, including several fructosyl-
transferase loci). The most significantly enriched of these was the
level two term ‘‘catalytic activity’’. In the CC category, the GO
terms ‘‘cytoplasmic part’’ (GO:0044444), ‘‘interacellular mem-
brane-bounded organelle’’ (GO:0043231), ‘‘interacellular organ-
elle part’’ (GO:0044446) and their daughter terms (‘‘plastid’’,
‘‘Golgi apparatus’’, ‘‘cytosol’’ and ‘‘vacuole’’) were highly enriched
(FDR#1.0E-60). These enrichments correspond with the involve-
ment of storage organelles in tuber inulin accumulation. The
‘‘vacuole’’ term was also found to be significantly enriched in tuber
samples. The H. tuberosus annotation results were similar to those
from the potato and sweet potato transcriptomes [57–60]. The
majority of the sequenced H. tuberosus loci were associated with
fundamental regulatory and metabolic processes in the membrane.
To assess the functionality of the H. tuberosus transcriptome,
the annotated loci were matched to the Eukaryotic Orthologous
Groups (KOGs) database to find homologous genes. The search
outcomes were used to determine sequence directions within loci
[45]. The 66,322 loci were annotated with 15,434 KOG terms in
25 classifications (Figure 3). Each KOG term represents a
conserved domain; therefore, these results indicated that a large
proportion of the putative proteins encoded by the assembled
locus sequences had protein domains with existing functional
annotations [45]. The cluster for ‘General function’ prediction
(19.77%) was the most frequently identified group, followed by
‘Signal transduction mechanisms’ (16.34%), ‘Post translational
modification, protein turnover, chaperones’ (7.37%), ‘Function
unknown’ (7.03%), ‘Transcription’ (6.78%), ‘Carbohydrate trans-
port and metabolism’ (5.53%), and ‘Secondary metabolites
biosynthesis, transport and catabolism’ (3.67%).
In addition, to identify active biochemical pathways, we
mapped the H. tuberosus loci onto the KEGG pathways using
BLASTX and the KEGG Automatic Annotation Server [47,48].
KO identifiers were assigned to 11,844 loci, using the KEGG
orthology that contains 4,531 Enzyme Codes [46]. A number of
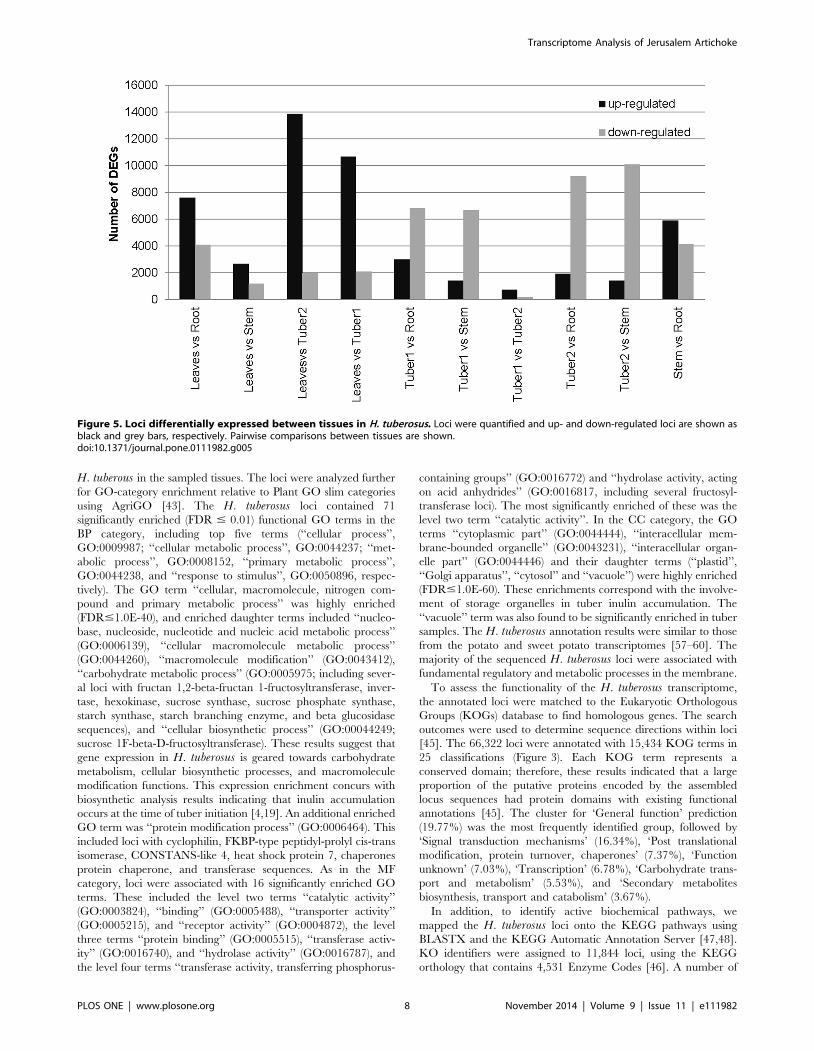
Figure 5. Loci differentially expressed between tissues in H. tuberosus. Loci were quantified and up- and down-regulated loci are shown asblack and grey bars, respectively. Pairwise comparisons between tissues are shown.doi:10.1371/journal.pone.0111982.g005
Transcriptome Analysis of Jerusalem Artichoke
PLOS ONE | www.plosone.org 8 November 2014 | Volume 9 | Issue 11 | e111982
KEGG pathways (237) were associated . 5 loci. The prevalent
pathways represented were ‘Ribosome’ (408 loci), ‘Plant hormone
signal transduction’ (365 loci), ‘Plant-pathogen interaction’ (365
loci), ‘Protein processing in endoplasmic reticulum’ (354 loci),
‘Spliceosome’ (329 loci), ‘Neurotrophin signaling pathway’ (285
loci), and ‘Starch and sucrose metabolism’ (276 loci) (Table S3).
The number of sequences associated with subcategories in the top
five KO categories are shown in Figure 4. Among the identified
functional categories, ‘Signal transduction’ (1,252 loci), ‘Transla-
tion’ (1,029 loci), ‘Carbohydrate metabolism’ (1,023 loci), and
‘Folding, sorting and degradation’ (913 loci) were the most highly
represented. These results showed that loci involved in processing
of genetic information, pathogen resistance, and carbohydrate
metabolism were active in H. tuberosus in the sampled tissues. The
KEGG annotations provided valuable information for investiga-
tion of metabolic processes, functions and pathways involved in
H. tuberosus metabolism.
3.5 Identification of Differentially Expressed Loci usingRNA-Seq Data
RNA-Seq data were used for the identification of differentially
expressed genes (DEGs) in different H. tuberosus tissues. More
than 4.8 million raw reads were obtained from the libraries for
each tissue (roots, stems, tuber1, tuber2, and leaves) (Table S1). To
create a unified library, the reads were normalized by the total
read count for gene expression in each tissue library (Figure S3).
Next, Likelihood Ratio Tests were used to correct p-values, and
libraries were median normalized. DEGs were identified using the
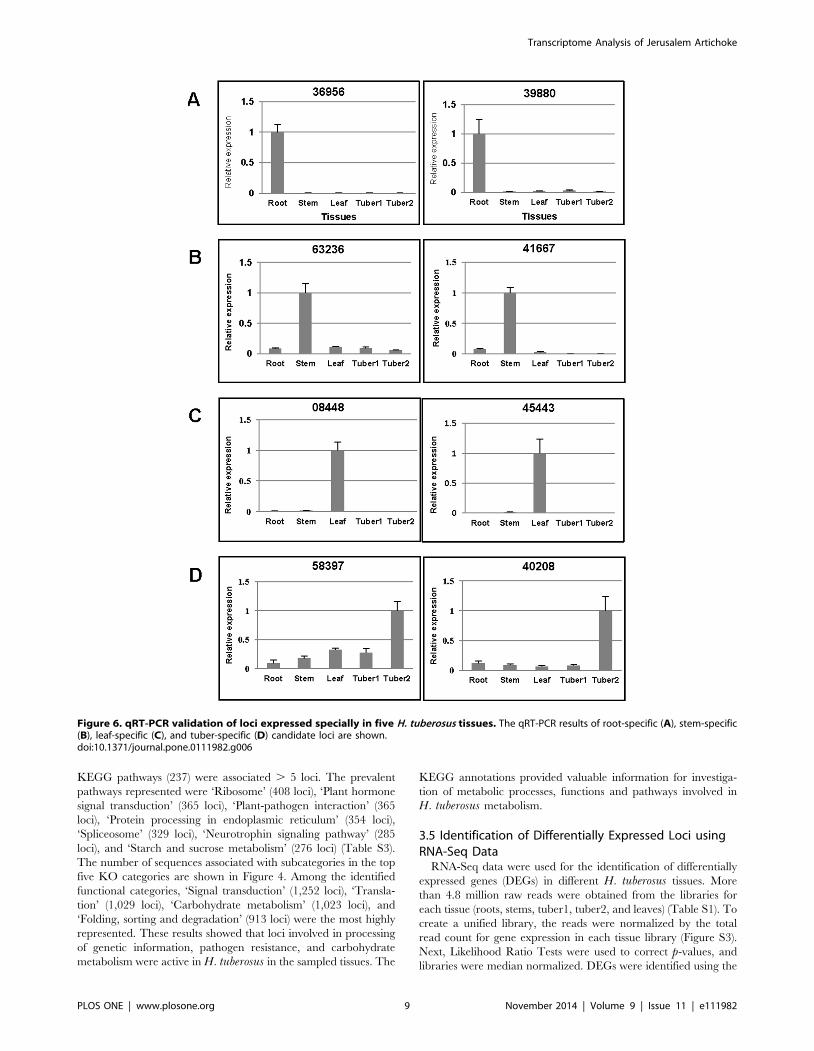
Figure 6. qRT-PCR validation of loci expressed specially in five H. tuberosus tissues. The qRT-PCR results of root-specific (A), stem-specific(B), leaf-specific (C), and tuber-specific (D) candidate loci are shown.doi:10.1371/journal.pone.0111982.g006
Transcriptome Analysis of Jerusalem Artichoke
PLOS ONE | www.plosone.org 9 November 2014 | Volume 9 | Issue 11 | e111982
Ta
ble
3.
Ide
nti
fica
tio
no
fg
en
es
invo
lve
din
inu
linb
iosy
nth
esi
sin
H.
tub
ero
sus.
En
zy
me
EC
nu
mb
er
Lo
cus
IDR
ea
dC
ou
nt
(lo
g2
)
Ro
ot
Ste
mT
ub
er2
Tu
be
r1L
ea
f
He
xoki
nas
e2
.7.1
.10
11
62
10
.41
9.9
78
.38
8.6
79
.46
05
27
41
0.2
88
.45
7.8
48
.06
9.7
9
07
02
87
.97
10
.24
8.5
68
.42
9.0
0
12
65
77
.77
6.5
55
.70
6.2
96
.58
49
51
98
.80
6.3
06
.29
5.2
57
.04
49
90
45
.17
4.4
63
.58
4.1
75
.25
Sucr
ose
Ph
osp
hat
eSy
nth
ase
2.4
.1.1
40
23
69
7.1
37
.71
5.1
75
.73
10
.08
21
07
41
1.0
71
2.0
01
2.4
41
2.3
91
1.1
7
22
46
58
.67
6.2
56
.83
6.5
56
.98
37
94
16
.55
2.0
02
.00
3.0
04
.70
61
41
88
.95
10
.03
10
.17
10
.28
9.5
6
61
92
37
.17
8.0
78
.35
8.2
87
.23
Sucr
ose
Syn
thas
e2
.4.1
.13
01
94
31
4.8
91
3.1
41
3.6
71
4.2
11
1.9
1
04
07
51
1.8
91
3.2
91
2.2
71
1.9
31
1.5
0
06
00
64
.75
7.7
55
.70
7.1
38
.16
13
50
97
.55
6.0
46
.04
4.8
65
.64
20
92
53
.81
4.0
03
.00
1.0
04
.58
23
50
53
.70
1.0
01
.00
1.0
01
.00
35
58
54
.58
3.0
01
.00
0.0
02
.58
38
81
24
.39
3.5
81
.00
1.5
82
.58
47
53
16
.83
6.3
65
.64
3.7
06
.78
48
85
04
.46
2.5
82
.32
2.3
23
.58
Sucr
ose
Ph
osp
hat
eP
ho
sph
atas
e3
.1.3
.24
11
01
08
.70
8.0
38
.43
8.2
68
.22
44
75
28
.61
8.6
26
.48
6.0
28
.83
Fru
ctan
:fr
uct
an1
,2
-be
ta-f
ruct
an1
-fru
cto
sylt
ran
sfe
rase
2.4
.1.1
00
01
76
81
1.8
61
3.8
81
5.0
11
3.7
61
0.8
0
Sucr
ose
:su
cro
se1
F-b
eta
-D-f
ruct
osy
ltra
nsf
era
se2
.4.1
.99
33
97
11
4.5
11
6.1
31
7.4
41
5.3
51
1.5
6
53
61
95
.64
7.2
58
.46
6.3
93
.32
Sucr
ose
6-f
ruct
osy
ltra
nsf
era
se2
.4.1
.10
14
81
67
.55
7.9
86
.94
6.3
97
.43
17
74
58
.25
6.7
35
.81
6.0
08
.81
18
46
34
.91
4.3
22
.58
3.0
05
.78
Fru
ctan
1-e
xoh
ydro
lase
Iia3
.2.1
.15
30
07
07
11
.55
10
.70
8.6
91
1.6
51
1.9
0
32
74
68
.73
7.5
45
.81
7.6
03
.81
34
04
09
.18
7.9
28
.08
8.4
85
.52
Solu
ble
acid
Inve
rtas
e3
.2.1
.26
06
72
81
0.3
81
0.9
57
.92
7.8
59
.66
Transcriptome Analysis of Jerusalem Artichoke
PLOS ONE | www.plosone.org 10 November 2014 | Volume 9 | Issue 11 | e111982
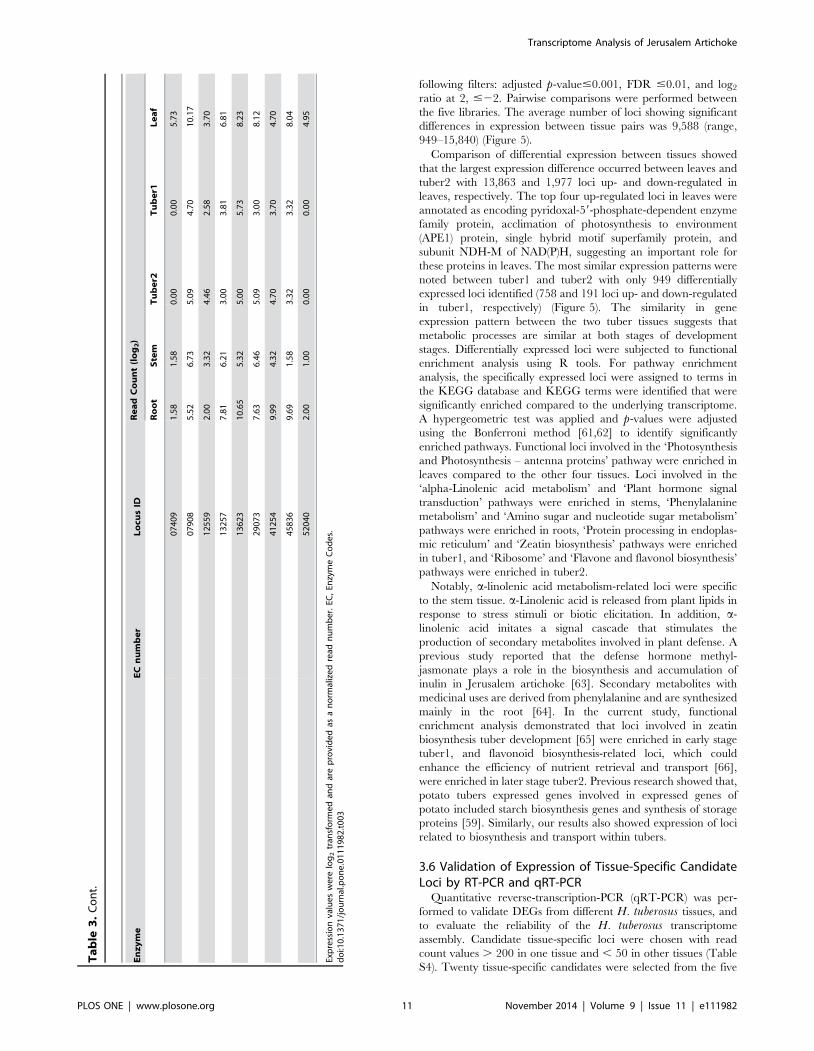
following filters: adjusted p-value#0.001, FDR #0.01, and log2
ratio at 2, #22. Pairwise comparisons were performed between
the five libraries. The average number of loci showing significant
differences in expression between tissue pairs was 9,588 (range,
949–15,840) (Figure 5).
Comparison of differential expression between tissues showed
that the largest expression difference occurred between leaves and
tuber2 with 13,863 and 1,977 loci up- and down-regulated in
leaves, respectively. The top four up-regulated loci in leaves were
annotated as encoding pyridoxal-59-phosphate-dependent enzyme
family protein, acclimation of photosynthesis to environment
(APE1) protein, single hybrid motif superfamily protein, and
subunit NDH-M of NAD(P)H, suggesting an important role for
these proteins in leaves. The most similar expression patterns were
noted between tuber1 and tuber2 with only 949 differentially
expressed loci identified (758 and 191 loci up- and down-regulated
in tuber1, respectively) (Figure 5). The similarity in gene
expression pattern between the two tuber tissues suggests that
metabolic processes are similar at both stages of development
stages. Differentially expressed loci were subjected to functional
enrichment analysis using R tools. For pathway enrichment
analysis, the specifically expressed loci were assigned to terms in
the KEGG database and KEGG terms were identified that were
significantly enriched compared to the underlying transcriptome.
A hypergeometric test was applied and p-values were adjusted
using the Bonferroni method [61,62] to identify significantly
enriched pathways. Functional loci involved in the ‘Photosynthesis
and Photosynthesis – antenna proteins’ pathway were enriched in
leaves compared to the other four tissues. Loci involved in the
‘alpha-Linolenic acid metabolism’ and ‘Plant hormone signal
transduction’ pathways were enriched in stems, ‘Phenylalanine
metabolism’ and ‘Amino sugar and nucleotide sugar metabolism’
pathways were enriched in roots, ‘Protein processing in endoplas-
mic reticulum’ and ‘Zeatin biosynthesis’ pathways were enriched
in tuber1, and ‘Ribosome’ and ‘Flavone and flavonol biosynthesis’
pathways were enriched in tuber2.
Notably, a-linolenic acid metabolism-related loci were specific
to the stem tissue. a-Linolenic acid is released from plant lipids in
response to stress stimuli or biotic elicitation. In addition, a-
linolenic acid initates a signal cascade that stimulates the
production of secondary metabolites involved in plant defense. A
previous study reported that the defense hormone methyl-
jasmonate plays a role in the biosynthesis and accumulation of
inulin in Jerusalem artichoke [63]. Secondary metabolites with
medicinal uses are derived from phenylalanine and are synthesized
mainly in the root [64]. In the current study, functional
enrichment analysis demonstrated that loci involved in zeatin
biosynthesis tuber development [65] were enriched in early stage
tuber1, and flavonoid biosynthesis-related loci, which could
enhance the efficiency of nutrient retrieval and transport [66],
were enriched in later stage tuber2. Previous research showed that,
potato tubers expressed genes involved in expressed genes of
potato included starch biosynthesis genes and synthesis of storage
proteins [59]. Similarly, our results also showed expression of loci
related to biosynthesis and transport within tubers.
3.6 Validation of Expression of Tissue-Specific CandidateLoci by RT-PCR and qRT-PCR
Quantitative reverse-transcription-PCR (qRT-PCR) was per-
formed to validate DEGs from different H. tuberosus tissues, and
to evaluate the reliability of the H. tuberosus transcriptome
assembly. Candidate tissue-specific loci were chosen with read
count values . 200 in one tissue and , 50 in other tissues (Table
S4). Twenty tissue-specific candidates were selected from the five
Ta
ble
3.
Co
nt.
En
zy
me
EC
nu
mb
er
Lo
cus
IDR
ea
dC
ou
nt
(lo
g2
)
Ro
ot
Ste
mT
ub
er2
Tu
be
r1L
ea
f
07
40
91
.58
1.5
80
.00
0.0
05
.73
07
90
85
.52
6.7
35
.09
4.7
01
0.1
7
12
55
92
.00
3.3
24
.46
2.5
83
.70
13
25
77
.81
6.2
13
.00
3.8
16
.81
13
62
31
0.6
55
.32
5.0
05
.73
8.2
3
29
07
37
.63
6.4
65
.09
3.0
08
.12
41
25
49
.99
4.3
24
.70
3.7
04
.70
45
83
69
.69
1.5
83
.32
3.3
28
.04
52
04
02
.00
1.0
00
.00
0.0
04
.95
Exp
ress
ion
valu
es
we
relo
g2
tran
sfo
rme
dan
dar
ep
rovi
de
das
an
orm
aliz
ed
read
nu
mb
er.
EC,
Enzy
me
Co
de
s.d
oi:1
0.1
37
1/j
ou
rnal
.po
ne
.01
11
98
2.t
00
3
Transcriptome Analysis of Jerusalem Artichoke
PLOS ONE | www.plosone.org 11 November 2014 | Volume 9 | Issue 11 | e111982
tissues. Primer sets were designed to verify tissue-specific
expression (Table S5) and were used for RT-PCR validation
(Figure S4). Quantification of tissue-specific loci was conducted
using qRT-PCR with two tissue-specific loci for each tissue.
Locus 36956 (similar to Arabidopsis 1-AMINOCYCLOPRO-
PANE-1-CARBOXYLATE OXIDASE (AT2G19590), which is
involved in cell wall macromolecule metabolic processes), and
locus 39880 (similar to AT4G12520, which is annotated as
‘bifunctional inhibitor/lipid-transfer protein/seed storage 2S
albumin superfamily protein) were confirmed as uniquely
expressed in root tissue (Figure 6A). Similarly, locus 63236 (similar
to CYSTEINE PROTEINASES SUPERFAMILY PROTEIN
(AT5G50260)), and locus 41667 (similar to HPT PHOSPHO-
TRANSMITTER 4 (AT3G16360)), were highly expressed in stem
(Figure 6B). Locus 08448 (similar to MLP-LIKE PROTEIN 28
(AT1G70830)), and locus 45443 (similar to PLANT PROTEIN
OF UNKNOWN FUNCTION (AT3G02645)) were confirmed to
be predominently expressed in leaf tissue (Figure 6C). Locus
58397 (similar to INTEGRASE-TYPE DNA-BINDING SUPER-
FAMILY PROTEIN (AT5G52020)), and locus 40208 (similar to
an F-box and associated interaction domains-containing protein
(AT4G12560)) were highly expressed in tuber tissues, in either a
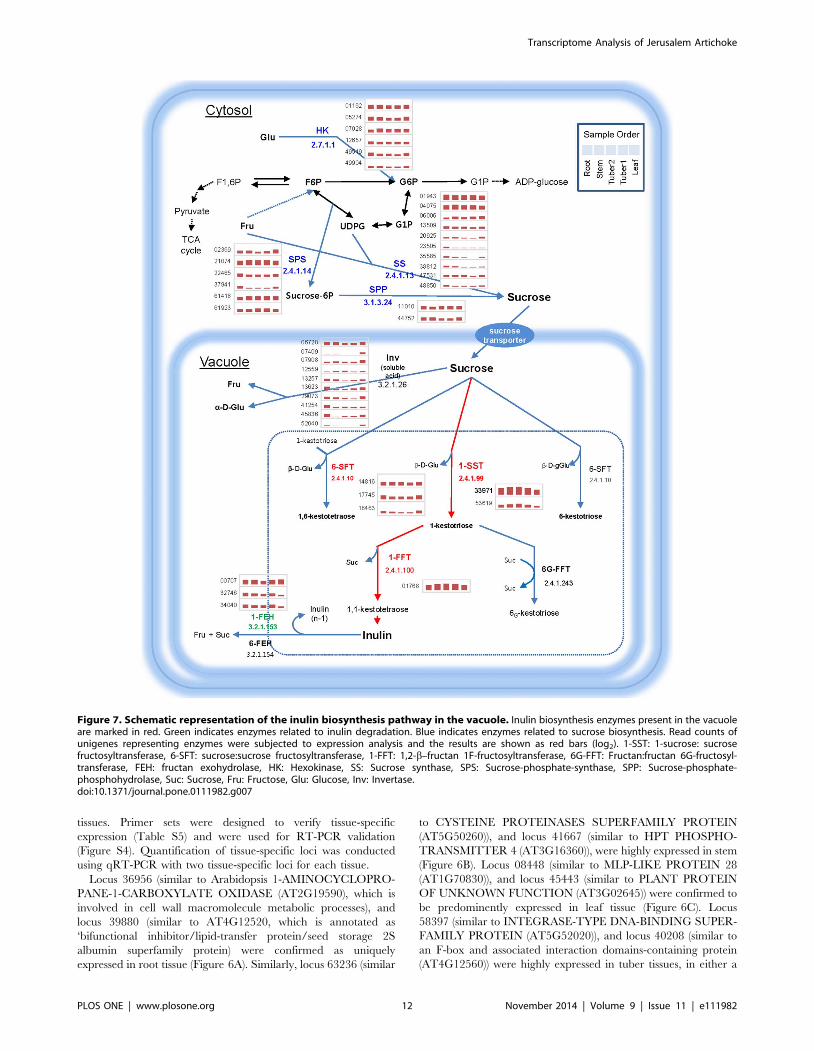
Figure 7. Schematic representation of the inulin biosynthesis pathway in the vacuole. Inulin biosynthesis enzymes present in the vacuoleare marked in red. Green indicates enzymes related to inulin degradation. Blue indicates enzymes related to sucrose biosynthesis. Read counts ofunigenes representing enzymes were subjected to expression analysis and the results are shown as red bars (log2). 1-SST: 1-sucrose: sucrosefructosyltransferase, 6-SFT: sucrose:sucrose fructosyltransferase, 1-FFT: 1,2-b–fructan 1F-fructosyltransferase, 6G-FFT: Fructan:fructan 6G-fructosyl-transferase, FEH: fructan exohydrolase, HK: Hexokinase, SS: Sucrose synthase, SPS: Sucrose-phosphate-synthase, SPP: Sucrose-phosphate-phosphohydrolase, Suc: Sucrose, Fru: Fructose, Glu: Glucose, Inv: Invertase.doi:10.1371/journal.pone.0111982.g007
Transcriptome Analysis of Jerusalem Artichoke
PLOS ONE | www.plosone.org 12 November 2014 | Volume 9 | Issue 11 | e111982
stage-specific or non-stage-specific pattern (Figure 6D). The
Arabidopsis genes similar to each annotated locus are shown in
Table S5.
3.7 SSR Markers in the H. tuberosus TranscriptomeH. Tuberosus sequences (66,322 loci) were examined for SSRs.
A total number of 10,778 SSRs were identified from 8,746 unique
loci. Of these, 1,604 loci contained more than one of SSR motif
(Table S6). The SSR frequency in the H. tuberosus transcriptome
was 16.25% and the average distance between SSRs was 4.68 kb.
Di-nucleotide repeats constituted the most abundant class,
followed by tri-nucleotide repeats (Figure S5A, Table S7). In
addition, among the specific repeat motifs, di- and tri-nucleotide
repeats were the most common, with AG/CT motifs accounting
for 41.31% of the di-nucleotide repeats, fllowed by ATC/ATG
(11.1%), ACC/GGT (9.41%), and AAG/CTT (8.25%) (Figure
S5B). SSRs are thought to affect chromatin organization, gene
regulation, recombination, DNA replication, the cell cycle, and
mismatch repair [67]. In addition, SSR markers are invaluable for
genetic diversity analysis [68].
Our transcriptome survey revealed that di-nucleotide repeats
(37.53%) are more abundant in Jerusalem artichoke than are tri-
(31.13%), mono- (28.38%), tetra- (1.9%), penta- (0.55%) and
hexanucleotide repeats (0.51%). These microsatellite characteris-
tics concur with those in the transcriptomes of several other plants
[69–71]. Our SSR data therefore represent an important resource
for the development of molecular markers for research and
molecular breeding of Jerusalem artichoke.
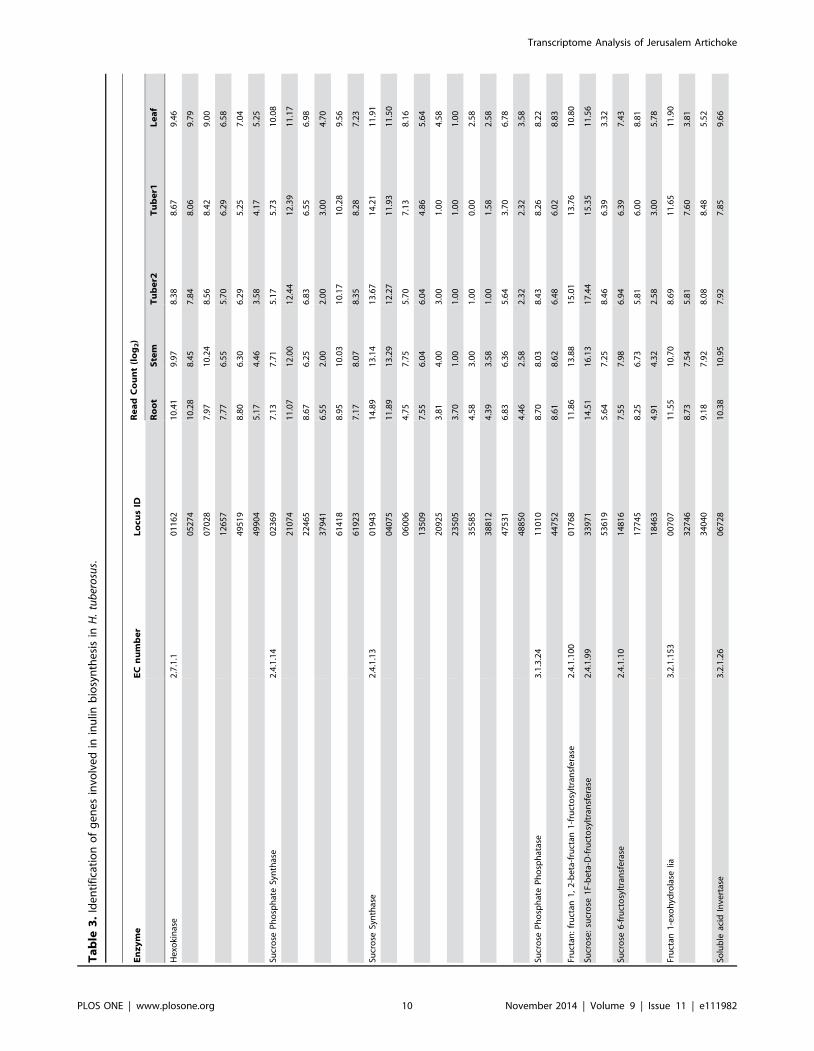
3.8 Loci from the H. tuberosus Transcriptome Involved inthe Inulin Biosynthesis Pathway
Inulin has phamarceutical applications in treating diabetes and
obesity. In H. tuberosus, inulin mainly accumulates in tuber tissue,
and it was therefore of interest to identify the genes responsible for
biosynthesis and vacuolar storage of inulins in tubers. We used our
RNA-Seq data to conduct expression profiling of loci related to
carbohydrate metabolism (Figure 7). Cytosolic sucrose is the only
substrate for inulin biosynthesis. Two major enzymes, fructan 1, 2-
beta-fructan 1-fructosyltransferase (1-FFT) and sucrose:sucrose 1F-
beta-D-fructosyltransferase (1-SST), function in transport of
sucrose [72]. The proteins encoded by the loci involved in sucrose
biosynthesis are likely to be present mainly in the cytosol, whereas
the proteins involved in fructose chain formation are likely be
present in the vacuole. We analyzed the expression of loci
encoding major carbohydrate metabolic enzymes in different
tissues to understand the inulin biosynthesis pathway in H.tuberosus. The four key enzymes involved in sucrose biosynthesis,
hexokinase (6 loci), sucrose phosphate synthase (6 loci), sucrose
synthase (10 loci) and sucrose phosphate phosphatase (2 loci), were
expressed in most tissues; however, some of the loci showed tissue-
specificity and had very low expression levels (Figure 7). Two
essential enzymes in inulin biosynthesis, 1-FFT and 1-SST, were
more strongly expressed in tuber1 and tuber2 tissues than in other
tissues. Locus 33971, annotated as 1-SST, showed 7.6-fold and 59-
fold higher expression in tuber tissue than in root and leaf tissues,
respectively. Another key enzyme, 1-FFT (locus 01768), also
showed tuber tissue-specificity with high expression levels. Locus
01768 was expressed more than 18.6-fold and 9-fold higher in
tuber tissue than in leaf and root tissues, respectively. Interestingly,
the fructan 1-exohydrolase (1-FEH) enzyme involved in inulin
degradation was not highly expressed; rather, gene expression was
lower in tuber tissue than in other tissues (Table 3). In summary,
we identified loci corresponding to 1-FFT and 1-SST, which are
two key enzymes involved in inulin biosynthesis, and demonstrated
that these unigenes were more highly expressed in tuber than in
other tissues. These results are consistent with inulin biosynthesis
occurring mainly in tuber tissue.
Conclusions
We took advantage of RNA-Seq technology from the Illumina
platform to investigate metabolic pathways and tissue-specific gene
expression in a non-model plant species. Our transcriptome
analysis used raw data at an unprecedented depth (20.6 Gbp) and
produced a total of 66,322 assembled loci using de novoassemblers. Of these loci, 87.65% were novel sequences not
present in the most recently released H. tuberosus EST database.
We mapped 11,844 loci onto 237 KEGG pathways, including
‘Carbohydrate metabolism’ and ‘Signal transduction and Trans-
lation pathways’. We further found 43 loci that functioned in
sucrose and inulin metabolism. We performed RT-PCR with 20
tissue-specific candidate loci, and most tissue-specific candidate
loci were expressed mainly in specific H. tuberosus tissues. In
addition, qRT-PCR results confirmed the reliability of the H.tuberosus transcriptome assembly and tissue-specificity of ex-
pressed loci. SSR markers were identified, and these could provide
primary information for analysis of polymorphisms within
Jerusalem artichoke populations. The assembled transcriptome
sequences and additional data make a substantial contribution to
the existing genomic resources for H. tuberosus and will serve to
enable functional genomics research in H. tuberosus.
Supporting Information
Figure S1 Length distributions of transcripts assem-bled with Trinity and Velvet-Oases algorithms.(TIF)
Figure S2 Venn diagrams comparing de novo assem-bled sequences and available ESTs of H. annuus. andH. tuberosus.(TIF)
Figure S3 Hierarchical cluster analysis of expressedloci in H. tuberosus tissues.(TIF)
Figure S4 RT-PCR analysis of loci expresses in specifictissues.(TIF)
Figure S5 Summary of simple sequence repeats identi-fied in the H. tuberosus transcriptome.(TIF)
Table S1 Summary of H. tuberosus transcriptomesequencing.(TIF)
Table S2 Sequence annotations of the H. tuberosustranscriptome against the Phytozome database andlocus expression levels (Read count).(XLS)
Table S3 Summary of loci involved in KEGG pathwaysand KO categories.(XLS)
Transcriptome Analysis of Jerusalem Artichoke
PLOS ONE | www.plosone.org 13 November 2014 | Volume 9 | Issue 11 | e111982
Table S4 Summary of pairwise comparisons of lociexpressed in specific H. tuberosus tissues.
(TIF)
Table S5 H. tuberosus tissue-specific locus candidatesand their primers.
(TIF)
Table S6 SSR search statistics.
(TIF)
Table S7 Distribution of different repeat type classes inthe H. tuberosus transcriptome.(TIF)
Author Contributions
Conceived and designed the experiments: HSC J-HJ WYJ SSL. Performed
the experiments: WYJ SSL HSK SRM JSM SYK J-HJ. Analyzed the data:
HSC WYJ SSL CWK. Contributed reagents/materials/analysis tools:
WYJ SSL. Contributed to the writing of the manuscript: HSC J-HJ WYJ.
References
1. Kosaric N, Cosentino GP, Wieczorek A, Duvnjak Z (1984) The Jerusalem
artichoke as an agricultural crop. Biomass 5: 1–36.
2. Monti A, Amaducci MT, Venturi G (2005) Growth response, leaf gas exchange
and fructans accumulation of Jerusalem artichoke (Helianthus tuberosus L.) as
affected by different water regimes. European Journal of Agronomy 23: 136–
145.
3. Yildiz GSP, Gungor T (2006) The effect of dietary Jerusalem artichoke
(Helianthus tuberosus L.) on performance, egg quality characteristics and egg
cholesterol content in laying hens. Czech J Anim Sci 51: (8): 349–354.
4. Kays SJ, Nottingham SF (2008) Biology and Chemistry of Jerusalem Artichoke
Helianthus tuberosus L. CRC press: 478.
5. G DD B CB (1977) Irrigation, Fertilizer, Harvest Dates and Storage Effects on
the Reducing Sugar and Fructose Concentrations of Jerusalem Artichoke
Tubers. Can J Plant Sci. 591–596.
6. Swanton CJ CPB, Clements DR, Moore ML (1992) The biology of Canadian
weeds: 101. Helianthus tuberosus L. Can J Plant Sci 72: 1367–1382.
7. Schilling EHC (1981) Infragenic classification of Helianthus (Compositae).
Taxon 30(2): 393–403.
8. Schilling EE, Linder CR, Noyes R, Riesberg LH (1998) Phylogenetic
relationships in Helianthus (Asteraceae) based on nuclear ribosomal DNA
internal transcribed spacer region sequence data. Systemic Botany 23: 177–187.
9. Timme RE, Simpson BB, Linder CR (2007) High-resolution phylogeny for
Helianthus (Asteraceae) using the 18S–26S ribosomal DNA external transcribed
spacer. Am J Bot 94: 1837–1852.
10. Straub SC, Parks M, Weitemier K, Fishbein M, Cronn RC, et al. (2012)
Navigating the tip of the genomic iceberg: Next-generation sequencing for plant
systematics. Am J Bot 99: 349–364.
11. Bock DG, Kane NC, Ebert DP, Rieseberg LH (2014) Genome skimming reveals
the origin of the Jerusalem Artichoke tuber crop species: neither from Jerusalem
nor an artichoke. New Phytol 201: 1021–1030.
12. Knapp S (2014) Why is a raven like a writing desk? Origins of the sunflower that
is neither an artichoke nor from Jerusalem. New Phytologist 201: 710–711.
13. RK HGaW (1993) The origin, distribution and evolution of fructans, in Science
and Technology of Fructans. CRC Press: 119–139.
14. Meijer WJM, Mathijssen EWJM (1992) Experimental and simulated production
of inulin by chicory and Jerusalem artichoke. Industrial Crops and Products 1:
175–183.
15. Van LJ CJ, Delzenne N, Hoebergs H, Smith G (1995) On the of inulin and oligo
fructose as natural ingredients in the Western diets. Critical Review in Food Sci
and Nutr 35: S25–S52.
16. De Mastro G, Manolio GaM V (2004) Jerusalem Artichoke (Helianthus
tuberosus L.) and Chicory (Cichorium intybus L.): Potential crops for inulin
production in the Mediterranean area. Acta Hortic 629: 365–374.
17. Fuchs A (1993) Inulin and Inulin-Containing Crops. 309–322.
18. L DL (1996) Production and use of inulin: industrial reality with a promising
future, in Carbohydrates as Organic Raw Materials III. 67–92.
19. McLaurin WJ SZC, Kays SJ (1999) Jerusalem artichoke growth, development,
and field storage. J Plant Nutr 22: 1303–1313.
20. S S (1999) Agronomic performance of root chicory, Jerusalem artichoke, and
sugarbeet in stress and non-stress environments. Vascul Pharmacol 39: 1815–
1823.
21. Vervoort L VdMG, Augustijns P, Busson R, Toppet S, Kinget R (1997) Inulin
hydrogels as carriers for clonic drug targeting: I. Synthesis and characterization
of methacrylated inulin and hydrogel formation. Phamarceutical Research 14:
1730–1737.
22. Hinrichs WL, Prinsen MG, Frijlink HW (2001) Inulin glasses for the stabilization
of therapeutic proteins. Int J Pharm 215: 163–174.
23. Stevens CV, Meriggi A, Booten K (2001) Chemical Modification of Inulin, a
Valuable Renewable Resource, and Its Industrial Applications. Biomacromo-
lecules 2: 1–16.
24. Swanton CJ CPB (1989) Biomass and nutrient allocation patterns in Jerusalem
artichoke (Helianthus tuberosus). Can J Bot 67: 2880–2887.
25. Morozova O HM, Marra MA (2009) Applications of New Sequencing
Technologies for Transcriptome Analysis. Annu Rev Genomics Hum Genet
10: 135–151.
26. Ozsolak F, Milos PM (2011) RNA sequencing: advances, challenges and
opportunities. Nat Rev Genet 12: 87–98.
27. Liu Z, Ma L, Nan Z, Wang Y (2013) Comparative transcriptional profiling
provides insights into the evolution and development of the zygomorphic flower
of Vicia sativa (Papilionoideae). PLoS One 8: e57338.
28. Jain M (2012) Next-generation sequencing technologies for gene expression
profiling in plants. Brief Funct Genomics 11: 63–70.
29. Mutz KO, Heilkenbrinker A, Lonne M, Walter JG, Stahl F (2013)
Transcriptome analysis using next-generation sequencing. Curr Opin Biotech-nol 24: 22–30.
30. Johnson MT, Carpenter EJ, Tian Z, Bruskiewich R, Burris JN, et al. (2012)
Evaluating methods for isolating total RNA and predicting the success ofsequencing phylogenetically diverse plant transcriptomes. PLoS One 7: e50226.
31. Schliesky S, Gowik U, Weber AP, Brautigam A (2012) RNA-Seq Assembly - AreWe There Yet? Front Plant Sci 3: 220.
32. Feng C, Xu CJ, Wang Y, Liu WL, Yin XR, et al. (2013) Codon usage patterns inChinese bayberry (Myrica rubra) based on RNA-Seq data. BMC Genomics 14:
732.
33. He CY, Cui K, Zhang JG, Duan AG, Zeng YF (2013) Next-generationsequencing-based mRNA and microRNA expression profiling analysis revealed
pathways involved in the rapid growth of developing culms in Moso bamboo.BMC Plant Biol 13: 119.
34. Chow KS, Ghazali AK, Hoh CC, Mohd-Zainuddin Z (2014) RNA sequencingread depth requirement for optimal transcriptome coverage in Hevea
brasiliensis. BMC Res Notes 7: 69.
35. Zerbino DR, Birney E (2008) Velvet: algorithms for de novo short read assemblyusing de Bruijn graphs. Genome Res 18: 821–829.
36. Schulz MH, Zerbino DR, Vingron M, Birney E (2012) Oases: robust de novoRNA-seq assembly across the dynamic range of expression levels. Bioinformatics
28: 1086–1092.
37. Kim HA, Lim CJ, Kim S, Choe JK, Jo SH, et al. (2014) High-throughput
sequencing and de novo assembly of Brassica oleracea var. Capitata L. for
transcriptome analysis. PLoS One 9: e92087.
38. Grabherr MG, Haas BJ, Yassour M, Levin JZ, Thompson DA, et al. (2011) Full-
length transcriptome assembly from RNA-Seq data without a reference genome.Nat Biotechnol 29: 644–652.
39. Altschul SF, Madden TL, Schaffer AA, Zhang J, Zhang Z, et al. (1997) GappedBLAST and PSI-BLAST: a new generation of protein database search
programs. Nucleic Acids Res 25: 3389–3402.
40. Conesa A, Gotz S, Garcia-Gomez JM, Terol J, Talon M, et al. (2005) Blast2GO:
a universal tool for annotation, visualization and analysis in functional genomics
research. Bioinformatics 21: 3674–3676.
41. Huang da W, Sherman BT, Lempicki RA (2009) Systematic and integrative
analysis of large gene lists using DAVID bioinformatics resources. Nat Protoc 4:44–57.
42. Huang da W, Sherman BT, Lempicki RA (2009) Bioinformatics enrichmenttools: paths toward the comprehensive functional analysis of large gene lists.
Nucleic Acids Res 37: 1–13.
43. Du Z, Zhou X, Ling Y, Zhang Z, Su Z (2010) agriGO: a GO analysis toolkit forthe agricultural community. Nucleic Acids Res 38: W64–70.
44. Ashburner M, Ball CA, Blake JA, Botstein D, Butler H, et al. (2000) Geneontology: tool for the unification of biology. The Gene Ontology Consortium.
Nat Genet 25: 25–29.
45. Tatusov RL, Fedorova ND, Jackson JD, Jacobs AR, Kiryutin B, et al. (2003)
The COG database: an updated version includes eukaryotes. BMC Bioinfor-
matics 4: 41.
46. Kanehisa M, Goto S, Kawashima S, Okuno Y, Hattori M (2004) The KEGG
resource for deciphering the genome. Nucleic Acids Res 32: D277–280.
47. Moriya Y, Itoh M, Okuda S, Yoshizawa AC, Kanehisa M (2007) KAAS: an
automatic genome annotation and pathway reconstruction server. Nucleic AcidsRes 35: W182–185.
48. Aoki-Kinoshita KF, Kanehisa M (2007) Gene annotation and pathway mapping
in KEGG. Methods Mol Biol 396: 71–91.
49. Wang L, Feng Z, Wang X, Wang X, Zhang X (2010) DEGseq: an R package for
identifying differentially expressed genes from RNA-seq data. Bioinformatics 26:136–138.
50. Fernandez P, Soria M, Blesa D, DiRienzo J, Moschen S, et al. (2012)Development, characterization and experimental validation of a cultivated
sunflower (Helianthus annuus L.) gene expression oligonucleotide microarray.
PLoS One 7: e45899.
Transcriptome Analysis of Jerusalem Artichoke
PLOS ONE | www.plosone.org 14 November 2014 | Volume 9 | Issue 11 | e111982
51. Goodstein DM, Shu S, Howson R, Neupane R, Hayes RD, et al. (2012)
Phytozome: a comparative platform for green plant genomics. Nucleic Acids Res
40: D1178–1186.
52. Yu K, Zhang T (2013) Construction of customized sub-databases from NCBI-nr
database for rapid annotation of huge metagenomic datasets using a combined
BLAST and MEGAN approach. PLoS One 8: e59831.
53. Dimmer EC, Huntley RP, Alam-Faruque Y, Sawford T, O’Donovan C, et al.
(2012) The UniProt-GO Annotation database in 2011. Nucleic Acids Res 40:
D565–570.
54. Li C, Weng S, Chen Y, Yu X, Lu L, et al. (2012) Analysis of Litopenaeus
vannamei transcriptome using the next-generation DNA sequencing technique.
PLoS One 7: e47442.
55. Li C, Wang Y, Huang X, Li J, Wang H, et al. (2013) De novo assembly and
characterization of fruit transcriptome in Litchi chinensis Sonn and analysis of
differentially regulated genes in fruit in response to shading. BMC Genomics 14:
552.
56. Wang H, Jiang J, Chen S, Qi X, Peng H, et al. (2013) Next-generation
sequencing of the Chrysanthemum nankingense (Asteraceae) transcriptome
permits large-scale unigene assembly and SSR marker discovery. PLoS One 8:
e62293.
57. Xie F, Burklew CE, Yang Y, Liu M, Xiao P, et al. (2012) De novo sequencing
and a comprehensive analysis of purple sweet potato (Impomoea batatas L.)
transcriptome. Planta 236: 101–113.
58. Tao X, Gu YH, Wang HY, Zheng W, Li X, et al. (2012) Digital gene expression
analysis based on integrated de novo transcriptome assembly of sweet potato
[Ipomoea batatas (L.) Lam]. PLoS One 7: e36234.
59. Firon N, LaBonte D, Villordon A, Kfir Y, Solis J, et al. (2013) Transcriptional
profiling of sweetpotato (Ipomoea batatas) roots indicates down-regulation of
lignin biosynthesis and up-regulation of starch biosynthesis at an early stage of
storage root formation. BMC Genomics 14: 460.
60. Massa AN, Childs KL, Lin H, Bryan GJ, Giuliano G, et al. (2011) The
transcriptome of the reference potato genome Solanum tuberosum Group
Phureja clone DM1-3 516R44. PLoS One 6: e26801.
61. Benjamini Y, Drai D, Elmer G, Kafkafi N, Golani I (2001) Controlling the false
discovery rate in behavior genetics research. Behav Brain Res 125: 279–284.62. Benjamini YHY (1995) Controlling the False Discovery Rate: a practical and
powerful approach to multiple testing. J R State Soc B: 289–300.
63. Taha HS, Abd El-Kawy AM, Fathalla MAE-K (2012) A new approach forachievement of inulin accumulation in suspension cultures of Jerusalem
artichoke (Helianthus tuberosus) using biotic elicitors. Journal of GeneticEngineering and Biotechnology 10: 33–38.
64. Flores HE, Vivanco JM, Loyola-Vargas VM (1999) ‘Radicle’ biochemistry: the
biology of root-specific metabolism. Trends Plant Sci 4: 220–226.65. Sasaki E, Ogura T, Takei K, Kojima M, Kitahata N, et al. (2013) Uniconazole,
a cytochrome P450 inhibitor, inhibits trans-zeatin biosynthesis in Arabidopsis.Phytochemistry 87: 30–38.
66. Weston LA, Mathesius U (2013) Flavonoids: their structure, biosynthesis androle in the rhizosphere, including allelopathy. J Chem Ecol 39: 283–297.
67. Li YC, Korol AB, Fahima T, Beiles A, Nevo E (2002) Microsatellites: genomic
distribution, putative functions and mutational mechanisms: a review. Mol Ecol11: 2453–2465.
68. Varshney RK, Graner A, Sorrells ME (2005) Genic microsatellite markers inplants: features and applications. Trends Biotechnol 23: 48–55.
69. La Rota M, Kantety RV, Yu JK, Sorrells ME (2005) Nonrandom distribution
and frequencies of genomic and EST-derived microsatellite markers in rice,wheat, and barley. BMC Genomics 6: 23.
70. Hisano H, Sato S, Isobe S, Sasamoto S, Wada T, et al. (2007) Characterizationof the soybean genome using EST-derived microsatellite markers. DNA Res 14:
271–281.71. Garg R, Patel RK, Tyagi AK, Jain M (2011) De novo assembly of chickpea
transcriptome using short reads for gene discovery and marker identification.
DNA Res 18: 53–63.72. Van den Ende W, Michiels A, De Roover J, Van Laere A (2002) Fructan
biosynthetic and breakdown enzymes in dicots evolved from different invertases.Expression of fructan genes throughout chicory development. ScientificWorld-
Journal 2: 1281–1295. Sucrose-phosphate-phosphohydrolase, Suc: Sucrose, Fru:
Fructose, Glu: Glucose, Inv: Invertase.
Transcriptome Analysis of Jerusalem Artichoke
PLOS ONE | www.plosone.org 15 November 2014 | Volume 9 | Issue 11 | e111982
Related Documents