Chapter 5 RNA Biomarkers in Schizophrenia Daniel Martins-de-Souza and Emmanuel Dias-Neto Abstract The deciphering of the human genome and the advances in transcriptome interrogation approaches have turned RNA biomarkers into important promises for the understanding and management of psychiatric diseases. In this chapter we describe the techniques more widely used for gene expression analysis and present the main findings in the search for RNA biomarkers in schizophrenia such as the recurrent observation of alterations in genes that encode proteins involved in path- ways related to myelinization, synapses, and energy metabolism. We also discuss the main findings resultant from peripheral blood cell studies and present new techniques and new sources of RNA biomarkers for the future of research in schizophrenia. Abbreviations AS: Alternative splicing; D2: Dopamine receptor 2; D2L: Long isoform of dopamine receptor 2; D2S: Short isoform of dopamine receptor 2; DPFC: Dorsolateral prefrontal cortex; dT : Deoxythymidine; EST : Expressed sequence tag; FDA: United States Food and Drug Administration; GABAA: Gamma- amino butyric acid – A; GNAO1: Guanine nucleotide-binding regulatory protein Go-alpha; mGluR3: Metabotropic glutamate receptor 3; miRNA: MicroRNA; NCAM1: Neural cell adhesion molecule 1; ncRNA: Noncoding RNA; NMDA: N -methyl-D-aspartic acid; PFC: Prefrontal cortex; PSYN: Pre-synaptic function; qPCR: Quantitative polymerase chain reaction; SAGE: Serial analysis of gene expression; SCZ: Schizophrenia Genes ACADS: acyl-Coenzyme A dehydrogenase, C-2 to C-3 short chain; ACADL: acyl-Coenzyme A dehydrogenase, long chain; ACAT2: acetyl-coenzyme D. Martins-de-Souza Laboratório de Neurociências (LIM-27), Instituto de Psiquiatria, Faculdade de Medicina, Universidade de São Paulo (USP), Brazil Laboratório de Proteômica, Dept. de Bioquímica, Instituto de Biologia, Universidade Estadual de Campinas (UNICAMP), Brazil E. Dias-Neto Laboratório de Neurociências (LIM-27), Instituto de Psiquiatria, Faculdade de Medicina, Universidade de São Paulo (USP), Brazil Present address: University of Texas, MD Anderson Cancer Center, Houston, TX USA C.W. Turck (ed.) Biomarkers for Psychiatric Disorders, 97 doi: 10.1007/978-0-387-79251-4_5, © Springer Science + Business Media, LLC 2008

Welcome message from author
This document is posted to help you gain knowledge. Please leave a comment to let me know what you think about it! Share it to your friends and learn new things together.
Transcript
Chapter 5 RNA Biomarkers in Schizophrenia
Daniel Martins - de - Souza and Emmanuel Dias-Neto
Abstract The deciphering of the human genome and the advances in transcriptome interrogation approaches have turned RNA biomarkers into important promises for the understanding and management of psychiatric diseases. In this chapter we describe the techniques more widely used for gene expression analysis and present the main findings in the search for RNA biomarkers in schizophrenia such as the recurrent observation of alterations in genes that encode proteins involved in path-ways related to myelinization, synapses, and energy metabolism. We also discuss the main findings resultant from peripheral blood cell studies and present new techniques and new sources of RNA biomarkers for the future of research in schizophrenia.
Abbreviations AS: Alternative splicing ; D2: Dopamine receptor 2; D2L : Long isoform of dopamine receptor 2 ; D2S: Short isoform of dopamine receptor 2 ; DPFC : Dorsolateral prefrontal cortex; dT : Deoxythymidine; EST : Expressed sequence tag ; FDA : United States Food and Drug Administration; GABAA : Gamma-amino butyric acid – A ; GNAO1: Guanine nucleotide-binding regulatory protein Go-alpha ; mGluR3 : Metabotropic glutamate receptor 3; miRNA : MicroRNA ; NCAM1 : Neural cell adhesion molecule 1; ncRNA : Noncoding RNA; NMDA : N -methyl-D-aspartic acid; PFC: Prefrontal cortex; PSYN : Pre-synaptic function; qPCR : Quantitative polymerase chain reaction ; SAGE: Serial analysis of gene expression ; SCZ : Schizophrenia Genes ACADS : acyl-Coenzyme A dehydrogenase, C-2 to C-3 short chain ; ACADL : acyl-Coenzyme A dehydrogenase, long chain; ACAT2 : acetyl-coenzyme
D. Martins-de-Souza Laboratório de Neurociências (LIM-27), Instituto de Psiquiatria, Faculdade de Medicina , Universidade de São Paulo (USP), Brazil Laboratório de Proteômica, Dept. de Bioquímica, Instituto de Biologia , Universidade Estadual de Campinas (UNICAMP), Brazil
E. Dias-Neto Laboratório de Neurociências (LIM-27), Instituto de Psiquiatria, Faculdade de Medicina , Universidade de São Paulo (USP), Brazil Present address: University of Texas , MD Anderson Cancer Center , Houston , TX USA
C.W. Turck (ed.) Biomarkers for Psychiatric Disorders, 97doi: 10.1007/978-0-387-79251-4_5, © Springer Science + Business Media, LLC 2008
98 D. Martins-de-Souza, E. Dias-Neto
A acyltransferase 2 ; ACO : aconitase ; ADSSL1 : adenylosuccinate synthetase ; AGPS: alkylglycerone phosphate synthase ; AMPA2 : glutamate receptor iono-tropic AMPA2 ; APOBEC3B : catalytic polypeptide-like apolipoprotein B mRNA editing enzyme 3B ; ATM : ataxia telangiectasia mutated ; ATP5A1 : ATP syn-thase mitochondrial F1 complex alpha ; Azin1 : antizyme inhibitor; BTG1 : B-cell translocation gene 1, anti-proliferative ; CALM3: calmodulin 3 ; CHRNA7 : alpha7-nicotinic-acetylcholine-receptor ; CLC : Charcot-Leyden crystal protein ; CLDN11 : claudin 11; CNP : 2′,3′-cyclic nucleotide 3′ phosphodiesterase ; CPT1 : carnitine palmitoyltransferases 1 ; CPT2 : carnitine palmitoyltransferases 2 ; CRYM : crystallin ; CTNNA1 : alpha catenin ; CXCR1 : chemokine C-X-C motif ligand 1 ; CYP27B1 : cytochrome P450 family 1, subfamily B, polypeptide 1 ; Datf1: death-associated transcription factor 1; DUSP6: dual specificity phosphatase 6; EBP50: ezrin-radixin-moesin phosphoprotein 50; Edg-2: endothelial differentia-tion gene 2; ENO : enolase ; ERBB2 : v-erb-b2 erythroblastic leukemia viral onco-gene homolog 2, neuro/glioblastoma derived oncogene homolog (avian) ; ERBB3 : v-erb-b2 erythroblastic leukemia viral oncogene ; GAP-43 : growth-associated protein-43 ; GAPDH : glyceraldehyde-3-phosphate dehydrogenase ; GOT2 : glutamic-oxaloacetic transaminase 2 ; GSK3a : glycogen synthase kinase 3 α; GSN : gelsolin; HLA-DRB1 : major histocompatibility complex, class II, DR β 1 ; HNRPA3 : hetero-geneous nuclear ribonucleoprotein A3; MAG : myelin-associated glycoprotein ; MAL : T-lymphocyte maturation-associated protein ; MARCKS : myristoylated alanine-rich C kinase substrate ; MAZ : myc-associated zinc finger protein ; MDH1 : malate dehy-drogenase 1 ; MOG: myelin oligodendrocyte glycoprotein; NDUFS1 : mitochondrial complex I 75-kDa subunit ; NPY : neuropeptide Y ; NPY1R : neuropeptide Y recep-tor Y1 gene ; NRG1 : neuregulin 1 ; NSF : N-ethylmaleimide sensitive factor ; OAT : ornithine aminotransferase ; OXCT1 : 3-oxoacid CoA transferase ; PDH : pyruvate dehydrogenase ; PDLIM5 : PDZ and LIM domain 5; PKM1 : muscle pyruvate kinase ; PLLP/TM4SF11 : plasmolipin or transmembrane 4 superfamily 11 ; PLP: prote-olipid protein; QKI : quaking homolog; RAB3C : RAB3C, member RAS oncogene family ; S100A9 : S100 calcium binding protein A9; SCG-10 : superior cervical gan-glia-10; SELENBP1 : selenium-binding protein 1 ; SERPINI1 : neuroserpin; SFRS1 : splicing factor, arginine/serine-rich 1 ; SMDF : sensory motor neuron derived factor ; SYN2 : synapsin 2; SYNJ1 : synaptojanin 1; TCFL4 : MAX-like protein X; TF : transferrin ; TIMM17A : translocase of inner mitochondrial membrane 17 ; TNFR2 : tumor necrosis factor receptor 2; UCHL1 : ubiquitin C-terminal esterase L1 ; USP14 : ubiquitin-specific protease 14 ; YWHAH : tyrosine 3-monooxygenase/tryptophan 5-monooxygenase activation protein, eta polypeptide
5.1 Introduction
The United States Food and Drug Administration (FDA) defines a biomarker as “a characteristic that is objectively measured and evaluated as an indicator of normal biologic or pathogenic processes or pharmacological responses to a therapeutic
5 RNA Biomarkers in Schizophrenia 99
intervention” (Chakravarty, 2003) . The utility of biomarkers in clinical medicine is vast, and includes disease diagnosis, indicators of disease status, or targets to monitor and predict response to therapeutics or disease outcome. In this context, RNAs constitute a central class of markers that can be directly influenced by DNA altera-tions but may also exert a straight influence on protein markers in many diseases.
The primary functional link of RNAs as biomarkers is their obvious role as inter-mediate between the DNA that encodes the information, and the proteins that are the ultimate effectors. However, as the RNA complexity continues to be revealed by large-scale transcriptome analysis, new RNA categories continue to emerge bringing new classes of potential markers, including regulatory noncoding RNAs such as miRNAs. The recent discovery of these new RNA molecules will certainly bring dramatic changes in the way we see and understand protein regulation, and will also increase the number of RNA markers available for a number of diseases.
The category of RNA biomarkers gained a dramatic impulse after the deciphering of the human genome, and the diverse projects that contributed to catalogue our transcrip-tomes. The dynamic nature of the transcriptome reveals the complexity of gene regula-tion and together with other molecular markers should contribute to the understanding of relevant clinical aspects such as disease mechanisms and reaction to drugs, pointing to less ambiguous prognosis, and more precise markers for treatment response.
RNA alterations are certainly involved in the biological basis of a number of diseases. In psychiatry, RNA markers are central, and are certainly implicated in diverse facets such as distinct clinical presentations, neuroimaging alterations, and endophenotypes. Consistent patterns of abnormalities in proteomes can be a result of alternative mRNA splicing, quantitative fluctuations in mRNA, or translational regulation, which can be determined by noncoding regulatory RNAs. These proteomic alterations can affect diverse disease-related aspects, including neural system alterations that may underlie emotional processing and cognitive control, characteristic for psychiatric diseases. Such abnormalities, present at protein and RNA levels, may constitute valuable disease biomarkers, and may potentially help in, disease diagnosis, shedding light on the molecular basis of psychiatric illnesses. Together, genome and transcriptome analysis provide the basis upon which these markers could be investigated and identified by a series of distinct and complementary approaches. In this chapter we will present the most frequently used techniques to interrogate the transcriptome in large-scale and will focus on the most relevant biomarkers that have been revealed in schizophrenia (SCZ), a disease uniquely human that affects 1% of the population world wide.
5.2 The Main Approaches used for RNA Biomarkers Discovery
The identification of reliable biomarkers is of utmost relevance for psychiatric diseases. The availability of these markers would be of great value for all psychiatric diseases, and of particular importance in SCZ, a complex disease with pathogenesis mechanisms yet to be defined, despite the various efforts in order to its progressive
100 D. Martins-de-Souza, E. Dias-Neto
understanding (Freedman, 2003) . Besides some macroscopic alterations observed in brain scans of SCZ patients, the disease diagnosis is essentially clinical, with no molecular basis nor reliable biochemical markers identified up to now and a still unpredictable response to treatment (Frances et al., 1991) . The complexity of SCZ is a driving force in the search for reliable markers, at DNA, RNA, protein and brain morphometry levels. Besides the recent exploration of the transcriptome in the postgenomic era, the search for reliable SCZ markers is still an ongoing process.
In its early days, the search of RNA markers in SCZ was focused on the evaluation of the expression of specific genes of interest related to what was known in SCZ. These genes had their cDNA sequenced in samples of patients, such as it has been done in 1986 with the analysis of the coding region of gamma-endorphin gene derived from postmortem brains and pituitary glands of schizophrenic patients (Bovenberg et al., 1986) . Nowadays, a number of large-scale techniques allow the interrogation of the entire transcriptome, mainly using hybridization platforms known as gene chips, or cDNA microarrays. The gene arrays available today not only cover the full set of human genes, but also include a large set of noncoding regions and noncoding transcripts, enabling the interrogation of a significant fraction of the whole genome. These comprehensive genome and transcriptome analyses promise a revolu-tion in the comprehension of gene regulation and its effects on human diseases.
The most commonly used techniques for high-throughput transcriptome analysis are cDNA microarrays, Serial Analysis of Gene Expression (SAGE), and the analyses of Expressed Sequence Tag (EST). The discrete capabilities and distinct aspects of these different approaches are important to reveal the diversity of gene regulation aspects. These large-scale methods are absolutely distinct from each other, and not only differ in their throughput and cost, but also in the type of data obtained and in the depth of information provided (Mirnics et al., 2001) . These techniques not only allow an analysis of quantitative alterations, an aspect that is the subject of frequent investigation by the majority of RNA biomarker projects, but also help to unravel qualitative aspects of gene expression, such as alternative splicing or alternative poly-adenylation events, that also affect protein composition and RNA stability, with direct phenotypic consequences. These aspects make complementary, rather than redun-dant, the distinct transcriptome interrogation approaches. The combination of large-scale transcriptome interrogation tools will facilitate the investigation of the most complex questions related to diseases of the nervous system (reviewed in Mirnics et al., 2001) and together with new and large-scale DNA sequencing approaches availa-ble today, have the potential to transfigure the importance of RNA markers for psy-chiatric diseases.
5.2.1 Expressed Sequence Tags Analysis (EST)
One of the early approaches used for large-scale gene discovery and analysis was based on the partial sequencing of clones derived from cDNA libraries as proposed by the group of J. Craig Venter, in 1992 (Adams et al., 1992) . Due to its capacity for generating relatively long reads of cDNA sequences, this approach is still very useful
5 RNA Biomarkers in Schizophrenia 101
for gene discovery, alternative splicing, alternative poly-adenylation, polymorphism, and mutation analysis, being extremely rich sources of transcribed biomarkers.
EST analysis starts with the extraction of the RNA of interest (mRNA or total RNA, depending on the approach used) that is going to be cloned into sequencing vectors. The standard approach consists of using oligo-dT primers for the synthesis of the first cDNA strand, followed by the second strand synthesis and the cloning of double stranded cDNA molecules in the sequencing vectors, usually with the help of adaptors for a directional cloning. In this regard, there is a major difference between EST and SAGE (to be described later); in the case of ESTs one usually aims to clone the entire, or the most complete cDNA fragment, while for SAGE the focus is on very small fragments from a defined portion of the transcript. The cDNA clones are then sequenced, from one or both ends. In non-normalized libraries, the number of times a certain gene is sequenced usually corresponds to its frequency in the original RNA pool. Also, as the fragment sequenced is usually long (500–800 nt), sequence analysis provides not only an unambiguous gene identification, but also provides data useful for the observation of transcriptional diversity, such as polymorphisms, mutations or alternative splicing and alternative polyadenylation events.
The major limitations of the EST approach are related to sequencing costs required for broad transcriptome coverage. Each clone sequenced allows the study of a single transcript and due to the high level of expression of some transcripts, sequencing redundancy of the most abundant transcripts could be a limitation. Another drawback is the biased distribution of the ESTs towards the ends of the transcripts, which reduces the coverage of the whole gene. While the reduction on DNA sequencing costs is now a reality, the alternative approaches that have been described to circumvent sequencing redundancy and positional biases of ESTs inevitably abolish its use in the detection of relevant fluctuations in gene expression (Soares et al., 1994 ; Dias-Neto et al., 2000 ; Camargo et al., 2001) .
In neuropsychiatry, ESTs have been used in the study of Parkinson’s disease (Lu et al., 2005a ; Kim et al., 2006) and epilepsy (Avedissian et al., 2007) . ESTs have also been used in the study of the brains of schizophrenic patients and a few thousand sequences have been generated and are publicly available in the EST database at the NIH ( www.ncbi.nlm.nih.gov/dbEST ). Most brains used for cDNA library construction were obtained from the Stanley Neuropathology Consortium, and include the frontal lobe of a suicide schizophrenic, male, 34 years old (3,699 ESTs available), and a hippocampus (a pool of three schizophrenic patients), sub-tracted from a pool of three mentally normal individuals. All sequences are availa-ble in public databases, and can be used to point to a number of transcriptional aspects present in these brain samples. In SCZ, ESTs were also useful for the analy-sis of new gene polymorphisms in the 14-3-3 eta chain gene (Bell et al., 2000) .
5.2.2 cDNA Microarrays
The development of cDNA microarrays has provided one of the most powerful tools for the large-scale gene expression investigation in human diseases. Through the
102 D. Martins-de-Souza, E. Dias-Neto
use of these arrays, global gene expression analysis could be used as a valuable tool to obtain major insights into diagnosis, progression, prognosis, and response to therapy for a number of human diseases. The basic technologies used for cDNA microarrays were first developed to evaluate gene expression. However, improvements of the initial methods now permits more intricate and widespread uses, including mutation analysis in expressed genes (Klevering et al., 2004 ; Tennis et al., 2006 ; Van Bogaert et al., 2007) , gene sequencing and polymorphism analysis (Kozal et al., 1996 ; Günthard et al., 1998) and analysis of splicing events and copy number variations (Cuperlovic-Culf et al., 2006 ; Hughes et al., 2006 ; Blencowe, 2006 ; Cowell and Hawthorn 2007) . The analysis of gene expression using cDNA microarrays is one of the most used applications of the gene-chip technology as it permits the rapid, simultaneous and sensitive analysis of a large number of biological samples for the concurrent expression of thousands of genes (Mirnics et al., 2001 ; Magic et al., 2007) . Recent developments allowed the investigation of larger fractions of the transcriptome, increasing the accuracy of cDNA microarrays, and reducing its costs, permitting microarrays to be used as a common tool in the search for markers of human diseases. These studies are often carried out in conjunction with other methods that confirm the differential expression detected with microarrays, including Northern blots and quantitative real-time PCR (qPCR).
The concepts that lead to the development of cDNA microarrays were realized soon after the first description of the double helix by Watson and Crick, in 1953. After the depiction of the DNA structure, it was realized that the two DNA strands could be separated by heat or alkali treatment, in a reversible process that underlies all the methods based on DNA hybridization. It was also observed at that time, that some degree of sequence complementarity was required during the hybridization of two sequences involved in the duplex formation. Double-strand denaturation, sequence complementarity, and renaturation capability were concepts that emerged during this period and allowed the development of analytical methods based on DNA hybridization, which were quickly incorporated into a range of biological investigations. Later, in the mid-1970s the potential of the recombinant DNA tech-nology was realized due to a number of factors, including the capability of detecting specific clones in genomic or cDNA libraries (Grunstein and Hogness 1975 ; Benton and Davis 1977) , using hybridization. Thus, bacterial or phage clones carrying plasmids with different inserts, could be screened and selected on mem-branes, exploring the concept of anchoring nucleic acids to a solid support for analysis by hybridization with radioactively-labeled probes.
Modern microarrays were developed from these key basic concepts, and now employ microscopic dots, spotted on glass slides, revealed with fluorescent probes. The most used platforms consist of a set of predefined arrays of DNA molecules (such as oligonucleotides, cDNA clones or PCR products) that are usually spotted onto glass slides, as well as labeled cDNAs, derived from the RNAs of the samples of interest. The labeled cDNA molecules are hybridized against the elements on the arrays and the detection is usually made using fluorophores such as Cy-3 or Cy-5. Once the hybridization step is completed, the glass slides are scanned to obtain digital images of the experimental results. These digital images contain hundreds
5 RNA Biomarkers in Schizophrenia 103
or thousands of points or “spots.” Each spot represents a probe, and usually, many probes are available for each transcript. Gene expression levels are then quantified with the help of software designed for image-analysis. After processing the hybridization results of thousands of probes, representing thousands of genes, the typical goal is to find statistically significant up- or down-regulated transcripts.
The technique is sensitive and can detect gene expression fluctuations for most of the transcripts. Commercially available cDNA microarrays can detect as few as one in 250,000 mRNA copies (Mirnics et al., 2001) . This level of sensitivity should allow the detection of rare mRNA species in a pool of transcripts found in a typical tissue sample (Lockhart et al., 1996 ; Bertucci et al., 1999 ; Kane et al., 2000) . However, even with this high sensitivity, many low-abundance transcripts remain undetected. Unfortunately, increasing the absolute amount of the hybridized target usually will not increase the sensitivity of the microarray – as the relative abundance of the transcript within the RNA pool, coupled with microarray probe characteristics, will influence the detection limit for each individual transcript. Thus, transcripts whose expression is restricted to a small subpopulation of neurons are effectively diluted by the most abundant ones and remain undetectable. Consequently, even if one had access to the entire transcriptome on a microarray, the complexity of gene expression in the brain would preclude real global gene expression profiling.
Advantages of microarrays include its high degree of automation, the requirement of relatively small RNA amounts, as well as the capability of simultaneous analysis of thousands of genes in a single experiment, at a relatively low cost (around US$500/slide). However, as each probe is capable of evaluating only its corre-sponding transcript, the distinct probe properties (such as its GC content, self-complementarity, and its location in the transcript) can affect its hybridization capabilities. Thus, the expression data derived this way is relative rather than absolute, and gene-expression measurements made by microarrays still need to be confirmed by other methods. Due to the relative low cost, and the availability of a number of commercial platforms, cDNA microarrays are one of the most popular approaches to investigate gene expression.
In psychiatry research, microarray analysis has provided a wealth of information to help uncover complex biological processes, to better understand the pathogenesis of many diseases, and to discover novel potential biomarker panels, to mention a few. Transcriptomes of different brain areas have been investigated by many groups, and the results have contributed to the definition of the set of genes expressed in diseased brains, pointing to a potentially relevant set of RNA markers. Most of the markers described in this chapter have been discovered by using microarray analysis.
5.2.3 Serial Analysis of Gene Expression (SAGE)
Gene expression patterns in the human brain exceed the complexity of many other organ systems. The degree of difficulty in the analysis of such patterns is magnified
104 D. Martins-de-Souza, E. Dias-Neto
in the investigation of psychiatric disorders, which appear to result from the interplay of polygenic and epigenetic factors on multiple brain circuits. Thus, in many situations of psychiatric research, it would be important to use techniques that do not require an a priori definition of the genes that are going to be investigated. This is one of the most interesting aspects of SAGE.
SAGE is a DNA sequencing-based technique, described by Velculescu et al., in 1995 (Velculescu et al., 1995) , based on the sampling of short cDNA sequences (called tags) ideally gene-specific, from a population of cells or tissues. The presence and the sequence of these gene tags are determined by the occurrence and location of digestion sites of frequent cutter restriction enzymes. SAGE theory rests on three basic principles: First, considering a traditional SAGE experiment, a theoretical tag of 14 – 4 nt corresponding to the restriction enzyme site, followed by 10 nucleotides downstream – can generate 4 10 (1,048,576) different tags, which in theory are capa-ble to discriminate most of human transcripts (Patino et al., 2002) . Second, tag concatenation allows a faster and less-expensive determination of the tag-sequence via cDNA sequencing, allowing the analysis of thousands of genes in a few sequencing reactions; and third, the number of times each tag is sequenced should reflect the expression level of its corresponding gene (Knox and Skuce, 2005) , allowing the generation of gene abundance lists, categorizing the expression of each transcript in an absolute fashion.
SAGE requires the extraction of the RNA samples to be compared, followed by the construction and sequencing of SAGE libraries containing tag concatemers. After sequencing a few thousand clones of the SAGE libraries, the frequency of the tags (which are derived from the collection of genes expressed in the studied samples) corresponds to the frequency of the respective gene in the original sample. Due to the concatenation of small fragments for serial sequencing, tag redundancy is used to estimate transcript abundance, and does not represent a limitation as seen in the EST approach.
The construction of SAGE-libraries is based on a chain of enzymatic steps. Briefly, the process starts with the synthesis of cDNA molecules, primed by a bioti-nylated oligo dT coupled to magnetic beads. The cDNAs are magnetically captured and digested with a frequent (4-bp) cutter restriction enzyme, named anchoring enzyme (usually NlaIII ). After this digestion, the digested fragments that are not coupled to the oligo-dT in the magnetic columns are washed away, and only the most 3 end fragments remain. These are subjected to the ligation of adapters con-taining the restriction site of other enzymes, used as tagging enzymes. A tagging enzyme is a type IIS restriction endonuclease ( BsmfI is typically used), an enzyme that cuts the DNA fragment at a defined distance of its recognition site (up to 20 base pairs). To illustrate, the restriction enzyme BsmfI recognizes the sequence GGGAC and will cleave the DNA strand 10 nt downstream. As the DNA is cleaved, it is released from the bead, and the tags are ligated to each other to create ditags. These tags are then concatenated and cloned in sequencing vectors, constituting a SAGE library, ready to be used for serial DNA sequencing. The detailed protocol of SAGE as well as more information can be found at the SAGEnet website ( http://www.sagenet.org/protocol/MANUAL1e.pdf – accessed on 30 Dec 2007 ) as well as in a recent review by Hu and Polyak (Hu and Polyak, 2006) .
5 RNA Biomarkers in Schizophrenia 105
A typical SAGE-library contains thousands of clones, each one containing a few dozens of small transcript tags (14 bp) cloned in tandem. In a single sequencing run, as many as 25–30 gene tags can be obtained from a clone, and 2,000–3,000 tags can be produced after sequencing a single 96 well plate. After extracting and counting the individual tags, a SAGE-tag list is produced. The tags are mapped to their genes, and their frequency corresponds to the abundance of the corresponding gene in the original RNA pool. Thus, SAGE is an open platform that does not require an a priori list of genes to be investigated.
Another important aspect of SAGE is with regard to its quantitative power. A typical SAGE experiment involves the construction and sequencing of a pair of SAGE libraries, allowing transcriptome comparison in two different situations, giving statistical significance to each compared transcript. This type of data permits a direct comparison between different experiments, laboratories, experimental systems, and data types; a crucial aspect of the database dependent analysis of biological systems that is required by functional genomics approaches. With the advent of the new DNA sequencing technologies (Margulies et al., 2005 ; Nielsen et al., 2006) SAGE lists with millions of tags can be generated in a few days, and data from different laboratories or experiments can be directly compared.
Maybe the most significant problem of SAGE is the generation of ambiguous tags, which could make difficult the interpretation of data. It is estimated that around 30% of the regular SAGE-tags can be mapped to multiple human transcripts, and the correct interpretation of gene regulation in the sample requires tag-extension approaches or alternative SAGE methods (reviewed in Wang, 2007) . One way to overcome this limitation is to generate longer and thus, more specific gene tags, as described (Saha et al., 2002) . Another limitation of SAGE is the inability of tagging some genes, due to the absence of required sites for the anchoring enzyme in a fraction of the transcripts. It has been calculated that this latter problem would prohibit the proper analysis of expression of 3–5% of the human genes. Due to the high costs, and many days required for library construction and sequencing SAGE libraries, this technique has been poorly used in the study of transcriptome alterations in psychiatric diseases.
The published gene expression analyses using SAGE in models to study neu-ropsychiatry are limited to a few papers evaluating drug-response and gene expression (Ouchi et al., 2004 ; Cai et al., 2005) , or models for epilepsy (Hendriksen et al., 2001 ; Arai et al., 2003) or Parkinson’s disease (Ryu et al., 2002 ; Ryu et al., 2005) . Few studies have been published with human samples, and are currently limited to epilepsy (Ozbas-Gerçeker et al., 2006) , bipolar disorder (Sun et al., 2001) , Parkinson’s (Noureddine et al., 2005) or Alzheimer’s disease (Xu et al., 2007) . After the recent development of new DNA sequencing technologies, such as the sequencing by synthesis using pyrosequencing protocols optimized for solid sup-ports (Margulies et al., 2005) we can expect to see a rebirth of sequencing-based RNA biomarker discovery in the coming years. These technologies dramatically reduce sequencing costs, and allow the generation of more than 400,000 reads in a single sequencing run. Less expensive sequencing will make possible the sequencing of hundreds of thousands of ESTs, and millions of SAGE tags in a single day, with a strong impact on the discovery of RNA-biomarkers.
106 D. Martins-de-Souza, E. Dias-Neto
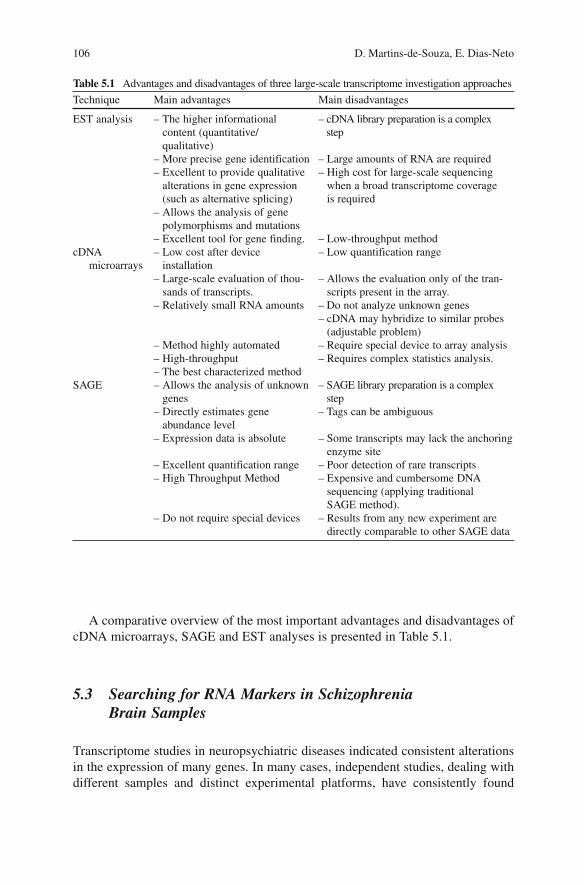
Table 5.1 Advantages and disadvantages of three large-scale transcriptome investigation approaches
Technique Main advantages Main disadvantages
EST analysis – The higher informational content (quantitative/qualitative)
– cDNA library preparation is a complex step
– More precise gene identification – Large amounts of RNA are required – Excellent to provide qualitative
alterations in gene expression (such as alternative splicing)
– High cost for large-scale sequencing when a broad transcriptome coverage is required
– Allows the analysis of gene polymorphisms and mutations
– Excellent tool for gene finding. – Low-throughput method cDNA
microarrays – Low cost after device
installation – Low quantification range
– Large-scale evaluation of thou-sands of transcripts.
– Allows the evaluation only of the tran-scripts present in the array.
– Relatively small RNA amounts – Do not analyze unknown genes – cDNA may hybridize to similar probes
(adjustable problem) – Method highly automated – Require special device to array analysis – High-throughput – The best characterized method
– Requires complex statistics analysis.
SAGE – Allows the analysis of unknown genes
– SAGE library preparation is a complex step
– Directly estimates gene abundance level
– Tags can be ambiguous
– Expression data is absolute – Some transcripts may lack the anchoring enzyme site
– Excellent quantification range – Poor detection of rare transcripts – High Throughput Method – Expensive and cumbersome DNA
sequencing (applying traditional SAGE method).
– Do not require special devices – Results from any new experiment are directly comparable to other SAGE data
A comparative overview of the most important advantages and disadvantages of cDNA microarrays, SAGE and EST analyses is presented in Table 5.1 .
5.3 Searching for RNA Markers in Schizophrenia Brain Samples
Transcriptome studies in neuropsychiatric diseases indicated consistent alterations in the expression of many genes. In many cases, independent studies, dealing with different samples and distinct experimental platforms, have consistently found
5 RNA Biomarkers in Schizophrenia 107
alterations in the same genes, or in the same pathways, strongly suggesting the implication of discrete physiological clusters in the pathophysiology of certain diseases. This is a strong suggestion that transcriptional alterations may be very relevant not only to propose appropriate biomarkers, but also to contribute to the comprehension of the biological basis of neuropsychiatric diseases.
On the next pages we will briefly present the regulatory clusters more consistently identified in gene expression studies in SCZ, which constitute the most promising RNA markers for this disease.
5.3.1 Oligodendrocyte-related Genes
The main function of the oligodendrocytes is the formation of myelin sheath units around the axons of the neurons in the central nervous system. Myelin is an electrically-insulating phospholipid layer that surrounds the axons of many neurons and greatly facilitates axonal signal by increasing the speed at which the electrical impulses are propagated and by preventing the electrical current from leaving the axon. Due to the key role of myelin, oligodendrocytes have been an important focus in the study of many neurological and neuropsychiatric diseases. In the grey-matter, oligodendro-cytes are more numerous than astrocytes and microglia (Dai et al., 2003) , and it has been estimated that oligodendrocytes constitute about 51% of cells around the soma of large neurons in the human cortex (Polak et al., 1982) . The atrophy of pyramidal neurons in the hippocampus, which has been reported in the prefrontal cortex (PFC) in SCZ, can be caused by the loss of these important cells (Benes et al., 1991 ; Arnold et al., 1995 ; Zaidel et al., 1997 ; Rajkowska et al., 2001) . Whereas the abnormal distribution and decreased density of oligodendrocytes in frontal regions of SCZ brains was observed in histological studies (Uranova et al., 2001) , the search for RNA markers in different regions of SCZ brains revealed the altered regulation of many oligodendrocyte-related genes, most involved with myelin-homeostasis, sug-gesting the important role of myelinization and oligodendrocytes in SCZ. Alterations in the metabolism of oligodendrocytes are among the most consistent SCZ biomarkers.
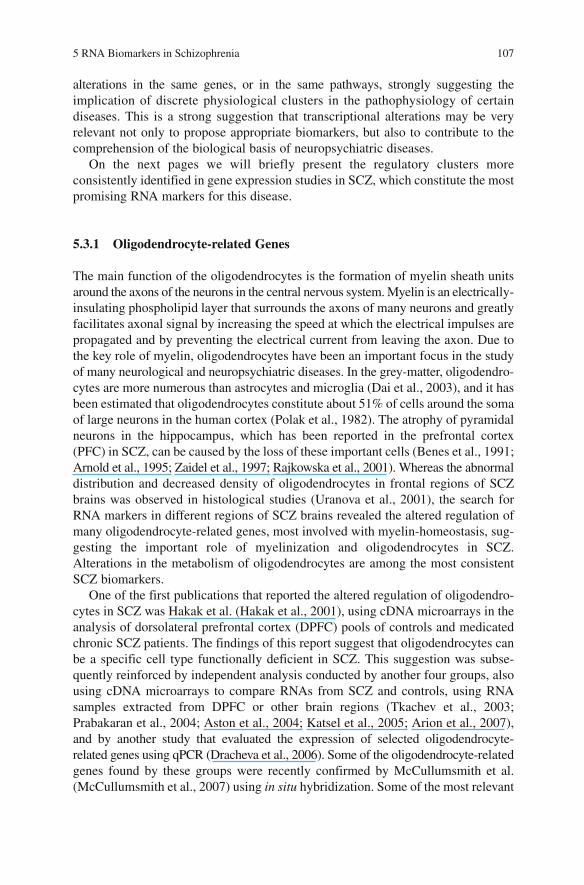
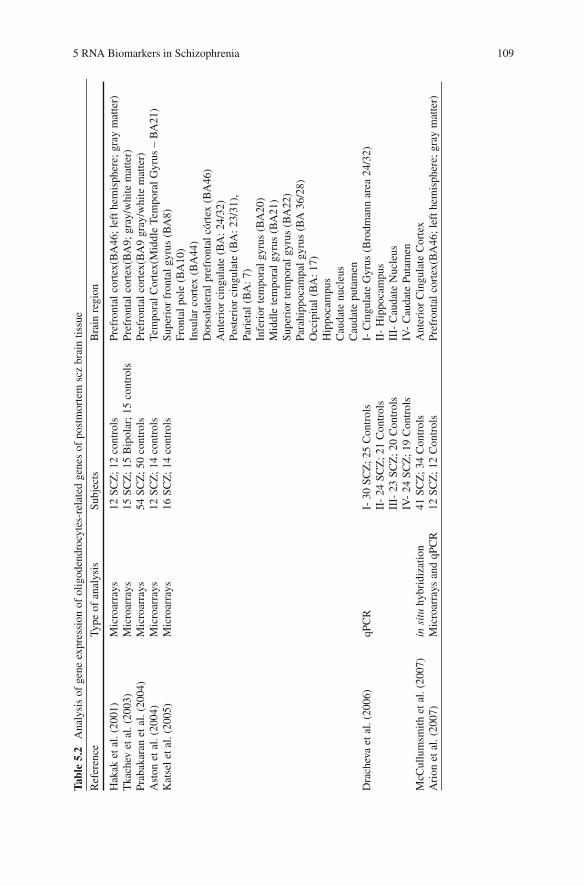
One of the first publications that reported the altered regulation of oligodendro-cytes in SCZ was Hakak et al. (Hakak et al., 2001) , using cDNA microarrays in the analysis of dorsolateral prefrontal cortex (DPFC) pools of controls and medicated chronic SCZ patients. The findings of this report suggest that oligodendrocytes can be a specific cell type functionally deficient in SCZ. This suggestion was subse-quently reinforced by independent analysis conducted by another four groups, also using cDNA microarrays to compare RNAs from SCZ and controls, using RNA samples extracted from DPFC or other brain regions (Tkachev et al., 2003 ; Prabakaran et al., 2004 ; Aston et al., 2004 ; Katsel et al., 2005 ; Arion et al., 2007) , and by another study that evaluated the expression of selected oligodendrocyte-related genes using qPCR (Dracheva et al., 2006) . Some of the oligodendrocyte-related genes found by these groups were recently confirmed by McCullumsmith et al. (McCullumsmith et al., 2007) using in situ hybridization. Some of the most relevant
108 D. Martins-de-Souza, E. Dias-Neto
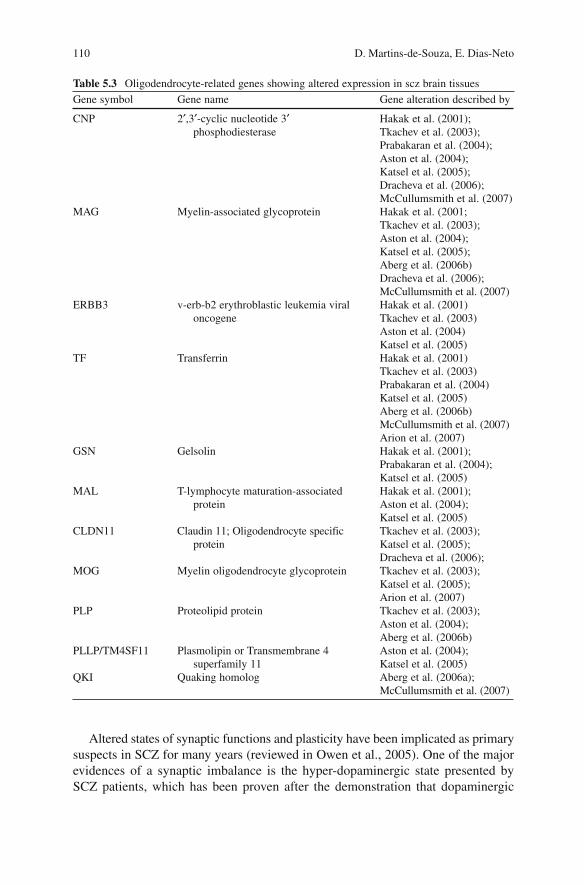
papers published on RNA analysis in SCZ, as well as the brain regions and plat-forms used in the study are presented in Table 5.2 . The most consistent oli-godendrocyte-related gene expression alterations, identified by at least two groups, are listed in Table 5.3 .
Many different large-scale studies, using different samples, different brain regions and diverse microarray platforms showed significant alterations in the expression of myelinization pathways. Many of these findings were subsequently confirmed on an individual basis, by other groups, usually with sensitive approaches such as qPCR analysis. Diverse genes related to oligodendrocyte function were confirmed on an individual basis, including 2’,3’-cyclic nucleotide 3’ phosphodiesterase (CNP) (Peirce et al., 2006) , Myelin-associated glycoprotein (MAG) (Aberg et al., 2006 ; Wan et al., 2005) , Gelsolin (GSN) (Xi et al., 2004) , Myelin oligodendrocyte glycoprotein (MOG) (Liu et al., 2005) , Neuregulin (NRG1) (Tosato et al., 2005) , and many others.
It is interesting to note that the myelination of the PFC occurs in adolescence, a period when SCZ onset is more common. It should also be noted that demyelination diseases such as metachromatic leukodystrophy, are associated with schizophrenic-like psychoses (Hyde et al., 1992) . As suggested by Hakak et al. (Hakak et al., 2001) , alterations in oligodendrocyte—axon interactions may underlie cytoarchitectural changes found in SCZ. When the consistent observation of a differential regulation of myelin-related genes is taken together with clinical and physiological aspects, oligodendrocytes appear as one of the stronger players in SCZ.
5.3.2 Alterations in Synaptic Function and Plasticity
One of the first large-scale transcriptome analyses of SCZ brains was carried out by Mirnics et al. (Mirnics et al., 2000) who used cDNA microarrays to study gene expression in PFC samples derived from 12 SCZ and 10 control subjects. PFC, the anterior region of the frontal lobes, is one of the most explored brain regions in SCZ RNA studies. This neocortical region is most elaborated in primates and provides diverse and flexible behavioral repertoires, including the differentiation of conflicting thoughts, determination of concepts of “good and bad”, and perspectives in accordance with determined actions and moderating correct social behavior. Moreover, an important function operated in PFC is personality expression (Miller and Cohen, 2001 ; Liston et al., 2006) . The platform used by Mirnics et al. (Mirnics et al., 2000) contained over 7,000 unique cDNA elements, and the most relevant findings involved the reduced expression of genes involved in presynaptic function (PSYN) which were subsequently verified by in situ hybridization. The reduced expression of PSYN genes, can lead to an impaired release of synaptic vesicles at nerve termi-nals, causing a neurotransmission imbalance frequently observed in SCZ. Two genes showed consistent regulation in individual analysis: N-ethylmaleimide sensi-tive factor (NSF) and synapsin II (SYN2) in all six SCZ patients included in the study. The markers revealed by this study suggest that SCZ can be the consequence of an abnormality in presynaptic function.
5 RNA Biomarkers in Schizophrenia 109
Tabl
e 5.
2 A
naly
sis
of g
ene
expr
essi
on o
f ol
igod
endr
ocyt
es-r
elat
ed g
enes
of
post
mor
tem
scz
bra
in ti
ssue
Ref
eren
ce
Type
of
anal
ysis
Su
bjec
ts
Bra
in r
egio
n
Hak
ak e
t al.
(200
1)
Mic
roar
rays
12
SC
Z; 1
2 co
ntro
ls
Pref
ront
al c
orte
x(B
A46
; lef
t hem
isph
ere;
gra
y m
atte
r)
Tka
chev
et a
l. (2
003)
M
icro
arra
ys
15 S
CZ
; 15
Bip
olar
; 15
cont
rols
Pr
efro
ntal
cor
tex(
BA
9; g
ray/
whi
te m
atte
r)
Prab
akar
an e
t al.
(200
4)
Mic
roar
rays
54
SC
Z; 5
0 co
ntro
ls
Pref
ront
al c
orte
x(B
A9
gray
/whi
te m
atte
r)
Ast
on e
t al.
(200
4)
Mic
roar
rays
12
SC
Z; 1
4 co
ntro
ls
Tem
pora
l Cor
tex(
Mid
dle
Tem
pora
l Gyr
us –
BA
21)
Kat
sel e
t al.
(200
5)
Mic
roar
rays
16
SC
Z; 1
4 co
ntro
ls
Supe
rior
fro
ntal
gyr
us (
BA
8)
Fron
tal p
ole
(BA
10)
Insu
lar
cort
ex (
BA
44)
Dor
sola
tera
l pre
fron
tal c
órte
x (B
A46
) A
nter
ior
cing
ulat
e (B
A: 2
4/32
) Po
ster
ior
cing
ulat
e (B
A: 2
3/31
),
Pari
etal
(B
A: 7
) In
feri
or te
mpo
ral g
yrus
(B
A20
) M
iddl
e te
mpo
ral g
yrus
(B
A21
) Su
peri
or te
mpo
ral g
yrus
(B
A22
) Pa
rahi
ppoc
ampa
l gyr
us (
BA
36/
28)
Occ
ipita
l (B
A: 1
7)
Hip
poca
mpu
s C
auda
te n
ucle
us
Cau
date
put
amen
D
rach
eva
et a
l. (2
006)
qP
CR
I-
30
SCZ
; 25
Con
trol
s I-
Cin
gula
te G
yrus
(B
rodm
ann
area
24/
32)
II-
24 S
CZ
; 21
Con
trol
s II
- H
ippo
cam
pus
III-
23
SCZ
; 20
Con
trol
s II
I- C
auda
te N
ucle
us
IV-
24 S
CZ
; 19
Con
trol
s IV
- C
auda
te P
utam
en
McC
ullu
msm
ith e
t al.
(200
7)
in s
itu
hybr
idiz
atio
n 41
SC
Z; 3
4 C
ontr
ols
Ant
erio
r C
ingu
late
Cor
tex
Ari
on e
t al.
(200
7)
Mic
roar
rays
and
qPC
R
12 S
CZ
; 12
Con
trol
s Pr
efro
ntal
cor
tex(
BA
46; l
eft h
emis
pher
e; g
ray
mat
ter)
110 D. Martins-de-Souza, E. Dias-Neto
Gene symbol Gene name Gene alteration described by
CNP 2′,3′-cyclic nucleotide 3′ phosphodiesterase
Hakak et al. (2001); Tkachev et al. (2003); Prabakaran et al. (2004); Aston et al. (2004); Katsel et al. (2005); Dracheva et al. (2006); McCullumsmith et al. (2007)
MAG Myelin-associated glycoprotein Hakak et al. (2001; Tkachev et al. (2003); Aston et al. (2004); Katsel et al. (2005); Aberg et al. (2006b) Dracheva et al. (2006); McCullumsmith et al. (2007)
ERBB3 v-erb-b2 erythroblastic leukemia viral oncogene
Hakak et al. (2001) Tkachev et al. (2003) Aston et al. (2004) Katsel et al. (2005)
TF Transferrin Hakak et al. (2001) Tkachev et al. (2003) Prabakaran et al. (2004) Katsel et al. (2005) Aberg et al. (2006b) McCullumsmith et al. (2007) Arion et al. (2007)
GSN Gelsolin Hakak et al. (2001); Prabakaran et al. (2004); Katsel et al. (2005)
MAL T-lymphocyte maturation-associated protein
Hakak et al. (2001); Aston et al. (2004); Katsel et al. (2005)
CLDN11 Claudin 11; Oligodendrocyte specific protein
Tkachev et al. (2003); Katsel et al. (2005); Dracheva et al. (2006);
MOG Myelin oligodendrocyte glycoprotein Tkachev et al. (2003); Katsel et al. (2005); Arion et al. (2007)
PLP Proteolipid protein Tkachev et al. (2003); Aston et al. (2004); Aberg et al. (2006b)
PLLP/TM4SF11 Plasmolipin or Transmembrane 4 superfamily 11
Aston et al. (2004); Katsel et al. (2005)
QKI Quaking homolog Aberg et al. (2006a); McCullumsmith et al. (2007)
Table 5.3 Oligodendrocyte-related genes showing altered expression in scz brain tissues
Altered states of synaptic functions and plasticity have been implicated as primary suspects in SCZ for many years (reviewed in Owen et al., 2005) . One of the major evidences of a synaptic imbalance is the hyper-dopaminergic state presented by SCZ patients, which has been proven after the demonstration that dopaminergic
5 RNA Biomarkers in Schizophrenia 111
agonists can induce “psychotic-like status” and after the observation that the potency of an antipsychotic drug is directly proportional to its ability to block dopamine receptors (Seeman et al., 1975) . Moreover, an abnormal neurodevelopment, including synapse formation, could be one of the main causes of this hyper-dopaminergic state (Raedler et al., 1998) . The synaptic defects in SCZ brains may lead to deficits in episodic memory, malfunction of hippocampal circuitry, and anomalies of axonal sprouting (Ben-Shachar and Laifenfeld, 2004) .
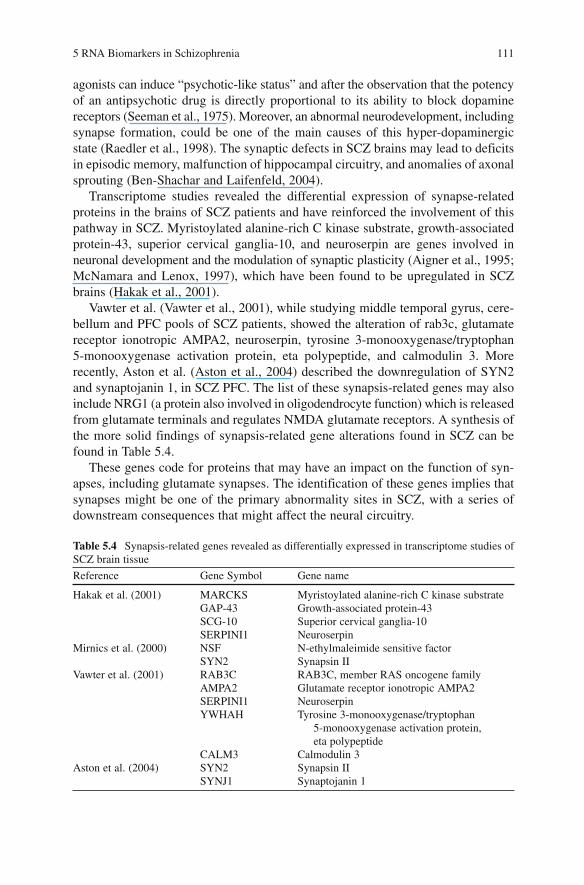
Transcriptome studies revealed the differential expression of synapse-related proteins in the brains of SCZ patients and have reinforced the involvement of this pathway in SCZ. Myristoylated alanine-rich C kinase substrate, growth-associated protein-43, superior cervical ganglia-10, and neuroserpin are genes involved in neuronal development and the modulation of synaptic plasticity (Aigner et al., 1995 ; McNamara and Lenox, 1997) , which have been found to be upregulated in SCZ brains (Hakak et al., 2001) .
Vawter et al. (Vawter et al., 2001) , while studying middle temporal gyrus, cere-bellum and PFC pools of SCZ patients, showed the alteration of rab3c, glutamate receptor ionotropic AMPA2, neuroserpin, tyrosine 3-monooxygenase/tryptophan 5-monooxygenase activation protein, eta polypeptide, and calmodulin 3. More recently, Aston et al. (Aston et al., 2004) described the downregulation of SYN2 and synaptojanin 1, in SCZ PFC. The list of these synapsis-related genes may also include NRG1 (a protein also involved in oligodendrocyte function) which is released from glutamate terminals and regulates NMDA glutamate receptors. A synthesis of the more solid findings of synapsis-related gene alterations found in SCZ can be found in Table 5.4 .
These genes code for proteins that may have an impact on the function of syn-apses, including glutamate synapses. The identification of these genes implies that synapses might be one of the primary abnormality sites in SCZ, with a series of downstream consequences that might affect the neural circuitry.
Table 5.4 Synapsis-related genes revealed as differentially expressed in transcriptome studies of SCZ brain tissue
Reference Gene Symbol Gene name
Hakak et al. (2001) MARCKS Myristoylated alanine-rich C kinase substrate GAP-43 Growth-associated protein-43 SCG-10 Superior cervical ganglia-10 SERPINI1 Neuroserpin
Mirnics et al. (2000) NSF N-ethylmaleimide sensitive factor SYN2 Synapsin II
Vawter et al. (2001) RAB3C RAB3C, member RAS oncogene family AMPA2 Glutamate receptor ionotropic AMPA2 SERPINI1 Neuroserpin YWHAH Tyrosine 3-monooxygenase/tryptophan
5-monooxygenase activation protein, eta polypeptide
CALM3 Calmodulin 3 Aston et al. (2004) SYN2 Synapsin II
SYNJ1 Synaptojanin 1
112 D. Martins-de-Souza, E. Dias-Neto
5.3.3 Energy Metabolism
Alterations in energy metabolism have been extensively described by large-scale transcriptome and proteome analyses in SCZ (Prabakaran et al., 2004 ; Ben-Shachar and Laifenfeld, 2004 ; Bubber et al., 2004 ; Karry et al., 2004 ; Glatt et al., 2005 ; Clark et al., 2006 ; Martorell et al., 2006 ; Mehler-Wex et al., 2006) . Many aspects of the energy metabolism in brain, as well as its close connection to the neuronal plasticity and synapse (reviewed in Ben-Shachar and Laifenfeld, 2004) and evi-dence of oxidative damage in SCZ brains (reviewed in Yao et al., 2001) strongly suggest that SCZ has an important energetic component in its pathogenesis.
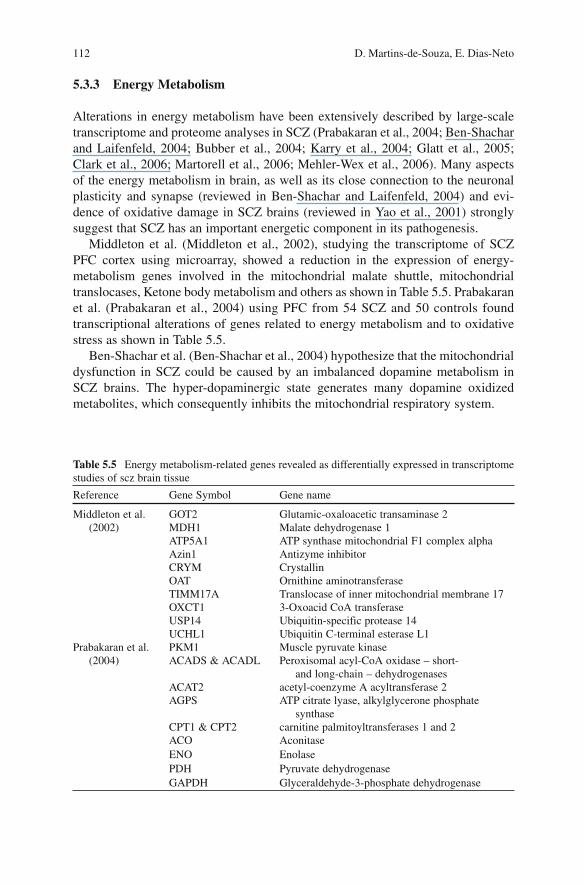
Middleton et al. (Middleton et al., 2002) , studying the transcriptome of SCZ PFC cortex using microarray, showed a reduction in the expression of energy-metabolism genes involved in the mitochondrial malate shuttle, mitochondrial translocases, Ketone body metabolism and others as shown in Table 5.5 . Prabakaran et al. (Prabakaran et al., 2004) using PFC from 54 SCZ and 50 controls found transcriptional alterations of genes related to energy metabolism and to oxidative stress as shown in Table 5.5 .
Ben-Shachar et al. (Ben-Shachar et al., 2004) hypothesize that the mitochondrial dysfunction in SCZ could be caused by an imbalanced dopamine metabolism in SCZ brains. The hyper-dopaminergic state generates many dopamine oxidized metabolites, which consequently inhibits the mitochondrial respiratory system.
Table 5.5 Energy metabolism-related genes revealed as differentially expressed in transcriptome studies of scz brain tissue
Reference Gene Symbol Gene name
Middleton et al. (2002)
GOT2 Glutamic-oxaloacetic transaminase 2 MDH1 Malate dehydrogenase 1 ATP5A1 ATP synthase mitochondrial F1 complex alpha Azin1 Antizyme inhibitor CRYM Crystallin OAT Ornithine aminotransferase TIMM17A Translocase of inner mitochondrial membrane 17 OXCT1 3-Oxoacid CoA transferase USP14 Ubiquitin-specific protease 14 UCHL1 Ubiquitin C-terminal esterase L1
Prabakaran et al. (2004)
PKM1 Muscle pyruvate kinase ACADS & ACADL Peroxisomal acyl-CoA oxidase – short-
and long-chain – dehydrogenases ACAT2 acetyl-coenzyme A acyltransferase 2 AGPS ATP citrate lyase, alkylglycerone phosphate
synthase CPT1 & CPT2 carnitine palmitoyltransferases 1 and 2 ACO Aconitase ENO Enolase PDH Pyruvate dehydrogenase GAPDH Glyceraldehyde-3-phosphate dehydrogenase
5 RNA Biomarkers in Schizophrenia 113
5.3.4 Other Biochemical Pathways
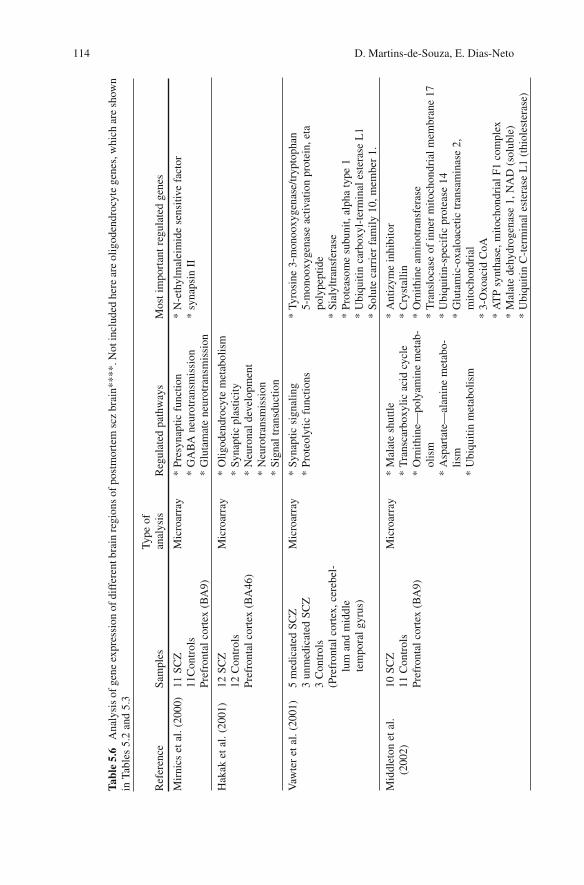
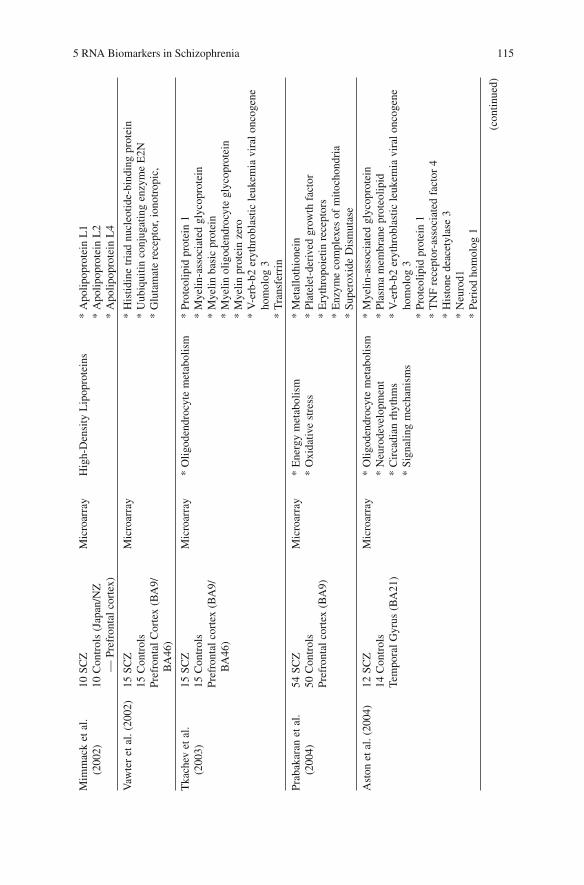
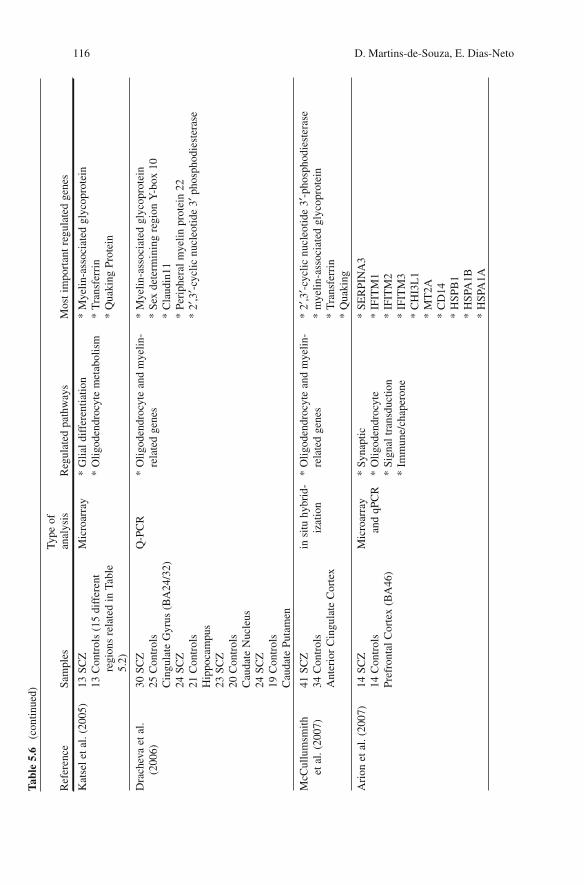
Table 5.6 presents an overall synthesis of large-scale analyses in SCZ brains, showing the sample size and the brain areas studied, and highlighting the most relevant regu-lated pathways.
Taken together, the results of the gene expression studies presented here suggest that there is both neuronal and glial involvement in the SCZ disease process, including alterations in the transmission and propagation of the electric impulse in the axons as well as in the synapses, together with central energy deficits in some brain areas.
5.4 Searching for RNA Biomarkers in Peripheral Blood Cells
Central biomarkers identified in the brains of SCZ patients are fundamental to help to uncover the biological basis of the disease and to provide new targets for the development of novel therapeutic approaches. However, the difficulty to obtain fresh brain tissues, especially for RNA studies, not only complicates the analysis of a large number of patients, but also makes it difficult to have homogeneous groups with less confounding effects (such as age, diet, causa-mortis , gender and use of psychotropic medications). Thus, the advantages of identifying SCZ markers in peripheral tissues are obvious and have clear implications for diagnosis and for the clinical management of the patients.
The large-scale analysis of the blood cell transcriptome in SCZ has been done by a few groups and a number of promising biomarkers have been revealed. However, the recurring identification of biomarkers has been scarce, mainly due to the distinct platforms and the heterogeneity of the clinical samples studied. Vawter et al. (Vawter et al., 2004) analyzed the transcriptome of cultured leukocytes from five patients with SCZ and nine controls using an array of brain-expressed genes. These authors found statistically significant differences in the expression of eight transcripts. The differential expression of two of these genes (neuropeptide Y receptor Y1 gene — NPY1R and guanine nucleotide-binding regulatory protein Go-alpha -GNAO1) could be confirmed by qPCR. The circulating blood transcrip-tome of 30 SCZ and 17 controls was evaluated by Tsuang et al. (Tsuang et al., 2005) , while searching for peripheral RNA markers for the diagnosis of SCZ. For this analysis the authors used cDNA microarrays as a platform to suggest dif-ferentially expressed genes, and qPCR for validation. The results allowed the discrimination between SCZ and controls through linear and nonlinear combina-tions of eight putative biomarker genes as shown in Table 5.7 with an overall accuracy of 95–97%. The confirmation of these findings by other groups is fundamental to validate these markers.
Altered gene expression in peripheral blood cells of SCZ patients was also evaluated by Glatt et al. (Glatt et al., 2005) in one of the most austere approaches published up to now. This study used cDNA microarray analysis to investigate RNA alterations in the brain, followed by the analysis of peripheral blood cells in
114 D. Martins-de-Souza, E. Dias-Neto
Tabl
e 5.
6 A
naly
sis
of g
ene
expr
essi
on o
f dif
fere
nt b
rain
regi
ons
of p
ostm
orte
m s
cz b
rain
****
. Not
incl
uded
her
e ar
e ol
igod
endr
ocyt
e ge
nes,
whi
ch a
re s
how
n in
Tab
les
5.2
and
5.3
Ref
eren
ce
Sam
ples
Ty
pe o
f an
alys
is
Reg
ulat
ed p
athw
ays
Mos
t im
port
ant r
egul
ated
gen
es
Mir
nics
et a
l. (2
000)
11
SC
Z
Mic
roar
ray
* Pr
esyn
aptic
fun
ctio
n *
N-e
thyl
mal
eim
ide
sens
itive
fac
tor
11C
ontr
ols
* G
AB
A n
euro
tran
smis
sion
*
syna
psin
II
Pref
ront
al c
orte
x (B
A9)
*
Glu
tam
ate
neur
otra
nsm
issi
on
Hak
ak e
t al.
(200
1)
12 S
CZ
12
Con
trol
s Pr
efro
ntal
cor
tex
(BA
46)
Mic
roar
ray
* O
ligod
endr
ocyt
e m
etab
olis
m
* Sy
napt
ic p
last
icity
*
Neu
rona
l dev
elop
men
t *
Neu
rotr
ansm
issi
on
* Si
gnal
tran
sduc
tion
Vaw
ter
et a
l. (2
001)
5
med
icat
ed S
CZ
3
unm
edic
ated
SC
Z
3 C
ontr
ols
(Pre
fron
tal c
orte
x, c
ereb
el-
lum
and
mid
dle
tem
pora
l gyr
us)
Mic
roar
ray
* Sy
napt
ic s
igna
ling
* Pr
oteo
lytic
fun
ctio
ns
* Ty
rosi
ne 3
-mon
ooxy
gena
se/tr
ypto
phan
5-
mon
ooxy
gena
se a
ctiv
atio
n pr
otei
n, e
ta
poly
pept
ide
* Si
alyl
tran
sfer
ase
* Pr
otea
som
e su
buni
t, al
pha
type
1
* U
biqu
itin
carb
oxyl
-ter
min
al e
ster
ase
L1
* So
lute
car
rier
fam
ily 1
0, m
embe
r 1.
Mid
dlet
on e
t al.
(200
2)
10 S
CZ
11
Con
trol
s Pr
efro
ntal
cor
tex
(BA
9)
Mic
roar
ray
* M
alat
e sh
uttle
*
Tra
nsca
rbox
ylic
aci
d cy
cle
* O
rnith
ine—
poly
amin
e m
etab
-ol
ism
*
Asp
arta
te—
alan
ine
met
abo-
lism
*
Ubi
quiti
n m
etab
olis
m
* A
ntiz
yme
inhi
bito
r *
Cry
stal
lin
* O
rnith
ine
amin
otra
nsfe
rase
*
Tra
nslo
case
of
inne
r m
itoch
ondr
ial m
embr
ane
17
* U
biqu
itin-
spec
ific
pro
teas
e 14
*
Glu
tam
ic-o
xalo
acet
ic tr
ansa
min
ase
2,
mito
chon
dria
l *
3-O
xoac
id C
oA
* A
TP
synt
hase
, mito
chon
dria
l F1
com
plex
*
Mal
ate
dehy
drog
enas
e 1,
NA
D (
solu
ble)
*
Ubi
quiti
n C
-ter
min
al e
ster
ase
L1
(thi
oles
tera
se)
5 RNA Biomarkers in Schizophrenia 115
(con
tinue
d)
Mim
mac
k et
al.
(200
2)
10 S
CZ
10
Con
trol
s (J
apan
/NZ
—
Pre
fron
tal c
orte
x)
Mic
roar
ray
Hig
h-D
ensi
ty L
ipop
rote
ins
* A
polip
opro
tein
L1
* A
polip
opro
tein
L2
* A
polip
opro
tein
L4
Vaw
ter
et a
l. (2
002)
15
SC
Z
15 C
ontr
ols
Pref
ront
al C
orte
x (B
A9/
BA
46)
Mic
roar
ray
* H
istid
ine
tria
d nu
cleo
tide-
bind
ing
prot
ein
* U
ubiq
uitin
con
juga
ting
enzy
me
E2N
*
Glu
tam
ate
rece
ptor
, ion
otro
pic,
Tka
chev
et a
l. (2
003)
15
SC
Z
15 C
ontr
ols
Pref
ront
al c
orte
x (B
A9/
BA
46)
Mic
roar
ray
* O
ligod
endr
ocyt
e m
etab
olis
m
* Pr
oteo
lipid
pro
tein
1
* M
yelin
-ass
ocia
ted
glyc
opro
tein
*
Mye
lin b
asic
pro
tein
*
Mye
lin o
ligod
endr
ocyt
e gl
ycop
rote
in
* M
yelin
pro
tein
zer
o *
V-e
rb-b
2 er
ythr
obla
stic
leuk
emia
vir
al o
ncog
ene
hom
olog
3
* T
rans
ferr
in
Prab
akar
an e
t al.
(200
4)
54 S
CZ
50
Con
trol
s Pr
efro
ntal
cor
tex
(BA
9)
Mic
roar
ray
* E
nerg
y m
etab
olis
m
* O
xida
tive
stre
ss
* M
etal
loth
ione
in
* Pl
atel
et-d
eriv
ed g
row
th f
acto
r *
Ery
thro
poie
tin r
ecep
tors
*
Enz
yme
com
plex
es o
f m
itoch
ondr
ia
* Su
pero
xide
Dis
mut
ase
Ast
on e
t al.
(200
4)
12 S
CZ
14
Con
trol
s Te
mpo
ral G
yrus
(B
A21
)
Mic
roar
ray
* O
ligod
endr
ocyt
e m
etab
olis
m
* N
euro
deve
lopm
ent
* C
irca
dian
rhy
thm
s *
Sign
alin
g m
echa
nism
s
* M
yelin
-ass
ocia
ted
glyc
opro
tein
*
Plas
ma
mem
bran
e pr
oteo
lipid
*
V-e
rb-b
2 er
ythr
obla
stic
leuk
emia
vir
al o
ncog
ene
hom
olog
3
* Pr
oteo
lipid
pro
tein
1
* T
NF
rece
ptor
-ass
ocia
ted
fact
or 4
*
His
tone
dea
cety
lase
3
* N
euro
d1
* Pe
riod
hom
olog
1
116 D. Martins-de-Souza, E. Dias-Neto
Tabl
e 5.
6 (c
ontin
ued)
Ref
eren
ce
Sam
ples
Ty
pe o
f an
alys
is
Reg
ulat
ed p
athw
ays
Mos
t im
port
ant r
egul
ated
gen
es
Kat
sel e
t al.
(200
5)
13 S
CZ
13
Con
trol
s (1
5 di
ffer
ent
regi
ons
rela
ted
in T
able
5.
2)
Mic
roar
ray
* G
lial d
iffe
rent
iatio
n *
Olig
oden
droc
yte
met
abol
ism
*
Mye
lin-a
ssoc
iate
d gl
ycop
rote
in
* T
rans
ferr
in
* Q
uaki
ng P
rote
in
Dra
chev
a et
al.
(200
6)
30 S
CZ
25
Con
trol
s C
ingu
late
Gyr
us (
BA
24/3
2)
24 S
CZ
21
Con
trol
s H
ippo
cam
pus
23 S
CZ
20
Con
trol
s C
auda
te N
ucle
us
24 S
CZ
19
Con
trol
s C
auda
te P
utam
en
Q-P
CR
*
Olig
oden
droc
yte
and
mye
lin-
rela
ted
gene
s *
Mye
lin-a
ssoc
iate
d gl
ycop
rote
in
* Se
x de
term
inin
g re
gion
Y-b
ox 1
0 *
Cla
udin
11
* Pe
riph
eral
mye
lin p
rote
in 2
2 *
2′,3
′-cyc
lic n
ucle
otid
e 3′
pho
spho
dies
tera
se
McC
ullu
msm
ith
et a
l. (2
007)
41
SC
Z
34 C
ontr
ols
Ant
erio
r C
ingu
late
Cor
tex
in s
itu h
ybri
d-iz
atio
n *
Olig
oden
droc
yte
and
mye
lin-
rela
ted
gene
s *
2′,3
′-cyc
lic n
ucle
otid
e 3′
-pho
spho
dies
tera
se
* m
yelin
-ass
ocia
ted
glyc
opro
tein
*
Tra
nsfe
rrin
*
Qua
king
Ari
on e
t al.
(200
7)
14 S
CZ
14
Con
trol
s Pr
efro
ntal
Cor
tex
(BA
46)
Mic
roar
ray
and
qPC
R
* Sy
napt
ic
* O
ligod
endr
ocyt
e *
Sign
al tr
ansd
uctio
n *
Imm
une/
chap
eron
e
* SE
RPI
NA
3 *
IFIT
M1
* IF
ITM
2 *
IFIT
M3
* C
HI3
L1
* M
T2A
*
CD
14
* H
SPB
1 *
HSP
A1B
*
HSP
A1A
5 RNA Biomarkers in Schizophrenia 117
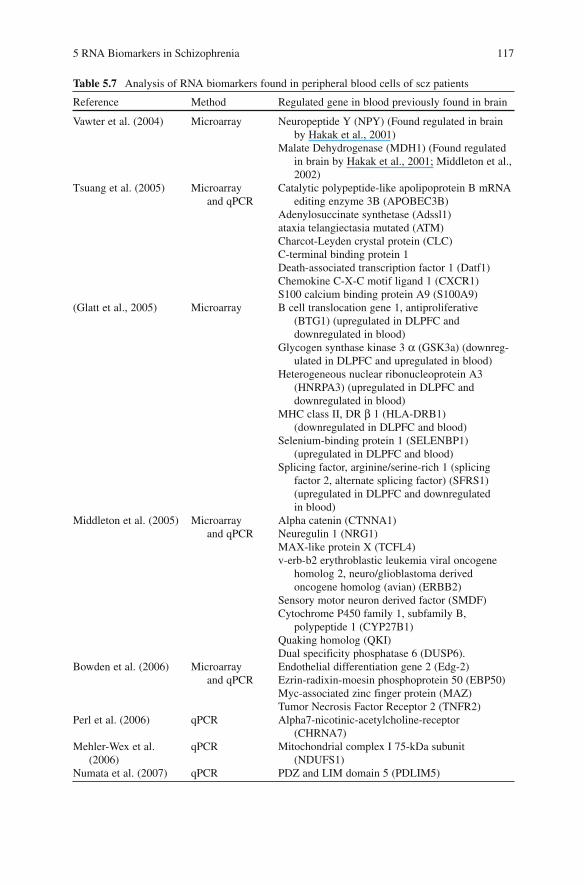
Table 5.7 Analysis of RNA biomarkers found in peripheral blood cells of scz patients
Reference Method Regulated gene in blood previously found in brain
Vawter et al. (2004) Microarray Neuropeptide Y (NPY) (Found regulated in brain by Hakak et al., 2001)
Malate Dehydrogenase (MDH1) (Found regulated in brain by Hakak et al., 2001; Middleton et al., 2002)
Tsuang et al. (2005) Microarray and qPCR
Catalytic polypeptide-like apolipoprotein B mRNA editing enzyme 3B (APOBEC3B)
Adenylosuccinate synthetase (Adssl1) ataxia telangiectasia mutated (ATM) Charcot-Leyden crystal protein (CLC) C-terminal binding protein 1 Death-associated transcription factor 1 (Datf1) Chemokine C-X-C motif ligand 1 (CXCR1) S100 calcium binding protein A9 (S100A9)
(Glatt et al., 2005) Microarray B cell translocation gene 1, antiproliferative (BTG1) (upregulated in DLPFC and downregulated in blood)
Glycogen synthase kinase 3 α (GSK3a) (downreg-ulated in DLPFC and upregulated in blood)
Heterogeneous nuclear ribonucleoprotein A3 (HNRPA3) (upregulated in DLPFC and downregulated in blood)
MHC class II, DR β 1 (HLA-DRB1) (downregulated in DLPFC and blood)
Selenium-binding protein 1 (SELENBP1) (upregulated in DLPFC and blood)
Splicing factor, arginine/serine-rich 1 (splicing factor 2, alternate splicing factor) (SFRS1) (upregulated in DLPFC and downregulated in blood)
Middleton et al. (2005) Microarray and qPCR
Alpha catenin (CTNNA1) Neuregulin 1 (NRG1) MAX-like protein X (TCFL4) v-erb-b2 erythroblastic leukemia viral oncogene
homolog 2, neuro/glioblastoma derived oncogene homolog (avian) (ERBB2)
Sensory motor neuron derived factor (SMDF) Cytochrome P450 family 1, subfamily B,
polypeptide 1 (CYP27B1) Quaking homolog (QKI) Dual specificity phosphatase 6 (DUSP6).
Bowden et al. (2006) Microarray and qPCR
Endothelial differentiation gene 2 (Edg-2) Ezrin-radixin-moesin phosphoprotein 50 (EBP50) Myc-associated zinc finger protein (MAZ) Tumor Necrosis Factor Receptor 2 (TNFR2)
Perl et al. (2006) qPCR Alpha7-nicotinic-acetylcholine-receptor (CHRNA7)
Mehler-Wex et al. (2006)
qPCR Mitochondrial complex I 75-kDa subunit (NDUFS1)
Numata et al. (2007) qPCR PDZ and LIM domain 5 (PDLIM5)
118 D. Martins-de-Souza, E. Dias-Neto
a second cohort of patients and controls. A total of 177 putative markers were found in brain, and 123 putative markers were seen in the peripheral blood cells. Six of these RNA markers were found in both compartments as shown in Table 5.7 . Middleton et al. (Middleton et al., 2005) analyzed by microarray and qPCR the LBP transcriptome from 33 SCZ patients, compared with controls and bipolar patients. They found many altered genes previously described in SCZ analysis as shown in Table 5.7 . Differential expression of Alpha7-nicotinic-acetylcholine-receptor could contribute to sensory gating, leading to a marked dysfunction that can impact employability, treatment adherence, and social skills of SCZ patients. qPCR was used by Perl et al. (Perl et al., 2006) to measure the expression of this gene in peripheral blood cells of 44 SCZ patients and compared with 16 controls, and found a downregulation of this gene (P < 0.05) in SCZ patients. Analysis of other individual genes have been performed by Mehler-Wex et al. (Mehler-Wex et al., 2006) showing the upregulation of mitochondrial complex I 75-kDa subunit in neuroleptic-naive SCZ patients and by Numata et al. (Numata et al., 2007) who described the upregulation of PDLIM5, a gene whose product regulates intracellular calcium levels and has a role in neurotransmitter synaptic vesicles. The PDLIM5 gene lies on chromosome 4q22, a locus previously reported to be linked with SCZ (Mowry et al., 2000) . A synthesis of these findings is described in Table 5.7 .
5.5 New Classes of RNA Markers in Psychiatry
5.5.1 Alternative Splicing Studies
The vast majority of the transcriptome analyses performed during the search for RNA markers in SCZ were based on the old central dogma of “one gene, one mRNA, one protein,” which clearly oversimplifies and underestimates transcriptome com-plexity. These studies are usually focused on quantitative alterations of gene expression, and don’t consider qualitative variations that may occur. While transcriptional regulation plays important roles within a cell, posttranscriptional regulation, such as alternative splicing (AS), dramatically increases transcriptional diversity and may have remarkable consequences for proteome variety. AS plays a critical role in gene expression regulation and human diseases (Kan et al., 2001 ; Cartegni et al., 2002) . Splicing is a cellular mechanism that joins the exons of a precursor immature RNA, removing its intronic sequences. This mechanism occurs in the spliceosome, a complex cellular compartment composed small nuclear RNAs and hundreds of proteins. Since the alternative combination of different gene exons can generate diverse protein isoforms, which can trigger different mechanisms inside the cell, the study of AS as a qualitative gene expression data has become one of the central issues in biomedical sciences (Buratti et al., 2006) including SCZ research.
Studies of AS isoforms, as possible RNA markers in SCZ, have been focused on a few genes usually those traditionally studied in SCZ. An example is the Dopamine receptor D2 which produces, by AS, two receptor isoforms called D2L (for long
5 RNA Biomarkers in Schizophrenia 119
isoform) and D2S (for short) (Giros et al., 1989) . These two isoforms have distinct functions in vivo: D2L acting mainly at postsynaptic sites and D2S serves as a pre-synaptic autoreceptor (Usiello et al., 2000) . These subunits differentially contribute to the therapeutic actions and side effects of antipsychotic agents (Xu et al., 2002) . Splicing variants are also responsible for the molecular dissimilarity of genes related to a number of important SCZ pathways discussed in this chapter, including genes involved in myelinization and synapses. Good examples are the synapsins, synaptic vesicle-associated phosphoproteins that have been implicated in the control of neurotransmitter release and synaptogenesis. It should be noted that a member of this family (synapsin III) is located on human chromosome 22q, a SCZ-susceptibility locus, and different AS isoforms have been described in the brain (Kao et al., 1998) .
Quaking homolog (QKI) is a development-related protein encoded by a gene highly conserved among different species. A deletion of a portion of this gene causes body tremor and severe dysmyelination of the central nervous system, with dysfunction of oligodendrocytes and a reduced expression of myelin components (Sidman et al., 1964 ; Ebersole et al., 1996 ; Hardy et al., 1996) . Aberg et al. (Aberg et al., 2006a) showed that one of the four AS isoforms of QKI (named QKI-7kb ) was reduced in the frontal cortex of SCZ patients. The same group showed later (Aberg et al., 2006b) that the reduced expression of this isoform could be correlated to the reduced expression of three tightly regulated myelin-related genes ( PLP1, MAG , and TF ) that also had a reduced expression in SCZ brain samples as compared to controls. These results indicate that QKI may be a master regulator of oli-godendrocyte differentiation/maturation in the human brain and also suggest that decreased activities of myelin-related genes in SCZ might be caused by a disturbed QKI splicing.
Other examples of AS in SCZ include variations in the relative abundance of alternatively spliced isoforms of the gamma2 subunit of the GABA-A receptor (Huntsman et al., 1998 ; Zhao et al., 2006) , NCAM1 (Neural cell adhesion molecule) (Vawter et al., 2000) , NMDA receptor (Clinton et al., 2003) , glutamate receptor 3 (mGluR3) (Sartorius et al., 2006) , and ErbB4 (a Neuregulin 1 receptor) (Silberberg et al., 2006 ; Law et al., 2007) . These examples clearly demonstrate that this class of transcriptional variation also can be relevant in the search of RNA markers for SCZ. In the near future, the analysis of AS RNA markers in SCZ should be reinforced by the use of cDNA microarrays specifically designed to investigate these events in human transcripts, as well as by new sequencing-based approaches that may reveal this kind of event.
5.5.2 microRNAs
A promising class of markers that still needs to be more explored in neuropsychiatry consists of the group of small noncoding regulatory RNA molecules found from plants to viruses and animals (reviewed in Bartel, 2004) . The advent of tiling genomic arrays showed that a significant fraction of the noncoding genome
120 D. Martins-de-Souza, E. Dias-Neto
sequence is transcribed (Kapranov et al., 2002 ; Cheng et al., 2005) . Among these noncoding RNA molecules we find the microRNAs (miRNAs) that are considered today to be the most important transcriptional regulators of the human genome (reviewed in Zhang and Farwell, 2008) . Some papers suggest that miRNA are more consistent regulators than mRNA and that the study of a few hundred of these mol-ecules can derive stronger markers than tens of thousands mRNAs used in cDNA microarray platforms (Lu et al., 2005b) .
miRNAs control distinct processes that lead to regulation of protein abundance, such as transcription, mRNA degradation, stability and translation. An increasing number of studies now reveal the important role of miRNAs in biological processes such as the differentiation and specificity of neurons (Vo et al., 2005 ; Krichevsky et al., 2006) , synapse plasticity (Schratt et al., 2006) development and maintenance of the central nervous system (Krichevsky et al., 2003 ; Miska et al., 2004 ; Giraldez et al., 2005 ; Lukiw and Pogue 2007 ; Makeyev et al., 2007) . The importance of miRNAs in the regulation of these processes, as well as their abundance in the brain, makes these molecules attractive RNA biomarkers to be explored in SCZ.
The analysis of miRNA in SCZ is still in its early days. A recent study evaluated for the first time the differential expression of miRNAs in SCZ (Perkins et al., 2007) . In this study, with a custom miRNA array, the expression of 264 distinct miRNAs was contrasted in postmortem PFC tissue samples of individuals with SCZ (n = 13) or schizoaffective disorder (n = 2) and nonpsychiatric patients (n = 21). The authors found 16 miRNA to be differentially expressed in PFC of patient subjects, 94% being down-regulated, which suggests an overall up-regulation of their targets. The authors concluded that genes that were commonly targeted by the regulated miRNAs were significantly clustered in 12 pathways. The most signifi-cant pathways identified contain proteins involved in synaptic plasticity at the level of dendritic spines.
Today we know that most of the eukaryotic genome is transcribed as noncoding RNAs (ncRNAs), which play important roles in chromatin organization, gene expression, posttranscription regulation, with consequences for normal physiology and disease etiology. The increasing diversity and high expression of ncRNAs, including miRNAs, identified in the eukaryotic genome suggests a critical link between the regulatory potential of ncRNAs and the complexity of genome expres-sion regulation.
5.6 Summary and Perspectives
The continuous identification of alterations in genes related to synapsis, myelini-zation and energy metabolism strongly suggests the involvement of these elements in the pathogenesis of SCZ. However, larger studies involving distinct popula-tions and more samples are still required to fully demonstrate the importance of markers already revealed, and to point to new markers valuable for more specific endophenotypes.
5 RNA Biomarkers in Schizophrenia 121
The future of neuropsychiatric diseases is likely to be profoundly dependent upon the use of biomarkers that shall guide the clinicians at many steps of disease management including early diagnosis, response to therapy and disease outcome. Biomarkers that detect diseases, and predict their outcome or influence treatment choice will have tremendous importance in the future of neuropsychiatric diseases. However, to understand the significance of each biomarker and its importance in pathogenesis, many samples, comprehending diverse ethnical backgrounds, endo-phenotypes and disease states need to be investigated. Massive amounts of biological information will need to be investigated with a multidisciplinary approach involving clinicians, biologists, statisticians and bioinformatics in a continuous interface of genomics, transcriptomics and proteomics.
It is clear that, together with DNA and protein, RNA biomarkers will be part of an optimistic scenario where more detailed and personalized data will be evaluated together, guiding researchers and clinicians to understand and to treat complex diseases.
Acknowledgments The authors thank ABADHS (Associação Beneficente Alzira Denise Hertzog Silva), FAPESP (Fundação de Amparo à Pesquisa do Estado de São Paulo — Brazil), CNPq (Conselho Nacional de Pesquisas) and DAAD (Deutscher Akademischer Austauschdienst) for their fundamental support of our research.
References
Aberg K , Saetre P, Lindholm E et al. (2006a) Human QKI, a new candidate gene for schizophrenia involved in myelination. Am J Med Genet B Neuropsychiatr Genet. 141(1):84–90.
Aberg K , Saetre P, Jareborg N, Jazin E (2006b) Human QKI, a potential regulator of mRNA expression of human oligodendrocyte-related genes involved in schizophrenia. Proc Natl Acad Sci U S A. 103(19):7482–7487.
Adams MD, Dubnick M, Kerlavage AR et al. (1992) Sequence identification of 2,375 human brain genes. Nature. 355(6361):632–634.
Aigner L, Arber S, Kapfhammer JP et al. (1995) Overexpression of the neural growth-associated protein GAP-43 induces nerve sprouting in the adult nervous system of transgenic mice. Cell. 83:269–278.
Arai M, Amano S, Ryo A et al. (2003) Identification of epilepsy-related genes by gene expression profiling in the hippocampus of genetically epileptic rat. Brain Res Mol Brain Res. 118(1–2):147–151.
Arion D, Unger T, Lewis DA (2007) Molecular evidence for increased expression of genes related to immune and chaperone function in the prefrontal cortex in schizophrenia. Biol Psychiatr. 62(7):711–721.
Arnold SE, Franz BR, Gur RC et al. (1995) Smaller neuron size in schizophrenia in hippocampal subfields that mediate cortical-hippocampal interactions. Am J Psychiatr. 152(5):738–748.
Aston C, Jiang L, Sokolov BP (2004) Microarray analysis of postmortem temporal cortex from patients with schizophrenia. J Neurosci Res. 77(6):858–866.
Avedissian M, Longo BM, Jaqueta CB et al. (2007) Hippocampal gene expression analysis using the ORESTES methodology shows that homer 1a mRNA is upregulated in the acute period of the pilocarpine epilepsy model. Hippocampus. 17(2):130–136.
Bartel DP (2004) MicroRNAs: genomics, biogenesis, mechanism, and function. Cell. 116(2):281–297.
122 D. Martins-de-Souza, E. Dias-Neto
Bell R, Munro J, Russ C et al. (2000) Systematic screening of the 14-3-3 eta (eta) chain gene for polymorphic variants and case-control analysis in schizophrenia. Am J Med Genet. 96(6):736–743.
Benes FM, McSparren J, Bird ED et al. (1991) Deficits in small interneurons in prefrontal and cingulate cortices of schizophrenic and schizoaffective patients. Arch Gen Psychiatr. 48(11):996–1001.
Ben-Shachar D, Laifenfeld D (2004) Mitochondria, synaptic plasticity, and schizophrenia. Int Rev Neurobiol. 59:273–296.
Ben-Shachar D, Zuk R, Gazawi H, Ljubuncic P (2004) Dopamine toxicity involves mitochondrial complex I inhibition: implications to dopamine-related neuropsychiatric disorders. Biochem Pharmacol. 67(10):1965–1974.
Benton WD, Davis RW (1977) Screening lambdagt recombinant clones by hybridization to single plaques in situ. Science. 196(4286):180–182.
Bertucci F, Bernard K, Loriod B et al. (1999) Sensitivity issues in DNA array-based expression measurements and performance of nylon microarrays for small samples. Hum Mol Genet. 8, 1715–1722 .
Blencowe BJ (2006) Alternative splicing: new insights from global analyses. Cell. 126(1):37–47. Bovenberg RA, Burbach JP, Wiegant VM et al. (1986) Gamma-Endorphin and schizophrenia:
amino acid composition of gamma-endorphin and nucleotide sequence of gamma-endorphin cDNA from pituitary glands of schizophrenic patients. Brain Res. 376(1):29–37.
Bowden NA, Weidenhofer J, Scott RJ et al. (2006) Preliminary investigation of gene expression profiles in peripheral blood lymphocytes in schizophrenia. Schizophr Res. 82(2–3):175–183.
Bubber P, Tang J, Haroutunian V et al. (2004) Mitochondrial enzymes in schizophrenia. J Mol Neurosci. 24(2):315–321.
Buratti E, Baralle M, Baralle FE (2006) Defective splicing, disease and therapy: searching for master checkpoints in exon definition. Nucleic Acids Res. 34(12):3494–3510.
Cai J, Ash D, Kotch LE et al. (2005) Gene expression in pharyngeal arch 1 during human embryonic development. Hum Mol Genet. 14(7):903–912.
Camargo AA, Samaia HP, Dias-Neto E et al. (2001) The contribution of 700,000 ORF sequence tags to the definition of the human transcriptome. Proc Natl Acad Sci U S A. 98(21):12103–12108.
Cartegni L, Chew SL, Krainer AR (2002) Listening to silence and understanding nonsense: exonic mutations that affect splicing. Nat Rev Genet 3:285–298.
Chakravarty A (2003) Surrogate Markers: Their Role in Regulatory Decision Process. Food and Drug Administration. www.fda.gov/cder/Offices/Biostatistics/Chakravarty_376/sld016.htm.
Cheng J, Kapranov P, Drenkow J et al. (2005) Transcriptional maps of 10 human chromosomes at 5-nucleotide resolution. Science. 308(5725):1149–1154.
Clark D, Dedova I, Cordwell S, Matsumoto I (2006) A proteome analysis of the anterior cingulate cortex gray matter in schizophrenia. Mol Psychiatr. 11:459–470.
Clinton SM, Haroutunian V, Davis KL, Meador-Woodruff JH (2003) Altered transcript expression of NMDA receptor-associated postsynaptic proteins in the thalamus of subjects with schizo-phrenia. Am J Psychiatr. 160(6):1100–1109.
Cowell JK, Hawthorn L (2007) The application of microarray technology to the analysis of the cancer genome. Curr Mol Med. 7(1):103–120.
Cuperlovic-Culf M, Belacel N, Culf AS, Ouellette RJ (2006) Microarray analysis of alternative splicing. OMICS. 10(3):344–357.
Dai X, Lercher LD, Clinton PM et al. (2003) The trophic role of oligodendrocytes in the basal forebrain. J Neurosci. 23(13):5846–5853.
Dias-Neto E, Correa RG, Verjovski-Almeida S et al. (2000) Shotgun sequencing of the human transcriptome with ORF expressed sequence tags. Proc Natl Acad Sci U S A. 97(7):3491–3496.
Dracheva S, Davis KL, Chin B et al. (2006) Myelin-associated mRNA and protein expression deficits in the anterior cingulate cortex and hippocampus in elderly schizophrenia patients. Neurobiol Dis. 21(3):531–540.
5 RNA Biomarkers in Schizophrenia 123
Ebersole TA, Chen Q, Justice MJ, Artzt K (1996) The quaking gene product necessary in embryo-genesis and myelination combines features of RNA binding and signal transduction proteins. Nat Genet. 12(3):260–265.
Frances AJ, First MB, Widiger TA et al. (1991) An A to Z guide to DSM-IV conundrums. J Abnorm Psychol 100:407–412.
Freedman R (2003). Schizophrenia. N Engl J Med. 349:1738–1749. Giraldez AJ, Cinalli RM, Glasner ME et al. (2005) MicroRNAs regulate brain morphogenesis in
zebrafish. Science. 308(5723):833–838. Giros B, Sokoloff P, Martres MP et al. (1989) Alternative splicing directs the expression of two
D2 dopamine receptor isoforms. Nature. 342(6252):923–926. Glatt SJ, Everall IP, Kremen WS et al. (2005) Comparative gene expression analysis of blood and
brain provides concurrent validation of SELENBP1 up-regulation in schizophrenia. Proc Natl Acad Sci U S A. 102(43):15533–15538.
Grunstein M, Hogness DS (1975) Colony hybridization: a method for the isolation of cloned DNAs that contain a specific gene. Proc Natl Acad Sci U S A. 72(10):3961–3965.
Günthard HF, Wong JK, Ignacio CC et al. (1998) Comparative performance of high-density oli-gonucleotide sequencing and dideoxynucleotide sequencing of HIV type 1 pol from clinical samples. AIDS Res Hum Retrovir. 14(10):869–876.
Hakak Y, Walker JR, Li C et al. (2001) Genome-wide expression analysis reveals dysregulation of myelination-related genes in chronic schizophrenia. Proc Natl Acad Sci U S A. 98(8):4746–4751.
Hardy RJ, Loushin CL, Friedrich VL Jr et al. (1996) Neural cell type-specific expression of QKI proteins is altered in quaking viable mutant mice. J Neurosci. 16(24):7941–7949.
Hendriksen H, Datson NA, Ghijsen WE et al. (2001) Altered hippocampal gene expression prior to the onset of spontaneous seizures in the rat post-status epilepticus model. Eur J Neurosci. 14(9):1475–1484.
Hu M, Polyak K (2006) Serial analysis of gene expression. Nat Protoc. 1:1743–1760. Hughes TR, Hiley SL, Saltzman AL et al. (2006) Microarray analysis of RNA processing and
modification. Methods Enzymol. 410:300–16. Huntsman MM, Tran BV, Potkin SG et al. (1998) Altered ratios of alternatively spliced long and
short gamma2 subunit mRNAs of the gamma-amino butyrate type A receptor in prefrontal cortex of schizophrenics. Proc Natl Acad Sci U S A. 95(25):15066–15071.
Hyde TM, Ziegler JC, Weinberger DR (1992) Psychiatric disturbances in metachromatic leukodystrophy. Insights into the neurobiology of psychosis. Arch Neurol. 49(4):401–406.
Kan Z, Rouchka EC, Gish WR, States DJ (2001) Gene Structure Prediction and Alternative Splicing Analysis Using Genomically Aligned ESTs. Genome Res 11(5):889–900.
Kane MD, Jatkoe TA, Stumpf CR et al. (2000) Assessment of the sensitivity and specificity of oligonucleotide (50mer) microarrays. Nucleic Acids Res. 28, 4552–4557
Kao HT, Porton B, Czernik AJ et al. (1998) A third member of the synapsin gene family. Proc Natl Acad Sci U S A. 95(8):4667–4672.
Kapranov P, Cawley SE, Drenkow J et al. (2002) Large-scale transcriptional activity in chromo-somes 21 and 22. Science. 296(5569):916–919.
Karry R, Klein E, Ben Shachar D (2004) Mitochondrial complex I subunits expression is altered in schizophrenia: a postmortem study. Biol Psychiatr. 55(7):676–684.
Katsel P, Davis KL, Haroutunian V (2005) Variations in myelin and oligodendrocyte-related gene expression across multiple brain regions in schizophrenia: a gene ontology study. Schizophr Res. 79(2–3):157–173.
Kim JM, Lee KH, Jeon YJ et al. (2006) Identification of genes related to Parkinson’s disease using expressed sequence tags. DNA Res. 13(6):275–286.
Klevering BJ, Yzer S, Rohrschneider K et al. (2004) Microarray-based mutation analysis of the ABCA4 (ABCR) gene in autosomal recessive cone-rod dystrophy and retinitis pigmentosa. Eur J Hum Genet. 12(12):1024–1032.
Knox DP, Skuce PJ (2005) SAGE and the quantitative analysis of gene expression in parasites. Trends Parasitol. 21:322–326.
124 D. Martins-de-Souza, E. Dias-Neto
Kozal MJ, Shah N, Shen N et al. (1996) Extensive polymorphisms observed in HIV-1 clade B protease gene using high-density oligonucleotide arrays. Nat Med. 2(7):753–759.
Krichevsky AM, King KS, Donahue CP et al. (2003) A microRNA array reveals extensive regulation of microRNAs during brain development. RNA. 9(10):1274–1281. Erratum in: RNA. 2004 10(3):551.
Krichevsky AM, Sonntag KC, Isacson O, Kosik KS (2006) Specific microRNAs modulate embry-onic stem cell-derived neurogenesis. Stem Cells. 24(4):857–864.
Law AJ, Kleinman JE, Weinberger DR, Weickert CS (2007) Disease-associated intronic variants in the ErbB4 gene are related to altered ErbB4 splice-variant expression in the brain in schizo-phrenia. Hum Mol Genet. 16(2):129–141.
Liston C, Miller MM, Goldwater DS et al. (2006) Stress-induced alterations in prefrontal cortical dendritic morphology predict selective impairments in perceptual attentional set-shifting. J Neurosci. 26(30):7870–7874.
Liu X, Qin W, He G et al. (2005) A family-based association study of the MOG gene with schizo-phrenia in the Chinese population. Schizophr Res. 73(2–3):275–280.
Lockhart DJ, Dong H, Byrne MC et al. (1996) Expression monitoring by hybridization to high-density oligonucleotide arrays. Nat. Biotechnol. 14:1675–1680.
Lu L, Neff F, Alvarez-Fischer D et al. (2005a) Gene expression profiling of Lewy body-bearing neurons in Parkinson’s disease. Exp Neurol. 195(1):27–39.
Lu J, Getz G, Miska EA et al. (2005b) MicroRNA expression profiles classify human cancers. Nature. 435(7043):834–838.
Lukiw WJ, Pogue AI (2007) Induction of specific micro RNA (miRNA) species by ROS-generating metal sulfates in primary human brain cells. J Inorg Biochem. 101(9):1265–1269.
Magic Z, Radulovic S, Brankovic-Magic M (2007) cDNA microarrays: identification of gene signatures and their application in clinical practice. J BUON. 12 (Suppl. 1):S39–S44.
Makeyev EV, Zhang J, Carrasco MA, Maniatis T (2007) The MicroRNA miR-124 promotes neuronal differentiation by triggering brain-specific alternative pre-mRNA splicing. Mol Cell. 27(3):435–448.
Margulies M, Egholm M, Altman WE et al. (2005) Genome sequencing in microfabricated high-density picolitre reactors. Nature. 437:376–380.
Martorell L, Segues T, Folch G et al. (2006) New variants in the mitochondrial genomes of schizo-phrenic patients. Eur J Hum Genet. 14(5):520–528.
McCullumsmith RE, Gupta D, Beneyto M et al. (2007) Expression of transcripts for myelination-related genes in the anterior cingulate cortex in schizophrenia. Schizophr Res. 90(1–3):15–27.
McNamara RK, Lenox RH (1997) Comparative distribution of myristoylated alanine-rich C kinase substrate (MARCKS) and F1/GAP-43 gene expression in the adult rat brain. J Comp Neurol. 379(1):48–71.
Mehler-Wex C, Duvigneau JC, Hartl RT et al. (2006) Increased mRNA levels of the mitochondrial complex I 75-kDa subunit. A potential peripheral marker of early onset schizophrenia? Eur Child Adolesc Psychiatr. 15(8):504–507.
Middleton FA, Mirnics K, Pierri JN et al. (2002) Gene expression profiling reveals alterations of specific metabolic pathways in schizophrenia. J Neurosci. 22(7):2718–2729.
Middleton FA, Pato CN, Gentile KL et al. (2005) Gene expression analysis of peripheral blood leukocytes from discordant sib-pairs with schizophrenia and bipolar disorder reveals points of convergence between genetic and functional genomic approaches. Am J Med Genet B Neuropsychiatr Genet. 136(1):12–25.
Miller EK, Cohen JD (2001) An integrative theory of prefrontal cortex function. Annu Rev Neurosci. 24:167–202.
Mimmack ML, Ryan M, Baba H et al. (2002) Gene expression analysis in schizophrenia: repro-ducible up-regulation of several members of the apolipoprotein L family located in a high-susceptibility locus for schizophrenia on chromosome 22. Proc Natl Acad Sci U S A. 99(7):4680–4685.
5 RNA Biomarkers in Schizophrenia 125
Mirnics K, Middleton FA, Marquez A et al. (2000) Molecular characterization of schizophrenia viewed by microarray analysis of gene expression in prefrontal cortex. Neuron. 28(1):53–67.
Mirnics K, Middleton FA, Lewis DA, Levitt P (2001) Analysis of complex brain disorders with gene expression microarrays: schizophrenia as a disease of the synapse. Trends Neurosci. 8:479–486; Review.
Miska EA, Alvarez-Saavedra E, Townsend M et al. (2004) Microarray analysis of microRNA expression in the developing mammalian brain. Genome Biol. 5(9):R68.
Mowry BJ, Ewen KR, Nancarrow DJ et al. (2000) Second stage of a genome scan of schizophre-nia: study of five positive regions in an expanded sample. Am J Med Genet. 96(6):864–869.
Nielsen KL, H gh AL, Emmersen J (2006) DeepSAGE—digital transcriptomics with high sensi-tivity, simple experimental protocol and multiplexing of samples. Nucleic Acids Res. 34(19):e133.
Noureddine MA, Li YJ, van der Walt JM et al. (2005) Genomic convergence to identify candidate genes for Parkinson disease: SAGE analysis of the substantia nigra. Mov Disord. 20(10):1299–1309.
Numata S, Ueno S, Iga J et al. (2007) Gene expression in the peripheral leukocytes and association analysis of PDLIM5 gene in schizophrenia. Neurosci Lett. 415(1):28–33.
Ouchi Y, Kubota Y, Ito C (2004) Serial analysis of gene expression in methamphetamine- and phencyclidine-treated rodent cerebral cortices: are there common mechanisms? Ann N Y Acad Sci. 1025:57–61.
Owen MJ, O’Donovan MC, Harrison PJ (2005) Schizophrenia: a genetic disorder of the synapse? BMJ 330: 158–159.
Ozbas-Gerçeker F, Redeker S, Boer K et al. (2006) Serial analysis of gene expression in the hippocampus of patients with mesial temporal lobe epilepsy. Neuroscience. 138(2):457–474.
Patino WD, Mian OY, Hwang PM (2002) Serial analysis of gene expression: technical considera-tions and applications to cardiovascular biology. Circ Res. 91(7):565–569.
Peirce TR, Bray NJ, Williams NM et al. (2006) Convergent evidence for 2′,3′-cyclic nucleotide 3′-phosphodiesterase as a possible susceptibility gene for schizophrenia. Arch Gen Psychiatr. 63(1):18–24.
Perkins DO, Jeffries CD, Jarskog LF et al. (2007) microRNA expression in the prefrontal cortex of individuals with schizophrenia and schizoaffective disorder. Genome Biol. 8(2):R27.
Perl O, Strous RD, Dranikov A et al. (2006) Low levels of alpha7-nicotinic acetylcholine receptor mRNA on peripheral blood lymphocytes in schizophrenia and its association with illness severity. Neuropsychobiology. 53(2):88–93.
Polak M, Haymaker W, Johnson JE, D’Amelio F (1982) Neuroglia and their reactions. In: Haymaker W, Adams RD (Eds.) Histology and Histopathology of the Nervous System. Springfield: Charles C. Thomas.
Prabakaran S, Swatton JE, Ryan MM et al. (2004) Mitochondrial dysfunction in schizophrenia: evi-dence for compromised brain metabolism and oxidative stress. Mol Psychiatr. 9(7):684–697, 643.
Raedler TJ, Knable MB, Weinberger DR (1998) Schizophrenia as a developmental disorder of the cerebral cortex. Curr Opin Neurobiol. 8(1):157–161.
Rajkowska G, Halaris A, Selemon LD (2001) Reductions in neuronal and glial density character-ize the dorsolateral prefrontal cortex in bipolar disorder. Biol Psychiatr. 49(9):741–752.
Ryu EJ, Angelastro JM, Greene LA (2005) Analysis of gene expression changes in a cellular model of Parkinson disease. Neurobiol Dis. 18(1):54–74.
Ryu EJ, Harding HP, Angelastro JM et al. (2002) Endoplasmic reticulum stress and the unfolded protein response in cellular models of Parkinson’s disease. J Neurosci. 22(24):10690–10698.
Saha S, Sparks AB, Rago C et al. (2002) Using the transcriptome to annotate the genome. Nat Biotechnol. 20(5):508–512.
Sartorius LJ, Nagappan G, Lipska BK et al. (2006) Alternative splicing of human metabotropic glutamate receptor 3. J Neurochem. 96(4):1139–1148.
Schratt GM, Tuebing F, Nigh EA et al. (2006) A brain-specific microRNA regulates dendritic spine development. Nature. 439(7074):283–289; Erratum in: Nature. 2006 441(7095):902.
126 D. Martins-de-Souza, E. Dias-Neto
Seeman P, Chau-Wong M, Tedesco J, Wong K (1975) Brain receptors for antipsychotic drugs and dopamine: direct binding assays. Proc Natl Acad Sci U S A. 72: 4376–4380.
Sidman RL, Dickie MM, Appel SH (1964) Mutant Mice (Quaking and Jimpy) with deficient myelination in the central nervous system. Science. 144:309–311.
Silberberg G, Darvasi A, Pinkas-Kramarski R, Navon R (2006) The involvement of ErbB4 with schizophrenia: association and expression studies. Am J Med Genet B Neuropsychiatr Genet. 141(2):142–148.
Soares MB, Bonaldo MF, Jelene P et al. (1994) Construction and characterization of a normalized cDNA library. Proc Natl Acad Sci U S A. 91(20):9228–9232.
Sun Y, Zhang L, Johnston NL et al. (2001) Serial analysis of gene expression in the frontal cortex of patients with bipolar disorder. Br J Psychiatr (Suppl. 41):s137–s141.
Tennis M, Krishnan S, Bonner M et al. (2006) p53 Mutation analysis in breast tumors by a DNA microarray method. Cancer Epidemiol Biomarkers Prev. 15(1):80–85.
Tkachev D, Mimmack ML, Ryan MM et al. (2003) Oligodendrocyte dysfunction in schizophrenia and bipolar disorder. Lancet. 362(9386):798–805.
Tosato S, Dazzan P, Collier D (2005) Association between the neuregulin 1 gene and schizophre-nia: a systematic review. Schizophr Bull. 31(3):613–617.
Tsuang MT, Nossova N, Yager T et al. (2005) Assessing the validity of blood-based gene expres-sion profiles for the classification of schizophrenia and bipolar disorder: a preliminary report. Am J Med Genet B Neuropsychiatr Genet. 133(1):1–5.
Uranova N, Orlovskaya D, Vikhreva O et al. (2001) Electron microscopy of oligodendroglia in severe mental illness. Brain Res. Bull. 55, 597–610.
Usiello A, Baik JH, Rouge-Pont F et al. (2000) Distinct functions of the two isoforms of dopamine D2 receptors. Nature. 408(6809):199–203.
Van Bogaert P, Azizieh R, Désir J et al. (2007) Mutation of a potassium channel-related gene in progressive myoclonic epilepsy. Ann Neurol. 61(6):579–586.
Vawter MP, Barrett T, Cheadle C et al. (2001) Application of cDNA microarrays to examine gene expression differences in schizophrenia. Brain Res Bull. 55(5):641–650.
Vawter MP, Frye MA, Hemperly JJ et al. (2000) Elevated concentration of N-CAM VASE isoforms in schizophrenia. J Psychiatr Res. 34(1):25–34.
Vawter MP, Crook JM, Hyde TM et al. (2002) Microarray analysis of gene expression in the prefrontal cortex in schizophrenia: a preliminary study. Schizophr Res. 58(1):11–20.
Vawter MP, Ferran E, Galke B et al. (2004) Microarray screening of lymphocyte gene expression differences in a multiplex schizophrenia pedigree. Schizophr Res. 67(1):41–52.
Velculescu VE, Zhang L, Vogelstein B, Kinzler KW (1995) Serial analysis of gene expression. Science. 270:484–487.
Vo N, Klein ME, Varlamova O et al. (2005) A cAMP-response element binding protein-induced microRNA regulates neuronal morphogenesis. Proc Natl Acad Sci U S A. 102(45):16426–16431; Erratum in: Proc Natl Acad Sci U S A. 2006 17;103(3):825.
Wan C, Yang Y, Feng G et al. (2005) Polymorphisms of myelin-associated glycoprotein gene are associated with schizophrenia in the Chinese Han population. Neurosci Lett. 388(3):126–131.
Wang SM (2007) Understanding SAGE data. Trends Genet. 23(1):42–50. Xi ZR, Qin W, Yang YF et al. (2004) Transmission disequilibrium analysis of the GSN gene in a
cohort of family trios with schizophrenia. Neurosci Lett. 372(3):200–203. Xu R, Hranilovic D, Fetsko LA et al. (2002) Dopamine D2S and D2L receptors may differentially
contribute to the actions of antipsychotic and psychotic agents in mice. Mol Psychiatr. 7(10):1075–1082.
Xu PT, Li YJ, Qin XJ et al. (2007) A SAGE study of apolipoprotein E3/3, E3/4 and E4/4 allele-specific gene expression in hippocampus in Alzheimer disease. Mol Cell Neurosci. 36(3):313–331.
Yao JK, Reddy RD, van Kammen DP (2001) Oxidative damage and schizophrenia: an overview of the evidence and its therapeutic implications. CNS Drugs. 15(4):287–310.

5 RNA Biomarkers in Schizophrenia 127
Zaidel DW, Esiri MM, Harrison PJ (1997) Size, shape, and orientation of neurons in the left and right hippocampus: investigation of normal asymmetries and alterations in schizophrenia. Am J Psychiatr. 154(6):812–818.
Zhang B, Farwell MA (2007) microRNAs: a new emerging class of players for disease diagnostics and gene therapy. J Cell Mol Med. 12:3–21.
Zhao C, Xu Z, Chen J et al. (2006) Two isoforms of GABA(A) receptor beta2 subunit with differ-ent electrophysiological properties: Differential expression and genotypical correlations in schizophrenia. Mol Psychiatr. 11(12):1092–1105.
Related Documents