IEEE TRANSACTIONS ON VEHICULAR TECHNOLOGY, VOL. 50, NO. 2, MARCH 2001 515 RMS Delay and Coherence Bandwidth Measurements in Indoor Radio Channels in the UHF Band Mercedes Sánchez Varela and Manuel García Sánchez, Member, IEEE Abstract—A study of time dispersion in different indoor line-of- sight radio channels in the 492–862 MHz band is presented in this paper. A combined method to filter the noise in the measured im- pulse response is described. The effect of frequency windowing on the impulse responses and the root mean square (rms) delay spread is also investigated. It has been found that, in general, the use of windows with lower side-lobe levels yields larger values of the rms delay spread. The relation between the mean delay and the rms delay spread has also been studied for copolar and crosspolar chan- nels. The dependence of the coherence bandwidth on the rms delay spread has been considered, and an inverse relation has been tested for both components. Index Terms—Communication channels, communication systems, parameter estimation, UHF measurements, UHF radio propagation. I. INTRODUCTION T HE dramatic increase of the number of digital radio com- munication systems within buildings has demanded wide band characterization of indoor radio channels. Signal time dis- persion is one of the main study issues because it limits the max- imum symbol rate that can be used without intersymbol inter- ference [1]. The impulse response (IR) of the radio channel and other parameters, as the mean delay and the root mean square (rms) delay spread [2], [3], are frequently used to characterize time dispersion of the channel. The coherence bandwidth , a parameter closely related with , is also used to describe frequency selectivity in the radio channel. Previous works have investigated the relation between and , and different solutions have been found for outdoor environments [1]–[6]. But at present, few experimental results exist that describe the relation between and in indoor environments. In this paper, an experimental study on the relation between these parameters inside buildings is presented. The results are based on wide-band measurements taken in three different indoor environments with a frequency swept radio channel sounder. The sounder, based on a vector network analyzer (VNA), has been used to measure the frequency response of the radio channel in the 470–862 MHz frequency band. From the frequency response, both the and the IR are obtained. The effect of the frequency windowing on the IR shape, , and is analyzed. A method to filter the noise Manuscript received June 30, 1999; revised July 25, 2000. This work was supported by the Spanish Comisión Interministerial de Ciencia y Tecnología (CICYT) under Project TIC97-1129-C04-03. The authors are with the Departamento De Tecnoloxias Das Comunicacions, E.T.S.E. Telecomunicacións, Universidade de Vigo, Vigo 36200, Spain (e-mail: [email protected]). Publisher Item Identifier S 0018-9545(01)03073-0. out from the IR is also presented. The parameters and are obtained from this filtered IR. A linear relation between and and an inverse relation between and are investigated for line-of-sight (LoS) situations in the three environments considered, both for copolar and crosspolar components. The values of the least mean square (LMS) error and the 90% confidence interval are given for the different fits. II. MEASUREMENT SETUP AND THEORETICAL FUNDAMENTALS An HP 8510C VNA was used to obtain the frequency re- sponse of the radio channel in the 470–862 MHz frequency band [7]. The measurement setup is shown in Fig. 1. The copolar component was measured with two vertical 3-dBi omnidirec- tional dipole antennas connected to the input and output ports of the VNA and placed on the top of a 1-m-height tripod. To mea- sure the crosspolar component, the vertical dipole at the receiver was replaced by a 5-dBi omnidirectional antenna consisting of two orthogonal folded dipoles. This antenna was horizontally polarized. The measurement system output is the frequency response of the devices connected between its two ports, including the channel, antennas, cables, amplifiers, and frequency response of the VNA itself. To compensate the effect of the system on the measurements, a calibration was carried out before the radio channel measurements. With this purpose, the antennas were removed so that the transmitter output was directly connected to the receiver input, its frequency response being measured. This result was automatically subtracted from the subsequent channel measurements, thus reducing the effect of the system on the measurement (1) If the channel is linear, the IR can be calculated from the fre- quency response using the inverse Fourier transform [8] (2) However, since the measurements were performed over a lim- ited frequency band, there was a windowing effect on the results (3) 0018–9545/01$10.00 ©2001 IEEE

Welcome message from author
This document is posted to help you gain knowledge. Please leave a comment to let me know what you think about it! Share it to your friends and learn new things together.
Transcript
IEEE TRANSACTIONS ON VEHICULAR TECHNOLOGY, VOL. 50, NO. 2, MARCH 2001 515
RMS Delay and Coherence Bandwidth Measurementsin Indoor Radio Channels in the UHF Band
Mercedes Sánchez Varela and Manuel García Sánchez, Member, IEEE
Abstract—A study of time dispersion in different indoor line-of-sight radio channels in the 492–862 MHz band is presented in thispaper. A combined method to filter the noise in the measured im-pulse response is described. The effect of frequency windowing onthe impulse responses and the root mean square (rms) delay spreadis also investigated. It has been found that, in general, the use ofwindows with lower side-lobe levels yields larger values of the rmsdelay spread. The relation between the mean delay and the rmsdelay spread has also been studied for copolar and crosspolar chan-nels. The dependence of the coherence bandwidth on the rms delayspread has been considered, and an inverse relation has been testedfor both components.
Index Terms—Communication channels, communicationsystems, parameter estimation, UHF measurements, UHF radiopropagation.
I. INTRODUCTION
T HE dramatic increase of the number of digital radio com-munication systems within buildings has demanded wide
band characterization of indoor radio channels. Signal time dis-persion is one of the main study issues because it limits the max-imum symbol rate that can be used without intersymbol inter-ference [1]. The impulse response (IR) of the radio channel andother parameters, as the mean delay and the root meansquare (rms) delay spread [2], [3], are frequently usedto characterize time dispersion of the channel. The coherencebandwidth , a parameter closely related with , is alsoused to describe frequency selectivity in the radio channel.
Previous works have investigated the relation betweenand , and different solutions have been found for outdoorenvironments [1]–[6]. But at present, few experimental resultsexist that describe the relation between and in indoorenvironments. In this paper, an experimental study on therelation between these parameters inside buildings is presented.The results are based on wide-band measurements taken inthree different indoor environments with a frequency sweptradio channel sounder. The sounder, based on a vector networkanalyzer (VNA), has been used to measure the frequencyresponse of the radio channel in the 470–862 MHz frequencyband. From the frequency response, both theand the IRare obtained. The effect of the frequency windowing on the IRshape, , and is analyzed. A method to filter the noise
Manuscript received June 30, 1999; revised July 25, 2000. This work wassupported by the Spanish Comisión Interministerial de Ciencia y Tecnología(CICYT) under Project TIC97-1129-C04-03.
The authors are with the Departamento De Tecnoloxias Das Comunicacions,E.T.S.E. Telecomunicacións, Universidade de Vigo, Vigo 36200, Spain (e-mail:[email protected]).
Publisher Item Identifier S 0018-9545(01)03073-0.
out from the IR is also presented. The parameters andare obtained from this filtered IR.
A linear relation between and and an inverserelation between and are investigated for line-of-sight(LoS) situations in the three environments considered, bothfor copolar and crosspolar components. The values of the leastmean square (LMS) error and the 90% confidence interval aregiven for the different fits.
II. M EASUREMENTSETUP AND THEORETICAL FUNDAMENTALS
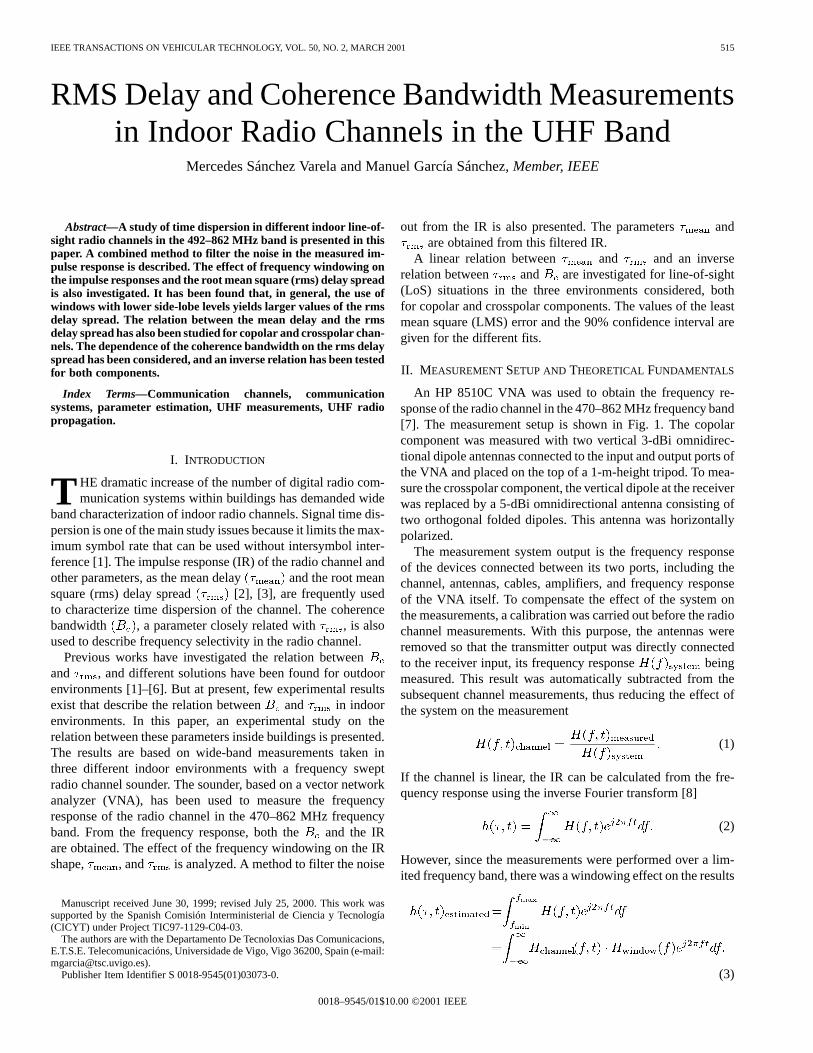
An HP 8510C VNA was used to obtain the frequency re-sponse of the radio channel in the 470–862 MHz frequency band[7]. The measurement setup is shown in Fig. 1. The copolarcomponent was measured with two vertical 3-dBi omnidirec-tional dipole antennas connected to the input and output ports ofthe VNA and placed on the top of a 1-m-height tripod. To mea-sure the crosspolar component, the vertical dipole at the receiverwas replaced by a 5-dBi omnidirectional antenna consisting oftwo orthogonal folded dipoles. This antenna was horizontallypolarized.
The measurement system output is the frequency responseof the devices connected between its two ports, including thechannel, antennas, cables, amplifiers, and frequency responseof the VNA itself. To compensate the effect of the system onthe measurements, a calibration was carried out before the radiochannel measurements. With this purpose, the antennas wereremoved so that the transmitter output was directly connectedto the receiver input, its frequency response beingmeasured. This result was automatically subtracted from thesubsequent channel measurements, thus reducing the effect ofthe system on the measurement
(1)
If the channel is linear, the IR can be calculated from the fre-quency response using the inverse Fourier transform [8]
(2)
However, since the measurements were performed over a lim-ited frequency band, there was a windowing effect on the results
(3)
0018–9545/01$10.00 ©2001 IEEE
516 IEEE TRANSACTIONS ON VEHICULAR TECHNOLOGY, VOL. 50, NO. 2, MARCH 2001
Fig. 1. UHF measurement system.
TABLE ISLL AND rms DELAY SPREAD OF
DIFFERENTWINDOWS
The shape of the window used in the frequency measurementsaffects the IRs as follows:
(4)
As a result, the impulse response is averaged and the delayresolution is reduced. Four different windows were consideredin this study: rectangular, Hanning, Blackman–Harris, andKaiser–Bessel. The side-lobe levels (SLLs) for these windowsare given in Table I. The lower the SLL, the wider the mainwindow lobe becomes [9]. A wider main lobe yields a lowerdelay resolution in the IR.
If the channel satisfies the wide sense stationary uncorrelatedscattering (WSSUS) assumption, the power delay profile (PDP)is given by
(5)
Wide-band parameters, as the mean delay , the rms delayspread , and the coherence bandwidth at level ,
are calculated. The mean delay is the average of thedelays of all paths
(6)
The radio channel time dispersion is characterized by the rmsdelay spread , calculated as
(7)
From (4), it can be demonstrated [10] that the channel delayspread is overestimated, the increase being due to the windowshape
(8)
where is the delay spread corresponding to thewindow impulse response. Values of for the fourdifferent windows considered in this work have been calculatedand are presented in Table I.
The frequency correlation function of the radio channel canbe obtained from the PDP as
(9)
For a particular correlation level, typically 0.9, 0.7, or 0.5,is the minimum frequency separation for which the norm of thefrequency correlation function crosses this level. As an example,
is calculated as
such that (10)
For low values of , this parameter represents the minimum fre-quency separation to have the components of the radio signalsufficiently uncorrelated.
III. ENVIRONMENT DESCRIPTION
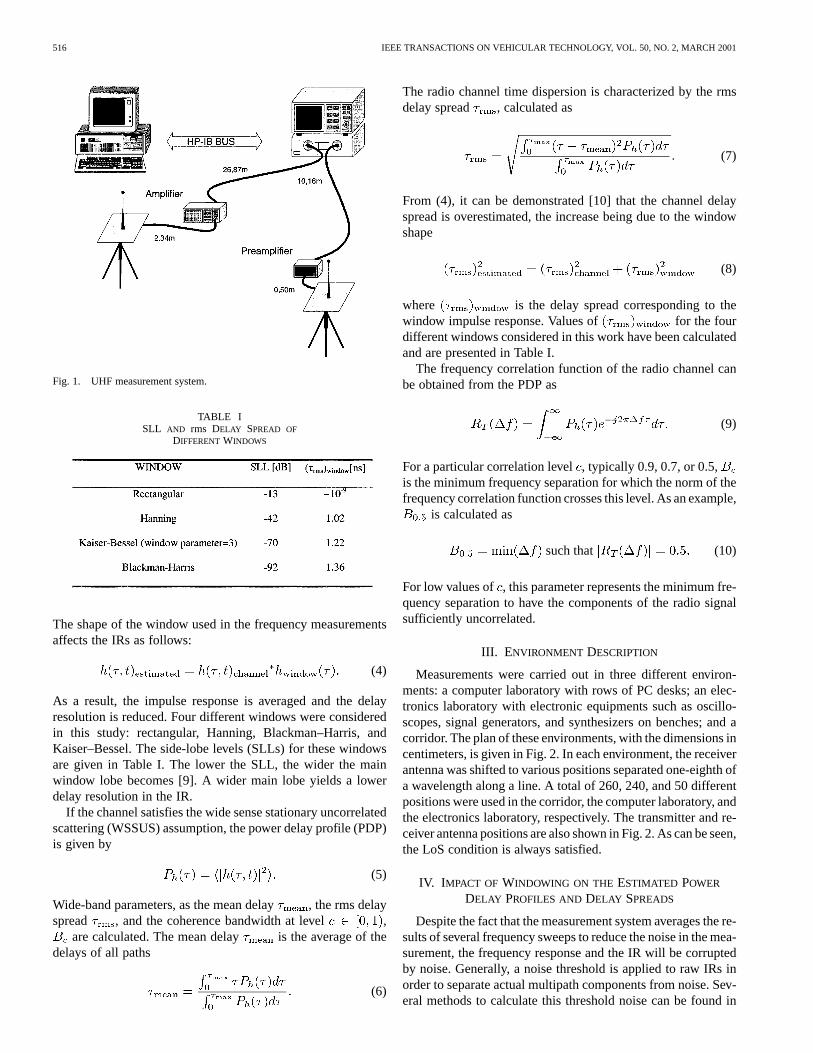
Measurements were carried out in three different environ-ments: a computer laboratory with rows of PC desks; an elec-tronics laboratory with electronic equipments such as oscillo-scopes, signal generators, and synthesizers on benches; and acorridor. The plan of these environments, with the dimensions incentimeters, is given in Fig. 2. In each environment, the receiverantenna was shifted to various positions separated one-eighth ofa wavelength along a line. A total of 260, 240, and 50 differentpositions were used in the corridor, the computer laboratory, andthe electronics laboratory, respectively. The transmitter and re-ceiver antenna positions are also shown in Fig. 2. As can be seen,the LoS condition is always satisfied.
IV. I MPACT OF WINDOWING ON THE ESTIMATED POWER
DELAY PROFILES AND DELAY SPREADS
Despite the fact that the measurement system averages the re-sults of several frequency sweeps to reduce the noise in the mea-surement, the frequency response and the IR will be corruptedby noise. Generally, a noise threshold is applied to raw IRs inorder to separate actual multipath components from noise. Sev-eral methods to calculate this threshold noise can be found in
SÁNCHEZ VARELA AND GARCÍA SÁNCHEZ: RMS DELAY AND COHERENCE BANDWIDTH MEASUREMENTS 517
Fig. 2. Environment plan.
the literature [11]–[13]. In [11], for instance, an empirical/an-alytical method is proposed that is not affected by the actualnoise level in the environment. To find the dynamic range noisefloor, first the lowest 25% of the delay profile amplitude pointsare sorted, and then the highest and the lowest 25% of these lowamplitude points are removed (median filtering). The remaininglow amplitude points are averaged to yield a power level that isthe dynamic range noise floor. In this method, we assume anaverage signal-to-noise ratio of at least 10 dB across the mea-sured profile. In [12], it is assumed that the noise level is muchlower than the side-lobe level (SLL) of the rectangular window,so the noise threshold is given by the SSL. Other authors, suchas [13], take into account the thermal noise of the system sothat the threshold becomes a function of the noise level. In thiswork, a new combined method to evaluate the noise thresholdhas been developed and used. Three different levels are calcu-
lated, and the threshold is chosen as the maximum of these threelevels.
The calculation of the first level is based on measurementsof the actual noise. Real and imaginary parts of the noiseare assumed to be random variables that follow a zero-meanGaussian distribution. From the corresponding measuredcumulative distribution functions (cdfs) of real and imaginaryparts of the noise, the value below which the random variablesremain the 99.999% of the time is determined. The level istaken as the square root of the sum of both squared values. Thesecond level is also calculated from measurements of the noise,but it becomes from the noise amplitude, which is assumed tofollow a Rayleigh distribution [14]. The measured cdf of noiseamplitude is calculated and the limit for 99.999% of the time isselected as the level. The third level is calculated as SSL (dB)below the peak signal level. This level does not depend on the
518 IEEE TRANSACTIONS ON VEHICULAR TECHNOLOGY, VOL. 50, NO. 2, MARCH 2001
(a) (b)
(c) (d)
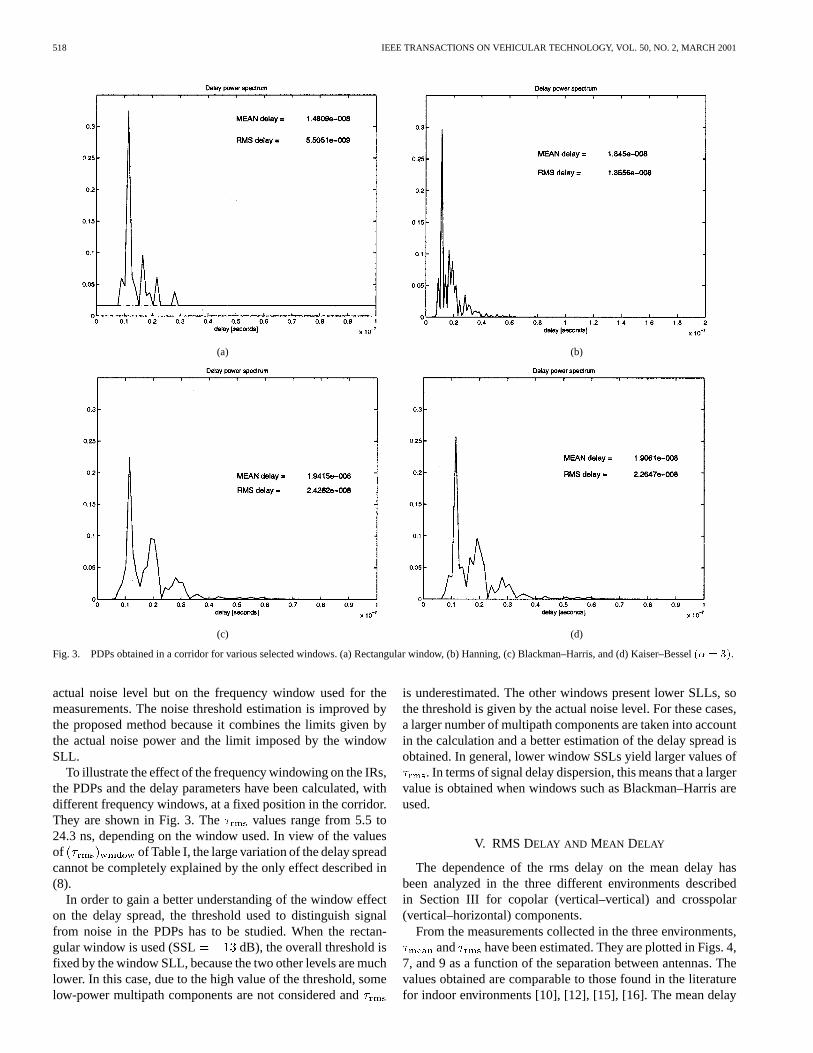
Fig. 3. PDPs obtained in a corridor for various selected windows. (a) Rectangular window, (b) Hanning, (c) Blackman–Harris, and (d) Kaiser–Bessel(� = 3).
actual noise level but on the frequency window used for themeasurements. The noise threshold estimation is improved bythe proposed method because it combines the limits given bythe actual noise power and the limit imposed by the windowSLL.
To illustrate the effect of the frequency windowing on the IRs,the PDPs and the delay parameters have been calculated, withdifferent frequency windows, at a fixed position in the corridor.They are shown in Fig. 3. The values range from 5.5 to24.3 ns, depending on the window used. In view of the valuesof of Table I, the large variation of the delay spreadcannot be completely explained by the only effect described in(8).
In order to gain a better understanding of the window effecton the delay spread, the threshold used to distinguish signalfrom noise in the PDPs has to be studied. When the rectan-gular window is used (SSL dB), the overall threshold isfixed by the window SLL, because the two other levels are muchlower. In this case, due to the high value of the threshold, somelow-power multipath components are not considered and
is underestimated. The other windows present lower SLLs, sothe threshold is given by the actual noise level. For these cases,a larger number of multipath components are taken into accountin the calculation and a better estimation of the delay spread isobtained. In general, lower window SSLs yield larger values of
. In terms of signal delay dispersion, this means that a largervalue is obtained when windows such as Blackman–Harris areused.
V. RMS DELAY AND MEAN DELAY
The dependence of the rms delay on the mean delay hasbeen analyzed in the three different environments describedin Section III for copolar (vertical–vertical) and crosspolar(vertical–horizontal) components.
From the measurements collected in the three environments,and have been estimated. They are plotted in Figs. 4,
7, and 9 as a function of the separation between antennas. Thevalues obtained are comparable to those found in the literaturefor indoor environments [10], [12], [15], [16]. The mean delay

SÁNCHEZ VARELA AND GARCÍA SÁNCHEZ: RMS DELAY AND COHERENCE BANDWIDTH MEASUREMENTS 519
(a) (b)
Fig. 4. Mean delay and rms delay versus transmitter–receiver separation in the corridor. (a) Copolar and (b) crosspolar component.
(a) (b)
Fig. 5. PDP in the corridor. (a) Copolar and (b) crosspolar component.
exhibits a trend to increase with distance. Some authors havereported that rms delay spread increases with antenna separa-tion [15]. However, the rms delay spread is almost constant inthe plots presented in this paper because of the short receiverantenna path. As the transmitter antenna is moved away fromthe receiver antenna, the amplitudes of the reflected signals rel-ative to the direct path become larger, and this produces the in-crease of the mean and rms delays. However, due to the limiteddelay resolution of the measurement system, some oscillationsare superimposed to the trend described above. After a thoroughanalysis of the IRs, it has been found that contributions withclose delays cannot be resolved and interfere, giving rise bothto a fast spatial variation of some IR and PDP components andto the oscillation of the delay parameters with the distance be-tween antennas. It should be noted that no averaging of severalsquared envelopes of the impulse responses is performed be-cause the effect of fast variation is also an issue of study. Thisexplains the fluctuations that the estimated mean delays and rms
delay spreads exhibit as the separation between the transmitterand the receiver is changed.
Values of both parameters are lower for the copolar than forthe crosspolar component because the copolar IRs present adominant ray while the crosspolar ones do not. To illustratethese differences, a sample of the IRs corresponding to bothcomponents is presented in Fig. 5. This difference can be quan-tified by calculating the factor, which represents the ratio be-tween the power of the direct ray to the power of the reflectedcomponents. The mean value of thefactor along the corridoris 0.32 for the copolar measurements and 0.23 for the crosspolarones, so the relative contribution of the direct component is moresignificant in the copolar IR.
The linear dependency between both delay parameterscan be measured by their correlation coefficients. Thesehave been calculated and are listed in Table II. The highcorrelation values suggest that a linear relation in the form
[ns] [ns] can model the dependence between
520 IEEE TRANSACTIONS ON VEHICULAR TECHNOLOGY, VOL. 50, NO. 2, MARCH 2001
(a) (b)
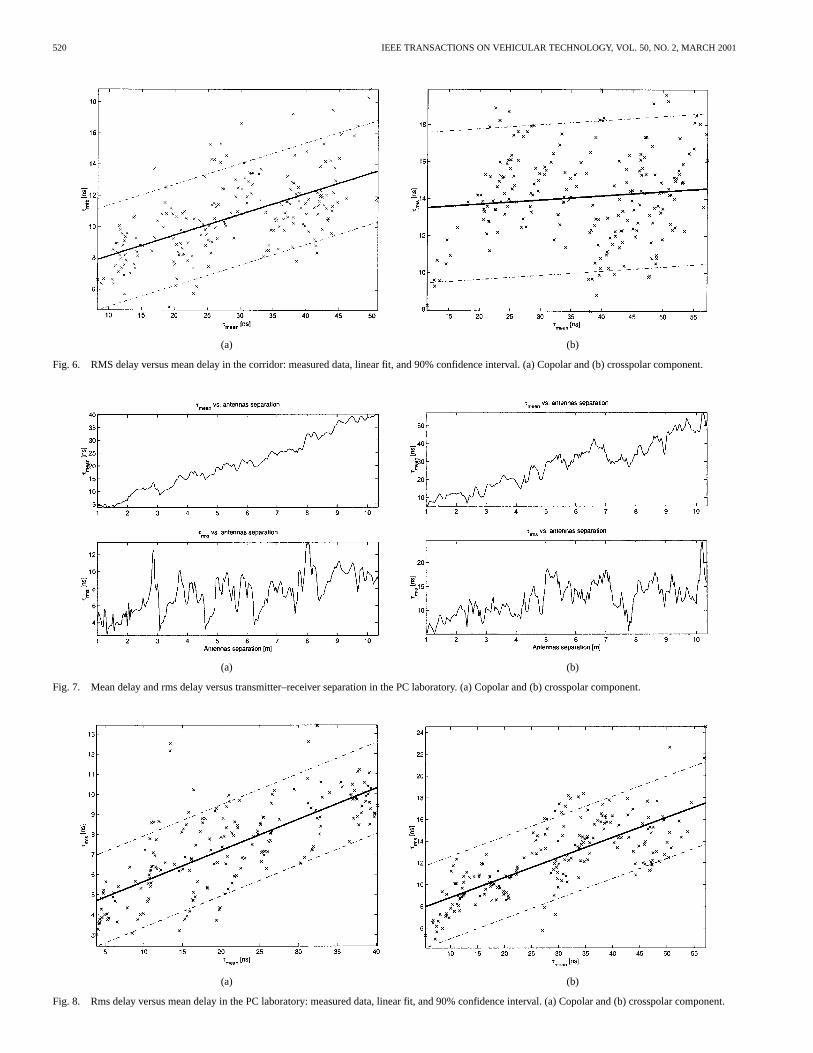
Fig. 6. RMS delay versus mean delay in the corridor: measured data, linear fit, and 90% confidence interval. (a) Copolar and (b) crosspolar component.
(a) (b)
Fig. 7. Mean delay and rms delay versus transmitter–receiver separation in the PC laboratory. (a) Copolar and (b) crosspolar component.
(a) (b)
Fig. 8. Rms delay versus mean delay in the PC laboratory: measured data, linear fit, and 90% confidence interval. (a) Copolar and (b) crosspolar component.

SÁNCHEZ VARELA AND GARCÍA SÁNCHEZ: RMS DELAY AND COHERENCE BANDWIDTH MEASUREMENTS 521
(a) (b)
Fig. 9. Mean delay and rms delay versus transmitter–receiver separation in the electronics laboratory. (a) Copolar and (b) crosspolar component.
(a) (b)
Fig. 10. RMS delay versus mean delay in the electronics laboratory: measured data, linear fit, and 90% confidence interval. (a) Copolar (b) and crosspolarcomponent.
TABLE IIa AND b PARAMETERS, CORRELATION FACTOR, CONFIDENCEINTERVAL, AND LMS ERROR FROM THE� VERSUS� LINEAR FIT
and . The results of a linear fit to the measured dataare presented in Figs. 6, 8, and 10 and in Table II, includingthe values of parametersand , the confidence interval for90% of the data, and the LMS error of the fit. The goodness ofthe linear fit has been confirmed by a Kolmogorov–Smirnovtest [17], which shows that the residuals follow a Gaussiandistribution.
For the three environments considered, it has been found thatand are high correlated. It should be noted that both
parameters are calculated from the same impulse response andthat both may have a dependence on a third common variablethat is the Tx–Rx separation. Again, the presence of a domi-nant component in the copolar IRs makes the linear dependencestronger for this component than for the crosspolar one.

522 IEEE TRANSACTIONS ON VEHICULAR TECHNOLOGY, VOL. 50, NO. 2, MARCH 2001
Fig. 11. Frequency correlation function at four different measurement points.Copolar component.
VI. DELAY SPREAD AND COHERENCEBANDWIDTH
The frequency correlation function is shown in Fig. 11 at fourdifferent positions along the corridor. As expected [2], [3], thecorrelation decreases when increasing the frequency separationand, due to the limited frequency band of the measurement, fallsto zero for a separation of 392 MHz. It can also be seen that thedecrease is not monotonous because the presence of significantmultipath in the radio channel produces an oscillation on thegeneral trend of the curve [2], [4], [18].
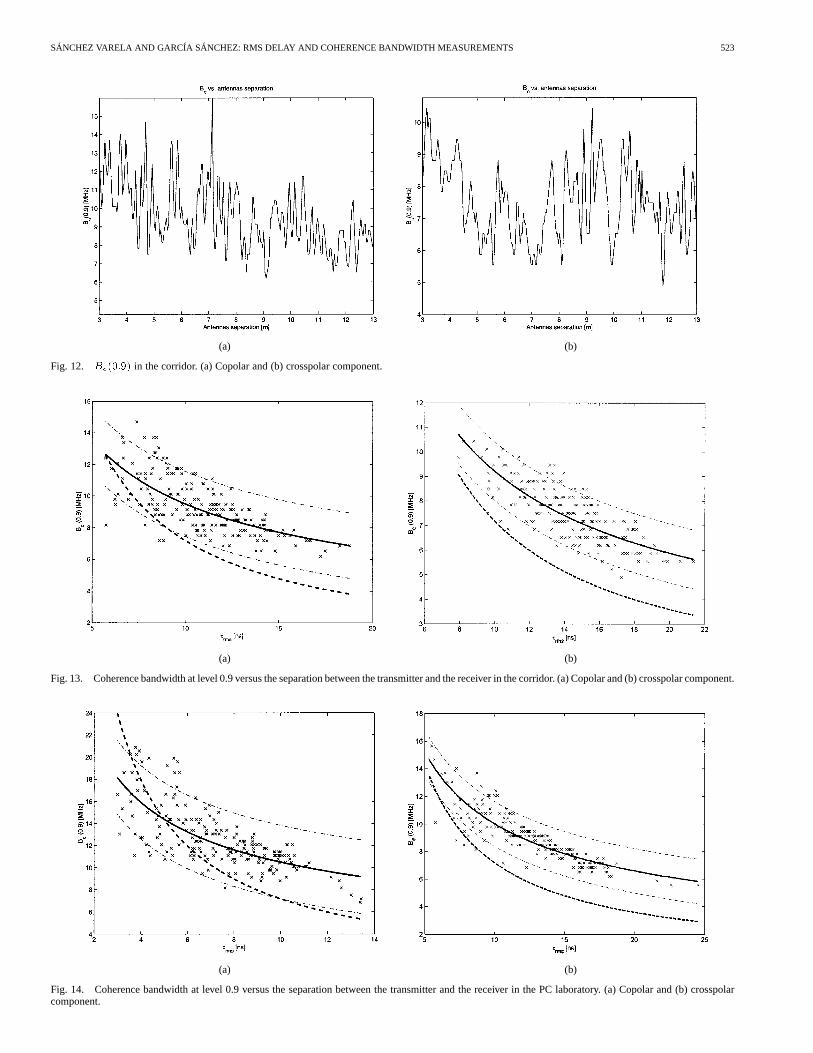
Once the correlation function is obtained and a correlationlevel is given, can be estimated. At each antenna positionalong the corridor, the coherence bandwidth for a correlationlevel of 0.9 has been calculated. The results are plotted as afunction of the antennas separation in Fig. 12 for copolar andcrosspolar components. The coherence bandwidth is larger forthe copolar component. This is consistent with the resultsand the inverse relation between these two parameters. As hap-pens with the rms delay spread, some oscillations are superim-posed to the mean coherence bandwidth. It was explained beforethat these oscillations are caused by the multipath propagationand the absence of a spatial averaging.
The relation between and has been long investigated.As a result of some experimental studies, Gans [19] proposed arelation of the form , where ranged fromsix to ten depending on the shape of the PDP. In Jakes [2], as aresult of a theoretical analysis of exponentially decaying powerdelay profiles, a value of was found. The inverse modelis also proposed in [7], with . In [16], for an indoorchannel, it was found that could vary between small valuesand ten. Also in [16], larger values of are observed in ob-structed situations than in LoS situations. A study based on atwo-ray model of the impulse response [18] supports the model
, with a value of . Other models used tocharacterize the relation between and can be found in[6], where, based on the results of a measurement campaign, arelation of the form is used, or in [5], where a lowerbound of the form is derived.
values depicted in Fig. 12 have been compared tovalues plotted in Fig. 4. This is done in Fig. 13, where the pairs
measured at each position in the corridor have beenplotted. Plots of the pairs obtained in the PC labora-tory and in the electronics laboratory are presented in Figs. 14and 15.
A relation of the form , where is expressedin [MHz] and in [ns] [6], has been considered. In orderto fit the curve , a log–log transformation of thepairs is performed so the relation becomes linear.Then a regression line is fitted to the scatter plot of pairs
. The results of the fit are given in Table IIIand Figs. 13–15.
The lower bound for given in [5] has been reported inFigs. 13–15 for comparison purposes. It is observed that mostof the pairs are located above this curve. How-ever, for shorter values of , there are some pairs below thelower bound. Lower values of correspond to shorter sep-arations between antennas. In this situation, the mean signalvalue changes rapidly and the wide-sense-stationary propertyassumed in [5] for the lower bound calculation is not verified.
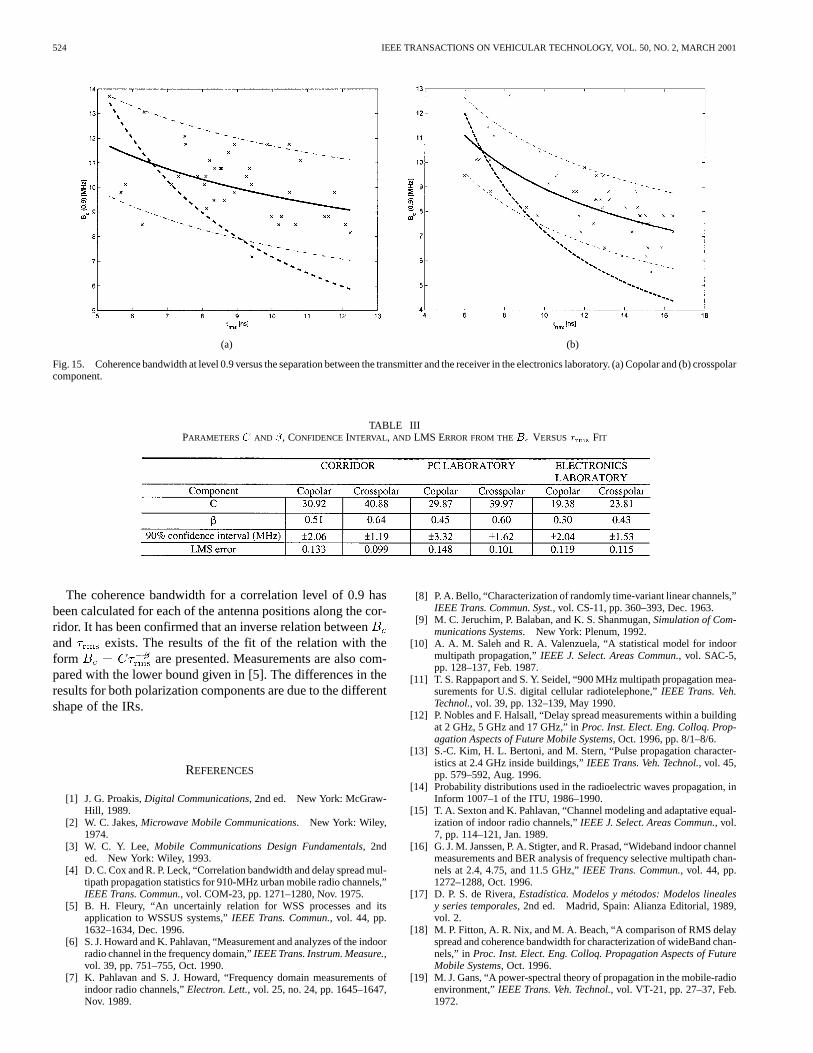
The values for and , are lower than those found in [6],where a different frequency band (900–1100 MHz) and correla-tion level (0.5) have been considered. In the corridor and in thePC laboratory, values of are around 0.5 for the copolar com-ponent and around 0.6 for the crosspolar one. In the electronicslaboratory, shorter values of have been obtained. Due to thedependence of and on the IR shape, the crosspolar com-ponent presents a larger decaying slope than the copolar one.
VII. CONCLUSION
The radio channel has been investigated in the 470–862MHz band in three different indoor environments. A combinedmethod is presented in order to filter noise from the frequencyresponse. With this method, more accurate estimations of
and can be calculated. The effect of four differentfrequency windows on the results has been analyzed. In gen-eral, windows with lower SLLs lead to larger values ofand . The Blackman–Harris window yields more accurateestimations and larger values of the delay parameters than otherwindows.
The variation of and with the antennas separationhas been presented. As the receiver antenna is separated fromthe transmitter antenna, the amplitudes of the reflected signalrelative to the direct path become larger, which results in the in-crease of and . Due to the fact that the copolar com-ponent contains the stronger contribution of the LoS wave, thevalues of and are lower for the copolar than for thecrosspolar component.
It has been demonstrated for the three environments that bothparameters exhibit a high correlation and a linear dependence.In all the cases, the correlation and the linear dependence arehigher for the copolar than for the crosspolar component. Thecorrelation is also higher in the laboratories than in the corridor.The linear fits have positive slopes that vary with the environ-ment and the polarization component considered.
SÁNCHEZ VARELA AND GARCÍA SÁNCHEZ: RMS DELAY AND COHERENCE BANDWIDTH MEASUREMENTS 523
(a) (b)
Fig. 12. B (0:9) in the corridor. (a) Copolar and (b) crosspolar component.
(a) (b)
Fig. 13. Coherence bandwidth at level 0.9 versus the separation between the transmitter and the receiver in the corridor. (a) Copolar and (b) crosspolar component.
(a) (b)
Fig. 14. Coherence bandwidth at level 0.9 versus the separation between the transmitter and the receiver in the PC laboratory. (a) Copolar and (b) crosspolarcomponent.
524 IEEE TRANSACTIONS ON VEHICULAR TECHNOLOGY, VOL. 50, NO. 2, MARCH 2001
(a) (b)
Fig. 15. Coherence bandwidth at level 0.9 versus the separation between the transmitter and the receiver in the electronics laboratory. (a) Copolar and (b) crosspolarcomponent.
TABLE IIIPARAMETERSC AND �, CONFIDENCEINTERVAL, AND LMS ERROR FROM THEB VERSUS� FIT
The coherence bandwidth for a correlation level of 0.9 hasbeen calculated for each of the antenna positions along the cor-ridor. It has been confirmed that an inverse relation betweenand exists. The results of the fit of the relation with theform are presented. Measurements are also com-pared with the lower bound given in [5]. The differences in theresults for both polarization components are due to the differentshape of the IRs.
REFERENCES
[1] J. G. Proakis,Digital Communications, 2nd ed. New York: McGraw-Hill, 1989.
[2] W. C. Jakes,Microwave Mobile Communications. New York: Wiley,1974.
[3] W. C. Y. Lee, Mobile Communications Design Fundamentals, 2nded. New York: Wiley, 1993.
[4] D. C. Cox and R. P. Leck, “Correlation bandwidth and delay spread mul-tipath propagation statistics for 910-MHz urban mobile radio channels,”IEEE Trans. Commun., vol. COM-23, pp. 1271–1280, Nov. 1975.
[5] B. H. Fleury, “An uncertainly relation for WSS processes and itsapplication to WSSUS systems,”IEEE Trans. Commun., vol. 44, pp.1632–1634, Dec. 1996.
[6] S. J. Howard and K. Pahlavan, “Measurement and analyzes of the indoorradio channel in the frequency domain,”IEEE Trans. Instrum. Measure.,vol. 39, pp. 751–755, Oct. 1990.
[7] K. Pahlavan and S. J. Howard, “Frequency domain measurements ofindoor radio channels,”Electron. Lett., vol. 25, no. 24, pp. 1645–1647,Nov. 1989.
[8] P. A. Bello, “Characterization of randomly time-variant linear channels,”IEEE Trans. Commun. Syst., vol. CS-11, pp. 360–393, Dec. 1963.
[9] M. C. Jeruchim, P. Balaban, and K. S. Shanmugan,Simulation of Com-munications Systems. New York: Plenum, 1992.
[10] A. A. M. Saleh and R. A. Valenzuela, “A statistical model for indoormultipath propagation,”IEEE J. Select. Areas Commun., vol. SAC-5,pp. 128–137, Feb. 1987.
[11] T. S. Rappaport and S. Y. Seidel, “900 MHz multipath propagation mea-surements for U.S. digital cellular radiotelephone,”IEEE Trans. Veh.Technol., vol. 39, pp. 132–139, May 1990.
[12] P. Nobles and F. Halsall, “Delay spread measurements within a buildingat 2 GHz, 5 GHz and 17 GHz,” inProc. Inst. Elect. Eng. Colloq. Prop-agation Aspects of Future Mobile Systems, Oct. 1996, pp. 8/1–8/6.
[13] S.-C. Kim, H. L. Bertoni, and M. Stern, “Pulse propagation character-istics at 2.4 GHz inside buildings,”IEEE Trans. Veh. Technol., vol. 45,pp. 579–592, Aug. 1996.
[14] Probability distributions used in the radioelectric waves propagation, inInform 1007–1 of the ITU, 1986–1990.
[15] T. A. Sexton and K. Pahlavan, “Channel modeling and adaptative equal-ization of indoor radio channels,”IEEE J. Select. Areas Commun., vol.7, pp. 114–121, Jan. 1989.
[16] G. J. M. Janssen, P. A. Stigter, and R. Prasad, “Wideband indoor channelmeasurements and BER analysis of frequency selective multipath chan-nels at 2.4, 4.75, and 11.5 GHz,”IEEE Trans. Commun., vol. 44, pp.1272–1288, Oct. 1996.
[17] D. P. S. de Rivera,Estadística. Modelos y métodos: Modelos linealesy series temporales, 2nd ed. Madrid, Spain: Alianza Editorial, 1989,vol. 2.
[18] M. P. Fitton, A. R. Nix, and M. A. Beach, “A comparison of RMS delayspread and coherence bandwidth for characterization of wideBand chan-nels,” in Proc. Inst. Elect. Eng. Colloq. Propagation Aspects of FutureMobile Systems, Oct. 1996.
[19] M. J. Gans, “A power-spectral theory of propagation in the mobile-radioenvironment,”IEEE Trans. Veh. Technol., vol. VT-21, pp. 27–37, Feb.1972.

SÁNCHEZ VARELA AND GARCÍA SÁNCHEZ: RMS DELAY AND COHERENCE BANDWIDTH MEASUREMENTS 525
Mercedes Sánchez Varelawas born in Vigo, Spain,in 1974. She received the M.S. degree in telecommu-nications engineering from the Universidade de Vigoin 1998, where she is currently pursuing the Ph.D.degree in the Departamento de Tecnoloxias das Co-municacións.
During 2000, she was a Visiting Researcher at theDepartment of Engineering Science, University ofOxford, U.K. Her research interests include radiochannel characterization and measurement. She hasperformed measurement campaigns with a vector
network analyzer and now is processing results. She is also working on antennaanalysis and design for DVB-T distribution networks.
Manuel García Sánchez(S’88–M’93) received theIngeniero de Telecomunicación degree from the Uni-versidad de Santiago de Compostela, Spain, in 1990and the Doctor Ingeniero de Telecomunicación de-gree from the Universidad de Vigo, Spain, in 1996.
In 1990, he joined the Departamento de Tec-nologías de las Comunicaciones, Universidadde Vigo, where he currently teaches courses inelectromagnetic fields as a Profesor Titular deUniversidad. He has been a Visiting Researcher atthe Departamento de Señales, Sistemas y Radioco-
municaciones, Universidad Politécnica de Madrid, Spain, and the Departmentof Electronics and Information Technology, University of Glamorgan, U.K.His research interests include studies of indoor and outdoor radio channelmodeling for wide-band applications at millimeter-wave frequencies, mobilecommunications, and DVB-T distribution networks.
Related Documents