RESTRICTED RLE COPY Report No. AS- 109 This report was prepared for use within the Bank and its affiliated organizations. They do not accept responsibility for its accuracy or completeness. The report may not be published nor may it be quoted as representing their views. INTERNATIONAL BANK FOR RECONSTRUCTION AND DEVELOPMENT INTERNATIONAL DEVELOPMENT ASSOCIATION ECONOMIC DEVELOPMENT OF PAKISTAN VOLUME II ANNEXES April 26, 1965 South Asia Department Public Disclosure Authorized Public Disclosure Authorized Public Disclosure Authorized Public Disclosure Authorized Public Disclosure Authorized Public Disclosure Authorized Public Disclosure Authorized Public Disclosure Authorized

Welcome message from author
This document is posted to help you gain knowledge. Please leave a comment to let me know what you think about it! Share it to your friends and learn new things together.
Transcript

RESTRICTED
RLE COPY Report No. AS- 109
This report was prepared for use within the Bank and its affiliated organizations.They do not accept responsibility for its accuracy or completeness. The report maynot be published nor may it be quoted as representing their views.
INTERNATIONAL BANK FOR RECONSTRUCTION AND DEVELOPMENT
INTERNATIONAL DEVELOPMENT ASSOCIATION
ECONOMIC DEVELOPMENT
OF
PAKISTAN
VOLUME II
ANNEXES
April 26, 1965
South Asia Department
Pub
lic D
iscl
osur
e A
utho
rized
Pub
lic D
iscl
osur
e A
utho
rized
Pub
lic D
iscl
osur
e A
utho
rized
Pub
lic D
iscl
osur
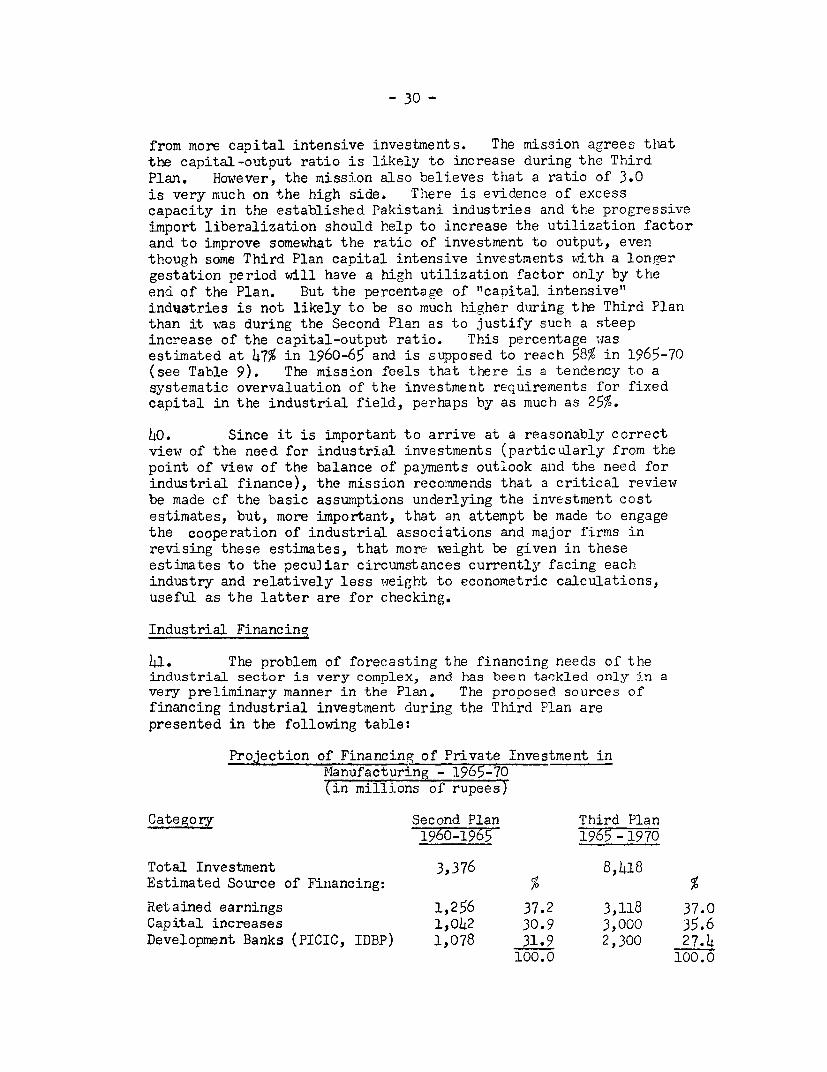
e A
utho
rized
Pub
lic D
iscl
osur
e A
utho
rized
Pub
lic D
iscl
osur
e A
utho
rized
Pub
lic D
iscl
osur
e A
utho
rized
Pub
lic D
iscl
osur
e A
utho
rized

CURRENCY EQUIVALENTS
4.762 rupees = U.S. $1. 00I rupee = U.S. $0. 211 million rupees = U.S. $210,0001 billion rupees = U. S. $210 millionI crore rupees = 10 million rupees
U. S. $2. 1 million

CONTENTS
Page
1. EXPORT FROJECTIONS FOR THE THIRD PLAN 1
2. AGRICULTURE 7
3. IINDUSTRY 19
4. POWER 56
5. TRANSPORT AND COMMUNICATIONS 87
6. SOCIAL SERVICES 95
7. CAPITAL IMARKET 99
8. RECENT TAX CHANGES ADOPTED DURING THESECOND FTVE-YEAR PLAN 102
9. TAX SYSTEM 115

ANNEX 1
EXPORT PROJECTIONS FOR THE THIRD PLAN
Raw Jute.
1. Average raw jute production during the 1950's was about 5.6 riiillionbales a year, moving up from 5.3 during the first half of the decade to 5.9during the second half. Since 1960, production has been as follows:
1960/61 1961/62 1962/63 1963/64 1964/65 Average
Million bales: 4.5 6.9 6.5 5.9 5*5.5/ 5.9
a/ Preliminary estimate.
2. The average for the Second Plan period would thus be unchanged atthe 5.9 figure of the previous five years; this stagnation is the moreremarkable as it implies a continuous decline from the large 1961/62 crop.At the same time, world production has recorded a progressive increase,mainly on account of India.
3. The Second Plan target for raw jute production had been 7.3 millionbales by 1964/65, and the shortfall is now expected to be 25 per cent. Thismust be attributed chiefly to the low price received by farmers relative torice, partly to lack of direct promotion of improvement in cultivation, andpossibly in some degree to emigration. The production target for the ThirdPlan is for 8 million bales by 1969/70, which represents an increase over theaverage Second Plan production by 36 per cent. One-half of this proposed in-crease is to come from additional acreage, made available through reclamationand drainage, and the other half from increased yields.
4. An appropriate price policy could most likely bring jute acreagefrom the present 1.66 million acres close to the 2 million acres target,which at current yields would produce roughly 7 million bales. Better farm-ing methods, seeds and fertilizers are expected to bring production furtherup to 8 million bales. These physical quantities are in no way ambitious bythemselves, but clearly no farmer will be persuaded to put more resourcesinto jute cultivation if the price incentives are lackiag. It may be thatthe continuation of current increases in rice productioon would help to improvethe relative cash value of jute cultivation, but unless the price of rice wrereto drop substantially in the years to come, positive measures will have to betaken to improve the price of jute. This problem is difficult because of thevery large number of growers, and the age-old marketing organization based onthe activity of innumerable small itinerant traders, middle men, country boatoperators, and money lenders. The Jute Marketing Corporation, set up by theCentral Government with the object of stabilizing farm prices through bufferstock operations at the intermediary level, does not appear to have beenoverly successful, although it is reported to have stocked 8 per cent of thecrop last year. The Mission has no information as to what extent this wassimply a commercial purchasing operation.

- 2 -
5. As far as promotion of fertilizer and better seeds is concerned,not much has been done by either Government or by other interested partiesin the past, and the same is true for irrigation. In the opinion of the
Mission, a combined effort of considerable magnitude will be necessary onthe side of production inputs and of price policy to achieve the Plan target
for jute output. In view of the need to keep export prices not only stablebut below the threshold of technological substitution which may become in-
creasingly competitive in the future, and of the need on the other hand to
create a price incentive to the farmer which at present clearly is not avail-able, it would be advisable to seriously consider the abolition of the export
duty as a first step. A thorough study of other suitable resources should
be undertaken as early as possible. Pending tangible indications of sub-stantial change, the Mission visualizes a shortfall by perhaps 5-10 per centfrom the raw jute production target of 8 million bales in 1969/70.
Jute Manufactures.
6. The availability of raw jute for export is the residual of produc-tion after domestic mill consumption, and it cannot be projected before theproduction of jute manufactures is known. Mlore than for other export goods,the limiting factor in jute manufactures is the speed at which productioncapacity can be expanded. The loomage target for the Second Plan had ori-ginally been for a 50 per cent increase to 12,000 looms and was twice revieedupwards during the Plan. Still, just about 10,500 looms are expected to be
operating at the beginning of the Third Plan. The Government is now settinga target to increase this to about 22,000 by 1969/70, including 1,800 broadlooms. This would enable Pakistan to export 600,000 tons of jute fabrics asagainst the present volume of 250,000 toins. The industry considers this tobe possible, given the most favorable conditions for investment, which goconsiderably beyond those presently prevailing. Indirectly, they wouldamount to subsidies advanced through public utilities, to removal of virtu-ally all government controls from the industry, and to extremely favorable
credit facilities. From experience in the past few years, it would notappear to be politically easy to extend all the freedoms requested, becauseof the structure of private capital in the jute industry. This is not to saythat the Mission shares the Government's concern with the conflict of con-centration of wealth with social objectives, but it can foresee polibtical
pressures for a wider social and geographical dispersion of jute mills. Time
is likely to be lost over these issues; and an acceleration in the ordering,shipment and installation of new looms from an annual rate of about 600 per
year in the Second Plan to over 2,500 on average during the Third Plan would
seem to be difficult for purely technical reasons, even in the absence of any
need for government sanctioning of plants.
7. Pakistan's exports of jute fabrics at present constitute about 20per cent of world exports. The proposed increase would imply that Pakistancaptures 58 per cent of the total increase in wqorld demand and would increase
its share to 33 per cent. Although there may be questicns about the industry's
capacity to make such large inroads in world markets, the Mission has no

reason to think that it should be impossible from the marketing point ofview, unless her major competitor, India, were to take drastic steps on theexchange rate side or otherwise, to offset the advantage which Pakistan hasin price as well as in quality. Another contingency would be a slowing downof world demand, brought about by new economies in bulk handling as againstthe use of jute sacking, or by technological competition from syntheticfibers. The most important factor in maintaining and promoting the use ofjute fabrics in the world is to lceep the price stable at a point low enoughto retain and expand markets against synthetic competition. If this can beachieved, much will have been done towards meeting the Plan targets forexport of jute manufactures.
8. The price assumptions made in the projections of earnings by1969/70, implying a slight reduction from present prices for sacking andhessian, and a price of Rs. 1,800 per ton for broad cloth, appear reasonable.However, in the light of the problems to be encountered in the accelerationof production, the Mission thinks that a target of Rs. 800 million from jutemanufacture is more than what can be expected. A reduced target of Rs. 700million might be feasible, implying a 10 per cent reduction from the produc-tion target of 720,000 tons. Even the Rs. 700 million would represent a100 per cent increase over 1964/65, and the Mission feels that the utmosteffort would be required to achieve it.
9. Assuming that the mill offtake of raw jute would be less by about10 per cent than assumed in the Government's projections, this would releaseabout 450,000 bales of raw jute. Such a volume is in the same order ofmagnitude as the shortfall which the Mission thinks is likely to occur in theoutput of raw jute and, therefore, it would still appear feasible to export3.75 million bales. On this basis, a target for earnings of Rs. 750 millionfrom raw jute would not seem to be unreasonable.
Raw Cotton.
10. The volume of Pakistan's cotton exports has in the past fluctuatedwith the crop output, while the export price is governed by factors outsidePakistan's control, such as U.S. farm and cotton export policy. Pakistan'sexports represent only about 4 per cent of total world exports; the qualityof Pakistani cotton is good, and from past experience it appears that evenwith substantial increases in availabilities from one year to another thereis no real difficulty in marketing a growing export surplus, notwithstandingthe fact that part of the volume in recent years has been exported underbilateral trade agreements. An increase in exports from a present trendlevel of close to 1 million bales to a 1969/70 target of 1.25 million baleswould not seem to pose a problem. The price assumption of Rs. 450 per balewould also seem reasonable.
11. Prospects for production of raw cotton are discussed inA n n e x 2, where it is concluded that an output of 3.5 million balesin 1969/70, representing a 45 per cent increase over the present trendlevel, is also a feasible objective. With an assumed domestic disappearanceof about 2.2 million bales, exports could well reach 1.25 million bales andproduce earnings of Rs. 550 million.
12. The production target for 196 4W/6 5 had been 213 million bales. Thiswas already exceeded in 1963/64 with production of around 2.35 millicn bales.In the current year, it is expected that production itill be slightly belowtarget owing to unfavorable weather conditions and floods. However, as inthe case of raw jute, the original price assumptions have proven conserva-tive, and it appears that the price will be at least 10 per cent betterthan expected. Domestic mill consumption increased more slowly than had beenassumed, so that exports now will be about 820,000 bales as against theprojected figure of 650,000 bales. Earnings should therefore be about $84million as against an expected $55 million. After the existing exportduties on raw jute and raw cotton had been reduced from time to time fromthe high level of the Korean boom, the Government decided in July 1964 tofurther reduce them by 50 per cent, to Rs. 10 per bale for both coLiiodi-ties, and to abolish the sales tax on cotton. Expressed as a percentageof the value, the remaining duty represents about 5 per cent in the caseof jute; this reduction is a realistic step but we do not think that byitself it will make the necessary impact on production and export, sincethe long-run prob'em, with Pakistan having a quasi-monopoly, lies deeper,and some day will require more drastic measures. The duty on cotton hadstill been the equivalent of over 15 per cent ad valorem in 1962, and itis now just over 2 per cent. This has certainly been a factor in makinga 100 per cent increase in exports of cotton possible.
Cotton Textiles.
12. Exports of cotton textiles has been disappointing in the SecondPlan, increasing from a level of 80 million yards of cloth to 106 millionyards over five years. It is true that international competition in cottontextiles is difficult, and Pakistan's industry still has difficulty in pro-ducing adequate quality. Her costs are not low and she has had no realincentive to become competitive. For nearly 15 years the domestic markethas been hermetically sheltered; in the first 10 years of this period, pro-duction of cloth increased seven-fold. Since 1961, however, the growthrate has been less than the growth of GNP, which is remarkable in a countrywhere per capita consumption of cloth is only 13 yards per annum, and wherethe income elasticity of demand is no doubt more than unity.
13. The export target for cloth in 1969/70 is modest. Indeed, it isthe same 225 million yards, which had been the target for the end of theSecond Plan. In proportion to total expected output, it is about one-sixth,the same as that prevailing at present with a mill production of 785 millionyards and an export of 106 million yards. The question is whether the
- 5 -
proposed increase of output to 1.4 billion yards by 1969/70 is feasiblewith present domestic market conditions. It would appear that a saturationpoint has been reached in this market two years agosince in the last twoyears domestic consumption increased less than domestic population; thishighly abnormal situation may be partly explained by relative stagnation ofinvestment in the expansion of capacity which is controlled by the Govern-ment. In fact, it is claimed by some sources that installed capacity isfully utilized. However, the Mission believes that the most importantobstacle which may stand in the way to achieving Third lPlan output andexport targets is extreme protection from competition and oligopoly. ThePakistan cotton textile industry is largely equipped with modern machinery;Pakistani factory workers are not less endowed with natural skills than inother countries; management is shrewd but accustomed to easy outlets. Itis a matter for concern that they should still be in need of a total pro-hibition of cotton textile imports and a protective duty of 100 per cent advalorem. The MIission thinks that, with the continuation of these presentarrangements, it is unlikely that costs and prices would become competitive;that incentives to expand output to the targets would be insufficient, andexports would continue to be in need of government compulsion.
14. If it were not for these considerations, the Third Plan targetfor the export of cotton manufactures, namely Rs. 170 million for yarn andRs. 180 million for cloth, with the underlying volume and price assumptions,would appear both practical and feasible.
Fish.
15. Of the Rs. 90 million worth of fish presently exported, abouthalf consisted of traditional exports of fresh river fish from East Pakistanto Calcutta and of dried fish to India, Ceylon and Southeast Asia. Thistype of fish export has not grown very fast and has no great potential. Atarget of Rs. 60 million for the Third Plan, implying a 30 per cent increase,would therefore seem more realistic than the proposed Rs. 100 million. Theother half consists mainly of fresh frozen fish and of shrimp, lobster, etc.,frozen or canned. These items have good market prospects in the U.S.,Europe and possibly in the Far East; but extremely favorable assumptions asto the volume, quality, and price of Pakistan's supply would have to bemade to assume a 200 per cent increase within the next five years. A morelikely assumption would be to double these items from Rs. 45 million toRs 90 million. An additional Rs. 20 million at least could be earned withfish meal, the production of which the M.ission recommends.
Rice.
16. As for raw cotton, the prospects for production of superior riceare very favorable. The Mission accepts the export targets of 400,000 tonseven though this implies a dramatic increase from the present volume of140,000 tons (but the present volume is also three times the volume at thebeginning of the Second Plan). However, it feels that in order to reach

- 6 -
markets other than the Middle East, which has a limited capacity, theassumed price of Rs. 980 per ton is too high. A price of Rs. 850 a tonwould be reasonable for Basmati rice. The assumed price of Rs. 550 forother varieties is less problematical. Therefore, it is felt that earn-ings might reach a level of Rs. 300 million for superior rice, subject tothe condition that the present unsatisfactory procurement and exportarrangements are modified. The Mission thinks that trade in rice shouldbe conducted entirely by private firms. Coarse rice, which is producedmainly in East Pakistan cannot be exported in present circumstances wherePakistan receives wheat under PL 480. In the absence of this factor, itwould be quite possible that Pakistan might become a net exporter; however,several developing countries are presently planning substantially to stepup rice exports; to what extent these efforts would materialize in comingyears is difficult to foresee at this stage. With these two considerationsin mind, the Mission agrees with the Government in considering the exportof coarse rice as too remote a possibility for inclusion in the Plantargets.
Other Exports.
17. As far as paper and newsprint is concerned, the official targetseems to be highly speculative. The assumed increase in both domesticproduction of paper (by 230 per cent) and in domestic consumption (by 210per cent) contairsmargins of guesswork so large that it would be safe notto assume a significant increase in the residual export surplus. For aUlthe other miscellaneous manufactured goods, the Export Promotion Bureau hadpresented detailed targets most of which are strikingly optimistic; theyimplied an annual compound rate of increase of 35 per cent. The PlanningCommission reduced this to 21 per cent, and projected an increase fromRs. 230 million to Rs. 600 million by 1969/70. The iission thinks thatthis is still a very optimistic, though not altogether impossible, target;as a reasonable expectation a figure of Rs. 500 million is suggested.

AGRICULTURE
Introduction
1. The Third Plan calls for a sharp acceleration of growth inthe agricultural sector from the 3.5 percent per year during the SecondPlan to 5 percent per year. The main objectives of the Plan in theagricultural sector are:
(a) to increase the real income of farmers;
(b) to move towards self-sufficiency in food requirementsto the extent compatible with other needs of the economy,aiming at the same time, at improving nutritional standards;
(c) to promote agricultural development on a sound, self-propelling basis by further improvements in agriculturalorganizations and intensified programmes such as thedevelopment of cooperatives, marketing, storage andcredit facilities.
2. To achieve this transformation of agriculture, the highestpriority is being given to rneasures to increase water availability andthe use of fertilizer. The Plan calls for maintaining strong farmincentives and strong support for the entire range of agriculturalprograms. Allocations of public development expenditures for agricultureand water have been roughly doubled over the levels achieved in theSecond Plan and provisions are also being made for a considerableincrease in development credit for financing private on-farm investments.Together these programs amount to over 30 percent of planned developmentoutlays. If the Rural Viorks program is added the percentage rises toabout 35 percent. Provisions have also been rmade for increasing thesupply of essential farm inputs and gradually transferring responsibilitiesto the private sector. Research and extension activities are to bestrengthened further and increased emphasis is to be given to land con-solidation, colonization, range land development, soil conservation andagricultural marketing.
3. Production targets for the principal crops and growth inagricultural GNP are shown in Tables 1 and 2. On the basis of perform-ance during the Second Plan and projected inputs during the Third Plan,the production targets for the major crops appear to be within reach.However, in order to reach an overall growth rate of 5 percent peryear (28 percent in 5 years) in the agricultural sector, the output ofminor crops and livestock will have to be increased considerably abovethe 2.8 percent and 1.9 percent per year growth achieved during theSecond Plan period. There is some evidence that the past growth of minorcrops and livestock may have been understated, but there has beenrelatively little study of these sub-sectors and no positive programfor achieving the planned increases. The mission believes, therefore,that to achieve the projected 5 percent per year growTth rate, some of

- 8 -
the targets for major crops would have to be exceeded by a substantialmargin. This will call for an acceleration of the changes in agriculturewhich were introduced during the First and Second Plans. In additionto the increased level of public development expenditures provided inthe Third Plan, a much greater effort will have to be made to utilizefully the resources of the private sector. This means maximum encourage-ment to private on-farm investments through increased availability ofessential farm inputs at reasonable prices, ircreased farm credit andmaintenance of adequate incentives through a realistic price supportprogram. It also means a more rapid transfer of service and distributionfunctions such as seed and fertilizer distribution, plant protectionservices and mechanized services from overburdened public agencies tothe private sector. This would permit government to concentrate itslimited technical manpower on essential technical services such asresearch, extension and training activities.
Table 1: PRODUCTION TARGETS (1000 tons)
Percentage1964/65 1969/70 IncreaseBenchmark Target Third Plan
Rice 11,000 14,445 31Wheat 4 ,157 5,465 31Maize 505 786 56Other foodgrains 738 770 4
Total foodgrains 16,800 21,466 28
Sugar cane 20,750 28,300 36Oilseeds 1,171 1,806 54Jute (1000 bales) 6,200 8,000 29Cotton (1000 bales) 2,217 3,500 58Tea (million lb) 56 73.5 31.5
Table 2: AGRICULTURAL GNP OF PAKISTANAT FACTOR COST OF 1959/60
(Rs million)
AnnualPercentage
1959/60 1960/61 1961/62 1962/63 1963/64 Growth
Agriculture 16,813 17,285 18,183 18,272 19,366 3.6Major crops 9,634 10,015 10,715 10,606 11i526 4.6Minor crops 2,180 2,229 *2,316 2,381 2,038 2.8Livestock 3,719 3,793 3,868 3,942 14,016 1.9Fishing 1,111 1,137 1,169 1,219 1,255 3.1Forestry 109 111 115 124 131 20.2
Source: Interim Report of the National Income Commission,September 1964, Appendix XIV.
-9-
Sources of Growth
4. Experience during the Second Plan demonstrates clearly thatwater has been the major limiting factor in both West and East Pakistan.In West Pakistan, the problem has been one of trying to spread too littlewater on too much land. In East Pakistan the problem has been too muchwater in the rainy season and not enough in the dry season. This hasresulted in periodic droughts, floods, waterlogging, salinity and con-sequent low yields. The twenty percent increase in water availabilitydeveloped during the Second Plan has been the major growth factor inWest Pakistan. The improvements in flood control and drainage resultingfrom the Coastal E-nbankment Project and other smaller works have beenimportant factors in East Pakistan. With better control of water andreduced crop losses. more intensive cropping has been made possible andfarmers have been in a better position to invest in other inputs such asbetter varieties of seeds, fertilizers and farm machinery.
5. In the Third Plan, public investments in water will be roughlydoubled. Moreover, considerable encouragement is to be given to privatetubewell development in West Pakistm . The low lift pump irrigationprograms in East Pakistan will be accelerated and possibilities forlarge scale sale of small low lift pumps to individual farmers anddevelopment of private tubewells will also be given priority. Majoremphasis is to be given to completion of the Coastal Embankments Projectsand other on-going projects and rapid implementation of a major floodcontrol program for East Pakistan. As a result of these programs,in both wings 5.5 million acres of land will be newly irrigated and21.7 million acres will receive an increased water supply. This isexpected to provide about 35 to 40 percent of the planned increase inoutput and provide the basis for improvements in cropping practices andincreases in other inputs. Achievement of this target will require asharp acceleration in the rate of project preparation and executionin the public sector as well as maximum effort in the private sector.
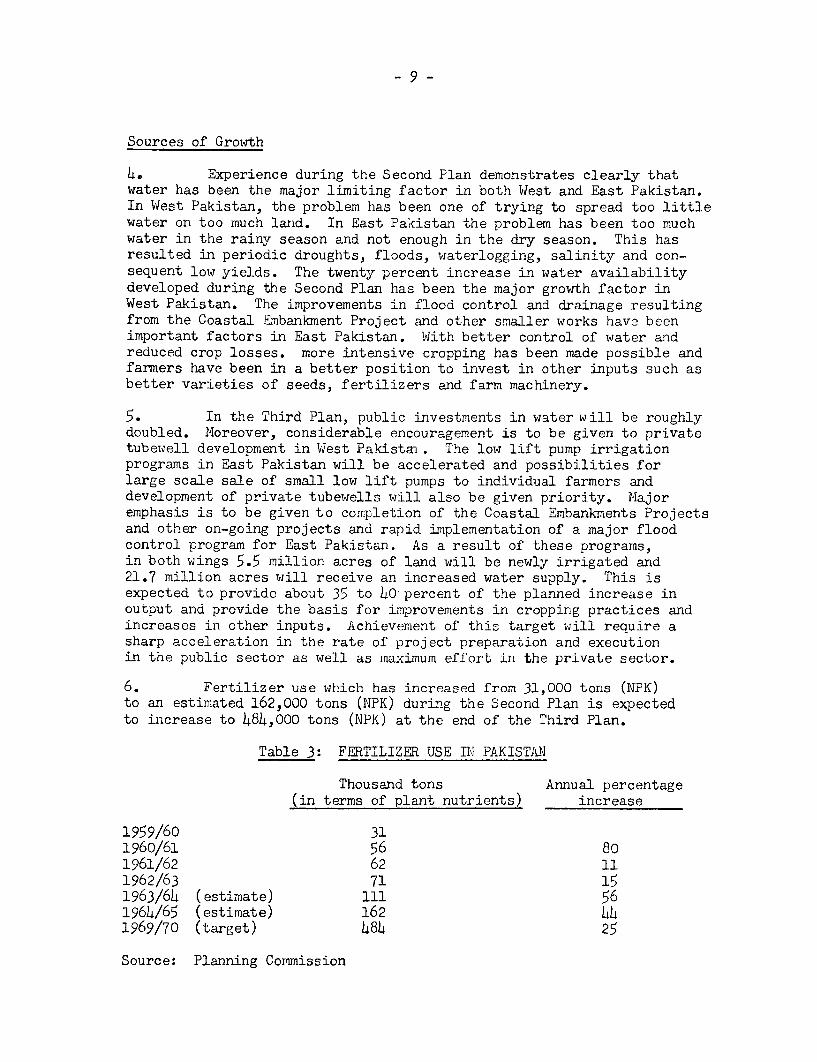
6. Fertilizer use which has increased from 31,000 tons (NPK)to an estimated 162,000 tons (NPK) during the Second Plan is expectedto increase to 484,000 tons (NPK) at the end of the Third Plan.
Table 3: FERTILIZER USE El PAKISTAN'
Thousand tons Annual percentage(in terms of plant nutrients) increase
1959/60 311960/61 56 801961/62 62 111962/63 71 151963/64 ( estimate) 111 561964/65 (estimate) 162 441969/70 (target) 484 25
Source: Planning Commission
- 10 -
The Plan calls for construction of additional fertilizer plants, con-tinuation of subsidies to offset high costs of domestic production,continued imports at a level sufficient to avoid recurrence of currentshortages, and further transfer of distribution to the private sector.Necessary credit arrangements are also to be provided. Fertilizer isexpected to produce about one-third of the planned increase in agricul-tural output. However, since demand is already in excess of domesticoutput, every effort will have to be made to step up imports and toexpedite construction of new plants.
7. Plant protection, improved seed, mechanization, improvedpractices and increased labor inputs are expected to provide the remain-ing 30 percent of the planned increase in output.
8. IWith the planned improvement in water availability and increasein fertilizer use, drought resistant varieties suitable for low fertilityconditions which have been in general use will not produce maximum returns.Fortunately, a number of high yielding varieties suitable for theseimproved conditions have been developed and are in various stages oftesting, multiplication and distribution. Some have already been dis-tributed and have made some impact on yields (e.g. cotton, sugar cane,rice) and can be expected to increase yields substantially as they aredistributed on a wider scale. TwJo promising wheat varieties, a Mexicanand an Australian, are almost ready for mass distribution and could havea dramatic effect on yields. The mission believes that an immediateexpansion and intensification of research activities aimed specificallyat developing high yielding varieties for all of the principal cropsunder different local conditions is essential for continued growthbeyond the Third Plan period. As applications of water and fertilizerincrease over the years, plant varieties will have to be repeatedlychanged to achieve best results.
9. Plant protection activities becorme increasingly important withintensification of production and higher yields. At present the costof the services are almost completely subsidized with the farmerproviding only some labor. On this basis, the government has been ableto provide services on only 12 percent of the cultivated area. Mostof the treatment has been curative rather than preventative. So longas free government services are provided, farmers will tend to avoidexpenditures for routine preventative spraying and dusting in the hopethat government services will be available when needed. However, withthe resources at hand, government has not been able to cope with thedemand and delays have resulted in substantial crop losses. Many of thefarmers would now be prepared to carry out such normal preventativetreatment at their own expense, particularly for orchards, sugar cane,cotton and other high value crops but materials are not readily available.Several private firms have started pilot services in order to meet thisdemand but have been restricted in the imports of materials and equipment.The mission believes that the present target to achieve 19 percent

- 11 -
coverage in 1969-70 is not adequate to achieve the growth projected.In order to achieve a higher coverage the farmers themselves must takeon greater responsibility. This is not possible so long as resourceallocation for plant protection is confined to the public sector. Themission believes that immediate steps should be taken to encouragemaximum private sector participation. This will call for the followingmeasures:
(a) Restricting free public plant protection services to locustcontrol and curative aerial spraying of areas with large scaleinfestation, and technical advice;
(b) Imposing a full charge for all other work, including smallscale curative and all preventative spraying work (most of thiswould be eliminated as rapidly as the private sector cansupply required materials and services);
(c) Liberalizing imports of plant protection materials and equip-ment until such time that local manufacturing can be established.
10. As shown below, the mechanization program c alls for a sharpincrease in government services for land development and private tubewelldevelopment in West Pakistan and low lift pump in East Pakistan.
Table 4: LOW LIFT PUIP IRRIGATION IN EAST PAKISTAIN
No. of Pumps Area Irrigated
1958/59 772 30,0001959/60 1,130 49,00O1960/61 1,267 65,ooo1961/62 1,543 98,0001962/63 2,024 133,0001963/64 2,456 156,ooo
Source: J. Hendry and U Hpu, "East Pakistan Agricultureduring the Third Five-Year Plan," July 196h, p.l5.
Table 5: NUMBER OF PRIVATE TUBEWILLS IN WEST PAKISTANJ/
Number ofPrivate Tubewells Number Installed Durin YearEnd of Year Total Agric. Dept. Private Drillers
1959/60 4,635 1,340 h89 85D1960/61 7,9L0 3,305 817 2,h881961/62 12,196 4,256 1,o40 3,2161962/63 17,600 5,400 1,088 4,2131963/64 24,200 6,400 1,410 4,9901969/70 (target) 70,000
1/ Estimates by Ghulam Mohammad, Senior Economist,Institute of Development Economics.

- 12 -
The Plan also provides for sale of low lift pumps to cultivators,encouraging the use of power tillers in East Pakistan, and expandeddistribution of improved implements. No mention is made of privatesales of tractors and equipment to larger farmers. As in the case ofother input items, the heavy reliance on government subsidized serviceshas limited the scope of development. Scarce foreign exchange has beenreserved for the government sector which has not been able to meet thedemand. Even so the private sector has been active, particularly inWest Pakistan where private well drillers are installing about three-fourths of the 6,000 to 7,000 private wells being installed annually andthe backlog of demand for farm tractors amounts to about 5,000 units ortwo and a half years' allocation of foreign exchange at current licensingrates. The mission believes that government mechanized services can beaugmented to a considerable extent by liberalizing the imports of tractors,pumps, equipment and materials. Moreover, before any substantial increasein the scope of government services, the possibilities of developingprivate sector interest should be carefully considered.
11. Improvement of cultural practices has been progressing slowlybut steadily and can be expected to continue at a somewhat more rapidrate with the use of more water, fertilizer and machinery. In this con-nection, the mission fully agrees with the Plan that there is a need forupgrading the quality of the extension services and providing betterfacilities so as to make them more efficient and effective.
Water Development
12. West Pakistan. The Third Plan calls for a dramatic accelera-tion of the water development program in West Pakistan. By the end ofthe Third Plan, out of a potentialfield availability of 114 millionacre feet it is proposed to develop 86 million acre feet or 75 percentof the total potential. This will require development of 24 millionacre feet as compared to 10.2 million acre feet developed during theSecond Plan. Out of a total conmanded area of 32 million acres in theIndus Basin, of which 27 million acres are presently cropped, about25 million acres will have been reclaimed and/or developed by the endof the Third Plan.
13. Out of the proposed increase of 24 million acre feet, theWater and Power Development Authority (WAPDA) is expected to develop15.8 million acre feet of ground wfater, 11.8 in the northern zone and4.0 in the south; private tubewell developments about 6 million acrefeet mostly in the northern zone; and about 2.2 million acre feet fromadditional river diversions and canal modifications.
1h. Acreage-wise, the development of 20.4 million acres is planned.WA?DA is responsible for 9.8 million acres, 7.3 million in the northernzone and 2.5 million in the south. ADC will complete drainage programsin 5.6 million acres carried over from the Second Plan and privatetubewells are expected to increase water availability on about 5 r,millionacres.

- 13 -
15. Since it will take another two to three years to undertakethe investigations needed for preparing the Master Plan for developmentof the entire Indus Basin, the government proposes to proceed as rapidlyas possible on the development of the sweet water areas where groundwater can be developed economically without prejudicing the developmentof the Basin as a whole. In the meantime, it is proposed to press forwardas rapidly as possible on the engineering of the more difficult areas.
16. At the time the mission was in Pakistan, IJAPDA had beenallocated Rs 2100 million for water development as compared to SecondPlan expenditures of Rs 14W4 million. The allocation has been subsequentlyraised to take care of the program acceleration outlined above. Althoughdetailed breakdowns are not yet available the total allocation for powerand water in West Pakistan has been increased from Rs 3800 million toRs 4370 million. Most of the increase is apparently in the water sector.Total investments would thus be of the order of Rs 2500 million or aboutdouble the expenditures in the Second Plan (exclusive of expenditureson the Indus Replacement Works).
17. On the basis of past performance and the present status ofpreparation of projects the mission doubts whether a development of thismagnitude can be carried out in a five-year period. In any case,considerable effort must be made to bring more schemes to the projectstage. At present, with the exception of the lower Thal Project, noneof the new schemes included in the Third Plan has reached the stage ofdetailed formulation. Moreover, progress on some of the "on-going"projects has been slower than anticipated at least in part because ofinadequate project preparation (e.g. Guddu and GM Barrage projects andSCARP II). A large number of consultants are currently engaged invarious studies which ought to lead to the identification and preparationof projects. Moreover, the Bank has organized a comprehensive study ofwater resources in West Pakistan which should lead to the determinationof a reasonable order of priorities.
18. Meanwhile, the mission believes that there is sufficient scopefor sizable public and private development of groundw7ater in the sweetwater areas and completion of on-going projects to permit a substantialincrease in the rate of water development in West Pakistan during thenext year or two. WAPDA should be prepared to give strong support to theprivate tubewell development by providing electrical connections andtechmical support to assure a maximum level of development.
19. East Pakistan. In East Pakistan the Plan calls for rapidcompletion of on-going projects, initiation of a major flood controlprogram, and a considerable expansion of the low lift pump irrigationprogram. Investments in the water sector will be more than doubled andthe projected irrigation, flood protection and drainage facilities areexpected to bring 1.8 million acres of new land into cultivation andexpand output on 2.7 million acres of presently cultivated land.

- 14 -
20. A large part of the increased output from irrigation isexpected to come from projects wihich have already made substantialprogress in the Second Plan. For example, the Kushtia unit of the GangesKobadak, the Dinajpur Low-lift Pump and Tubewell, the Dacca Demra andthe Chandpur projects which have not yet affected output materiallyare expected to be completed early in the Third Plan. These projectsare expected to bring about 450,000 acres of new land under irrigationand improve yields on an additional 90,000 acres.
21. The major increase is expected, however, from small low liftpump projects. The ADC and EPWAPDA plan to expand their programs toirrigate an additional 750,000 acres and the private sector is expectedto irrigate 240,000 acres mostly with small pumps of 1 cusec or less.Total projected development under these programs is estimated at almost1 million acres.
22. The Coastal Embankments project which has already providedprotection for an estimated 1,400,000 acres will be completed during theThird Plan and improve output on an additional million acres. Aninportant advantage of embankment work is that benefits can be realizedimmediately without a major change in cropping practices and furtherbenefits can be realized as cropping is adjusted to the improved conditions.
23. The Flood Control Plan can also be expected to provide similarimmediate benefits. However, at present the Plan presents only the broadframework and a listing of projects. Considerable engineering andhydrological studies will be required although some individual projectsmay be brought to the execution stage in the next year or two. Studiesby the Krug M4ission, General Hardin, and Professor Thijsse are insubstantial agreement that the problem of floods in East Pakistan is highlycomplex and unusually difficult. All suggest channel improvement andembankment as the practical means of improving conditions and that thesemeans should be developed cautiously with testing and careful observationof each project over a period of years. The reports stress the insatabi-lity of alluvial rivers in delta reaches, the uncertainties of siltation,the great size and power of East Pakistan rivers, ana the economicaspects of protection works. The strategy adopted by East PakistanWAPDA is to carry out construction in stages over the next decade,to observe effects of each project and to adjust plans as necessary.
24. The Bank has undertaken to review all aspects of the waterproblem with the Government of East Pakistan and, if it is considerednecessary, to provide a high level study group to recommend futuredevelopment alternatives. The mission believes, however, that in themeantime, there is sufficient scope for projects which would not prejudicethe direction of future development to achieve the proposed levels ofinvestments. These include completion of on-going projects, low liftpumping in areas protected from floods, and irrigation and drainageprojects in the lower delta where surplus water can be drained to the sea.

- 15 -
Agricultural Administration and Development
25. The public sector program for agricultural development haslagged behind targets set in the Second Plan period. The major reorganiza-tion of agricultural agencies carried out during the first several yearsof the Plan was undoubtedly a disruptive force. On the other hand, theperformance of the farmers has been much better than expected. The sharpincrease in private tubewell development and the unfilled demand fortractors, farm machinery, fertilizers and plant protection services showclearly that farmers have become development minded. The 3.5 percentper year increase in agricultural output which has been achieved duringthe past five years in spite of the limited availability of essentialfarm inputs and the inadequate farm credit system indicate a considerablescope for further acceleration of growth.
26. To date, developmental expenditures for agriculture properhave consisted largely of subsidies for various inputs and expensesassociated with building up a large governmental bureaucracy engaged inlarge part in administering a wide range of services. The purpose ofthe heavy subsidy element was to demonstrate the advantages of theseservices to farmers at a cost which would not be too burdensome to thesmall farmer. Lhe mission believes that the demonstration effect hasnow been accomplished on a wide enough scale so that most farmers areaware of the advantages of fertilizer as well as many of the othersubsidized inputs. Government has not been able to provide a sufficientvolume of fertilizer or services because of foreign exchange shortages,limited budgets and the difficulties of organizing these services onthe scale required. The mission believes that Pakistan could absorb amuch higher level of inputs if a larger share of the supply and servicefunctions were turned over to the private sector and government concen-trated on those areas which cannot be handled by the private sector.These include planning and execution of infrastructure investments suchas irrigation, drainage, flood control, soil conservation, grain storage,support for a commercially oriented credit system; adequate research andextension services; regulatory functions such as establishment andenforcement of standards; and a market support system to ensure adequateproduction incentives. Such a change in the role of government couldbring about a substantial savings in development expenditures andpersonnel currently earmarked for subsidized inputs and services. Thiswould make it possible to provide adequate support both in terms offacilities, funds and personnel for the essential agricultural functionsof government.
27. A basic change of this nature cannot be achieved overnight.Particularly, any reduction of the fertilizer subsidy should be approachedcautiously. The experience of recent reorganizations of agriculturalagencies shows clearly that changes must be introduced gradually andshould take the form of encouraging the private sector and reducing oreliminating functions and modifying government's role as the privatesector develops.
- 16 -
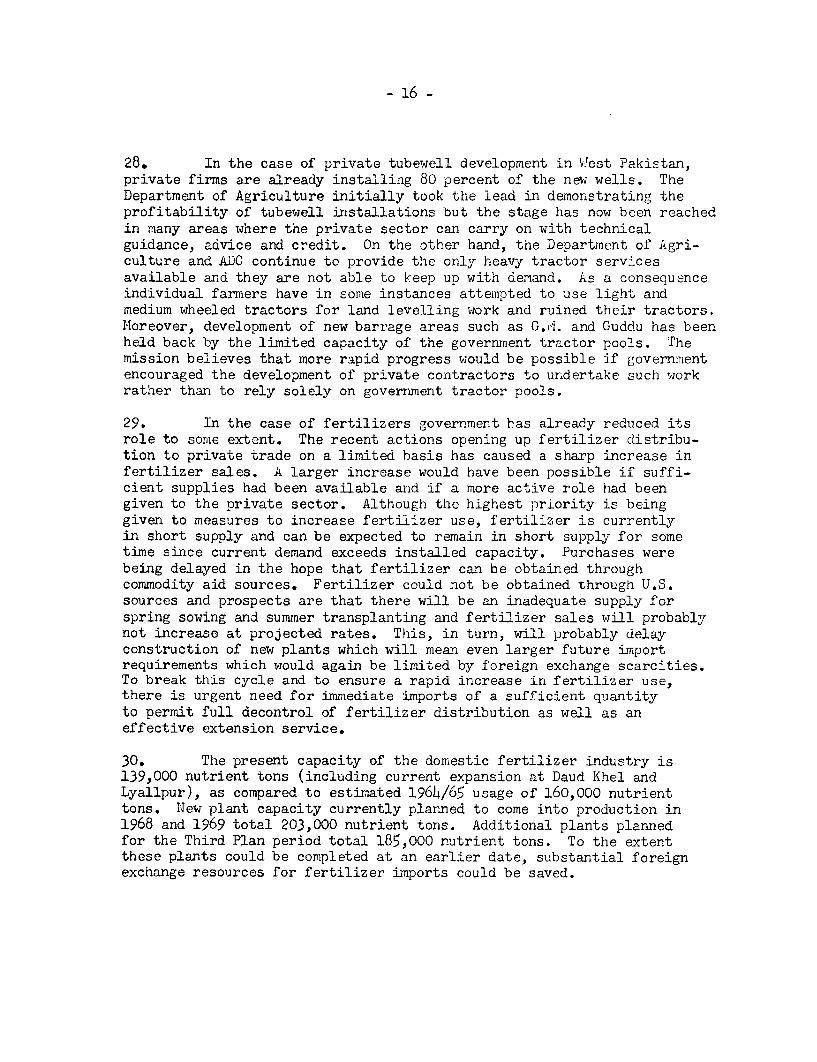
28. In the case of private tubewell development in West Pakistan,private firms are already installing 80 percent of the new wells. TheDepartment of Agriculture initially took the lead in demonstratina theprofitability of tubewell installations but the stage has now been reachedin many areas where the private sector can carry on with technicalguidance, advice and credit. On the other hand, the Department of Agri-culture and ADC continue to provide the oialy heavy tractor servicesavailable and they are not able to keep up with demand. As a consequenceindividual farmers have in some instances attempted to use light andmedium wheeled tractors for land levelling work and ruined their tractors.Moreover, development of new barrage areas such as G.A. and Guddu has beenheld back by the limited capacity of the government tractor pools. Themission believes that more rapid progress would be possible if governmentencouraged the development of private contractors to undertake suchl workrather than to rely solely on governument tractor pools.
29. In the case of fertilizers government has already reduced itsrole to some extent. The recent actions opening up fertilizer distribu-tion to private trade on a limited basis has caused a sharp increase infertilizer sales. A larger increase would have been possible if suffi-cient supplies had been available and if a more active role had beengiven to the private sector. Although the highest priority is beinggiven to measures to increase fertilizer use, fertilizer is currentlyin short supply and can be expected to remain in short supply for sometime since current demand exceeds installed capacity. Purchases werebeing delayed in the hope that fertilizer can be obtained throughcommodity aid sources. Fertilizer could not be obtained through U.S.sources and prospects are that there will be an inadequate supply forspring sowing and summer transplanting and fertilizer sales will probablynot increase at projected rates. This, in turn, will probably delayconstruction of new plants which will mean even larger future importrequirements which would again be limited by foreign exchange scarcities.To break this cycle and to ensure a rapid increase in fertilizer use,there is urgent need for immediate imports of a sufficient quantityto permit full decontrol of fertilizer distribution as well as aneffective extension service.
30. The present capacity of the domestic fertilizer industry is139,000 nutrient tons (including current expansion at Daud Khel andLyallpur), as compared to estimated 196h/65 usage of 160,000 nutrienttons. New plant capacity currently planned to come into production in1968 and 1969 total 203,000 nutrient tons. Additional plants plannedfor the Third Plan period total 185,000 nutrient tons. To the extentthese plants could be completed at an earlier date, substantial foreignexchange resources for fertilizer imports could be saved.

- 17 -
31. Similarly, to achieve projected levels of other inputs, thesupply of farm machinery, small low-lift pumps, plant protection materialsand improved seed will have to be increased at a much faster rate thancan be achieved through government action alone. Immediate steps shouldbe taken to liberalize current restrictions on imports and to encourageactive private sector participation in making essential farm input itemsavailable.
32. While considerable progress has been made in strengthening andexpanding research and extension services, a number of serious gapsremain. In the past water has been the most important limiting factor.As a result of the water development program water is no longer a limitingfactor in many areas. Suitable crop varieties and fertilizer are becomingincreasingly important. This calls for an accelerated research programaimed at developing more high yielding varieties responsive to conditionsof optimum water and fertilizer application. It also calls for a furtherexpansion in extension activities to expedite the transfer of researchresults from the research stations to the better farmers.
33. With the increased intensification of agriculture which iscurrently underway, the cash requirements of farmers for fertilizer,seed, farmn machinery, tubewells and land improvement can be expectedto increase sharply. To date, a substantial part of the investments intubewel'ls and farm machinery has come out of private savings and non-institutional forms of credit. Institutional sources provided aboutRs 120 crores of credit during the Second Plan period, of which about halfwas on medium and long term. This represented about 1.5 percent of theGNP generated in agriculture as compared to officially estimated require-ments of about 25 percent. The Third Plan provides for only a modestincrease in institutional forms of farm credit. "Taccavi loans" (directgovernment loans) will be maintained at about current levels and expend-itures on cooperative credit are to be increased somewhat. The Agricul-tural Development Bank of Pakistan, which has been the principal sourceof agricultural development credit, plans to increase its lendingoperations by about 50 percent in the next five years. The missionbelieves that a much greater increase will be necessary if the objectivesof the Plan are to be realized.
Conclusions
34. In summary, the proposed growth rate of 5 percent per yearduring the Third Plan is extremely ambitious. To achieve this ratean all-out effort will be required. Immediate steps should be takento assure action in the following key areas:
1. Water. A general acceleration of the public water developmentprogram, particularly the preparation of flood control, irrigation,drainage and reclamation projects integrated into the respective provin-cial water resource development plans and maximum encouragement toprivate tubewells and low-lift pump irrigation.
- 18 -
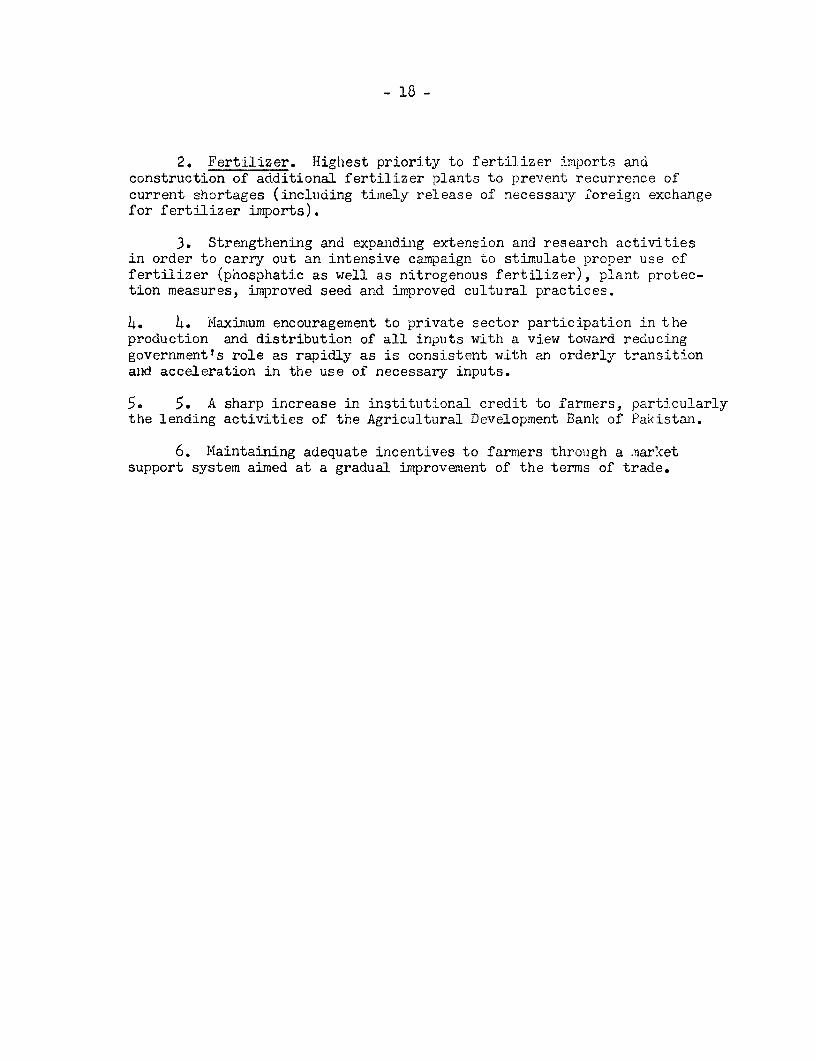
2. Fertilizer. Highest priority to fertilizer imports andconstruction of additional fertilizer plants to prevent recurrence ofcurrent shortages (including timely release of necessary foreign exchangefor fertilizer imports).
3. Strengthening and expanding extension and research activitiesin order to carry out an intensive campaign to stimulate proper use offertilizer (phosphatic as well as nitrogenous fertilizer), plant protec-tion measures, improved seed and improved cultural practices.
4e h. iiaxilnum encouragement to private sector participation in theproduction and distribution of all inpuits with a view toward reducinggovernment's role as rapidly as is consistent with an orderly transitionand acceleration in the use of necessary inputs.
5. 5. A sharp increase in institutional credit to farmers, particularlythe lending activities of the Agricultural Development Bank of Pakistan.
6. Maintaining adequate incentives to farmers through a mnar'ketsupport system aimed at a gradual improvement of the terms of trade.
ANNEX 3
INDUSTRY
GENERAL UIDUSTRIAL SITUATION - SECOND PLAN
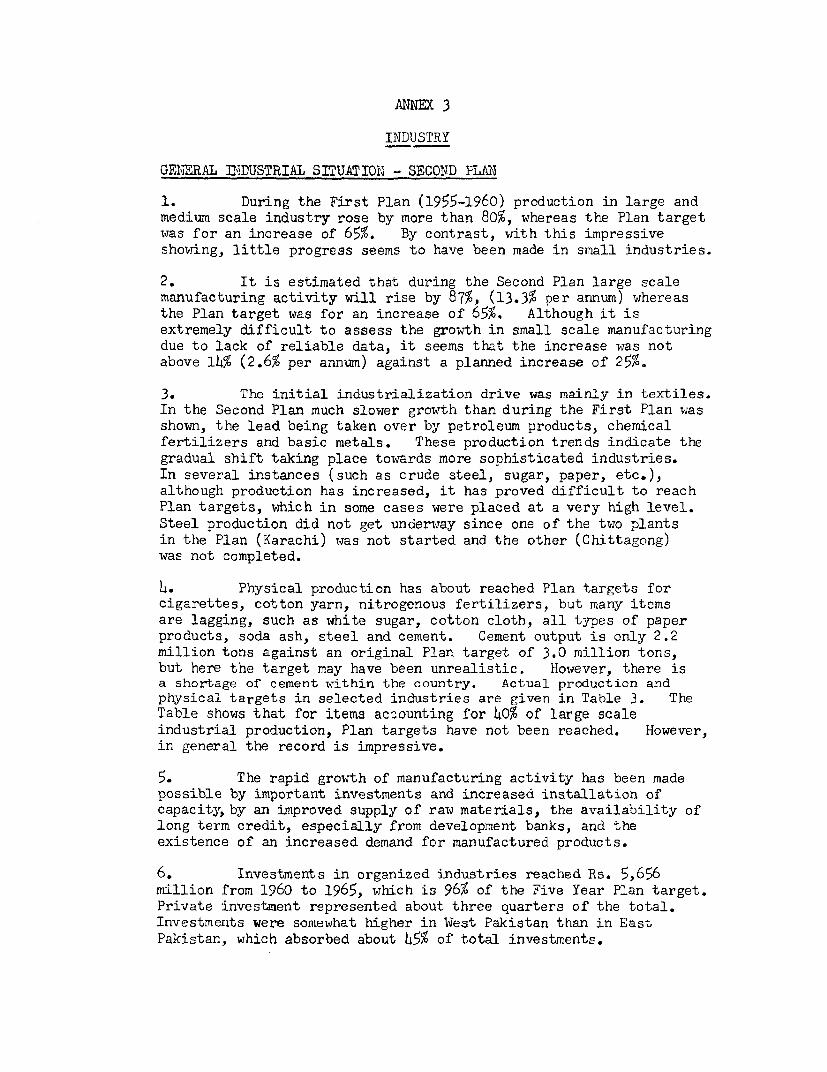
1. During the First Plan (1955-196o) production in large andmedium scale industry rose by more than 80%, whereas the Plan targetwas for an increase of 65%. By contrast, with this impressiveshowing, little progress seems to have been made in small industries.
2. It is estimated that during the Second Plan large scalemanufacturing activity will rise by 87%, (13.3% per annum) whereasthe Plan target was for an increase of 65%. Although it isextremely difficult to assess the growth in small scale manufacturingdue to lack of reliable data, it seems that the increase was notabove 14% (2.6% per annum) against a planned increase of 25%.
3. The initial industrialization drive was mainly in textiles.In the Second Plan much slower growth than during the First Plan wasshown, the lead being taken over by petroleum products, chemicalfertilizers and basic metals. These production trends indicate thegradual shift taking place towards more sophisticated industries.In several instances (such as crude steel, sugar, paper, etc.),although production has increased, it has proved difficult to reachPlan targets, which in some cases were placed at a very high level.
Steel production did not get underway since one of the two plantsin the Plan (Karachi) was not started and the other (Chittagong)was not completed.
4. Physical production has about reached Plan targets forcigarettes, cotton yarn, nitrogenous fertilizers, but many itemsare lagging, such as white sugar, cotton cloth, all types of paperproducts, soda ash, steel and cement. Cement output is only 2.2million tons against an original Plan target of 3.0 million tons,but here the target may have been unrealistic. However, there isa shortage of cement within the country. Actual production andphysical targets in selected industries are given in Table 3. TheTable shows that for items accounting for 4C% of large scaleindustrial production, Plan targets have not been reached. However,in general the record is impressive.
5. The rapid growth of manufacturing activity has been madepossible by important investments and increased installation ofcapacity,by an improved supply of raw materials, the availability oflong term credit, especially from development banks, and theexistence of an increased demand for manufactured products.
6. Investments in organized industries reached Rs. 5,656million from 1960 to 1965, which is 96% of the Five Year Plan target.Private investment represented about three quarters of the total.Investments were somewhat higher in West Pakistan than in EastPakistan, which absorbed about 45% of total investments.

- 20 -
7. Although many companies are not operating at full capacity,and do not have a high degree of technical capacity, profits remainhigh. While some of the difference in profitability from oneindustry to the other represent varying amounts of capital investedper dollar of product, the degree of competition is also a majorfactor. In fact, the mission found that many companies had littlecompetition. This comfortable position is attributed to the smallsize of the market which allows only a limited number of producersand to the protective policy of high duties and quotas, especiallyfor consumer goods industries, which enjoy average tariffs of about50%. Since value added is often comparatively small and importedmaterials and components carry duties of about 10-12%, the marginof protection on domestic consumer goods production is obviouslyclose to 90% on the average.
8. The main factor hindering the full utilization of existingcapacity, the shortage of industrial raw materials, components andspare parts, has been partly removed. The ratio of licensing torequirements has increased in many sectors, sometimes very signifcantly.In 1964, fifty-one items were placed on the free import 'List and donot require import licenses. The list has been continued for thefirst half of 1965 and it is the stated government policy to maintainit within the limits of foreign exchange availability. As a resultof the liberalization policy, some industrial prices have been reduced,sometimes significantly.
9. In many cases, plant layout and material handling do notpermit the most efficient operations. Modern tooling techniques andmethods, production time standards and quality controls are also notful'ly understood by managers. These shortcomings, together withunder-utilization of capacity, have made much of Pakistani industryhigh cost and many companies (except for jute and sometimes for othertextile industries) are clearly not able to compete effectively ininternational markets.
10. Productivity per employee in many of the factories is belownormal standards for comparable industries elsewhere. This is dueto lack of training, not to any inherent inability of the workers toabsorb training and develop advanced industrial skills. The majorityof factory managers complain about the lack of skilled workers andsupervisors. However, a few of the factories have high productivity,with workers turning out products requiring a high degree of skill.
The Private Sector
11. To enable the development of industries in accordance withtheaims of the Second Five Year Plan, in July 1960 an IndustrialInvestment Schedule was established. The total investment targetwas Rs. 2,181 million, but by June 1963 investments of Rs. 3,151million had been sanctioned, 44% above that originally planned.A Revised Industrial Investment Schedule was issued in 1963. It
- 21 -
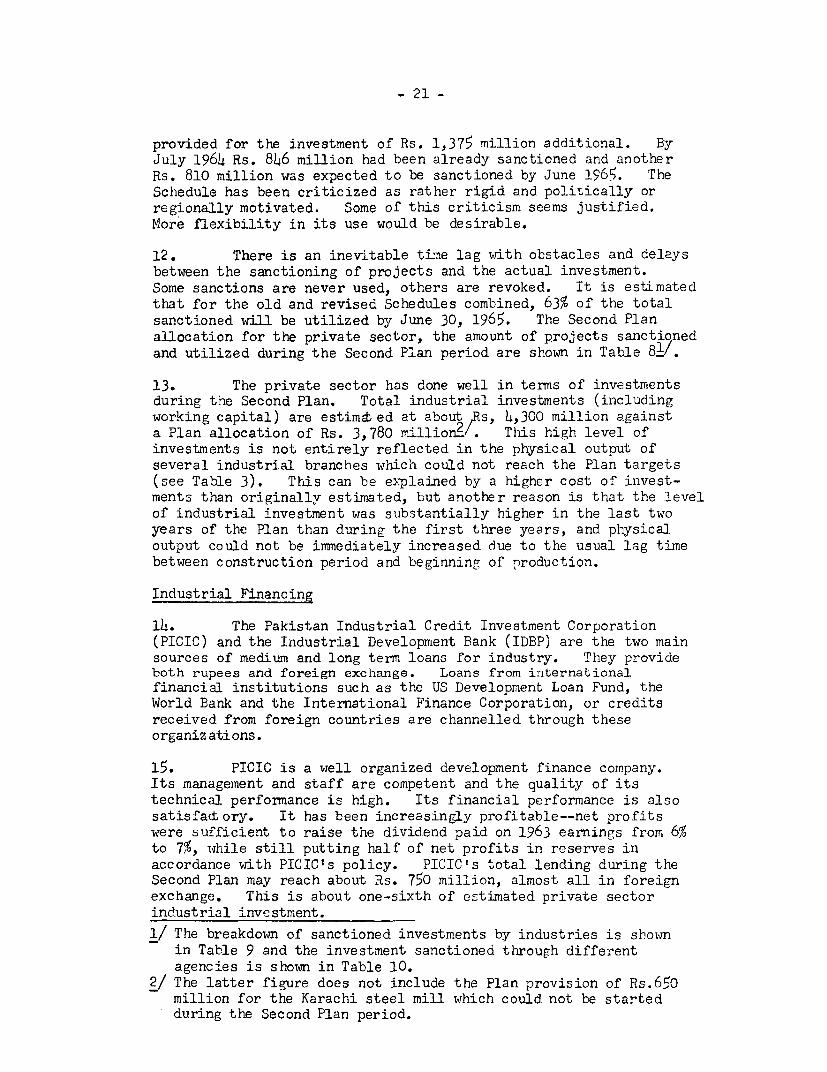
provided for the investment of Rs. 1,375 million additional. ByJuly 1964 Rs. 846 million had been already sanctioned and anotherRs. 810 million was expected to be sanctioned by June 1965. TheSchedule has been criticized as rather rigid and politically orregionally motivated. Some of this criticism seems justified.More flexibility in its use would be desirable.
12. There is an inev-itable time lag with obstacles and delaysbetween the sanctioning of projects and the actual investment.Some sanctions are never used, others are revoked. It is estimatedthat for the old and revised Schedules combined, 63% of the totalsanctioned will be utilized by June 30, 1965. The Second Planallocation for the private sector, the amount of projects sanctio,nedand utilized during the Second P'lan period are shown in Table 81/
13. The private sector has done well in terms of investmentsduring the Second Plan. Total industrial investments (includingworking capital) are estimt ed at about Rs, 4,300 million againsta Plan allocation of Rs. 3,780 milliong'. This high level ofinvestments is not entirely reflected in the physical output ofseveral industrial branches which could not reach the Plan targets(see Table 3). This can be explained by a higher cost of invest-ments than originally estimated, but another reason is that the levelof industrial investment was substantially higher in the last twoyears of the Plan than during the first three years, and physicaloutput could not be immediately increased due to the usual lag timebetween construction period and beginning of production.
Industrial Financing
14. The Pakistan Industrial Credit Investment Corporation(PICIC) and the Industrial Development Bank (IDBP) are the two mainsources of medium and long term loans for industry. They provideboth rupees and foreign exchange. Loans from internationalfinancial institutions such as the US Development Loan Fund, theWorld Bank and the International Finance Corporation, or creditsreceived from foreign countries are channelled through theseorganizations.
15. PICIC is a well organized development finance company.Its management and staff are competent and the quality of itstechnical performance is high. Its financial performance is alsosatisfat ory. It has been increasingly profitable--net profitswere sufficient to raise the dividend paid on 1963 earnings from 6%to 7%, while still putting half of net profits in reserves inaccordance with PICICts policy. PICIC's total lending during theSecond Plan may reach about Rs. 750 mil'lion, almost all in foreignexchange. This is about one-sixth of estimated private sectorindustrial investment.
1/ The breakdown of sanctioned investments by industries is shownin Table 9 and the investment sanctioned through differentagencies is shown in Table 10.
2/ The latter figure does not include the Plan provision of Rs.650million for the Karachi steel mill which could not be startedduring the Second Plan period.
- 22 -
16. Some aspects of PICICI.s performance give cause for unease.Firstly, it has done a relatively small amount of underwriting. Ithas thus become primarily a lending, rather than an investing,institution, considerably restricting its role as a stimulator of thecapital marlct. However, very recently PICIC has become more activein underwriting and equity participations. PICIC should make adetermined effort to increase the financing of share capital, both bydirect subscription and by underwriting. In this connection, thegovernment should not delay its approval of more appropriate stand-byand underwriting commissions, so as to make such activitysufficiently attractive not only to PICIC, but also to other Pakistaniinstitutions which might join PICIC. Secondly, the average scale ofPICIC's operations is quite large, the result in part of the line ofdemarcation between PICIC and IDBP operations established by govern-ment. One consequence of this fact is that PICIC has tended tobecome less active in East Pakistan. Another consequence is thata substantial part of PICIC's operations are closely associated withPakistan's largest industrialists. This situation has created forPICIC the image of an institution designed to help the country'slargest industrialists rather than to stimulate new entrepreneurs.The situation can be corrected if appropriate policies are adopted.
17. The present division between the activities of PICIC andof IDBP should be changed. PICIC should be allowed to make smallerinvestments and IDBP to make larger ones. Reduction of thegovernment-established floor on PICIC's operations to, say,Rs. 500,000, would make it possible for PIC1C to be of greater useto medium scale enterprises. As the scale of enterprises isgenerally smaller in East Pakistan, the lowering of PICIC's minimumcommitment would remove one of the obstacles to PICIC's, as yet,limited activities in that Province. However, government shouldalso try to bring better understanding between PICIC and thePakistan Industrial Development Corporation (PIDC), since the latterhas a very large role in East Pakistan. Reduction of PICIC'slending floor should be accompanied by an increase in IDBP'sceiling, thereby making it possible for IDBP to increase itsprofitability. The new ceiling on IDEP's operations could beestablished around the level of, say, Rs. 2,500,0001/. The effectof this measure would be to increase IDBP's opportunities to makelarge scale, and hence more profitable, loans. As a result ofthese steps, there will be some overlap and competition betweenPICIC and IDBP. The industrial growth of Pakistan has now reacheda stage where two development finance companies can work side byside and have a volume of activity large enough to work on aprofitable basis. However, the prospective competition will beharmful, rather than helpful, to both if prospective clients areallowed to play one against the other, or if one institution lowers
1/ Foreign exchange loans are presently limited to Rs. 1.5 million.
- 23 -
standards of appraisal in order to capture business from the other.Accordingly, an understanding should be reached that neitherinstitution will consider investments in enterprises which havebeen rejected on their merits by the other.
18. It is difficult to appraise with exactitude IDBP'scontribution to the economic growth of Pakistan. IDBP is onlythree and one half years old, many of the projects it has financedare still under construction or in the early stages of operation.However, with total loans of Rs. 754 million from August 1961 toDecember 1964, IDBP is becoming, through the sheer volume of itsoperations, an influential stirnulator of industry and is bound tohave a major impact on industrial development.
19. IDBP has aimed at a wide diffusion of credit andbroadening of the base of industrial ownership. Its activity ishelping create a middle-class of entrepreneurs, especially in EastPakistan. The structure of industrial ownership in East Pakistanis overwhelmingly based on small scale enterprises, for whichmedium and long-term credit is of paramount importance. The sameis true of the less developed areas of West Pakistan.
20. The price of IDBP's rapid growth and its penetration tolevels and areas of enterprise not previously reached by institutionalfinance, have been some important weaknesses in the quality of IDBP'swork and in its financial condition. It is not sufficientlyinsulated from political pressire. The quick development of alarge volume of lending, the special efforts being made in EastPakistan and the small average amount of IDBP's loans have given itthe character of an instrument of political and social policy. Assuch, it is often exposed to pressures, particularly from theProvincial Governments which are charged with responsibility forindustrial affairs. These pressures can be partly counteracted bya strong Board with a clear cut business orientation and by anexperienced professional staff, under tough direction, applyinghigh technical standards in the selection of projects.
21. IDBP has reported significant deferrals and arrears asto principal and interest. An examination of past appraisalssuggests that more loans (perhaps 20% of the portfolio) are likelyto be in default, since the enterprises may not be able to generatethe cash necessary for timely repayment.. IDBP appears to bereluctant to collect loans in arrears or to enforce its security,because of the risk of placing the borrower in bankruptcy, perhapsclosing the enterprise, and attracting critical comment in thecommunity.
22. A principal reason for this high level of defaults andarrears is that IDBP's appraisals still leave much to be desired.It is a consequence of the pressure under which IDBP work to lendrapidly, of the inadequate training of its staff, and of the fact
that effective investment-type appraisal is difficult for thesmall enterprises with which so much of IDBPPs operations areconcerned. IDBP has sought to counteract this situation byplacing great emphasis on security, but strict security and othercovenants are not a satisfactory substitute for judgment based onan assessment of financial and technical merits. Also, securityis of little value if IDBP is lenient in enforcing it. Themission believes that IDBP should decide to act firmly to collectdebts in arrears and to make use of its special powers to enforcesecurity.
23. A second matter of concern is IDBPrs capital structure.IDEP has insufficient equity. Its debt-eouity ratio was about19:1 at the beginning of 1964. This is far in excess of the 5:1ratio allowed in the IDBP ordinance. Moreover, IDBP's reservesare growzing at an inadeouate rate, particularly in the light ofrepayment performance.
Public Financed Sector
2h. Government investment in large scale industries con-templated in the Second Plan was Rs. 1,076 million (of which Rs.448million was for chemical and fertilizer plants). In addition, theSecond Plan made a provision of Rs. 100 million for the creation oflarge industrial estates in both the Provinces to assist theestablishment of industries. Another provision of Rs. 280 millionwas made to assist the development of small industries throughsmall industrial estates and technical assistance. The totalallocation for the public financed sector was Rs. 1,456 million.Actual investments are estimated at Rs. 1,352 million (Table 6).The main shortfall has occurred in investments for small industrieswhich amounted to Rs. 178.7 million against Rs. 280 million in thePlan (Table 7). The program for small industries is running verymuch behind schedule.
25. Most of the investments have been made by the PIDCwhich have spent Rs. 1,015 million, 70% in East Pakistan. Thereason for larger investments in East Pakistan is because thegovernment considered that the desired level of industrial invest-ment could not be reached by relying only on the limited financialand technical capacity of local private investors. The Wv4estPakistan PIDC has been much less active because the private sectoris rnuch more developed in that Province. During the first fouryears of the Plan, seven projects have been completed by PIDC inEast Pakistan (4 jute mills, 1 sugar mill, one pharmaceuticalfactory and one fertilizer factory). Most of the major schemesowned by EPIDC have a high utilization of capacity, but their costsare rather high and the return on sales and/or 4-nvestriient is lowE/by Pakistan standards. EPIDC itself recognizes that it has stillto make substantial progress to become an efficient organization.
1/ With the exception of the E?IDC jute mills.
- 25 -
However, the mission feels that, especially in East Pakistan,PIDC has played a useful role in promoting new investments in
some fields (such as fertilizers) where private investors werenot forthcoming, at least at the early stage.
26. It is the declared policy of government to disinvestthe PIDC-owned plants if and when private enterprise becomesinterested in the industries offered for sale. However, dis-investments have been relatively small and perhaps the PIDCshould be less reluctant to sell their successful schemes tothe private sector.
TARGETS OF THE THIRD PLAN
27. The industrial sector of the Plan had been programmedonly in a general way when the mission visited Pakistan. InWest Pakistan an inventory had been made of major industrialprojects underway or in the planning stage. In East Pakistanthis analysis was still in progress. A few preliminary studieshave been undertaken for some projects in the chemical andengineering sectors. This work had not yet provided a sub-stantial basis for Plan projections.
28. Based on general projections given to the mission,production by industries producing investment goods and inter-mediate products would increase at 10.6% per annum compared with7.9% for consumer's goods industries. The share of the formerin total industrial output would rise from about 33% in 196h/65to about 36% in 1969/70. The manufacturing sector as a wholewould grow by 9.5% per annum versus 9.2% per annum during theSecond Plan. Large scale industry would grow by 12.1% perannum compared to 13.3% (see Table 10 a). The contribution ofindustry to economic growth during the Third Plan would be about18% as compared i%ith 20%5 in the Second Plan.
29. It is assumed that the relative share of factoryindustries in the total manufacturing output would increase atthe expense of cottage and other small scale industries. Thoughthere would be a higher growth than in the past in the latteractivities (by about 3% a year versus 2.6% during the Second Plan),the share of small scale industries would decline from about 32%of total industry in 1964/65 to 24% in 1969/70. However, theproductivity assumption for small industry are not specificallystated. The basic data available for estimating value added inthis sub-sector are extremely weak. At the present stage, it isdifficult to say whether the small scale industries are expandingor shrinking. The labor productivity in the urban smallindustries has probably increased slightly, but the relative shareof small industries in the total labor force may have decreased.The mission recommends that necessary benchmark data should becollected through a quinquennial census of small and o ttageindustries in both the Provinces.
- 26 -
30. The employment impact of the proposed expansion infactory industries is still under study. It is assumed thatthe measures for employment promotion in organized industriesin the urban areas will continue and include fuller utilizationof existing industrial capacity by the introduction of multipleshifts and removing of handicaps such as non-availability of rawmaterials and spare parts. However, in some industries such aspetrochemicals and steel, it is necessary to use high productivitytechniques. Since the Third Plan stresses the need to developmore capital intensive industries it will be difficult to reconcilethe need to provide more industrial employment opportunities,especially in the urban areas uwith the introduction of industrieswhich are not labor intensive.
Evaluation of Targets
31. Of the total increase of Rs. 3,089 million (see Table11) in value added in manufacturing during the Third Plan, thePlanners expect Rs. 1,954 million to be absorbed by the domesticmarket and Rs. 1,135 to be exported. Rs. 900 million of thedomestic absorption would be import substitution and Rs. 1,054million normal increase in domestic demand. Thus, about two-thirds of the increased industrial production will be directlyrelated to the "international" sector of the economy, i.e.export and import substitution, emphasizing the need forgreater attention to Pakistan's competitive position.
Increase in Exports in Relation to Domestic Demand
32. The above data indicate that 63% of the increase inindustrial production is projected to meet increases in domesticdemand and 37% is for exports. The percentage for the domesticmarket was 87% during the Second Plan. The domestic absorptionof manufactured goods was calculated as a residual between totalplanned increase in industrial output and export projections formanufactures which, in the Plan model, are treated as an independentvariable. This should, of course, be checked by independentestimates of domestic demand for various types of products, butthis had still to be done when the mission was in Pakistan. Suchestimates raise many practical difficulties, and are necessarilysubject to a wide margin of error. An independent check by themission on prospects for exports of manufactured goods by maintypes of industry suggests that the necessary increase indomestic absorption in relation to the production target is under-estimated and that the domestic market would have to take 72%rather than 63% of the increase in industrial production (Table 11).
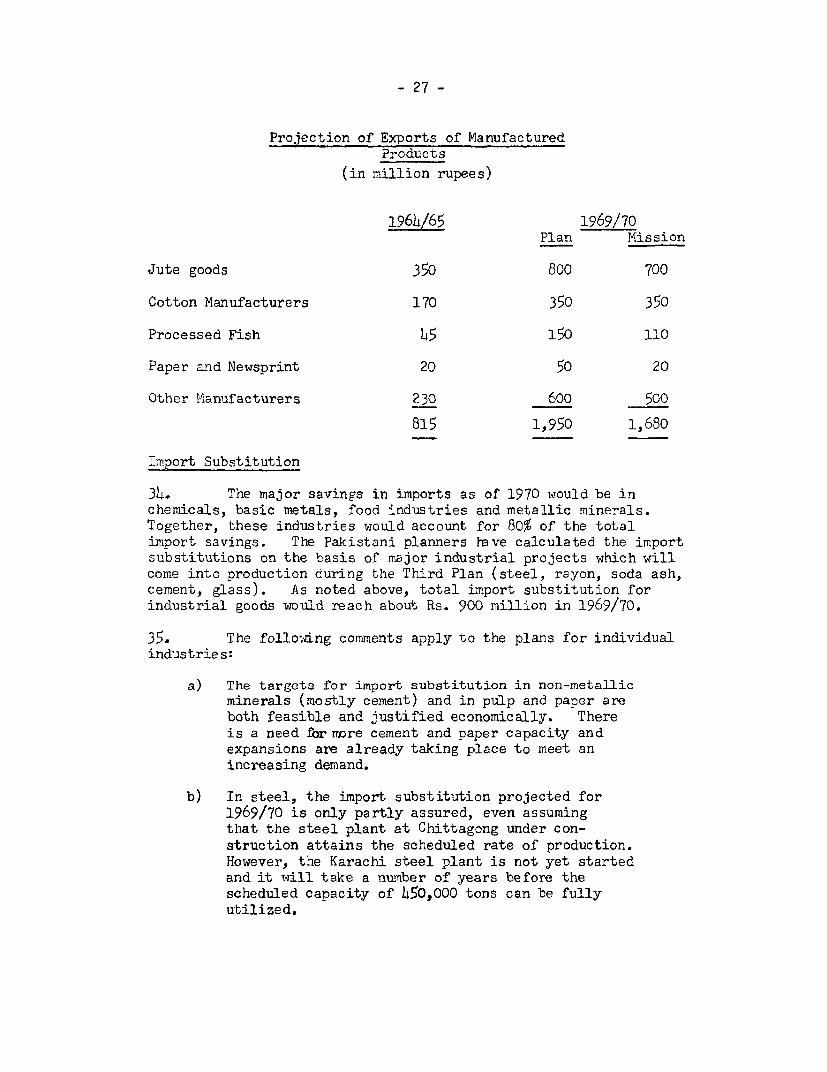
33. The projected exports of manufactured products, accordingto the Plan and by the mission, are summarized in the followingtable:
- 27 -
Projection of Exports of ManufacturedProducts
(in million rupees)
1964/65 1969/70Plan Mission
Jute goods 350 800 700
Cotton Manufacturers 170 350 350
Processed Fish 4 150 120
Paper and Newsprint 20 50 20
Other Manufacturers 230 600 500
815 1,950 1,680
Import Substitution
34. The major savings in imports as of 1970 would be inchemicals, basic metals, food industries and metallic minerals.Together, these industries would account for 80% of the total
import savings. The Pakistani planners 1-ve calculated the importsubstitutions on the basis of major industrial projects which willcome into production during the Third Plan (steel, rayon, soda ash,cement, glass). As noted above, total import substitution forindustrial goods would reach about Rs. 900 million in 1969/70.
35. The following comments apply to the plans for individualindustries:
a) The targets for import substitution in non-metallicminerals (mostly cement) and in pulp and paper areboth feasible and justified economically. Thereis a need for more cement and paper capacity andexpansions are already taking place to meet anincreasing demand.
b) In steel, the import substitution projected for1969/70 is only partly assured, even assumingthat the steel plant at Chittagong under con-struction attains the scheduled rate of production.However, the Karachi steel plant is not yet startedand it will take a number of years before thescheduled capacity of 45O,000 tons can be fullyutilized.
- 28 -
c) Rightly no provision has been made for importsubstitution by new projects to be completedor started during the Plan in the field oftransport equipment, heavy electricals andmachinery (heavy engineering and machine tools).These projects consitute either pure assemblyoperations with low foreign exchange savings(e.g. transport equipment, electrical machinery)or are not likely to start production during thePlan (i.e. machine tools factories).
d) It is not clear how much of the import sub-stitution projected for chemicals for 1970 iscovered by projects already in operation orunder construction. One item is caustic soda,of which production has started in Lahore.There are projects for petrochemicals based onthe Mari natural gas field and/or utilizing rawmaterials supplied by the Karachi refinery.The economics of manufacturing many of thechemical items suggested are rather doubtfulbecause of the smallness of the local market.Hence, very great efforts will be required toreach the targets set for 1970.
36. Despite the mission's reservations on some of theseindustries, we feel that the target of Rs. 900 million of importsubstitution may occur during the Third Plan, though some of theprojects suggested will not be ready in time to yield importsubstitution by 1969/70. Since import substitution will occuronce the plant is built, whether or not it is economic, one canspeak wJith greater assurance about import substitution capabilitythan about exports.
37. A question that remains is whether the mission's lessoptimistic view of Pakistan's export prospects than those heldby the Planning Commission casts doubt on the feasibility of thegrowth targets in manufacturing. Since the items on which wehave doubts (jute goods and processed fish) probably have a some-what inelastic demand in Pakistan, this would seem to be the case.However, the magnitudes are not large enough to be of major con-cern in relation to total output.
Volume of Investment
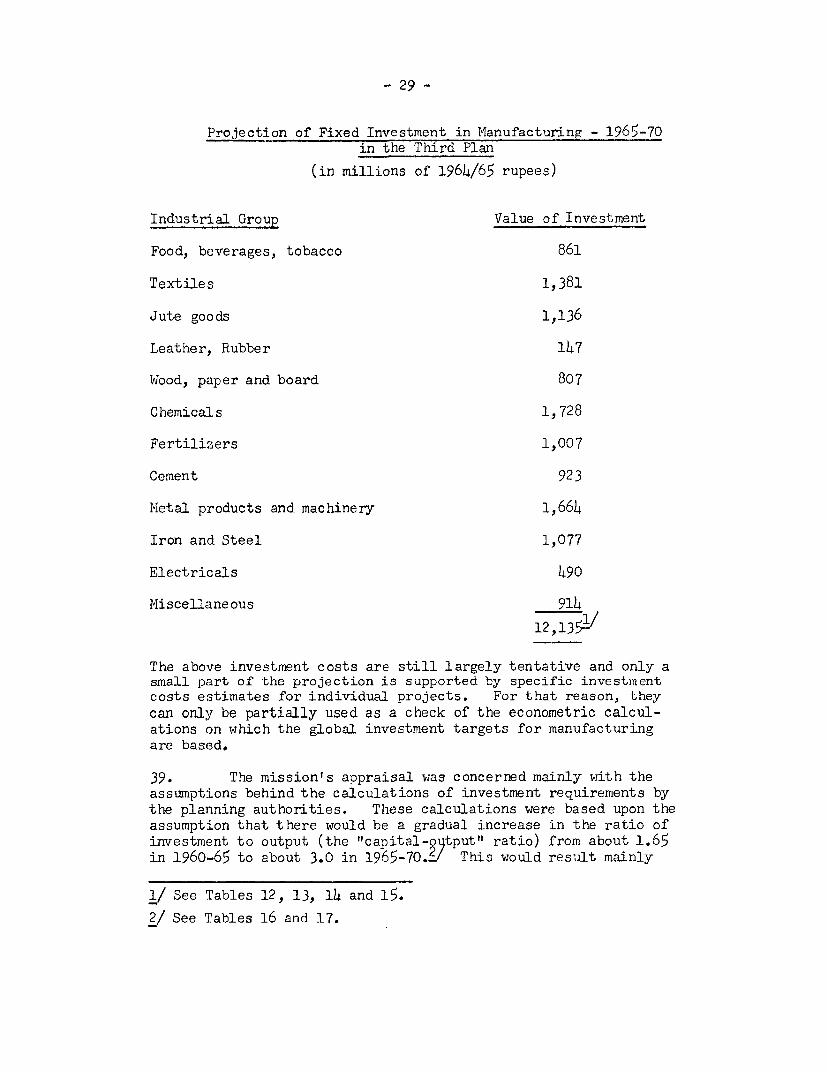
38. A summary of fixed investment in manufacturing asprojected in the Plan is presented in the following table:
- 29 -
Projection of Fixed Investment in Manufacturing - 1965-70in the Third Plan
(in millions of 1964/65 rupees)
Industrial Group Value of Investment
Food, beverages, tobacco 861
Textiles 1,381
Jute goods 1,136
Leather, Rubber 147
Wood, paper and board 807
Chemicals 1,728
Fertilizers 1,007
Cement 923
Metal products and machinery 1,664
Iron and Steel 1,077
Electricals 490
Miscellaneous 914
12,135-/
The above investment costs are still largely tentative and only asmall part of the projection is supported by specific investmentcosts estimates for individual projects. For that reason, theycan only be partially used as a check of the econometric calcul-ations on which the global investment targets for manufacturingare based.
39. The mission's appraisal was concerned mainly with theassumptions behind the calculations of investment requirements bythe planning authorities. These calculations were based upon theassumption that there would be a gradual increase in the ratio ofinvestment to output (the "capital-o itput" ratio) from about 1.65in 1960-65 to about 3.0 in 1965-70.~/ This would result mainly
1/ See Tables 12, 13, 14 and 15.2/ See Tables 16 and 17.
- 30 -
from more capital intensive investments. The mission agrees thatthe capital-output ratio is likely to increase during the ThirdPlan. However, the mission also believes that a ratio of 3.0is very much on the high side. There is evidence of excesscapacity in the established Pakistani industries and the progressiveimport liberalization should help to increase the utilization factorand to improve somewhat the ratio of investment to output, eventhough some Third Plan capital intensive investments with a longergestation period will have a high utilization factor only by theend of the Plan. But the percentage of "'capital intensive"indeatries is not likely to be so much higher during the Third Planthan it was during the Second Plan as to justify such a steepincrease of the capital-output ratio. This percentage wasestimated at 47% in 1960-65 and is supposed to reach 58% in 1965-70(see Table 9). The mission feels that there is a tendency to asystematic overvaluation of the investment requirements for fixedcapital in the industrial field, perhaps by as much as 25%.
40. Since it is important to arrive at a reasonably correctview of the need for industrial investments (particularly from thepoint of view of the balance of payments outlook and the need forindustrial finance), the mission reconmends that a critical reviewbe made of the basic assumptions underlying the investment costestimates, but, more important, that an attempt be made to engagethe cooperation of industrial associations and major firms inrevising these estimates, that more weight be given in theseestimates to the peculiar circumstances currently facing eachindustry and relatively less weight to econometric calculations,useful as the latter are for checking.
Industrial Financing
41. The problem of forecasting the financing needs of theindustrial sector is very comDlex, and has been tackled only in avery preliminary manner in the Plan. The proposed sources offinancing industrial investment during the Third Plan arepresented in the following table:
Projection of Financing of Private Investment inManufacturing - 1965-70(in millions of rupees)
Category Second Plan Third Plan1960-1965 1965 -1970
Total Investment 3,376 8,418Estimated Source of Financing: % %
Retained earnings 1,256 37.2 3,118 37.0Capital increases 1,042 30.9 3,000 35.6Development Banks (PICIC, IDBP) 1,078 31.9 2,300 27.4
100.0 100.0
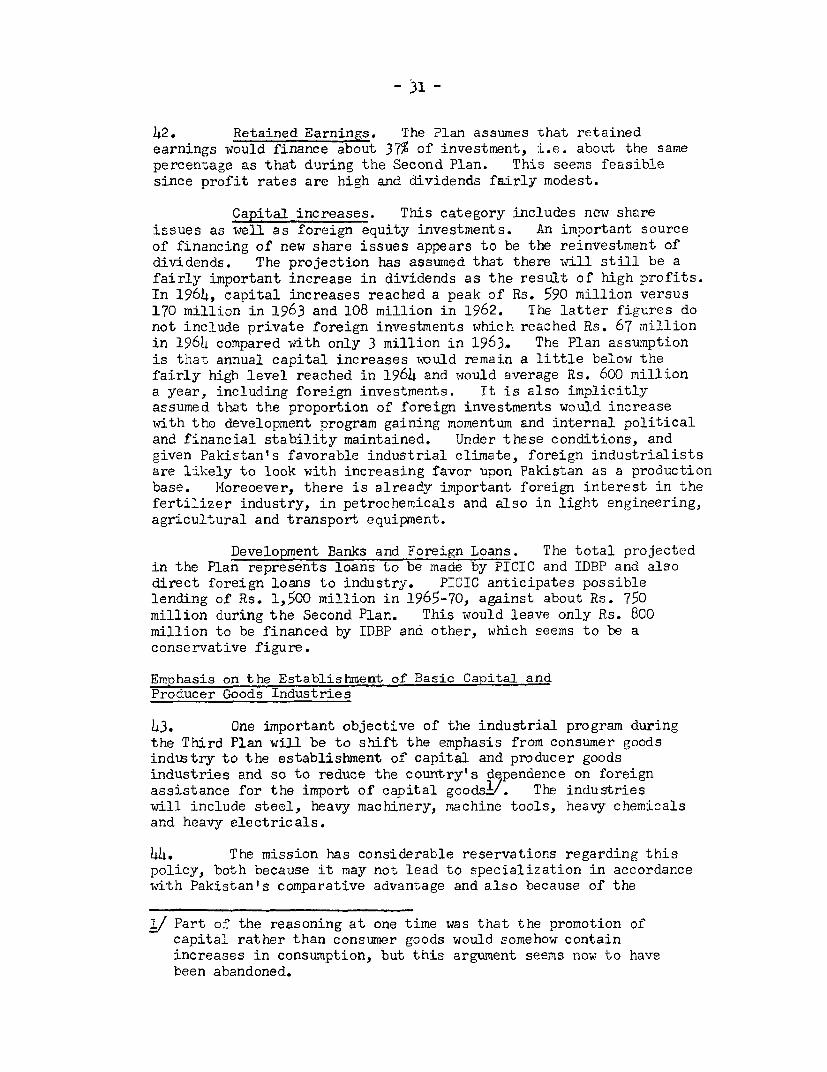
- 31 -
42. Retained Earnings. The Plan assumes that retainedearnings would finance about 37% of investment, i.e. about the samepercentage as that during the Second Plan. This seems feasiblesince profit rates are high and dividends fairly modest.
Capital increases. This category includes new shareissues as well as foreign equity investments. An important sourceof financing of new share issues appears to be the reinvestment ofdividends. The projection has assumed that there will still be afairly important increase in dividends as the resul-t of high profits.In 1964, capital increases reached a peak of Rs. 590 million versus170 million in 1963 and 108 million in 1962. The latter figures donot include private foreign investments which reached Rs. 67 millionin 1964 compared with only 3 million in 1963. The Plan assumptionis that annual capital increases would remain a little below thefairly high level reached in 1964 and would average Rs. 600 milliona year, including foreign investments. It is also implicitlyassumed that the proportion of foreign investments would increasewith the development program gaining momentum and internal politicaland financial stability maintained. Under these conditions, andgiven Pakistan's favorable industrial climate, foreign industrialistsare likely to look with increasing favor upon Pakistan as a productionbase. Nv1oreoever, there is already important foreign interest in thefertilizer industry, in petrochemicals and also in light engineering,agricultural and transport equipment.
Development Banks and Foreign Loans. The total projectedin the Plan represents loans to be made by PICIC and IDBP and alsodirect foreign loans to industry. PICIC anticipates possiblelending of Rs. 1,500 million in 1965-70, against about Rs. 750million during the Second Plan. This would leave only Rs. 800million to be financed by IDBP and other, which seems to be aconservative figure.
Emphasis on the Establishment of Basic Canital andProducer Goods Industries
43. One important objective of the industrial program duringthe Third Plan will be to shift the emphasis from consumer goodsindustry to the establishment of capital and producer goodsindustries and so to reduce the country's dqpendence on foreignassistance for the import of capital goods&/. The industrieswill include steel, heavy machinery, machine tools, heavy chemicalsand heavy electricals.
44. The mission has considerable reservations regarding thispolicy, both because it may not lead to specialization in accordancewith Pakistan's comparative advantage and also because of the
1/ Part of the reasoning at one time was that the promotion ofcapital rather than consumer goods would somehow containincreases in consumption, but this argument seems now to havebeen abandoned.
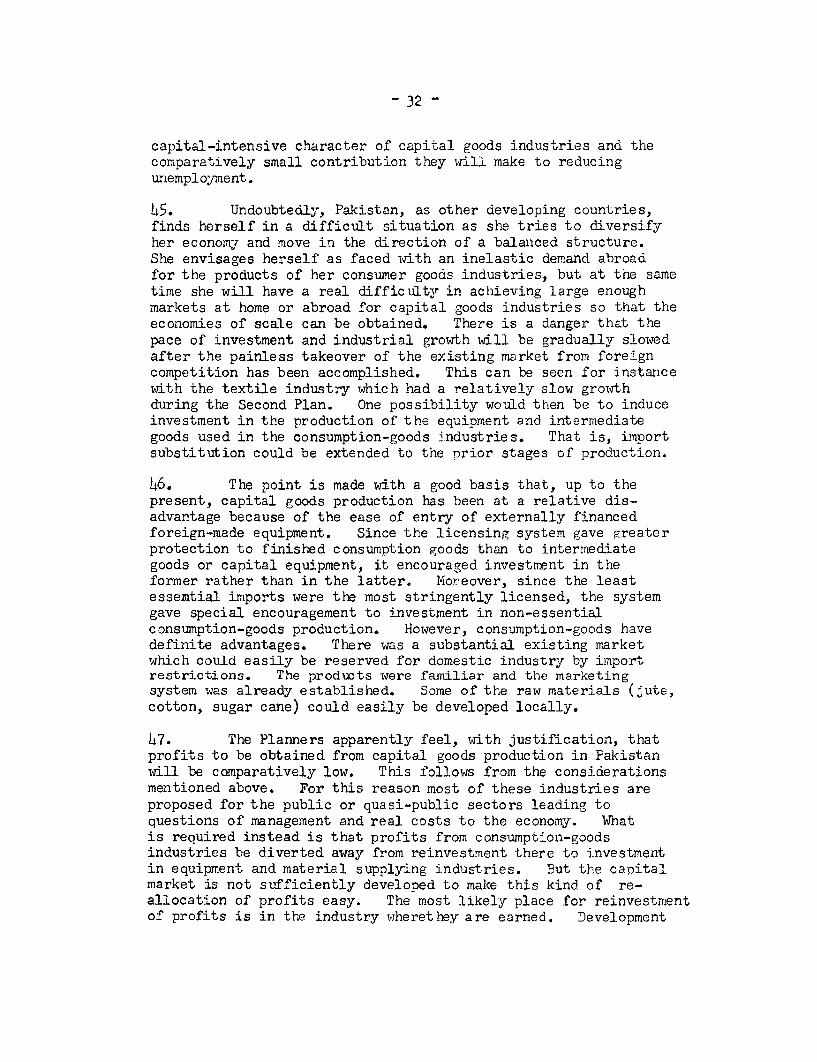
- 32 -
capital-intensive character of capital goods industries and thecomparatively small contribution they will make to reducingunemployment.
45. Undoubtedly, Pakistan, as other developing countries,finds herself in a difficult situation as she tries to diversifyher economyi and move in the direction of a balaniced structure.She envisages herself as faced with an inelastic demand abroadfor the products of her consumer goods industries, but at the sametime she will have a real difficilty in achieving large enoughmarkets at home or abroad for capital goods industries so that theeconomies of scale can be obtained. There is a danger that thepace of investment and industrial growth will be gradually slowedafter the painless takeover of the existing market from foreigncompetition has been accomplished. This can be seen for instancewith the textile industry which had a relatively slow growthduring the Second Plan. One possibility would then be to induceinvestment in the production of the equipment and intermediategoods used in the consumption-goods industries. That is, importsubstitution could be extended to the prior stages of production.
46. The point is made with a good basis that, up to thepresent, capital goods production has been at a relative dis-advantage because of the ease of entry of externally financedforeign-made equipment. Since the licensing system gave greaterprotection to finished consumption goods than to intermediategoods or capital equipment, it encouraged investment in theformer rather than in the latter. Yoreover, since the leastessential imports were the most stringently licensed, the systemgave special encouragement to investment in non-essentialconsumption-goods production. However, conslumption-goods havedefinite advantages. There was a substantial existing marketwhich could easily be reserved for domestic industry by importrestrictions. The products were familiar and the marketingsystem was already established. Some of the raw materials (Jute,cotton, sugar cane) could easily be developed locally.
47. The Planners apparently feel, with justification, thatprofits to be obtained from capital goods production in Pakistanwill be comparatively low. This follows from the considerationsmentioned above. For this reason most of these industries areproposed for the public or quasi-public sectors leading toquestions of management and real costs to the economy. Whatis reouired instead is that profits from consumption-goodsindustries be diverted away from reinvestment there to investmentin equipment and material supplying industries. But the canitalmarket is not sufficiently developed to malke this kind of re-allocation of profits easy. The most likely place for reinvestmentof profits is in the industry wherethey are earned. Development
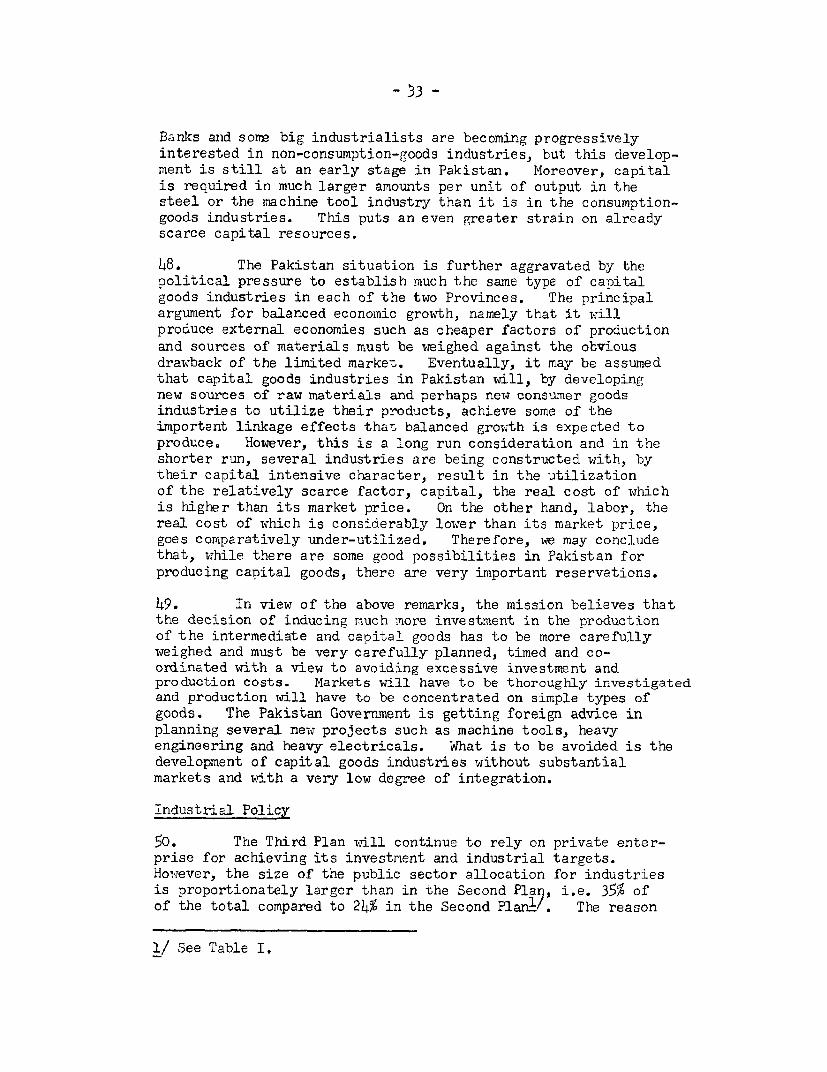
Banks and sormr big industrialists are becoming progressivelyinterested in non-consumption-goods industries, but this develop-ment is still at an early stage in Pakistan. Moreover, capitalis required in much larger amounts per unit of output in thesteel or the machine tool industry than it is in the consumption-goods industries. This puts an even greater strain on alreadyscarce capital resources.
48. The Pakistan situation is further aggravated by thepolitical pressure to establish much the same type of capitalgoods industries in each of the two Provinces. The principalargument for balanced economic growth, namely that it willproduce external economies such as cheaper factors of productionand sources of materials must be weighed against the obviousdrawback of the limited market. Eventually, it may be assumedthat capital goods industries in Pakistan will, by developingnew sources of raw materials and perhaps new consumer goodsindustries to utilize their products, achieve some of theimportant linkage effects that balanced growth is expected toproduce. However, this is a long run consideration and in theshorter run, several industries are being constructed with, bytheir capital intensive character, result in the utilizationof the relatively scarce factor, capital, the real cost of whichis higher than its market price. On the other hand, labor, thereal cost of which is considerably lower than its market price,goes comparatively under-utilized. Therefore, we may concludethat, while there are some good possibilities in Pakistan forproducing capital goods, there are very important reservations.
49. In view of the above remarks, the mission believes thatthe decision of inducing much more investment in the productionof the intermediate and capital goods has to be more carefullyweighed and must be very carefully planned, timed and co-ordinated with a view to avoiding excessive investment andproduction costs. Markets will have to be thoroughly investigatedand production will have to be concentrated on simple types ofgoods. The Pakistan Government is getting foreign advice inplanning several new projects such as machine tools, heavyengineering and heavy electricals. What is to be avoided is thedevelopment of capital goods industries without substantialmarkets and with a very low degree of integration.
Industrial Policy
50. The Third Plan will continue to rely on private enter-prise for achieving its investment and industrial targets.However, the size of the public sector allocation for industriesis proportionately larger than in the Second Plar, i.e. 35% ofof the total compared to 24% in the Second Plan1/. The reason
1/ See Table I.
- 34 -
given is that there is a "need for accelerating the pace ofindustrialization in East Pakistan where private capital orinitiative is not adequate". As a result, in East Pakistan theshare of public investments in total industrial investments wouldincrease from 36% in the Second Plan to 44% in the Third Plan.But government industrial investments in West Pakistan would alsosubstantially incre.se, i.e. from 12% in the Second Plan to 23%in the Thiird Plan.!/
51. However, there is a special problem in East Pakistan.Without substantial increases in agricultural production, anyattempt to accelerate industrialization is likely to be frustratedby shortages of food and raw materials. But on the other hand,living conditions in East Pakistan overpopulated agriculturecannot improve significantly (in the absence of large-scaleemigration) until a far greater proportion of industrial invest-ment is allocated to that Province.
52. Most of the private investment in East Pakistan willnot be local; the capitalist enterprises in East Pakistan mainlybelong to West Pakistanis. One curious result has been thatsome East Pakistani businessmen, fearing anything that will maketheir powerful rivals still stronger, have opposed the demands byWest Pakistani industrialists that the government limit itself toplanning, leaving the implementations of the plans to the privatesector. In fact, the potential investment capaclty of the privatesector in the East Wing is unknown. Some industries (such as thejute industry) have shown high rates of return and actual privateinvestment during the Second Plan seems to have been about 20%above Plan targets. However, although this would suggest thatincreasing investments can be expected under the new Plan, themission beli ves that doubling the level of private industrialinvestmentsz over the next five years will prove very difficult.One of the weaknesses of the private sector in East Pakistanremains the persistent lack of skills and entrepreneurship andanother problem is to induce businessmen to shift from real estateand trade to the establishment of new industrial ventures.
53. In order to give to East Pakistan a larger share inindustrial investments, the new Plan allocates a very substantialamount to the Industrial Development Corporation (EPIDC)3 .Aside from the fact that EPIDC still needs strengthening of
/ Although two-thirds of public investment in industry for theSecond Plan went to the East (the percentage would remain aboutthe same for the Third Plan), two-thirds of the far greatervolume of private investment went West. For the Third Plan, itis assumed that at least 45% of total private investment wouldgo East. Combined with a much larger public investment, it isofficially hoped that this would give the East Wing a slightedge (Rs. 6,770 million versus Rs.5,980 million in West Pakistan).
2/ From Rs. 1.8 billion in 19060-65 to Rs. 3.8 billion in 1965-70.
j The West Pakistan Industrial Development Corporation has alsoobtained a substantial allocation.

management, a question mark is the availability of public funds forPIDC since the latter has not been able to accuiaulate reserves inthe last years. The mission was informed that government considersthat the allocation to the "public sector" should in fact cover anumber of projects in which EPIDC would have some participation, butwhich could be also financed by development banks, domestic and/orforeign private investors and the general public. The missionsupports that approach. Those public sector schemes of the ThirdPlan in which domestic or foreign comDanies have an interest shouldbe set up under such arrangements whenever possible. Severalinvestors have already expressed interest in new projects includedin the public sector. As an example, the petrochemical complexes,the fertilizer projects, the production of insecticides andpesticides, the streptomycin scheme and perhaps the machine toolscheme could fall into the category of joint ventures. For certainprojects which require skill and know-how currently not availablein the country and in which the government would prefer not to haveforeign equity participation, the use of management contracts withescalated incentive bonuses tied to profits and payable in a hardcurrency should be tried. Of course, these contracts would havespecific terminations adjusted to the nature of the industry.Such an arrangement has several advantages: it reduces the currentoutflow of foreign exchange that would normally be required forconsultants and it provides the management with a direct incentiveto optimize profits. The presence of skilled managenent on anincentive contract of a fixed duration will also make the schemlemore bankable and attractive to local capital for equity participationand foreign capital for non-equity (based on long term loan)financing.
54. Government is still working on the future allocation forindustry in the public sector. The mission hopes that the `_jialallocation will clearly show the projects which are intended to) befinanced by joint ventures, and will indicate the amount of EPIDCparticipation in such ventures. Then the total amount of fundsearmarked for government investments in industry could be sub-stantially reduced.
Conclusions
55. The mission is generally satisfied with the industrialprogram in terms of the projected overall growth rate of about 9%per annum which is consistent with the growth registered duringthe Second Plan. However, the mission believes that the magnitudeof industrial investments in the Plan is overestimated to achievethis growth target. The mission has also some reservationsregarding the possibility of raising investments in East Pakistanto the projected high level in such a short period of time. Themission recommends that a critical review be made of the basicassumptions underlying the investment costs estimates, but moreimportant that an attempt be made to engage the cooperation of theprivate sector in revising estimates, so that more weight could begiven to the peculiar circumstances currently facing industry ineach Province.

Table 1
Summary of Allocation for the Indu3tries Sector Duringthe Second and the Third Plan
(million rupees)
(1) (2) Proposed Third Pla
Second Plan Investment Targets Second Plan stimated Investrent (ll)cationr3
Public Private Total Public Private Total Public Private Total
(4.)East Pakistan 849.0 1349.0 2198.0 903.2 1623.1 2526.3 2970 3800 6770
West Pakistan 558.4 3081.0 3639.4 356.6 2681.3 3037.9 1362 4618 5980
Center 52.6 - 52.6 91.8 - 91.8 300 - 300
Total 1460.0 4430.0 4890.0 1351.6 4304.4 5656.0 4632 8418 13050
Estimated Totalin 1964/65 prices 1620.6 4917.3 6537-9 1500.3 4777.9 6278.2 4632 8418 13050
(1) In 1959/60 prices.(2) In current prices.(3) In 1964/65 prices.(4) Including Rs. 344 million for work;-ng capital.(5) Including Rs. 584 million for working capital.
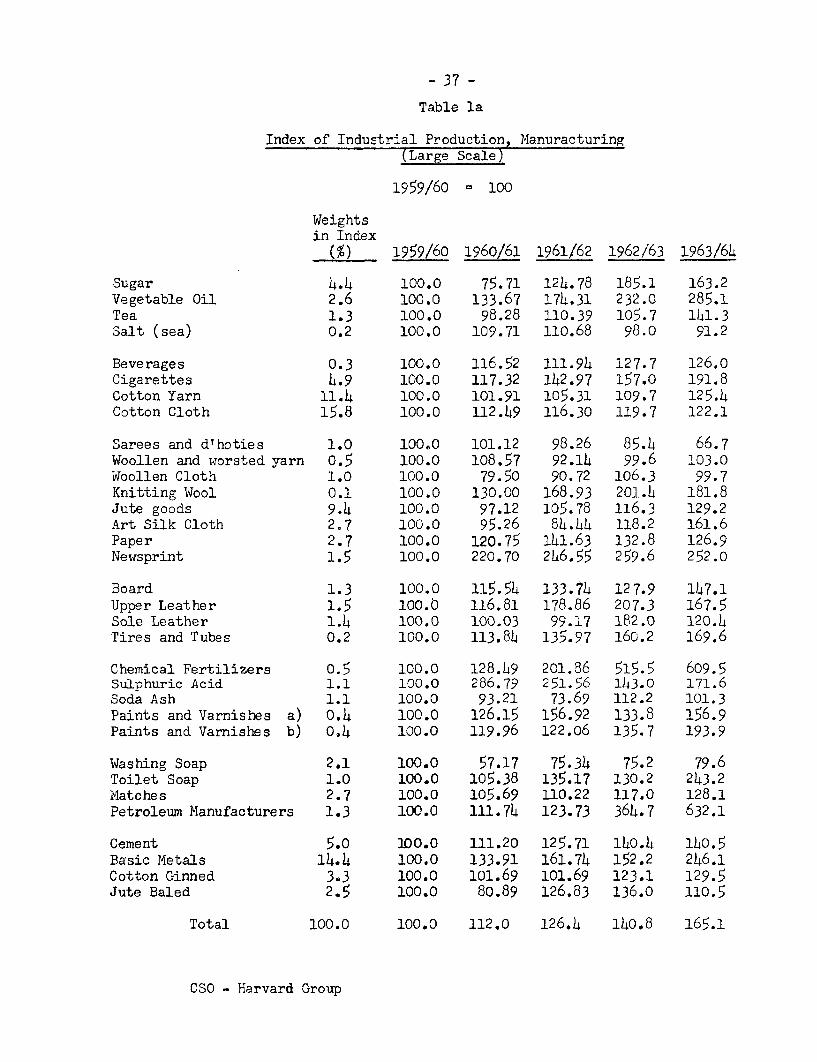
- 37 -
Table la
Index of Tndustrial Production, Manuracturing(Large Scale)
1959/60 = 100
Weightsin Index(%) 1959/60 1960/61 1961/62 1962/63 1963/6h
Sugar 4.4 100.0 75.71 124.78 185.1 163.2Vegetable Oil 2.6 100.0 133.67 174.31 232.0 285.1Tea 1.3 100.0 98.28 110.39 105.7 141.3Salt (sea) 0.2 100.0 109.71 110.68 98.0 91.2
Beverages 0.3 100.0 116.52 111.94 127.7 126.0Cigarettes 4.9 100.0 117.32 142.97 157.0 191.8Cotton Yarn 11.4 100.0 101.91 105.31 109.7 125.4Cotton Cloth 15.8 100.0 112.49 116.30 119.7 122.1
Sarees and drhoties 1.0 100.0 101.12 98.26 85.4 66.7Woollen and worsted yarn 0.5 100.0 108.57 92.14 99.6 103.0Woollen Cloth 1.0 100.0 79.50 90.72 106.3 99.7Knitting Wool 0.1 100.0 130.00 168.93 201.4 181.8Jute goods 9.4 100.0 97.12 105.78 116.3 129.2Art Silk Cloth 2.7 100.0 95.26 84.44 118.2 161.6Paper 2.7 100.0 120.75 i4l.63 132.8 126.9Newsprint 1.5 100.0 220.70 246.55 259.6 252.0
Board 1.3 100.0 115.54 133.74 127.9 147.1Upper Leather 1.5 100.0 116.81 178.86 207.3 167.5Sole Leather 1.4 100.0 100.03 99.17 182.0 120.4Tires and Tubes 0.2 100.0 113,84 135.97 16o.2 169.6
Chemical Fertilizers 0.5 100.0 128.49 201.86 515.5 609.5Sulphuric Acid 1.1 100.0 286.79 251.56 143.0 171.6Soda Ash 1.1 100.0 93.21 73.69 112.2 101.3Paints and Varnishes a) 014 100.0 126.15 156.92 133.8 156.9Paints and Varnishes b) 014 100.0 119.96 122.06 135.7 193.9
Washing Soap 2.1 100.0 57.17 75.34 75.2 79.6Toilet Soap 1.0 100.0 105.38 135.17 130.2 243.2Matches 2.7 100.0 105.69 110.22 117.0 128.1Petroleum Manufacturers 1.3 100.0 111.74 123.73 364.7 632.1
Cement 5.0 100.0 111.20 125.71 140.4 140.5Basic Metals 14.4 100.0 133.91 161.74 152.2 246.1Cotton Ginned 3,3 100.0 101.69 101.69 123.1 129.5Jute Baled 2.5 100.0 80.89 126.83 136.0 110.5
Total 100.0 100.0 112.0 126.4 140.8 165.1
CSO - Harvard Group

- 38 -
Table 2
Industrial Growth (1959/6o - 1964/65)
I. Value added (Rs. million) in 1959/60 pricesGrowthduring
1959/60 1960/61 1961/62 1962/63 1963/64 1964/65 Second_______ _______ (est) Plan
Large andmedium scaleindustry 1,765 1,977 2,231 2,485 2,914 3,793 + 86.6%
Small scaleindustry 1,365 1,h02 1,439 1,477 1,515 1,55h + 13.8%
Total 3,130 3,379 3,670 3,962 4,429 4,847 + 54.9%
II. Growth rates %
Large andmedium scaleindustry 12.0 12.8 11.4 17.2 13.0 13.3
Small scaleindustry 2.7 2.6 2.6 2.5 2.6 2.6
Total 8.0 8.6 8.o 11.8 9.4 9.2
Note: The Second Plan target was an increase of 65% in largescale output and of 25% in small scale industry. Totalmanufacturing was then assumed to increase by 50.2%from 1959/60 to 196h/65.
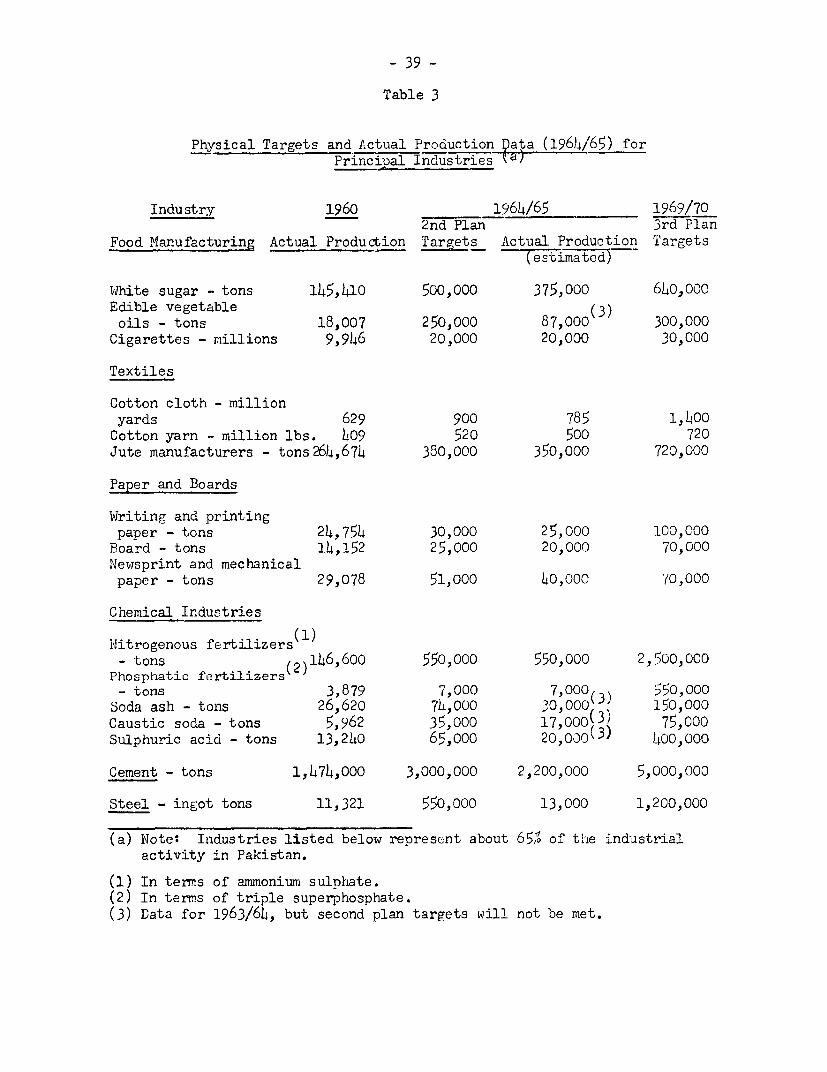
- 39 -
Table 3
Physical Targets and Actual Production Data (1964/65) forPrincipal Industries 'a)
Industry 1960 1964/65 1969/702nd Plan 3rd Plan
Food Manufacturing Actual Production Targets Actual Production Targets(es-timated)
White sugar - tons 145,410 500,000 375,000 640,000Edible vegetable (3)oils - tons 18,007 250,000 87,000 300,000
Cigarettes - millions 9,946 20,000 20,000 30,000
Textiles
Cotton cloth - millionyards 629 900 785 1,L00Cotton yarn - million lbs. 409 520 500 720Jute manufacturers - tons264,674 330,000 350,000 720,000
Paper and Boards
Writing and printingpaper - tons 24,754 30,000 25,000 100,000Board - tons 1h,152 25,000 20,000 70,000Newsprint and mechanicalpaper - tons 29,078 51,000 40,000 70,000
Chemical Industries
Nitrogenous fertilizers(1)- tons (2)146,600 550,000 550,000 2,500,000
Phosphatic fertilizers- tons 3,879 7,000 7,000 550,000
Soda ash - tons 26,620 74,000 0,000 150,000Caustic soda - tons 5,962 35,000 17,000(3 75,000Sulphuric acid - tons 13,240 65,000 20,0O0(3) 400,000
Cement - tons 1,474,000 3,000,000 2,200,000 5,000,000
Steel - ingot tons 11,321 550,000 13,000 1,200,000
(a) Note: Industries listed below represent about 65i' of the industrialactivity in Pakistan.
(1) In terms of ammonium sulphate.(2) In terms of triple superphosphate.(3) Data for 1963/64, but second plan targets will not be met.
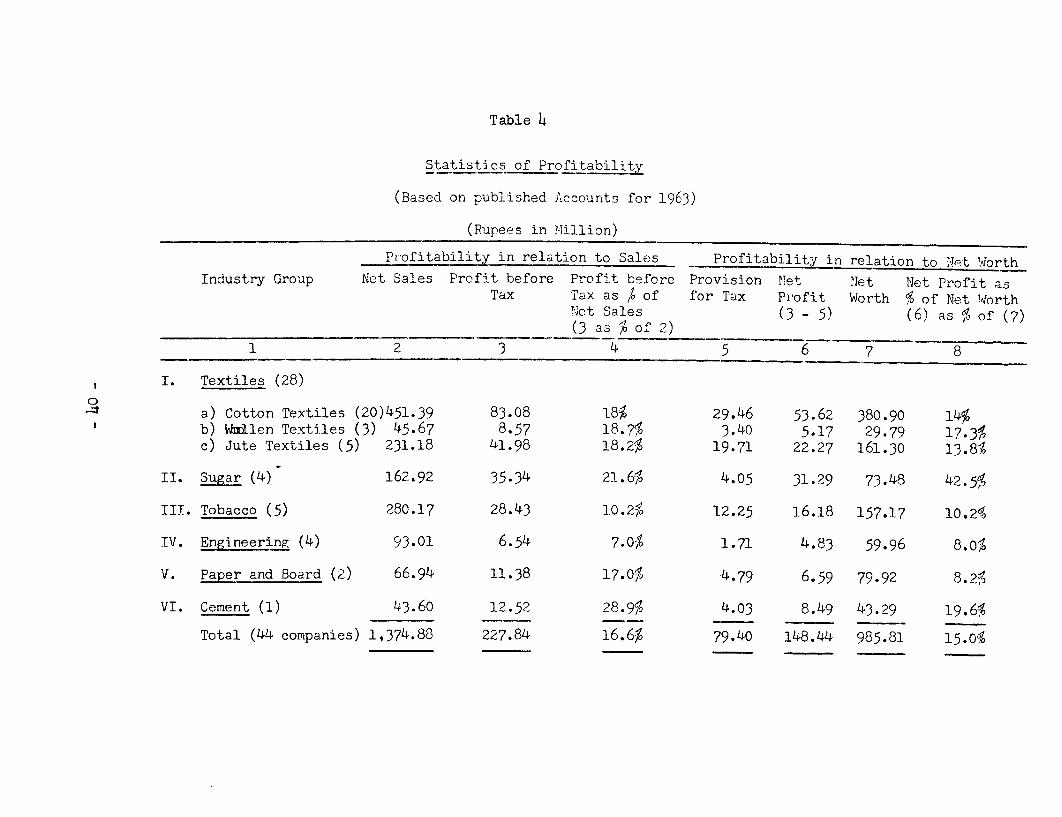
Table 4
Statistics of Profitabilitv
(Based on published Accounts for 1963)
(Rupees in !lillion)
Profitability in relation to Sales Profitability in relation to I!et Worth
Industry Group Net Sales Profit before Proflt before Provision NTet Net Net Profit asTax Tax as lo of for Tax Profit Worth % of Net Worth
Net Sales (3 - 5) (6) as % of (7)(3 as % of 2)
2 3 4 5 6 7 8
I. Textiles (28)
a) Cotton Textiles (20)451.39 83.08 18% 29.46 53.62 380.90 14%b) himilen Textiles (3) 45.67 8.57 18.7% 3.40 5.17 29.79 17.3%c) Jute Textiles (5) 231.18 41.98 18.2% 19.71 22.27 161.30 13.8,%
II. Sugar (4) 162.92 35.34 21.6% 4.05 31.29 73.48 42.5%
III. Tobacco (5) 280.17 28.43 10.2% 12.25 16.18 157.17 10.21
IV. Engineering (4) 93.01 6.54 7.0% 1.71 4.83 59.96 8.01
V. Paper and Board (2) 66.94 11.38 17.0% 4.79 6.59 79.92 8.2%
VI. Cement (1) 43.60 12.52 28.9% 4.03 8.49 43.29 19.6%
Total (44 companies) 1,374.88 227.84 16.6% 79.40 148.44 985.81 15 .0
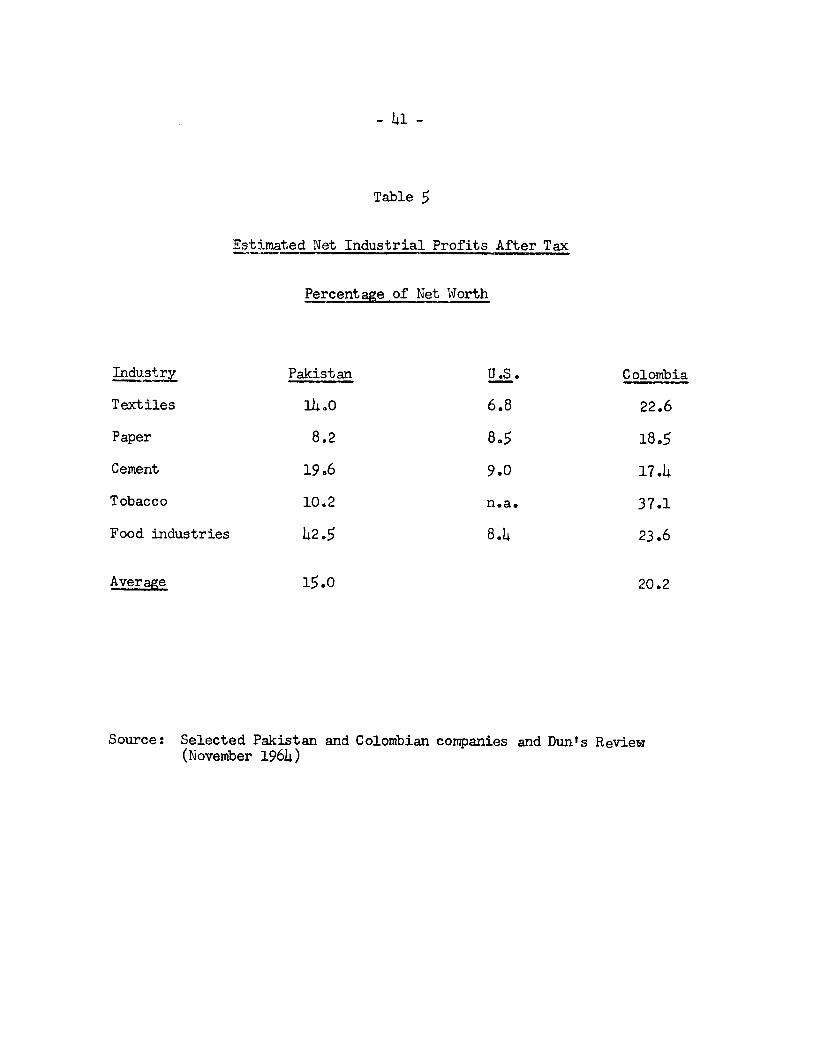
- 41 -
Table 5
Estimated Net Industrial Profits After Tax
Percentage of Net Worth
Industry Pakistan U.S. Colombia
Textiles 14.0 6.8 22.6
Paper 8.2 8.5 18.5
Cement 19.6 9.0 17.4
Tobacco 10.2 n.a. 37.1
Food industries 42.5 8.4 23.6
Average 15.0 20.2
Source: Selected Pakistan and Colombian companies and Dun's Review(November 1964)
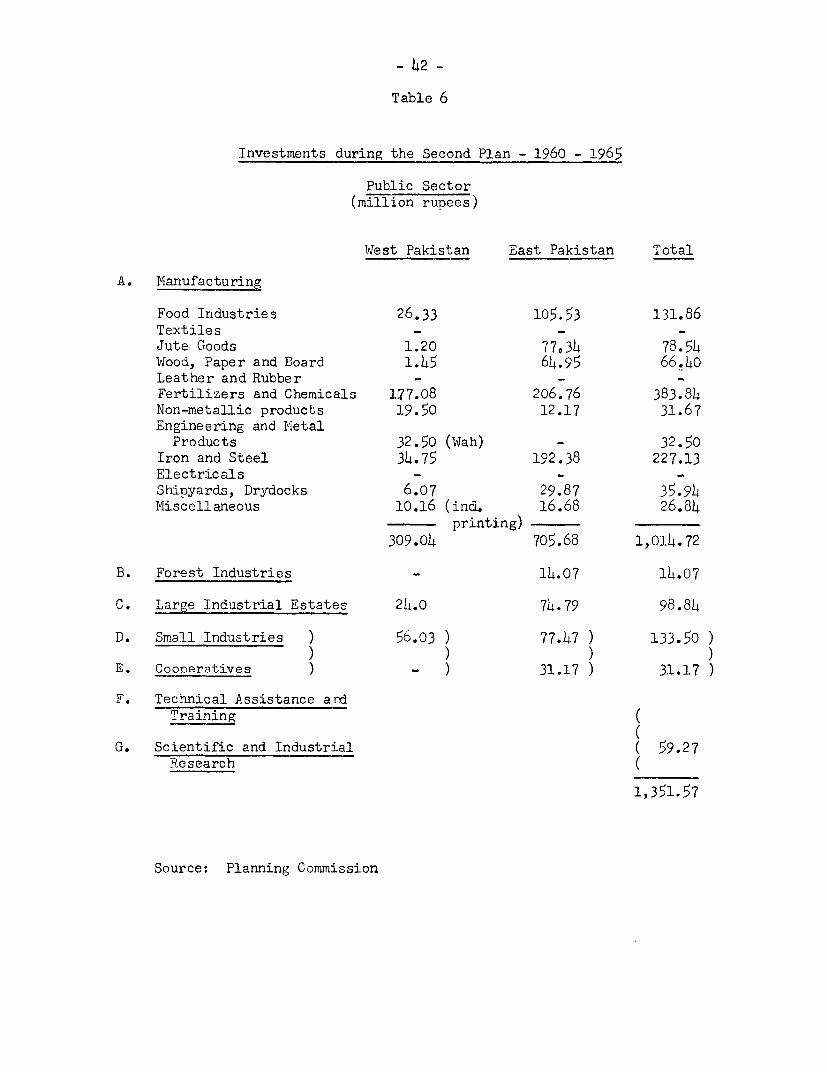
- 42 -
Table 6
Investments during the Second Plan - 1960 - 1965
Public Sector(million rupees)
West Pakistan East Pakistan Total
A. Manufacturing
Food Industries 26.33 105.53 131.86Textiles - - -Jute Goods 1.20 77,34 78.54Wood, Paper and Board 1.45 64.95 66.40Leather and Rubber - -Fertilizers and Chemicals 177.08 206.76 383.84Non-metallic products 19.50 12.17 31.67Engineering and Metal
Products 32.50 (Wah) - 32.50Iron and Steel 34.75 192.38 227.13Electricals - - -Shipyards, Drydocks 6.07 29.87 35-94Miscellaneous 10.16 (ind. 16.68 26.84
printing)309.04 705.68 1,014.72
B. Forest Industries - 14.07 14.07
C. Large Industrial Estates 24.0 74-.79 98.84
D. Small Industries ) 56.03 ) 77.47 ) 133.50) ) ))
E. Cooperatives ) - ) 31.17 ) 31.17
F. Technical Assistance ardTraining
G. Scientific and Industrial ( 59.27Research (
1,351.57
Source: Planning Commission
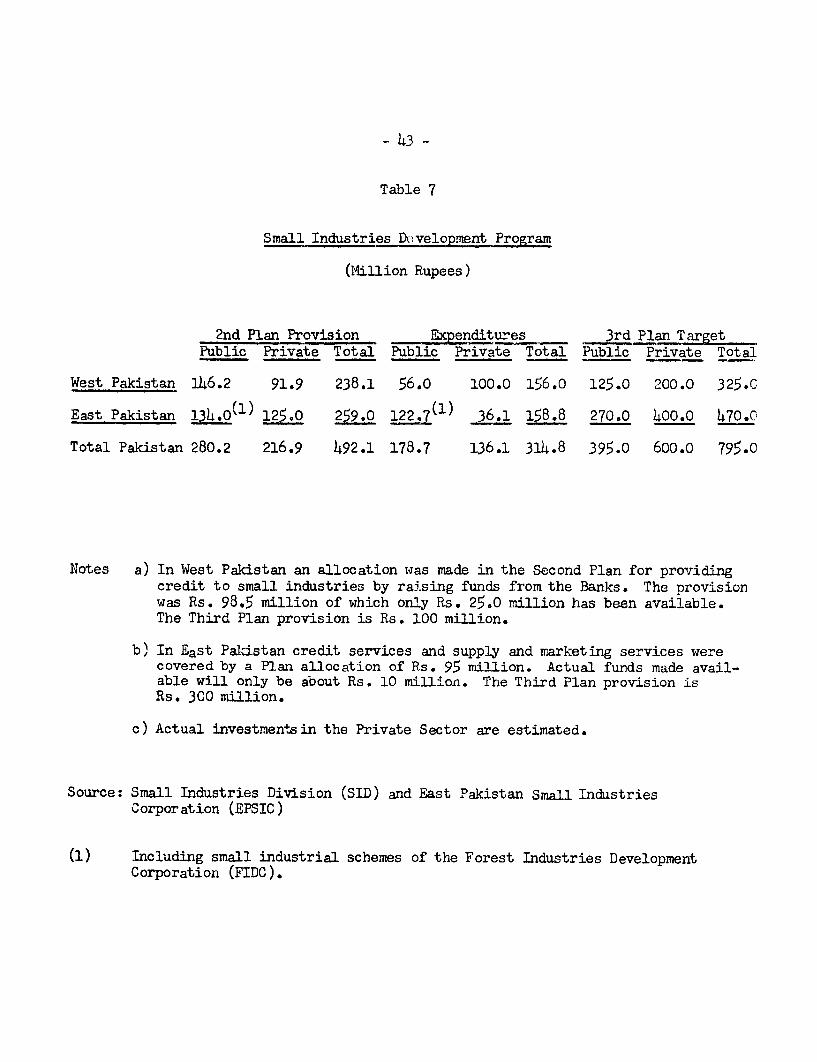
- 43 -
Table 7
Small Industries DEvelopment Program
(Million Rupees)
2nd Plan Provision Expenditures 3rd Plan TargetPublic Private Total Public Private Total Public Private Total
West Pakistan 146.2 91.9 238.1 56.o 100.0 156.0 125.0 200.0 325.C
East Pakistan 134.0(1) 125.0 259.0 122.7(1) 36.1 158.8 270.0 400.0 470.0
Total Pakistan 280.2 216.9 492.1 178.7 136.1 314.8 395.0 600.0 795.0
Notes a) In West Pakistan an allocation was made in the Second Plan for providingcredit to small industries by raising funds from the Banks. The provisionwas Rs. 98.5 million of which only Rs. 25.0 million has been available.The Third Plan provision is Rs. 100 million.
b) In East Pakistan credit services and supply and marketing services werecovered by a Plan allocation of Rs. 95 million. Actual funds made avail-able will only be about Rs. 10 million. The Third Plan provision isRs. 300 million.
c) Actual investmentsin the Private Sector are estimated.
Source: Small Industries Division (SID) and East Pakistan Small IndustriesCorporation (EPSIC)
(1) Including small industrial schemes of the Forest Industries DevelopmentCorporation (FIDC).
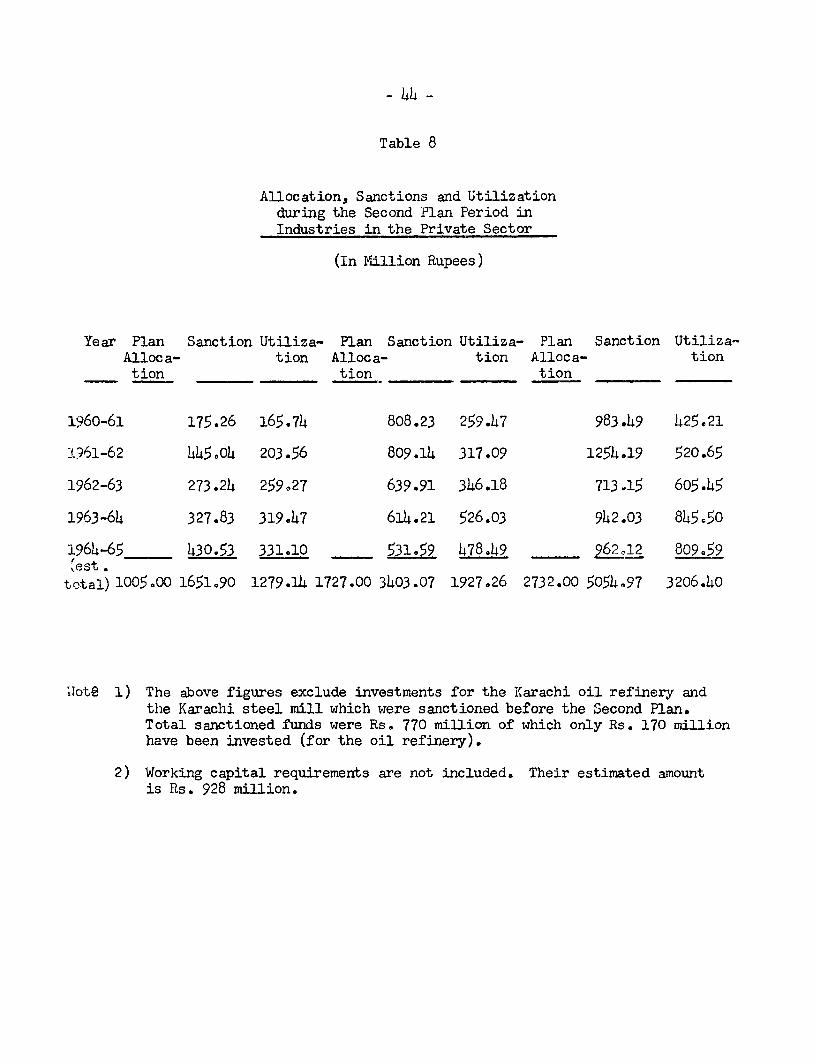
- 44 -
Table 8
Allocation, Sanctions and Utilizationduring the Second Plan Period inIndustries in the Private Sector
(In Million Rupees)
Year Plan Sanction Utiliza- Plan Sanction Utiliza- Plan Sanction Utiliza-Alloca- tion Alloca- tion Alloca- tiontion tion tion
1960-61 175.26 165.74 808.23 259.47 983 49 425.21
i961-62 44504 203.56 809 t14 317.09 1254,19 520.65
1962-63 273.24 259827 639.91 346.18 713015 605.45
1963-64 327.83 319.47 614.21 526.o3 942.03 845c50
1964-65 430r53 331.10 531.59 478.149 962,12 809o59rest.total) 1005.00 1651.90 1279.14 1727.00 3403.07 1927.26 2732.00 5054,97 3206.40
llotE 1) The above figures exclude investments for the Karachi oil refinery andthe Karachi steel mill which were sanctioned before the Second Plan.Total sanctioned funds were Rs. 770 million of which only Rs. 170 millionhave been invested (for the oil refinery).
2) Working capital requirements are not included. Their estimated amountis Rs. 928 million.

- 45 -
Table 9
Estimated Investments in Industry - Second Plan versus Third Plan
(mil ion rupee~s
2nd Plan (1960-65) 3rd Plan (1965-70)Public Private Public Private
(sanctions)
1. Food industries 131.86 516.44 196.82 664.10
2. Textiles - i491.59 8.73 1372.50
3. Jute goods 78.54 - 62.46 1074.00
4. Wood, paper and board 66.40 209.78 604.71 201.80
5. Leather and rubber - 52.10 - 1147.20
6. Chemicals 383.84 822.84 1324.73 1LI0.40
7. Non-metallic products 31.67 249.90 319.96 603.00
8. Engineering and metalproducts 259.63 357.36 886.72 1854.5o
9. Shipyards 35.94 - 93.-9 -
10. Electricals - 127.16 175.90 31l4.50
11. Miscellaneous 26.84 438.681) 43.148 776.00
Total 1014.72 4262.85 3727.00 8418.00
Capital intensiveindustries (6+7+8+9+10) 711.08 1724.26 2810.80 W132,40
Other industries(1+2+3+4+5+11) 303.64 2538.59 916.20 4235.60
% capital intensivein total 70.1 40.4 75.4 49.7
% capital intensivein total industrialinvestments(2) 47.3 57.6
(1) Investwents sanctioned up to June 1964. Actual investments up toJune 1965 are estimated to be 3376.40 million. It is assumed thatpercentage-wise the breakdown will be the same for various industrialbranches in case of actual investments and sanctioning.
(2) Assuming 40.14 for private investments of 3376.40 million, i.e.1364.07 million.

- 46 -
Table 10
Industrial Investment in Private SectorSanctioned Through Different Agencies in the Private
Sector from July 1960 to June 1964
(in million rupees)
Agency East Pakistan West Pakistan Total
1. I.P.B. (InvestmentPromotion Bureau) 297.68 921.61 1,219.29
2. PICIC (PakistanIndustrial Credit andInvestment Corporation) 241.32 961.11 1,202.h3
3. PIFCO/IDBP (PakistanIndustrial FinanceCorporation/IndustrialDevelopm.ent Bank ofPakistan) 477.98 669-75 1,147.73
4O Cash Licences 159.13 137.57 296.70
5. Bonus Vouchers 45.27 181.44 226.71
Total 1,221.38 2,871.L8 4,092.86

Table lOa
Industrial Growth - 1964/65 - 1969/70
I. Added value (Rs. million in l959160 prices)Growth Growth
1959/60 1964/65 1969/70 Second Third(1) Plan Plan
Large scaleindustry 1765 3293 5832 *86.6 +77.1
Small scaleindustry 1365 1554 1799 +13.8 +15.8
Total 3130 4847 7631 +54.9 +57.4
II. Growth rates (%)Growth during Seccnd Growth during Third
Plan PlanTotal Per annum Total Per annum
Large scaleindustry 86.6 13.3 77.1 12.1
Small scaleindustry 13.8 2.6 15.8 3.0
Total 54.9 9.2 57.4 9.5
Note: a) Growth rates in large scale industry can be estimated asfollows by Province:
Second Plan Third Plan
West Pakistan 11.2 9.6East Pakistan 18.2 16.2
Total Pakistan 13.3 12.1
b) Growth rates in small scale industry are estimated to be2.6% per annum in both ways during the Second Plan and3.0% during the Third Plan.
(1) 1960/61 prices. They are not significantly different from 1959/60prices (1 or 2%).
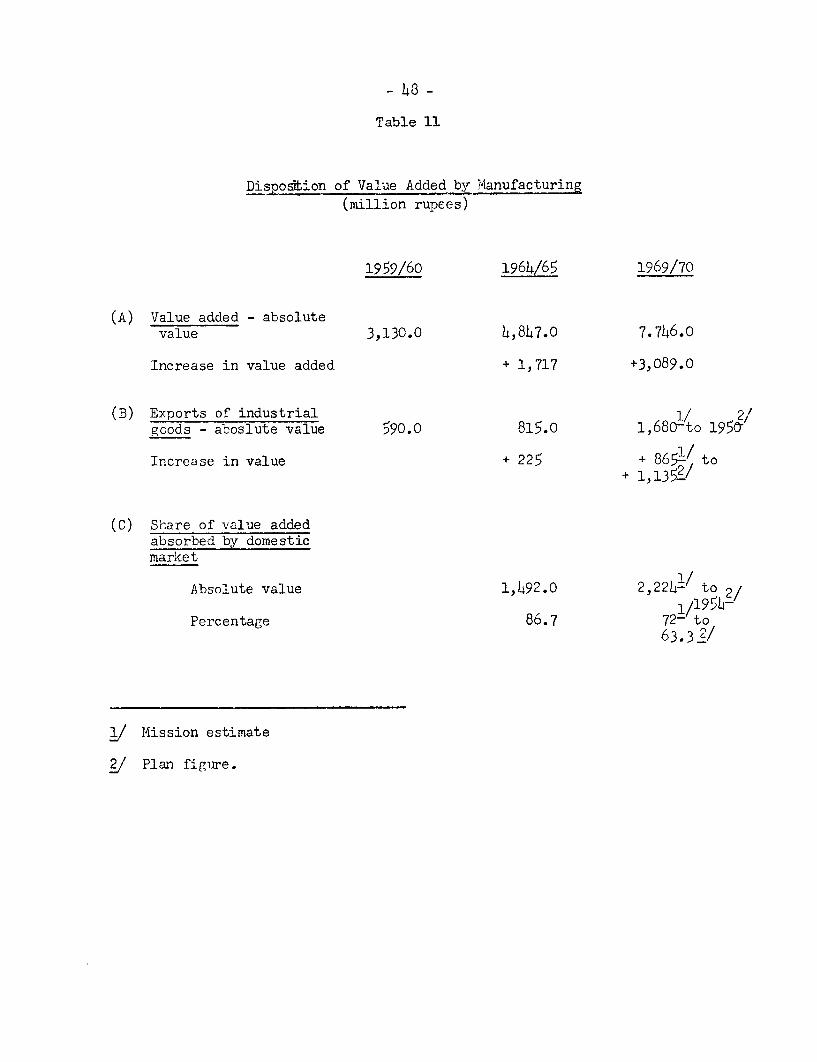
Table 11
Disposition of Value Added by Manufacturing(million rupees)
1959/60 196h/65 1969/70
(A) Value added - absolutevalue 3,130.0 4,847.0 7.746.0
Increase in value added + 1,717 +3,089.0
(B) Exports of industrial 1/ r/
goods - aboslute value 590.0 815.0 1,680-to 1950
Increase in value + 225 + 8651/ to+ 1,1 3 52
(C) Share of value addedabsorbed by domesticmarket
Absolute value 1,492.0 2,2241/ to 2/1/1954-
Percentage 86.7 72- to63.3 2/
1/ Mission estimate
g/ Plan figure.

- 49 -
Table 12
Total Investment Targets in Manufacturing 1965-1970
Public and Private Sector
(million rupees)
West Pakistan East Pakistan Total
1. Food industries, beverage,tobacco 418.10 hL42.82 860.92
2. Textiles 778.50 602.73 1,381.23
3. Jute goods 60.00 1,076.46 1,136.46
4. Wood, paper and board 117.57 688.g4 80o.51
5. Leather and rubber 68.20 79.00 lL7.20
6. Fertilizers 450.10 557.13 1,007.23
7. Chemicals and petro-chemicals 1,031.03 696.87 1,727.90
8. Non-metallic products 648.95 274.01 922.96
9. Engineering and metalproducts 717.70 946.41 1,664.11
10. Iron and steel 800.00 277.11 1,077.11
11. Electricals 214.50 275.90 490.40
12. Shipyards - drydocks 25.20 68.29 93.49
13. MiscelIaneous 445.15 374.33 829.485,775.00 6,360.00 12,135.00
Technical assistance,research and industrialestates 915.00
l3,o50.00

-50-
Table 13
Investments Targets in Manufacturing - 1965-1970
Public Sector(million rupees)
West Pakistan East Pakistan Total(WPIDC) (EPIDC)
A. Manufacturing
Sugar 296.82 196.82Cotton Textiles 8.75 8.73Jute goods - 62.h6( 1 ) 62.46Wood and Paper 0.77 283.94 284.71Fertilizers 330.10 557.13 887.23Chemicals and Petrochemicals 161.63 275.87 437.50Cement and Refractory Plants 151.95 168.01 319.96Engineering Machine tools 212.20 2L7.41 459.61Iron and Steel 150.00 277.11 427.11Electrical Equipment 100.00 75.90 175.90Shipyards - Drydocks 25.20 68.29 93.L9Miscellaneous 25.15 18.33 43.48
1,157.00 2,250.00 3,407.00
B. Forest Industries Develop-ment Corporation - 320.00 320.00
C. Large Industrial Estates 49.00 140.00 189.00
D. Small Inclustries 99.00 235.00 334.00
E. Cooperatives - 35.00 35.00
F. Technical Assistance andTraining 63.00 70.00 133X00
G. Scientific and IndustrialYResearch 100.00 50.00 150.00
H. Miscellaneous 44.00 20.00 64.001,512.00 3,120.00 4,632.00
Source of Funds
Provincial Government 1,362.00 2,970.00 4,332.00Central Government 150.00 150.00 300.00
1,512.00 3,120.00 4,632.00
(1) Excluding wood and wood prodicts indicated under B.
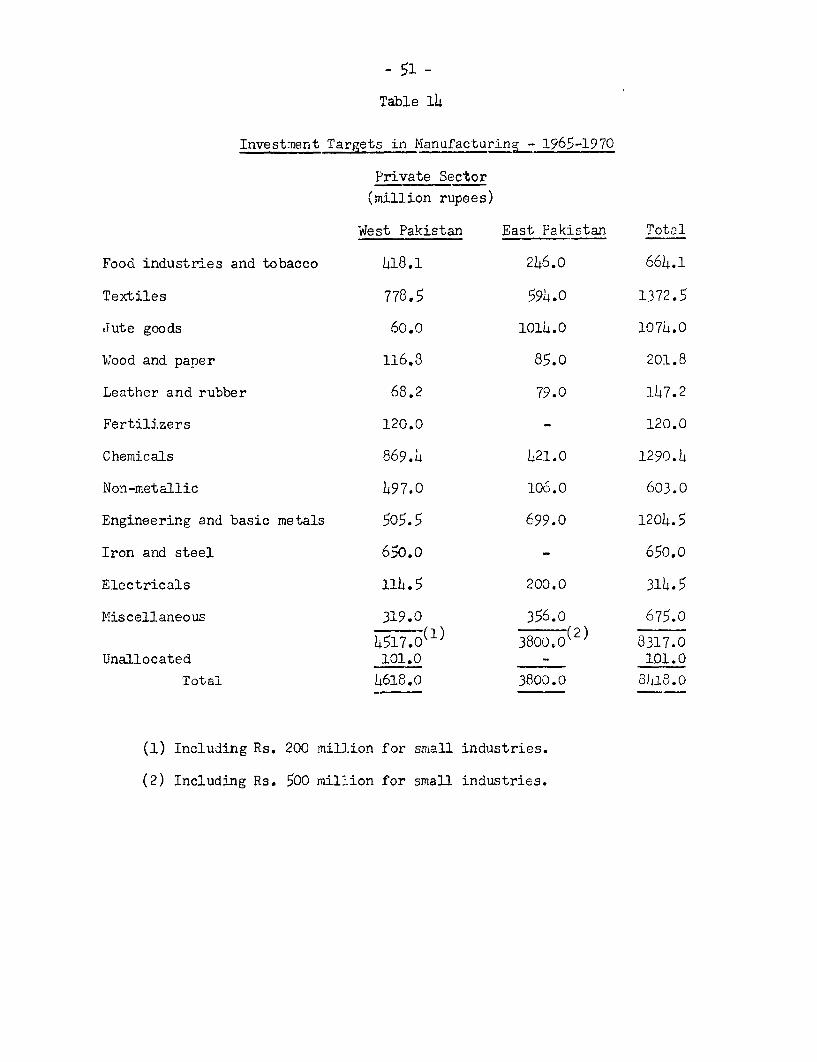
- 51 -
Table 14
Invest:nent Targets in Manufacturing - 1965-1970
Private Sector
(million rupees)
West Pakistan East Pakistan Total
Food industries and tobacco 418.1 246.0 664.1
Textiles 778.5 594.0 1372.5
.Jute goods 60.0 1014.0 1074.0
Wood and paner 116.3 85.0 201.8
Leather and rubber 68.2 79.0 147.2
Fertilizers 120.0 - 120.0
Chemicals 869.4 421.0 1290.4
Non-metallic 497.0 106.0 603.0
Engineering and basic metals 505.5 699.0 1204.5
Iron and steel 650.0 - 650.0
Electricals 114.5 200.0 314.5
Miscellaneous 319.0 356.o 675.0
4517.0(1) 3800.0(2) 8317.0Unallocated 101.0 -_101.0
Total 4618.0 3800.0 W8jl.0
(1) Including Rs. 200 million for small industries.
(2) Including Rs. 500 million for small industries.
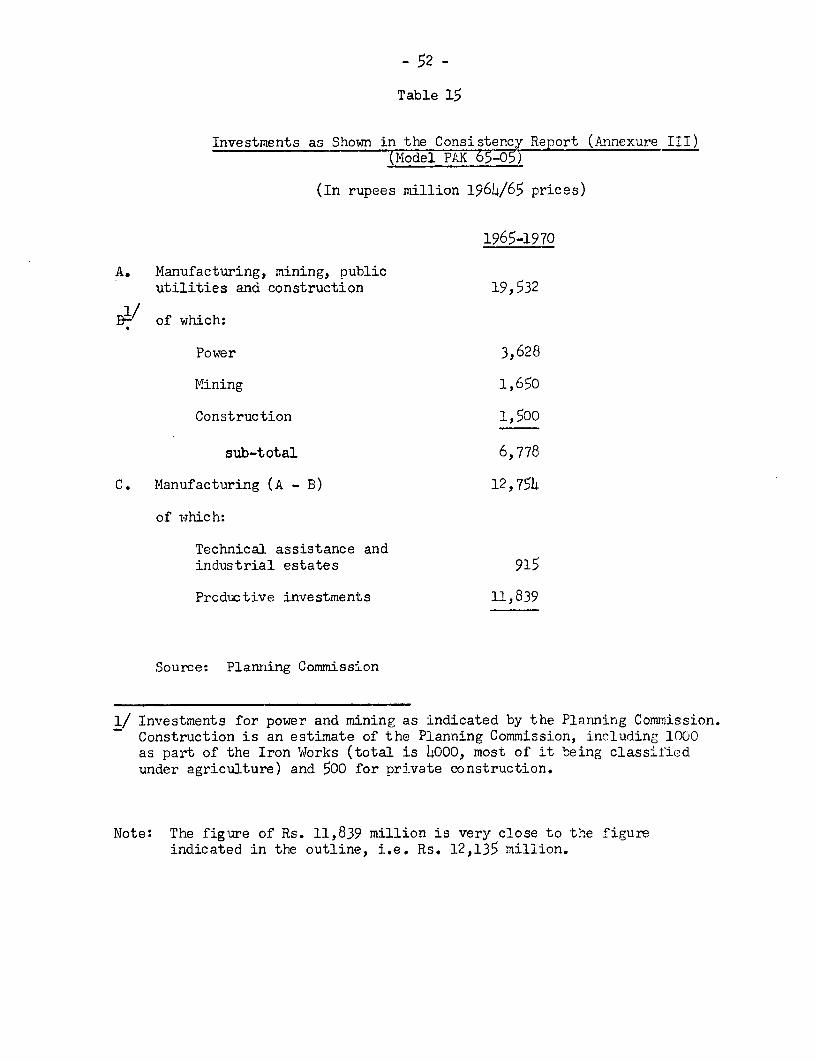
- 52 -
Table 15
Investments as Shown in the Consistency Report (Annexure III)(Model PAS 65-05)
(In rupees million 1964/65 prices)
1965-1970
A. Manufacturing, mining, publicutilities and construction 19,532
1/B-' of which:
Power 3,628
Mining 1,650
Construction 1,500
sub-total 6,778
C. Manufacturing (A - B) 12,754
of which:
Technical assistance andindustrial estates 915
Productive investments 11,839
Source: Planning Commission
1/ Investments for power and mining as indicated by the Planning Commission.Construction is an estimate of the Planning Commission, including 1000as part of the Iron Wdorlcs (total is 4000, most of it being classitiedunder agriculture) and 500 for private construction.
Note: The figure of Rs. 11,839 million is very close to the figureindicated in the outline, i.e. Rs. 12,135 million.
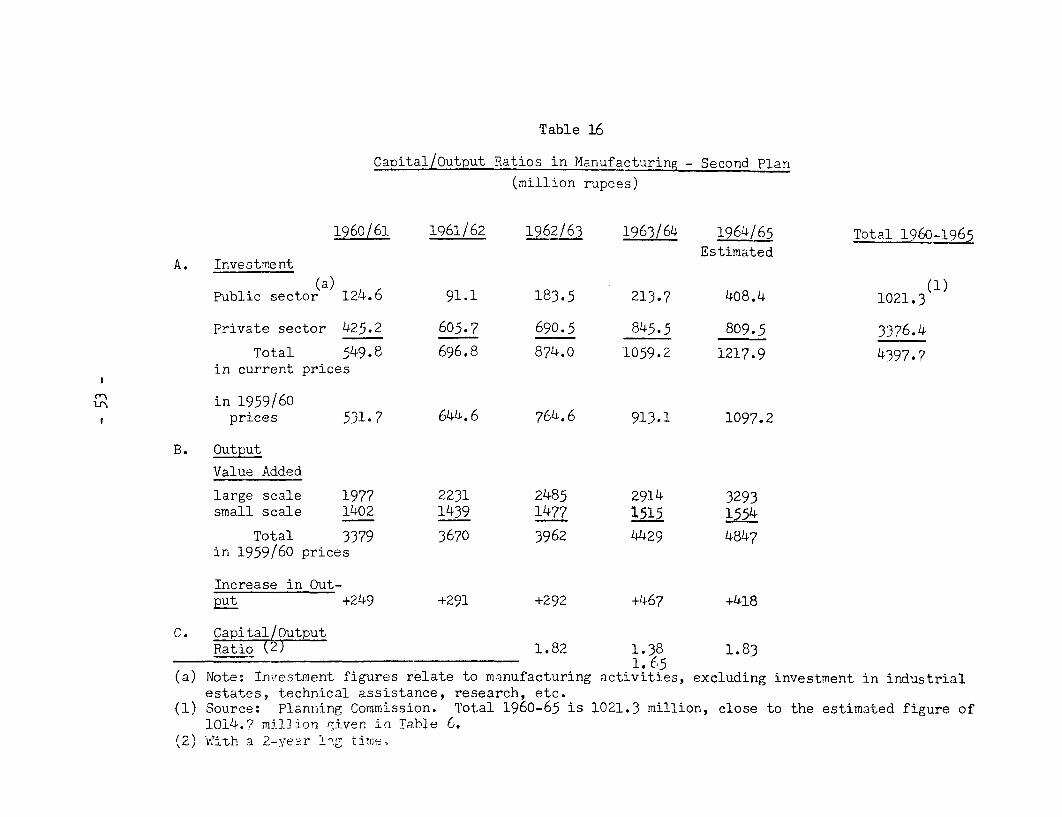
Table 16
Capital/Output Ratios in Manufacturing Second Plan
(million rupees)
1960/61 1961/62 1962/63 1963/64 1964/65 Total 1960-1965Estimated
A. Investment
(a) (1)Public sector 124.6 91.1 183.5 213.7 408.4 1021.3
Private sector 425.2 605.7 690.5 845.5 809.5 3376.4
Total 549.8 696.8 874.0 1059.2 1217.9 4397.7in current prices
in 1959/60prices 531.7 644.6 764.6 913.1 1097.2
B. Output
Value Added
large scale 1977 2231 2485 2914 3293small scale 1402 1439 1477 1515 1554
Total 3379 3670 3962 4429 4847in 1959/60 prices
Increase in Out-put +249 +291 +292 +467 +418
C. Capital/OutputRatio 2 1.82 1.38 1.83
1. 65(a) Note: Investment figures relate to manufacturing activities, excluding investment in industrial
estates, technical assistance, research, etc.(1) Source: Planning Commission. Total 1960-65 is 1021.3 million, close to the estimated figure of
1014.7 million given in Table 6.(2) W'ith a 2-year tlog rtije
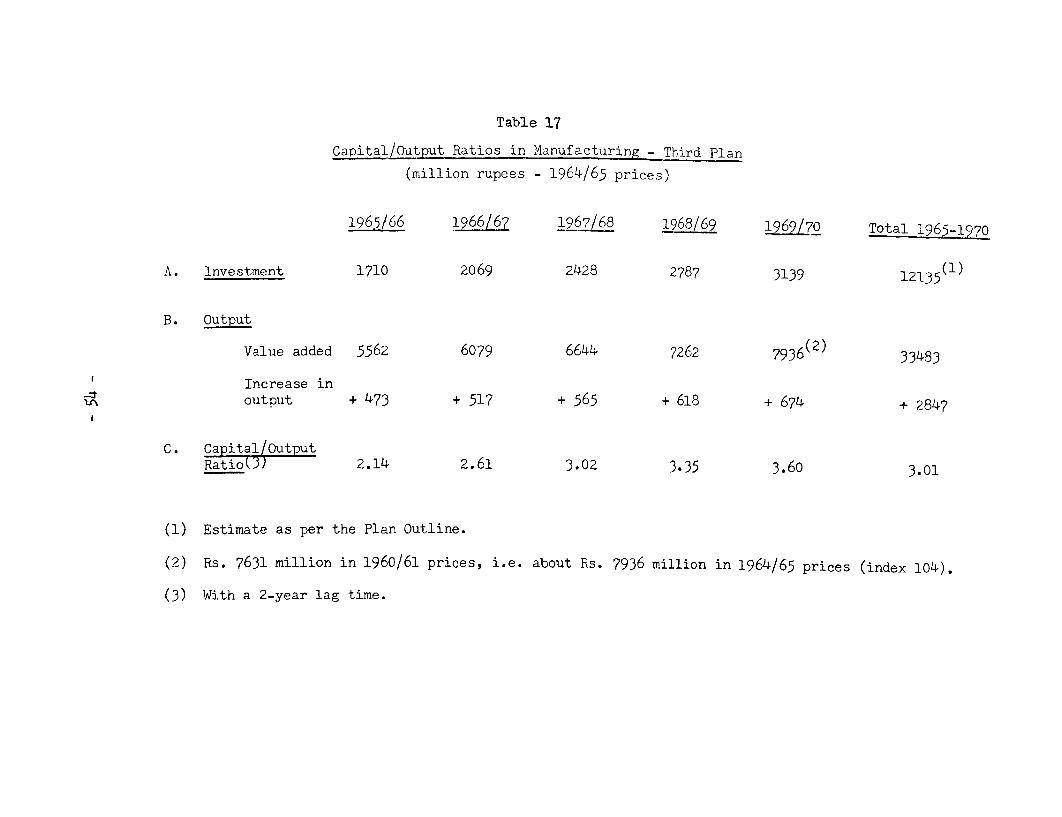
Table 17
Capital/OutputRatios in Manufacturing - Third Plan
(million rupees - 1964/65 prices)
1965/66 1966/67 1967/68 1968/69 1969/70 Total 1965-1970
A. Investment 1710 2069 2428 2787 3139 12135(1)
B. Output
Value added 5562 6079 6644 7262 7936(2) 33483
Increase inoutput + 473 + 517 + 565 + 618 + 674 + 2847
C. Capital/OutputRatioU3) 2.14 2.61 3.02 3.35 3.60 3.01
(1) Estimate as per the Plan Outline.
(2) Rs. 7631 million in 1960/61 prices, i.e. about Rs. 7936 million in 1964/65 prices (index 104).
(3) With a 2-year lag time.

- 55 -
Table 18
Estimated Cost of Some New CapitalGoods Industries Envisaged in the
Third Plan
West Pakistan East Pakistan Total PakistanTotal Foreign Total Foreign Total ForeignCost Exchange Cost Exchange Cost Exchange
Heavy EngineeringComplex 250.0 150.0 - - 250.0 150.0
Machine ToolFactory 116.0 65.0 239.0 154.0 355.0 219.0
Heavy ElectricComplex 100.0 60.0 - - 100.0 60.0
Fertilizer Plants 300.0 180.0 I.226.0 107.0 7141.0 1422.0II.225.0 135.0
SEW 0 2T2.0
Petrochemical Plant 150.0 90.0 - - 150.0 90.0
Steel Mill 650.o 450.0 120.0 75.0 770.0 525.o
Total 1566.0 995.0 800.0 471.0 2366.0 1466.0(million rupees)
Million UTS$Equivalent 329.0 209.0 168.0 99.0 497.0 308.0

ANNEX 4
POWER
1. The electric supply industry has made substantial progress duringthe Second Plan as the result of large capital expenditures. The totalallocation for electric power was Rs.1,631 million. Total estimated expendi-tures have been Rs.1,772 million in current value or about 1,580 million in1960/61 rupees i.e. 97% of the financial targets of the Plan. More progresswas made in West Pakistan and in Karachi than in East Pakistan.
Program for Power Development in the Second andThird Plan and Actual Expenditures in 1960 - 1965
(Rs.Million)
2nd Plan Target Actual Expenditures 3rd Plan Target1960-65 1960-65 1965-70
East PakistanEast Pakistan 371.0 353.0 1,481.0West Pakistan 1,070.0 1,182.0 1,708.0Karachi (KESC)1/ 190.0 190.0 (est.) 170.0Nuclear power - 147.2/ 269.0
1,631.0 1,772.0 3,628.0
1/ Karachi Electric supply Corporalion (KESC) is an autonomouspublic utility corporation, supplying power to Karachi, which isnot included in the West Pakistan system.
2/ Land acquisition in Karachi and at Rooppur (East Pakistan), etc.
2. Generating capacity of the public utilities has inc;-eased by 89%since 1960. Nearly 520 MW have been installed. This growth is very rapid.It is expected that total installed capacity will be 1,100 MWJ by Jule 1965.As a result the practice of large-scale shedding of loads will be progressivelyreduced. The following table indicates the growth of capacity over the lastfive years.
Estimated Growth of Installed Capacity in Pakistan between1960/61 and 1964/65 - Public Utilities
(in megawatts)
East West Pakistan Grid TotalPakistan and Isolated System Karachi Pakistan
1960/61 90.5 438.8 54.0 583.31961/62 95.3 439.5 130.5 665.31962/63 175.8 454.3 135.0 765.11963/64 183.0 600.0 135.0 918.01964/65 193.0 640.0 267.0 1,100.0
- 57 -
3. Diring the First Plan, the per capita electricity generation rosefrom about 12 kwh in 1955 to about 22 kwh in 1960. The Second Plan aimedat generating 50 kwh per capita, but the actual generation is expected to beonly 39 kwh. This is because of delayed implementation of some of the dis-tribution schemes. Transmission and Distribution remain the limiting factorin the power sector in Pakistan.
4. The Third Five Year Plan (1965/70) proposes to more than doublecapital expenditures on power. The electric power program would concentrateheavily on transmission and distributi.on schemes, which are now the bottle-necks in the electric supply industry. Expenditures on transmission anddistribution would then be about 6V4 of the total Plan allocation. Thelargest increase in investments is proposed to take place in East Pakistanbut although more attention should be given to power in the Eastlling thanduring the previous plan, the allocation might be too large and seems to over-estimate the capacity of the Eastern Region to absorb and complete the verylarge number of projects implied.
5. It is proposed to enter the field of nuclear generation ofelectricity by the completion of a 70 MW station at Rooppur in East Pakistanand one of 132 MWX in Karachi. Although these projects are said to providepower at costs comparable with steam generation in Pakistan because ofspecially low cost foreign loans, it would be very desirable to have in-vestigations made of the economics of producing power from alternative cheapsources of supply, specially in the Sind area in West Pakistan by other thanthe proponents of nuclear power.
6. Installed capacity would reach 2.6 million kw in 1969/70 versus1.1 million kw in 1964/65 which indicates how ambitious is the whole program.East Pakistan would grow from 0.2 million kw to 0.7 million kw wnich could beoverly optimistic. West Pakistan (excluding Karachi) would have 1.5 millionkw capacity in 1969/70 versus 0.64 million in 1964/65. The latter developmentmay also be optimistic but not in excess of requirement if the reclamationtubewell program gains the momentum expected.
7. Electricity generated would amount to 9.8 b0llion kwh giving aper capita consumption of 78 kwh in 1970 versus 39 kwh in 1964/65. In EastPakistan it is hoped that the per capita generation of e&lectricity will nearlytriple, from 13 kwh in 1964/65 to 35 kwrh by 1970. Much will depend on theambitious industrial and agricultural programs. If these do not reach theirgoals, neither will electricity consumption.
- 58 -
Electric Supply in Karachi
8. At the beginning of the Second Plan, the basic facilities of theKarachi Electric Supply CorporatiorLI/ (KESC) consisted of some old dieselunits, an old steam plant with an installed capacity of some 15,000 kw("A" station) and a newly completed 30 MW ("B" station) financed with thehelp of the IBRD. The Second Plan aimed at the extension of the "B" stationby 60 MW and at the completion of a 15 MWX dual-fuel plant. Finally, a newsteam station of 132 MW was also envisaged.
9. KESC sales have increased from 251 million kwh in 1960/61 to about630 million kwh in 1964/65 and the number of customers has now reached173,000. There is no shortage of power now in Karachi and generating plantsare not overloaded. Assuming that the "C" station of 132 101 can be completedby mid-1965 the KESC will have an installed capacity of 267 lAW (see Table 1).The Plan provision of Rs.190 million has been entirely spent.
10. The Third Plan makes provision for the extension of station "C" by66 FW. But the demand for power by 1969/70 would reach a level of 300 14W.It is therefore felt necessary to have new capacity available by the end ofthe Third Plan to meet the increasing demand. It has been officially statedthat a nuclear power plant should be chosen instead of a gas-fired plant.Reasons given are that: (1) if gas-fired stations are being established inthe 70's, a new pipe line from Sui to Karachi will have to be built at anestimated cost of US$26 million, (2) it should be more economical to conservegas for use as a raw material for the production of fertilizers, petrochemicalsand production of industrial steam, and (3) it is necessary for Pakistan toenter into the field of nuclear power so that scientists and engineers couldlearn the new technology under conditions prevailing in Pakistan.
11. The total capital investment in the 132 NWJ nuclear power project isestimated to be of the order of US$58 million (which includes the cost of thefirst core of the atomic fuel, estimated to be nearly US$2.4 million) orUS$440 per kw versus about US$180 per kw for conventional internal plants.The foreign exchange component of the total investment is likely to be US$46.5million. Originally, indications were that nearly 5C% of the foreign exchangerequired could be obtained in the form of a grant under the Colombo P'lan andthe balance as a loan from Canada. As rupee finance for the project would beavailable at 3Vj% to 4%, the composite rate of interest of the total capitalinvestment works out to be slightly less than 4,. It is only under theseinterest rate assumptions that the proposed nuclear plant is said to be ableto deliver power cheaper than a gas-fired plant of equivalent caoacity, upto 60% igad factor (6.70 mills/kwh for nuclear versus 7.20 for a gas-firedplant)._/ Assuming a capacity factor of 80% (7,000 hours per year), energycost would be 5.55 mills/kwh for nuclear and 6.35 for a gas-fired plant.
l/ Autonomous public utility corporation controlled by a Board of Directorsrepresenting both the Central Government and private interests.
2/ Figures are based on 3.43%composite rate of interest. Life of the plantis taken at 30 years. All the data have been supplied by the PakistanAtomic Energy Commission.
However, another study made available to the missionr/ indicatesthat assuming a relatively low capital charge of about 10% to cover fulldepreciation as well as the cost of capital, the estimated average unitcosts of conventional thermal and nuclear generating plants would be asfollows (US mills per kwh):
OperationalPlant Fixed Charges Maintenance Fuel Total
Nuclear 3.7 O.5 2.3 6.5Conventional Thermal 2.0 0.3 1.3 3.6(extension to an exist-ing unit)
The above figures are also based on the assumption that a capacity factorof 80% would be achieved on the nuclear plant. On the other hand, theconventional costs are low in that they reflect the very advantageous costsof an extension to an existing plant. However, the assumption is not un-realistic since a large thermal plant based on 14ari gas will be built byWTapda in the late 60's. It is also proposed to connect it with Karachi beforethe end of the Third Plan and to expand the plant during the Fourth Planperiod. On balance, it appears that nuclear power should not be consideredas an economic alternative. Even if the capital cost of the Karachi nuclearpower plant is relatively low, it remains to be seen wqhat the operating costwould be. Operating difficulties and the relatively low load factor whichis to be expected are likely to result in high generating costs. The missionbelieves that, before a nuclear power plant is seriously considered acomprehensive comparison should be made between the cost of power sent toKarachi from the M4ari thermal plant with the cost of nuclear power generatedat Karachi. A gas-fired plant at M4ari could transmit electricity to Karachiand no extra gas pipe line from the gas field to Karachi would be needed.Mari gas reserves are large and can be used for producing power as well as araw material for chemicals.
1/ Results of the study were included in the "Study of the Water andPower Resources of West Pakistan" sponsored by the World Bank.

- 60 -
Power in West Pakistan
The following paragraphs present the estimated results of theSecond Plan and the programs for the Third Five Year Plan.
The Second Five Year Plan
12. The Plan provided an allocation of Rs.1,069.63 million in respectof the power program as undertaken by Wapda. Expenditures on projects inthe Second Plan were as follows (in million rupees):
Second TotalEstimated Expenditures Plan - Cost ofCost of before Second Plan Expendi- Projects
Projects Second Plan Allocation tures so far
Generation 537.3 167.3 289.1 347.5 514.8Transmission and
distribution 814.3 158.0 585.2 734.2 892.2Village
Electrification 325.0 190.6 45.0 45.0Research 4.7 - 4.7 4.2 4.2
Total 1,681.3 325.3 1,069.6 1,130. 94 1,456.2
There were also some Wapda expenditures for schemes not included in the Planand recently started (Lyallpur and Sulkkur B thermal plants). Total cost ofthese projects is Rs.216.1 million of which 50.7 million would be spent inthe Second Plan (1964/65). Thus, total Wapda expenditures have a-lounte1 toRs.1,181.6 million, i.e. 10.5% above the Plan provision. Ho-wever equipme. ntprices have increased by about this percentage from 1960 to 1965._ So inreal terms expenditures have been about as planned.
13. However, the above table shows that there were large de7arturesfrom individual financial targets by divisions of the p7ro 'am. The detailwill be found in Table II. Costs have been higher than e:'r:e:t-ed 2or theextension for the Multan power plant and for powe- dKstri>ut on. However,large underspending took place on the village electr.i:fication schez,1e. Dueto non-availability of foreign exchange, no progress could be niade on thisproject except the design and engineering aspects. Implementalion of theproject will have to be deferred to the Third Five Year Plan. One must addthat although the work on the village electrification scheme as such has notbeen started so far, 860 villages have been electrified under other programs.
1/ Actual expenditures 1960764 were 936.1 million. Budgeted expendituresfor 1964/65 amount to 194.8 million.
2/ The Planning Commission estimate is fl<.
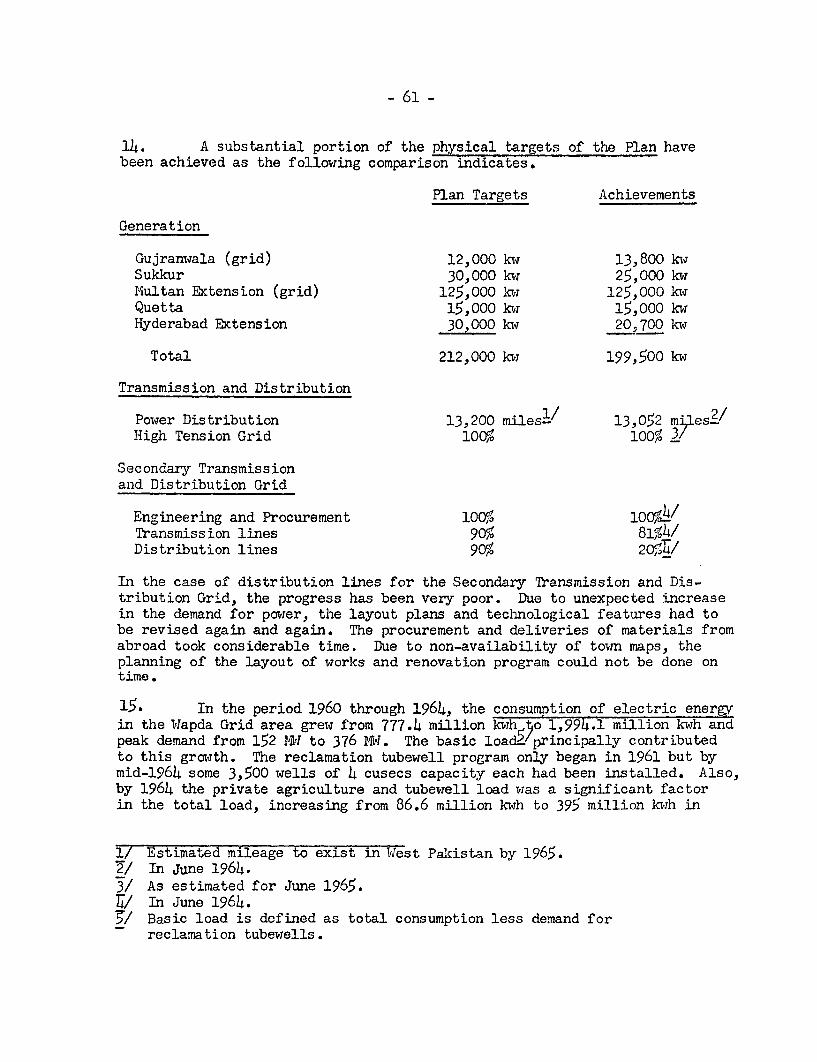
- 61 -
14. A substantial portion of the physical targets of the Plan havebeen achieved as the following comparison indicates.
Plan Targets Achievements
Generation
Gujranwala (grid) 12,000 kw 13,800 kwSukkur 30,000 kw 25,000 kwMultan Extension (grid) 125,000 ku 125,000 kwQuetta 15,000 kaw 15,000 kwHyderabad Extension 30,000 kw 20,700 kw
Total 212,000 kvy 199,500 kw
Transmission and Distribution
Power Distribution 13,200 miles-/ 13,052 miles2/High Tension Grid 100% 100% 3
Secondary Transmissionand Distribution Grid
Engineering and Procurement l00% l0O/4/Transmission lines 90% 81%4/Distribution lines 90% 20,%_/
In the case of distribution lines for the Secondary Transmission and Dis-tribution Grid, the progress has been very poor. Due to unexpected increasein the demand for power, the layout plans and technological features had tobe revised again and again. The procurement and deliveries of materials fromabroad took considerable time. Due to non-availability of town maps, theplanning of the layout of works and renovation program could not be done ontime.
15. In the period 1960 through 1964, the consumption of electric energyin the Wapda Grid area grew from 777.4 million kwh,to 1,994.1 million kwh andpeak demand from 152 MId to 376 MID. The basic loadL principally contributedto this growth. The reclamation tubewell program only began in 1961 but bymid-1964 some 3,500 wells of 4 cusecs capacity each had been installed. Also,by 1964 the private agriculture and tubewell load was a significant factorin the total load, increasing from 86.6 million kwh to 395 million kwh in
1/ Estimated mileage to exist in West Pakistan by 1965.2/ In June 1964.3/ As estimated for June 1965.77/ In June 1964.§/ Basic load is defined as total consumption less demand for
reclamation tubewells.
- 62 -
the 1960/64 period representing about 20% of the total at the end of theperiod. As at July 1964, there were over 24,000 privately owned tubewellsin the grid area of about 1 cusec capacity each. A fairly large number ofthese wells are diesel operated, and Wapda has a large backlog of requestsfor electrical tubewell connections. The electricity consumption and peakdemand in the grid area for the period 1960/64 are summarized in Table III.The growth of power consumption since 1960 seems as impressive as that whichapparently took place during the 50!s. During the past 5 years, the numberof customers increased by 350,000 bringing the total served by Wapda in 1964to 620,000. Since 1960, the system has generally met the demands. As notedbelow, distribution facilities are, however, now becoming a bottleneck.
16. Generating Capacity in the Grid. The installed capacity of theWapda Gridi`reasei`Tfrom 419,200 kw in960/61 to 558,000 kw in 1964/65.The increase was due to: (1) the completion of the Gujranwala hydrostationin 1962/63 - it has a capacity of 13,800 kw; and (2) the extension of theMultan steam plant from 125,000 to 250,000 kw. There are now fourteen electricgenerating plants in Ulapda's main grid (see Table IV). During the wintermonths, as explained below, downstream irrigation problems restrict the peakingcapacity of the Wplarsak plant to 100 MW1 during the October to March period.The other small hydro plants are limited to 55 1,11 during the winter becauseof reduced canal flows, and the old steam and diesel units cannot carry theirrated outputs. The system's effective generating capability at the time ofthe winter peak load is now 432 MW and, with the largest generating unit outof service (Multan - 65 nW), the system's firm capability is 367 4IW againstabout 230 HW in 1960/61.
17. The Grid's Transmission System. Wapda's transmission lines whichdeliver energy from the principal generating stations to the main substationsare double circuit lines of 132 kv although a single circuit interconnectingline of 220 kv supplying the Lyallpur primary load center from the Multanthermal power plant has now been achieved. A second 220 kv circuit was alsoto be added to this line during the Second Plan but it is now doubtful that itcould be completed before 1966. The lines are modern and terminate at wellequipped substations. At the present time, the 132 kv grid generally hassufficient capacity to supply existing loads. At several primary grid loadcenters as well as at several secondary grid load centers, however, it isevident that the demand will soon reach the capacity of both lines andsubstations and in particular, substation transformers. Load curtailment incertain areas became necessary in January 1965.
18. Distribution. The present indications are that the distributionsystem in the grid area is the weak link in the system's physical facilities.Lack of distribution regulators and capacity installations, long secondaryruns, small conductors result in extreme voltage fluctuations and high systemlosses. Capital costs are generally high. Insufficient funds are causingdelay in the improvement programs. In fact large generating and transmissionprojects have received priority but the last link - distribution - has notreceived enough attention. Renovation programs, now scheduled for nine majorcities are approaching completion but they will still leave about 80/ of thedistribution system in a poor state. Manufacture of line materials, includingconcrete poles has started, but present manufacturing capacity is too low tomeet the present requirements. A training program, now started, must be
- 63 -
accelerated to staff with trained personnel, the work group who will handledistribution, construction and renovation.
19. Non-Interconnected Areas of Wapda's Service Area. These areasconsist of: (1) The Sind, which is served by two isolated systems centering onHyderabad and Sukkur; (2) another small isolated system at Quetta serving thetown Qalat and the surrounding coal mining a/reas; and (3) some isolateddiesel stations in the Northern Grid zone.l _There are also the RawalpindiElectric Poawer Co. Ltd., and the Iiultan Electric Supply Co. Ltd., both smallprivate stock companies.Y/ Wapda furnishes wholesale power to them and theyform a part of Wapda's northern grid to which they are now connected.
Wapda's Sind service area is expected to consume 488 million kwhin 1965 compared to 189 million kwh in 1961. The Hyderabad Division (LowerSind) is experiencing rapid industrial development. Natural gas from Sui hascontributed to the economic development of the area. The Division's powersupply consists of a thermal station with 25.7 MW capacity and 3.5 MWJ ofdiesel generators. The Plan envisaged to bring thermal capacity to 30 MW butit is now expected that the addition of some 8 MW will not take place beforeearly 1966.
The Upper Sind is served by diesel stations totalling 4 14W1 capacityand by a new steam electric station fired with Sui gas and consisting of two12.5 MW units which has just been completed at Sukkur.
The Quetta-Qalat area is rugged and sparsely settled. Small,private diesel stations supply power to the Quetta area. Wapda has justinstalled two 7.5 MW51 coal-fired steam electric units to provide power to someof the nearby coal mines and to the city of Quetta. The energy consumptionin this area is expected to reach 110 million kwh in 1965 versus about 70million kwh in 1961.
The Third Five Year Plan
The Power Program of Wapda for the Third Five Year Plan is estimatedto cost Rs.1,707.8 million over the period 1965-70 versus Rs.1,181.6 millionduring the Second Plan.
20. Future needs. An estimate of load growth has been made for thewapda system by IJapda's consultants. In this particular case a special factorarises from the tubewell pumping loads which result from the land reclamationprogram are especially difficult to forecast. The estimated loads through1970 for both the Northern Grid and Southern Zones are shown in Table VI,labelled appropriately "basic load"., "tubewell load" and "total load". Theseare the annual maximum demands in megawatts which the system must be preparedto meet. By 1970 the maximum demand in the Northern Grid is estimated to be1,005 megawatts compared to the maximum in 1960 to 152 megawatts and anestimated 461 megawatts in 1965. In the Southern Zone between 1965 and 1970,it is estimated that the loads will increase from 66 to 170 IYIW.
i/ For description of installed capacity, see Table V.2/ Their combined installed capacity is 13 MW (see Table IV).
- 64 -
1Wrapda's forecast for 1970 has been judaged somewhat optimistic bythe "Report on a Dam on the Indus at Tarbela".1 The Report forecasts atotal load of 930 4Wf in 1970 versus 1,005 lAW envisaged by Wapda. The maindifference is for agriculture. There can be doubts regarding the size ofthe tubewell load. Reclamation tubewells are assumed to operate 4,500 to4,800 hours annually and private tubewells 4,000 hours. But, other studiesindicate that the annual hours of use might be considerably lower. The effectof such a possible reduction in the hours of usage would be to lower theenergy requirement and result in a total load lower than shown by Wapda'sestimates. The comprehensive phase of the studylj ha3 still to be completed,but may show a total load even below 930 NW in 1970. However, it is knownthat the Third Plan does not make any provision for the Warsak project /Then, the firm capability would be 876 MW and not 1,016 MW as stated by Wapda.Such an estimate would be more in line with the load which can be reasonablyestimated for 1969/70. Wapda's and the Bank's sets of results are indicatedin Table VII.
21. Facilities required
a. Generation
One thermal plant in the Northern Zone is scheduled for operationin 1966, 132 I4W at Lyallpur. Construction has started in 1964 but costs willremain in the Third Plan period, i.e. Rs.107 million (see Table VIII). TheMain Grid (NIorthern Zone) has a deficit of 37 P&I forecast for 1966 even withthe new Lyallpur station. A mobile thermal plant of 20 iNW will be installedto meet part of the shortage in 1966. In 1967/69, the first three 100 W,units at M-langla are scheduled to come on the line and, although the margin issmall, the firm capacity in those years is surplus to requirement. However,by 1971 a fourth unit at 1Jangla of 100 MW is required. This has been includedunder the Third Plan at a total cost of Rs.120 million.
Shofn on Table VI is an item for an addition to the hydroelectricgenerating station at Wlarsak. Present maximum installed capacity of 160 MWat Warsak is limited to 100 111W at times of peak load by the damage caused todownstream irrigators by the fluctuations of the water releases from theplant. By the remodelling and extension or irrigation canals, the fullcapacity of the plant could be utilized, adding 60 1M1W to the system. Twoadditional 40 NW17 units for which provision was made in the original con-struction could also be installed, adding 80 Hl more, or a total addition tosystem capacity of 140 nW. However, the project outlined requires major re-arrangement of long established irrigation practices which will require a longperiod of discussion with landowners before acceptance. Although Wapda hasincluded lWarsak in its forecast of firm capability in 1970, it has been deemedproper by the Planning Commission to leave the Warsak project out of the ThirdPlan. This would imply that the Planning Commission estimates the total loadto be around 850 MW by 1969/70 and not 1,005 IMW as assessed by Wapda.
1/ Study of the Water and power resources of West Pakistan - February 15, 19657/ See paragraph 10 - a. Generation.

- 65 -
In the Southern Zone, additions to the present thermal plants ofHyderabad and Sukkur of 15 and 25 1W respectively mill be completed in theThird Plan.
Another major new thermal plant is planned for the Southern Zonewith a total capacity of about 200 WI. As shown in Table VI, the first two66 4W units are necessary to meet the loads in 1968/70. The tlird nnit wouldbe installed under the Fourth Plan. Discussions are still takLing place con-cerning the location of the plant. Additions to the Quetta generating plantwill be sufficient to carry the projected loads through about 1967.
b. Transmission
The Nkltan-Lyallpur second circuit wrill be finished early inthe Plan period. In the Northern Zone, the capacity at hangla which becomesavailable in 1967 must be transmitted to the load centers. This is providedfor under the program as shown in Table VIII. A part of the global allocationof Rs.145 million is to support the programs for tubewell electrification,village electrification and the other new consumers to be served.
The Southern Zone system consists at present mainly of the twoisolated systems, EIyderabad and Sukkur. Since the discovery of the NIari gasfields east of Sukkur affords genuine prospects of abundant low cost thermalgeneration at the gas field, the possibility of connecting Sukkur to Karac,aithrough M4oro and Hyderabad has been scheduled for the Third Plan period.2The interconnection between the Northern and Southern Zones is not scheduledbefore 1970. Other transmission scheduled in the Southern Zone is to supporttubewell and village electrification programs and to furnish supplies to othernew- customers.
c. Distribution
Projections made by Wapda for the period up to 1970 indicatethat it would be desirable to allocate 60% of the total plan provision forpower to distribution. Table VIII indicates a percentage of 57%. This con-firms the distribution problem now existing in the Grid area. The programsfor tubewell connections and village electrification are inditated separatelyin Table VIII. Wlapda had asked Rs.350 million for electrificatior of 5,000villages. On checking, it w^ras found that the actual cost of the scheme wasRs.325 million. However, the Plan allocation is only Rs.255 million.
It is estimated that 100,000 new customers will be connected eachyear of the Plan. The provision of these service connections is covered underSystem Additions and Rehabilitation at a total estimated cost of Rs.425 millionbut the Plan allocation has been reduced to Rs.450 million. All effcrtsshould be done to improve the distribution system during the next five years.
1/ See paragraphs on Karachi power supply.
- 66 -
Conclusions:
22. Power demand projected up to 1970 are high. However, alternativeprojections do not show that llapda forecast is entirely unrealistic, Sinceno financial provision is made in the Plan for the Warsak project and sinceit is known that resources are urgently needed to improve the distributionsystem which is getting almost 60/o of the total Plan allocation, the missionfeels that the PLanned expenditure of Rs.1,707.8 millicn should not be con-sidered as excessive.
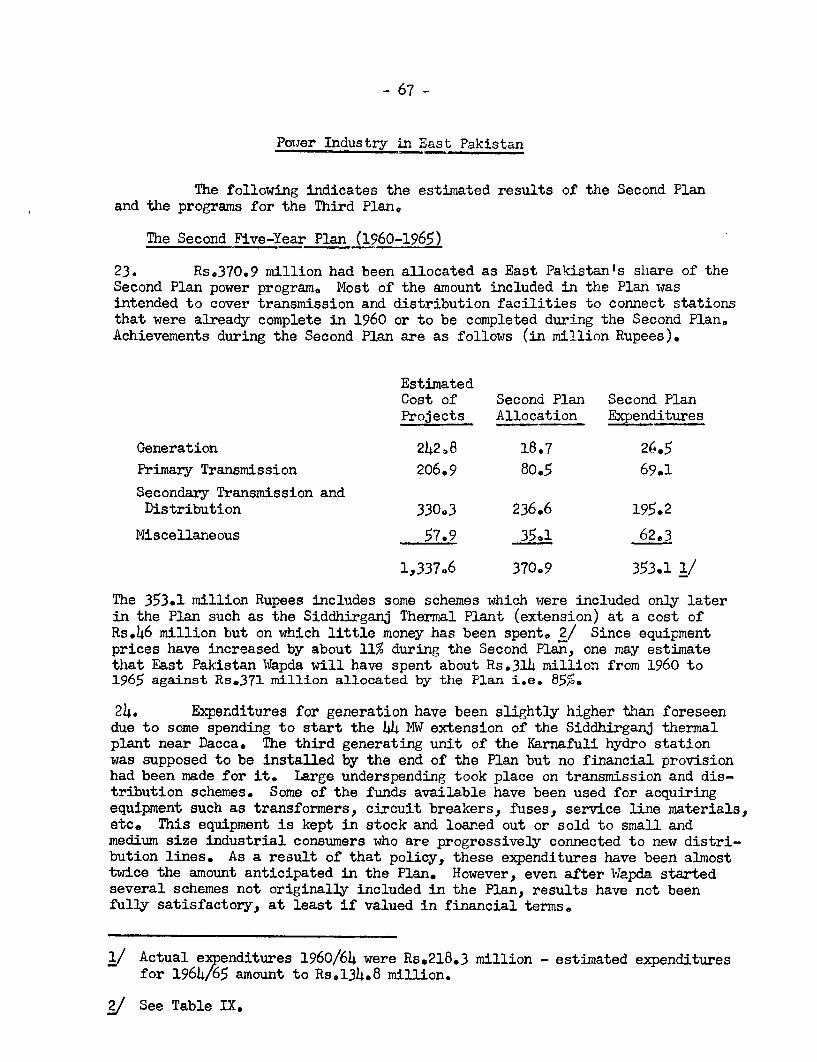
- 67 -
Powier Industry in East Pakistan
The following indicates the estimated results of the Second Planand the programs for the Third Plan.
The Second Five-Year Plan (1960-1965)
23. Rs.370.9 million had been allocated as East Pakistan's share of theSecond Plan power program. Most of the amount included in the Plan wasintended to cover transmission and distribution facilities to connect stationsthat were already complete in 1960 or to be completed during the Second Plan.Achievements during the Second Plan are as follows (in million Rupees).
EstimatedCost of Second Plan Second PlanProjects Allocation Expenditures
Generation 242,8 18.7 26.5
Primary Transmission 206.9 80.5 69.1Secondary Transmission andDistribution 330.3 236.6 195.2
Miscellaneous 57.9 35.1 62.3
1,337.6 370.9 353.1 1/
The 353.1 million Rupees includes some schemes which were included only laterin the Plan such as the Siddhirganj Thermal Plant (extension) at a cost ofRs.46 million but on which little money has been spent. 2/ Since equipmentprices have increased by about 11% during the Second Plan, one may estimatethat East Pakistan Wapda will have spent about Rs.314 million from 1960 to1965 against Rs,371 million allocated by the Plan i.e. 85`.
24. Expenditures for generation have been slightly higher than foreseendue to some spending to start the 44 MW extension of the Siddhirganj thermalplant near Dacca. The third generating unit of the Karnafuli hydro stationwas supposed to be installed by the end of the Plan but no financial provisionhad been made for it. Large underspending took place on transmission and dis-tribution schemes. Some of the funds available have been used for acquiringequipment such as transformers, circuit breakers, fuses, service line materials,etc. This equipment is kept in stock and loared out or sold to small andmedium size industrial consumers who are progressively connected to new distri-bution lines. As a result of that policy, these expenditures have been almosttwice the amount anticipated in the Plan. However, even after Wapda startedseveral schemes not originally included in the Plan, results have not beenfully satisfactory, at least if valued in financial terms.
1 Actual expenditures 1960/64 were Rs.218.3 million - estimated expendituresfor 1964/65 amount to Rs,134.8 million.
/ See Table IX.
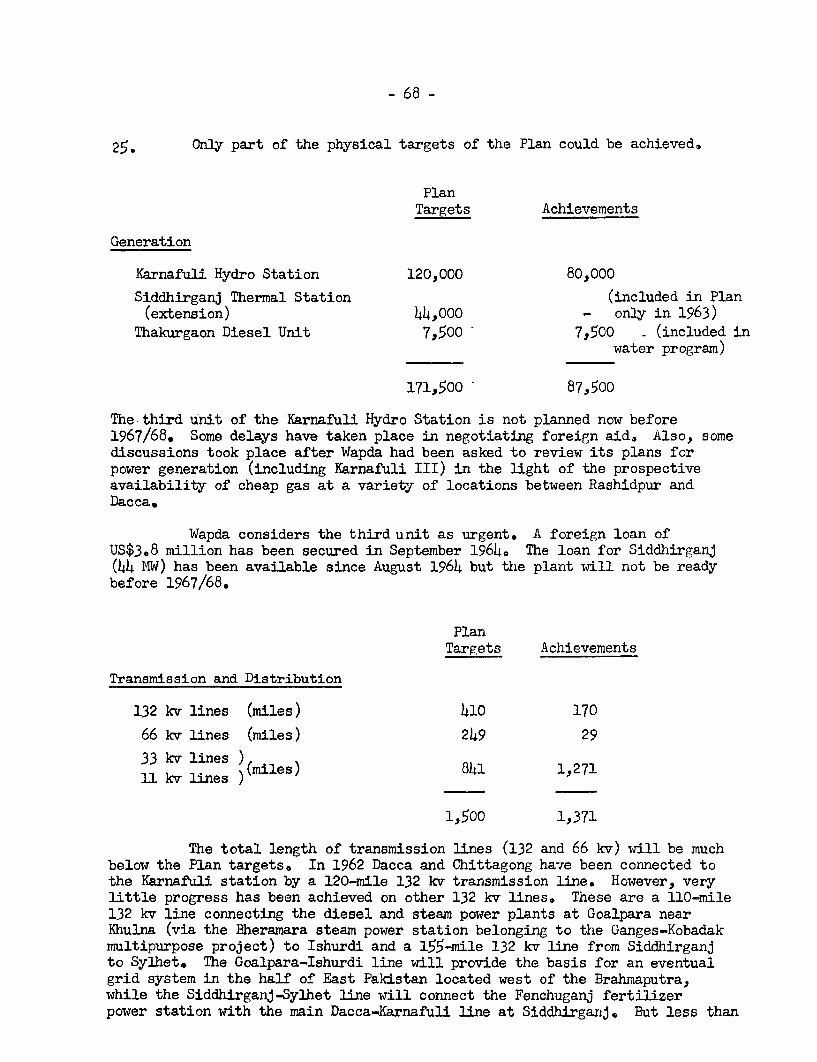
- 68 -
25. Only part of the physical targets of the Plan could be achieved,
PlanTargets Achievements
Generation
Karnafuli Hydro Station 120,000 80,000
Siddhirganj Thermal Station (included in Plan(extension) 44,000 - only in 1963)
lThakurgaon Diesel Unit 7,500 7,500 - (included inwater program)
171,500 87,500
The third unit of the Karnafuli Hydro Station is not planned now before1967/68. Some delays have taken place in negotiating foreign aid. Also, somediscussions took place after Wapda had been asked to review its plans forpower generation (including Karnafuli III) in the light of the prospectiveavailability of cheap gas at a variety of locations between Rashidpur andDacca.
Wapda considers the third unit as urgent. A foreign loan ofUS$3.8 million has been secured in September 19640 The loan for Siddhirganj(44 MW) has been available since August 1964 but the plant will not be readybefore 1967/68.
PlanTargets Achievements
Transmission and Distribution
132 kv lines (miles) 410 170
66 kv lines (miles) 249 29
33 kv lines (m ) 841 1,271
1,500 1,371
The total length of transmission lines (132 and 66 kv) will be muchbelow the Plan targets. In 1962 Dacca and Chittagong have been connected tothe Karnafuli station by a 120-mile 132 kv transmission line. However, verylittle progress has been achieved on other 132 kv lines. These are a 110-mile132 kv line connecting the diesel and steam power plants at Goalpara nearKhulna (via the Bheramara steam power station belonging to the Ganges-Kobadakmultipurpose project) to Ishurdi and a 155-mile 132 kv line from Siddhirganjto Sylhet. The Goalpara-Ishurdi line will provide the basis for an eventualgrid system in the half of East Pakistan located west of the Brahmaputra,while the Siddhirganj-Sylhet line will connect the Fenchuganj fertilizerpower station with the main Dacca-Karnafuli line at Siddhirgarnj But less than
- 69 -
25% of the physical work will have been done by June 1965 on the Goalpara lineand a little more than 10% on the Siddhirganj line, Hopefully both theseprojects are expected to be completed in 1967.
Some progress has been made for 33 kv and 11 kv lines and the mileageto be reached in 1965 should be above Plan targets. However, the quality ofdistribution remains a very weak point. To improve the situation at Khulnaand Kushtia, a French firm has completed a survey of the existing distributionsystem and is now engaged on the design of an improved network. Until thedistribution system is improved in East Pakistan, there is no possibility ofexisting generating capacity being fully utilized.
26. From 1960 to 1964, total electric generation increased from 190 to460 million kwh. The number of consumers has increased from 40,000 to almost100,000. Industrial is by far the most important use, Since 1960, the systemhas generally met demands. The peak demand reached 96.4 MW in December 1964and the dependable capacity was about 145 MW (see Table X), For the improve-ment of power outside the grid system, Wapda initiated a scheme known as"Isolated Power Generation and Distribution Project." Under this scheme dieselunits with necessary distribution systems are being installed in places exper-iencing a local shortage of power,
27. The installed capacity of Wapda in the Eastern Grid of East Pakistanis now 138,570 kw, an increase of 81,000 kw over the 1960 level due to thecompletion of two units of 40;000 kw each at Karnafuli in 1962. Since thencapacity has remained practically at the same level (see Table XI)e Theinstalled capacity in the area west of the Brahmaputra increased from 29,230kw in 1960 to 40,880 kw in 1964 due to the installation of additionalcapacity at the Goalpara steam plant and to the installation of a 7,500 kw.diesel station at Thakurgaon. The existing facilities are still above thepresent peak requirements of about 25,000 kw.
28. Industrial captive capacity is needed to supplement existing publicutilities, The capacity now stands at 110,000 kw after the installation of32,000 kw at Fenchuganj fertilizer factory. The Karnafuli paper mill has a14.,000 kw steam station and the newsprint mill at Khulna a 16,000 kw. powerhouse.
29. In conclusion, several major objectives of the Second Plan have notbeen achieved, The Plan target that two real major grid systems be establishedin East Pakistan separated by the Brahmaputra River has not been met, Also, asa result of a rapidly growing demand, more capacity is now needed and someshortage may develop in 1965/66. Even if new capacity can be rapidly in-stalled, the poor quality of the distribution system and the lack of qualifiedpersonnel remain unresolved problems.
The Third Five-Year Plan
30. The Power Program of Wapda for the Third Five-Year Plan is estimatedto cost Rs.l,481.3 million 1/ versus Rs.353.1 million spent during the SecondPlan. The following paragraphs present the estimated future needs and theprograms for the Third Five-Year Plan.
2 See detailed program in Table XII and Table XIII.
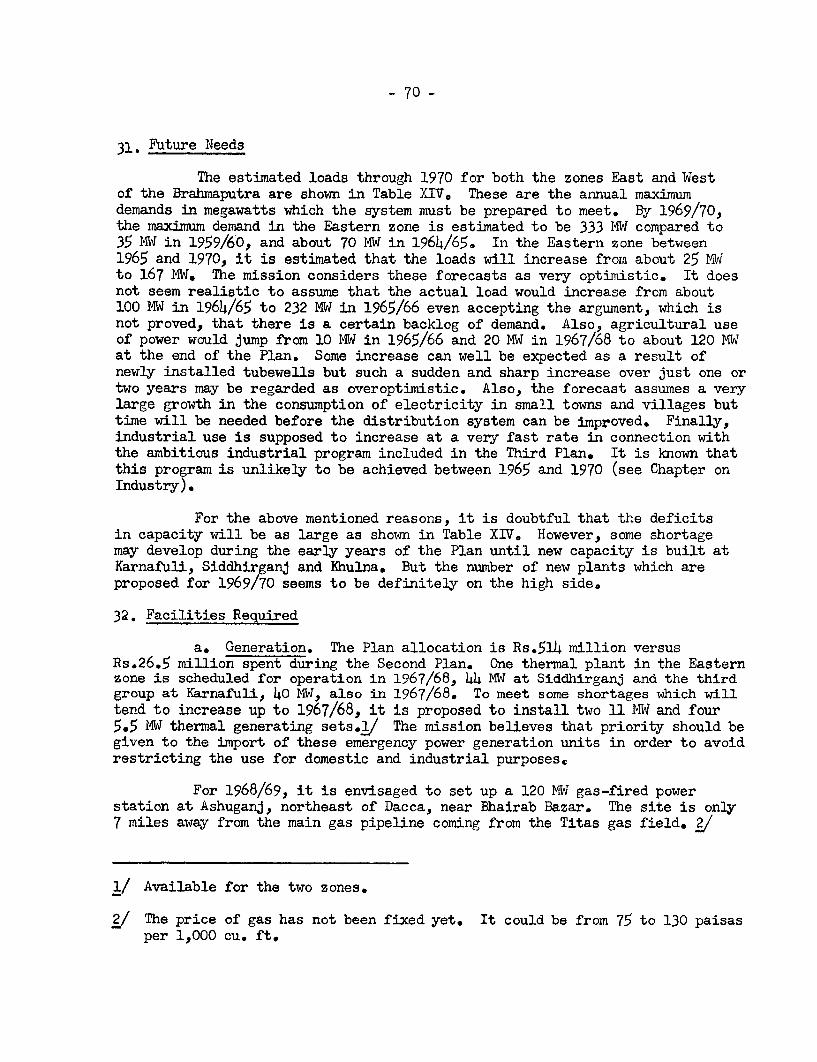
- 70 -
31. Future Needs
The estimated loads through 1970 for both the zones East and Westof the Brahmaputra are shown in Table XIV. These are the annual maximumdemands in megawatts which the system must be prepared to meet. By 1969/70,the maximum demand in the Eastern zone is estimated to be 333 IMW compared to35 MW in 1959/60, and about 70 MW in 1964/65. In the Eastern zone between1965 and 1970, it is estimated that the loads will increase frorn about 25 MWto 167 MW. The mission considers these forecasts as very optimistic. It doesnot seem realistic to assume that the actual load would increase from about100 MW in 1964/65 to 232 MW in 1965/66 even accepting the argument, which isnot proved, that there is a certain backlog of demand. Also, agricultural useof power would jump from 10 MW in 1965/66 and 20 MW in 1967/68 to about 120 MWat the end of the Plan. Some increase can well be expected as a result ofnewly installed tubewells but such a sudden and sharp increase over just one ortwo years may be regarded as overoptimistic. Also, the forecast assumes a verylarge growth in the consumption of electricity in small towns and villages buttime will be needed before the distribution system can be improved. Finally,industrial use is supposed to increase at a very fast rate in connection withthe ambitious industrial program included in the Third Plan. It is known thatthis program is unlikely to be achieved between 1965 and 1970 (see Chapter onIndustry).
For the above mentioned reasons, it is doubtful that the deficitsin capacity will be as large as shown in Table XIV. However, some shortagemay develop during the early years of the Plan until new capacity is built atKarnafuli, Siddhirganj and Khulna. But the number of new plants which areproposed for 1969/70 seems to be definitely on the high side.
32. Facilities Required
a. Generation. The Plan allocation is Rs.514 million versusRs.26.5 million spent during the Second Plan. One thermal plant in the Easternzone is scheduled for operation in 1967/68, 44 MW at Siddhirganj and the thirdgroup at Karnafuli, 40 MW, also in 1967/68. To meet some shortages which willtend to increase up to 1967/68, it is proposed to install two 11 MW and four5.5 MW thermal generating sets.j2 The mission believes that priority should begiven to the import of these emergency power generation units in order to avoidrestricting the use for domestic and industrial purposese
For 1968/69, it is envisaged to set up a 120 MW gas-fired powerstation at Ashuganj, northeast of Dacca, near Bhairab Bazar. The site is only7 miles away from the main gas pipeline coming from the Titas gas field. /
1/ Available for the two zones.
/ EThe price of gas has not been fixed yet. It could be from 75 to 130 paisasper 1,000 cu. ft.
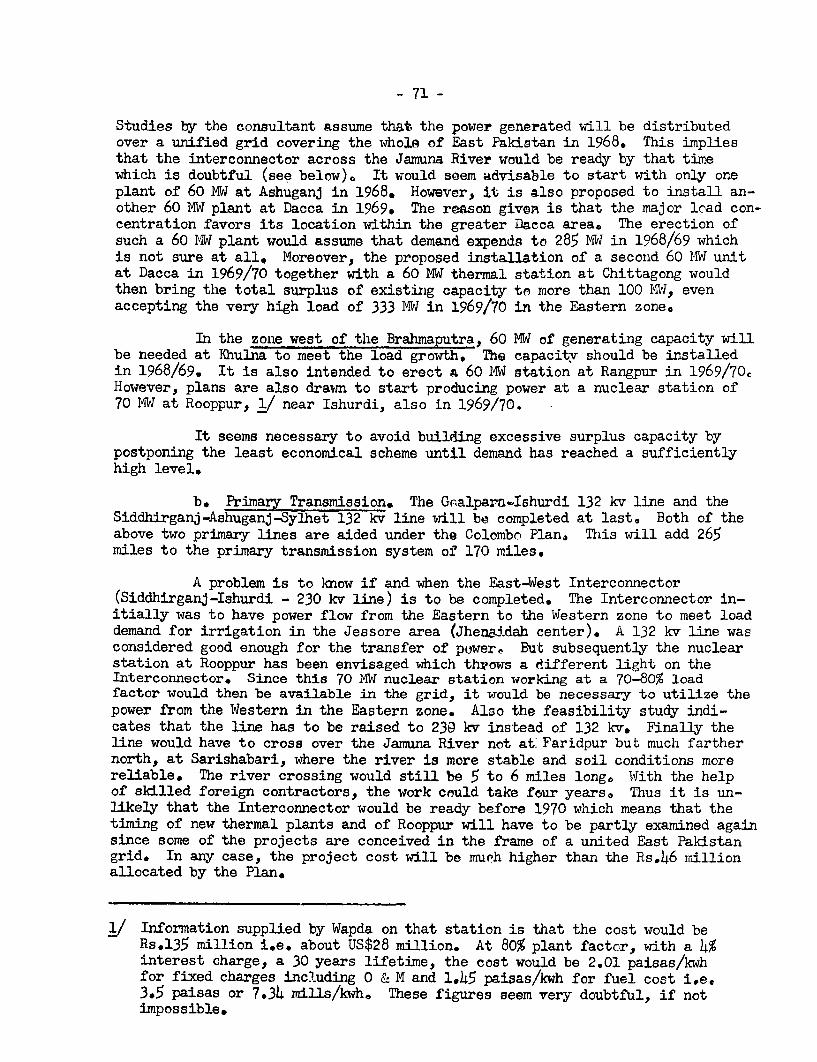
- 71 -
Studies by the consultant assume that the power generated will be distributedover a unified grid covering the whole of East Pakistan in 1968. This impliesthat the interconnector across the Jamuna River would be ready by that timewhich is doubtful (see below)0 It would seem advisable to start with only oneplant of 60 MW at Ashuganj in 1968. However, it is also proposed to install an-other 60 MW plant at Dacca in 1969. The resson given is that the major load con-centration favors its location within the greater Dacca area. The erection ofsuch a 60 NW plant would assume that demand expends to 285 MW in 1968/69 whichis not sure at all. Moreover, the proposed installation of a second 60 MW unitat Dacca in 1969/70 together with a 60 MW thermal station at Chittagong wouldthen bring the total surplus of existing capacity to more than 100 MW, evenaccepting the very high load of 333 MW in 1969/70 in the Eastern zone.
In the zone west of the Brahmaputra, 60 MW of generating capacity willbe needed at Khulna to meet the load growth. The capacitv should be installedin 1968/69. It is also intended to erect A 60 MW station at Rangpur in 1969/70cHowever, plans are also drawn to start producing power at a nuclear station of70 MW at Rooppur, 2/ near Ishurdi, also in 1969/704
It seems necessary to avoid building excessive surplus capacity bypostponing the least economical scheme until demand has reached a sufficientlyhigh level.
b. Primary Transmission. The GralparanIshurdi 132 kv line and theSiddhirganj-Ashuganj-Sylhet 132 kv line will be completed at last. Both of theabove two primary lines are aided under the Colombo Plan,, This will add 265miles to the primary transmission system of 170 miles.
A problem is to know if and when the East-West Interconnector(Siddhirganj-Ishurdi - 230 kv line) is to be completed. The Interconnector in-itially was to have power flow from the Eastern to the Western zone to meet loaddemand for irrigation in the Jessore area (JhenBJidah center). A 132 kv line wasconsidered good enough for the transfer of powere But subsequently the nuclearstation at Rooppur has been envisaged which throws a different light on theInterconnector. Since this 70 IMW nuclear station working at a 70-80% loadfactor would then be available in the grid, it would be necessary to utilize thepower from the Western in the Eastern zone. Also the feasibility study indi-cates that the line has to be raised to 239 kv instead of 132 kv. Finally theline would have to cross over the Jamuna River not at: Faridpur but much farthernorth, at Sarishabari, where the river is more stable and soil conditions morereliable. The river crossing would still be 5 to 6 miles long. With the helpof skilled foreign contractors, the work could take four years. Thus it is un-likely that the Interconnector would be ready before 1970 w1hich means that thetiming of new thermal plants and of Rooppur will have to be partly examined againsince some of the projects are conceived in the frame of a united East Pakistangrid. In any case, the project cost will be mueh higher than the Rs.46 millionallocated by the Plan.
1/ Information supplied by Wapda on that station is that the cost would beRs.135 million i.e. about US$28 million. At 80% plant factor, with a 4%interest charge, a 30 years lifetime, the cost would be 2.01 paisas/kwhfor fixed charges including 0 & M and L.45 paisas/kwh for fuel cost i.e.3.5 paisas or 7.34 mills/kwhe These figures seem very doubtful, if notimpossible.
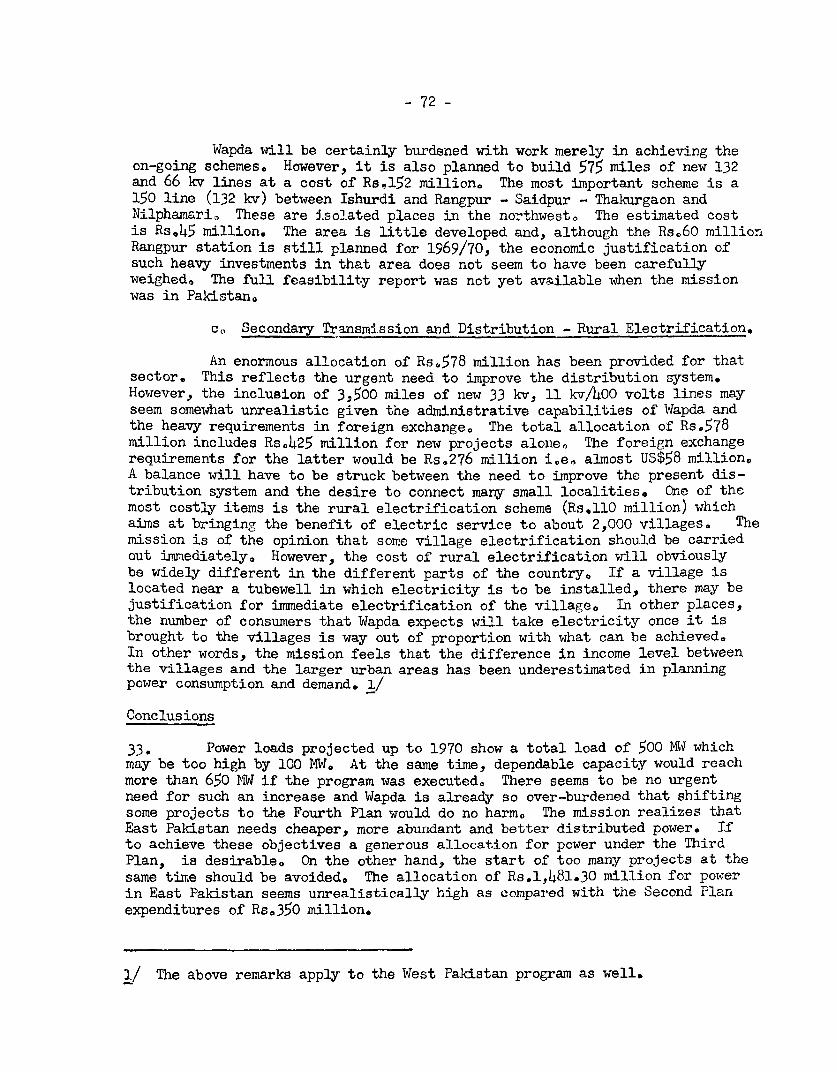
- 72 -
Wapda will be certainly burdened with work merely in achieving the
on-going schemes. However, it is also planned to build 575 miles of new 132
and 66 kv lines at a cost of Rs.152 million. The most important scheme is a
150 line (132 kv) between Ishurdi and Rangpur - Saidpur - Thakurgaon and
Nilphamari. These are isolated places in the northwest. The estimated cost
is Rs.45 million. The area is little developed and, although the Rse60 million
Ranigpur station is still planned for 1969/70, the economic justification of
such heavy investments in that area does not seem to have been carefully
weighed. The full feasibility report was not yet available when the mission
was in Pakistan.
c. Secondary Transmission and Distribution - Rural Electrification.
An enormous allocation of Rs-578 million has been provided for that
sector. This reflects the urgent need to improve the distribution system.
However, the inclusion of 3,500 miles of new 33 kv, 11 kv/400 volts lines mayseem somewhat unrealistic given the administrative capabilities of Wapda and
the heavy requirements in foreign exchange. The total allocation of Rs.578
million includes Rso425 million for new projects alone0 The foreign exchange
requirements for the latter would be Rs.276 million i.e., almost US$58 million.
A balance will have to be struck between the need to improve the present dis-
tribution system and the desire to connect many small localities. One of the
most costly items is the rural electrification scheme (Rs.110 million) which
aims at bringing the benefit of electric service to about 2,000 villages. The
mission is of the opinion that some village electrification should be carried
out immediately. However, the cost of rural electrification will obviously
be widely different in the different parts of the country, If a village is
located near a tubewell in which electricity is to be installed, there may be
justification for immediate electrification of the village. In other places,
the number of consumers that Wapda expects will take electricity once it is
brought to the villages is way out of proportion with what can be achieved.
In other words, the mission feels that the difference in income level between
the villages and the larger urban areas has been underestimated in planning
power consumption and demand. 1/
Conclusions
33. Power loads projected up to 1970 show a total load of 500 MW whichmay be too high by 100 MW. At the same time, dependable capacity would reach
more than 650 MW if the program was executed. There seems to be no urgent
need for such an increase and Wapda is already so over-burdened that shifting
some projects to the Fourth Plan would do no harm0 The mission realizes that
East Pakistan needs cheaper, more abundant and better distributed power. If
to achieve these objectives a generous allocation for power under the Third
Plan, is desirable, On the other hand, the start of too many projects at the
same time should be avoided, The allocation of Rs.1,483130 million for power
in East Pakistan seems unrealistically high as compared with the Second Plan
expenditures of Rso350 million.
1/ The above remarks apply to the West Pakistan program as well.
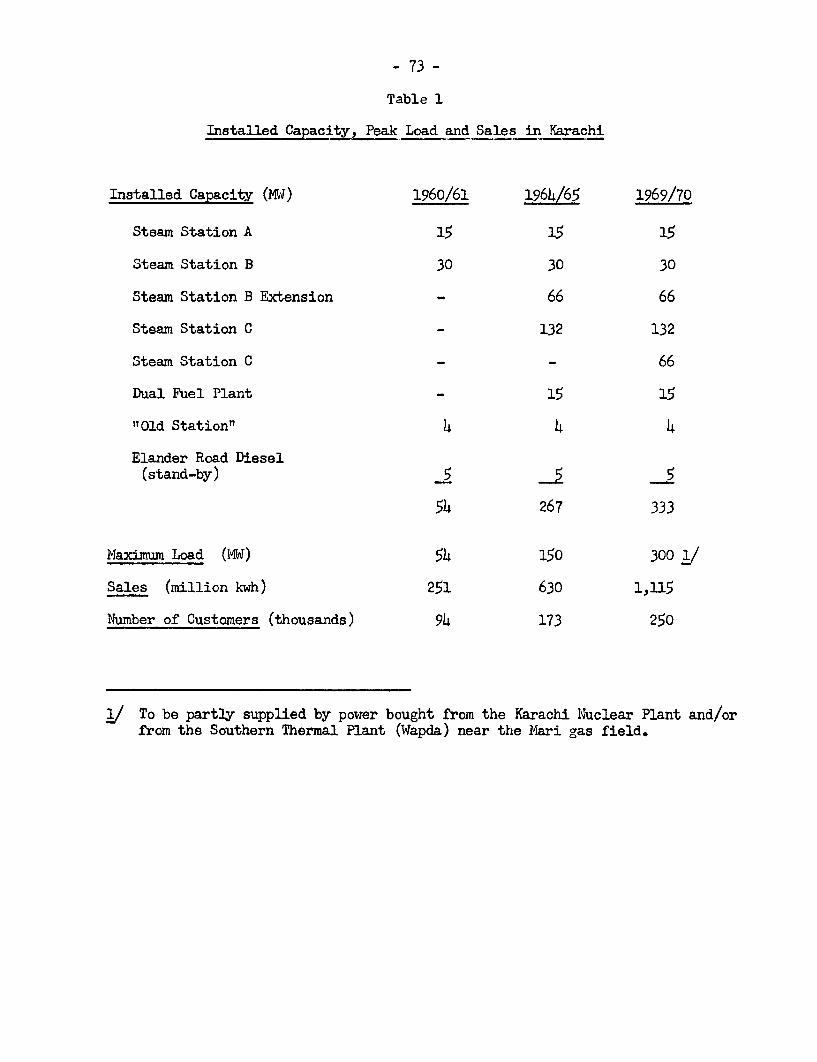
- 73 -
Table 1
Installed Capacity, Peak Load and Sales in Karachi
Installed Capacity (MW) 1960/61 1964/65 1969/70
Steam Station A 15 15 15
Steam Station B 30 30 30
Steam Station B Extension - 66 66
Steam Station C - 132 132
Steam Station C - - 66
Dual Fuel Plant - 15 15
"Old Station" 4 4 4
Elander Road Diesel(stand-by) 5 5 5
54 267 333
Maximum Load (MqW) 54 150 300 i/
Sales (million kwh) 251 630 1,115
Number of Customers (thousands) 94 173 250
j/ To be partly supplied by power bought from the Karachi Nuclear Plant and/orfrom the Southern Thermal Plant (Wapda) near the Mari gas field.

- 74 -
Table 2
Wapda Investments for the Second Plan (1960-1965) - (West Pakistan)
(Rs. million)
Cost of Expenditures Plan 2nd Plan Total CostProject Before 2nd Plan Provision Expenditures (2 + 4)
(est.)I. GENEATION
Piultan 10810 9l105 15.5 19.5 llleOMultan Extension 140.8 (117?) - 110 0 138o7 138.7Hyderabad 54.5 8.3 32,3 39.0 47,3
Hyderabad Extension 20.0 - 20,0 16.9 16.9
Sukkur 58.0 - 53.0 57.0 57.0
Quetta 37.3 0,2 3703 40.8 41.0
Gujranwala 51,1 30,5 16,3 23.0 53.5
Shadiwal 40.1 20.5 4.7 6.2 26.7
Chichoki 27.5 16.3 _ 6.4 22.7
537.3 167.3 289.1 347.5 514.8
II. RESEARCH 4.7 - 4.7 4.2 4.2
iII. DISTRIBUTION andTRANSMISSION
Power Distribution 350,0 65,8 276.0 340.0 405.8
WP HT Grid 121.1 48.6 92.4 112,4 161.0Secondary T. andDist. 292,3 21,2 201.4 271.0 292.2
Village Electri-fication 325,0 - 190o6 45.0 45.0
Multan-Lyallpur220 kv 26,0 22.4 3.7 6.2 28.6
Second Circuit Multan-Lyallpur 24.9 - 11.7 4.6 4.6
1,139.3 158.o 775,8 779.2 937.2
IV. ADDITIONAL SCHEMES
Generation(L.yallpur) 137.5 - 32.3 32,3
Sukkur Thermal 78,6 - 1804 18,e4
216.1 - 50.7 50.7
V * TTYfAL 1,89704 325.3 1,069.6 1,181.6 1,506.9

- 75 -
Table 3
Electric Energy Consumption - Wapda Grid - 1960-1964
(million kwh)
Increase1960 1961 1962 1963 1964 (est.) 1960-1964
General 96.5 122.0 151.9 175.3 205.5 + 109.0
Industrial 398.8 452.6 544.0 624.0 670.0 + 271.2
Bulk (mostlyindustrial) 49.5 72.1 88.7 99.4 109.4 + 59*9
Agricultural 1/ 86.6 127.5 229.1 370.5 508.0 + 421.4
Public Lighting 4,3 5e8 6.8 8.2 9.8 + 5,5
Total Sales 635.7 780.0 1,020.5 1,277.4 1,502.7 + 867.0
Wapda Use 25.4 32.5 35.4 34.1 35.O + 9.6
Uraccounted forand Losses 116.3 211.5 298.3 390.7 456.4 + 340o1
Total Energy 77704 1,024.0 1,354.2 1,702.2 1,994.1 + 1,216,7
Peak Demand and Load Factor in the Wapda Grid - 1960-1964(M4W)
1960 1961 1962 1963 1964 (est.)
Basic Load 152 189 232 295 345
ReclamationTubewells - 5 21 22 31
Total Demand 152 194 253 317 376
Load Factor 58.4% 60.5% 56.2% 61.4% 60.5%
1/ Including reclamation tubewells.
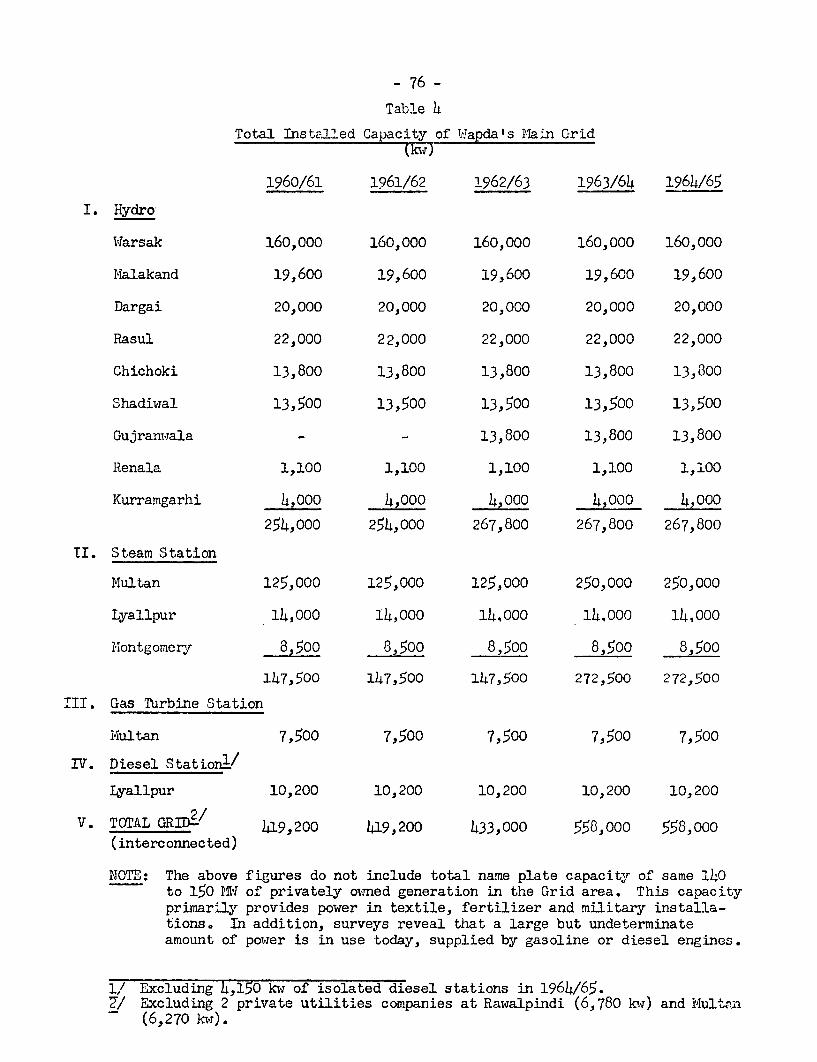
- 76 -
Table 4
Total Installed Capacity of Wapda's Main Grid(krw)
1960/61 1961/62 1962/63 1963/64 1964/65
I. Hydro
Warsak 160,000 160,000 160,000 160,000 160,000
IIalakand 19,600 19,600 19,600 19,600 19,600
Dargai 20,000 20,000 20,000 20,000 20,000
Rasul 22,000 22,000 22,000 22,000 22,000
Chichoki 13,800 13,800 13,800 13,800 13,800
Shadiwal 13,500 13,500 13,500 13,500 13,500
Gujranmala _ - 13,800 13,800 13,800
Renala 1,100 1,100 1,100 1,100 1,100
Kurramgarhi 4,000 4,000 4,000 4,000 4,000
254,000 254,000 267,800 267,800 267,800
II. Steam Station
Multan 125,000 125,000 125,000 250,000 250,000
Lyallpur 14,000 14,000 14,000 14,000 14,000
Iontgomery 8,500 8,500 8,500 8,500 8,500
147,500 147,500 147,500 272,500 272,500
TII. Gas Turbine Station
Multan 7,500 7,500 7,500 7,500 7,500
IV. Diesel Stationl./
Lyallpur 10,200 10,200 10,200 10,200 10,200
V. TOTAL GRID2/ 419,200 419,200 433,000 558,000 558,000(interconnected)
NOTE: The above figures do not include total name plate capacity of same 140to 150 rMw of privately o'med generation in the Grid area. This capacityprimarily provides power in textile, fertilizer and military installa-tions. In addition, surveys reveal that a large but undeterminateamount of power is in use today, supplied by gasoline or diesel engines.
1/ Excluding 4,150 kw of isolated diesel stations in 1964/65.7/ Excluding 2 private utilities companies at Rawalpindi (6,780 kw) and Multun
(6,270 kf).
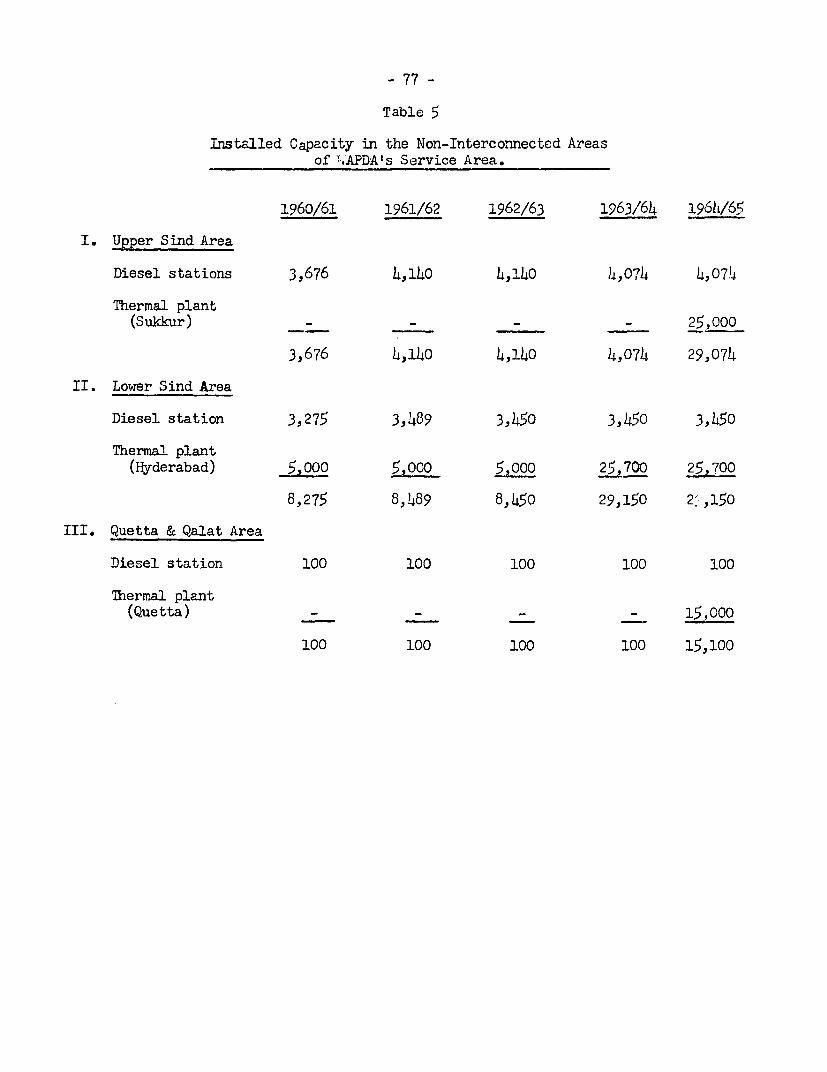
- 77 -
Table 5
Installed Capacity in the Non-Interconnected Areasof ~.APDA's Service Area.
1960/61 1961/62 1962/63 1963/64 196lL/65
I. Upper Sind Area
Diesel stations 3,676 4,140 4,140 4,074 4,074
Thermal plant(Sukkur) _ - - 25,000
3,676 4,l140 4,140 4,074 29,074
II. Lower Sind Area
Diesel station 3,275 3,489 3,450 3,45o 3,45o
Thermal plant(Hyderabad) 5,000 500 5 ,000 25,700 25,700
8,275 8,489 8,450 29,150 2: ,150
III. Quetta & Qalat Area
Diesel station 100 100 100 100 100
Thermal plant(Quetta) _ _ _ 15,000
100 100 100 100 15,100
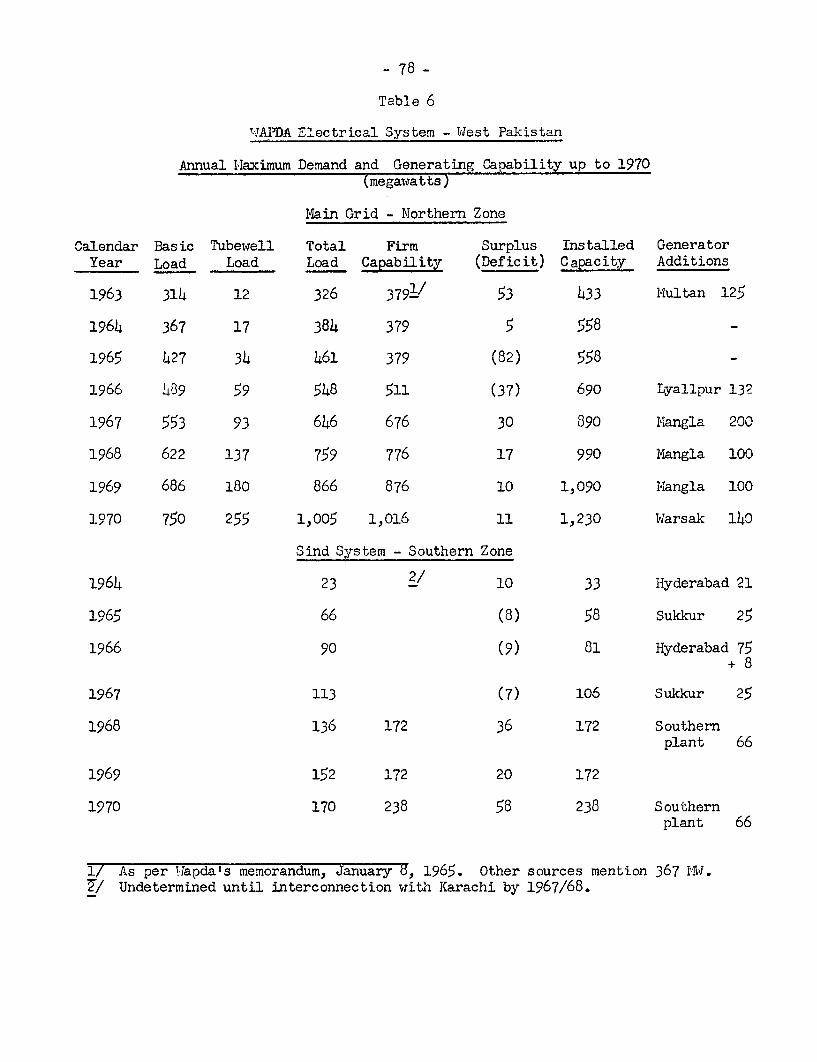
- 78 -
Table 6
WJAPDA Electrical System - West Pakistan
Annual Ilaximum Demand and Generating Capability up to 1970(megawatts)
Main Grid - Northern Zone
Calendar Basic Tubewell Total Firm Surplus Installed GeneratorYear Load Load Load Capability (Deficit) Capacity Additions
1963 314 12 326 3791/ 53 433 Multan 125
1964 367 17 384 379 5 558 _
1965 427 34 461 379 (82) 558 _
1966 489 59 548 511 (37) 690 Lyallpur 13?
1967 553 93 646 676 30 890 Mlangla 200
1968 622 137 759 776 17 990 Mangla 100
1969 686 180 866 876 10 1,090 IMIangla 100
1970 750 255 1,005 1,016 11 1,230 Warsak 140
Sind System - Southern Zone
1964 23 2/ 10 33 Hyderabad 21
1965 66 (8) 58 Sukkur 25
1966 90 (9) 81 Hyderabad 75+ 8
1967 113 (7) 106 Sukkur 25
1968 136 172 36 172 Southernplant 66
1969 152 172 20 172
1970 170 238 58 238 Southernplant 66
1/ As per Wapda's memorandum, January d, 1965. Other sources mention 367 INb.2/ Undetermined until interconnection with Karachi by 1967/68.
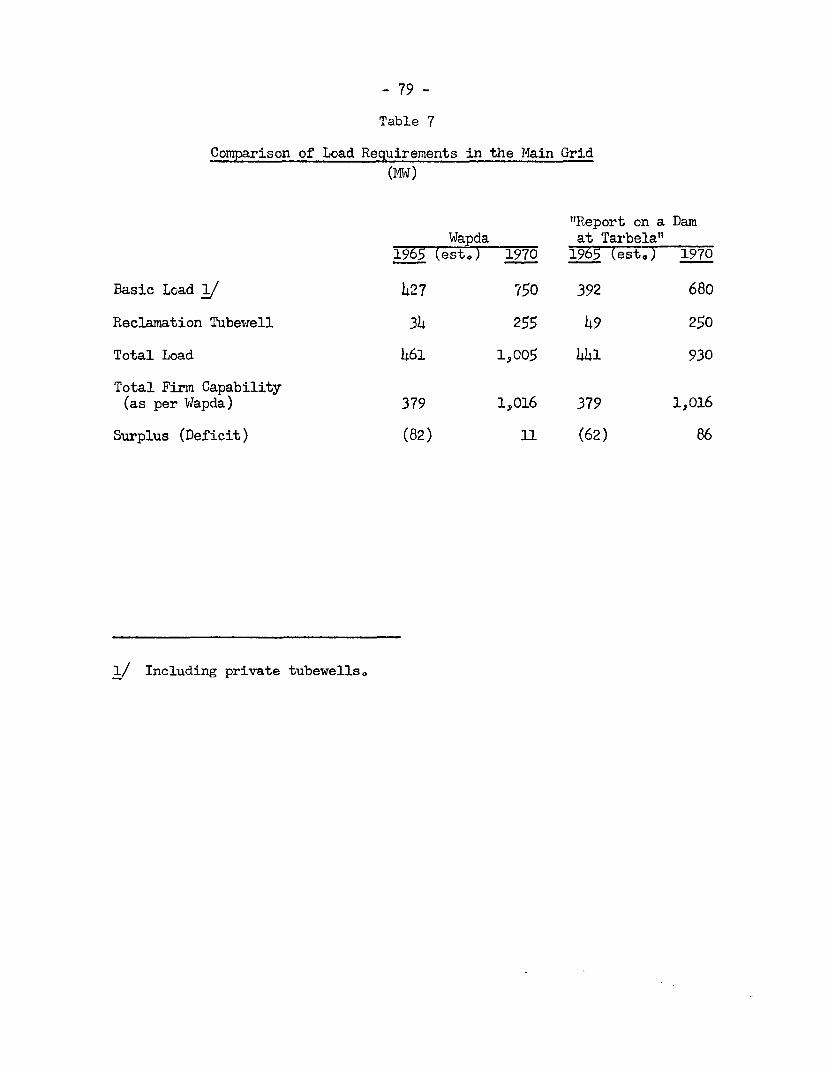
- 79 -
Table 7
Comparison of Load Requirements in the Main Grid
(MW)
"Report on a DamWapda at Tarbela"
1965 (est.) 1970 1965 (est.) 1970
Basic Load 4 427 750 392 680
Reclamation Tubeawell 34 255 49 250
Total Load 461 19005 441 930
Total Firm Capability(as per Wapda) 379 1,016 379 1,016
Surplus (Deficit) (82) 11 (62) 86
1/ Including private tubewells.
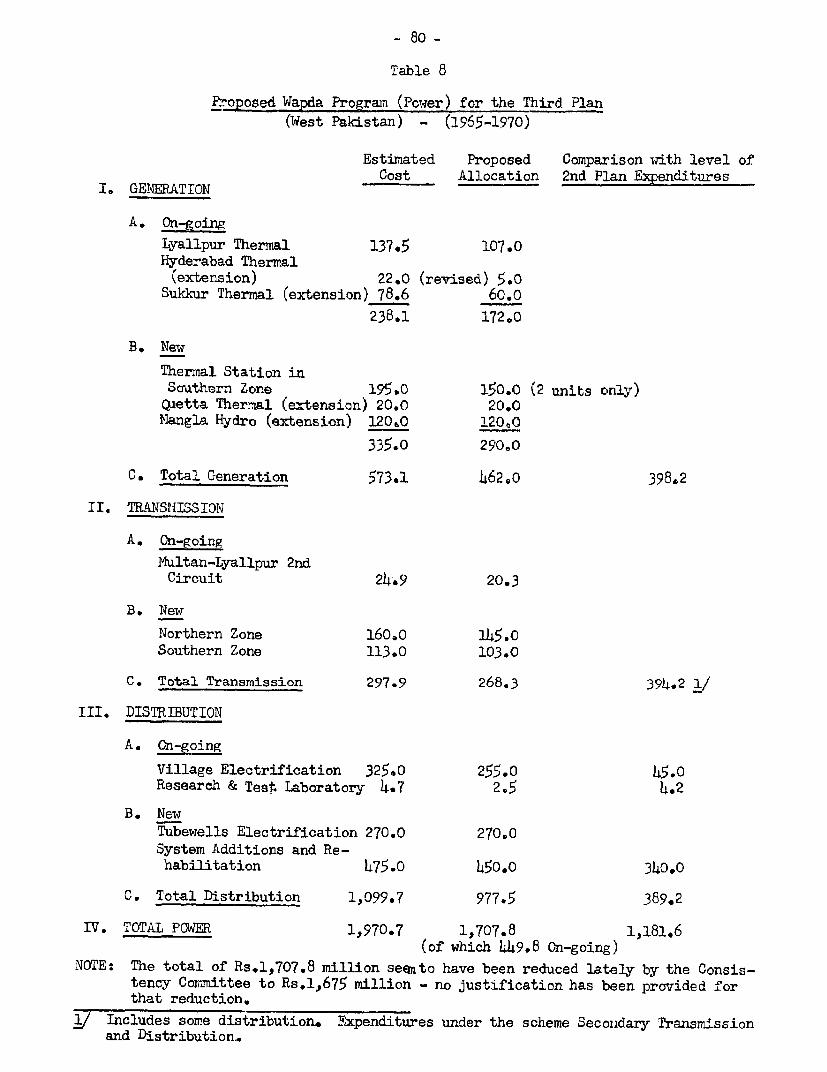
- 80 -
Table 8
PrFoposed Wapda Prograa (Power) for the Third Plan(West Pakistan) - (2965-1970)
Estimated Proposed Comparison with level ofCost Allocaticn 2nd Plan Expenditures
I. GLNERATION
A. On-going
Lyallpur Thermal 137.5 107.0Hyderabad Thermal
(extension) 22.0 (revised) 5.0Sukkur Thermal (extension) 78.6 60.0
238.1 172,0
B. New
Thermal Station inSouthern Zone 195.0 150.0 (2 units only)Quetta Thermal (extension) 20.0 20.0Mangla Hydro (extension) 120e0 120,0
335.0 290,0
C. Total Generation 573.1 462.0 398.2
II, TRANSIIISSION
A. On-going
Multan-Lyallpur 2ndCircuit 24.9 20.3
B. New
Northern Zone 160.0 145.0Southern Zone 113e0 103.0
C. Total Transmission 297.9 268.3 394.2 1/
III. DISTRIBUTION
A. 'n-going
Village Electrification 325.0 255.0 45.0Research & Test Laboratory 4.7 2,5 4.2
B. NewTubewells Electrification 270.0 270.0System Additions and Re-habilitation 475.0 450.0 34.0o
C. Total Distribution 1,099.7 977.5 389.2
IV. TOTAL POWER 1,970.7 1,707.8 1,181.6(of which 449.8 On-going)
NOTE: The total of Rs.l,707.8 million seento have been reduced lately by the Consis-tency Committee to Rs.1,675 million - no justification has been provided forthat reduction,
j Includes some distribution. Expenditures under the scheme Seconldary Transmissionand Distribution.
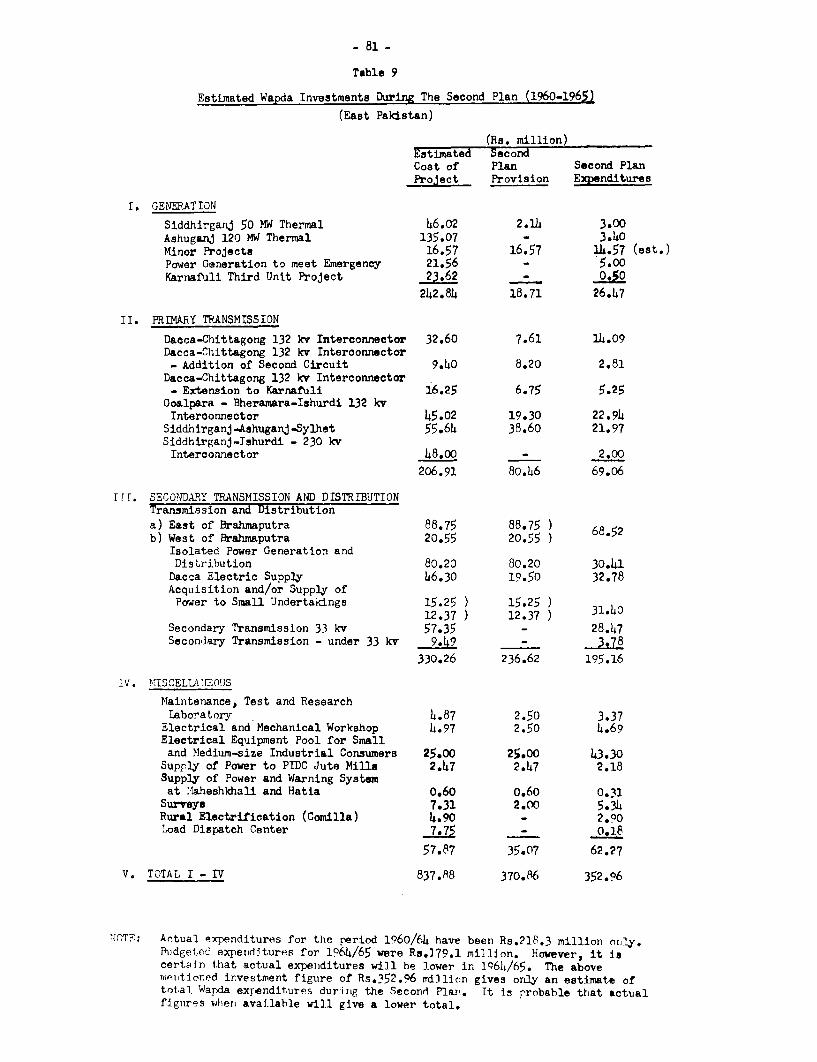
- S1 -
Table 9
Estimated Wapda Investments During The Second Plan (1960-1965)
(East Pakistan)
(Re. million)Estimated SecondCost of Plan Second PlanProject Provision Expenditures
I. GENERATION
SiddhirganJ 50 MW Thermal 46.02 2.14 3.00Ashuganj 120 MW Thermal 135.07 - 3.40Minor Projects 16.57 16.57 14.57 (est.)Power Generation to meet Emergency 21.56 - 5.00Karnafuli Third Unit Project 23.62 _ 0.%0
242.84 18.71 26.47
II. PRIMARY TRANSMISSION
Dacca-Chittagong 132 kv Interconnector 32.60 7.61 14.09Dacca-Chittagong 132 kv Interconnector- Addition of Second Circuit 9.40 8.20 2.81
Dacca-Chittagong 132 kv Interconnector- Extension to Karnafuli 16.25 6.75 5.25
Goalpara - Bheramara-Ishurdi 132 kvInterconnector 45.02 19.30 22.94
Siddhirganj-Ashuganj-Sylhet 55.64 38.60 21.97Siddhirganj-Ishurdi - 230 kvInterconnector 48.oo - 2.00
206.91 80.46 69.06
ir t. SECONDARY TRANSMISSION AND DISTRIBUTIONTransmission and Distributiona) East of Brahmaputra 88.75 88.75 ) 68.52b) West of Brahmaputra 20.55 20.55 )
Isolated Power Generation andDiseribution 80.20 80.20 30.41
Dacca Electric Supply 46.30 19.50 32.78Acquisition and/or Supply ofPower to Small Undertakings 15.25 ) 15.25
12.37 ) 12.37 ) 31.4Secondary Transmission 33 kv 57.35 - 28.47Secondlary Transmission - under 33 kv 9.49 - 3.78
330.26 236.62 195.16
iV. M'ISCELUV'E:OUJS
Maintenance, Test and ResearchLaboratory 4.87 2.50 3.37
Electrical and Mechanical Workshop 4.97 2.50 4.69Electrical Equipment Pool for Smalland Medium-size Industrial Consumers 25.00 25.00 43.30
Supply of Power to PTDC Jute Mills 2.47 2.47 2.18Supply of Power and Warning Systemat Ilaheshkhali and Hatia 0.60 o.60 0.31
Surveya 7.31 2.00 5.34Rural Electrification (Comilla) 4.90 - 2.90Load Dispatch Center 7.75 _ 0.18
57.87 35.07 62.27
V. TOTAL I - IV 837.88 370.86 352.96
NflT-: Actual expenditures for the period 1960/64 have been Rs.218.3 million or,ly.Pudgetoe' expenditurfs for 1964/65 were Rs.J79.1 million. However, it iscertain that actual expenditures will he lower in l164/65. The aboveTAmt.tiored irnvestment figiire of Rs.352.06 million gives only an estimate oftotal Wapda expenditures during the Second Plan. It is probable that actualfiguires wihern available will give a lower total.
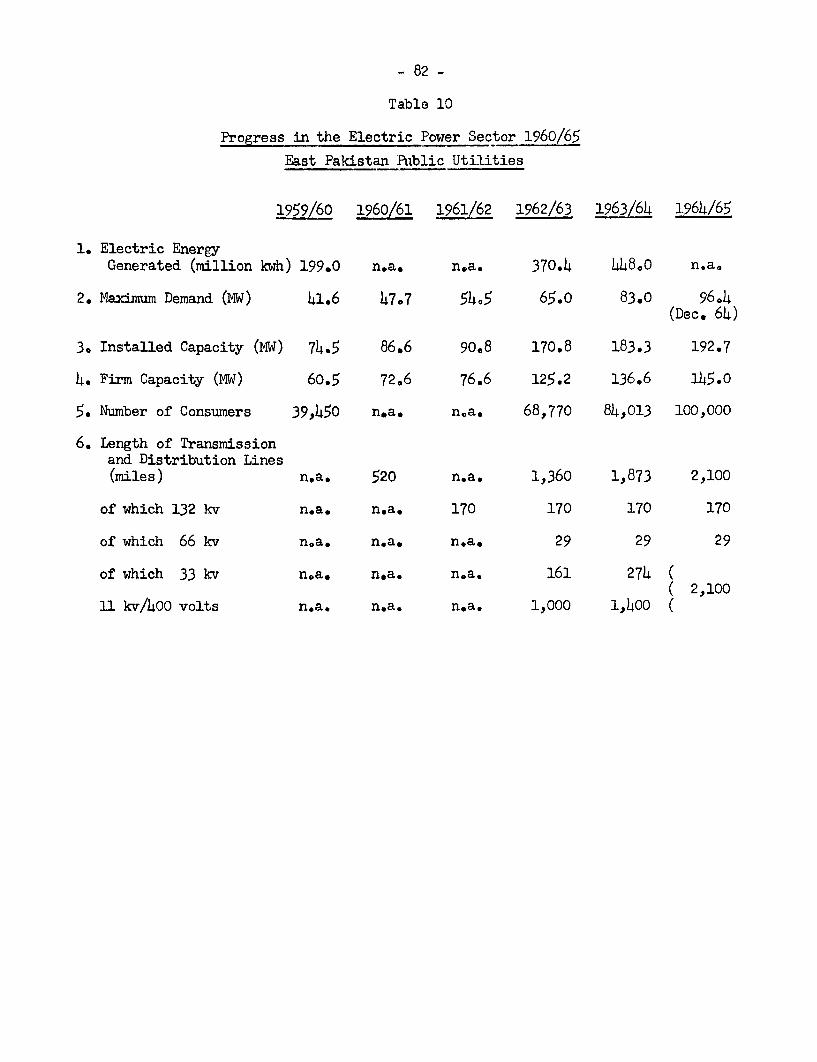
- 82 -
Table 10
Progress in the Electric Power Sector 1960/65
East Pakistan Public Utilities
1959/60 1960/61 1961/62 1962/63 1963/64 1964/65
1. Electric EnergyGenerated (million kwh) 199.0 n.a. n,a. 370.4 4480o n.a.
2. Maximum Demand (MW) 41.6 47.7 54.5 65.0 83.0 96.4(Dec. 64)
3. Installed Capacity (MW) 74.5 86.6 90.8 170.8 183.3 192.7
4. Firm Capacity (MW) 60.5 72.6 76.6 125.2 136.6 1)45.0
5* Number of Consumers 39,)450 na. n,a. 68,770 84,013 100,000
6. Length of Transmissionand Distribution Lines(miles) n.a. 520 n.a. 1,360 1,873 2,100
of which 132 kv n.a. n.a. 170 170 170 170
of which 66 kv n.a. n.a. n.a. 29 29 29
of which 33 kv n,a. n,a. n.a. 161 274 (( 2,100
11 kv/)400 volts n.a. n.a. n.a. 1,000 1,)400 (
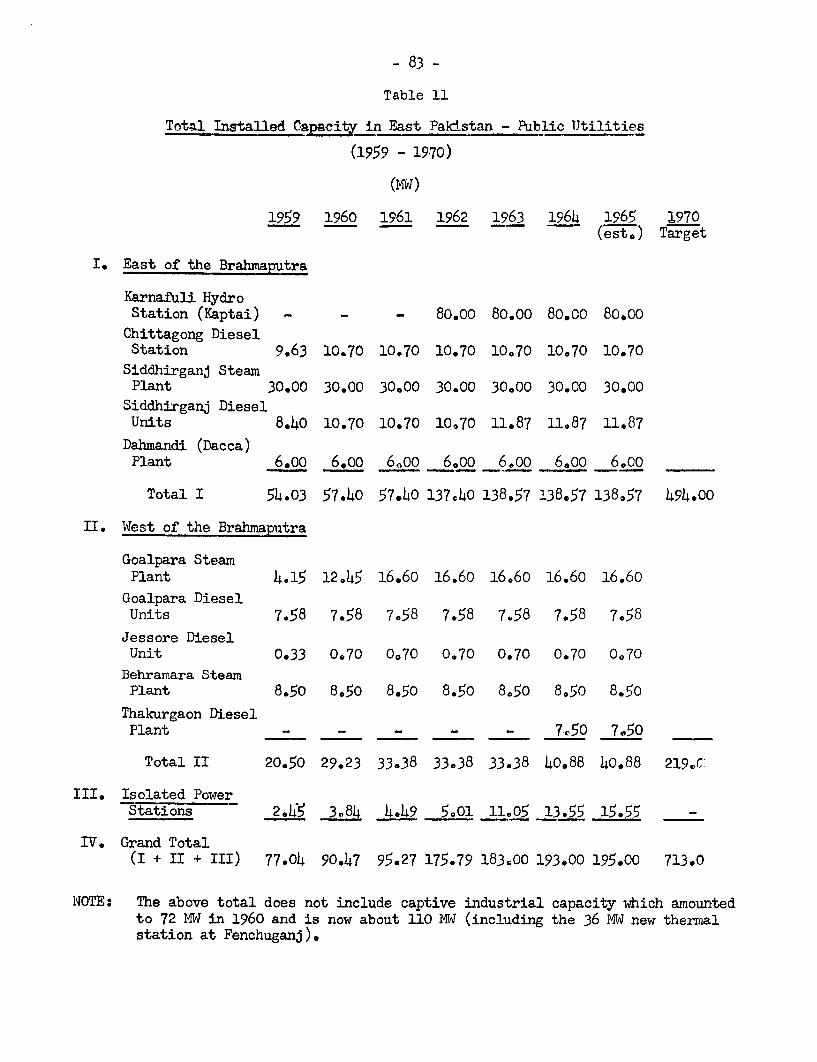
- 83 -
Table 11
Total Installed Capacity in East Pakistan - Public IJtilities
(1959 - 1970)
(MW)
1959 1960 1961 1962 1963 1964 1965 1970(est,) Target
I. East of the Brahmaputra
Karnafuli HydroStation (Kaptai) - - - 80.00 80.00 80.00 80.00
Chittagong DieselStation 9.63 10.70 10.70 10.70 10.70 10.70 10.70
Siddhirganj SteamPlant 30.00 30.00 30.00 30.00 30.00 30.00 30.00
Siddhirganj DieselUnits 8.40 10.70 10.70 10.70 11.87 11.87 11.87
Dahmandi (Dacca)Plant 6.oo 6.oo 60oo 6.00 6.00 6.00 6,00
Total I 54h03 57.4o 57.40 137e40 138.57 138.57 138.57 494.00
II. West of the Brahmaputra
Goalpara SteamPlant 4h15 12e45 16.60 16.60 16.60 16.60 16.60
Goalpara DieselUnits 7.58 7.58 7.58 7.58 7.58 7.58 7.58Jessore DieselUnit 0.33 0.70 0.70 0.70 0.70 0.70 0.70Behramara SteamPlant 8.50 8.50 8.50 8.50 8e50 8.50 8.50
Thakurgaon DieselPlant - - - - - 750 7.50
Total II 20.50 29.23 33.38 33.38 33.38 4o.88 4o.88 219.C
III. Isolated PowerStations 2OIX 3.84 4.49 5.01 11.05 13.55 15.55 -
IV. Grand Total(I + II + III) 7704 90.47 95*27 175.79 183-00 193.00 195.00 713.0
NOTE: The above total does not include captive industrial capacity which amountedto 72 MW in 1960 and is now about 110 MW (including the 36 MW new thermalstation at Fenchuganj).
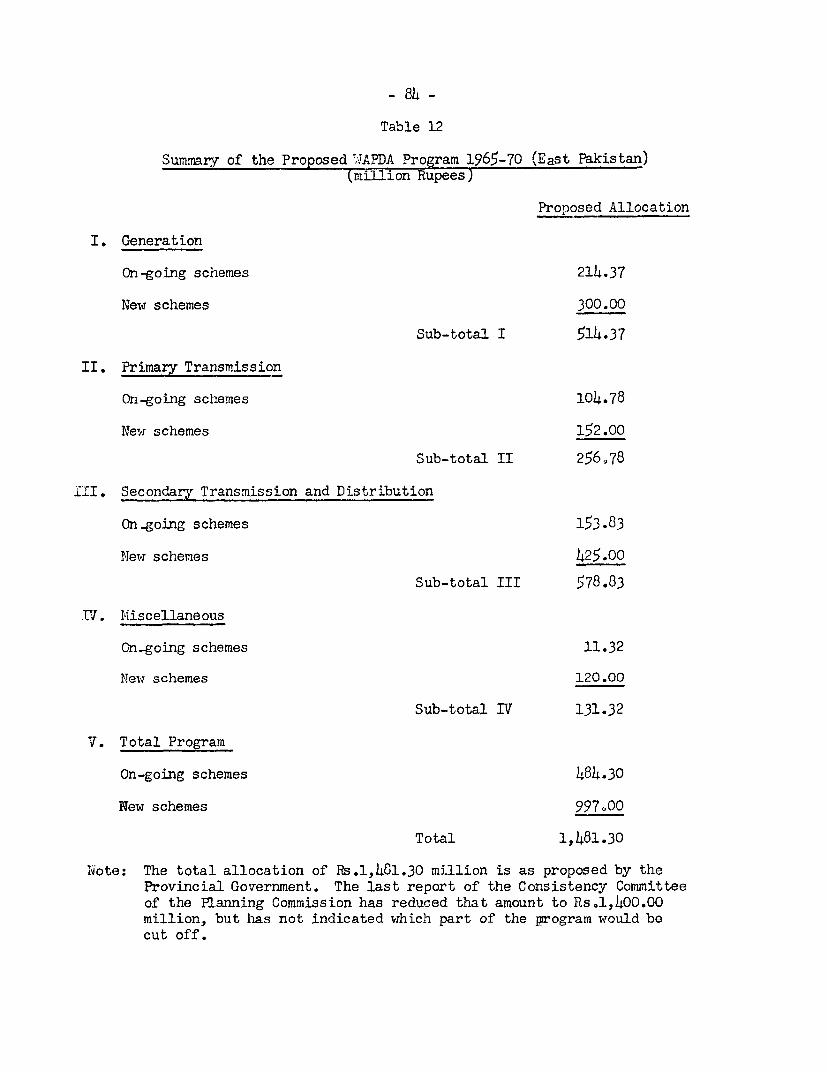
- 84 -
Table 12
Summary of the Proposed-.APDA Program 1965-70 (East Pakistan)(million Rupees)
Proposed Allocation
I. Generation
On-going schemes 214.37
New schemes 300.00
Sub-total I 514.37
II. Primary Transmission
On-going schemes 104.78
New schemes 152.00
Sub-total II 256078
III. Secondary Transmission and Distribution
On-going schemes 153.83
New schemes 425.00
Sub-total III 578.83
TY1. Miscellaneous
On_going schemes 11.32
New schemes 120.00
Sub-total IV 131.32
V. Total Program
On-going schemes 484.30
New schemes 997-00
Total 1,481.30
iqote: The total allocation of Rs.1,481.30 million is as proposed by theProvincial Government. The last report of the Consistency Committeeof the Planning Commission has reduced that amount to Rs.1,400.00million, but has not indicated which part of the program would becut off.
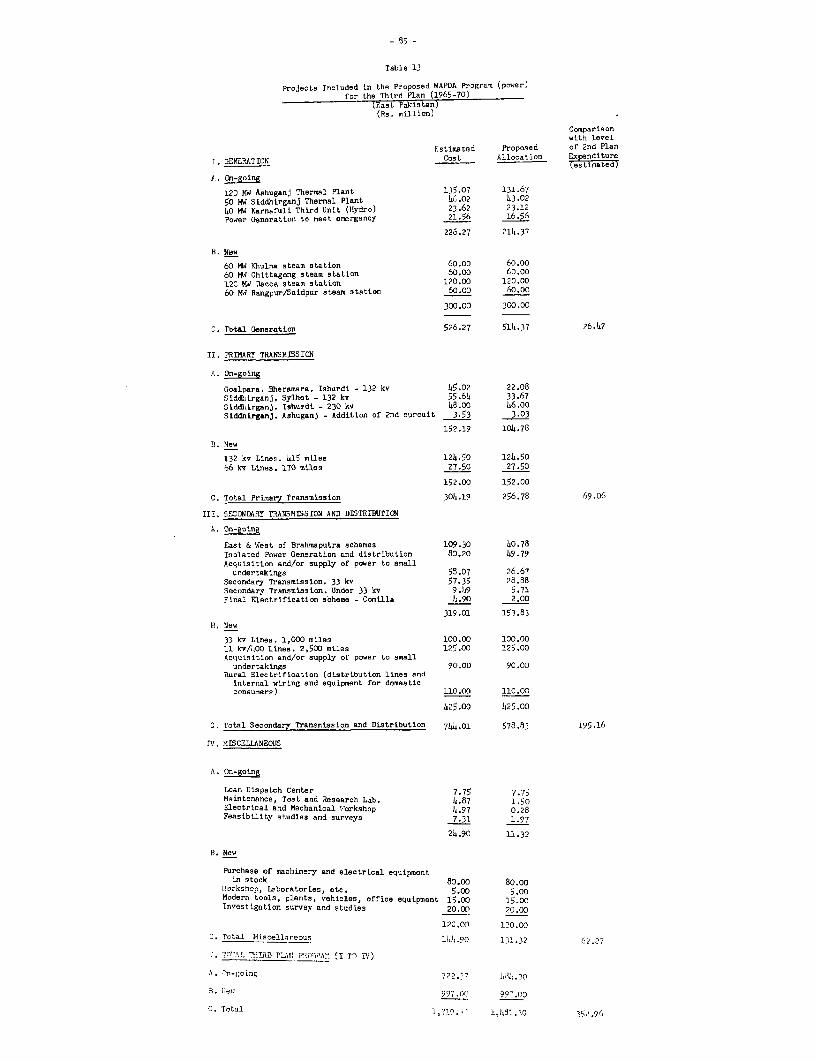
- 55 -
Table 13
Projects Included in the Proposed WAPDA Program (power)for the Third Plan (1965-70)
(E.ast Paktstan)(Rs. milion)
Comparisonwith level
Estimated Proposed of 2nd Plan
I. OEtERATION Cost Allocation Expenditure
A. On-going
120 MW Ashuganj Thermal Plant 135.07 131.6750 MW Siddhirganj Thermal Plant 46.02 43.0240 M9d Karnafuli Third Unit (Hydro) 23.62 23.12Power Generation to meet emergency 21.56 16.56
226.27 214.37
B. Hew
60 MW Ehulna steam station 60.00 60.0060 MW Chittagong steam station 60.00 60.00120 MW Dacca steam statton 120.00 120.0060 MW Rangpur/Saidpur steam station 60.00 60.00
300.00 300.00
C. TotAl Generation 526.27 514.37 26.47
II. PRIMARY TRANSMISSION
A. On-going
Goalpara. Bheramara. Ishurdi - 132 kv 45.02 22.08Siddhirganj. Sylhet - 132 kv 55.64 33.67Siddhirganj. Ishurdt - 230 kv 48.00 46.00SiddhirgLnj. Ashuganj - Addition of 2nd curcuit 3.53 3.03
152.19 104.78
B. New
132 kv Lines. 415 miles 124.50 124.5066 kv Lines. 170 mUes 27.50 27.50
152.00 152.00
C. Total Prinary Transmission 304.19 256.78 69.06
III. SECONDARY TRANSMISSION AND DISTRIBUTION
A. On-going
East & West of Brahmaputra schemes 109.30 40.78Isolated Power Generation and distribution 80.20 49.79Acquisition and/or supply of power to small
undertakings 55.07 26.67Secondary Transmission. 33 kv 57.35 28.88Secondary Transmission. Under 33 kv 9.49 5.1Final Electrification scheme - Comilla 4.90 2.00
319.01 153.83
B. New
33 kv Lines. 1,000 miles 100.00 100.0011 kv/400 Lines. 2,500 miles 125.00 125.00Acquisition and/or supply of power to small
undertakings 90.00 90.00Rural Electrification (distribution lines and
internal wiring and equipment for domesticconsumers) 110.00 110.00
h25.00 425.00
0. Total Secondary Transmission and Distribution 744.01 578.83 195.16
IV. MISCELLANEOUS
A. On-going
Loan Dispatch Center 7.75 7.75Meintenance, Test and Research Lab. 4.87 1.50Electrical and Mechanical 1Workshop 4.97 0.28Feasibility studies and surveys 7.31 1.97
24.90 11.32
B. New
Purchase of machinery and electrical equipmentin stock 80.00 80.00
Workshop, laboratories, etc. 5.00 5.00Modern tools, plants, vehicles, office equipment 15.00 15.00Investigation survey and studies 20.00 20.00
120.00 120.00
C. Total Eliscelluneous 14h.90 131.32 62.7
V. TIOTAL ?T.RTD PLlO PR%RWI: (I TO IV)
2.. n- ng 7227.77 L4.30
3. oe 997.00 997.00
C. Total 1,71?. 1,451.30 35,98
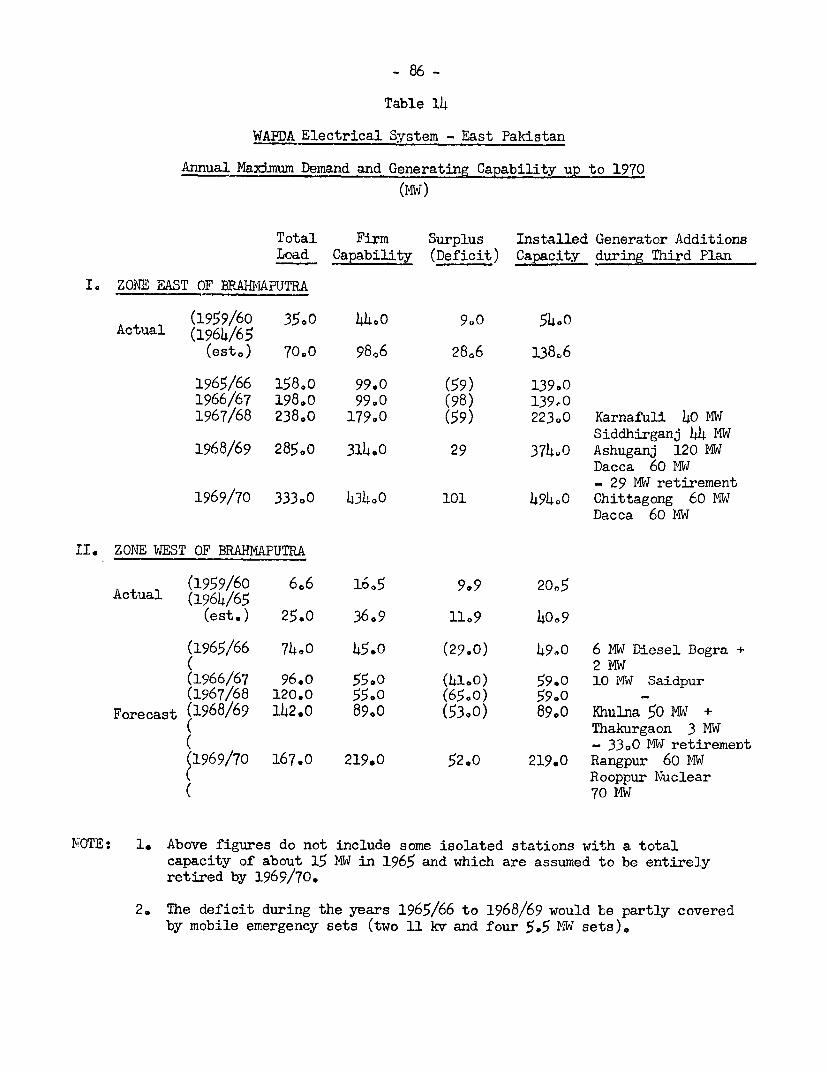
- 86 -
Table 14
WAPDA Electrical System - East Paldstan
Annual Maximum Demand and Generating Capability up to 1970
(MW)
Total Firm Surplus Installed Generator AdditionsLoad Capability (Deficit) Capacity during Third Plan
I. ZONE EAST OF BRAJIMAPUTRA
(1959/60 35.0 44.0 9.0 54h0Actual (1964/65
(esto) 70.0 98.6 28.6 138.6
1965/66 158.0 99.0 (59) 139.01966/67 198.0 99.0 (98) 139e 1967/68 238.0 179.0 (59) 223.0 Karnafuli 40 MW
Siddhirganj 44 Mw1968/69 285.0 314.0 29 374.0 Ashuganj 120 MW
Dacca 60 MMW- 29 MW retirement
1969/70 333.0 434.0 101 494.0 Chittagong 60 MWDacca 60 MW
LI, ZONE WEST OF BRAHMAPUTRA
(1959/60 6.6 16.5 9.9 20e5Actual (1964/65
(est.) 25.0 36.9 11.9 4O.9
(1965/66 74.0 45.0 (29.0) 49-0 6 M4W Diesel Bogra +2 MW
(1966/67 96.0 55.0 (41.0) 59.0 10 MW Saidpur(1967/68 120.0 55e0 (65.0) 59.0 _
Forecast (1968/69 142.0 89,0 (53.0) 89.0 Khulna 50 MW +( Thakurgaon 3 MW( - 33,0 MW retirement(1969/70 167.0 219.0 52.0 219.0 Rangpur 60 MW( Rooppur Nuclear( 70 MW
I:OTE: 1. Above figures do not include some isolated stations with a totalcapacity of about 15 MW in 1965 and which are assumed to be entirelyretired by 1969/70.
2. The deficit during the years 1965/66 to 1968/69 would be partly coveredby mobile emergency sets (two 11 kv and four 5,5 MW sets).
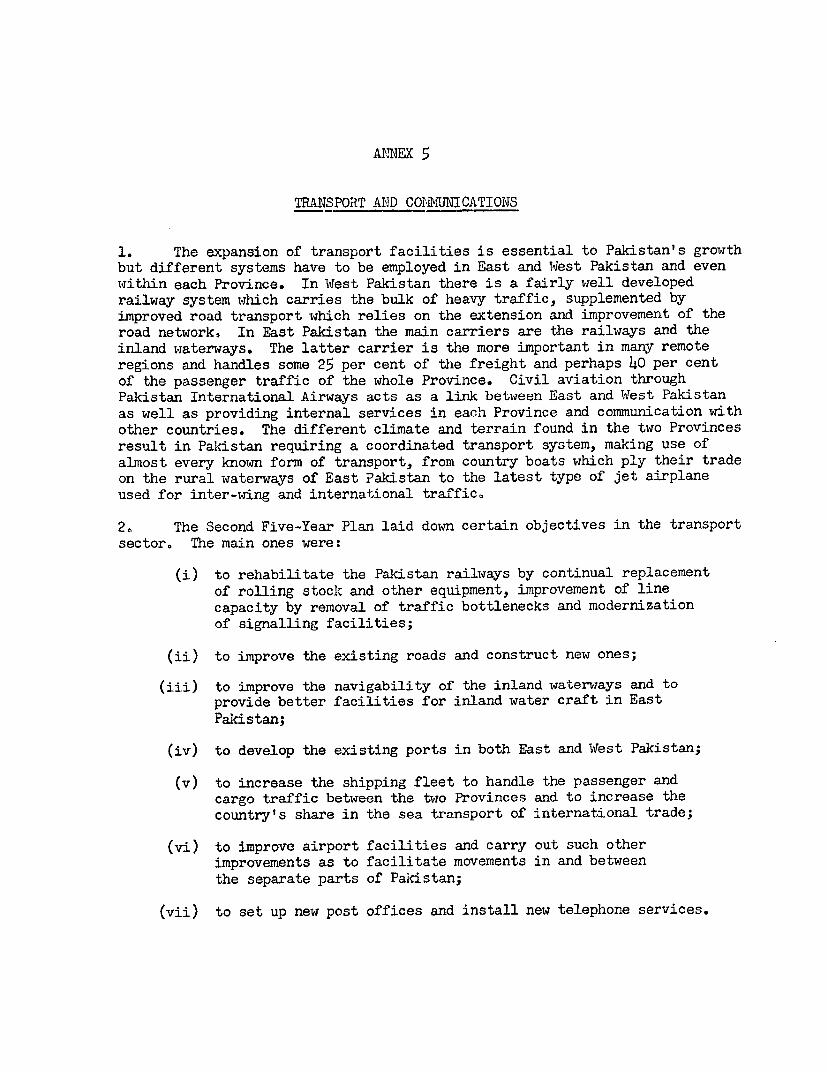
ANNEX 5
TRANSPORT AMD CODNUNICATIONS
1. The expansion of transport facilities is essential to Pakistan's growthbut different systems have to be employed in East and W4est Pakistan and evenwithin each Province. In West Pakistan there is a fairly well developedrailway system which carries the bulk of heavy traffic, supplemented byimproved road transport which relies on the extension and improvement of theroad network, In East Pakistan the main carriers are the railways and theinland waterways. The latter carrier is the more important in many remoteregions and handles some 25 per cent of thle freight and perhaps 40 per centof the passenger traffic of the whole Province. Civil aviation throughPakistan International Airways acts as a link between East and W4est Pakistanas well as providing internal services in each Province and communication withother countries. The different climate and terrain found in the two Provincesresult in Pakistan requiring a coordinated transport system, making use ofalmost every known form of transport, from country boats which ply their tradeon the rural waterways of East Pakistan to the latest type of jet airplaneused for inter-wing and international traffic.
2e, The Second Five-Year Plan laid down certain objectives in the transportsector. The main ones were:
(i) to rehabilitate the Pakistan railways by continual replacementof rolling stock and other equipment, improvement of linecapacity by removal of traffic bottlenecks and modernizationof signalling facilities;
(ii) to improve the existing roads and construct new ones;
(iii) to improve the navigability of the inland waterways and toprovide better facilities for inland water craft in EastPakistan;
(iv) to develop the existing ports in both East and West Pakistan;
(v) to increase the shipping fleet to handle the passenger andcargo traffic between the two Provinces and to increase thecountry's share in the sea transport of international trade;
(vi) to improve airport facilities and carry out such otherimprovements as to facilitate movements in and betweenthe separate parts of Pakistan;
(vii) to set up new post offices and install new telephone services.
- 88 -
3. Progress during the first four years of the Second Plan to meet thesePlan objectives has been in general satisfactory with most physical targetsbeing met but with same bottlenecks remaining. Rs. 2,725.0 million wasallocated for the public sector of which Rs. 2,094.5 million was for transport,By the end of the fiscal year 1963/64 it is estimated that Rs. 2,312.3 millionhad been spend, 85 per cent of the total. Expenditure has been rising over theyears of the Second Plan; the growth has been from Rs. 387.7 million in1960/61 to Rs. 757.7 million in 1963/h and Rs. 979.3 million for 1964/5.Should the estimate for 1964/5 be realized, the target will be surpassedby 20 per cent. At a minimum the target should be met. A maJor part of anyoverexpenditure in relation to the Plan figure will be due to the inclusionof additional projects in the Plan and not to increased costs alone.
4. It is estimated that in the decade of the First and Second Eive-YearPlans the transport traffic has grown at twice tire rate of GIJP. Calculationsof increase in traffic demand have been pit at some 60 per cert in the ThirdPlan period. It is est>_iated that the growth rate in the sector will havebeen 5.8 per cent in the Second Plan but will be only 5.5 per cent in theperiod of the Third Plan. For comrurications, telephone traf'fic is estimatedto increase at a rapid rate, requiring in addition to new instruments,improvements in the inter-wing system. The Third Plan expenditure targetfor the public sector is Rs. 6,300 million and for the private sectorRs. 3,900 million.
Railways
5. Until 1962 the Railway Administration was a service of the CentralGovernment. In July 1962 the railways were oifurcated and responsibilitywas taken over by the Provincial Governments with the Central Railway Boardbeing responsible for coordinating railway requirements in the framework ofthe Plan and for implementing agreements with foreign countries. The targetsset in the Second Dive-Vear Plan should be reached, The West Pakistanrailways system was allocated Rs. 972.3 million and by the end of the financialyear 1964, actual and estimated expenditure had totalled Rs. 892.3 million.Expenditure during the present year is expected to be at about the same rateas in 1963/64 (Rs. 250.0 million) and by June 1965 expenditure should be17 per cent greater than that proposed as the Plan target. This overexprndi-ture results partly from the inclusion of new sc.hemes. In East Paid stanthe Plan allocation was Rs. 427.7 million and expenditure in the first fouryears of the Plan has totalled Rs. 31805 million, The expenditures duringthe present financial year are estimated to be much greater than in earlieryears; if the estimates are correct, the target will be surpassed by 22 percent in financial terms. Progress has been satisfactory in modernizing andexpanding equipment to move the backlog of goods and also the increase incommodities resulting from expansion in other parts of the economy.

- 89 -
6. In WMest Pakistan in the first four years of the Second Five-Year Plan808 miles of rail renewals were laid, together with 1,390 miles of sleeperrenewals. The Railway Administration obtained new rolling stock andlocomotives and placed orders for additional diesel-electric locomotivesand carriages. Work on the first phase of the Karachi Circular Railway wasvirtually completed and the line was opened for goods traffic in January 1963.The conversion of part of the Hyderabad - Mirpurkas section from metre gaugeto broad gauge has been proceeding and some of the work on removing trafficbottlenecks by improved signalling was finished.
7. The East Pakistan Railway has also been successful in achieving itsPlan target. 172 miles of rail renewals and 598 miles of sleeper renewalswere laid in the first four years of the Plan, an equivalent of some 80 percent of the Plan target. New rolling stock and locomotives became availableto the system. In addition orders were placed for diesel-electric locomotives,wagons, coaches and carriages. Some of these supplies will become avai'lablebefore the end of the Second Plan. Wqork on all major bridges was completedand orders have been placed for additional tugs and barges for a doublewagon-ferry. The increase in freight ton miles carried during the Second Planperiod has been satisfactory and passenger traffic has increased.
8. Tne overall traffic demand has been estimated to increase by 60 percent during the Third Plan period. However, in view of the potential growthof other methods of transport, it is not considered that major new lineconstruction projects will be started. The main emphasis will be onincreasing the line and terminal capacities and improving general efficiency.
9. The proposed financial allocation for the TNst Pakistan Railway isRs. 1,370 million and for the East Pakistan Railways Rs. 940 million.
10. In West Pakistan about 25 per cent of the total allocation will beused to complete on-going projects of the Second Plan; the remainder will beused to provide rolling stock and track renewal as well as signalling andother equipment. The Plan for the West Pakistan railway emphasizes theimportance of replacing worn out assets and increasing the supply of rollingstock as well as improving line and terminal capacity to carry the increasedtraffic estimated to develop in the next five years. There will also be aprogram to manufacture some of the rolling stock within the country.
11. In East Pakistan it is proposed that some 25 per cent of the proposedexpenditure be for projects already under way at the end of the Second Plan.Like West Pakistan, much of the remainder will be spent on wagons andcarriages and on the renewal and modernization of track, while some will befor the construction of new lines.
- 90 -
Roads
12. At the end of the First Plan it was realized that although the Orogresshad been satisfactory there had been little coordination of various means oftransport and comprehensive transport surveys of both East and West Pakistanwere then sponsored by the Government. Expenditure of Rs. 250.0 million wasincluded in the Second Five-Year .lan for East Pakistan and Rs. 275.7 millionfor West Pakistan and the Frontier Region. In making these allocationsadequate development of other means of transport, particularly waterways inEast Pakistan and railways in both Provinces, had been taken into consideration.
13. Road construction raised technical problems in both Provinces but it iseasier to construct and maintain roads in WVest Pakistan. In East Pakistan theproblems of building roads are immense and would tax the skills and knowledgeof highly experienced engineering organizations.
14. The Third Plan program for Pakistan proposes the improvement of anumber of existing roads and construction of new ones. The aim is to provideroads for short distance and light traffic, particularly in rural areas andnewly developing regions of the country, and to allow through a better roadnetwork the expansion of a road transport industry.
15. The bulk of the Second Five-Year Plan projects in West Pakistanconsisted of building numerous, widely scattered, short sections rather thanconcentrating on a small number of through roads. The work was handicappedby a shortage of funds, lack of equipment and the skills to build high-standard roads. During the Second Five-Year Plan there has been littleupgrading of the main road system. The Rural Works program is expected toplay an important role in building feeder roads in the Third Plan.
16. The expenditure in the first four years of the Second Plan in WestPakistan was Rs. 179.2 million and it is expected that another Rs. 115.0million will be utilized during the fiscal year 1964/65. If this expenditureis incurred, the Plan target will be exceeded by some 12 per cent.
17. In East Pakistan many of the roads constructed in the last ten yearshave been built to a sub-standard single or two-lane width and with theexpected increase in traffic they will have to be rebuilt. The present roadsystem in East Pakistan consists of a large number of nonconnected sectionsunusable by through traffic. Except for periods of abnormal flooding theseroads are passable but the secondary roads are often impassable. In the firstfour years of the Plan Rs. 279.8 million was reported as being spent andshould the estimated expenditure in the current year be incurred (Rs. 131.4million) the total expenditure will be some 64 per cent greater than planned.
18. It is expected that roads in the frontier regions and in special areasof West Pakistan will be constructed at a cost of some Rs. 65 million duringthe course of the present Five-Year Plan.
- 91 -
19. Continuing from the developments of the First and Second Five-YearPlans, it is proposed in the Third Five-Year Plan to recondition and strengthenthe existing road system, to widen many of the present roads and develop feederroads connecting farms to markets and villages to railway centers. The totalallocated for the road program for the years 1965-70 amounts to Rs. 1,830million, of which Rs. 730 million is for West Pakistan development andRs. 1,100 million for improvements in East Pakistan. Around 20 per cent ofthe allocation in each Province is for on-going projects and the remainderwill be utilized for new schemes which have been or are being planned. Suchexpenditures are much greater than in the Second Plan and doubts have beenexpressed as to the ability of the organizations to handle the volume ofprojects involved.
Road Transport
20. There has been a considerable increase in road transport over theperiod of the Second Five-Year Plan. In 1959 there were estimated to be some31O000 trucks and buses in service and this figure will have risen to 52,000in 1964/65, of which 41,0C0 would be in liest Pakistan and 11,000 in EastPakistan. The improvement of roads has encouraged the development of roadtransport and it is calculated that Rs. 1,230 million will be utilized in thecourse of the Third Plan, mostly in the private sector. Important sectionsdealing with maintenance and workshop facilities are planned to be improved.
IoW.Ta,e
21. The importance of inland water transport to East Pakistan can hardly beoveremphasized. It is the mainstay of the transport system and given suitablenavigational routes and terminal facilities, it is an economical method ofhaulage of goods, particularly of bulk cargo. The efficient operation ofinland water transport depends on the provision of a number of services anduntil 1958 these were provided by several independent agencies but in thatyear the East Pakistan Inland Water Transport Authority was established totake over those services and to regulate traffic and rates and to plan forthe future development of inland water transport.
22. By the end of the Second Plan period, the Authority will have completedthe initial phase of its work of providing navigational and operationalfacilities, by introducing the Decca-Chain radio location system and carryingout river and port surveys and hydraulic investigations. In 1963 there weresome 3,100 miles of waterways which were navigable for the whole year and anadditional 1,800 miles navigable during the flood season only. Many of thechannels are deteriorating rapidly and shoals are forming. The effectivenessof the IWTA has been limited by being overburdened with many diverse anddifficult functions. Some of these are now to be transferred to otherorganizations, allowing IlTA to concentrate on waterway regulation anddevelopment. It has been estimated by IWqTA that the total length of allyear navigable waterways could be increased to 4,650 miles.

- 52 -
23. The Second Plan allocation for IWTA has been repeatedly raised byadding new schemes. The present allocation is Rs. 62.5 million and by theend of the first four years of the Plan it is estimated that Rs. 87.8 millionhad been spent with the fourth year, 1963/64, accounting for some 60 per centof the total expenditure. Over the whole Plan period expenditure is estimatedat Rs. 139.8 million, resulting in an implementation of 224 per cent of thePlan target. Several important schemes are still behind schedule, and IWTAshould concentrate on completing these schemes. Compared with January 1959,the percentage increase in the traffic in terms of ton miles was 39 per centby January 1964 while the passenger miles carried had increased by 52 per cent.
24. In the Third Five-Year Plan, it is thought that the Authority may beready to launch a major development program. An allocation of Rs. 830 millionhas been made, Rs. 310 million in the public sector and Rs. 520 million in theprivate sector. The program aims at improving all the major river pDrts andsome small ones, improving 2,000 miles of channel, The problem of adequatemanagement exists in this sub-sector also, but is being tackled partly by theuse of consultants and by reducing the functions of the organization.
Ports and Shipping
25. The ports of Palcistan have been attempting to handle traffic much inexcess of the capacities for which they were designed. The Plan targets forthe handling capacities of Karachi, Chittagong and Chalna ports were 9.3million tons but in the year 1963/64, 11.4 million tons were actually handled.This large volume of traffic has resulted in serious bottlenecks andrecommendations for improvement in the ports have been made. Reconstructionof 13 berths at Karachi has been completed and the hanculing capacity of theseberths increased by about 30 per cent. The problems of the port of Chittagonghave been the subject of a report, at present under study by the Government.Some improvements have been made and in 1964/65 it is hoped that threeprojects dealing with (a) the rehabilitation and extension of jetties, (b) theprovision of worLkshops and (c) the provision of an off-shore oil terminal willbe started.
26. Adequate port capacity is important in view of the increasing externaltrade as well as inter-provincial traffic. In addition to the completion ofon-going projects, the Third Plan provides for the improvement of existingport facilities at Karachi, including three new berths, and Chittagong andconverting the Chlalna 'ancAora!e into a major port. A feasibility study forthe establishment of a second port in West Pakistan is being undertaken andthe total allocation in the Thlird Plan for ports in the public sector isRs. 100 million and in the private Rs. 510 million.
27. A large share of the country's international traffic, which amountedin total to 9 million tons in 1962/63, is being carried by foreign shipswhich the Pakistan Government estimates is causing a drain on foreign exchangeresources of Rs. 400 million to Rs. 500 million annually for freight charges.The National Chipping Corporation was recently set up to supplement the private
- 93 -
sector efforts in this field and to increase Pakistan's share of internationaltraffic. This policy has been encouraged by the relative ease of obtainingcredit for new and old ships because of the present depressed state of shippingand ship-building in most countries. Much of the additional capacity has andwill be taken up by the International Shipping Corporation. In total theCorporation has acquired 6 ships and will acquire 4 more by the end of theSecond Plan period. The economic operation of this Corporation is notassured. To develop technical training facilities a Mercantile Marine Academyhas been established which started functioning in 1962.
28. At present Pakistan has in total, both in private and in the ShippingCorporation, 43 ships, of which 16 are old and require replacement. It isplanned to acquire 35 additional ships before July 1965 and during the ThirdPlan period 28 more ships are to be acquired, 8 to replace old vessels and20 to increase the country's share of international shipping. A provisionof Rs. 300 million is being made for this purpose.
Air Transport
29. Air transport is of great importance because of the physicalseparation of the two Provinces, the long distances in West Pakistan andthe terrain of East Pakistan. Air services continue to meet their tasksin an efficient and reliable manner. The Second Five-Year Plan envisagedthe development of a well organized air transport system, improvement ofground aviation facilities, construction of additional airports and thedevelopment of international services. A number of feasibility studieshave been undertaken for airports at different centers while the jet runwayhas been completed at Karachi. An extensive network of radio communicationswas provided for both East and lest Pakistan. In East Pakistan a helicopterservice which was instituted some time ago has proved well suited to theneeds of the Province. It was estimated that expenditure on civil aviation,other than the international airline, would be Rs. 200 million during thecourse of the Second Five-Year Plan. It is estimated that 80 per cent ofthis amount will be utilized although the amount to be spent in the year1964/65 is estimated to be equal to some 40 per cent of the grand total.If expended the sum would be twice as much as has been spent in any otheryear of the Five-Year Plan.
30. The Pakistan International Air Corporation acquired a number of newaircraft in the course of the Second Five-Year Plan. The PIA capacity inton miles increased from 62.4 million in 1960/61 to 101.1 million in 1963/64.The PIA has been a successful organization and has resulted in improvedcommunications between the two Provinces and on international routes.
Communications
31. Progress in this field has been fairly well on schedule. It wasanticipated that the Telephone and Telegraph sections would utilize Rs. 338million and by the end of the first four years about this amount had been
- 94 -
spent. It is expected that the Plan target will be exceeded by some 30 percent. Against the Plan target of 45,700 new -telephones, 40,700 have beeninstalled and it is thought that an extra 14,000 will be installed by the endof the Second Five-Year Plan, so improving cormmnications throughout thecountry. In East Pakistan the very high frequency network liniking majorcities was completed. In West Pakistan progress was made in the provisionof a co-axial cable system between Karachi, Laho:e and RaJalpindi. The entirelink, including two other sections, should be completed by the end of the 'irstyear of the Third Plan.
32. A study of long-term requirements will be initiated to provide a basisfor further planning and in the Third Five-Year Plan Rs. 880 million has beenallocated to telegraph and telephone services. The Third Plan is ambitiousin this field, with the installation of 150,000 telephones. The totalallocation for public communications including te'evision is Rs. 1,060 millior.with Rs. 120 million in the private sector.

ANNEX 6
SOCIAL SERVICES
General
1. The Government of Pakistan is eager to improve facilities ineducation and health and use its manpower efficiently. Less than 16 percent of the total population could be classified as literate in 1961 andPakistan faces the problem, common to mnany developing countries, of asurplus of unskilled manpower while having a scarcity of skills.Significant progress has been made in lowering the death rate throughdisease preventative services but it is considered that debilitatingillnesses still make the labor force less productive. Population controlthrough family planning is a recognized part of the public health program.Although given some importance in Government circles, there would appearto be little evidence of a response to the exhortations made so far.The results of this propaganda in all its forms may take time forevaluation. It is expected that all these programs will have utilized90 per cent of the public funds, amounting to Rs. 440 million, providedin the Second Five-Year Plan.
2. The Third Five-Year Plan proposes the expenditure of Rs. 300 millionin the public sector and Rs.400 million in the private. The majority ofsuch expenditure would be from local funds.
Education
3. The Second Plan recognized that education was a vital nationalinvestment and attempted to ensure that as many persons as finances permittedwere trained. The Plan attempted to phase the expansion of different typesof education. Problems of educational administration and particularly ofplanning exist and need to be faced. Although funds have been channelledinto buildings and equipment, the largest part of expenditure in educationremains recurrent. The physical target of children at primary school willnot be met although the financial expenditures will be equal to the targetfigure for the Plan. In secondary education, the physical targets proposedin the Second Plan should be achieved or exceeded while for teachertraining the expansion has been such that the proposed program will be fullyimplemented. Technical training has been important in the Second Five-YearPlan and it is expected that the targets will be fulluy achieved by the endof the Plan period. The work on the expansion of university facilitiesmade satisfactory progress, although there were many delays in implementation.
4. The Third Five-Year Plan is based on the assumption of a well balancedand integrated development of all levels of education. The proposal is tospend in the public sector Rs. 2,730 million and in the private sectorRs. 300 million. ilost of the expenditure will be for primary and technicaleducation where the need is not only considered to be greatest but where alarge nurmlber of people can receive tuition. The main expenditures will beon buildings and the development of facilities but the recurrent expendituresarising in the Third Plan as a result of activities to date and during theThird Plan, will armount to Rs. 1,110 million.
- 96 -
5. During the Third Plan projections will be made of the numbers,levels of education and of skilled labor needed to meet the requirementsof the Plan and also the Perspective Plan. At the sarmie time a generalanalysis of the role of education in the total development of Pakistanwill be undertaken.
6. Although the efforts made in the education field have been worth-while there have been a number of shortfalls, due mainly to the inadequateprovision for additional recurring expenditure. The low standard ofteachers and of teachers' salaries has called for improvements.
Iianpower
7. A major problem in Pakistan is the chronic surplus of manpower.The Second Plan objectives were to produce worlkers with skills andattempts have been made to meet these objectives oy constructing buildingsas training centers and providing training for managerial development andfor supervisors and instructors. This project has been helped by theUnited Nations Special Fund and the International Labor Organization. ThePalistan Government has also received assistance from a number of interestedcountries.
8. The Works Program shows its great significance in the employmentsector, the capital required to provLde emplo,ment for one person beingonly Rs. 600. By enlarging the Works Prograrmi in subsequent plans, it isthought that the employment potential could be raised substantially.
9. The lJorks Program will be tripled in size during the Third Planand attemnpt to absorb manpower into industry and agriculture throughorganizing industries in the urban centers and through the development ofhandicraft and cottave industries and rural areas by denaonstration farmsand siDiilar facilities.
Health
10. Lack of financial resources has resulted in Pakistan concentratingon preventive rather than curative measures for public health. Themalaria eradication programo, which proposed the wiping out of malaria by1975, has to date been a success. In the areas where spraying byinsecticides was carried out the parasite rate has fallen greatly. TBhospitals and clinics have been developed and considerable attention hasbeen given to the control of tuberculosis. The training of medical andhealth workers has taken up a considerable proportion of the funds imiadeavailable under the Plan.
11. The Perspective Plan for the next 20 years proposes to providereasonably adequate medical facilities for the entire population bybuilding up the health services tlirough training personnel to man them andproviding special services for child welfare. The long-term goal is toprovide one doctor for every 3,000 persons, one hospital bed for every1,000 persons and 3,800 rural clinics.
- 97 -
12. The Third Five-Year Plan is designed to mnake some advances towardsthis target. Preventative services are given a high priority, particularlypreventative medicine against malaria. The program for setting up rural
health centers, initiated during the Second Plan, will be increased. Therewill be also a new program to improve industrial health. On the curative
side, more hospital beds are to be provided and the number should increase
by 14,000 over the Third Plan period.
13. A large part of the developrment budget is being spent on constructionand this cost is increasing every year. Wherever possible the funds to bespent on buildings and other constructional activities should be kept to aminimum, consistent with efficiency.
Farmily Planning
14. The rate of population growth recorded and estimated for Palcistanhas given cause for great alarm. The estimates of 1.8 per cent and 2.2per cent which were used in the early part of the Second Five-Year Planhave nowL been revised upwards to 2.6 per cent and it is thought that thepresent population growth rate might be even higher and could undercertain circumstances, such as an improved health program, result in a
population growth of some 3 per cent per annurn. Officially no change inthe rate of increase in forecast for the period of the Third Plan: a rateof 2.6 per cent per annum is used.
15. WJith the attempt at reducing the death rate, great efforts needto be made to lover the birth rate and to this end farily planning wasstressed in the First and Second Plans but the actual programs were keptsmnall. The problem is not easily solved and social and religiousprejudices have to be overcome and adequate arrangeiments rmust be providedto m,,ake the program facilities available to the population. The administra-tive actions taken to date have sometimes been frustrated oy Governinentcontrols and if the funds proposed for the period of the Third Plan areto be used efficiently, as much energr should be devoted to the adjiinistrationof family planning as has been devoted to some of the major sectors of the
economic system. The Second Plan provided an allocation of Rs.35 millionfor family planning which was to meet the requirements of 1.2 mlillionfai,dlies and train 1,200 personnel. The actual utilization of funds is
unlikely to exceed 50 per cent.
16. The Third Plan proposes a much larger allocation of Rs. 150 million.There are at present 15 research projects in progress in both lJings. Theprogram in the Third Plan will adapt and adopt these projects which havebeen found to be most effective. Unfortunately, the economic proof ofthese schemes cannot be judged in the short run. Family planning advisorswill be required and Government Departments have been asked to play animrportant role in implementing the program. Family planning has been givenhigh priority in the Plan but if it is to be successful the administratorsat the highest level must be both energetic and skilled and it will be
necessary for the program to be kept under constant review, taking intoaccount the reactions of the population. Since it is unlikely that the
- 98 -
population estirmates overstate the position, the Government of Pakistanmay need to devote even higher resources to the prograin and imhust ensurethat the allocation granted is not only used oalt employed efficiently andeffectively.
Housing and Social NJelifare
17. Rs. 1,885 isiillion, or about 13 per cent of the total Second Planallocations, was for housing and other urban projects, including theIsla.abad and Dacca Federal capitals and water supplies. It is expectedthat the target figure will be just exceeded by the end of the Planperiod. Programs in this sector include refugee housing, rural and urbanwater supplies, the development of the Federal capitals as well as aid tolocal bodies. The largest excess of expenditure over target in the SecondFive-Year Plan will be on Government offices and buildings and on Federalcapitals and the greatest shortfallon industrial urban housing, basicdevelopment and public, welfare housLng and town planning schemes.
18. The sociLal welfare sector was allocated Rs. 85.0 million. Therehave been a number of programs, the majority dealing with co-mlunitydevelopment, child and medical-social welfare. A great deal of theimplementation of these programs is through voluntary organizations whichreceive grants in aid. An assessment of expenditure alone bears littlerelation to achievernent but it is expected that at the end of the Planperiod about 50 per cent of the allocation will have been utilized. Thiswill include all of the allocation for grants in aid and 60 per centoverexpenditure on urban cormmunity development.

ANNEK 7
CAPITAL MA.RET
1. Pakistan's present banking and credit system consists of the StateBank, 36 large commercial banks (the scheduled banks), 40 smaller commercialbanks (the non-scheduled banks which do less than 1 per cent of the banking'business), cooperative credit institutions and specialized credit corporations.The number of commercial bank branches has tripled during the Second Plan.
2, The State Bank combines orthodox central banking functions withactivities of a developmental character. It can make loans and advancesto institutions or banks set up to promote agricultural or industrial developmentand to cooperative banks. It can also purchase, hold and sell debentures ofany development institution. Pakistan has specialized credit institutionsin agriculture, industry and hotning. However, the State Bank has no directcontrol over the lending of the cooperatives and by the specialized creditinstitutions. During recent years, the trend of such credit has been risingwith respect to industry and housing but stagnant with respect to agriculture.
3. The Agricultural Development Bank of Pakistan (ADBP) was establishedin 1961 to provide credit to individuals and companies engaged in agricultureor in the development of agriculture. It also finances cottage industries inrural areas. ADBP is a scheduled bank with a network of about 120 officeshbich receive deposits from the public. The State Bank grants loans to ADBP,as it does to cooperatives, at concessional rates, so that the rates chargedto ultimate borrowers do not exceed 7 per cent. In spite of some expansion,agricultural credit is still insufficient to meet the needs resulting fromthe present efforts to modernize and expand agricultural production.
4. The ADBP does not have adequate resources to meet the need foragricultural credit. The provincial land revenues are used to make so-calledTaccavi loans at concessionary rates, and a limited amount of cooperativecredit is available. Also, some rural credit comes from the surviving smallmoney lenders who, of course, command exhorbitant rates of interest.
5. Two institutions provide industrial medium and long term credit.The Industrial Development Bank of Pakistan (IDBP) is a joint venture ofthe Government (51 per cent of share capital) and private enterprise whichwas established in 1961, with the objectives of bringing new medium andsmall-scale entrepreneurs in the industrial sector, particularly in under-developed areas, and of providing finance for balancing and modernization ofexisting industries. It is also a scheduled bank. It lends both in localand foreign currencies. The size and soundness of its remarkable expansionmay have been reduced by its emphasis on social objectives and by itssecurity-minded approach to lending.
6. The Pakistan Industrial Credit and Investment Corporation (PICIC)is a private institution with foreign participation, which was set up in1957 to provide finance to new and existing industries in the private sector.
- 100 -
PICIC lends to large-scale industrialists mostly in foreign currencies.It has received two long-term loans from the Government and several linesof credit from the TWorld Bank and friendly countries. It has endeavored,with some measure of success, to broaden the base of industrial ownership.It has also investigatedthe possibility of investment in new and untappedfields, In that respect, its activities seem to develop more rapidly in theNbst than in the East Wing. Both PICIC and IDBP assume the important flnctionof allocating scarce foreign exchange resources to the industrial sector.
7. The House Building Finance Corporation (HBFC) was set up in1962 to provide loans to individuals and cooperatives desiring to constructhouses in urban areas. Its entire share capital was subscribed by theGovernment, and it can issue bonds and debentures guaranteed by Government.It is also authorized to accept deposits from the public, although it hasnot done this so far. The State Bank has provided it with assistance bytaking up its debentures. So far, the corporationts performance has beenon a very limited scale and Karachi has taken the largest part of itsloans, Now, the head office has been transferred to Dacca with a view toaccelerating the pace of house building in East Pakistan)
8. In Pakistan, the Government raises funds to finance its opera-tions by floating bonds and by borrowirg directly from the F'tate Bank andfrom commercial banks. lWhen the Government resorts to floating bonds, mostof the bonds issued are taken up by the banking system because tha capitalmarket is so narrow. Much of the direct borrowing is miade uiiecer thescheme of counter-finance through wihich funds are providee by the StateBank to commercial banks in lieu of their lending to the Central and ProvincialGovernments. Such facilities are provided to the banks at concussional ratesto enable them to add half of one per cent more for their operational costs.The Scheme dates back to 1954, when the Government undertook large-scalefood procurement operations with the help of commercial bank credit. Morerecently, it alsowent into the jute trade. It was originally contemplatedthat banks would meet such requirements out of their own resources. But,in view of the rise in public and private demand for bank credit, the bankshave come increasingly to rely upon the State Bank through the medium of thecounter-finance scheme.
9. The Karachi Stock Exchange made a modest beginning in 1949,and developed considerably thereafter. Still the volume of shares traded issmall, many of the larger corporations being family concerns. The NationalInvestment Trust, created in 1963, has had limited success in achieving itsobjective of spreading ownership in the middle class. One of the importanttypes of transactions in the stock exchange is trade in Donus vouchers. Thebanks are chiefly interested in gilt-edged securities, but the system as awhole is unable to sell securities except to the State Bank. The only otherinstitutional source with any significant demand are the insurance companies

- 101 -
which are interested in long-dated maturities offering high yields. Thestock market was depressed after the 1963/64 budget introduced new tax measures.The share price index declined by about 10 per cent from the peak of April1963 and has not yet recovered.

AI\Tt 8
RECENT TAX CHANGES ADOPTED DURING THE SECOND FIVE-YEAR PLAN
Summary of Tax Achievements.
1. The Government's tax policies and program during 1960/61-1964/65principally took the form of (A) income tax exemptions to promote savings,investment and capital formation; (B) tax measures to check excessive con-centration of wealth and productive resources in fewer hands by increasingthe tax burden on the richer classes, providing incentives for widerdiffusion of ownership of productive resources, and by building up astronger middle class through tax relief and other tax actions; (C) taxreductions and exemptions to increase industrial and agricultural produc-tion, residential construction, and to promote exports; and higher taxesto hold down consumption to desired levels, but lower taxes bearing on thecosts of the most essential consumer goods. These measures were generallyin harmony with the broad objectives of the Second Plan. The objective ofraising the nation's fiscal contribution by Rs. 1,000 million of addi-tional taxation, as proposed in the Second Plan, was closely coordinatedwith development objectives and policies, and the revenue target was ex-ceeded by 70%.
2. New taxes amounting to Rs. 150 million were levied during 1960/61and a development surcharge was imposed in 1961/62 which was expected toyield Rs. 30 million. Additional tax measures covering a wide range ofdirect and indirect taxes including a 20 per cent increase in excise andimport duties on diesel oil, increases in corporate tax rates, and new taxes(wealth tax, gift tax and capital gains tax) were introduced in 1963/64 andwere expected to yield approximately Rs. 345 million of additional revenue.A flexible surcharge on import duties combined with other minor tax measuresin 1964/65 are expected to yield additional revenue of Rs. 170 million. Theestimated additional tax revenues by year are: 1960/61, Rs. 150 million;1961/62, Rs. 250 million; 1962/63, Es. 180 million; 1963/64, Rs. 525 million;and 1964/65, Rs. 695 million.
3. Collections of taxes have roughly doubled in volume during theSecond Plan from Rs. 2.0 billion in 1959/60 to about Rs. 4.0 billion in1964/65. About half of the increase has come from excise duties and customsduties (including export duties but excluding customs on commodity aid) thelatter rising from Rs. 560 million in 1959/60 to an estimated Rs. 1,080million in 1964/65, the former from Rs. 370 million to Rs. 849 million. Re-ceipts from sales taxes have more than doubled principally on account of theincrease in imports and industrial output; their present level is estimatedat Rs. 750 million. Income and corporate taxes have increased less rapidlyfrom a level of Es. 370 million in 1959/60 to an estimated Rs. 633 millionin 1964/65. Land revenue collections which are the responsibility of theProvincial Governments increased relatively slowly from the 1959/60 rate ofRs. 220 million to Rs. 307 million estimated for 1964/65. Other Central andProvincial taxes have increased from Rs. 170 million in 1959/60 to Rs. 362million in 1964/65. The principal tax measures taken during the past 5 yearsare discussed in more detail below.
- 103 -
(A) Direct Tax Incentives and Concessions to Promote Investment, Savingsand Capital Fonration.
a. Tax Holiday. Tax concessions under the "tax holiday" were liber-alized in 1960/61, the period of tax holiday for new industrial undertakingsbeing extended from 2 to 4 years and, in the case of East Pakistan and theless developed regions of West Pakistan, the tax exermption applied for 6years. The existing provision restricting the distribution of profitsduring the tax holiday period to the extent of 5 per cent of the capitalemployed was modified in favor of a set-aside of 60 per cent of the profitsin each year of the period for utilization in the expansion or furtherdevelopment of the undertaking, with permission given in special cases toinvest this amount in other approved industries. The requirement that taxholiday industrial undertakings use raw materials wholly or mainly producedin Pakistan was modified so that this condition could be relaxed by theGovernment in appropriate cases. The tax holiday was made available toindustries established between April 1959 and June 30, 1965, and to exist-ing industries in the case of development and expansion projects constitut-ing new identifiable units or new identifiable industrial processes. Thescope of tax holiday was further extended in 1961/62 by allowing 4 yearsfor new industries located in the more advanced areas and 6 to 8 years inthe others, (the latter generally applying to all of East Pakistan exceptfour urban areas, and most of the region west of the Jhelum and Indus Riversin West Pakistan). Moreover, the 60 per cent reserve created during thetax holiday period could be used for the issue of bonus shares and thetax payable (at the rate of 12-1/2 per cent on the nominal value of thebonus issue) would be waived in that case. Companies which were unable touse the special reserve for their own expansion were permitted to investthis sum in any industry listed in the Industrial Investment Schedule with-out prior Government approval. The tax holiday benefits were also madeapplicable to companies with a minimum share capital of Rs. 200,000 minimum.The tax holiday was to expire on June 30, 1965 but was extended in the1964/65 budget to June 30, 1970. The length of the holiday was reduced bytwo years and will now last for six, four or two years in West Pakistanand six or four years in East Pakistan, depending on the location of theindustry. The benefits of the tax holiday have also been extended toindustries requiring special technical know-how or wihere the return islikely to be small compared to the risk and to industries contributing toagricultural development or having an appreciable export potential.
b. Depreciation Allowances. The provision for an "additional de-preciation allowance" on plant and machinery (equal to normal depreciationallowed for the first 5 years of operation) which was due to expire onJune 30, 1961, was extended for 5 years in 1961/62. In the 1962/63 budget,for enterprises not enjoying tax holiday exemption the existing system ofinitial, normal and additional depreciation allowances to which new under-takings had been entitled was scrapped in favor of a "development allowance"at the rate of 20 per cent over and above the depreciation allowance which

- 104 -
is admissible to the extent of 100 per cent of the original cost of plantand machinery installed after June 30, 1962. This enabled new undertakingsto recover 120 per cent of the cost of their capital assets. An amountequal to the development allowance had to be kept in a reserve account for8 years for the purpose of replacement of capital assets or investment inother business of the undertaking. The new concession, it was felt, wouldbe more successful in ensuring building up sufficient reserves for meetingthe increasing costs or replacements; however, it was discontinued in1963/64. Under this year's tax holiday extension, at the end of the holidayperiod depreciation will be calculated on the depreciated value of the costof plant and machinery rather than on the original cost as was the previousrule.
c. Corporate and Inter-corporate Taxes. In 1960/61 the entire systemof corporate taxation was changed in favor of reduced tax liability (incometax and super-tax) for industrial firms declaring dividends in Pakistan.All the tax rates of public and private commercial and industrial firmswere lowered by a 3-10 per cent margin, with the new rate of 45 per cent(reduced from 55 per cent) applicable to Pakistan industrial companiesestablished since Partition and declaring dividends in Pakistan. The taxon branches of foreign industrial corporations established after Partitiondeclaring dividends outside Pakistan was reduced from 60 per cent on theirlocal profits to 55 per cent. However, the tax differential in favor offoreign corporations operating in Pakistan through subsidiaries, as againstbranches, was raised from 5 per cent to 10 per cent making it more profit-able to operate through a subsidiary than through a branch. Also 1960/61,the tax on dividend income received by one company from another (i.e.,inter-corporate taxation) was reduced from 20 per cent to 15 per cent forapproved industrial companies established after June 30, 1959. The ef-fective tax rate was reduced for companies resident in countries with whichPakistan has agreements for the avoidance of double taxation. Thus thetotal incidence on a principal public corporation operating in Pakistanthrough a public subsidiary was decreased, for example, from 60.6 per centto 49.8 per cent on their local profits in the case of U.S., Swedish andJapanese industrial companies established after Partition. In 1961/62 thetax on inter-corporate industrial profits was reduced from 15 per cent to10 per cent on dividends received from a subsidiary industrial company inwhich the parent firm held not less than one-third of the voting shares.The following year tax exemption was granted on dividends received by aparent company from a subsidiary concern established for the purpose ofoperating a new unit or a new industrial process. In 1964/65 the taxposition of Pakistan firms having many branches abroad was improved bypermitting their foreign income and the tax paid thereon to be aggregatedand a credit given for the total tax paid abroad. A tax rebate was alsoextended to the foreign income of Pakistan enterprises which is remittedto Pakistan.
- 105 -
d. Mining Industry Concessions. The 1961/62 budget gave miningcompanies the option of claiming the special liberal concessions previ-ously granted to the mining industry, or an 8-year tax holiday. If theformer option were chosen, the company could set off losses in miningagainst income from other sources, provided the mining enterprise andthe other business activities were owned by the same taxable entity.Under both options the mining company could take advantage of the taxholiday for the profits from refining or concentrating minerals in Pakistan,or alternatively could take the existing concession exempting from incometax profits from such operations up to 5 per cent of the capital employedtherein for a period of 5 years. In 1962/63 mining companies not eligiblefor special tax exemption and tax holiday were granted a 15 per cent de-pletion allowance, subject to a maximum of 50 per cent of the capitalemployed in the relevant year. As an additional incentive, a tax rebateof 10 per cent was given to all mining companies in 1964/65.
e. Insurance Companies. Direct tax relief was given to insurancecompanies in 1962/63 by raising from 50 per cent to 75 per cent the per-centage of income tax deduction permitted for amounts paid to, reservedfor, or expended on behalf of policy holders. Indirect assistance wasextended to insurance companies in 1960/61 by doubling the exemption inrespect of life insurance policies in payment of estate duty liability and,in 1961/62, by allowing taxpayers an additional "investment allowance" of10 per cent of income for taking out life insurance policies.
f. Foreign Technical Assistance. Foreign professors and teachersat a recognized university or school in Pakistan were granted tax exemptionfor a period of 2 years in 1960/61. Foreign technicians employed by firmsengaged in the drilling of minerals (excluding petroleum) rock, water, etc.and by institutions established for financing and assisting industries weregiven tax exemption in 1961/62 and in 196 4/ 6 5 the period of tax exemptionenjoyed by foreign technicians employed by industrial firms in Pakistanwas extended to 3 years.
g. Interest on Foreign Loans. Another concession to industry in1960/61 was the exemption from income tax of interest paid to foreignlenders provided the country from which the loan has emanated either exemptsfrom taxation the interest income in question or agrees to give tax creditfor the tax payable but not actually charged in Pakistan. W4here the sourcecountry does not grant total exemption, the Pakistan tax liability wouldbe reduced to the level of the tax imposed in that country.
h. Taxation of Income From Property. Income from newly constructedresidential property up to an annual rental value of Rs. 3,000 previouslyhad been exempted from tax for a period of two years. This concession,scheduled to expire on June 30, 1961, was extended for 4 additional yearsand the exemption limit was raised to Rs. 6,000. The 1961/62 budget also

- 106 -
granted a 6-year tax holiday to housing estates building small houses andflats, subject to certain conditions regarding ownership, size and rent.The same exemption was given to housing estates constructing middleincome dwellings provided the annual rent did not exceed 7-1/2 per centof the investment or Rs. 500 monthly per unit: the minimum number ofdwelling units required was reduced from 100 to 25 to qualify for thisexemption. The period of concession on small residential houses up to anannual rental value of Rs. 6,000 and small residential estates which expireson June 30, 1965, was extended in the 1964/65 budget for these housingcategories constructed up to the end of the Third Five-Year Plan.
i. Personal Savings Tax Incentives. In 1960/61 dividend incomereceived by individuals and other taxable entities taxed at rates ap-plicable to individuals was made tax-exempt up to Rs. 1,000. This exemp-tion limit was raised in 1961/62 to Rs. 1,000 plus an additional 20 percent of income in excess of Rs. 1,000; in 1963/64 the exemption limit wasincreased further to 20 per cent of the balance, if any, up to Rs. 2,000.The maximum limit of "investment allowances" (i.e., contributions toProvident Funds, payment of life insurance premia, investment in Governmentsecurities and in undertakings approved by the Government) was raised in1960/61 from 20 per cent of taxpayer's total income, subject to a maximumof Rs. 8,000, to 20 per cent of total income, subject to a maximum overalllimit of Rs. 12,000. The 1961/62 budget provided an additional investmentallowance of 10 per cent of income for taking out life insurance policies,making the total investment allcwance 30 per cent of income with an un-changed maximum of Rs. 12,000. Unit Trust Certificates issued by theNational Investment Trust were made eligible for tax-exemption in 1962/63as an investment allowance and the income of the Investment Trust wasexempted from income tax and super tax. The scope of investment allowanceswas extended to cover investments in Government sponsored finance corpora-tions and transport companies. Interest on all savings banks deposits upto a maximum of Rs. 500 became tax exempt in 1964/65 and the benefit ofthe investment allowance was extended in respect of all shares purchasedby a taxpayer from the PIDC in both the East and Wlest Provinces.
j. Estate Duty. The scope of existing concessions was extended andadditional exemptions were granted in 1960/61 so that the estate of aperson leaving about Rs. 500,000 would not have to pay any estate duty.The exemption in respect to life insurance policies was increased fromRs. 25,000 to Rs. 50,000, Post Office Savings Banks deposits, SavingsCertificates including National Development Certificates were made tax-exempt up to Rs. 25,000, and amounts in Provident Funds were exempt fromduty. In 1963/64 in respect of insurance policies purchased for the solepurpose of meeting estate duty liability and assigned to the Government,tax exemption was granted to the extent of the duty actually becomingpayable. Land Reform property and compensation bonds were also madeacceptable in meeting estate duty liability.
- 107 -
(B) Tax Measures with Primarily Social Justice Objectives.
Several of the above tax incentives and concessions have as asecondary objective to break up or avoid excessive concentration of wealthand productive resources, to foster a strong and widely-based middle class,to achieve a more equitable distribution of the burden of taxes, or other-wise advance the concept of social justice. The tax measures more directlyconcerned with such social objectives are given below.
a. Personal Taxation. In 1961/62 the highest marginal rate ofpersonal income tax was reduced from 80 per cent to 75 per cent, thereduced rate applying to taxable income exceeding Rs. 60,000. This re-duction was also made to apply in the case of partners of registered firmswhose proportionate share of the super-tax on partnerships, combined withtheir personal tax liability, exceeded 75 per cent of their income. Directtax relief was provided in 1962/63 for private earned incomes (i.e., incomefrom salary, business, profession or vocation and other sources if derivedfrom personal exertion rather than investment) by raising the exemptionlimit of 20 per cent of such income from a maximum of Rs. 4,000 to amaximum of z.s. ,000. In 1963/64 the rate of earned income relief wasincreased to 25 per cent of such income up to Ls. 20,000 plus the pre-vious rate of 20 per cent for the balance, the maximum limit of Rs. 6,000remaining unchanged. The education allowaance of Rs. 200 per child, sub-ject to a maximum of Rs. 600, for persons whlose annual income did notexceed Rs. 25,000 was raised in 1963/64 to Rs. 300 per child up to a rmaxi-mum of Rs. 900. In 196h/65 the maximum of .;ls. 900 that may be clairmed bya taxpayer was likewise made applicable to one child or two children pro-vided an iteemized account of the expenditure is submitted.
b. Cooperative societies were given the option in 1960/61 to betaxed at company rates or at individual rates, whichever treatment wasmore beneficial to them, and the profits of such societies engaged incottage industries or providing agricultural and rural credit facilitieswere made tax-exempt. In 1962/63 the tax-exemption limit in the case ofowner-occupied houses was raised from Rs. 2,400 net annual assumed rentalvalue to Rs. 4,d00.
c. "Grossing Up Dividends." The previous complicated system wasabolished in 1960i61 under which a company was deemed to have paid incometax (but not super-tax) on behalf of its shareholders. The new systemrequired the dividend income to be added to the other income of the tax-payer and taxed in the normal manner. The first Rs. 1,000 of dividendswas tax-exempt to encourage the small investor. The "grossing up" ofdividends made companies and their stockholders liable for taxes onaccumulated dividends in higher tax brackets and was an effort by theGovernment to obtain more revenue from high income earners.

- 108 -
d. Change in Definition of Public Corporations. The definition ofa public corporation was revised in 1963/64 to make them more broad-based.The corporation income tax rates were not changed but closely held companiessuch as family corporations, after a period allowed for becoming publiccorporations by selling shares to the public, would have to pay a 5 percent higher tax than public corporations. The 5 per cent tax rebateextended to industrial firms was discontinued but small companies (incomenot exceeding Rs. 25,000) were given a 5 per cent rebate. In 1964/65the rate of corporate taxation on small industrial companies with totalincome up to Rs. 50,000 was reduced from 55 per cent to 50 per cent.
e. Declaration of Dividends. The compulsory requirement that pri-vate limited companies declare a certain percentage of their income asdividends which had been held in abeyance in 1959/60 and 1960/61, toenable them to plough back a higher proportion of profits, was made in-applicable to industrial profits in 1961/62. This relaxation was withdrawnin 1963/64.
f. Business Deductions. Limits (75 per cent of salary and a maximumof Rs. 30,000 per year per person) were placed in 1963/64 on deductionsfrom taxable profits on account of perquisites and benefits. Initialand depreciation allowances for motor vehicles not plying for hire werewithdrawn and any excess over Rs. 40,000 in the cost of a car was hence-forth ineligible for depreciation allowance.
g. New Direct Taxes. The imposition of a wealth tax in 1963/64on the assets of private companies in excess of Rs. 400,000 representeda new departure in the field of taxation. The tax was 1 per cent on thefirst net assets of Rs. 1 million in excess of Rs. 400,000 and 1-1/2 percent on the remainder. Agricultural properties were generally exempt.The wealth tax on private companies was abolished in 1964/65 but that onindividuals was raised from 1-1/2 per cent to 2 per cent on net assetsexceeding Rs. 340,000. Partnerships are exempt but the share of eachpartner is taxable along with his other assets. A capital gains tax wasintroduced in 1963/6h at the rate of 20 per cent for companies and reg-istered partnerships. The tax wjas not made applicable to gains in respectto immovable property (beyond that levied at the local level). The follow-ing year, to meet criticism against this tax, it was decided that gainsfrom disposal of capital assets held for six months will be treated asordinary income and taxed accordingly and that the current gains tax rateswould apply on capital assets held for more than six months and up to fiveyears; for capital assets disposed after five years the tax would be leviedat half the existing rates applicable to capital gains. This last conces-sion is made available to regular dealers and brokers in stocks and shareswhose profits from such transactions are normally treated as income, thoughthey would continue to pay income tax on the profits derived from assetsacquired and disposed of within five years of acquisition. Another newdirect tax was the gifttax levied in 1963/64 on a graduated basis from
- 109 -
5 to 30 per cent on gifts above Rs. 200,000. To meet criticism againstthis tax the 1964/65 budget provided that the income from property givenaway as a gift will not be aggregated with the other income of the donorfor income tax purposes. Once an asset has been given away as a gift andthe appropriate amount of gift tax has been paid on it, income derivedfrom it would be taxed in the hands of the gift recipient and not in thehands of the donor, with effect from the year following that in which thegift was made.
(C) Tax Measures to Increase Production and Exports or to ControlConsumption.
The Second Plan period has been characterized by numerous adjustmentsin indirect taxes to strengthen incentives for increased production andinvestment, to encourage more economical use of natural resources and tohold down consumption to desired levels. During the 5-year period importduties were substantially changed, the standard rate of sales tax wasraised from 10 per cent to 16 per cent (including a 1 per cent rehabilita-tion charge), numerous modifications were made in excise duties, exportduties were progressively reduced and special incentives were given toexporters.
a. Import Duties. Concomitant with the freeing in 1960/61 of amajor sector of the economy from import controls was the reduction inimport duties on many industrial raw materials and other essential goods.This program was continued in 1961/62 with decreases in import duties invarious industrial raw materials, chemicals and drugs, food and beverages,etc.; further, customs duty on machinery and spare parts imported intoEast Pakistan was lowered from 12-1/2 per cent to 7-1/2 per cent. Reliefwas provided consumers in 1962/63 by granting customs exemption to poultry,ghee and dried eggs under PL-480. The duty on diesel oil used in tractors,tubewells and lift pumps for agricultural purposes was reduced by 20 percent in June 1963. In the 1963/64 budget import duties were cut for in-dustrial chemicals and other raw materials but raised for diesel and otherfuel oils. For machinery imported for installation in underdeveloped areasin West Pakistan and eligible for the 8 -year tax holiday, a rebate of 5 percent was allowed against the standard 12-1/2 per cent duty. In the 1964/65 budget, a number of selected items were subjected either to increasesin import duties for revenue reasons or as part of the program of importliberalization, or as a measure of relief or import rationalization, orto decreases or exemption from duties on such items as food for infantsand invalids, fountain pen nibs, laboratory glassware, sports goods notmanufactured locally, toys, etc. Importantly, the Minister of Financewas granted authority to enhance, by notification, at any time during theyear, customs duty, excise duty and sales tax, to a maximum of 25 per centof the existing rate of 10 per cent ad valorem. All such notificationswould automatically lapse after June 30, 1965, unless incorporated bythe National Assembly in the statutory rates. This power was exercised on
- 110 -
July 11, 1964 when 31 items were put on the free list and regulatory importduties were levied on many items ranging from five to ten per cent advalorem (and for one category 20 per cent ad valorem). The additional ratelevied for most items was 10 per cent, but for tied imports from the UnitedStates and Canada an additional duty of only 5 per cent was imposed sincethe Pakistan authorities view prices from these countries as already high.The measures taken on July 11, 1964, pertained mainly to customs dutiesand were estimated to increase customs collections by approximatelyRs. 70 million or 8 per cent. Again in February 1965 the Minister ofFinance exercised this regulatory power to raise customs duties to dis-courage speculative imports of certain Free List items.
b. Sales Tax. The standard rate of sales tax was raised in 1960/61from 10 per cent to 12-1/2 per cent and the concessional rate of 6-1/4 percent in respect of paper and board was withdrawn. Exempted from the salestax were ten categories of goods of every day use (e.g. food preparations,edible oils, ready-made clothes, photographic film, etc.). The followingyear exe-mptions were granted on many other articles of every day usemanufactured or assembled in Pakistan. Further a general exemption wasgiven on all articles manufactured in Pakistan when exported as well as tothe raw materials used in their manufacture (e.g. cycles, sewing machines,locks, hand water-pumps, plastic and glass crockery, etc.), and insecticidesand pesticides (and their ingredients) used for agricultural purposes.Sales tax exemption was provided to the local shipbuilding industry inrespect to ships, barges and vessels, and to the raw materials used intheir manufacture. The statutory sales tax exemption limit of Rs. 36,000for cottage industries satisfying certain conditions was removed. Furtherrelief was afforded consumers in 1962/63 as additional items were exemptedfrom sales tax (e.g. rubber shoes, trunks made of iron and zinc sheets,sewing needles, dried milk, ghee, pencils, etc.). The general rate ofsales tax was increased in 1963/64 from 12-1/2 per cent to 15 per cent, butsince many goods of common use were exempt, the increase was not expectedto affect living costs unduly. In the 1964/65 budget the sales tax wasabolished on raw cotton (exports) and on locally made furniture, sportsgoods not manufactured in Pakistan, laboratory glass equipment, writing inkand other selected items. To help the local industry the concessional salestax rate of 3-1/8 per cent on fresh imported fruit was raised to thestandard rate of 15 per cent. Under the authority granted to the M4inisterof Finance to enhance, by notification, sales tax to a maximum of 25 percent, the sales tax was raised on July 11, 1964, from 15 to 16 per cent inthe form of a surcharge of 1 per cent on all goods liable to sales tax(except exports) for a special fund to be used exclusively for the reha-bilitation and maintenance of Muslims displaced from India, and was expectedto yield Rs. 40 million. In February 1965 this regulatory power was againexercised in the form of higher sales taxes to discourage speculativeimportations of certain Free List items.
- ill -
c. Excise Duties. Excise duties were increased in 1960/61 on man-made fabrics, woolen fabrics and high speed diesel oil, new duties wereimposed on cement and Mild Steel bars, and betelnuts were brought underduty. The following year salt manufactured in East Pakistan was exemptedfrom duty, the rate of excise duty was increased on sugar manufactured bypower-operated Khandsari Sugar factories, and all excisable articlesproduced in the North-West Frontier areas of West Pakistan and in theChittagong Hill Tracts were exempted from duty for a period of 4 years.Central excises were withdrawn in 1962/63 on betelnut, Khandsari sugar andsitta salt, and biri tobacco, and reduced on artsilk cloth; however, rateswere raised on cigarettes. In 1963/64 a large number of changes were madein excise duties, perhaps the most significant being increases in thetaxes on certain types of diesel oil, fuel oil and refined sugar. In196h/65 excise duties were imposed or added on nonessential vegetableoils, motor tires and tubes, cotton textiles, cigarettes, tobacco andtobacco stalks; in the case of soap, tea and certain beverages, exciseswere reduced or withdrawn.
d. Export Duties. A progressive reduction in export duties on rawcotton has occurred during the Second Plan period. The duty on Comillacotton was reduced in August 1960 by half to Rs. 20 per bale and wasabolished a year later. Other raw cotton varieties have been reduced fromRs. 75 per bale (Rs. 40 in the case of desi cotton) to Rs. 10 during thePlan period. In the case of raw jute the only reduction took place inthe 1964/65 budget when the Rs. 20 per bale export tax on jute was cut by50 per cent. In the case of tea, the export duty was reduced in each yearand eliminated after August 1963.
e. Export Incentives. In addition to other incentives, exporterswere given a tax rebate (15 per cent for incorporated concerns and 10 percent for unincorporated firms) in 1963/64. For manufacturers who are alsoexporters, rebates ranging from 10-20 per cent were provided depending onthe percentage of output exported less the value of the export bonus earnedthrough export sales. The tax rebate was not allowed on tea, cotton, rawjute, jute manufactures, and other manufactured products as might be de-termined by Government from time to time.
(D) Provincial Taxation.
The major source of Provincial revenue is the share of taxes leviedby the Central Government. Taxes levied by the Provincial Governmentshave increased only slightly and not very significantly during the SecondPlan period, as indicated below.
a. West Pakistan. The Provincial Government imposed temporary taxesin 1960/61 w7hich were continued the following year. An effort was made in1962/63 to rationalize excise duties and certain other taxes and, in con-junction with a 100 per cent increase in the excise duty on imported liquor
- 112 -
in Karachi, was expected to increase tax receipts by more than Rs. 10million. The duty on electricity in the Southern zone was abolished sincethe rates in those regions were already higher than in other parts of WestPakistan. The Wlest Pakistan Government introduced several new fiscalmeasures in 1964/65 including a sugarcane development cess, a duty onelectricity and a uniform tax on professions, trades and callings. Thecess on sugarcane is at the rate of 12 paisa per mound of sugarcane crushedby sugar mills, with the sugarcane seller and the sugar mill contributingequally to the cess, and the proceeds earmarked for road maintenance anddevelopment and plant protection in areas falling within the mills zonesand other purposes connected with sugarcane development. The electricityduty is at the rate of one paisa per unit of energy consumed for residential,office or commercial purposes and one paisa for every four units consumedby industrial enterprises. The duty does not apply to power used foragricultural purposes and by individuals consuming less than 20 unitsmonthly. The tax on professions, trades and callings previously leviedat differential rates has been replaced by a flat rate of Rs. 30 per annumapplying to persons who in the previous financial year were assessed anincome tax or an agricultural income tax or paid land revenue exceedingRs. 250, or to legal practitioners of not less than five years standing,contractors selling goods or services to Government agencies, income taxpractitioners, approved custom house agents, and licensed exporters andimporters. In May 1964 the Governor of West Pakistan promulgated an ordi-nance providing for the levy of a tax at the rate of Rs. 60 to Rs. 100 peracre on lands irrigated by inundation canals in the Ghulam Mohammad Barragearea in former Sind. The higher rate applied to lands not irrigated by suchcanals before the contruction of the G. M. Barrage. The taxes were to bepaid in installments spread over 20 years. Revisions in existing taxeswhich are being considered relate to horse race betting, entertainment andhotels. As a step towards reducing evasion and increasing receipts thebetting tax is to be levied at the race tracks and the collection sharedbetween the Government and the club owners subject to the condition thatthe latter guarantee the loss if receipts fall below the average of theprevious two years; the levy will be at the rate of 5 per cent of all betsinstead of 12-1/2 per cent of winnings. The entertainment tax is to bebased on the theatre's seating capacity rather than on the basis of ticketssold, and the hotel tax may be revised on a similar basis.
b. East Pakistan. The rate of super tax on agricultural income taxpayable by companies (principally tea gardens), associations and firms wasincreased in July 1962 from 12 paisa to 20 paisa per rupee. In 1963/64the rate of tax on motor vehicles was increased per year from Rs. 25 toRs. 30 per seat applicable to passenger buses. The tax on professions,trades and callings was increased from Rs. 30 to Rs. 50 per year and incometax practitioners, clearing agents, contractors, etc. were included. Thestamp duty (non-judicial) on conveyance instruments exceeding Rs. 10,000was reduced from 2 per cent to 1 per cent ad valorem. The tax of Rs. 3per year paid by shops situated in municipal and other notified areas wasabolished in July 1963. No tax changes were made in 1964/65.

(E) Administrative Changes.
Many changes to improve tax administration were introduced duringthe past 5 years. Among the more noteworthy actions was the establish-ment in 1963/64 of a penalty against taxpayers of 6 per cent on taxesnot paid by the due date and the institution in 1964/65 of a system ofincome tax self-assessment of salaried persons and certain other classesof taxpayers whose annual income does not exceed Rs. 25,000 under whichthe taxpayer pays his computed tax liability at the time of filing hisreturn instead of waiting for the Income Tax Department to scrutinizehis return and notify him of the payment due.
ANNEX 9
TAX SYSTEI
1. This annex presents a brief evaluation of Pakistan's system oftaxation against the objectives of the Third Plan! a discussion of the assumedtax elasticities; a preliminary survey of measures for additionaltaxation which are likely to be proposed for the Third Plan; and asummary of projections for government's net capital receipts.
A. The Tax System and Plan Objectives
2. To put Pakistan's tax system into gear with the Third Planand the Perspective Plan will necessitate far - reachingchanges in tax policies, structure and administration. Unfortunately,the report of the high-level Commission on Taxation and Tariffs is notyet available and the draft Plan document contains no specific recom-mendations for rationalizing the existing tax and tariff structure,mobilizing the required tax revenues and improving the tax machinery.It is to be hoped that the findings and conclusions of the Commissionwill enable the Government to consider in a more concrete manner thealternatives and economic implications of increased or decreaseddirect and indirect taxation and appropriate levels and trends formajor taxes. Obviously both the level and structure of taxes influencedifferently domestic savings and investment, for instance, direct taxesby influencing the distribution of income after taxes and indirect taxesby influencing the level and composition of imports and exports. In-formed judgments of the effects of changes in the level and structure oftaxes (using alternative combinations) are vital to formulating coherentand internally consistent economic policies. Furthermore, the likelyeffects of tax measures on production, prices and consumption as well asthe revenue implications of the physical production targets need to beconsidered in order to arrive at a consistent set of relationships withthe macro-economic projections in the Plan.
3. Meanwhile, the Mission has attempted to combine available in-formation on projected yields of existing taxes with a tentative distri-bution of the proposed Rs. 3 billion of additional taxation, to arriveat a judgment on the realism of the assumptions underlying the ThirdPlan with regard to domestic resource mobilization. The main conclusionsare presented in paragraph of the Main Report.
4. The tax revenue projections for the Third Plan (Table 1 below,and Appendix Table 12 ) indicate that direct taxes are expected to yieldunder 30 per cent ane indirect taxes over 70 per cent of total tax

- 115 -
revenues, thus approximating the proportions in the Second Plan.-/ The
yield anticipated from income and corporate taxes, accounting for morethan half of the total direct taxation, is expected to grow only slightlyfaster than other direct taxes. Although income and corporation taxesin the past have increased faster than income in the non-agriculturesectors, the relative share of these taxes in the Third Plan periodapparently is not expected to change appreciably from the Second Plan.
There is room for gradual broadening of coverage, modification of toolenient rates, reducing exemptions not economically justifiable, reduc-ing tax concessions to industry, plugging tax 'oopholes, and reducing
tax evasion.
Table 1
Shifts in Tax Structure(Percent)
1960/61 1964/65 1969/70 1/ Second Thir/(Actual) (Estimated) (Projected)- Plan Plan-/
Total Tax Revenues 100.0 100.0 100.0 100.0 100.0
Direct Taxes 30.4 28.6 29.8 29.8 29.2
Income and Corporation Tax 15.7 15.9 17.2 16.4 16.5Land Revenue 9.9 7.7 7.2 8.4 7.4Agricultural Income Tax 0.7 0.3 1.2 0.5 1.0Stamp and Registration
Taxes 2.9 2.6 2.0 2.8 2.2Other 1.4 1.7 2.2 1.7 2.1
Indirect Taxes 69.4 71.4 70.2 70.2 70.8
Excise Duties 17.9 22.6 22.3 20.0 21.9Customs Duties 25.6 27.1 22.3 26.4 24.5Sales Taxes 19.2 18.8 18.9 18.9 18.6Other 6.7 2.9 6.7 4.7 5.8
1/ Including Rs. 3,000 million of additional taxation apportioned on atentative basis.
Source: Planning Commission, with adjustments.See Apperndix Table 12.
1/ In addition to the taxes shown in the table, direct taxesinclude wealth and capital gains taxes, rehabilitation taxes, estateduties, motor vehicle taxes and urban immovable property taxes.

- 116 -
5. Tax revenue from agricultural land and income together repre-sents around 29 per cent of the total direct taxes, slightly less pro-portionately than in the Second Plan; comprising one-eleventh of totaltax revenues, they represent a somewhat smaller share than in the previ-ous Plan period. Other direct taxes, mostly levied by ProvincialGovernments, are expected to form a larger segment of total tax revenuesconsistent with the objective of greater tax effort at provincial levelsas part of the overall fiscal policy. In the opinion of the Mission thetax structure could be improved by imposing appropriate bettermentlevies to capture windfall gains in land values when they are realizedwhich are attributable to Government irrigation and other improvements,by introducing more progressive rates, and administration of the agri-cultural income tax as part of the Central Government income tax, withthe existing land revenue tax integrated with the personal income taxin the form of a tax credit, and by overhauling the water rate structure.Despite the remarkable growth in agricultural output, the agriculturalsector has lagged substantially behind others in its relative tax contri-bution. Admittedly, the price system discriminates against the agri-cultural sector and the domestic price system needs to be rationalized.Tax policy and other indirect measures should be employed toward thisend so as to provide increased incentives for producing cash crops forexpo.t and crops that are import substitutes. Provincial taxation, ofwhich agricultural taxes form the major part, has generally lagged be-hind the growth of the economy and the effort to develop a sound andstronger tax base at this level needs encouragement particularly inview of the rapid growth in their non-development expenditures and thedecline in their revenue surpluses. Some further comments on this sub-ject will be made below in connection with additional taxation.
6. The indicated shifts in the structure of indirect taxes, whilestill relatively minor, have more significance. The anticipated yieldfrom customs duties is proportionately less than in the Second Plan, de-clining by approximately 2 per cent, primarily the result of a relativelysmaller volume of import duties which reflects the further developmentand growing relative importance of Pakistan's import substitution indus-try and a growing proportion of low-duty imports. Also, the relativegrowth of merchandise imports projected for the Third Plan is somewhatless than the projected growth of overall tax revenue. The impositionof additional regulatory import duties on Free List and OGL items isadvisable as well as higher customs duties on consumer goods importsconsumed by higher income groups.
7. Excise duties show a relative gain of almost 2 per cent, andother indirect taxes, mostly levied by Provincial Governments (e.g.entertainment and betting taxes, tolls on inland vessels, electricityduties, etc.) are also expected to form a larger segment of the total.The case for increasing the relative share of excise duties seems clearsince the bulk of the revenue from this tax comes from only four itemsand the rates on the relatively few industrial domestic commodities

- 117 -
taxed at present are low. IWTith the impressive advance in industrialproduction achieved during 1960/61-1964/65 and planned ahead and theprogressive replacement of dutiable imports by new doms3tic imianufactures,with the need for establishing a broader base for controlling inflation-ary or deflationary tendencies by appropriate tax adjustments, a morewidespread levy of excise duties, shifting from specific rates to anad valorem basis where feasible, would make the tax system more flexibleand responsive to economic growth. Increasing the rates on selectedcommodities and extending the coverage would not be likely to exert un-due pressure on living costs.
8. Receipts from sales taxes are expected to grow by 75 per centor somewhat less than excise duties, accounting for a slightly reducedproportion of total tax revenues. Inevitably Pakistan will have to relyincreasingly on consumption taxes to finance development, and salestaxes therefore will also need to be increased and enlarged in scope.This should be done on a selective basis to minimize regressive effects,with items consumed by higher income groups more heavily taxed thanthose consumed by lower income groups.
9. The principal conclusion from the above is that the tax struc-ture as a whole is not expected to show pronounced shifts during thenext five years. The relation of direct to indirect taxes is expectedto be the same as in the Second Five-Year Plan. A close examination ofthe implied tax elasticities will show, however, that the growth rate ofindirect tax revenues has probably been underestimated.
10. The elasticity assumed by the Flanning Commission to calculatethe revenue projections in the case of imports, using total imports asthe determining variable, is 0.7 although there is evidence that anelasticity of near unity might have been more fitting. The elasticityassumed in the case of excise duties is 1.0, with the value added indomestic manufacturing the determining variable. In the case of salestax on imported goods, the determining variable is total imports andthe assumed elasticity is 0.4. This low elasticity rate is attributedto the lower sales tax on imported capital goods which have been a grow-ing share of total inports. The sales tax on domestic goods is assumedto have an elasticity of 1.0, the value added in large scale industrybeing the determining variable. The elasticity assumed for income andcorporation taxes is 1.3 in relation to non-agricultural income, thedetermining variable. The technique followed is one of fitting regressionequations to time-series of tax receipts with adjustments to correct forerratic and structural changes. The performance of these taxes during1952/53-1962/63 in relation to their determining variables provides thebasis for the elasticity calculations, with more emphasis given to theperiod after 1958 than to the earlier years.
11. The projected yields of the major Central Government taxes(excluding the Rs. 3 billion of additional taxation) are based on the

- 118 -
present tax system, and in the case of the assumed elasticity for importtaxes rmay also be too low because the base year (1964/65) does notreflect the full use of powers in connection with regulatory duties onFree List items, that is to say, only the July 11, 1964 regulatoryactions have been considered and not the second installment which wentinto effect in February 1965, Foodgrains, the bulk of which are duty-free PL 480 imports, should have been excluded from the elasticitycalculations. From these observations it appears that there are severalshortcomings in the tax revenue projections, most of which would resultin estimates on the conservative side; but no reliable data are a.ailablefor quLntifying the amount of possible overestimations.
12. The estimate and possible distribution of the Rs. 3,000 millionof additional taxation is based on an examination of the additional tax-able capacity likely to be generated in the Third Plan as well as theareas where the full potential of taxable capacity has not been fullytapped by the existing tax system. The Provincial Finance Departmentsparticipated on a tentative basis in the estimation of receipts fromadditional provincial taxation but apparently neither they nor theMinistry of Finance evaluated the results utilizing the elasticities ormade independent estimates following customary budget procedures. Theestimates of additional taxation assume various increases in the ratesand coverage of existing taxes, imposition of new taxes and othermeasures which suggest the scope for additional taxes but have no forceof recommendation in their present form; as a whole, they can be regardedas no more than crude and tentative approximations of prospective taxyields. They are distributed as follows: Central Government excises(Rs. 1,000 million), sales taxes (Rs. 600 million), import duties(Rs. 350 million), income and corporation taxes (Rs. 300 million), better-ment levies (Rs. 400 million), agricultural income taxes (Rs. 200 million)and water rates (Rs. 150 million). The Central Government accounts forRs. 2,250 million of this total and the Provincial Governments for theremainder (West Pakistan about Rs. 520 million and East Pakistan approxi-mately Rs. 240 million). These figures exclude increased revenues re-sulting from improvements in tax administration except in the case ofincome and corporation taxes; readjustments of tax concessions toindustry are however included. A more detailed discussion of the itemsencompassed by the Rs. 3 billion of additional taxes is given below.
B. Scope for Additional Taxation
13. Central excises and sales taxes. The extension of CentralGovernment excise duties to industrial commodities not taxed at present(e.g. gas, footwear, cotton and woolen yarn, electric fans and otherelectrical goods, rubber, leather and plastic products, blades, chemicals,machine tools, etc.) is expected to yield almost Rs. 1,000 million, andthe increase in rates on the domestic commodities at present subjected to
- 119 -
low duties (e.g. gasoline, silk cloth, fine cotton textiles, cement,steel, kerosene, cosmetics, paints and varnishes, etc.) more than"Rs. 500 million. The case for extending the coverage and increasingthe rates of excise duties seems c]ear. While revenues from Centralexcises have more than doubled during the Second Plan, the bulk of theyield comes from only four items (kerosene, sugar, tobacco and textiles).Increasing the rates on selected commodities and extending the coveragewould not put undue pressure on the cost of living. Moreover, with theimpressive advance in industrial production during the past five yearsand projected ahead, and with the replacement of dutiable imports bynew domestic manufactures, a more widespread levy of excise duties wouldbe highly desirable. It would bring under excise duties a larger seg-ment of the rapidly expanding industrial sector which has developed be-hind the protective wall of high tariffs and quantitative restrictions.Shifting from specific rates to an ad valorem basis vihere feasible wouldmake the tax system more flexible and responsive to economic grow;th.
14. As with excises, the scope for enlarging sales taxes widens aslocal industries increase the volume and diversity of products fordomestic consumption and as the share of the monetized sector of theeconomy in the national income develops. Insofar as consumer goods areconcerned, the Government has moved and wrill be moving farther in thedirection of heavier taxes on items obviously consumed by higher incomegroups and lighter taxes on those consumed by those with lower income.The possibilities for enlarging the scope, avoiding as much as possibleregressive impact, are manifold. It is estimated, for example, thatraising the present standard rate of 15 per cent to, say, 17-1/2 per centand 20 per cent during the Third Plan would yield roughly .us. 150-200 mil-lion depending on whether the increase is to 17-1/2 per cent or 20 per cent.Raising existing low rates (3 to 6 per cent) on selected items to10 per cent, and on alcoholic liquors from 20 per cent to 30 per cent,applying a low rate of 5 per cent on certain items now exempt (e.g.tobacco,biscuits, film, rubber shoes, etc.) and so on, could yield perhaps anotherRs. 900-950 million. It is imperative to keep current with the consump-tion patterns of various income groups in order to determine as con-cretely as possible the scope for selective non-regressive consumptiontaxes. Y/
1/ Pakistan's existing licensing system severely restricts thesupply of consumer goods imports and results in domestic prices wellabove CIF prices plus taxes. Import licensees and domestic producershave profited from this scarcity of imported goods and the existing taxsystem has not been capturing very much of the excess profit. Availableevidence suggests that in recent years increases in the standard rateof sales taxes and modifications in excise taxes have sometimes been ab-sorbed by producers and sellers and sometimes been passed on to consumers.If a principal objective of indirect taxation is to curtail consumptionor limit the production of certain goods, there may be ample margin forraising tax rates and substantial revenue in many cases without causingreal consumer hardship.

- 120 -
15. Import duties. The scope for additional revenue from importduties will depend, of course, on the type of foreign exchange systemthat govermnent will continue or evolve in the next five years. Relianceon the remaining quantitative restrictions will continue to leave aconsiderable amount of scarcity profits in the hands of importers thatcou]d in a free system be tapped for revenue through high import duties.If the present system is maintained the scope for increasing revenues ismore limited because of Government's program to accelerate the develop-ment of import substitution industries. However, imposing regulatoryimport duties on additional items placed on the free list or CGL toprevent excessive imports, and levying higher regulatory duties onselected items are desirable avenues for additional taxation. So faras the consumer goods sector is concerned, the approach would be thesame as with sales taxes and excises, that is, to tax more heavilyitems consumed by higher income groups and less heavily those by lowerincome groups. To some extent, action in this direction will be limitedby the competing need for supporting the premium or export bonusvouchers which is fed by domestic demand for certain imported consumergoods, and which might become regressive. But in the case of non-bonusitems, large windfall gains of importers could be tapped by higher im-port duties, and the existing ample margin for the use of influence inthe licensing of these goods could be removed. Even more scope foradditional taxation would become available if the Government viewed theproblern as one of trying to achieve an equilibrium between demand andsupply of all imported goods and fixed import surcharges accordingly.
16. Income and corporation taxes. The principal areas forenlarging the scope of income and corporate taxation includes reducingtax concessions given to industry, lowering basic exemption limits, andachieving revenue gains through improving tax administration, pluggingtax loopholes and reducing tax evasion. Revenues from income and corpo-ration taxes have increased only moderately during the Second Planperiod in part because of the many tax concessions granted to promoteindustrialization. The loss of revenue from such tax concessions hasbeen conservatively estimated on a rough basis at between 5 to 10 per centof total income tax receipts during the Second Plan period. Measurestaken in the 1964/65 budget to shorten the income tax holiday period fornew industries and to reduce the generous depreciation allowances areproper steps in attaining a better balanced package of tax incentivesrequired to promote sound industrialization. Lowering the corporate taxrate of 55 per cent and at the same time reducing the over-generousdepreciation allowances would be highly desirable. In specific indus-tries tax concessions in the form of accelerated depreciation allowancesmay no longer be desirable. Other instances of over-generous concessionsexist and their reduction or removal would be further steps in the rightdirection. Lowering the personal income 'exemption limit to Rs. 4,000and taxing the Rs. 4,o0o-6,0oo income group at relatively low rateswould yield an estimated Rs. 100 million of additional revenues.

- 121 -
17. There is a case for rationalizing existing tax concessions to ma'cethem more selective and discrimLinating. The rates in the upper personalincome brackets may be too high acting as disincentives for saving andinvestmaent.l/ The way to reduce the tax burden for those who are effectivelvcontributing to economic development is to couple the high rates withsubstantial specific incentives for saving and investment in desired economicactivities and to withhold such advantages from those whose preference is forinvestment in socially less desirable ways (e.g. conspicuous consumption, orreal estate speculation).2/ While exemptions and deductions for sociallydesirable investment incentive purposes are desirable, tax privileges forspecific groups or classes or their exclusion from effective taxation are notjustifiable. They indicate unused taxable capacitv and erode the tax base.The agriculture sector in particular is effertively excluded from incometaxation; this could be acceptable if other specific taxes on land andagricultural activities effectively tapped agricultural income, which .heydo not, or if the volume of subsidies and free government services to agriculturewere substantially reduced. Only about one per cent of the population iscovered by the income tax, and low income levels for many years to comae willprevent the income tax from becoming a mass tax yielding high revenues. How-ever, this is no reason why the coverage, starting at the top of the incomepyramid, could not gradually be broadened and rates that are obviously toolenient modified, with the long-term objective of reducing the exemptionlimit substantially below the present level of 20 times the per capitaincome. This improvement can only be gradual for it requires a build-up ofadministrative capacity to master the compliance and auditing problemsgenerated by the broadening of coverage.
18. Unquestionably, reducing the backlog of assessed but uncollectedtaxes, applying and enforcing stiff penalties for tax evaders, closingtax loopholes, improving the quality of tax administration (through adequatestaffing, better training and higher salaries), would result in net gains.
1/ Structural features of the incomne tax law (e.g. preferential taxationof private capital gains, exemptions, etc.) and institutional arrange-ments (e.g. ample expense accounts and other fringe benefits) ease theimpact of top rates, and as a consequence the top rates are in fact lesssevere than in many other countries.
2/ On incentive grounds capital appreciation of business assets deservesfavorable treatment under the capital gains tax. The gains that mightbe given preferential treatment, the capital losses deductible, etc. raisecomplex questions. On the other hand, appreciation of real estate whichis stimulated by quickening urbanization provides opportunities for sizableadventitious and speculative capital gains. The opportunities for gainare even greater when the general price level is rising, for real estateprices tend to rise relatively more than many other financial assets. Thesegains are proper objects of taxation especially for the benefit ofmunicipal and other local governments. iMoreover, since property is unevenlydistributed and capital gains accrue mostly to the wealthy, the case forthe capital gains tax on economic and social grounds is even stronger.
- 122 -
It is believed by Planning Commission officials that the settlement ofpending income tax cases and proper measures to reduce tax evasion could aloneyield at least an additional Rs. 200 million during the Third Plan period.l/
19. Agricultural land and income taxes. It is tentatively estimated byGovernment officials that betterment levies and agricultural income taxes couldyield roughly Rs. 600 million of additional taxation during the Third Plan,Bet 4 'erment levies, which would be expected to produce about Rs. 400 millionduring this period, would be designed to recover a part of the capital costof a new public development project from owners of land benefitting from theparticular project, for example, from an irrigation facility, Similar taxeswere recommended in the First and Second Pive-Year Plans on land receivingimproved irrigation as a result of Government contruction of new barragesand other irrigation facilities but little was accomplished on this scoreand Without doubt windfall gains on "unearned increments" in land valuesoccurred.2/ The investment in water and power projects during the Third Planwill be twice as large as in the Second Plan and it is felt that betterment leviescould provide a justifiable and fruitful source of revenue, Systems of recoveryof betterment charges would have to be worked out project by project in orderto avoid hardships to the farmers. The expectation that betterment levieswould yield Rs. 400 million during the Third Plan is very rough. The projectionof a relatively significant increase (Rs. 200 million) in agricultural incometaxes during the Third Plan rests on introducing more progressive rates andadministration of the tax as part of the Central Government income tax, withthe existing land revenue tax intel:^ated with the personal income tax in theform of a tax credit, The projections assume no increase or other adjustmentsin land revenue rates.
20, Perhaps no subject in Pakistan is more politically charged orcontroversial than agricultural income and land taxation. The yield from landrevenue and agricultural income taxes has lagged seriously behind that ofother taxes despite remarkable growth in agricultural output, and the relativetax contribution of the agricultural sector which accounts for about 55 per centof the total national income remains substantially below other sectors. The
In the absence of reliable estimates of income distribution and personaltaxable income (i.e., personal income adjusted for deductions and allowancesother than those representing operating expenses) it is difficult to estimatethe loss of tax revenue due to tax evasionJ Perhaps the best way of estimatingthe degree of tax evasion when reliable statistical data are unavailable isto sample audited returns. In India, for example, the 1953/54 Taxation EnquiryCommission found that for income tax returns effectively audited there was adifference of as much as 600 per cent between the income originally returnedand later disclosed. Pakistan's Taxation Enquiry Committee reported in 1959that figures collected on occasion of the tax amnesty disclosed that 40 to60 per cent of income from wealth had been concealed.
.i It should be noted that West Pakistan has a betterment levy based on theincremental value of land resulting from irrigation; it is a fixed sum represent-ing a proportion of the incremental value recoverable over a period of 15-20 years.
- 123 -
argument is made that such comparisons understate the true burden of "taxation"borne by agriculture, that consideration also has to be given to the effectsof export duties, adverse terms of trade with the non-agricultural sector(due to protection of manufactures, imports of PL-ht80 foodgrains, Governmentfoodgrain procurement policies, etc.) and the overvaluation of the rupee. Thepresent pattern of indirect taxation and other Government policies undeniablytransfers income from the agricultural sector to the manufacturing sector whichnot only affects the willingness and ability of agriculturalists to enter themarket economy but gives a distorted impression of industrial profits as well.On the other hand, subsidized fertilizers, free pesticides, improved seedsand other Government agriculturalservices transfer income to the agriculturalsector. The existence of these conditions points to the necessity forrationalizing the relative price system as far as possible, using tax policyas one of the means towards this end. Improvement of agriculture's termsof trade would provide increased incentives for producing cash crops forexport and growing crops that are import substitutes. This would encouragemore saring and would provide a more widely acceptable basis for an increasein agricultural land and income taxes.
21. The scope for increases in agricultural land and income taxes appearsconsiderable provided the measuros taken are designed so that these taxes areresponsive to growth in aclcultxlral o-t'put and gric'Ltr 1 pri.es -vrithoutadversely affecting ancertile.v for pr,dTcfonl Snd irnvestmn.rit, For exwople, ithas"been suggested to replace the exis-Zng complex Ild taum system, wherethe level of texation is s.ppo sed to vary withl the type of crop and withofficial crop reports for a given year, with a simpler one in which progressiverates would be imposed on all fai'm land, whether used or not, without regardto the crop grown, with changes in rates made accordcing to a moving averageof harvest prices in the area. The rate per acre would increase with the sizecS the holding and/or the value of land per acre. Rates would be higher thanat present, but average rates need not be high and in case of extreme flood,draught or blight, rates could be reduced., Such a system wo-uld tend to removethe opportunities for discrimination and would terd to encourage the marketingof crops by all persons in all seasons thereby provi.ding additional econromicbenefits. Assessing the land tax on the land's potential output rather thanactual output, defining potential as the average value of output over a recentperiod from comparable land in the area, could conceivably put pressure on largeholders of underdeveloped or idle farm land to become more productive or todispose of at least part of their holdings in favor of investment in relativelymore productiveassets; it would discourage absentee landlordism and speculationin idle land. _
1/ Studies are under way in West Pakistan to move from the present"fluctuating" land revenue assessment system to a "fixed"system under whichassessment does not vary with the harvest or crop condition and exemptionsare granted on account of improvements or extensions to cultivation sothat the farmer knows the limit of his annual obligation. This could proveto be a greater incentive to cultivate fallow areas and would also requireless administrative work on the part of the Government.
- 124 -
It is felt that the agricultural sector in general would be stimulated tomove more rapidly to a market economy with a resulting increase in suppliesof agricultural products to the non-agricultural sector and for export.
22. Available studies indicate that the rate of progression on"high" agricultural incomes (i.e,, net income of Rs. 25,000 and above) isrelatively low and that the concentration of a fairly sizable proportionof land holdings is in the hands of a small number of large land owners.W4ith the vast majority of farmers having inceme of Rs. 6,000 or less, thusmaking them exempt frem personal income taxation, the yield from agriculturalincome taxation is very low. It is against this background that the suggestionis made that more progressive rates be applied and that the present systemof splitting up agricultural and non-agricultural incomes, which results inmore favorable tax treatment of agricultural incomes, be replaced by oneadministered as part of the Central income tax, aggregating agriculturalincormie with other income for tax purposes.
23. Wqater rates. Increasing interest and effective action by theProvincial Governments in rationalizing the water rate structure andorganizing irrigation services along commercial lines should lead to additionalrevenue from this source. In iest Pakistan where nominal water rates havebeen in existence for a long time, and are more in the nature of a tax peracre than a fee, the charges are said to be well below the scarcity value ofwater and the limited water resources are rationed by non-price means whichreportedly provide opportunities for questiopable administrative practices.-AS a rule, water rates should be ra:sed sufficiently to cover the full costof providing water and to obtain the most efficient water use. The presentpractice of varying the water rate with the crop grown and its averageconsumption of water doeu not necessarily promote the best use of waterresources, nor is it likely that the existing rate structure has much effecton the cultivator's decision to grow one crop in preference to another.Clearly, where a private market for ground water exists, water charges shouldbe increaed. The scope for raising water rates is said to be considerableand the estimate of Rs. 150 million during the Third Plan is regarded as aconservative view of the potential.
2/ In the Punjab average water rates work out to about Rs. 9 per acre.Land reclaimed by Government at a cost of about Rs. 100 per acre is being soldfor as much as Rs. 1,200 per acre. West Pakistan water rates were increased10 per cent in December 1963 and a water rate cormittee is reviewing the wholeproblem of water rate setting. In East Pakistan where artificial irrigation isa relatively recent development, WAPDA is reported about ready to charge waterrates which will be used to pay off its loans.
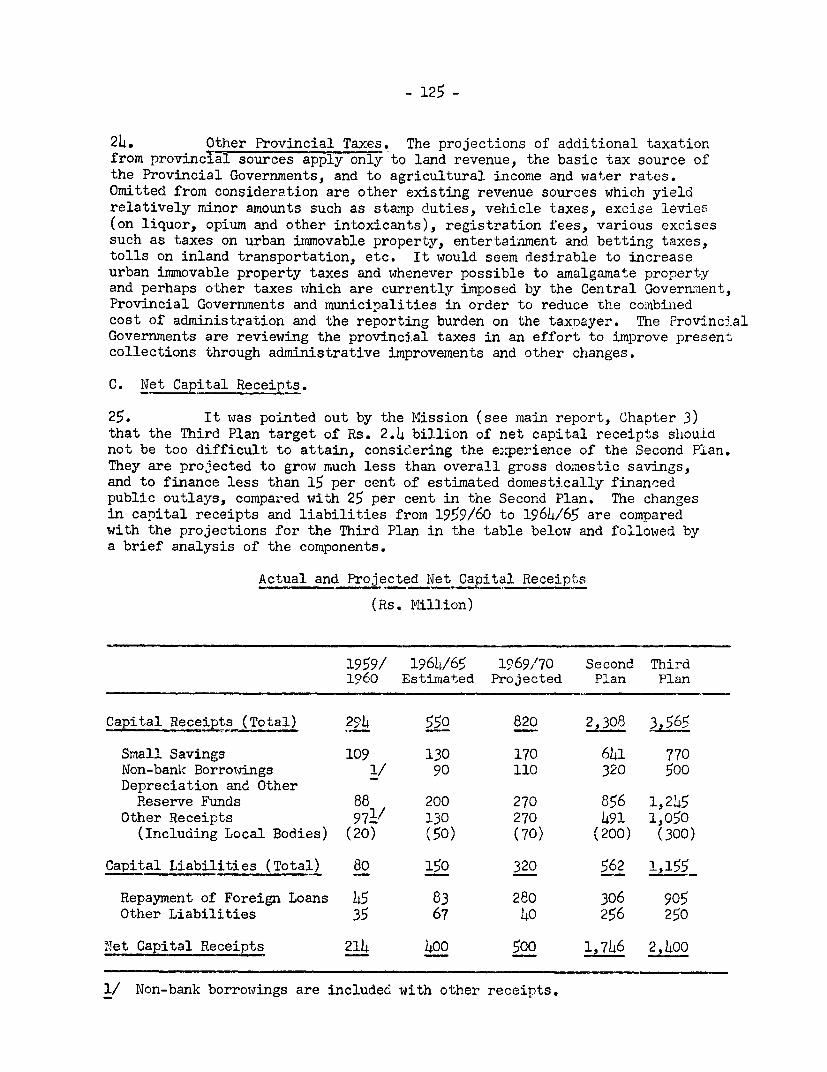
- 125 -
24. Other Provincial Taxes. The projections of additional taxationfrom provincial sources apply only to land revenue, the basic tax source ofthe Provincial Governments, and to agricultural income and water rates.Omitted from consideration are other existing revenue sources which yieldrelatively minor amounts such as stamp duties, vehicle taxes, excise levies(on liquor, opium and other intoxicants), registration fees, various excisessuch as taxes on urban immovable property, entertainment and betting taxes,tolls on inland transportation, etc. It would seem desirable to increaseurban immovable property taxes and whenever possible to amalgamate propertyand perhaps other taxes which are currently imposed by the Central Governm,ent,Provincial Governments and municipalities in order to reduce the coinbinedcost of administration and the reporting burden on the taxpayer. The ProvincialGovernments are reviewing the provincial taxes in an effort to improve presentcollections through administrative improvements and other changes.
C. Net Capital Receipts.
25. It was pointed out by the Mission (see main report, Chapter 3)that the Third Plan target of Rs. 2.4 billion of net capital receipts shouidnot be too difficult to attain, consic.ering the experience of the Second PLan.They are projected to grow much less than overall gross domestic savings,and to finance less than 15 per cent of estimated domestically financedpublic outlays, compared with 25 per cent in the Second Plan. The changesin canital receipts and liabilities from 1959/60 to 1964/65 are comparedwith the projections for the Third Plan in the table below and fo'llowed bya brief analysis of the components.
Actual and Projected Net Capital Receipts
(Rs. Million)
1959/ 1964/65 1969/70 Second Third1960 Estimated Projected Plan Plan
Capital Receipts (Total) 294 550 820 2 308 3z565,,~~~~~~~~~~~~~Z _-.,? v
Small Savings 109 130 170 641 770Non-banic Borrowings 1/ 90 110 320 500Depreciation and Other
Reserve Funds 88 200 270 856 1,245Other Receipts 971/ 130 270 491 1,050
(Including Local Bodies) (20) (50) (70) (200) (300)
Capital Liabilities (Total) 80 150 320 562 155_
Repayment of Foreign Loans 45 83 280 306 905Other Liabilities 35 67 40 256 250
Net Capital Receipts 214 400 500 1,746 2,400
1/ Non-bank borrowings are included with other receipts.
- 126 -
26. Depreciation and other reserve funds of which the railways areaccounting for the major part, are expected to be the main source for capitalreceipts, as in the Second Plan, accounting for over Rs. 1.2 billion, oralmost two-fifths of the total, and slightly more proportionately than duringthe five fiscal years ending in 1965. Although these funds more than doubledin amount from 1959/60 to 1964/65, only a 45 per cent gain over 1964/65 isprojected by 1969/70. The Mission did not obtain details on the surplusesthat the railways, post and telegraph and other public enterprises earn.
27. Second in importance is the unfunded debt (small savings) projec-tion of Rs. 770 million which is similar to the Second Plan target ofRs. 700 million against which net receipts estimated at Rs. 641 million wereattained. In respect of the Central Government, unfunded debt receipts maywell turn out higher than the target since it appears to be weighted tooheavily by the realization in .l963/64. The Central Government in collabora-tion with the Provincial Governments is expanding efforts to popularize thebanking and savings habit through campaigns, special incentives on smallsavings certificates, increasing postal savings facilities, introducingbanking facilities in mills and factories and other schemes. These effortscould be stepped up with the cooperation of private banks, particularly thenew banking offices that are opening up in the smaller towns.
28. The target for Provincial Government borrowings from non-banksources (i.e., individuals, insurance companies, trusts, joint stock companies)and market loans likewise appears conservative. The insurance companieshave been absorbing an average of Rs. 20 million per year and probably couldbe persuaded to increase their net absorption of Government securities. TheNational Investment (Unit) Trust, a government sponsored institution whichbegan operations in January 1963, is now purchasing Government securities aspart of its portfolio to distribute its assets between fixed and variableincome bonds. This, too, should help increase capital receipts, especiallyin view of the growing tendency of the public to invest and hold on to NITUnits. Various other trusts are increasing their purchases of Governmentbonds and Prize Bond sales are rising. The estimate of market borrowing bythe West Pakistan Government as well as the projections of net loans andadvances of both Provincial Governments may also turn out to be low, especiallyif more effective measures are taken to recover agricultural and otherdelinquent loans.
29. The intention to sell PIDC assets in the amount of Rs. 300 millionduring the Third Plan, if it is to be realized, wi'll require more concretemeasures than were taken during the past five years when, even including Rs. 39million of estimated sales in 1964/65, less than 60 per cent of the target wasachieved. Finally, possibilities may exist for obtaining larger dividends3nd contributions from banks, corporations and other institutions sponsoredby Government. The many diverse elements going into the Government's programfor mobilizing domestic capital receipts during the Third Plan and the existenceof still other possibilities make it imperative to construct a comprehensive
- 127 -
and challenging long-range action program which would have a better chance ofachieving optimum results with greater economy of effort and funds. Thisprogram would need to be consistent with Government's tax, credit, privateinvestment promotion and other economic policies and objectives, withconsideration given to aspects such as further incentives required to encourageadditional savings and investments in Government securities and necessaryadjustments to interest rates and other credit policies to attract and channeladditional savings into public investment.
30. The increased liability on account of foreign loan repayments inprospect for 1969/70 is about 3-1/2 times the level budgeted in 1964/65 andthis trend alone dominates the projection for total capital liabilities inthe Third Plan. Other liabilities are expected to maintain their estimated1964/65 level and taper off around the middle of the Third Plan, but nobreakdown was furnished to the Mission to support this estimate. Includedin the projection of net capital receipts is an estimate of Rs. 300 millionfor local governmental units as compared with Rs. 200 million estimated inthe Second Plan; this also appears to be quite a rough estimate.
Related Documents