World Bank Group– Development Impact Evaluation Unit RJK IE Endline Report Final impact evaluation report for Rani Jamara Kulariya Modernization Project - Nepal Paul Christian Teevrat Garg Odbayar Batmunkh 5-25-2020 Public Disclosure Authorized Public Disclosure Authorized Public Disclosure Authorized Public Disclosure Authorized

Welcome message from author
This document is posted to help you gain knowledge. Please leave a comment to let me know what you think about it! Share it to your friends and learn new things together.
Transcript

World Bank Group– Development Impact Evaluation Unit
RJK IE Endline Report
Final impact evaluation report for Rani Jamara Kulariya
Modernization Project - Nepal
Paul Christian
Teevrat Garg
Odbayar Batmunkh
5-25-2020
Pub
lic D
iscl
osur
e A
utho
rized
Pub
lic D
iscl
osur
e A
utho
rized
Pub
lic D
iscl
osur
e A
utho
rized
Pub
lic D
iscl
osur
e A
utho
rized

RJK IE Final Report
ACRONYMS
CAPI Computer
DIME Development Impact Evaluation
FFS Farmer Field Schools
FG Farmer Group
GoN Government of Nepal
ICC Intra-Cluster Correlation
IE Impact Evaluation
IYCF Infant and Young Child Feeding
MDES Minimum Detectable Effect Size
MoALD Ministry of Agriculture and Livestock Development
NLSS National Living Standards Survey
NPR Nepali Rupees
PIU Project Implementation Unit
RJK Modernization of Rani Jamara Kulariya Irrigation Scheme Project
TE Technical Efficiency
WUA Water Users Association
RJK IE Final Report
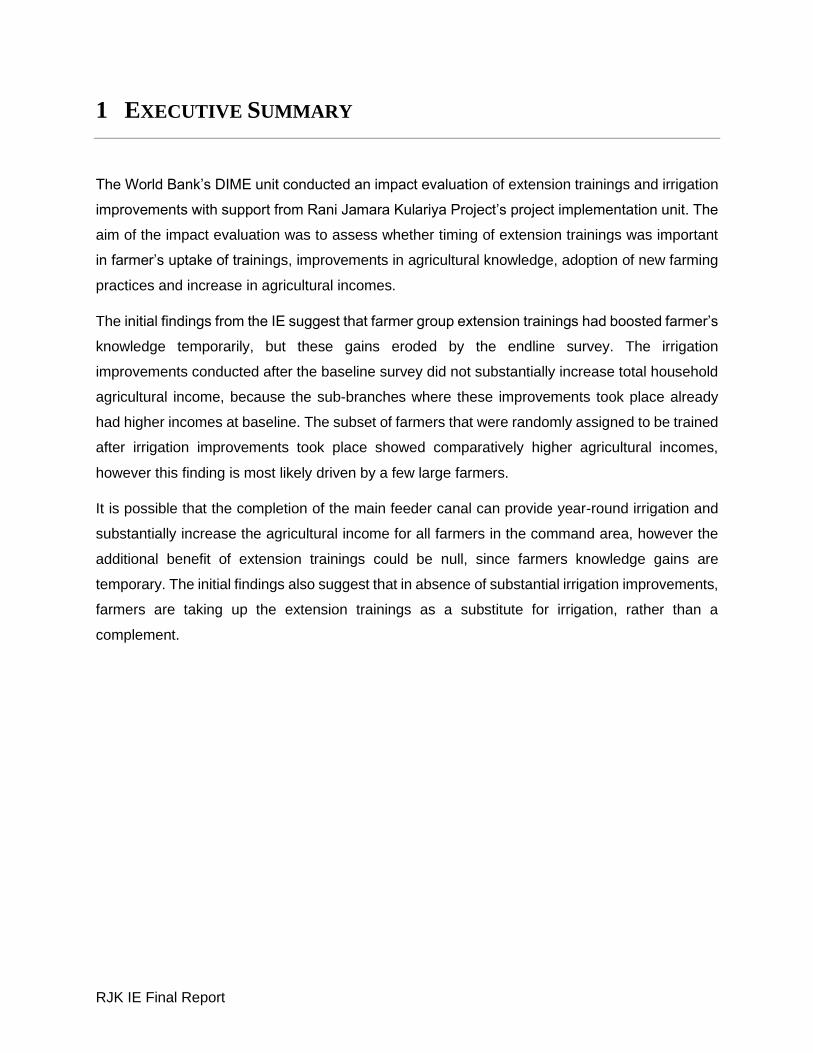
1 EXECUTIVE SUMMARY
The World Bank’s DIME unit conducted an impact evaluation of extension trainings and irrigation
improvements with support from Rani Jamara Kulariya Project’s project implementation unit. The
aim of the impact evaluation was to assess whether timing of extension trainings was important
in farmer’s uptake of trainings, improvements in agricultural knowledge, adoption of new farming
practices and increase in agricultural incomes.
The initial findings from the IE suggest that farmer group extension trainings had boosted farmer’s
knowledge temporarily, but these gains eroded by the endline survey. The irrigation
improvements conducted after the baseline survey did not substantially increase total household
agricultural income, because the sub-branches where these improvements took place already
had higher incomes at baseline. The subset of farmers that were randomly assigned to be trained
after irrigation improvements took place showed comparatively higher agricultural incomes,
however this finding is most likely driven by a few large farmers.
It is possible that the completion of the main feeder canal can provide year-round irrigation and
substantially increase the agricultural income for all farmers in the command area, however the
additional benefit of extension trainings could be null, since farmers knowledge gains are
temporary. The initial findings also suggest that in absence of substantial irrigation improvements,
farmers are taking up the extension trainings as a substitute for irrigation, rather than a
complement.

RJK IE Final Report
2 INTRODUCTION
2.1 PROGRAM CONTEXT
Agriculture is the primary sector of employment in Nepal. 26.98% percent of Nepal’s GDP comes
from agriculture, which employs 81% of the active labor force.1 (FAO, 2020) However, Nepal’s
agricultural sector is characterized by subsistence farming, low crop yields and low cropping
intensity arising from lack of properly managed irrigation facilities and farmer’s poor knowledge of
improved cultivation practices. (World Bank, 2011)
2.2 PROJECT DESCRIPTION
To address these issues the government of Nepal has been implementing the Modernization of
Rani Jamara Kulariya Irrigation Scheme Project since 2012, with financing and technical
assistance from the World Bank. The project has two primary components. The first is the
modernization of the Rani Jamara Kulariya (RJK) Irrigation Scheme, which includes construction
of a feeder canal to link the three major canals in the target area as well as modernization of these
three branch canals including intake structures, control structures, diversion structures, and canal
bank protection. The major improvements, excluding the construction of the feeder canal, were
completed by June 2018, with additional tertiary level improvements to be undertaken in Phase 2
of the project. Rani, Jamara and Kulariya are 3 pre-existing traditional irrigation systems, which
are subdivided into 48 different sub-branch canals. (Figure 1) (Figure 6)
Irrigation improvements constructed so far include:
1. Construction of control structures connecting the Karnali river to each of the three primary
branch canals. This system regulates the flow of water into each primary branch and
reduce the likelihood of monsoon flooding.
2. Construction of control structures along each of the primary branches to regulate water
flow and divert water into sub-branch canals
3. Construction of off takes on the sub-branch canals, which allow for off-season irrigation in
a non-randomly assigned subset of the sub-branch canals. (Figure 8)
1 Share of GDP from agriculture taken from Nepal Ministry of Finance’s Economic Survey 2018. Share of population involved in agriculture was reported by FAO.

RJK IE Final Report
Figure 1 RJK Irrigation System Overview
Source: RJK Phase 2 PAD (2018)
The second component of the RJK project involves supporting farmers with extension programs
to improve their agricultural practices and to maximize the benefits of the new irrigation structures.
These extension programs include the following: block production demonstrations, subsidies for
equipment purchases, construction of collection centers, farmer field schools and farmer group
trainings on vegetable and cereal crop production.
2.3 THEORY OF CHANGE
There are two broad paths in the theory of change based on the two classes of interventions the
project is implementing. The first intervention (non-experimentally varied by the impact evaluation)
is irrigation infrastructure and technical expertise that serve as inputs. The main output from this
intervention is the modernization of the canals and building new control structures that result in
predictable supply of water. The expected change in farmers’ outcomes from the irrigation
investments is an increase in access, especially availability of water in the off-season, and more
efficient water usage.

RJK IE Final Report
Figure 2 Project Theory of Change
The second intervention (experimentally varied during the impact evaluation) is the transfer of
technical expertise on agriculture practices to farmers through certified training of farmer groups.
The main output from extension is increased knowledge of agriculture methods and commercial
crops. The expected change in farmers’ outcomes resulting from their improved knowledge is
diversification of crops and increased yields in high value crops. Both sets of interventions should
result in new and improved crop varieties and agricultural methods being adopted leading to
improved welfare of farm households. (Figure 2) The above theory of change only covers
extension trainings and irrigation, and does not cover support to postharvest activities, seed,
equipment, or pesticide distribution conducted by the project.
2.4 LITERATURE REVIEW
Despite growing concerns about the impact of changing climate (and the manifestation of such
change through extreme weather events) on a range of economic outcomes including especially
RJK IE Final Report
agricultural productivity (Burke, 2012) (Schlenker, 2009) (Deschenes, 2007), little is known about
the extent of the damage in developing countries (Taraz, 2013) (Guiteras, 2009). Therefore, and
not surprisingly, we know even less about the channels for adaptation as well as coping
mechanisms that individuals and households use to modulate the deleterious effects of changing
resource environments. In the case of agriculture, one such important coping mechanism is
irrigation, which is known to generate unequal benefits across rich and poor farmers (Duflo &
Pande, 2007), underscoring the socio-economic disparities in capacity for adaptation.
At the same time, much of the global variation in income growth is explained by the fact that most
people in poor societies use means of production that are less efficient than those employed in
higher income societies (Comin, 2004). Given that most of the world’s poor earn their income
from subsistence agriculture, it would seem that one of the best prospects for alleviating poverty
may be to achieve convergence between the methods and inputs used by the poorest farmers
with those used by the most productive farmers (Foster, 2010). Lack of access to irrigation, failure
to use the highest yielding varieties, and lack of fertilizer lead farmers to have far lower incomes
than would otherwise be possible. For example, Evenson and Gollin (Evenson, 2003) show that
adoption of new “Green Revolution” varieties of crops accounted for 40% of the growth in
agricultural production growth in developing countries between 1981 and 2000, meaning that
areas that failed to adopt the modern farming practices missed out on a large share of the income
growth in agriculture in recent years. They argue that a major reason Sub-Saharan Africa failed
to take advantage of Green Revolution varieties was because of a lack irrigation and access to
water, complementary inputs to using these varieties. As such, adoption of new technologies will
become particularly important if climate change creates an additional mismatch between
appropriate technologies for current environments and actual technologies employed.
The recognized importance of modernizing factors of production in agriculture in general, and
specifically irrigation, has led to massive investments in improving agricultural inputs. Across Asia,
public investments in agricultural inputs including extension and input subsidies account for nearly
10% of total government expenditures, more than half the amount spent on education and more
than the amount spent on health programs (Akroyd & Smith, 2007). There is also strong evidence
of the impacts of irrigation on increased household food security (Dillon, 2011), increased in food
production and consumption (Ahmed, Mume, & Kedir, 2014) and positive general equilibrium
effects on non-irrigators (Hossain & Shahabuddin, 2005). Between 1900 and 2000, global public
investment in large-scale irrigation projects such as dams accounted for over $2 Trillion, and
these investments are relied on by 30-40% of the world’s irrigated land (World Commission on
RJK IE Final Report
Dams., 2000). Despite such investments, use of modern inputs and adoption of intensive farming
methods remains low.
The economics literature has made considerable headway in exploring behavioral channels to
explain low adoption of productive technologies. For instance, Duflo et al. (Duflo E. M., 2008)
argue that present bias leads to underinvestment in fertilizers. Alternatively, farmers may be
inattentive to opportunities to learn about new inputs and methods unless exposed to a shock
(Foster, 2010). As a historical example, (Sutch, 2011) argues that when hybrid maize was
introduced in the United States in the 1920’s, initial adoption was low despite heavy promotion,
until intense droughts in the 1930’s prompted switching.
It is possible that standard non-behavioral economic models can explain low adoption if adoption
of technologies is not profitable unless complementary inputs such as irrigation are in place. For
instance, Evenson and Gollin (Evenson, 2003) argue that the reason Sub-Saharan Africa failed
to take advantage of Green Revolution varieties was because of a lack irrigation and access to
water. Therefore, we use quasi-experimental variation in access to irrigation and randomized roll-
out of extension-based agricultural training to study the individual and joint impact of these two
strategies on crop yields.
One important input whose absence may particularly inhibit growth of agricultural production is
irrigation. Duflo and Pande (Duflo & Pande, 2007) show that dams increase agricultural
productivity in India on average, but not without generating winners and losers. If returns to
modern inputs are high and investments in delivering access to modern inputs are large, the
question of why farmers fail to take full advantage of this inputs is a puzzle (Duflo E. M., 2008).
Several explanations for this puzzle have been proposed. First, farmers may require external
shocks to prompt attention to new learning opportunities. Second, adoption of technologies may
not be profitable unless complementary inputs are in place (Evenson, 2003). Finally, farming
methods and technologies may be suited to environments that have changed, rendering farming
strategies outdated.
Each of these explanations suggest that the timing in which inputs are offered to farming is likely
to be important to stimulating uptake of these inputs. If farmers only pay attention to learning
opportunities when prompted by external shocks to their environment, then extension training
sessions that are not timed to coincide with irrigation investments or other environmental changes
might not be effective. If adopting new cropping strategies is not cost effective until
complementary irrigation inputs are in place, training sessions before irrigation works are
completed may be wasted.

RJK IE Final Report
The key hypotheses derived from our theory of change are our primary research questions.
A. Changes in access to water and regularity of water delivery will prompt farmers most
affected by the changes (those farmers with plots in sub-branches that receive irrigation
improvements during the course of the evaluation) to increase their interest in agricultural
extension programs, making them more likely to attend training sessions and adopt new
methods.
B. The highest rates of adoption of new technologies among the trained farmers most
affected by irrigation changes will lead to the biggest impacts on yields, income, and
dietary diversity to appear for households that were both exposed to extension and receive
irrigation improvements. The gains from irrigation combined with extension will be bigger
than the gains from either irrigation or extension alone.
The main evaluation questions are as follows:
1. What is the impact of agricultural extension service provision of crop choice, yields and
household welfare? [Experimental]
2. What is the impact of modernized irrigation infrastructure on crop choice, yields and
household welfare? [Non-experimental]
3. What is the impact of both extension services and modernized irrigation infrastructure on
crop choice, yields and household welfare? [Experimental and Non-Experimental]
3 METHODOLOGY
3.1 EVALUATION DESIGN
The location of the canals has been fixed for a century, thus targeting of the irrigation
improvements could not be altered and is likely to be endogenous to land quality and land
ownership. Because of worries about non-parallel time trends that may differentially affect the 48
different sub-branch command areas, we analyzed the pre-trends in share of household of
households that will ultimately receive irrigation improvements, with those that will not, comparing
census 1 and baseline data for same households. Results are presented in the descriptive
statistics section. We used a difference-in-difference design to assess new changes from the
irrigation improvements. Since we observed cropping patterns both before the irrigation
improvements are completed and after, we can compare households across these three groups:
• Households with plots that were not irrigated by RJK in either survey round
• Households with plots in sub-branches that ended up receiving improved structures

RJK IE Final Report
• Households with plots in sub-branches that ended up not receiving improved structures
In order to assess the role of combined agriculture and irrigation improvements, we randomized
the timing of the agricultural training programs. Out of a sample of 150 farmer’s groups that
requested training, we selected 40 to be trained before the baseline survey (early training) and
40 after the baseline survey (late training). Originally, we expected the feeder canal to be
completed after the baseline survey, however only the off takes on sub-branches were
constructed between 2017 and 2018. The training were also offered to control farmer groups that
were within the RJK command area at the start of Phase 2 of RJK project in 2019, however the
take up was significantly lower due to all of the control groups becoming inactive 5 years after the
initial randomization.
Figure 3 Impact Evaluation Timeline
The extension treatment consisted of 2- or 3-day training sessions to farmers groups within the
command area on topics selected by the farmer groups themselves. Farmers groups are
comprised of approximately 25 farmers from the same community, with multiple members of the
same household often being a member of one group. The extension programs covered the
following topics:
Table 1 Trainings Topics Offered
Training Topic # %
Banana 1 2%
Cauliflower 2 3%
Cucumber 5 8%
Maize 2 3%
Onion 2 3%

RJK IE Final Report
Paddy 12 19%
Potato 1 2%
Sugarcane 1 2%
Vegetable 36 58%
Total 62 100%
20 groups were trained each year, starting in 2015. The project’s agriculture component would
contact the representative of each selected farmer group and that person would inform the
members of the training date and venue.2
Randomization of the timing of training allows us to estimate two econometric specifications of
interest. First, since extension is randomly assigned relative to the timing of surveys, we are able
to estimate the causal effect of the training programs alone on adoption of new technology, yields,
and household expenditures through a simple comparison of treatment and control groups at
baseline. Having random assignment over several years allows us to estimate the effects over
time as farmers learn and improve their application of methods.
To estimate the impact of extension services, we estimated the impact of extension equation
separately in each round. In the baseline, we estimate
Yijt = α + β1Extensionjt + εijt
where Yijt is an outcome (yield, household expenditure) for household, or plot i in farmers’ group
j in period t, Extensionjt is an indicator for whether farmer’s group j has been offered extension
trainings in or prior to period t. The coefficient of particular interest is β1, the effect of extension
services on outcomes. Since extension is randomized, this tells us causal impact of extension
on farmers knowledge and yields in the year following the first trainings conducted before
irrigation improvements were made.
In the endline, we estimate
Yijt = α + β1Early_Extensionjt + εijt
Comparing those households that were in the early extension group tells us the difference in
timing of extension. If farmers improve their learning over time and take advantage of things
2 Feedback from farmers indicates that in some groups the person contacted would invite farmers based on their own preferences, instead of inviting all group members, but our survey instrument does not allow us to separate whether a person was informed but did not attend from cases where a farmer was not informed. Both causes are recorded as farmers not attending the training..

RJK IE Final Report
they learned only after a few seasons have passed or their conditions have changed, we may
see that differences in agricultural production emerge only over time.
For the effect on irrigation, we estimated the following simple difference in difference specification:
Yijt = α + β1Irrigationjt + Gj + Tt + εijt
where Yijt is an outcome (yield, household expenditure) for household, or plot i in farmers’ group
j in period t, Irrigationjt is an indicator for whether sub-branch of plot had off take installed in or
prior to period t, and G and T are group and time fixed effects. The coefficient of particular interest
is β1, the effect of irrigation on outcomes. Our difference-in-differences approach is embedded in
the fixed effects estimation. As with the primary specification, we cluster standard errors at the
farmer group level.
Ultimately, we are interested in whether having access to extension in before irrigation
improvements are made helps farmers take advantage of changes from irrigation or whether
farmers are most likely learn and adopt practices from extension only after they have noticed
significant changes in access to inputs like new access to irrigation.
Combining the difference-in-difference approach with randomized training schedule allows us to
identify complementarities between extension and irrigation using the following form:
Yijt = β1 Late_extensionjt*No_Irrigation_Changejt
+ β2 Late_extensionjt*Irrigation_Changejt
+ β3 Late_extensionjt*No_Irrigation_Changejt * Roundt
+ β4 Late_extensionjt*Irrigation_Changejt * Roundt
+ β5 Early_extensionjt*No_Irrigation_Changejt
+ β6 Early _extensionjt*Irrigation_Changejt
+ β7 Early _extensionjt*No_Irrigation_Changejt * Roundt
+ β8 Early _extensionjt*Irrigation_Changejt * Roundt + εijt
Where Yijt is an outcome (yield, household expenditure) for household, or plot i in farmers’ group
j in period t, Extensionjt is an indicator for whether farmer’s group j has been offered extension
trainings in or prior to period t, Irrigationjt is an indicator for whether the area for which the outcome
is measured has experienced an irrigation improvement by period t, and G and T are group and

RJK IE Final Report
time fixed effects. The coefficient of particular interest is β3, the combined effect of having both
extension programs and irrigation improvements occurring in tandem. Because trainings are
offered to farmers groups, the primary unit of clustering is farmers groups.
3.2 SAMPLING
The sample size was chosen by comparing Minimum Detectable Effects for various survey
design choices according to the formula (Duflo, Glennerster, Kremer; 2007):
𝑀𝐷𝐸 =(𝑡𝛼 2⁄ + 𝑡1−𝜅)
2
√𝑃(1 − 𝑃)𝐽𝜎 √𝜌 +
1 − 𝜌
𝑛
1
𝑐 − 𝑠
Where
o α=.1 is the level of the statistical test
o κ=.8 is the power of the test
o P=.167 is the proportion of households assigned to treatment (described below)
o σ= is the standard deviation of the outcome of interest. Rice yields are estimated
from data collected during an impact evaluation in Bihar India3.
o ρ=.01 is the intracluster correlation of rice yields computed from an impact
evaluation in Bihar for yields and is varied to account for scenarios for take up
calculations.
o J is the number of clusters
o n is the average number of households per clusters
o c is the proportion of households who take up the technology advocated by the
extension
o s is the proportion of households practicing the technology without being offered
extension
The sampling frame for the survey were 150 farmer groups that expressed interest in the
extension training from the project. This made up 2000 households, the remaining 500 were
selected from Village Development Committees and Wards that lied outside of the command area
of RJK to act as the external control group. The 500 households were selected from the census
of the command area conducted by the project at the beginning of phase 1 of RJK project.
3 Variance and intracluster correlation can be estimated from data taken from an impact evaluation in Bihar state in India which has similar agricultural practices and environment

RJK IE Final Report
At baseline we gave the survey team all 40 early and 40 late treatment groups to be surveyed.
The team was instructed to survey all households that were members of the selected farmer
group, households with multiple people enrolled in the same farmer group were only interviewed
once. Then enumerators were provided with the list of all control groups and 500 households
outside of the command area, regardless of farmer group status. It was observed that control
farmer groups were largely inactive, and some could not be reached at baseline. The final sample
is shown in Table 2 below:
Table 2 Sample and Attrition
Baseline Survey Attrition at
endline
Treatment Arm Freq. Percent Freq. Percent
Other 392 16% 38 10%
Early treatment 621 25% 68 11%
Late treatment 571 23% 49 9%
Control inside RJK 422 17% 29 7%
Control outside RJK* 503 20% 73 15%
Total 2,509 100% 257 10%
At endline the survey team was able to reach 90% of baseline respondents, however the control
group outside of the RJK command area experienced higher attrition than other groups. For the
regressions analysis we will combine the late treatment and control inside RJK groups, because
they were both offered the training after the baseline survey took place. The “Other” groups in the
above table are households that lived in same wards as control group households, but were not
included in the original randomization, and thus they will be excluded from the analysis. The
control outside RJK group will be the main counter-factual groups, because they received neither
the irrigation improvement nor extension training from RJK project.
3.3 DATA
The project collected three types of data with supervision, coordination, and planning from the
research team:
1. The main data used for the impact evaluation relies on a panel survey that tracks crop
cultivation and household. This survey instrument consisted of several sections
• An irrigation section to assess water usage, satisfaction with water availability,
fees paid for maintenance and operations to the water users associations (WUA),
and labor-days contributed by the family to canal maintenance
RJK IE Final Report
• An agricultural survey module asking plot- and season-wise inputs and outputs
for the previous year (3 seasons) to assess family labor time spent on agriculture,
net revenue from agriculture, and agricultural methods used
• A module on agricultural knowledge and recall of RJK training attendance
• A consumption module based on common foods and non-food categories to
measure household expenditure and measures of well-being such as dietary
diversity indices
• A social networks module asking about primary sources of information about
agricultural practices, types of information shared with these contacts, and
methods of sharing information to assess spillovers
2. Census of the RJK command area was conducted twice, at the beginning of Phase 1 and
Phase 2. The latter also covered the future Lamki extension area. The first census only
asked about household’s land ownership tabulated by RJK irrigation status and the latter
census also asked about income from production of crops.
3. The final type of data collected were GPS coordinates of houses and plots, however at
endline only 17% of plots had GPS coordinates collected, thus we are unable to present
any geospatial analysis in this report.
The baseline survey took place in December 2016 and was collected using paper questionnaires.
One important implication of the use of paper questionnaires was to that assignment of quizzes
assessing knowledge of farming practices deviated from random assignment. Relative to the
planned random assignment, farmers were much more likely to answer questions about crops
that they actively cultivated, such as paddy and wheat, which may inflate average quiz scores at
baseline relative to a random assignment of quizzes. The endline survey took place in December
2019 and was administered using computer-assisted personal interviewing (CAPI) methods, and
we were able to randomly assign different quiz topics to all households.
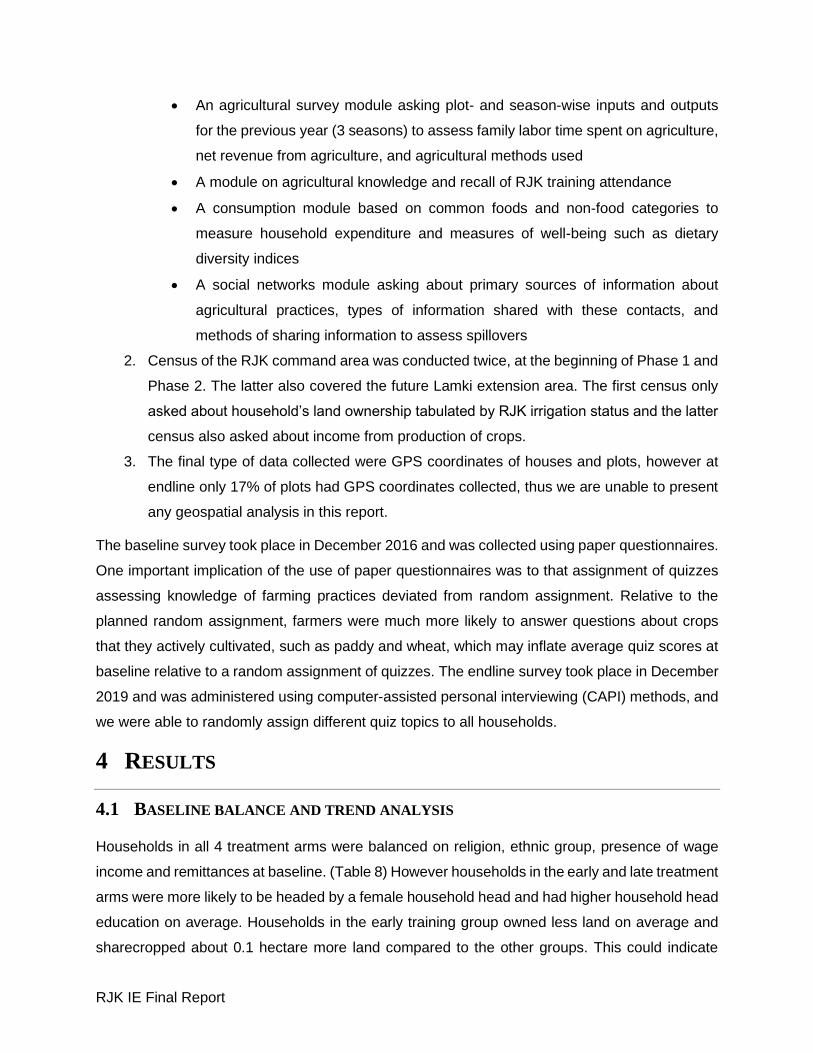
4 RESULTS
4.1 BASELINE BALANCE AND TREND ANALYSIS
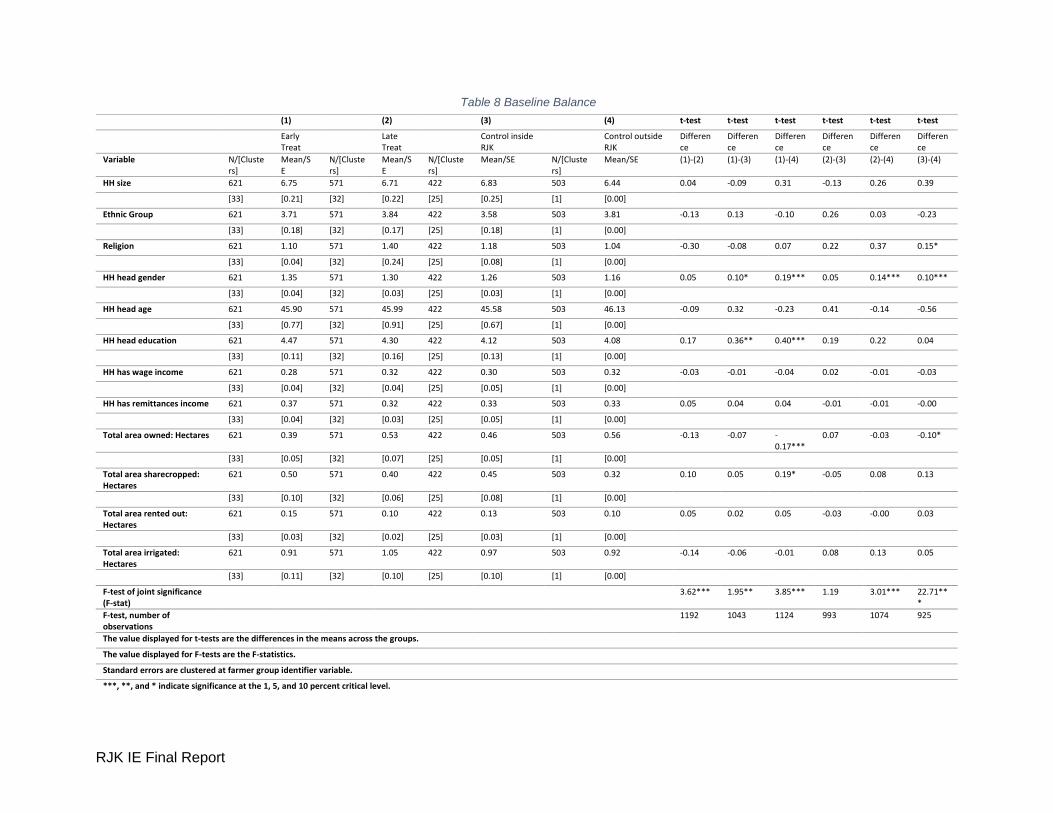
Households in all 4 treatment arms were balanced on religion, ethnic group, presence of wage
income and remittances at baseline. (Table 8) However households in the early and late treatment
arms were more likely to be headed by a female household head and had higher household head
education on average. Households in the early training group owned less land on average and
sharecropped about 0.1 hectare more land compared to the other groups. This could indicate

RJK IE Final Report
early changes to cropping behavior at baseline, since the early training groups was already
trained when the baseline survey took place. However, all groups were balanced on the amount
of land that is rented out and amount of land that is irrigated.
Figure 4 Trends in land ownership and irrigation
Figure 4 above show trends in land ownership and irrigation in sub-branches that were in the
study sample. We divided the sub-branches into those that would ultimately receive off-takes and
those that would not. The data presented above uses Census 1, which was conducted at the start
of Phase 1 of RJK project. We then matched households in Census 1 with those in each survey
round using respondent names, phone numbers, and address. Households with plots in sub-
branch canals that would ultimately receive an off take had on average higher land ownership
and area irrigated by RJK. The parallel trends between census 1 and baseline are sufficient to
meet the parallel trends assumption for difference in difference analysis.4
Table 3 Irrigation structures built
Is the off-take operational in off-
season?
Idle at Endline
Operational at Endline
Total
Off take not built during IE period
10 1* 11
Off take built during IE period
9 23 32
Total 19 24 43
4 This was based on 87 households whose information was present in both survey rounds and census 1. Further data cleaning can increase the number of households in the parallel trends analysis and integration with MODIS satellite data (vegetation index and evapotranspiration) will be used to confirm parallel trends in future academic work.

RJK IE Final Report
* One off-take was pre-existing before Phase 1 and was still operational.
During the endline survey all sub-branch offtakes were visited, accompanied by staff from the
RJK project, to assess operational status in the winter season. There was a total of 43 off-takes
in the command area of RJK and 32 had off-takes constructed during phase 1 of the project. Only
24 offtakes were operational in the winter season, or roughly half of the command area.
Table 4 Flood protection
Offtake type
Gated offtake
Traditional offtake
Total
Off take not built
3 8 11
Off take built 30 2 32
Total 33 10 43
Table 4 above shows that out of 32 sub-branches were irrigation structures were constructed, 2
were still using traditional offtakes due to land disputes. Overall, 33 out of 43 visited sub-branches
had a gated offtake structure, mostly from phase 1 of the project, but 3 were pre-existing before
the project. These 33 gates provide protection from flooding during the monsoon season, when
the level of water in the sub-branch canals is high.
Table 5 WUA membership and satisfaction
Survey Round
WUA committee membership
WUA satisfaction
N Obs
Baseline 10% 65% 1468
Endline 18% 78% 1468
Membership in Water User Associations (WUA) increased by 8% from baseline to endline, and
the self-reported satisfaction with WUA activities also increased to 78% at endline. This impact
evaluation was not designed to gauge the impact of increased WUA participation on farm level
production outcomes. Additionally, the membership to WUA committees is most likely
endogenous to land size and higher status in the community, thus any association between
membership and household long term outcomes can’t be causal.

RJK IE Final Report
4.2 LEARNING FROM AGRICULTURAL EXTENSION
Figure 5 Kernel density plots: AG knowledge
To measure the gain in agricultural knowledge which resulted from the impact of randomly
assigned extension trainings, the evaluation team created 15 different quizzes based on the RJK
training curriculum. Z-scores were created for each quiz and the kernel density plots are
presented above in Figure 5. Visually we observe that the farmers trained before the baseline
survey exhibit higher scores than the rest of the sample. Difference in differences analysis in
Table 9 shows that at baseline the early trained groups had a 0.34 higher z-scores compared to
other households. This result suggested that the first round of agricultural trainings led to
statistically significant5 increases in farmers learning. In the endline, we find that the late trained
group, who were offered training 1-3 years before the endline survey, did not have significantly
higher scores than the group who were trained before the baseline years earlier suggesting that
repeated training doesn’t have additional gains.
To test if the temporary6 gains in agricultural knowledge translate to improved farming practices
we estimated farm level technical efficiency, where the outcome variable was the value of all
crops produced, as a function of seeds, manure, fertilizer, micronutrients, cultivated area, hired
and farm labor. We find that irrigation improvements increase predicted farm level technical
efficiency of inputs (Table 12), while standalone training does not impact predicted farm level
technical efficiency. The group trained after the baseline survey and received irrigation
5 Statistically significant refers to a coefficient with a p-value of less than 0.1, or that there is at maximum 10% chance that the coefficient was created by a random process. Or the probability that the estimated coefficient is null is below 10%. 6 The project commented that the nature of farmer group trainings, which lasted 1-3 days, explain the temporary impact on farmer’s agricultural knowledge.
RJK IE Final Report
improvements also saw a 2% increase in farm level technical efficiency, suggesting those farmers
are now better utilizing their inputs.
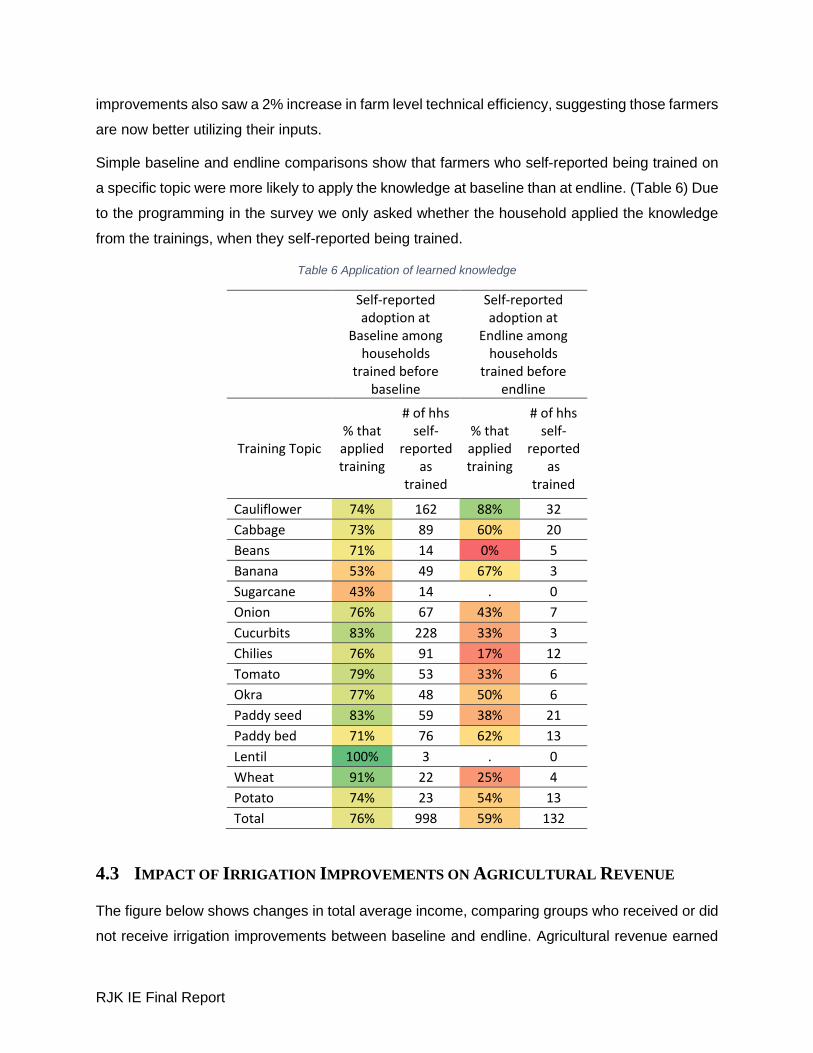
Simple baseline and endline comparisons show that farmers who self-reported being trained on
a specific topic were more likely to apply the knowledge at baseline than at endline. (Table 6) Due
to the programming in the survey we only asked whether the household applied the knowledge
from the trainings, when they self-reported being trained.
Table 6 Application of learned knowledge
Self-reported adoption at
Baseline among households
trained before baseline
Self-reported adoption at
Endline among households
trained before endline
Training Topic % that applied training
# of hhs self-
reported as
trained
% that applied training
# of hhs self-
reported as
trained
Cauliflower 74% 162 88% 32
Cabbage 73% 89 60% 20
Beans 71% 14 0% 5
Banana 53% 49 67% 3
Sugarcane 43% 14 . 0
Onion 76% 67 43% 7
Cucurbits 83% 228 33% 3
Chilies 76% 91 17% 12
Tomato 79% 53 33% 6
Okra 77% 48 50% 6
Paddy seed 83% 59 38% 21
Paddy bed 71% 76 62% 13
Lentil 100% 3 . 0
Wheat 91% 22 25% 4
Potato 74% 23 54% 13
Total 76% 998 59% 132
4.3 IMPACT OF IRRIGATION IMPROVEMENTS ON AGRICULTURAL REVENUE
The figure below shows changes in total average income, comparing groups who received or did
not receive irrigation improvements between baseline and endline. Agricultural revenue earned

RJK IE Final Report
by households who cultivate plots on sub-branch canals that experienced irrigation improvements
increased by 6,030 rupees (9% of baseline income) per year more than revenue earned by
households whose plots are located on sub-branches that did not have irrigation improvements,
but this difference is not statistically significant7.
The figure above also shows that irrigation improvements were conducted in sub-branches that
already had higher baseline incomes. This suggests that irrigation improvements are reinforcing
pre-existing disparities in access to irrigation in the command area of RJK.
4.4 DOES THE IMPACT OF IRRIGATION DEPEND ON THE TIMING OF EXTENSION
TRAINING?
The goal of the impact evaluation is to test whether farmers are more likely to change their
practices and experience yield gains if extension occurs before or after irrigation improvements
have been made. The graph below shows the results of the difference-in-difference estimate fully
interacted with the timing of training. The bars on the left show the change in agricultural revenue
from baseline to endline, comparing households who cultivate on sub-branches where irrigation
7 In this case, not statistically significant means that the 6030 NPR increase in income is not different from 0, or that the study’s sample is too low to detect a change less than 6030 NPR (50$ USD).
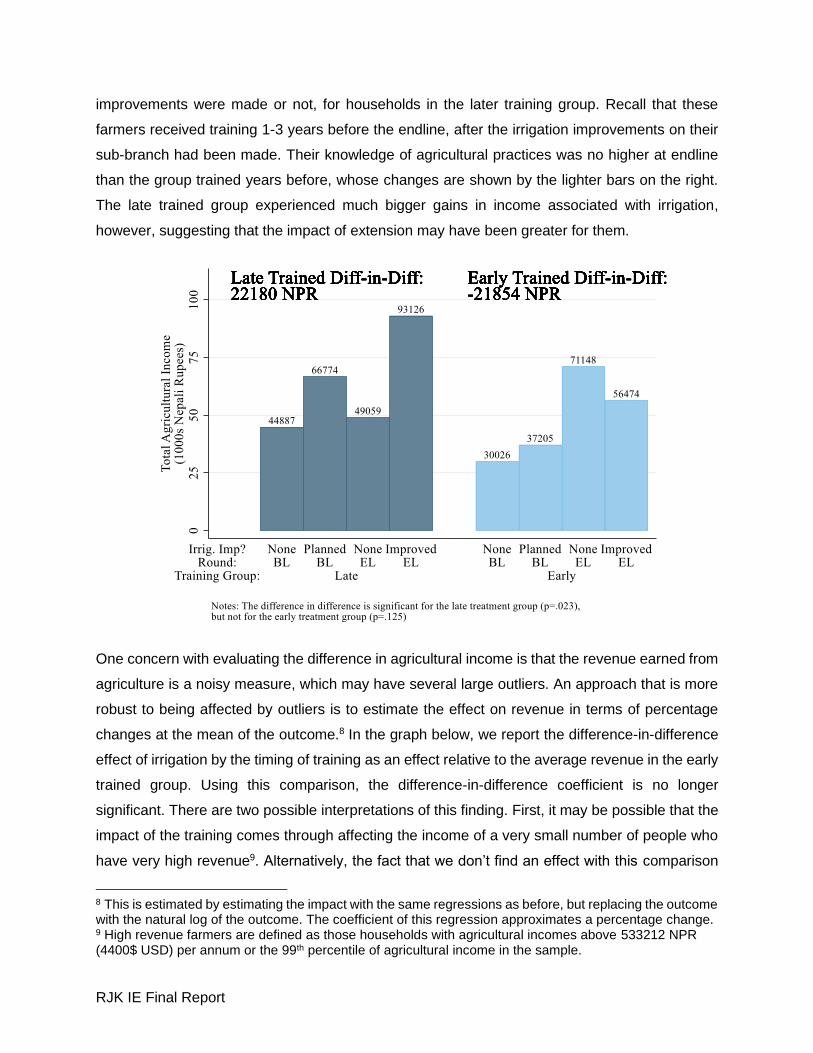
RJK IE Final Report
improvements were made or not, for households in the later training group. Recall that these
farmers received training 1-3 years before the endline, after the irrigation improvements on their
sub-branch had been made. Their knowledge of agricultural practices was no higher at endline
than the group trained years before, whose changes are shown by the lighter bars on the right.
The late trained group experienced much bigger gains in income associated with irrigation,
however, suggesting that the impact of extension may have been greater for them.
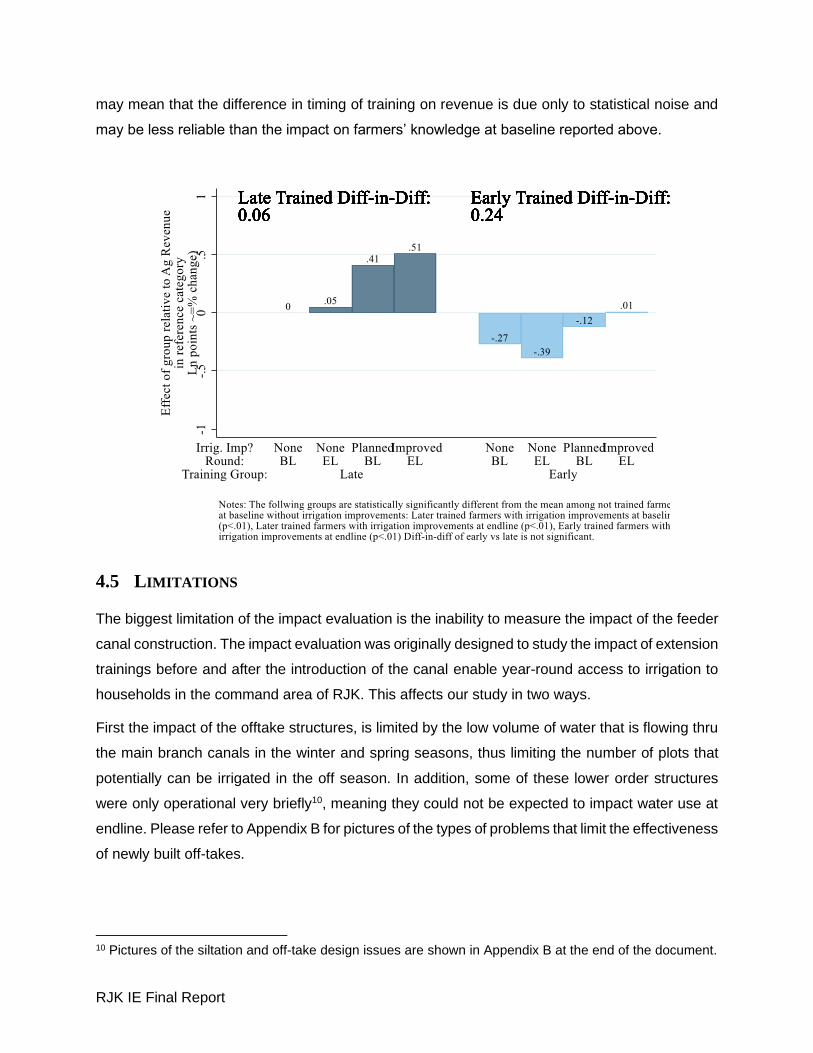
One concern with evaluating the difference in agricultural income is that the revenue earned from
agriculture is a noisy measure, which may have several large outliers. An approach that is more
robust to being affected by outliers is to estimate the effect on revenue in terms of percentage
changes at the mean of the outcome.8 In the graph below, we report the difference-in-difference
effect of irrigation by the timing of training as an effect relative to the average revenue in the early
trained group. Using this comparison, the difference-in-difference coefficient is no longer
significant. There are two possible interpretations of this finding. First, it may be possible that the
impact of the training comes through affecting the income of a very small number of people who
have very high revenue9. Alternatively, the fact that we don’t find an effect with this comparison
8 This is estimated by estimating the impact with the same regressions as before, but replacing the outcome with the natural log of the outcome. The coefficient of this regression approximates a percentage change. 9 High revenue farmers are defined as those households with agricultural incomes above 533212 NPR (4400$ USD) per annum or the 99th percentile of agricultural income in the sample.
RJK IE Final Report
may mean that the difference in timing of training on revenue is due only to statistical noise and
may be less reliable than the impact on farmers’ knowledge at baseline reported above.
4.5 LIMITATIONS
The biggest limitation of the impact evaluation is the inability to measure the impact of the feeder
canal construction. The impact evaluation was originally designed to study the impact of extension
trainings before and after the introduction of the canal enable year-round access to irrigation to
households in the command area of RJK. This affects our study in two ways.
First the impact of the offtake structures, is limited by the low volume of water that is flowing thru
the main branch canals in the winter and spring seasons, thus limiting the number of plots that
potentially can be irrigated in the off season. In addition, some of these lower order structures
were only operational very briefly10, meaning they could not be expected to impact water use at
endline. Please refer to Appendix B for pictures of the types of problems that limit the effectiveness
of newly built off-takes.
10 Pictures of the siltation and off-take design issues are shown in Appendix B at the end of the document.

RJK IE Final Report
Table 7 Issues with newly built irrigation structures
Is the off-take operational in off-season?
Idle Operational Total
Not silted 5* 23 28
Silted 4 0 4
Total 9 23 32
* These 5 off takes had entry gates that were too high for the low water level in branch canals.
Table 7 above shows that 9 out of 32 newly built off-takes had either silting or design issue that
prevents off-season irrigation. With 4 offtakes encountering a siltation problem and 5 offtakes
having a gate that was too high for the low water level in the winter. This resulted in only half of
the command area having access to irrigation in the winter season.
In contrast, the feeder canal was expected to have a much bigger influence on water regularity
and accessibility. As a result of only being able to study changes in lower order irrigation
structures, the expected effect of interaction term coefficient of extension training and irrigation
improvements is lower, because not enough plots were affected by both improvements.
Secondly the farmers were possibly reluctant to take up the extension trainings offered by the
project if they expected most of the benefits of such training to only occur if irrigation access
improved significantly. The repeated delays and extended timelines in feeder canal construction
could also drive household to leave farming and focus on remittances as their most important
source of income, this could potentially explain the significant number of households that were
cultivating crops at baseline but sharecropped out their land at endline.
This evaluation narrowly focuses on the interaction of extension training and irrigation support,
we are not evaluating the other activities of the project, such as improving access to improved
seed varieties, pesticides, crop insurance and support to marketing and postharvest facilities. We
were unable to conduct detailed productivity of crops adjusted for area, due to the lack of plot
GPS tracing coordinates.
5 DISCUSSION AND CONCLUSION
5.1 POLICY RECOMMENDATIONS
The positive impact of extension trainings on farmer’s agricultural knowledge lasts a short time,
especially if major irrigation improvements do not materialize. We therefore recommend that the

RJK IE Final Report
project re-train the farmers again after the feeder canal is constructed and access to year-round
irrigation is fully realized. Repeated trainings are likely necessary to help farmers realize gains to
irrigation.
The lower gains in knowledge and practices in later trainings relative to earlier trainings suggests
that communication with farmers about delays is important. Initial interest in new practices when
construction begins may fade if dramatic changes in water access or availability take longer to
materialize than expected. We can speculate that attendance and learning from trainings might
re-appear once the canal begins to operate and farmers can observe changes in water availability
for which they might want to take advantage, but without additional trainings after the feeder canal
is completed, the evaluation cannot confirm this hypothesis.
5.2 CONCLUSION
In summary, we find that standalone extension trainings have a temporary impact on farmer’s
knowledge and fails to increase adoption of new cropping methods. Although the groups of
farmers that were offered extension trainings after irrigation improvements were constructed
showed higher agricultural incomes at endline, the coefficient is too small for our sample to detect.
These findings reinforce the importance of providing irrigation improvements in a timely fashion,
otherwise we risk farmers losing interest in the trainings and fail to adopt the new technologies
demonstrated in the extension trainings.

RJK IE Final Report
6 APPENDIX A – MAP OF COMMAND AREA
Figure 6 Location of Sub-branches
Source: RJK Phase 2 Feasibility Study 2017

RJK IE Final Report
7 APPENDIX B – IRRIGATION STRUCTURES
Figure 7 Example of siltation problem
This picture shows two sub-branch canals that share
the same off take. The offtake is capable of
siphoning water in the winter and spring, but the sub-
branch on the right has a design issue that caused a
siltation problem. The sub-branch on the left is able
to access irrigation year-round, while the sub-branch
on the right is only able to access water in the
summer. The siltation issue can be caused by
insufficient slope in the sub-branch command area
or lack of cement lining in the sub-branch canal.
Figure 8 Off take not providing water in off-season
This is an example of an off take that has an opening
that is too high to allow for water to enter in the off
season.

RJK IE Final Report
8 APPENDIX C – EXTENSION SUPPORT
Figure 9 Farmer group training
Figure 10 High value crop production supported by the project

RJK IE Final Report
9 APPENDIX D – TABLES
RJK IE Final Report
Table 8 Baseline Balance
(1)
(2)
(3)
(4) t-test t-test t-test t-test t-test t-test
Early Treat
Late Treat
Control inside RJK
Control outside RJK
Difference
Difference
Difference
Difference
Difference
Difference
Variable N/[Clusters]
Mean/SE
N/[Clusters]
Mean/SE
N/[Clusters]
Mean/SE N/[Clusters]
Mean/SE (1)-(2) (1)-(3) (1)-(4) (2)-(3) (2)-(4) (3)-(4)
HH size 621 6.75 571 6.71 422 6.83 503 6.44 0.04 -0.09 0.31 -0.13 0.26 0.39
[33] [0.21] [32] [0.22] [25] [0.25] [1] [0.00]
Ethnic Group 621 3.71 571 3.84 422 3.58 503 3.81 -0.13 0.13 -0.10 0.26 0.03 -0.23
[33] [0.18] [32] [0.17] [25] [0.18] [1] [0.00]
Religion 621 1.10 571 1.40 422 1.18 503 1.04 -0.30 -0.08 0.07 0.22 0.37 0.15*
[33] [0.04] [32] [0.24] [25] [0.08] [1] [0.00]
HH head gender 621 1.35 571 1.30 422 1.26 503 1.16 0.05 0.10* 0.19*** 0.05 0.14*** 0.10***
[33] [0.04] [32] [0.03] [25] [0.03] [1] [0.00]
HH head age 621 45.90 571 45.99 422 45.58 503 46.13 -0.09 0.32 -0.23 0.41 -0.14 -0.56
[33] [0.77] [32] [0.91] [25] [0.67] [1] [0.00]
HH head education 621 4.47 571 4.30 422 4.12 503 4.08 0.17 0.36** 0.40*** 0.19 0.22 0.04
[33] [0.11] [32] [0.16] [25] [0.13] [1] [0.00]
HH has wage income 621 0.28 571 0.32 422 0.30 503 0.32 -0.03 -0.01 -0.04 0.02 -0.01 -0.03
[33] [0.04] [32] [0.04] [25] [0.05] [1] [0.00]
HH has remittances income 621 0.37 571 0.32 422 0.33 503 0.33 0.05 0.04 0.04 -0.01 -0.01 -0.00
[33] [0.04] [32] [0.03] [25] [0.05] [1] [0.00]
Total area owned: Hectares 621 0.39 571 0.53 422 0.46 503 0.56 -0.13 -0.07 -0.17***
0.07 -0.03 -0.10*
[33] [0.05] [32] [0.07] [25] [0.05] [1] [0.00]
Total area sharecropped: Hectares
621 0.50 571 0.40 422 0.45 503 0.32 0.10 0.05 0.19* -0.05 0.08 0.13
[33] [0.10] [32] [0.06] [25] [0.08] [1] [0.00]
Total area rented out: Hectares
621 0.15 571 0.10 422 0.13 503 0.10 0.05 0.02 0.05 -0.03 -0.00 0.03
[33] [0.03] [32] [0.02] [25] [0.03] [1] [0.00]
Total area irrigated: Hectares
621 0.91 571 1.05 422 0.97 503 0.92 -0.14 -0.06 -0.01 0.08 0.13 0.05
[33] [0.11] [32] [0.10] [25] [0.10] [1] [0.00]
F-test of joint significance (F-stat)
3.62*** 1.95** 3.85*** 1.19 3.01*** 22.71**
*
F-test, number of observations
1192 1043 1124 993 1074 925
The value displayed for t-tests are the differences in the means across the groups.
The value displayed for F-tests are the F-statistics.
Standard errors are clustered at farmer group identifier variable.
***, **, and * indicate significance at the 1, 5, and 10 percent critical level.

RJK IE Final Report
Table 9 Impact on Agricultural knowledge

RJK IE Final Report
Table 10 Impact of irrigation improvements on total AG income
RJK IE Final Report
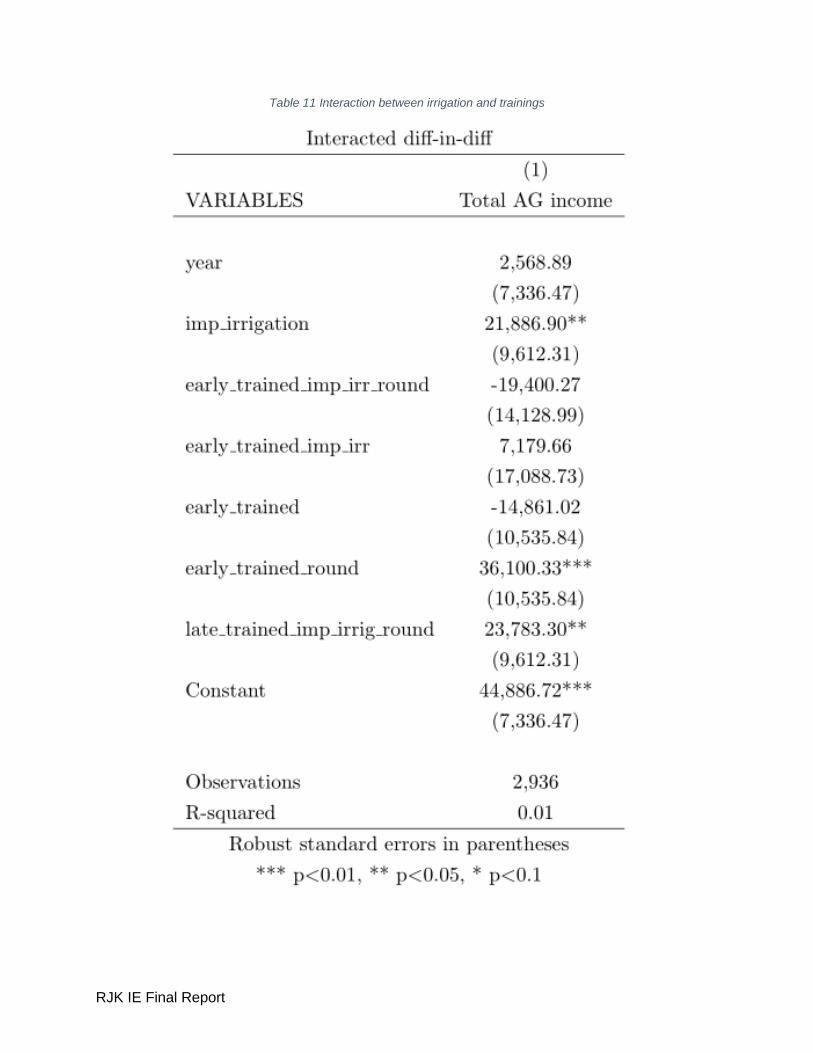
Table 11 Interaction between irrigation and trainings

RJK IE Final Report
Table 12 Interacted diff in diff - all outcomes

RJK IE Final Report
10 REFERENCES
Ahmed, B., Mume, J., & Kedir, A. (2014). Impact of Small-scale Irrigation on Farm Income
Generation and Food Security Status: The Case of lowland Areas, Oromia, Ethiopia. .
International Journal of Economics and Empirical Research, 2(10): 412-419.
Akroyd, S., & Smith, L. (2007). Review of public spending to agriculture . World Bank Group.
Burke, M. &. (2012). Adaptation to climate change: Evidence from US agriculture. Available at
SSRN 2144928.
Cochrane, W. W. (1958). Farm prices: myth and reality. U of Minnesota Press.
Comin, D. a. (2004). An Exploration of Technology Diffusion. American Economic Review,
100(5): 2031–59.
Deschenes, O. &. (2007). The economic impacts of climate change: evidence from agricultural
output and random fluctuations in weather. The American Economic Review, 354-385.
Dillon, A. (2011). Do differences in the scale of irrigation projects generate different impacts on
poverty and production? . Journal of Agricultural Economics, 62(2), 474-492.
Duflo, E. M. (2008). How High Are Rates of Return to Fertilizer? Evidence from Field
Experiments in Kenya. American Economic Review, 98(2), 482-88.
Duflo, E., & Pande, R. (2007). Dams. Quarterly Journal of Economics, 122(2), 601-646.
Evenson, R. a. (2003). Assessing the Impact of the Green Revolution, 1960 to 2000. Science,
300(5620): 758.
Foster, A. a. (2010). The Microeconomics of Technology Adoption. Annual Review of
Economics, 2(10).
Guiteras, R. (2009). The impact of climate change on Indian agriculture. College Park,
Maryland: Department of Economics, University of Maryland.
Hossain, M. N., & Shahabuddin, Q. (2005). Food security and nutrition in Bangladesh: Progress
and determinants. Electronic Journal of Agricultural and Development Economics,
2(2):103-132.
Schlenker, W. &. (2009). Nonlinear temperature effects indicate severe damages to US crop
yields under climate change. Proceedings of the National Academy of sciences, 106(37),
15594-15598.
Suri, T. (2011). Selection and comparative advantage in technology adoption. Econometrica,
79(1), 159-209.
Sutch, R. (2011). The Impact of the 1936 Corn Belt Drought on American Farmers’ Adoption of
Hybrid Corn. in The Economics of Climate Change: Adaptations Past and Present.
National Bureau of Economic Research.
Taraz, V. (2013). Adaptation to Climate Change: Historical Evidence from the Indian Monsoon.
Smith College Working Paper.

RJK IE Final Report
UNDP. (2014). Nepal Human Development Report. United Nations Development Programme.
United Nations Development Programme . (2014). Nepal Human Development Report . UNDP.
World Bank. (2011). RJK Project Appraisal Document. World Bank.
World Commission on Dams. (2000). Dams and Development: A New Framework for Decision-
making: the Report of the World Commission on Dams. Earthscan.
RJK IE Final Report
Technical Appendix: Quizzes used to assess extension knowledge
This appendix includes the text of all the quizzes on 15 possible topics administered to farmers
to assess their knowledge of topics covered by the training sessions. Farmers were assigned to
complete 3 of these quizzes so that we can measure knowledge of both quizzes taken and not
taken.

RJK IE Final Report
SECTION F1 - CAULIFLOWER CULTIVATION
10 11 12 13 14
Did you receive a
training on cauliflower
cultivation?
Did you apply or
practice the learnt
knowledge and
practices from the
training?
If yes what practices did
you apply in the field?
If no, could you please state
reasons for not using the
knowledge?
How can you prevent your cauliflower from
Molybdenum deficiency (with symptoms of
crumpled and overcrowded white and yellow
leaves)?
1 - Yes
2 - No (Skip to 18)
1 - Yes
2 - No ( Skip to 13)
a)_______________
b)_______________
c)_______________
a)_______________
b)_______________
c)_______________
1 - Use Bororn while preparing soil for
plantation
2 - Spray Bororn mixed in water
3 - Use 45 gram of Sodium Ammonium
Molybdenum mixed with chemical
fertilizer per Ropani of land
4 - Don’t know
15 16 17 18 19 20
How can you prevent your cauliflower from not
growing to its full potential?
Name any two
cauliflower
diseases:
Name two
insects that can
affect
cauliflowers
negatively:
How does
cabbage
butterfly
damage
cauliflower
plants?
Which planting
season can
potentially produce
maximum profits
from cauliflower
cultivation?
Name three types of
cauliflower that are
regular season (any
three would suffice):
1 - Transplanting seedlings to fertile soil on time
2 - Use Nitrogen rich fertilizer on time
3 - Maintain appropriate soil moisture
4 - All of the above
5 - Don’t know
1 - Club root (gada
jasto jara hune)
2 - Damping off
(Biruwa marne
rog)
3 - Powdery
mildew
(Kapasedhusi)
4 - Don’t know
1 - Cabbage
butterfly
2 - Tobacco
butterfly
3 - Brick pattern
larvae
4 - Aphid (lahi)
5 - Don't know
1 - Damage the
stem
2 - Damage the
leaves
3 – Damage the
crown
4 - Don’t know
1 - On season
2 - Off season
3 - Both (1) and (2)
4 - Don’t know
1 - Snow Crown
2 - Snow King
3 - Kathmandu local
4 - Jyapu local
5 - Don't know

RJK IE Final Report
SECTION F2 - CABBAGE CULTIVATION
21 22 23 24 25
Did you receive a
training on cabbage
cultivation?
Did you apply or practice the
learnt knowledge and
practices from the training?
If yes what practices
did you apply in the
field?
If no, could you please
state reasons for not using
the knowledge?
What is the optimal amount
of seed for cultivation per
kattha?
1 - Yes
2 - No (Skip to 28)
1 - Yes
2 - No ( Skip to 24)
a)_______________
b)_______________
c)_______________
a)_______________
b)_______________
c)_______________
1 - 5 gram
2 - 10 gram
3 - 15 gram
4 - None of the above
5 - Don’t know
26 27 28 29 30
How can we protect
seedlings from extreme
temperature/rain?
The best season with
suitable environment for
cabbage is:
Name three varieties of
cabbage
Name two common
diseases of cabbage
Name two most comoin
insects that affect cabbage
plants
1 - Cover seedlings
with stray or grass
2 - No need to protect
the seedlings
3 - Don’t know
1 - Summer
2 - Winter
3 - Spring
4 - Don't know
1 - Greenstone
2 - Green coronate
3 - Zenisth
4 - Super Green
5 - All green
6 - Don't know
1 - Club root
2- Kapase dhusi
3 - Alterneria thople
4 - Don't know
1 - Cabbage butterfly
2 - Tobacco butterfly
3 - Brick pattern larvae
4 - Aphid (lahi)
5 - Don't know

RJK IE Final Report
SECTION F3 - BEAN SEEDS PRODUCTION METHOD
31 32 33 34 35
Did you receive a training on
Bean Seeds Production?
Did you apply or practice the
learnt knowledge and
practices from the training?
If yes what practices did
you apply in the field?
If no, could you please state
reasons for not using the
knowledge?
Name three major early steps
to keep in mind for bean seeds
production
1 - Yes
2 - No (Skip to 38)
1 - Yes
2 - No ( Skip to 34) a)_______________
b)_______________
c)_______________
a)_______________
b)_______________
c)_______________
1 - Selection of appropriate
soil
2 - maintaining proper distance
between plants
3 - Land Preparation
4 - Bean planting methods
5 - Fertilizer selection and use
6 - Don't know
36 37 38 39 40
Where should one buy the
bean seeds from?
Name two organic or
inorganic fertilizers that can
be used for healthy high
quality plant and seeds (any
of two works):
When is the best time to
harvest the peas?
To store the bean seeds
properly, farmers should dry
the seeds properly
Bean seeds can be stored
immediately after drying.

RJK IE Final Report
1 – Agrovet
2 - Seed company
3 - Agriculture research
station
4 - Agriculture cooperative
5 - Seed producing farm
6 - All of the above
7 - Don't know
1 - Compost
2 - Nitrogen
3 - Potash
4 - Don't know
1 - When the bean pods
turn yellow
2 - When pea pods are
still green
3 - Pea pods are dry and
brown
4 - None of the above
5 - Don’t know
0 - False
1 - True
2 - Don't know
0 - False
1 - True
2 - Don't know
SECTION F4 - BANANA CULTIVATION
41 42 43 44 45
Did you receive a training
on Banana Cultivation?
Did you apply or practice
the learnt knowledge and
practices from the
training?
If yes what practices
did you apply in the
field?
If no, could you please
state reasons for not
using the knowledge?
Banana cultivation should be
rotated every 3-4 years for
protection from insects and
diseases related to banana
plants
1 - Yes
2 - No (Skip to 48)
1 - Yes
2 - No ( Skip to 44)
a)_______________
b)_______________
a)_______________
b)_______________
0 - False
1 - True
2 - Don't know
RJK IE Final Report
c)_______________
c)_______________
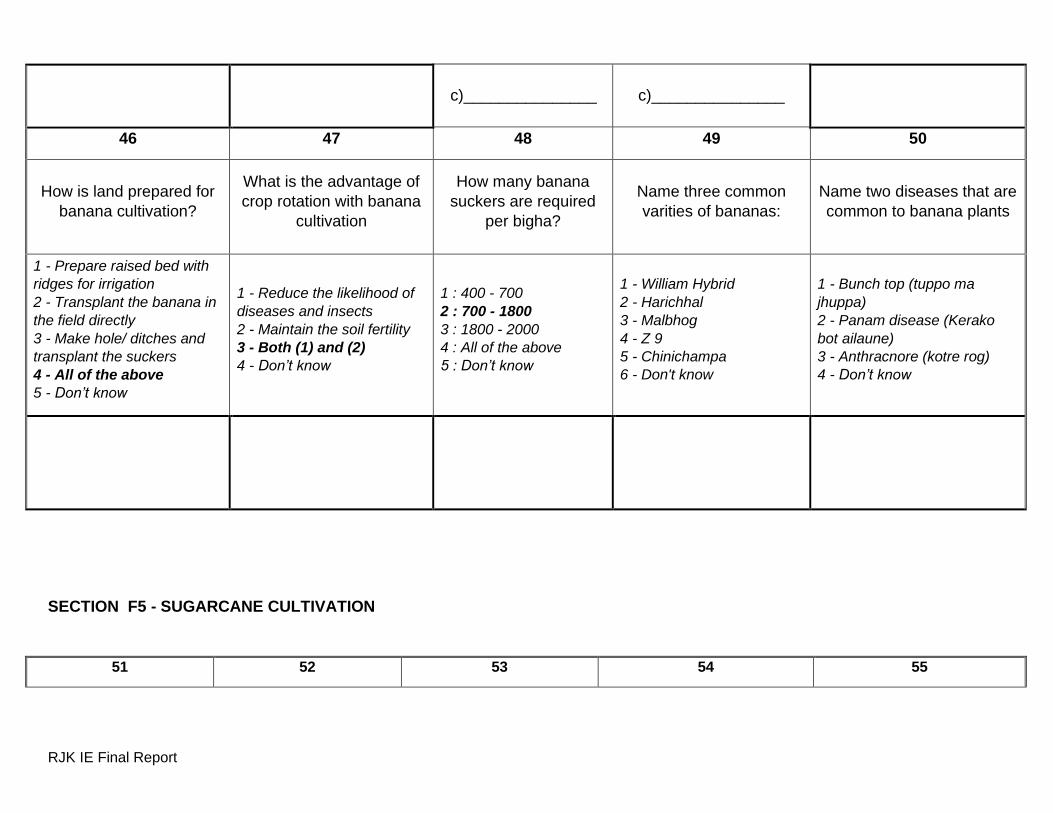
46 47 48 49 50
How is land prepared for
banana cultivation?
What is the advantage of
crop rotation with banana
cultivation
How many banana
suckers are required
per bigha?
Name three common
varities of bananas:
Name two diseases that are
common to banana plants
1 - Prepare raised bed with
ridges for irrigation
2 - Transplant the banana in
the field directly
3 - Make hole/ ditches and
transplant the suckers
4 - All of the above
5 - Don’t know
1 - Reduce the likelihood of
diseases and insects
2 - Maintain the soil fertility
3 - Both (1) and (2)
4 - Don’t know
1 : 400 - 700
2 : 700 - 1800
3 : 1800 - 2000
4 : All of the above
5 : Don’t know
1 - William Hybrid
2 - Harichhal
3 - Malbhog
4 - Z 9
5 - Chinichampa
6 - Don't know
1 - Bunch top (tuppo ma
jhuppa)
2 - Panam disease (Kerako
bot ailaune)
3 - Anthracnore (kotre rog)
4 - Don’t know
SECTION F5 - SUGARCANE CULTIVATION
51 52 53 54 55

RJK IE Final Report
Did you receive a training
on Sugarcane Cultivation?
Did you apply or practice
the learnt knowledge and
practices from the
training?
If yes what practices did you
apply in the field?
If no, could you please state
reasons for not using the
knowledge?
One kattha of land requires 60
- 80 kilos of sugarcane seeds.
1 - Yes
2 - No (Skip to 58)
1 - Yes
2 - No ( Skip to 54) a)_______________
b)_______________
c)_______________
a)_______________
b)_______________
c)_______________
0 - False
1 - True
2 - Don't know
56 57 58 59 60
Name three varieties of
sugarcane
Depending on the
conditions of pests and
diseases, sugarcane can
be kept for
What is the most
appropriate type of soil for
sugarcane?
It is necessary to tie sugarcane
from two rows once it reaches
1 to 1.5 meters to:
What is the best climate for
sugarcane cultivation?
1 - Jeetpur 1
2 - Jeetpur 2
3 - B. O. -17, 32, 34, 42,
47, 50
4 - Don't know
1 - One/twpo times
2 - Two/three times
3 - Three/four times
4 - All of the above
5 - Don’t know
1 - Alluvial
2 - Sandy loam
3 - Sandy
4 - Don’t know
1 - Prevent it from
overcrowding
2 - Prevent it from falling
3 - For aesthetics
4 - None of the above
5 - Don’t know
1 - Winter
2 - Spring
3 - Summer and humid
4 - Don’t know

RJK IE Final Report
SECTION F6 - ONION CULTIVATION
61 62 63 64 65
Did you receive a
training on Onion
Cultivation?
Did you apply or practice
the learnt knowledge
and practices from the
training?
If yes what practices did
you apply in the field?
If no, could you please state
reasons for not using the
knowledge?
What are the difficulties in
onion cultivation?
1 - Yes
2 - No (Skip to 68)
1 - Yes
2 - No ( Skip to 64) a)_______________
b)_______________
c)_______________
a)_______________
b)_______________
c)_______________
a)_______________
b)_______________
c)_______________
66 67 68 69 70
Demand for onion is all
around the year and its
increasing
State two ways in which
onions can go bad
What are the fertilizers
one can use while land
preparation for onion
cultivation?
Onion bulbs are perfectly dry
when
After spreading the seed,
one should cover it with
straw/thatch

RJK IE Final Report
0 - False
1 - True
2 - Don't know
1 - Germination
2 - Rot
3 - Withering/drying
4 - Don’t know
1 - Compost
2 - DAP
3 - Urea
4 - All of the above
5 - Don’t know
1 - The shells are dry
2 - The bulb is closed
3 - Bulbs look dry
4 - Both (1) and (2)
5 - Don’t know
0 - False
1 - True
2 - Don't know
SECTION F7 - CUCURBITS OFFSEASON CULTIVATION
71 72 73 74 75
Did you receive a training on
Cucurbits offseason
cultivation?
Did you apply or practice
the learnt knowledge and
practices from the training?
If yes what practices did you
apply in the field?
If no, could you please state
reasons for not using the
knowledge?
What are the major nutritions
obtained from cucumber,
bittergourd, pumpkin, squash
and gourd?
1 - Yes
2 - No (Skip to 78)
1 - Yes
2 - No ( Skip to 74) a)_______________
b)_______________
c)_______________
a)_______________
b)_______________
c)_______________
1 - Vitamin A
2 - Iron
3 - Both (1) and (2)
4 - None of the above
5 - Don’t know
76 77 78 79 80
How many grams of seed do
you need for per katha for
cucumber, squash, pumpkin
and bottle gourd?
While sowing, one must use
two seeds per hole
Which season is the best for
cucurbits production in terms
of environment?
What kind of soil is
appropriate for cucurbits
production?
What kind of seed sowing do
you prefer?

RJK IE Final Report
1 - 100 grams
2 - 75 grams
3 - 50 grams
4 - Don’t know
0 - False
1 - True
2 - Don't know
1 - Winter
2 - Summer
3 - Rainy
4 - Don’t know
1 - Alluvial soil
2 - Sandy soil
3 - Balaute domat or
Pango domat
4 - None of the above
5 - Don’t know
1 - Direct seed sowing
2 - Nursery raise transplant
3 - Don't know
SECTION F8 - CHILIES CULTIVATION
81 82 83 84 85
Did you receive a training on
Chilies cultivation?
Did you apply or practice the
learnt knowledge and
practices from the training?
If yes what practices
did you apply in the
field?
If no, could you please state
reasons for not using the
knowledge?
How can one prevent/cure
chilies plants from Mozac
virus?

RJK IE Final Report
1 - Yes
2 - No (Skip to 88)
1 - Yes
2 - No ( Skip to 84) a)_______________
b)_______________
c)_______________
a)_______________
b)_______________
c)_______________
1 - Use healthy seeds
2 - Pluck out affected parts
from the plants
3 - Wash hands after touching
affected parts
4 - All of the above
5 - Don’t know
86 87 88 89 90
Name two diseases that can
affect chilies:
Once the seedlings are ready
to be transformed, the soil
attached to the seedlings
should be properly removed
before transferring.
How many grams of
chilies are required per
kattha of land?
Name three fertilizers that
can be used for production
Chilies can be best grown in
rainy season
1 - Anthracnode (kotre)
2 - Mozac Virus
3 - Wilt
4 - Don't know
0 - False
1 - True
2 - Don't know
1 - 20 to 30 grams
2 - 30 to 50 grams
3 - 50 to 100 grams
4 - Don’t know
1 - Compost
2 - Urea
3 - DAP
4 - Murate of Potash
5 - Chilated zinc
6 - Don't know
0 - False
1 - True
2 - Don't know
SECTION F9 - TOMATO CULTIVATION

RJK IE Final Report
91 92 93 94 95
Did you receive a training
on Tomato cultivation?
Did you apply or practice the
learnt knowledge and
practices from the training?
If yes what practices did
you apply in the field?
If no, could you please
state reasons for not
using the knowledge?
Lahi sucks onto leaves and
soft stems of the tomato
plant.
1 - Yes
2 - No (Skip to 98)
1 - Yes
2 - No ( Skip to 94)
a)_______________
b)_______________
c)_______________
a)_______________
b)_______________
c)_______________
0 - False
1 - True
2 - Don't know
96 97 98 99 100
Tomato gawaro eats the
surface of tomatoes.
For one ropani of land, 10
gram seed is required.
Name three varieties of
tomatoes that can be
grown in Nepal region
Name two common
diseases that affect
tomato plants
Name three fertilizers used
in tomato cultivation
0 - False
1 - True
2 - Don’t know
0 - False
1 - True
2 - Don't know
1 - Manisha
2 - Ankush
3 - Suraksha
4 - Indom 9502/9808
5 - Himsohana
6 - Siris
7 - Don't know
1 - Root rotting disease
2 - Dhadhuwa rog
3 - Oilaune rog
4 - Mozac virus
5 - Don't know
1 - Compost
2 - Urea
3 - DAP
4 - Murate of Potash
5 - Don't know

RJK IE Final Report
SECTION F10 - OKRA (LADY'S FINGER) CULTIVATION
101 102 103 104 105
Did you receive a training
on Okra cultivation?
Did you apply or practice
the learnt knowledge and
practices from the training?
If yes what practices did you
apply in the field?
If no, could you please state
reasons for not using the
knowledge?
How can we cure okra plant
from yellow mosaic vein virus?
1 - Yes
2 - No (Skip to 108)
1 - Yes
2 - No ( Skip to 104) a)_______________
b)_______________
c)_______________
a)_______________
b)_______________
c)_______________
1 - Uproot diseased plants and
burn them.
2 - Plant disease resistant
varieties
3 - Spray Rogar by mixing 2 ml
per liter of water
4 - All of the above
5 - Don’t know
106 107 108 109 110
Name three fertilizers
used for okra cultivation
Ganwaro penetrates the
okra plant through its stem
and sucks the juice out of
the plant so that the plant
dies
Okra seeds should be put in
water 24 hours prior to
sowing.
State the quantity of seed
needed for one kattha of
land.
Name three varieties of okra:

RJK IE Final Report
1 - Compost/Cowdung
2 - Nitrogen
3 - Phosphorus
4 - Potash
5 - Don't know
0 - False
1 - True
2 - Don't know
0 - False
1 - True
2 - Don't know
1 - 200 to 300 gram
2 - 300 to 400 gram
3 - 400 to 500 gram
4 - 500 to 600 gram
5 - Don’t know
1 - Pusa sawani
2 - Parmani Kranti
3 - Punjab Padmani
4 - Parvati
5 - Ako Anamika
6 - Sagun
7 - Don't know
SECTION F11 - PADDY SEED SELECTION AND TREATMENT
111 112 113 114 115
Did you receive a
training on Paddy
Selection and
Treatment?
Did you apply or practice
the learnt knowledge and
practices from the training?
If yes what practices did you
apply in the field?
If no, could you please state
reasons for not using the
knowledge?
What are the two
methods to treat seeds
for good quality?
1 - Yes
2 - No (Skip to 116)
1 - Yes
2 - No ( Skip to 114)
a)_______________
b)_______________
c)_______________
a)_______________
b)_______________
c)_______________
1 - Treat the seeds in
salt and water.
2 - Treat the seeds with
chemicals to kill any
bacteria or
diseases.
3 - Don't know

RJK IE Final Report
116 117 118
State two physical attributes of good paddy/rice seed
Seeds that have been selected
can be stored anywhere in open
or closed space
Seeds that are moist are
good quality seeds
1 - Seeds that did not have any broken or damaged seed mixed in it.
2 - Seeds that do not have any leaves or seeds of other plants mixed in it.
3 - Seeds that do not any small stones, soil, leaves, stem, etc. not mixed
4 - Don't know
0 - False
1 - True
2 - Don't know
0 - False
1 - True
2 - Don't know
SECTION F12 - PADDY BED PREPARATION
119 120 121 122 123
Did you receive a
training on Paddy Bed
Preparation?
Did you apply or practice the
learnt knowledge and practices
from the training?
If yes what practices did you
apply in the field?
If no, could you please state
reasons for not using the
knowledge?
If the seedlings become
yellow due to Nitrogen
deficiency, one should apply

RJK IE Final Report
1 - Yes
2 - No (Skip to 124)
1 - Yes
2 - No ( Skip to 122) a)_______________
b)_______________
c)_______________
a)_______________
b)_______________
c)_______________
1 - Compost
2 - Nitrogen
3 - Phosphorus
4 - Don’t know
124 125 126
The seedlings must be transplanted within the same day
of uprooting
Name two fertilizers used for
bed preparation
What are the appropriate
number of days required for
the seedling to be ready?
0 - False
1 - True
2 - Don't know
1 - Compost
2 - Urea
3 - Don’t know
1 - 15 to 20 days
2 - 20 to 25 days
3 - Don’t know

RJK IE Final Report
SECTION F13 - LENTIL CULTIVATION METHOD
127 128 129 130 131
Did you receive a training on
Lentil Cultivation Method?
Did you apply or practice the
learnt knowledge and
practices from the training?
If yes what practices did
you apply in the field?
If no, could you please state
reasons for not using the
knowledge?
Musuro helps to balance the
nitrogen level in the soil
1 - Yes
2 - No (Skip to 134)
1 - Yes
2 - No ( Skip to 130) a)_______________
b)_______________
c)_______________
a)_______________
b)_______________
c)_______________
0 - False
1 - True
2 - Don't know
132 133 134 135 136
Name two sources of
nutrient found in Musuro
Name two fertilizers used in
Musuro production
When is the best time to
harvest Musuro?
How long should one dry
Musuro before storing it?
One kattha of land needs
1 - 1.5 kg of seed
1 - Protein
2 - Calcium
3 - Iron
4 - Don’t know
1 - DAP
2 - Potash
3 - Borax
4 - Don’t know
1 - When 80% is ripe
2 - When 60% is ripe
3 - Whenever you think is
appropriate
4 - All of the above
5 - Don’t know
1 - One to Two days
2 - Three to Four days
3 - No need to dry
4 - Don’t know
0 - False
1 - True
2 - Don't know

RJK IE Final Report
SECTION F14 - WHEAT CULTIVATION
137 138 139 140 141
Did you receive a training on
Wheat Cultivation Method?
Did you apply or practice the
learnt knowledge and
practices from the training?
If yes what practices did you
apply in the field?
If no, could you please state
reasons for not using the
knowledge?
Water should not be
stagnant in wheat field.
1 - Yes
2 - No (Skip to 144)
1 - Yes
2 - No ( Skip to 140) a)_______________
b)_______________
c)_______________
a)_______________
b)_______________
c)_______________
0 - False
1 - True
2 - Don't know
142 143 144 145 146
Wheat should be dried for 2-
3 days before storage.
Name three types of wheat
suitable for Terai and inner
Terai:
Name two ways to
prevent/treat aphid /lahi:
Name three fertilizers that
can be used in wheat
cultivation:
One kattha needs 4 kg of
seeds

RJK IE Final Report
0 - False
1 - True
2 - Don't know
1 - BL 1135/1473
2 - Achyut
3 - Bhrikuti
4 - Gautam
5 - Don't know
1 - Mitra khapate keera
2 - Tobacco leaves with
soap and water
3 - Cow urine
4 - Don't know
1 - Compost
2 - DAP
3 - Potash
4 - Urea
5 - Don't know
0 - False
1 - True
2 - Don't know
SECTION F15 - POTATO DISEASES AND PREVENTION
147 148 149 150 151
Did you receive a training on Potato
Diseases and Prevention?
Did you apply or practice
the learnt knowledge
and practices from the
training?
If yes what practices did you
apply in the field?
If no, could you please
state reasons for not using
the knowledge?
Name two media
through which black
scurf can spread
1 - Yes
2 - No (Skip to 154)
1 - Yes
2 - No ( Skip to 150)
a)_______________
b)_______________
c)_______________
a)_______________
b)_______________
c)_______________
1 - Infected Seed
2 - Infected Soil
3 - Don’t know
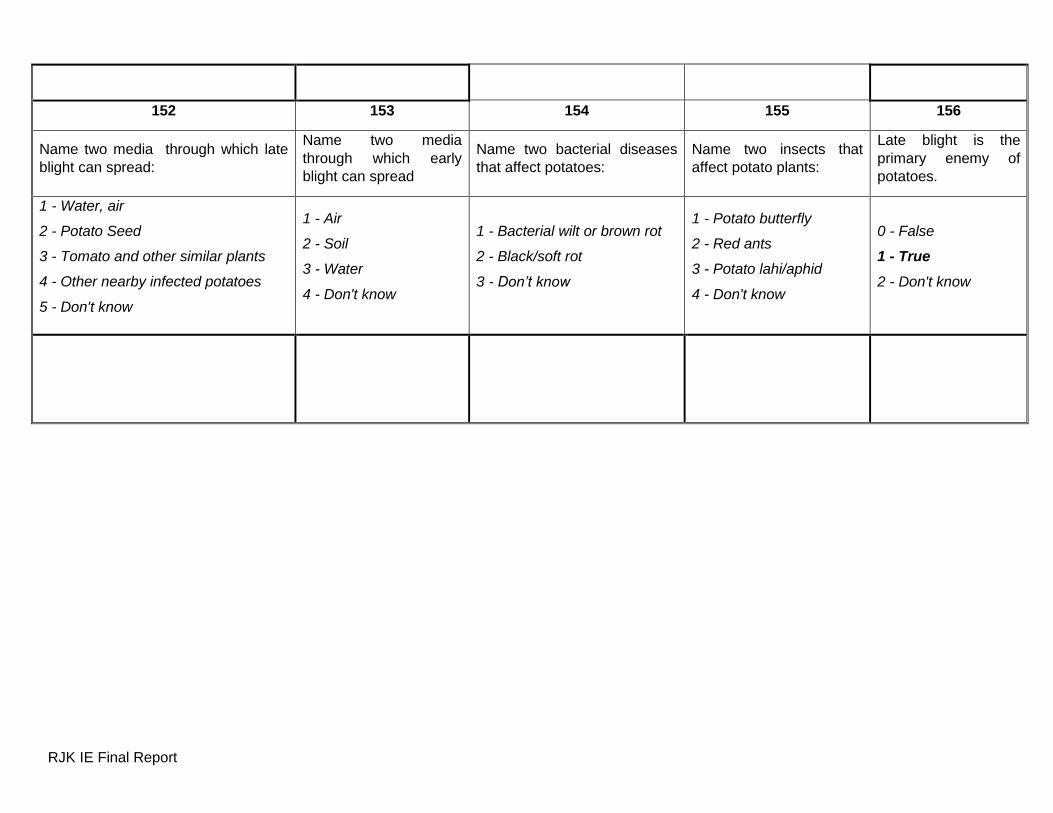
RJK IE Final Report
152 153 154 155 156
Name two media through which late
blight can spread:
Name two media
through which early
blight can spread
Name two bacterial diseases
that affect potatoes:
Name two insects that
affect potato plants:
Late blight is the
primary enemy of
potatoes.
1 - Water, air
2 - Potato Seed
3 - Tomato and other similar plants
4 - Other nearby infected potatoes
5 - Don't know
1 - Air
2 - Soil
3 - Water
4 - Don't know
1 - Bacterial wilt or brown rot
2 - Black/soft rot
3 - Don’t know
1 - Potato butterfly
2 - Red ants
3 - Potato lahi/aphid
4 - Don't know
0 - False
1 - True
2 - Don't know

RJK IE Final Report
Related Documents