R.J. Wichink Kruit 1 , D. Simpson 2 , M. Schaap 1 , R. Kranenburg 1 , E. Dammers 1 , C.A. Geels 3 , C. Skjoth 4 , M. Engardt 5 , A. Graff 6 , R. Stern 7 , B. Bessagnet 8 , L. Rouil 8 , J.M. Baldasano 9 , M. Pay 9 , D. Hauglustaine 10 , A. Nyiri 2 , M.A. Sutton 11 , S. Reis 11 , P. Thunis 12 and C. Cuvelier 12 ÉCLAIRE model inter-comparison of atmospheric nitrogen deposition and concentrations over Europe 1 TNO, Dept. of Climate, Air and Sustainability, P.O. Box 80015, NL-3508TA Utrecht, The Netherlands 2 Norwegian Meteorological Institute, Air Pollution Section Research Department, P.O. Box 43, Blindern, N-0313, Oslo, Norway 3 Aarhus University, Department of Environmental Science-Atmospheric modeling, Frederiksborgvej 399, 4000 Roskilde, Denmark 4 University of Worcester, National Pollen and Aerobiology Research Unit, Henwick Grove, VR2 6AJ, Worcester, United Kingdom 5 SMHI, Norkoping 6 Umweltbundesamt, Postfach 1406, D-06813 Dessau-Roßlau, Germany 7 Freie Universität Berlin, Institut für Meteorologie und Troposphärische Umweltforschung, Carl-Heinrich-Becker Weg 6-10, D-1216 Berlin, Germany 8 INERIS, Institut National de l’Environnement Industriel et des Risques Parc Technologique, ALATA, F-60550 Verneuil-en-Halatte, France 9 Barcelona Supercomputing Center, c/ Jordi Girona 29, E-08034 Barcelona, Spain 10 Laboratoire des Sciences du Climat et de l’environnement, UMR 8212 CEA-CNRS-UVSQ, Gif-sur-Yvette, France 11 CEH, Natural Environmental Research Council, Bush Estate, Pinicuik, Midlothian, EH26 0QB 12 European Commission, DG Joint Research Centre, Institute for Environment and Sustainability, I-21020 Ispra (Va), Italy

R.J. Wichink Kruit 1, D. Simpson 2, M. Schaap 1, R. Kranenburg 1, E. Dammers 1, C.A. Geels 3, C. Skjoth 4, M. Engardt 5, A. Graff 6, R. Stern 7, B. Bessagnet.
Dec 17, 2015
Welcome message from author
This document is posted to help you gain knowledge. Please leave a comment to let me know what you think about it! Share it to your friends and learn new things together.
Transcript

R.J. Wichink Kruit1, D. Simpson2, M. Schaap1, R. Kranenburg1, E. Dammers1,
C.A. Geels3, C. Skjoth4, M. Engardt5, A. Graff6, R. Stern7 , B. Bessagnet8, L. Rouil8,
J.M. Baldasano9, M. Pay9, D. Hauglustaine10, A. Nyiri2, M.A. Sutton11, S. Reis11,
P. Thunis12 and C. Cuvelier12
ÉCLAIRE model inter-comparison of atmospheric nitrogen deposition and concentrations over Europe
1 TNO, Dept. of Climate, Air and Sustainability, P.O. Box 80015, NL-3508TA Utrecht, The Netherlands2 Norwegian Meteorological Institute, Air Pollution Section Research Department, P.O. Box 43, Blindern, N-0313, Oslo, Norway3 Aarhus University, Department of Environmental Science-Atmospheric modeling, Frederiksborgvej 399, 4000 Roskilde, Denmark4 University of Worcester, National Pollen and Aerobiology Research Unit, Henwick Grove, VR2 6AJ, Worcester, United Kingdom5 SMHI, Norkoping6 Umweltbundesamt, Postfach 1406, D-06813 Dessau-Roßlau, Germany7 Freie Universität Berlin, Institut für Meteorologie und Troposphärische Umweltforschung, Carl-Heinrich-Becker Weg 6-10, D-12165 Berlin, Germany8 INERIS, Institut National de l’Environnement Industriel et des Risques Parc Technologique, ALATA, F-60550 Verneuil-en-Halatte, France9 Barcelona Supercomputing Center, c/ Jordi Girona 29, E-08034 Barcelona, Spain10 Laboratoire des Sciences du Climat et de l’environnement, UMR 8212 CEA-CNRS-UVSQ, Gif-sur-Yvette, France 11 CEH, Natural Environmental Research Council, Bush Estate, Pinicuik, Midlothian, EH26 0QB12 European Commission, DG Joint Research Centre, Institute for Environment and Sustainability, I-21020 Ispra (Va), Italy

Motivation
It is difficult to say anything about uncertainties in model calculations of
Nr-deposition as there are no observations of total Nr deposition
available yet.
This study aims to:
deliver an ensemble map of the total Nr-deposition over Europe based
on 7 regional European CTMs, and to
estimate the inter-model variation in the total Nr-deposition over Europe
validate the models by comparing modelled wet depositions and
concentrations with observations from the EMEP wet deposition network
and NitroEurope IP

Model settings
ECLAIRE model comparisonModelling the European Nitrogen budget
3
Domain nx ny ΔLon (°)
ΔLat (°)
ΔLon x ΔLat (km x km)
SW corner grid centre (Lon / Lat)
Europe 82 104 0.5 0.25 28 x 28 (N) 44 x 28 (S) -10.25 / 36.00
Emissions: provided by INERIS at 0.5° x 0.25° Longitude/LatitudeNote: INCA used own emissions!
Other Input: not prescribed.Output domain:
Resolution: 0.5° x 0.25° (~28x28 km2)DEHM: hemispheric (~ 50x50 km2)INCA (global): 3.75° x 1.875° (~210x210 km2)
Models: EMEP, LOTOS-EUROS, DEHM, MATCH, CMAQ, CHIMERE, RCGC, INCA (global)

Individual model results
ECLAIRE model comparisonModelling the European Nitrogen budget
4
EMEP CMAQ CHIMERE RCGC MATCH LOTOS-EUROS
DEHM INCA
dry NHx
dry NOy
wet NHx
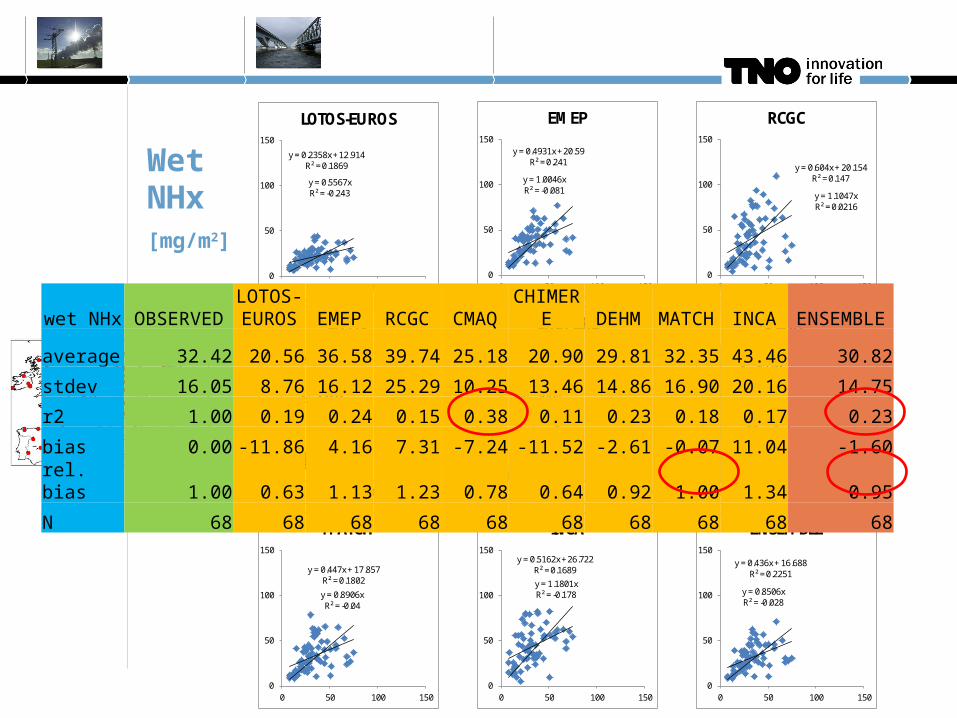
wet NOy

Ensemble of 7 regional CTMs:Total Nr
ECLAIRE model comparisonModelling the European Nitrogen budget
5

Contribution of NHx to total Nr
ECLAIRE model comparisonModelling the European Nitrogen budget
6

10-day running mean of model domain
Total Nr
ECLAIRE model comparisonModelling the European Nitrogen budget
7
Dry Nr ~ 40%
Wet Nr ~ 60%

Contribution of dry Nr to total Nr
ECLAIRE model comparisonModelling the European Nitrogen budget
8

ECLAIRE model comparisonModelling the European Nitrogen budget
9
10-day running mean of model domain
Dry NOy ~ 35%
Wet Noy ~ 65%
Dry NHx ~ 45%
Wet NHx ~ 55%

Conclusions from model inter-comparison
This study showed that the total Nr-deposition (NHx +NOy) in the model
domain were rather similar in all models
The variation in model results is largest for the dry deposition of NHx
Larger dry deposition is compensated by smaller wet deposition
The average variation in the modeled Nr-deposition was about 30-50% over land and
50-100% over water
NHx vs. NOy deposition is approximately 50% vs. 50%, but large
regional differences!
Dry versus wet deposition contributions are approximately 45% vs. 55% for NHx and
35% vs. 65% for NOy and
40% vs. 60% for total Nr (but large regional differences again!)
KLD presentatie 24-maart 2011Development of GHG projection guidelines
10

Comparison with EMEP wet deposition and NitroEurope IP observation
ECLAIRE model comparisonModelling the European Nitrogen budget
11
y = 0.5567xR² = -0.243
y = 0.2358x + 12.914R² = 0.1869
0
50
100
150
0 50 100 150
LOTOS-EUROS
y = 1.0046xR² = -0.081
y = 0.4931x + 20.59R² = 0.241
0
50
100
150
0 50 100 150
EMEP
y = 1.1047xR² = 0.0216
y = 0.604x + 20.154R² = 0.147
0
50
100
150
0 50 100 150
RCGC
y = 0.7025xR² = 0.0965
y = 0.3954x + 12.358R² = 0.3837
0
50
100
150
0 50 100 150
CMAQ
y = 0.5726xR² = -0.049
y = 0.2747x + 11.991R² = 0.1074
0
50
100
150
0 50 100 150
CHIMERE
y = 0.8262xR² = 0.0085
y = 0.4394x + 15.57R² = 0.2253
0
50
100
150
0 50 100 150
DEHM
y = 0.8906xR² = -0.04
y = 0.447x + 17.857R² = 0.1802
0
50
100
150
0 50 100 150
MATCH
y = 1.1801xR² = -0.178
y = 0.5162x + 26.722R² = 0.1689
0
50
100
150
0 50 100 150
INCA
y = 0.8506xR² = -0.028
y = 0.436x + 16.688R² = 0.2251
0
50
100
150
0 50 100 150
ENSEMBLE
WetNHx[mg/m2]
wet NHx OBSERVEDLOTOS-EUROS EMEP RCGC CMAQ CHIMERE DEHM MATCH INCA ENSEMBLE
average 32.42 20.56 36.58 39.74 25.18 20.90 29.81 32.35 43.46 30.82
stdev 16.05 8.76 16.12 25.29 10.25 13.46 14.86 16.90 20.16 14.75
r2 1.00 0.19 0.24 0.15 0.38 0.11 0.23 0.18 0.17 0.23
bias 0.00 -11.86 4.16 7.31 -7.24 -11.52 -2.61 -0.07 11.04 -1.60
rel. bias 1.00 0.63 1.13 1.23 0.78 0.64 0.92 1.00 1.34 0.95
N 68 68 68 68 68 68 68 68 68 68
y = 0.7728xR² = 0.5156
y = 0.584x + 21.008R² = 0.5897
0
50
100
150
200
0 50 100 150 200
LOTOS-EUROS
y = 1.0156xR² = 0.0741
y = 0.5574x + 50.984R² = 0.3945
0
50
100
150
200
0 50 100 150 200
EMEP
y = 0.8732xR² = -0.111
y = 0.3965x + 53.046R² = 0.1499
0
50
100
150
200
0 50 100 150 200
RCGC
y = 1.0239xR² = 0.5508
y = 0.824x + 22.247R² = 0.5927
0
50
100
150
200
0 50 100 150 200
CMAQ
y = 1.017xR² = -0.381
y = 0.4365x + 64.598R² = 0.3385
0
50
100
150
200
0 50 100 150 200
CHIMERE
y = 0.7443xR² = 0.24
y = 0.457x + 31.97R² = 0.4571
0
50
100
150
200
0 50 100 150 200
DEHM
y = 1.0416xR² = 0.0344
y = 0.5536x + 54.301R² = 0.5213
0
50
100
150
200
0 50 100 150 200
MATCH
y = 0.871xR² = -0.201
y = 0.4026x + 52.125R² = 0.3211
0
50
100
150
200
0 50 100 150 200
INCA
y = 0.9737xR² = 0.1674
y = 0.5584x + 46.207R² = 0.499
0
50
100
150
200
0 50 100 150 200
ENSEMBLE
WetNOy[mg/m2]
wet NOy OBSERVEDLOTOS-EUROS EMEP RCGC CMAQ CHIMERE DEHM MATCH INCA ENSEMBLE
average 92.58 75.07 102.59 89.75 98.53 105.01 74.28 105.55 89.39 97.91
stdev 41.91 31.87 37.20 42.93 44.86 31.44 28.33 32.14 29.78 33.14
r2 1.00 0.59 0.39 0.15 0.59 0.34 0.46 0.52 0.32 0.50
bias 0.00 -17.51 10.01 -2.83 5.95 12.43 -18.30 12.97 -3.19 5.33
rel. bias 1.00 0.81 1.11 0.97 1.06 1.13 0.80 1.14 0.97 1.06
N 68 68 68 68 68 68 68 68 68 68

NH3
ECLAIRE model comparisonModelling the European Nitrogen budget
14
EMEP CMAQ CHIMERE RCGC MATCHLOTOS-EUROS DEHM INCA
ENSEMBLE
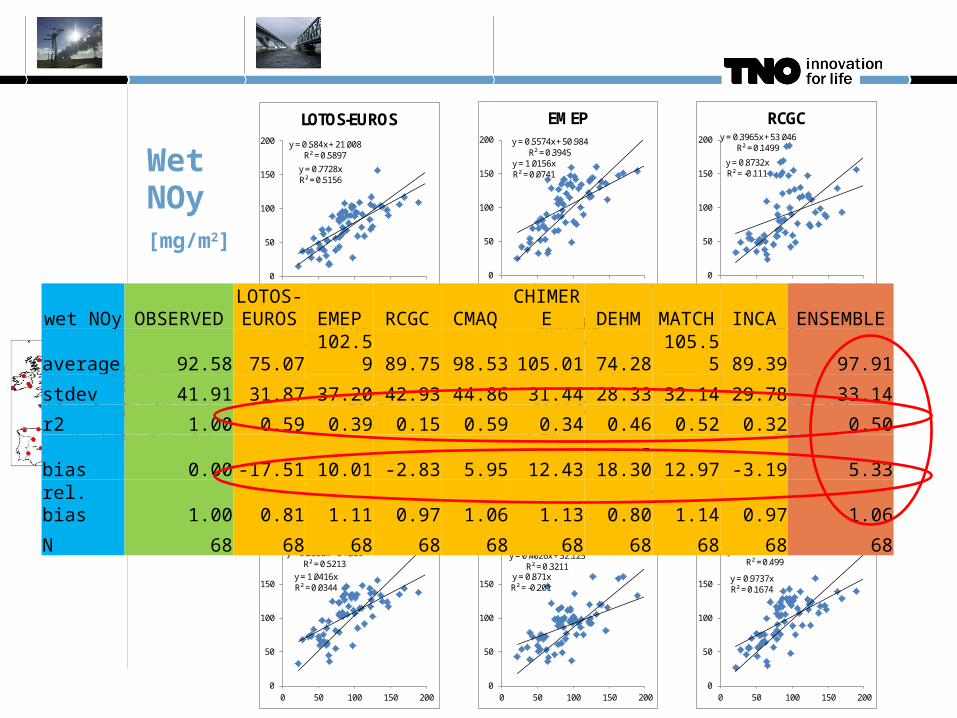
NH3
ECLAIRE model comparisonModelling the European Nitrogen budget
15
y = -0.0168x + 1.8112R² = 0.1127
0
1
2
3
4
5
6
0 2 4 6
LOTOS-EUROS
y = 0.7122x + 0.4567R² = 0.525
y = 0.8623xR² = 0.4865
0
2
4
6
8
10
12
14
0 5 10 15
LOTOS-EUROS
y = 0.5147x + 0.3718R² = 0.5181
y = 0.6369xR² = 0.4698
0
2
4
6
8
10
12
14
0 5 10 15
EMEP
y = 1.0253x + 0.9661R² = 0.4838
y = 1.3429xR² = 0.4072
0
2
4
6
8
10
12
14
0 5 10 15
RCGC
y = 0.4361x + 0.5312R² = 0.3713
y = 0.6107xR² = 0.273
0
2
4
6
8
10
12
14
0 5 10 15
CMAQ
y = 0.4522x + 0.523R² = 0.3991
y = 0.6241xR² = 0.3039
0
2
4
6
8
10
12
14
0 5 10 15
CHIMERE
y = 0.478x + 0.3299R² = 0.4786
y = 0.5865xR² = 0.4379
0
2
4
6
8
10
12
14
0 5 10 15
MATCH
y = 0.418x + 1.7301R² = 0.1635
y = 0.9867xR² = -0.336
0
2
4
6
8
10
12
14
0 5 10 15
INCA
y = 0.5717x + 0.6773R² = 0.5115
y = 0.7944xR² = 0.3834
0
2
4
6
8
10
12
14
0 5 10 15
ENSEMBLE
y = 0.5381x + 0.5061R² = 0.4955
y = 0.7045xR² = 0.4173
0
2
4
6
8
10
12
14
0 5 10 15
DEHMNH3 OBSERVEDLOTOS-EUROS EMEP RCGC CMAQ CHIMERE DEHM MATCH INCA ENSEMBLE
average 1.84 1.77 1.32 2.86 1.33 1.36 1.50 1.21 2.50 1.73
stdev 1.50 1.48 1.07 2.21 1.07 1.07 1.15 1.04 1.55 1.20
r2 1.00 0.525 0.518 0.484 0.371 0.399 0.496 0.479 0.164 0.512
bias 0.00 -0.07 -0.52 1.01 -0.51 -0.49 -0.34 -0.63 0.66 -0.11
rel. bias 1.00 0.96 0.72 1.55 0.72 0.74 0.81 0.66 1.36 0.94
N 51 51 51 51 51 51 51 51 51 51

Conclusions from comparison with observations
ECLAIRE model comparisonModelling the European Nitrogen budget
16
Ensemble results of the seven regional CTM models are generally
better than the individual model results
Modelled wet deposition of NOy correlates much better with observed
wet deposition than NHx.
Regional CTMs are well able to estimate ‘background’ NH3
concentrations
Data from NitroEurope IP is very useful for the ECLAIRE model
evaluation!
Further analysis of the model-measurement comparison and reasons
for inter-model differences is a priority for the next phase in ECLAIRE.

Thank you!
ECLAIRE model comparisonModelling the European Nitrogen budget
17

y = 0.2941x + 0.2755R² = 0.2114
y = 0.4978xR² = 0.0881
0
0.5
1
1.5
2
2.5
3
3.5
4
0 1 2 3 4
LOTOS-EUROSy = 0.398x + 0.2409
R² = 0.2079
y = 0.5762xR² = 0.1573
0
0.5
1
1.5
2
2.5
3
3.5
4
0 1 2 3 4
EMEP
y = 0.3035x + 0.2281R² = 0.0858
y = 0.4722xR² = 0.0535
0
0.5
1
1.5
2
2.5
3
3.5
4
0 1 2 3 4
RCGC
y = 0.5468x + 0.3362R² = 0.3001
y = 0.7955xR² = 0.2247
0
0.5
1
1.5
2
2.5
3
3.5
4
0 1 2 3 4
CMAQy = 0.3291x + 0.2563
R² = 0.237
y = 0.5187xR² = 0.1415
0
0.5
1
1.5
2
2.5
3
3.5
4
0 1 2 3 4
CHIMEREy = 0.3653x + 0.3194
R² = 0.1963
y = 0.6015xR² = 0.0966
0
0.5
1
1.5
2
2.5
3
3.5
4
0 1 2 3 4
DEHM
y = 0.2736x + 0.3472R² = 0.2551
y = 0.5304xR² = -0.018
0
0.5
1
1.5
2
2.5
3
3.5
4
0 1 2 3 4
MATCHy = 0.4246x + 0.8198
R² = 0.1021
y = 1.0308xR² = -0.151
0
0.5
1
1.5
2
2.5
3
3.5
4
0 1 2 3 4
INCA
y = 0.3679x + 0.3519R² = 0.219
y = 0.6282xR² = 0.0858
0
0.5
1
1.5
2
2.5
3
3.5
4
0 1 2 3 4
ENSEMBLE
HNO3
ECLAIRE model comparisonModelling the European Nitrogen budget
18
Related Documents