An annual report to the community about teaching, learning, test results, resources, and measures of progress in our school. » Published by SCHOOL WISE PRESS Riverview Elementary School School Accountability Report Card, 2012–2013 Lakeside Union School District

Welcome message from author
This document is posted to help you gain knowledge. Please leave a comment to let me know what you think about it! Share it to your friends and learn new things together.
Transcript

Riverview Elementary SchoolSchool Accountability Report Card, 2012–2013Lakeside Union School District
An annual report to the
community about teaching,
learning, test results,
resources, and measures of
progress in our school.
»
Published bySCHOOL WISE PRESS

Riverview Elementary School School Accountability Report Card, 2012–2013Lakeside Union School District
»Contents
ONLINE USERS: CLICK ON A TITLE TO JUMP TO THAT SECTION
This School Accountability Report Card (SARC) provides information that can be used to evaluate and compare schools. State and federal laws require all schools to publish a SARC each year.
The information in this report represents the 2012–2013 school year, not the current school year. In most cases, this is the most recent data available. We present our school’s results next to those of the average elementary school in the county and state to provide the most meaningful and fair comparisons. To find additional facts about our school online, please use the DataQuest tool offered by the California Department of Education.
Please note that words that appear in a smaller, bold typeface are links in the online version of this report to more information. You can find a list of those linked words and their Web page URLs at:http://pub.schoolwisepress.com/sarc/links_2013_en.html
Reports about other schools are available on the California Department of Education Web site. Internet access is available in local libraries.
If you have any questions related to this report, or would like to request a hardcopy version, please contact our school office.
How to Contact Our School9308 Winter Gardens Blvd.Lakeside, CA 92040Principal: Olympia KyriakidisPhone: (619) 390-2662
How to Contact Our District12335 Woodside Ave.Lakeside, CA 92040Phone: (619) 390-2600http://www.lsusd.net/site/default.aspx?PageID=1
Published by
SCHOOL WISE PRESS466 Green Street, Suite 303San Francisco, CA 94133Phone: (415) 432-7800www.schoolwisepress.com
©2013 Publishing 20/20
Principal’s Message
Measures of Progress
Student Achievement
Students
Climate for Learning
Leadership, Teachers, and Staff
Adequacy of Key Resources 2013–2014
Data Almanac

»
Riverview Elementary SchoolSchool Accountability Report Card, 2012–2013Lakeside Union School District
Lakeside Union School District
Grade range and calendar
K–5TRADITIONAL
Academic Performance Index
879County Average: 837State Average: 810
Student enrollment
494County Average: 559State Average: 534
Principal’s Message
Riverview Elementary School is a public school located in Lakeside in San Diego County. This school is very unique, offering a trilingual model with a 21st Century skills focus. The mission of the school is to provide students with a world-class trilingual instructional program such that they can speak, read, and write in three languages: to prepare them for an ever-developing world of technology, cultivate an awareness and respect for other cultures, and empower them as future leaders of a global society. This mission is based on the following beliefs: 1) The understanding of multiple languages and cultures promotes the development of multiculturalism and a harmonious world, 2) All students should have an opportunity to receive the best possible education and to see themselves as global students who understand the value and potential of their multicultural skills.
At Riverview, English-speaking students are taught Spanish, Mandarin Chinese and English. Students are taught these three languages for two distinct reasons. A person able to speak these three languages can communicate with 75 percent of the world’s population. This is a great advantage in a competitive global society. In addition, teaching these three languages stimulates different parts of the brain and provides students the neural capacity to learn character-based and tonal languages as well as alphabetic-based languages. Research shows that younger is better when learning languages and there are numerous educational benefits resulting from multilingualism.
Riverview Elementary’s trilingual model is unique in the world. In this model students receive 90 percent instruction in Spanish and 10 percent instruction in Mandarin Chinese in kindergarten and first grade. English instruction is introduced in grade two (2) for approximately 20 percent of the instructional time and Chinese increases to 40 minutes, three times a week. The percentage of English instruction increases through the grades. Chinese instruction continues three times a week for forty minutes. All language instruction begins in kindergarten and progresses through the fifth grade. Students continue their language studies at Lakeside Middle School. Why do we teach students these three languages?
While our students learn three languages, they are outshining their monolingual peers on the California STAR assessment. Our API is currently 879 and this is a very high score in the state of California. The California STAR assessment measures English language arts and mathematics. Therefore, the average Riverview student achieves grade level proficiency in English and math, but also achieves grade-level proficiency in Spanish and novice high stages of Mandarin Chinese.

Riverview Elementary School School Accountability Report Card for 2012–2013 Page 2
Multilingualism is not the only focus in helping fulfill the mission of this unique program. Twenty-first century skills and technology are an important focus. Technology is considered a fourth language and students use different forms of technology and multimedia beginning in kindergarten. Additionally, students are taught to think critically, collaborate, and use their creativity on a daily basis. The arts and PE are integrated daily to ensure the whole child is educated. The Seven Habit’s Leader in Me program teaches students to take responsibility for their learning and their school. Through careful planning and integration of content, language, and 21st-century skills, Riverview staff, students, and families have created an exceptional educational program that is preparing students to be future global leaders.
Olympia Kyriakidis, PRINCIPAL
Lakeside Union School District

Riverview Elementary School School Accountability Report Card for 2012–2013 Page 3
School ExpendituresThe district’s expenditures include funds for general education, special education, and specially funded projects but do not include facilities costs or deferred maintenance. Approximately three-fourths of the revenues go toward the salaries of teachers, specialists, auxiliary personnel, books, supplies, and equipment.
Riverview offers exceptional programs for its students despite the impact on budgets this past year. State funding is used for curriculum to support instruction towards mastery of the state standards, integrating Spanish with content. Furthermore, Riverview’s Chinese program is funded through state funding. Federal funding helps support student interventions for our English Learner and Socio-economically disadvantaged students.
Monies from Run for the Arts, a district fundraiser, help provide drama opportunities in conjunction with La Jolla Playhouse for upper grade students. District funds also provide for instrumental music instruction in the upper grades for interested students. PTSA funds also help pay for additional visual, dance, and music artists. PTSA funds also help pay for high-quality assemblies and field trip opportunities for every child. Riverview also offers incredible enrichment programs thanks to donations from our community. These programs include Robotics, Chess Club, Chorus, guitar, and dance.
Funds from Prop V Bond provided the school with additional technology such as MacBook Pro computers for every teacher, SMART Boards, docucams, and wireless access in every classroom. Additional site funds as well as donations were used to increase the amount of computers in every classroom and provide computers for a computer lab.
SafetyThe Riverview Elementary campus is a safe and secure campus. A perimeter fence deters entrance except in front of the office. All visitors, including parents must sign in and wear a badge. The principal, staff, and a morning and lunch campus supervisor monitor campus security consistently through out the school day.
A safety committee made up of the principal, teachers, and parents, in the field of fire emergency and law enforcement, reviews and continuously improves safety procedures on the campus. This committee walks through classrooms twice a year to ensure classrooms are safe and routines and procedures for safety are in place. The Riverview Elementary School Safety Plan is a complete Safety Plan covering all areas designed by the state of California. The safety plan is based on the REMS program and includes the physical environment, social environment and culture, emergency/disaster procedures, and school board policy and procedures. The REMS Safety plan is broken down into four key areas: mitigation and prevention, preparedness, recovery, and response. Safety procedures including fire, disaster and lockdown drills are practiced through the year. The complete plan is on file, updated every August, and available at the school office. The staff reviews the plan before school starts and each trimester through out the school year. A flip chart outlining LUSD emergency procedures is posted in each classroom and the office.
Practice and training is ongoing with disaster drills varying in the type of disaster and obstacles on a bi-monthly basis. The Connect-Ed system is used for emergency communication. The system can be used with or without power from a cell phone, providing instant information to all parents. Community safety meetings are held with representatives from Riverview, PTSA, Sheriff ’s Department, Highway Patrol, Fire Department, and San Diego County to discuss safety issues for each of the sites.
BuildingsRiverview is in excellent condition and well maintained. Riverview was built in the 1950s. Riverview undergoes maintenance on a regular basis. An online system of work orders is used to facilitate maintenance requests. The district maintenance crew responds quickly and is very proactive in maintaining and improving the campus.
Modernization construction occurred several years ago. During modernization all walls, roofs, floors, plumbing, and electrical were updated to reflect current demands including technology upgrades. SMART Boards were added to every classroom along with other high quality technology upgrades. Rest rooms and fire alarm systems were updated, along with heating and cooling systems upgraded to ensure energy efficient use. Sites are cleaned daily and any graffiti removed immediately by custodial staff. New portable classrooms were added to accommodate the growth of the school.
The parking area and pick up were redesigned two years ago to accommodate an increase in traffic due to increasing enrollment. Parking and pick-up procedures were redesigned to ensure student safety. A state-of-the-art computer lab with MacBook computers and multimedia tools was added to align with the mission of the school.
Lakeside Union School District

Riverview Elementary School School Accountability Report Card for 2012–2013 Page 4
A few years ago, significant concrete and landscape work was completed to enhance both the safety and the aesthetics of the campus. A Peace Pole and PeaceBuilders mural add to the culture on the campus. Five years ago, parents and community volunteers worked along side district and school site staff to create a beautiful, safe and modern new play structure, outdoor classroom, picnic tables, and planter benches for our students to enjoy.
In 2011, a Farmer’s Market Garden was planted behind the new portables for growing fruits and vegetables. Each grade level has their area and shares their produce in a Farmer’s Market showcasing their hard work. The school plans to add Asian garden in front of the Mandarin Chinese classrooms. The Seven Habit’s Leader in Me program plays a large role in establishing the culture of the school. The students have requested the addition of a Seven Habit’s mural in one of the breezeways.
Parent InvolvementParents are viewed as partners in their child’s education at Riverview. Parents are asked to sign a commitment form each year along with staff and students outlining expectations and opportunities for involvement. Parents and community members are encouraged to become partners with the school as room parents, volunteers, and PTSA members. These opportunities include programs facilitated and implemented by parents. Two of these programs, Everyone a Reader and Riverview Readers help students read more and develop a love of reading. Additional programs include Arts Attack, which integrates art into the classroom and provides students an outlet for creativity, Riverview Robotics, and Chess Club.
Opportunities for parents in the governance of the school include service on the following committees: School Site Council, District Advisory Committee, both the site and District English Learner Advisory Committees and the GATE Advisory Committee.
Parenting classes are offered throughout the year at the site and district level. Great events bring the school, families, and the community together. The largest of these events is the International Fair. Last year approximately 2,000 people attended the International Fair; children received passports and “traveled the world” experiencing games, foods, and crafts from different cultures. Additional large events include a Jog-a-Thon, International Day of Peace, Literacy Night and guest readers celebrating Love of Reading Week, a Science night celebrating Eye on Science Week, a family BBQ celebrating Our Heroes, a Chinese New Year Celebration, and Grandparent’s Day. Other opportunities for parental involvement include student performances, book fairs, the Seven Habit’s Leader in Me program, the PeaceBuilders program, robotics, PTSA Founder’s Day community service celebration, bi-annual parent-teacher conferences, Parent Information Nights, and Open House.
With the help of PTSA, Riverview is able to provide a minimum of two field trips a year for each child. Parents are encouraged to chaperone field trips. The PTSA also helps the school provide high quality assemblies, such as BMX bikes for Red Ribbon Week, Mad Science for Eye on Science Week, Chinese acrobats, and the La Jolla Playhouse POP Tour.
Parental involvement is one of the greatest strengths of the Riverview program. Every day, parents make a difference for their children and all children on the Riverview campus. Contact people include our PTSA president and our volunteer coordinator. Please contact the school office for their contact information.
Lakeside Union School District

Riverview Elementary School School Accountability Report Card for 2012–2013 Page 5
Academic Performance IndexThe Academic Performance Index (API) is California’s way of comparing schools based on student test scores. The index was created in 1999 to help parents and educators recognize schools that show progress and identify schools that need help. It is also used to compare schools in a statewide ranking system. The California Department of Education (CDE) calculates a school’s API using student test results from the California Standards Tests and, for high schools, the California High School Exit Exam (CAHSEE). APIs range from 200 to 1000. The CDE expects all schools to eventually obtain APIs of at least 800. Additional
information on the API can be found on the CDE Web site.
Riverview’s API was 879 (out of 1000). This is an increase of 4 points compared with last year’s API. All students took the test. You can find three years of detailed API results in the Data Almanac that accompanies this report.
API RANKINGS: Based on our 2011–2012 test results, we started the 2012–2013 school year with a base API of 875. The state ranks all schools according to this score on a scale from 1 to 10 (10 being highest). Compared with all elementary schools in California, our school ranked 8 out of 10.
SIMILAR SCHOOL RANKINGS: We also received a second ranking that compared us with the 100 schools with the most similar students, teachers, and class sizes. Compared with these schools, our school ranked 2 out of 10. The CDE recalculates this factor every year. To read more about the specific elements included in this calculation, refer to the CDE Web site.
API GROWTH TARGETS: Each year the CDE sets specific API “growth targets” for every school. It assigns one growth target for the entire school, and it sets additional targets for ethnic groups, English Learners, special education students, or socioeconomic subgroups of students that make up a significant portion of the student body. Schools are required to meet all of their growth targets. If they do, they may be eligible to apply for awards through the California School Recognition Program and the Title I Achieving Schools Program.
We met our assigned growth targets during the 2012–2013 school year. Just for reference, 48 percent of elementary schools statewide met their growth targets.
MEASURES OF PROGRESS
CALIFORNIA
APIACADEMIC PERFORMANCE INDEX
Met schoolwide growth target YesMet growth target for prior school year Yes
API score 879Growth attained from prior year +4Met subgroup* growth targets Yes
SOURCE: API based on spring 2013 test cycle. Growth scores alone are displayed and are current as of December 2013.
*Ethnic groups, English Learners, special ed students, or socioeconomic groups of students that make up 15 percent or more of a school’s student body. These groups must meet AYP and API goals. N/A - Results not available.
200 300 400 500 600 700 800 900 1000
Learning disabled
English Learners
Low income
Two or more races
White/Other
Hispanic/Latino
STUDENT SUBGROUPS
STATE AVERAGE
ALL STUDENTS IN THIS SCHOOL
API, Spring 2013
879
810
837
897
921
811
822
739
SOURCE: API based on spring 2013 test cycle. State average represents elementary schools only.NOTE: Only groups of students that represent at least 15 percent of total enrollment are calculated and displayed as student subgroups.
Lakeside Union School District

Riverview Elementary School School Accountability Report Card for 2012–2013 Page 6
Adequate Yearly ProgressIn addition to California’s accountability system, which measures student achievement using the API, schools must also meet requirements set by the federal education law known as No Child Left Behind (NCLB). This law requires all schools to meet a different goal: Adequate Yearly Progress (AYP).
We met 13 out of 17 criteria for yearly progress. Because we fell short in four areas, we did not make AYP.
To meet AYP, elementary schools must meet three criteria. First, a certain percentage of students must score at or above Proficient levels on the California Standards Tests (CST), the California Modified Assessment (CMA), and the California Alternate Performance Assessment (CAPA): 89.2 percent on the English/language arts test and 89.5 percent on the math test. All ethnic, English Learners, special education, and socioeconomic subgroups of students also must meet these goals. Second, the schools must achieve an API of at least 770 or increase the API by one point from the prior year. Third, 95 percent of the student body must take the required standardized tests.
If even one subgroup of students fails to meet just one of the criteria, the school fails to meet AYP. While all schools must report their progress toward meeting AYP, only schools that receive federal funding to help economically disadvantaged students are actually penalized if they fail to meet AYP goals. Schools that do not make AYP for two or more years in a row in the same subject enter Program Improvement (PI). They must offer students transfers to other schools in the district and, in their second year in PI, tutoring services as well.
The table at left shows our success or failure in meeting AYP goals in the 2012–2013 school year. The green dots represent goals we met; red dots indicate goals we missed. Just one red dot means that we failed to meet AYP.
NOTE: Dashes indicate that too few students were in the category to draw meaningful conclusions. Federal law requires valid test scores from at least 50 students for statistical significance.
FEDERAL
AYPADEQUATE YEARLY PROGRESS
Met AYP NoMet schoolwide participation rate YesMet schoolwide test score goals NoMet subgroup* participation rate YesMet subgroup* test score goals NoMet schoolwide API for AYP YesProgram Improvement school in 2013
No
SOURCE: AYP is based on the Accountability Progress Report of September 2013. A school can be in Program Improvement based on students’ test results in the 2012–2013 school year or earlier.
*Ethnic groups, English Learners, special ed students, or socioeconomic groups of students that make up 15 percent or more of a school’s student body. These groups must meet AYP and API goals. N/A - Results not available.
Adequate Yearly Progress, Detail by Subgroup
● MET GOAL ● DID NOT MEET GOAL – NOT ENOUGH STUDENTS
English/Language Arts Math
DID 95%OF STUDENTS TAKE THE CST,
CMA OR CAPA?
DID 89.2%OF STUDENTS
SCOREPROFICIENT OR ADVANCED ON THE CST, CMA,
& CAPA?
DID 95%OF STUDENTS TAKE THE CST,
CMA OR CAPA?
DID 89.5%OF STUDENTS
SCOREPROFICIENT OR ADVANCED ON THE CST, CMA,
& CAPA?
SCHOOLWIDE RESULTS ● ● ● ●
SUBGROUPS OF STUDENTS
Low income ● ● ● ●
STUDENTS BY ETHNICITY
Hispanic/Latino ● ● ● ●
White/Other ● ● ● ●SOURCE: AYP release of September 2013, CDE.
Lakeside Union School District

Riverview Elementary School School Accountability Report Card for 2012–2013 Page 7
Here you’ll find a three-year summary of our students’ scores on the California Standards Tests (CST) in selected subjects. We compare our students’ test scores with the results for students in the average elementary school in California. On the following pages we provide more detail for each test, including the scores for different subgroups of students. In addition, we provide links to the California Content Standards on which these tests are based. If you’d like more information about the CST, please contact our principal or our teaching staff. To find grade-level-specific scores, you can refer to the Standardized Testing and Reporting (STAR) Web site. Other tests in the STAR program can be found on the California Department of Education (CDE) Web site.
STUDENT ACHIEVEMENT
BAR GRAPHS BELOW SHOW THESE PROFICIENCY GROUPS (LEFT TO RIGHT):FAR BELOW BASIC BELOW BASIC BASIC PROFICIENT ADVANCED
California Standards Tests
TESTED SUBJECT2012–2013
LOW SCORES HIGH SCORES
2011–2012 LOW SCORES HIGH SCORES
2010–2011 LOW SCORES HIGH SCORES
ENGLISH/LANGUAGE ARTS
Our schoolPercent Proficient or higher
70% 73% 67%
Average elementary schoolPercent Proficient or higher
57% 59% 57%
MATH
Our schoolPercent Proficient or higher
77% 74% 70%
Average elementary schoolPercent Proficient or higher
63% 64% 63%
SCIENCE
Our schoolPercent Proficient or higher
74% 69% 71%
Average elementary schoolPercent Proficient or higher
57% 59% 58%
SOURCE: The scores for the CST are from the spring 2013 test cycle. State average represents elementary schools only. Whenever a school reports fewer than 11 scores for a particular subgroup at any grade level, the CDE suppresses the scores when it releases the data to the public. Missing data makes it impossible for us to compile complete schoolwide results. Therefore, the results published in this report may vary from other published CDE test scores.
Lakeside Union School District

Riverview Elementary School School Accountability Report Card for 2012–2013 Page 8
Frequently Asked Questions About Standardized TestsHAVE THE CALIFORNIA STANDARDS TESTS KEPT UP WITH THE CHANGES IN WHAT WE TEACH? In two subjects, the answer is “yes,” and in two more the answer is “no.” The Common Core transition is the reason for this. The test questions in math and English/language arts in 2012-13 were likely to be less well aligned with the official standards for California curriculum than they were three years ago. But the test questions in social studies and science were just as well aligned in 2012-13 as they were in the past.
WHERE CAN I FIND GRADE-LEVEL REPORTS? Due to space constraints and concern for statistical reliability, we have omitted grade-level detail from these test results. Instead we present results at the schoolwide level. You can view the results of far more students than any one grade level would contain, which also improves their statistical reliability. Grade-level results are online on the STAR Web site. More information about student test scores is available in the Data Almanac that accompanies this report.
WHAT DO THE FIVE PROFICIENCY BANDS MEAN? Test experts assign students to one of these five proficiency levels, based on the number of questions they answer correctly. Our immediate goal is to help students move up one level. Our eventual goal is to enable all students to reach either of the top two bands, Advanced or Proficient. Those who score in the middle band, Basic, have come close to attaining the required knowledge and skills. Those who score in either of the bottom two bands, Below Basic or Far Below Basic, need more help to reach the Proficient level.
HOW HARD ARE THE CALIFORNIA STANDARDS TESTS? Experts consider California’s standards to be among the most clear and rigorous in the country. Just 57 percent of elementary school students scored Proficient or Advanced on the English/language arts test; 63 percent scored Proficient or Advanced in math. You can review the California Content Standards on the CDE Web site.
ARE ALL STUDENTS’ SCORES INCLUDED? No. Only students in grades two through eleven are required to take the CST. When fewer than 11 students in one grade or subgroup take a test, state officials remove their scores from the report. They omit them to protect students’ privacy, as called for by federal law.
CAN I REVIEW SAMPLE TEST QUESTIONS? Sample test questions for the CST are on the CDE’s Web site. These are actual questions used in previous years.
WHERE CAN I FIND ADDITIONAL INFORMATION? The CDE has a wealth of resources on its Web site. The STAR Web site publishes detailed reports for schools and districts, and assistance packets for parents and teachers. This site includes explanations of technical terms, scoring methods, and the subjects covered by the tests for each grade. You’ll also find a guide to navigating the STAR Web site as well as help for understanding how to compare test scores.
Lakeside Union School District

Riverview Elementary School School Accountability Report Card for 2012–2013 Page 9
The graph to the right shows how our students’ scores have changed over the years. We present each year’s results in a vertical bar, with students’ scores arrayed across five proficiency bands. When viewing schoolwide results over time, remember that progress can take many forms. It can be more students scoring in the top proficiency bands (blue); it can also be fewer students scoring in the lower two proficiency bands (brown and red).
You can read the California standards for English/
language arts on the CDE’s Web site.
BAR GRAPHS BELOW SHOW THESE PROFICIENCY GROUPS (LEFT TO RIGHT):FAR BELOW BASIC BELOW BASIC BASIC PROFICIENT ADVANCED
English/Language Arts (Reading and Writing)
GROUP LOW SCORES HIGH SCORES PROFICIENT OR
ADVANCED
STUDENTS TESTED
COMMENTS
SCHOOLWIDE AVERAGE 70% 99% SCHOOLWIDE AVERAGE: About 13 percent more students at our school scored Proficient or Advanced than at the average elementary school in California.
AVERAGE ELEMENTARY SCHOOL IN THE COUNTY
63% 94%
AVERAGE ELEMENTARY SCHOOL IN CALIFORNIA
57% 94%
BAR GRAPHS BELOW SHOW TWO PROFICIENCY GROUPS (LEFT TO RIGHT):
FAR BELOW BASIC, BELOW BASIC, AND BASIC PROFICIENT AND ADVANCED
Subgroup Test Scores
GROUP LOW SCORES HIGH SCORES PROFICIENT OR
ADVANCED
STUDENTS TESTED
COMMENTS
Boys 63% 164 GENDER: About 13 percent more girls than boys at our school scored Proficient or Advanced.
Girls 76% 186
English proficient 71% 344 ENGLISH PROFICIENCY: We cannot compare scores for these two subgroups because the number of English Learners tested was either zero or too small to be statistically significant. English Learners NO DATA AVAILABLE N/A 6
Low income 57% 105 INCOME: About 19 percent fewer students from lower-income families scored Proficient or Advanced than our other students.
Not low income 76% 245
Learning disabled DATA STATISTICALLY UNRELIABLE N/S 26 LEARNING DISABILITIES: We cannot compare scores for these two subgroups because the number of students tested with learning disabilities was too small to be statistically significant. Not learning disabled 72% 323
Hispanic/Latino 59% 112 ETHNICITY: Test scores are likely to vary among students of different ethnic origins. The degree of variance will differ from school to school. Measures of the achievement gap are beyond the scope of this report.White/Other 74% 211
SOURCE: The scores for the CST are from the spring 2013 test cycle. County and state averages represent elementary schools only. Whenever a school reports fewer than 11 scores for a particular subgroup at any grade level, the CDE suppresses the scores when it releases the data to the public. Missing data makes it impossible for us to compile complete schoolwide results. Therefore, the results published in this report may vary from other published CDE test scores.N/A: Not applicable. Either no students took the test, or to safeguard student privacy the CDE withheld all results because very few students took the test in any grade.N/S: Not statistically significant. While we have some data to report, we are suppressing it because the number of valid test scores is not large enough to be meaningful.
Three-Year Trend:
AdvancedProficientBasicBelow BasicFar Below Basic
English/Language Arts
Percentage of studentswho took the test:2011: 94%2012: 95%2013: 99%
SOURCE: CDE STAR research file: 2011, 2012, and 2013.
100
80
60
40
20
0
20
40
60
80
100
2011 2012 2013
Perc
enta
ge
of
stu
den
ts
Lakeside Union School District
Riverview Elementary School School Accountability Report Card for 2012–2013 Page 10
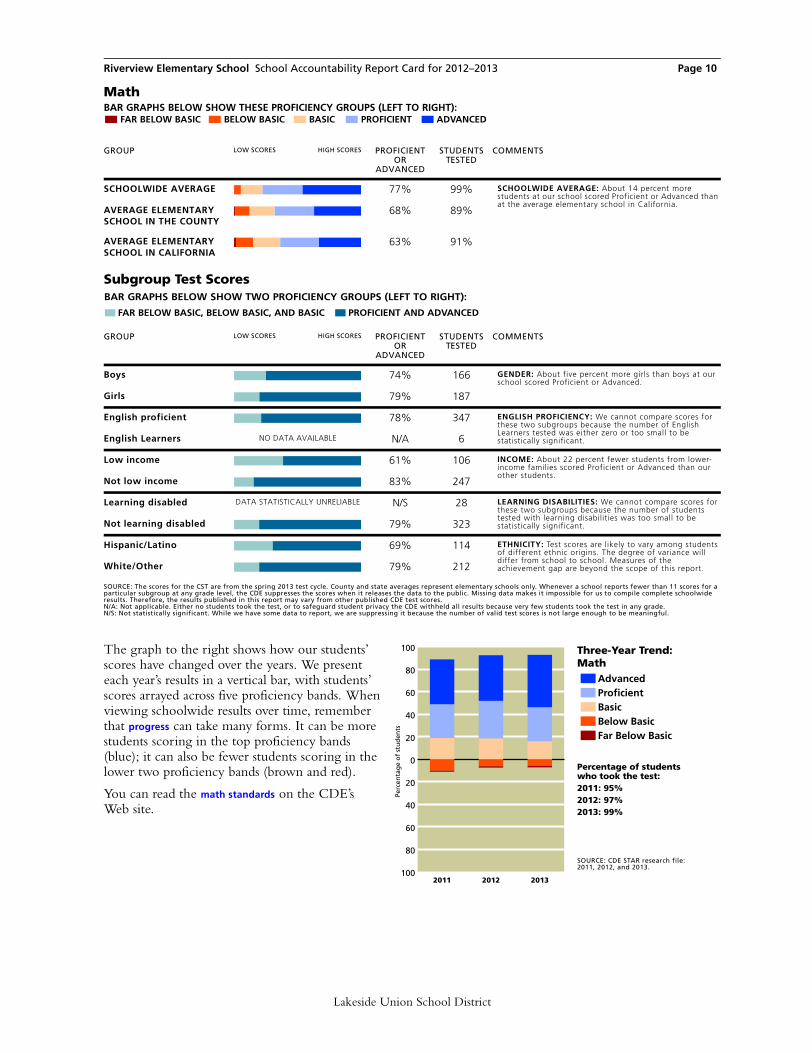
The graph to the right shows how our students’ scores have changed over the years. We present each year’s results in a vertical bar, with students’ scores arrayed across five proficiency bands. When viewing schoolwide results over time, remember that progress can take many forms. It can be more students scoring in the top proficiency bands (blue); it can also be fewer students scoring in the lower two proficiency bands (brown and red).
You can read the math standards on the CDE’s Web site.
BAR GRAPHS BELOW SHOW THESE PROFICIENCY GROUPS (LEFT TO RIGHT):FAR BELOW BASIC BELOW BASIC BASIC PROFICIENT ADVANCED
Math
GROUP LOW SCORES HIGH SCORES PROFICIENT OR
ADVANCED
STUDENTS TESTED
COMMENTS
SCHOOLWIDE AVERAGE 77% 99% SCHOOLWIDE AVERAGE: About 14 percent more students at our school scored Proficient or Advanced than at the average elementary school in California.
AVERAGE ELEMENTARY SCHOOL IN THE COUNTY
68% 89%
AVERAGE ELEMENTARY SCHOOL IN CALIFORNIA
63% 91%
BAR GRAPHS BELOW SHOW TWO PROFICIENCY GROUPS (LEFT TO RIGHT):
FAR BELOW BASIC, BELOW BASIC, AND BASIC PROFICIENT AND ADVANCED
Subgroup Test Scores
GROUP LOW SCORES HIGH SCORES PROFICIENT OR
ADVANCED
STUDENTS TESTED
COMMENTS
Boys 74% 166 GENDER: About five percent more girls than boys at our school scored Proficient or Advanced.
Girls 79% 187
English proficient 78% 347 ENGLISH PROFICIENCY: We cannot compare scores for these two subgroups because the number of English Learners tested was either zero or too small to be statistically significant. English Learners NO DATA AVAILABLE N/A 6
Low income 61% 106 INCOME: About 22 percent fewer students from lower-income families scored Proficient or Advanced than our other students.
Not low income 83% 247
Learning disabled DATA STATISTICALLY UNRELIABLE N/S 28 LEARNING DISABILITIES: We cannot compare scores for these two subgroups because the number of students tested with learning disabilities was too small to be statistically significant. Not learning disabled 79% 323
Hispanic/Latino 69% 114 ETHNICITY: Test scores are likely to vary among students of different ethnic origins. The degree of variance will differ from school to school. Measures of the achievement gap are beyond the scope of this report.White/Other 79% 212
SOURCE: The scores for the CST are from the spring 2013 test cycle. County and state averages represent elementary schools only. Whenever a school reports fewer than 11 scores for a particular subgroup at any grade level, the CDE suppresses the scores when it releases the data to the public. Missing data makes it impossible for us to compile complete schoolwide results. Therefore, the results published in this report may vary from other published CDE test scores.N/A: Not applicable. Either no students took the test, or to safeguard student privacy the CDE withheld all results because very few students took the test in any grade.N/S: Not statistically significant. While we have some data to report, we are suppressing it because the number of valid test scores is not large enough to be meaningful.
Three-Year Trend:
AdvancedProficientBasicBelow BasicFar Below Basic
Math
Percentage of studentswho took the test:2011: 95%2012: 97%2013: 99%
SOURCE: CDE STAR research file: 2011, 2012, and 2013.
100
80
60
40
20
0
20
40
60
80
100
2011 2012 2013
Perc
enta
ge
of
stu
den
ts
Lakeside Union School District

Riverview Elementary School School Accountability Report Card for 2012–2013 Page 11
The graph to the right shows how our students’ scores have changed over the years. We present each year’s results in a vertical bar, with students’ scores arrayed across five proficiency bands. When viewing schoolwide results over time, remember that progress can take many forms. It can be more students scoring in the top proficiency bands (blue); it can also be fewer students scoring in the lower two proficiency bands (brown and red).
The science standards test was administered only to fifth graders. Of course, students in all grade levels study science in these areas: physical science, life science, earth science, and investigation and experimentation. For background, you can review the science standards by going to the CDE’s Web site.
BAR GRAPHS BELOW SHOW THESE PROFICIENCY GROUPS (LEFT TO RIGHT):FAR BELOW BASIC BELOW BASIC BASIC PROFICIENT ADVANCED
Science
GROUP LOW SCORES HIGH SCORES PROFICIENT OR
ADVANCED
STUDENTS TESTED
COMMENTS
SCHOOLWIDE AVERAGE 74% 100% SCHOOLWIDE AVERAGE: About 17 percent more students at our school scored Proficient or Advanced than at the average elementary school in California.
AVERAGE ELEMENTARY SCHOOL IN THE COUNTY
64% 92%
AVERAGE ELEMENTARY SCHOOL IN CALIFORNIA
57% 93%
BAR GRAPHS BELOW SHOW TWO PROFICIENCY GROUPS (LEFT TO RIGHT):
FAR BELOW BASIC, BELOW BASIC, AND BASIC PROFICIENT AND ADVANCED
Subgroup Test Scores
GROUP LOW SCORES HIGH SCORES PROFICIENT OR
ADVANCED
STUDENTS TESTED
COMMENTS
Boys 71% 41 GENDER: About six percent more girls than boys at our school scored Proficient or Advanced.
Girls 77% 43
English proficient 76% 80 ENGLISH PROFICIENCY: We cannot compare scores for these two subgroups because the number of English Learners tested was either zero or too small to be statistically significant. English Learners NO DATA AVAILABLE N/A 4
Low income 57% 30 INCOME: About 26 percent fewer students from lower-income families scored Proficient or Advanced than our other students.
Not low income 83% 54
Learning disabled DATA STATISTICALLY UNRELIABLE N/S 14 LEARNING DISABILITIES: We cannot compare scores for these two subgroups because the number of students tested with learning disabilities was too small to be statistically significant. Not learning disabled 80% 69
Hispanic/Latino 59% 32 ETHNICITY: Test scores are likely to vary among students of different ethnic origins. The degree of variance will differ from school to school. Measures of the achievement gap are beyond the scope of this report.White/Other 83% 48
SOURCE: The scores for the CST are from the spring 2013 test cycle. County and state averages represent elementary schools only. Whenever a school reports fewer than 11 scores for a particular subgroup at any grade level, the CDE suppresses the scores when it releases the data to the public. Missing data makes it impossible for us to compile complete schoolwide results. Therefore, the results published in this report may vary from other published CDE test scores.N/A: Not applicable. Either no students took the test, or to safeguard student privacy the CDE withheld all results because very few students took the test in any grade.N/S: Not statistically significant. While we have some data to report, we are suppressing it because the number of valid test scores is not large enough to be meaningful.
Three-Year Trend:
AdvancedProficientBasicBelow BasicFar Below Basic
Science
Percentage of studentswho took the test:2011: 91%2012: 90%2013: 100%
SOURCE: CDE STAR research file: 2011, 2012, and 2013.
100
80
60
40
20
0
20
40
60
80
100
2011 2012 2013
Perc
enta
ge
of
stu
den
ts
Lakeside Union School District

Riverview Elementary School School Accountability Report Card for 2012–2013 Page 12
Students’ English Language SkillsAt Riverview, 98 percent of students were considered to be proficient in English, compared with 70 percent of elementary school students in California overall.
Languages Spoken atHome by English LearnersPlease note that this table describes the home languages of just the eight students classified as English Learners. At Riverview, the language these students most often speak at home is Spanish. In California it’s common to find English Learners in classes with students who speak English well. When you visit our classrooms, ask our teachers how they work with language differences among their students.
EthnicityMost students at Riverview identify themselves as White. The state of California allows citizens to choose more than one ethnic identity, or to select “two or more races” or “decline to state.” As a consequence, the sum of all responses rarely equals 100 percent.
Family Income and EducationThe free or reduced-price meal subsidy goes to students whose families earned less than $42,643 a year (based on a family of four) in the 2012–2013 school year. At Riverview, 28 percent of the students qualified for this program, compared with 61 percent of students in California.
The parents of 87 percent of the students at Riverview have attended college and 58 percent have a college degree. This information can provide some clues to the level of literacy children bring to school. One precaution is that the students themselves provide this data when they take the battery of standardized tests each spring, so it may not be completely accurate. About 71 percent of our students provided this information.
STUDENTS
LANGUAGE SKILLSOUR
SCHOOLCOUNTYAVERAGE
STATEAVERAGE
English-proficient students 98% 71% 70%
English Learners 2% 29% 30%
SOURCE: Language census for the 2012–2013 school year. County and state averages represent elementary schools only.
LANGUAGEOUR
SCHOOLCOUNTYAVERAGE
STATEAVERAGE
Spanish 88% 81% 84%
Vietnamese 0% 3% 3%
Cantonese 0% 0% 1%
Hmong 0% 0% 1%
Filipino/Tagalog 0% 3% 1%
Korean 0% 1% 1%
Khmer/Cambodian 0% 0% 0%
All other 12% 12% 9%
SOURCE: Language census for the 2012–2013 school year. County and state averages represent elementary schools only.
ETHNICITYOUR
SCHOOLCOUNTYAVERAGE
STATEAVERAGE
African American 1% 6% 6%
Asian American/Pacific Islander
2% 10% 11%
Hispanic/Latino 33% 46% 54%
White 61% 33% 25%
SOURCE: California Longitudinal Pupil Achievement Data System (CALPADS), October 2012. County and state averages represent elementary schools only.
FAMILY FACTORSOUR
SCHOOLCOUNTYAVERAGE
STATEAVERAGE
Low-income indicator 28% 52% 61%
Parents with some college 87% 66% 58%
Parents with college degree 58% 42% 34%
SOURCE: The free and reduced-price lunch information is gathered by most districts in October. This data is from the 2012–2013 school year. Parents’ education level is collected in the spring at the start of testing. Rarely do all students answer these questions.
Lakeside Union School District

Riverview Elementary School School Accountability Report Card for 2012–2013 Page 13
Average Class SizesBecause funding for class-size reduction was focused on the early grade levels, our school’s class sizes, like those of most elementary schools, differ across grade levels.
The average class size at Riverview varies across grade levels from a low of 8 students to a high of 24. Our average class size schoolwide is 21 students.
CLIMATE FOR LEARNING
AVERAGE CLASS SIZE BY GRADEOUR
SCHOOLOUR
DISTRICT
Kindergarten 8 19
First grade 20 18
Second grade 24 21
Third grade 22 19
Fourth grade 24 21
Fifth grade 21 25
SOURCE: California Department of Education, SARC Research File. District averages represent elementary schools only.
Lakeside Union School District

Riverview Elementary School School Accountability Report Card for 2012–2013 Page 14
PLEASE NOTE: Comparative data (county average and state averages) for some of the data reported in the SARC is unavailable as of December 2013.
“HIGHLY QUALIFIED” TEACHERS: The federal law known as No Child Left Behind (NCLB) requires districts to report the number of teachers considered to be “highly qualified.” These “highly qualified” teachers must have a full credential, a bachelor’s degree, and, if they are teaching a core subject (such as reading, math, science, or social studies), they must also demonstrate expertise in that field. The table above shows the percentage of core courses taught by teachers who are considered to be less than “highly qualified.” There are exceptions, known as the High Objective Uniform State Standard of Evaluation (HOUSSE) rules, that allow some veteran teachers to meet the “highly qualified” test who wouldn’t otherwise do so.
CREDENTIAL STATUS OF TEACHERS: Teachers who lack full credentials are working under the terms of an emergency permit, an internship credential, or a waiver. They should be working toward their credential, and they are allowed to teach in the meantime only if the school board approves. None of our teachers was working without full credentials.
LEADERSHIP, TEACHERS, AND STAFF
Indicators of Teachers Who May Be Underprepared
KEY FACTOR DESCRIPTIONOUR
SCHOOLCOUNTYAVERAGE
STATEAVERAGE
Core courses taught by a teacher not meeting NCLB standards
Percentage of core courses not taught by a “highly qualified” teacher according to federal standards in NCLB
0% N/A 0%
Fully credentialed teachers
Percentage of staff holding a full, clear authorization to teach at the elementary or secondary level
100% N/A N/A
Teachers lacking a full credential
Percentage of teachers without a full, clear credential
0% N/A N/A
SOURCE: Data on NCLB standards is from the California Department of Education, SARC research file. Information on teachers lacking a full credential provided by the school district.
Lakeside Union School District

Riverview Elementary School School Accountability Report Card for 2012–2013 Page 15
Districtwide Distribution of Teachers Who Are Not “Highly Qualified”Here, we report the percentage of core courses in our district whose teachers are considered to be less than “highly qualified” by NCLB’s standards. We show how these teachers are distributed among schools according to the percentage of low-income students enrolled.
When more than 40 percent of the students in a school are receiving subsidized lunches, that school is considered by the California Department of Education to be a school with higher concentrations of low-income students. When less than 25 percent of the students in a school are receiving subsidized lunches, that school is considered by the CDE to be a school with lower concentrations of low-income students.
Specialized Resource StaffThe table to the right lists the number of full-time equivalent qualified support personnel who provide counseling and other pupil support services in our school. These specialists often work part time at our school and some may work at more than one school in our district. For more details on statewide ratios of counselors, psychologists, or
other pupil services staff to students, see the California Department of Education (CDE) Web site. Library facts and frequently asked questions are also available there.
DISTRICT FACTOR DESCRIPTION
CORE COURSES
NOT TAUGHT BY
HQT IN DISTRICT
Districtwide Percentage of core courses not taught by “highly qualified” teachers (HQT)
0%
Schools with more than 40% of students from lower-income homes
Schools whose core courses are not taught by “highly qualified” teachers
0%
Schools with less than 25% of students from lower-income homes
Schools whose core courses are not taught by “highly qualified” teachers
0%
SOURCE: Data is from the California Department of Education, SARC research file.
STAFF POSITIONSTAFF (FTE)
Academic counselors 0.0
Behavioral/career counselors
0.0
Librarians and media staff
0.3
Psychologists 0.7
Social workers 0.4
Nurses 0.4
Speech/language/hearing specialists
1.0
Resource specialists 0.0
SOURCE: Data provided by the school district.
TECHNICAL NOTE ON DATA RECENCY: All data is the most current available as of December 2013. The CDE may releaseadditional or revised data for the 2012–2013 school year after the publication date of this report. We rely on the followingsources of information from the California Department of Education: California Longitudinal Pupil Achievement Data System(CALPADS) (October 2012); Language Census (March 2013); California Standards Tests (spring 2013 test cycle); AcademicPerformance Index (September 2013 growth score release); Adequate Yearly Progress (September 2013). DISCLAIMER: School Wise Press, the publisher of this accountability report, makes every effort to ensure the accuracy of thisinformation but offers no guarantee, express or implied. While we do our utmost to ensure the information is complete, wemust note that we are not responsible for any errors or omissions in the data. Nor are we responsible for any damages caused bythe use of the information this report contains. Before you make decisions based on this information, we strongly recommendthat you visit the school and ask the principal to provide the most up-to-date facts available.
rev20140107_37-68189-6038384e/21474
Lakeside Union School District

Riverview Elementary School School Accountability Report Card for 2012–2013 Page 16
Lakeside Union School District

Riverview Elementary School School Accountability Report Card for 2012–2013
»
Page 17
Adequacy of Key Resources 2013—2014
Here you’ll find key facts about our teachers, textbooks, and facilities during the school year in progress, 2013–2014. Please note that these facts are based on evaluations our staff conducted in accordance with the Williams legislation.
This section also contains information about 2012–2013 staff development days, and, for high schools, percentages of seniors who met our district’s graduation requirements.
Lakeside Union School District

Riverview Elementary School School Accountability Report Card for 2012–2013
TEACHERS
Teacher Vacancies
KEY FACTOR 2011–2012 2012–2013 2013–2014
TEACHER VACANCIES OCCURRING AT THE BEGINNING OF THE SCHOOL YEAR
Total number of classes at the start of the year 23 25 28
Number of classes that lacked a permanently assigned teacher within the first 20 days of school
0 0 0
TEACHER VACANCIES OCCURRING DURING THE SCHOOL YEAR
Number of classes where the permanently assigned teacher left during the year
0 0 0
Number of those classes where you replaced the absent teacher with a single new teacher
0 0 0
NOTES:
There are two general circumstances that can lead to the unfortunate case of a classroom without a full-time, permanently assigned teacher. Within the first 20 days of the start of school, we can be surprised by too many students showing up for school or too few teachers showing up to teach. After school starts, however, teachers can also be surprised by sudden changes: family emergencies, injuries, accidents, etc. When that occurs, it is our school’s and our district’s responsibility to fill that teacher’s vacancy with a qualified, full-time, and permanently assigned replacement. For that reason, we report teacher vacancies in two parts: at the start of school and after the start of school.
Lakeside Union School District
Page 18
Riverview Elementary School School Accountability Report Card for 2012–2013
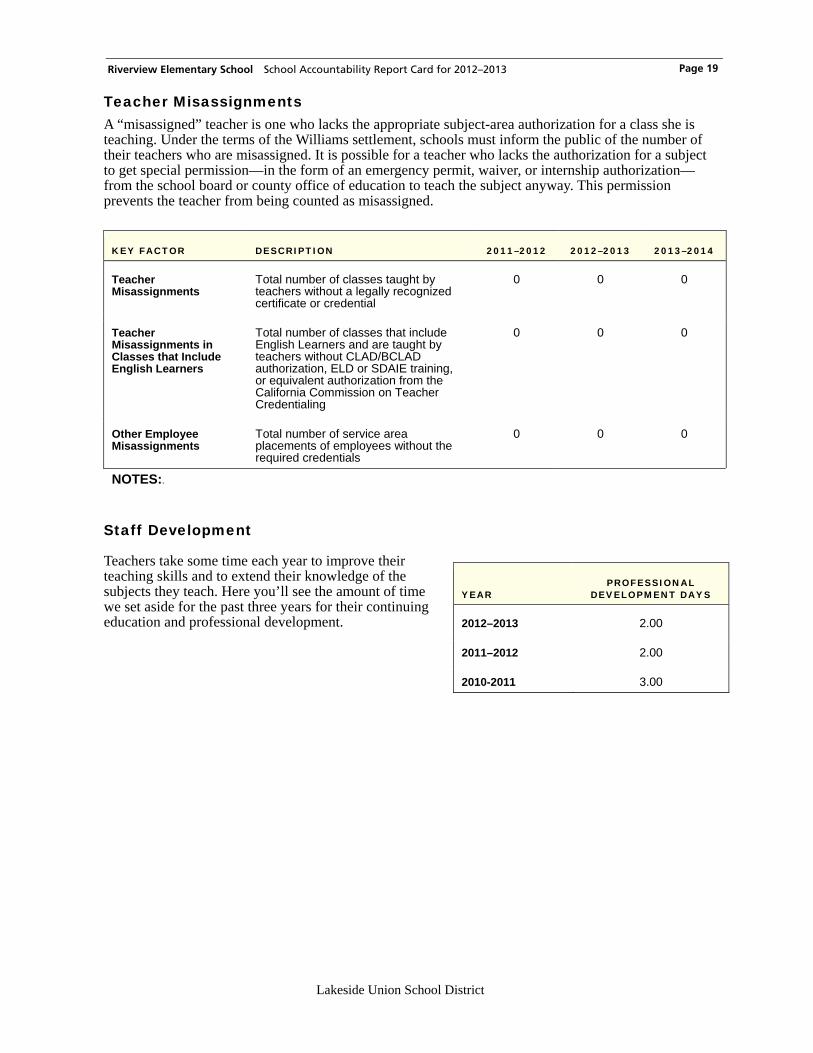
Teacher Misassignments A “misassigned” teacher is one who lacks the appropriate subject-area authorization for a class she is teaching. Under the terms of the Williams settlement, schools must inform the public of the number of their teachers who are misassigned. It is possible for a teacher who lacks the authorization for a subject to get special permission—in the form of an emergency permit, waiver, or internship authorization—from the school board or county office of education to teach the subject anyway. This permission prevents the teacher from being counted as misassigned.
KEY FACTOR DESCRIPTION 2011–2012 2012–2013 2013–2014
Teacher Misassignments
Total number of classes taught by teachers without a legally recognized certificate or credential
0 0 0
Teacher Misassignments in Classes that Include English Learners
Total number of classes that include English Learners and are taught by teachers without CLAD/BCLAD authorization, ELD or SDAIE training, or equivalent authorization from the California Commission on Teacher Credentialing
0 0 0
Other Employee Misassignments
Total number of service area placements of employees without the required credentials
0 0 0
NOTES:.
Staff Development
Teachers take some time each year to improve their teaching skills and to extend their knowledge of the subjects they teach. Here you’ll see the amount of time we set aside for the past three years for their continuing education and professional development.
PROFESSIONAL DEVELOPMENT DAYS YEAR
2.00 2012–2013
Lakeside Union School District
2.00 2011–2012
2010-2011 3.00
Page 19
Riverview Elementary School School Accountability Report Card for 2012–2013
Lakeside Union School District
TEXTBOOKS
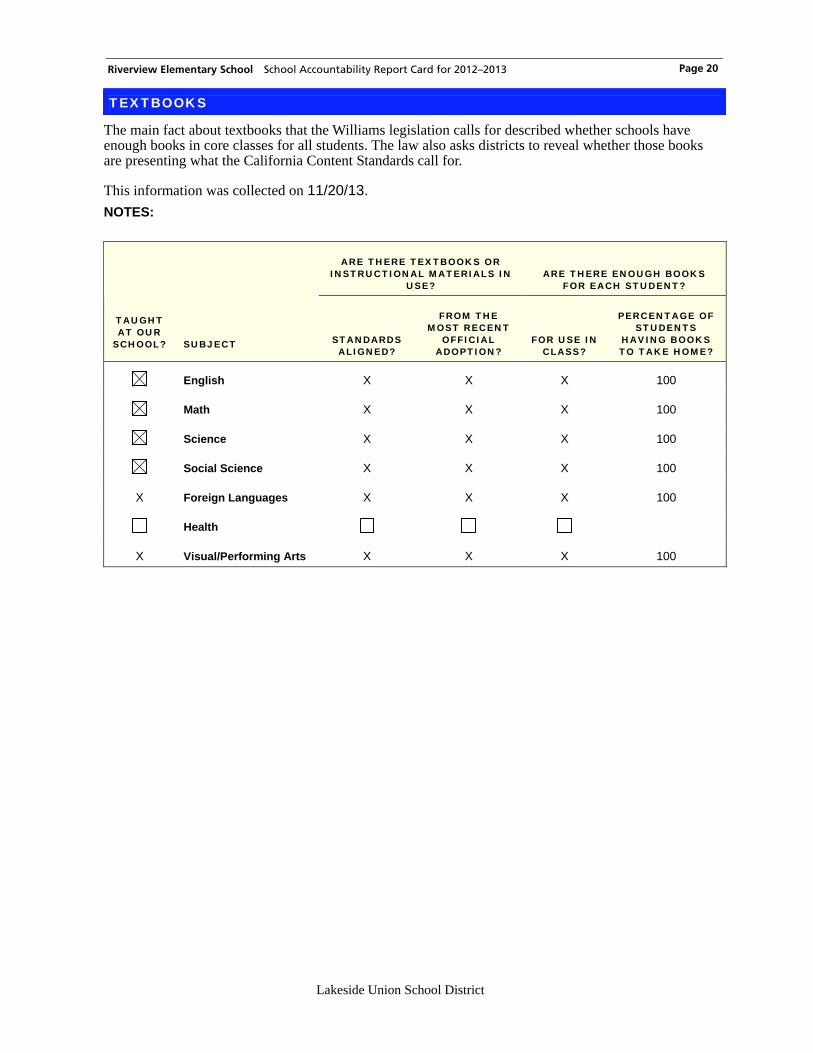
The main fact about textbooks that the Williams legislation calls for described whether schools have enough books in core classes for all students. The law also asks districts to reveal whether those books are presenting what the California Content Standards call for. This information was collected on 11/20/13. NOTES:
ARE THERE TEXTBOOKS OR INSTRUCTIONAL MATERIALS IN
USE? ARE THERE ENOUGH BOOKS
FOR EACH STUDENT?
TAUGHT AT OUR
SCHOOL? SUBJECT STANDARDS ALIGNED?
FROM THE MOST RECENT
OFFICIAL ADOPTION?
FOR USE IN CLASS?
PERCENTAGE OF STUDENTS
HAVING BOOKS TO TAKE HOME?
English X X X 100
Math X X X 100
Science X X X 100
Social Science X X X 100
X Foreign Languages X X X 100
Health
X Visual/Performing Arts X X X 100
Page 20

Riverview Elementary School School Accountability Report Card for 2012–2013
Lakeside Union School District
Textbooks in Use Here are some of the textbooks we use for our core courses.
SUBJECT AND TITLE PUBLISHER YEAR
ADOPTED
ENGLISH/LANGUAGE ARTS
California Treasures 2010 McMillan/McGraw Hill 2010
CA Tesoros (Spanish) McMillan/McGraw Hill 2010
MATH
enVisionMATH™© Scott Foresman-Addison Wesley 2009
SCIENCE
Ciencias - Spanish Pearson 2007
Full Option Science System Delta Education
Science and Technology for Children Carolina Biological
SOCIAL SCIENCE
History Social Science for California English and Spanish
Scott Foresman 2006
Page 21

Riverview Elementary School School Accountability Report Card for 2012–2013
Lakeside Union School District
FACILITIES
To determine the condition of our facilities, our district sent experts from our facilities team to perform an inspection using a survey called the Facilities Inspection Tool, which is issued by the Office of Public School Construction. Based on that survey, we’ve answered the questions you see on this report. Please note that the information reflects the condition of our buildings as of the date of the report. Since that time, those conditions may have changed. INSPECTORS AND ADVISORS: This report was completed in January, 2013 by Todd Owens. The most recent facilities inspection occurred in January, 2013. ADDITIONAL INSPECTORS: There were no other inspectors used in the completion of this form.
AREA RATING REPAIR NEEDED AND ACTION TAKEN OR PLANNED
Overall Rating EXCELLENT No apparent problems
A. Systems EXCELLENT
1. Gas No apparent problems
2. Mechanical/HVAC No apparent problems
3. Sewer No apparent problems
B. Interior Surfaces EXCELLENT
1. Interior Surfaces No apparent problems
C. Cleanliness EXCELLENT
1. Overall cleanliness No apparent problems
2. Pest/Vermin No apparent problems
D. Electrical Components EXCELLENT
1. Electrical Components No apparent problems
E. Rest Rooms/Fountains EXCELLENT
1. Rest Rooms No apparent problems
2. Drinking Fountains No apparent problems
F. Safety EXCELLENT
1. Fire Safety No apparent problems
2. Hazardous Materials No apparent problems
Page 22
Riverview Elementary School School Accountability Report Card for 2012–2013
Lakeside Union School District
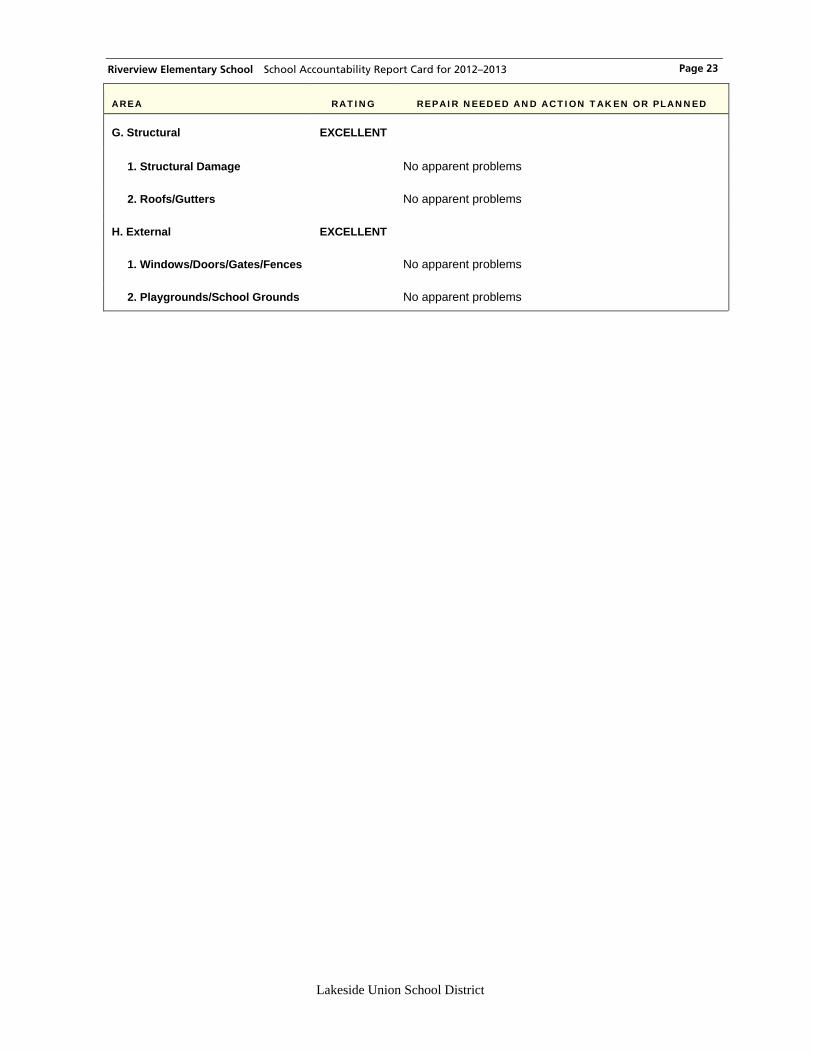
AREA RATING REPAIR NEEDED AND ACTION TAKEN OR PLANNED
G. Structural EXCELLENT
1. Structural Damage No apparent problems
2. Roofs/Gutters No apparent problems
H. External EXCELLENT
1. Windows/Doors/Gates/Fences No apparent problems
2. Playgrounds/School Grounds No apparent problems
Page 23

Riverview Elementary School School Accountability Report Card for 2012–2013
Lakeside Union School District
SCHOOL FINANCES, 2011–2012
We are required by the California Dept. of Education to report financial data from the 2011–2012 school year. More recent financial data is available on request from the district office.
Spending per Student To make comparisons possible across schools and districts of varying sizes, we first report our overall spending per student. We base our calculations on our average daily attendance (ADA). We’ve broken down expenditures by the type of funds used to pay for them. Unrestricted funds can be used for any lawful purpose. Restricted funds, however, must be spent for specific purposes set out by legal requirements or the donor. Examples include funding for instructional materials, economic impact aid, and teacher and principal training funds. Next to the figures for the district and state averages, we show the percentage by which the school’s spending varies from the district and state averages. For example, we calculate the school’s variance from the district average using this formula:
(SCHOOL AMOUNT – DISTRICT AVERAGE)
DISTRICT AVERAGE
TYPE OF FUNDS OUR
SCHOOL DISTRICT AVERAGE
SCHOOL-TO-DISTRICT VARIANCE
STATE AVERAGE
SCHOOL-TO-STATE VARIANCE
Unrestricted funds ($/student) $4,179 $6,030 -31% $5,596 -25%
Restricted funds ($/student) $180 $694 -74% $2,786 -94%
Total ($/student) $4,359 $6,724 -35% $8,382 -48%
Compensation for Staff with Teaching Credentials To make comparisons possible across schools and districts of varying sizes, we report our compensation per full-time equivalent (FTE) certificated staff.* A teacher/administrator/pupil services person who works full-time counts as 1.0 FTE. Those who work only half time count as 0.5 FTE.
CERTIFICATED STAFF* OUR
SCHOOL DISTRICT AVERAGE
SCHOOL-TO-DISTRICT VARIANCE
STATE AVERAGE
SCHOOL-TO-STATE VARIANCE
Salary ($/certificated staff) 54,824 69,782 $71,848
Benefits ($/certificated staff) $16,999
Total ($/certificated staff) $88,847
* A certificated staff person is a school employee who is required by the state to hold teaching credentials, including full-time, part-time, substitute, or temporary teachers and most administrators.
Page 24

Riverview Elementary School School Accountability Report Card for 2012–2013
»
Page 25
Data Almanac
This Data Almanac provides additional information about students, teachers, student performance, accountability, and district expenditures.
Lakeside Union School District

Riverview Elementary School School Accountability Report Card for 2012–2013 Page 26
STUDENTS AND TEACHERS
Student Enrollment by Ethnicity and Other Characteristics
The ethnicity of our students, estimates of their family income and education level, their English fluency, and
their learning-related disabilities.
Student Enrollment by Grade Level
Number of students enrolled in each grade level at our school.
GROUP ENROLLMENT
Number of students 494
Black/African American 1%
American Indian or Alaska Native 1%
Asian 1%
Filipino 0%
Hispanic or Latino 33%
Pacific Islander 1%
White (not Hispanic) 61%
Two or more races 3%
Ethnicity not reported 0%
Socioeconomically disadvantaged 28%
English Learners 5%
Students with disabilities 8%
SOURCE: All but the last three lines are from the annual census, CALPADS, October 2012. Data about students who are socioeconomically disadvantaged, English Learners, or learning disabled come from the School Accountability Report Card unit of the California Department of Education.
GRADE LEVEL STUDENTS
Kindergarten 15
Grade 1 118
Grade 2 96
Grade 3 109
Grade 4 71
Grade 5 85
Grade 6 0
Grade 7 0
Grade 8 0
Grade 9 0
Grade 10 0
Grade 11 0
Grade 12 0
SOURCE: CALPADS, October 2012.
Lakeside Union School District

Riverview Elementary School School Accountability Report Card for 2012–2013 Page 27
Average Class Size by Grade Level
Average Class Size by Grade Level, DetailThe number of classrooms that fall into each range of class sizes.
GRADE LEVEL 2010–2011 2011–2012 2012–2013
Kindergarten 22 22 8
Grade 1 22 22 20
Grade 2 22 24 24
Grade 3 22 24 22
Grade 4 26 27 24
Grade 5 26 27 21
Grade 6 N/A N/A N/A
Grade 7 N/A N/A N/A
Grade 8 N/A N/A N/A
Combined K–3 N/A N/A N/A
Combined 3–4 N/A N/A N/A
Combined 4–8 N/A N/A N/A
Other 24 N/A N/A
SOURCE: CALPADS, October 2012.
2010–2011 2011–2012 2012–2013
GRADE LEVEL 1–20 21–32 33+ 1–20 21–32 33+ 1–20 21–32 33+
Kindergarten 2 1 0 3 2 0 2 0 0
Grade 1 1 2 0 2 3 0 1 5 0
Grade 2 1 3 0 1 3 0 1 3 0
Grade 3 2 0 0 0 3 0 1 4 0
Grade 4 0 1 0 0 3 0 1 2 0
Grade 5 0 1 0 0 2 0 1 3 0
Grade 6 N/A N/A N/A N/A N/A N/A N/A N/A N/A
Combined K–3 N/A N/A N/A N/A N/A N/A N/A N/A N/A
Combined 3–4 N/A N/A N/A N/A N/A N/A N/A N/A N/A
Combined 4–8 N/A N/A N/A N/A N/A N/A N/A N/A N/A
Other N/A N/A N/A N/A N/A N/A N/A N/A N/A
SOURCE: CALPADS, October 2012.
Lakeside Union School District

Riverview Elementary School School Accountability Report Card for 2012–2013 Page 28
Teacher CredentialsThe number of teachers assigned to the school with a full credential and without a full credential,
for both our school and the district.
Physical FitnessStudents in grades five, seven, and nine take the California Fitness Test each year. This test measures students’ aerobic capacity, body composition, muscular strength, endurance, and flexibility using six different tests. The table shows the percentage of students at our school who scored within the “healthy fitness zone” on four, five, and all six tests. More information about physical fitness testing and standards is available on the CDE Web site.
Suspensions and ExpulsionsAt times we find it necessary to suspend students who break school rules. We report only suspensions in which students are sent home for a day or longer. We do not report in-school suspensions, in which students are removed from one or more classes during a single school day. Expulsion is the most serious consequence we can impose. Expelled students are removed from the school permanently and denied the opportunity to continue learning here.
During the 2012–2013 school year, we had seven suspension incidents. We had no incidents of expulsion. To make it easy to compare our suspensions and expulsions to those of other schools, we represent these events as a ratio (incidents per 100 students) in this report. Please note that multiple incidents may involve the same student.
SCHOOL DISTRICT
TEACHERS 2010–2011 2011–2012 2012–2013 2012–2013
With Full Credential 23 23 25 264
Without Full Credential 1 1 0 0
SOURCE: Information provided by school district.
PERCENTAGE OF STUDENTS MEETING HEALTHY FITNESS ZONES
GRADE LEVEL
MET FOUR OR MORE
STANDARDS
MET FIVE OR MORE
STANDARDSMET ALL SIX STANDARDS
Grade 5 86% 80% 51%
Grade 7 N/A N/A N/A
Grade 9 N/A N/A N/A
SOURCE: Physical fitness test data is produced annually as schools test their students on the six Fitnessgram Standards. This information is from the 2012–2013 school year.
KEY FACTOROUR
SCHOOLDISTRICTAVERAGE
STATEAVERAGE
Suspensions per 100 students
2012–2013 1 2 N/A
2011–2012 1 3 N/A
2010–2011 1 2 5
Expulsions per 100 students
2012–2013 0 0 N/A
2011–2012 0 0 N/A
2010–2011 0 0 0
SOURCE: Information for the two most recent years provided by the school district. Prior data is from the Consolidated Application published by the California Department of Education. The numbers above are a ratio of suspension or expulsion events, per 100 students enrolled. District and state averages represent elementary schools only.
Lakeside Union School District

Riverview Elementary School School Accountability Report Card for 2012–2013 Page 29
California Standardized Testing and Reporting ProgramThe California Standards Tests (CST) show how well students are learning what the state content standards require. The CST include English/language arts and mathematics in grades two through five and science in grade five. We also include results from the California Modified Assessment and California Alternative Performance Assessment (CAPA).
STAR Test Results for All Students: Three-Year ComparisonThe percentage of students achieving at the Proficient or Advanced level
(meeting or exceeding the state standards) for the most current three-year period.
STAR Test Results by Student Subgroup: Most Recent YearThe percentage of students, by subgroup, achieving at the Proficient or Advanced level
(meeting or exceeding the state standards) for the most recent testing period.
STUDENT PERFORMANCE
SCHOOLPERCENT PROFICIENT OR
ADVANCED
DISTRICTPERCENT PROFICIENT OR
ADVANCED
STATEPERCENT PROFICIENT OR
ADVANCED
SUBJECT 2011 2012 2013 2011 2012 2013 2011 2012 2013
English/language arts
66% 72% 70% 57% 60% 57% 54% 56% 55%
Mathematics 69% 74% 77% 51% 53% 54% 49% 50% 50%
Science 71% 69% 74% 65% 66% 67% 57% 60% 59%
SOURCE: STAR results, spring 2013 test cycle, as interpreted and published by the CDE unit responsible for School Accountability Report Cards.
STUDENTS SCORING PROFICIENT OR ADVANCED
STUDENT GROUP
ENGLISH/LANGUAGE ARTS
2012–2013MATHEMATICS
2012–2013SCIENCE
2012–2013
African American N/A N/A N/A
American Indian or Alaska Native N/A N/A N/A
Asian N/A N/A N/A
Filipino N/A N/A N/A
Hispanic or Latino 59% 69% 59%
Pacific Islander or Native Hawaiian N/A N/A N/A
White (not Hispanic) 74% 79% 83%
Two or more Races 82% 91% N/A
Boys 62% 74% 71%
Girls 76% 79% 77%
Socioeconomically disadvantaged 56% 61% 57%
English Learners N/A N/A N/A
Students with disabilities 43% 47% 43%
Receives migrant education services N/A N/A N/A
SOURCE: STAR results, spring 2013 test cycle, as interpreted and published by the CDE unit responsible for School Accountability Report Cards.
Lakeside Union School District

Riverview Elementary School School Accountability Report Card for 2012–2013 Page 30
California Academic Performance Index (API)The Academic Performance Index (API) is an annual measure of the academic performance and progress of schools in California. APIs range from 200 to 1000, with a statewide target of 800. Detailed information about the API can be found on the CDE Web site at http://www.cde.ca.gov/ta/ac/ap/.
API Ranks: Three-Year ComparisonThe state assigns statewide and similar-schools API ranks for all schools. The API ranks range from 1 to 10. A statewide rank of 1 means that the school has an API in the lowest 10 percent of all elementary schools in the state, while a statewide rank of 10 means that the school has an API in the highest 10 percent of all elementary schools in the state. The similar-schools API rank reflects how a school compares with 100 statistically matched schools that have similar teachers and students.
API Changes by Subgroup: Three-Year ComparisonAPI changes for all students and student subgroups: the actual API changes in points added or lost for the past three years, and the most recent API. Note: “N/A” means that the student group is not numerically significant.
ACCOUNTABILITY
API RANK 2010–2011 2011–2012 2012–2013
Statewide rank 6 7 8
Similar-schools rank 3 5 2
SOURCE: The API Base Report from May 2013.
ACTUAL API CHANGE API
SUBGROUP 2010–2011 2011–2012 2012–2013 2012–2013
All students at the school +31 +22 +4 879
Black/African American N/A N/A N/A N/A
American Indian or Alaska Native N/A N/A N/A N/A
Asian N/A N/A N/A N/A
Filipino N/A N/A N/A N/A
Hispanic or Latino +13 +61 -11 837
Pacific Islander N/A N/A N/A N/A
White (non Hispanic) +43 -5 +9 897
Two or more races N/A N/A N/A 921
Socioeconomically disadvantaged +27 +60 -27 811
English Learners -7 +116 -32 822
Students with disabilities +61 +79 -34 739
SOURCE: The API Growth Report as released in the Accountability Progress Report in September 2013. Students from all elementary, middle and high schools are included in the district and state columns for comparison.
Lakeside Union School District
Riverview Elementary School School Accountability Report Card for 2012–2013 Page 31
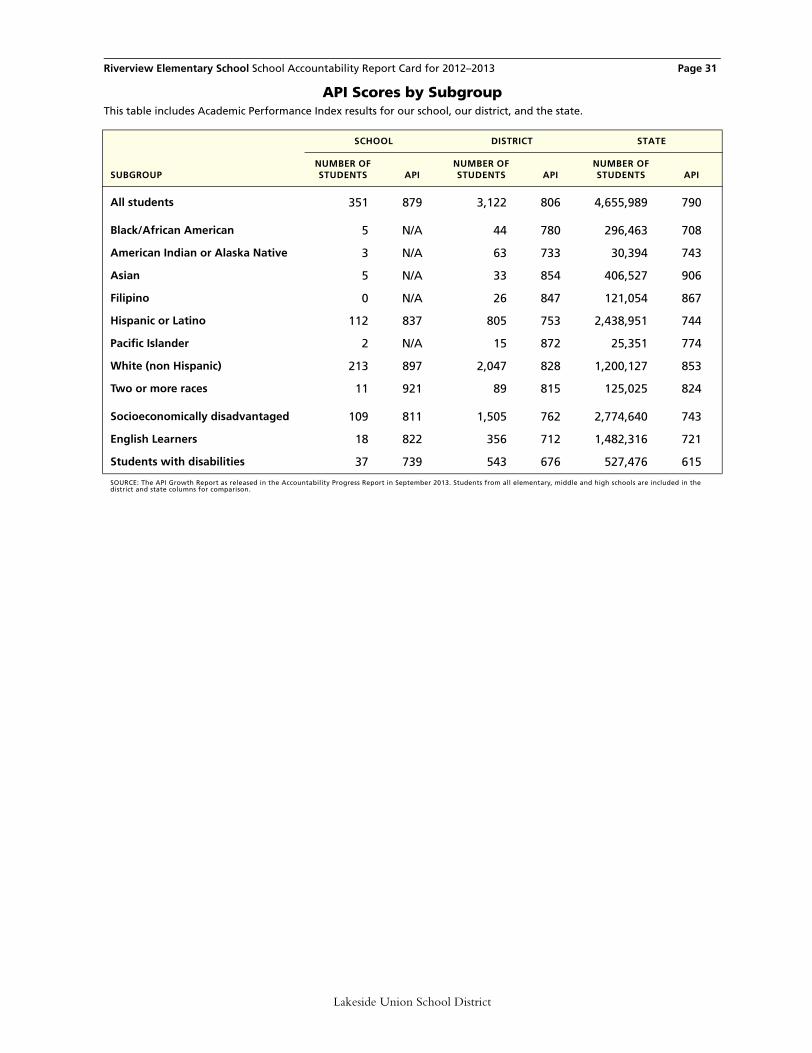
API Scores by SubgroupThis table includes Academic Performance Index results for our school, our district, and the state.
SCHOOL DISTRICT STATE
SUBGROUPNUMBER OF STUDENTS API
NUMBER OF STUDENTS API
NUMBER OF STUDENTS API
All students 351 879 3,122 806 4,655,989 790
Black/African American 5 N/A 44 780 296,463 708
American Indian or Alaska Native 3 N/A 63 733 30,394 743
Asian 5 N/A 33 854 406,527 906
Filipino 0 N/A 26 847 121,054 867
Hispanic or Latino 112 837 805 753 2,438,951 744
Pacific Islander 2 N/A 15 872 25,351 774
White (non Hispanic) 213 897 2,047 828 1,200,127 853
Two or more races 11 921 89 815 125,025 824
Socioeconomically disadvantaged 109 811 1,505 762 2,774,640 743
English Learners 18 822 356 712 1,482,316 721
Students with disabilities 37 739 543 676 527,476 615
SOURCE: The API Growth Report as released in the Accountability Progress Report in September 2013. Students from all elementary, middle and high schools are included in the district and state columns for comparison.
Lakeside Union School District

Riverview Elementary School School Accountability Report Card for 2012–2013 Page 32
Federal Adequate Yearly Progress (AYP) and Intervention ProgramsThe federal law known as No Child Left Behind requires that all schools and districts meet all three of the following criteria in order to attain Adequate Yearly Progress (AYP): (a) a 95-percent participation rate on the state’s tests (b) a CDE-mandated percentage of students scoring Proficient or higher on the state’s English/language arts and mathematics tests (c) an API of at least 770 or growth of at least one point.
AYP for the DistrictWhether the district met the federal requirement for AYP overall,
and whether the district met each of the AYP criteria.
Intervention Program: District Program Improvement (PI)Districts receiving federal Title I funding enter Program Improvement (PI) if they do not make AYP for two consecutive years in the same content area (English/language arts or mathematics)and for each grade span or on the same indicator (API or graduation rate). After entering PI, districts advance to the next level of intervention with each additional year that they do not make AYP.
AYP CRITERIA DISTRICT
Overall No
Graduation rate N/A
Participation rate in English/language arts Yes
Participation rate in mathematics Yes
Percent Proficient in English/language arts No
Percent Proficient in mathematics No
Met Academic Performance Index (API) Yes
SOURCE: The AYP Report as released in the Accountability Progress Report in September 2013.
INDICATOR DISTRICT
PI stage 1 of 3
The year the district entered PI 2013
Number of schools currently in PI 4
Percentage of schools currently in PI 31%
SOURCE: The Program Improvement Report as released in the Accountability Progress Report in September 2013.
Lakeside Union School District

Riverview Elementary School School Accountability Report Card for 2012–2013 Page 33
Total expenses include only the costs related to direct educational services to students. This figure does not include food services, land acquisition, new construction, and other expenditures unrelated to core educational purposes. The expenses-per-student figure is calculated by dividing total expenses by the district’s average daily attendance (ADA). More information is available on the CDE’s Web site.
District Salaries, 2011–2012This table reports the salaries of teachers and administrators in our district for the 2011–2012 school year. This table compares our average salaries with those in districts like ours, based on both enrollment and the grade level of our students. In addition, we report the percentage of our district’s total budget dedicated to teachers’ and administrators’ salaries. The costs of health insurance, pensions, and other indirect compensation are not included.
DISTRICT EXPENDITURES
CATEGORY OF EXPENSE OUR DISTRICT SIMILAR DISTRICTS ALL DISTRICTS
FISCAL YEAR 2011–2012
Total expenses $36,151,892 $8,575,019,725 $46,420,178,248
Expenses per student $8,701 $7,846 $8,382
FISCAL YEAR 2010–2011
Total expenses $35,173,318 $8,497,573,732 $46,278,595,991
Expenses per student $8,653 $7,789 $8,323
SOURCE: Fiscal Services Division, California Department of Education.
SALARY INFORMATIONDISTRICTAVERAGE
STATEAVERAGE
Beginning teacher’s salary
$43,593 $41,327
Midrange teacher’s salary $64,864 $63,903
Highest-paid teacher’s salary
$97,193 $81,573
Average principal’s salary (elementary school)
$106,362 $103,887
Superintendent’s salary $167,000 $155,551
Percentage of budget for teachers’ salaries
41% 41%
Percentage of budget for administrators’ salaries
6% 6%
SOURCE: School Accountability Report Card unit of the California Department of Education.
rev20140121_37-68189-6038384e/21474
Lakeside Union School District
Related Documents


![Welcome to riverview middle school[1]](https://static.cupdf.com/doc/110x72/55581e18d8b42a5e468b4e63/welcome-to-riverview-middle-school1.jpg)