River otters in Prince William Sound and Kenai Fjords National Park: Distribution, relative abundance, and minimum population size Merav Ben-David University of Wyoming Howard Golden Alaska Department of Fish and Game Michael Goldstein US Forest Service Ian Martin National Park Service

Welcome message from author
This document is posted to help you gain knowledge. Please leave a comment to let me know what you think about it! Share it to your friends and learn new things together.
Transcript

River otters in Prince William Sound and Kenai Fjords National Park:
Distribution, relative abundance, and minimum
population size
Merav Ben-David
University of Wyoming
Howard Golden
Alaska Department of Fish and Game
Michael Goldstein
US Forest Service
Ian Martin
National Park Service

Other Personnel: Jessica Boyd, University of Wyoming
David Crowley, Alaska Department of Fish and Game Heidi Hansen, University of Wyoming
Dan Logan, US Forest Service Kaithryn Ott, University of Wyoming
Aaron Poe, US Forest Service Todd Rinaldi, Alaska Department of Fish and Game
James Wendland, Alaska Department of Fish and Game
Financial and Logistical support: Alaska Department of Fish and Game
National Park Service - SWAN Oil Spill Recovery Institute – Prince William Sound Science Center
University of Wyoming US Forest Service

Why monitor river otters?
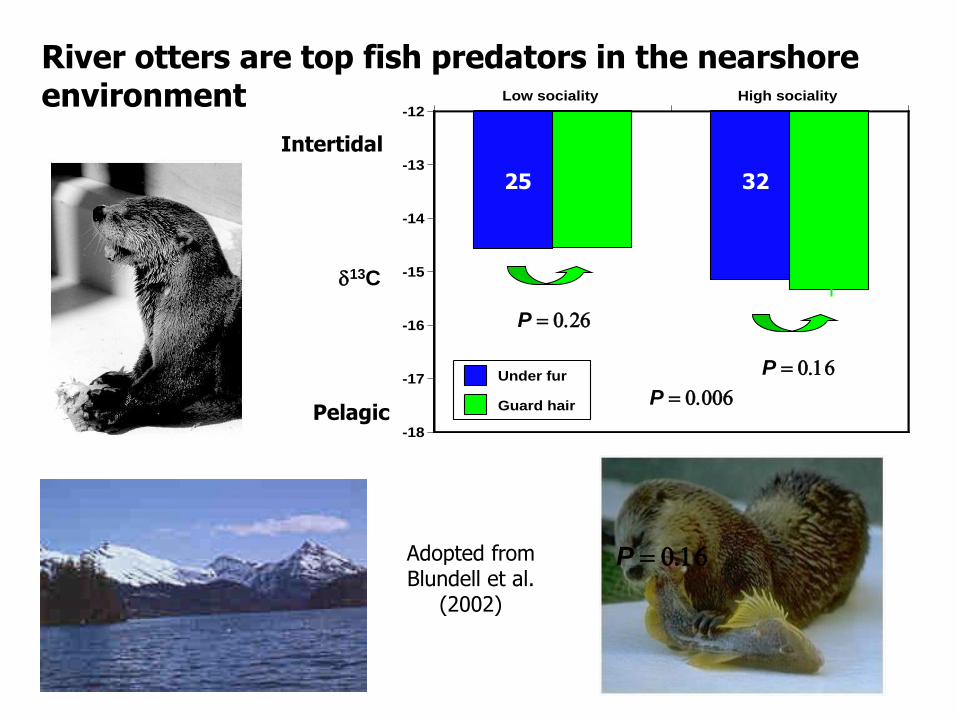
River otters are top fish predators in the nearshore environment
P = 0.16
25 32
Low sociality High sociality
-18
-17
-16
-15
-14
-13
-12
Under fur
Guard hair
d13C
P = 0.006
P = 0.26
P = 0.16
25 32
Pelagic
Intertidal
Adopted from Blundell et al.
(2002)

Otters can serve as sentinels for changes in the nearshore environment
Regime shift in the gulf of Alaska Adopted from Piatt and Anderson (1996)

River otters are sensitive to environmental pollution
Bleed session
Oil administered
capture June July Aug SeptI SeptII Oct NovI NovII Dec Jan FebI FebII
11.0
12.0
13.0
14.0
15.0
16.0
17.0
Control
Low
High
10 10.4 10.8 11.2 11.6 12 12.4 12.8 13.2 13.6 14 14.4 14.80
4
8
12
16
20
24
28
32
36
40
44
48
Ox
yg
en
co
ns
um
pti
on
(m
l O
2.k
g-1
.min
-1)
R2 = 0.4
Exercise
At rest VO2 = 61.10 - 2.01(Hb) Results in a 37.6% increase in
energetic cost of running in river otters with low hemoglobin levels
Ben-David et al. (2000)

11.2 11.5 11.8 12.1 12.4 12.7 13 13.3 13.6 13.9 14.2 14.5 14.8 15.1 15.4 15.7 16 16.3 16.6 16.9 17.2
0
50
100
150
200
250
300
350
400
450
Hemoglobin (g/dL)
Hemoglobin levels were positively related to post-release survival of captive (n = 15) river otters.
( ) represent missing animals; ( ) represent animals dying of starvation. (Proportional hazard regression P = 0.045)
Ben-David et al. (2002)

River otter link the marine and terrestrial ecosystems
How much nitrogen can otters transfer from sea to land?
If otter densities are 1 per 1.3 km of shoreline deposition at latrines can be as high as 160 g/m2/year
Atmospheric deposition in Alaska
= 0.01-0.3 g/m2/year
Ben-David et al. (in press)

a b Land
Nitrogen deposition at latrines in Herring Bay in g/m2/year at different latrines based on actual visitation rate determined
from radio-telemetry. (a) assuming group size of 4, (b) assuming group size of 7
Ben-David et al. (in press)

-3-113579
111315171921
-5-3-113579
1113151719
-5-3-113579
1113151719
-36 -32 -28 -24 -20 -16 -12
Elderberry
Spruce
Alder
Salmonberry
Grass
Devil’s club
Blue berry
Fern
Moss
d13C
d15N
d15N
d15N
Incorporation of marine derived nitrogen into terrestrial vegetation (n ranges between 4 and 12 samples per plant species; closed symbols represent plants growing on river otters latrine sites, open symbols plants growing at random sites)
Ben-David et al. (1998)

0
10
20
30
40
50
60
70
80
90
100
Plant
% o
f sit
es
Differences in community composition of plants between river otter latrines (n = 12) and nonlatrines (n = 9)
Ben-David (unpublished data)
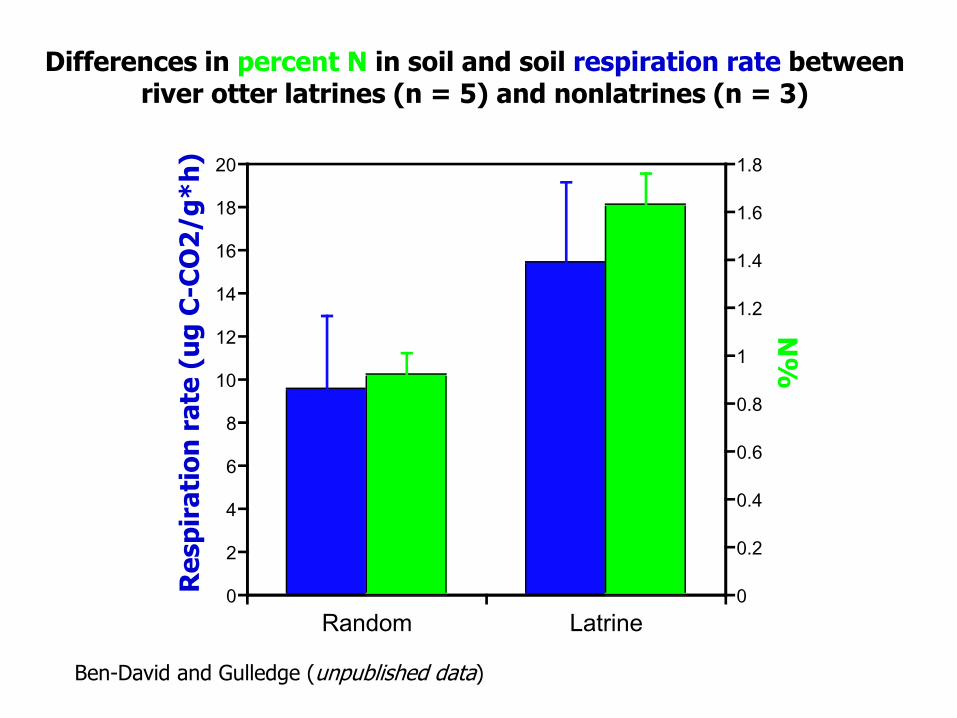
Differences in percent N in soil and soil respiration rate between river otter latrines (n = 5) and nonlatrines (n = 3)
Random Latrine
0
2
4
6
8
10
12
14
16
18
20
0
0.2
0.4
0.6
0.8
1
1.2
1.4
1.6
1.8
Re
sp
ira
tio
n r
ate
(u
g C
-CO
2/g
*h
)
%N
Ben-David and Gulledge (unpublished data)

How to monitor river otters?
They are hard to observe and difficult to re-capture

Distribution and relative abundance: Latrine site surveys a. latrine density
b. fecal deposition rate c. habitat selection
Location Dates Length of shoreline (km)
Latrine density
Fecal deposition rate
Kenai Fjords NP
7/5-10/04 354 0.432 1.94
Prince William Sound
8/9-21/04 945 0.269 1.80

Distribution of river otter latrine sites in Kenai Fjords National Park as determined during a survey in July 2004
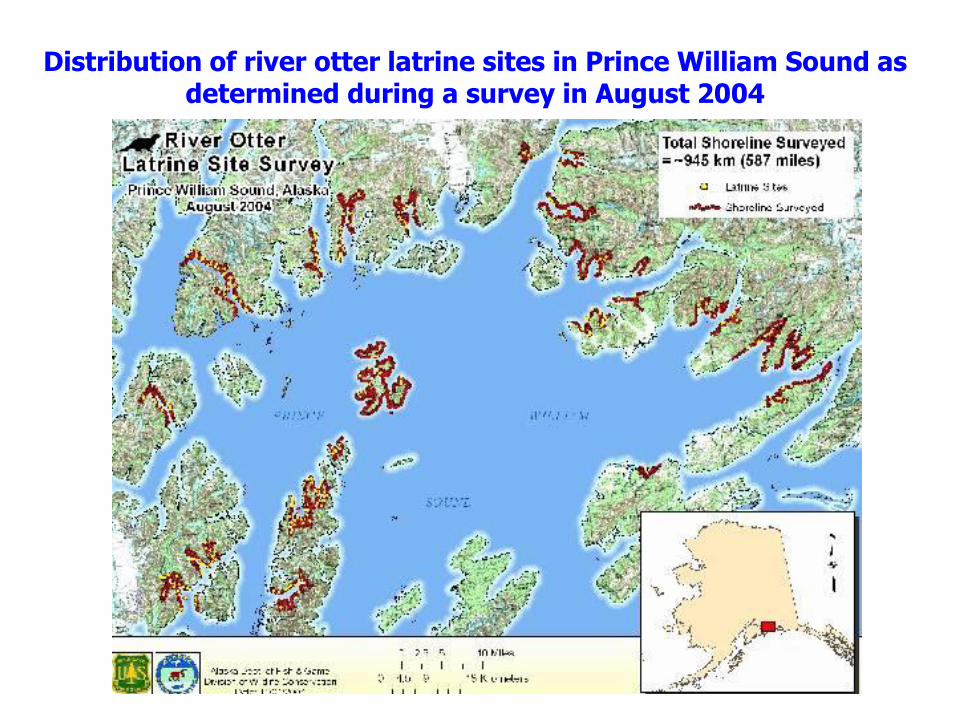
Distribution of river otter latrine sites in Prince William Sound as determined during a survey in August 2004
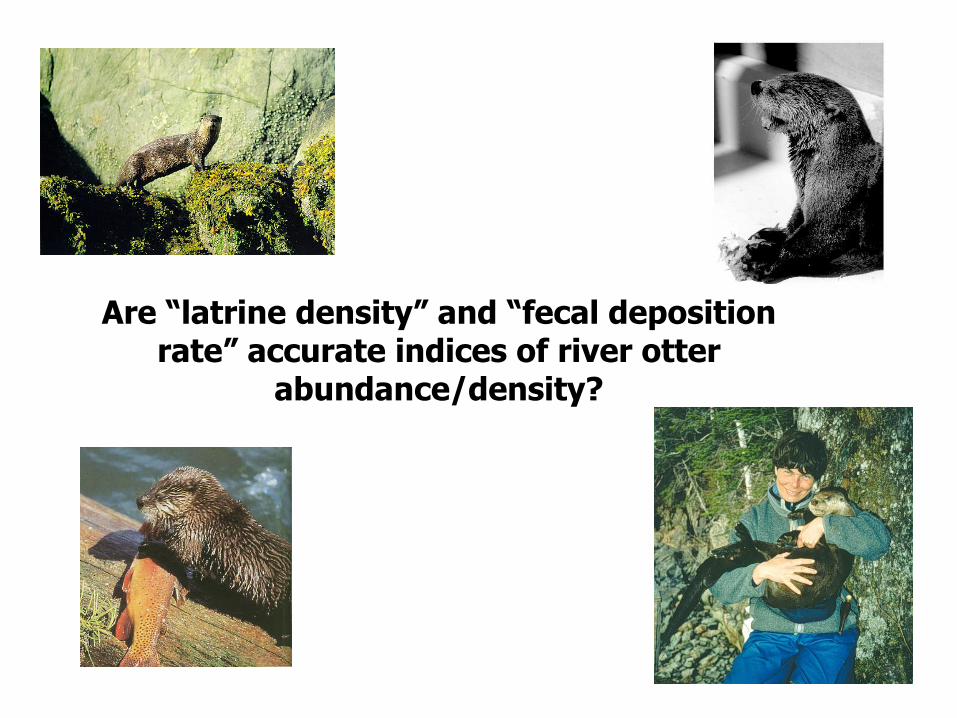
Are “latrine density” and “fecal deposition rate” accurate indices of river otter
abundance/density?
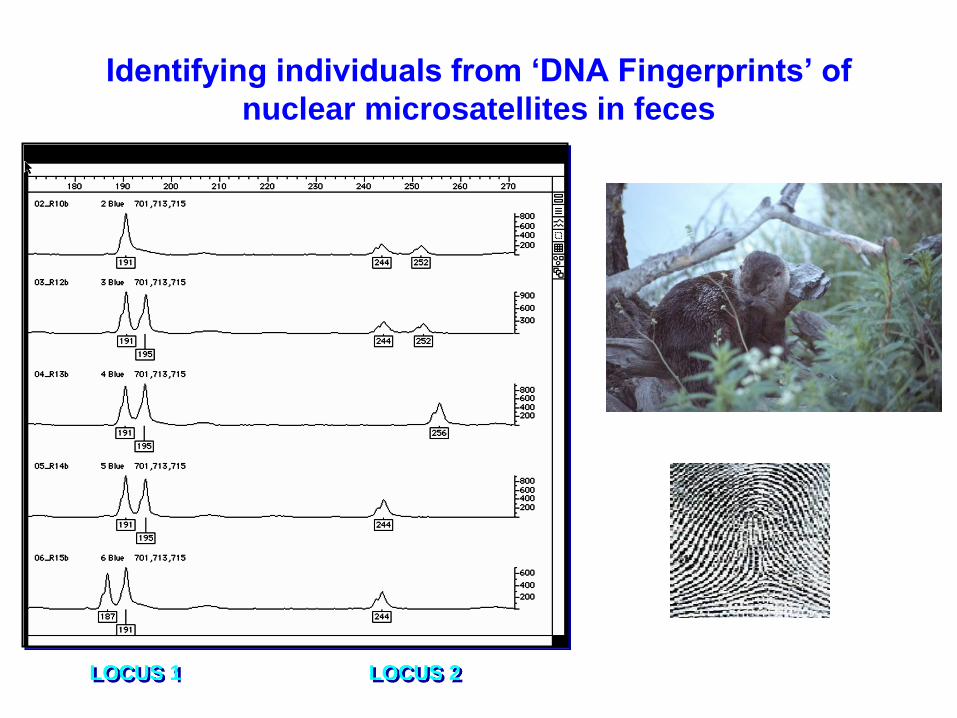
Identifying individuals from ‘DNA Fingerprints’ of
nuclear microsatellites in feces
LOCUS 1 LOCUS 2

Estimating population size with mark-recapture methods of individuals identified from feces: Latrine site surveys a. collect all fresh feces (< 12 hours old) on first visit (marking occasion) b. collect all fresh feces on second visit (re-capture occasion) c. preserve all feces in 100% ethanol and keep cool

Extracting and amplifying otter DNA from feces
• Samples are sieved to remove prey remains
• Excess EtOH evaporated
• Extracted using Qiagen
• Prescreened with 2 best primers (Lut701, RIO05)
• Samples that do not amplify after 3 PCRs are discarded
Location Number of fresh feces collected on
first occasion
Number of fresh feces collected on second occasion
Total Discarded
KEFJ 267 NA 267 166
PWS 302 263 565 377

Is this a low success rate?
Species Location Success rate
River otters KEFJ (AK) 38%
PWS (AK) 33%
Green River (WY) 34%
Eurasian otters Scotland (UK) 15%
Brown Bears Captive (WA) 20%
All studies 31%
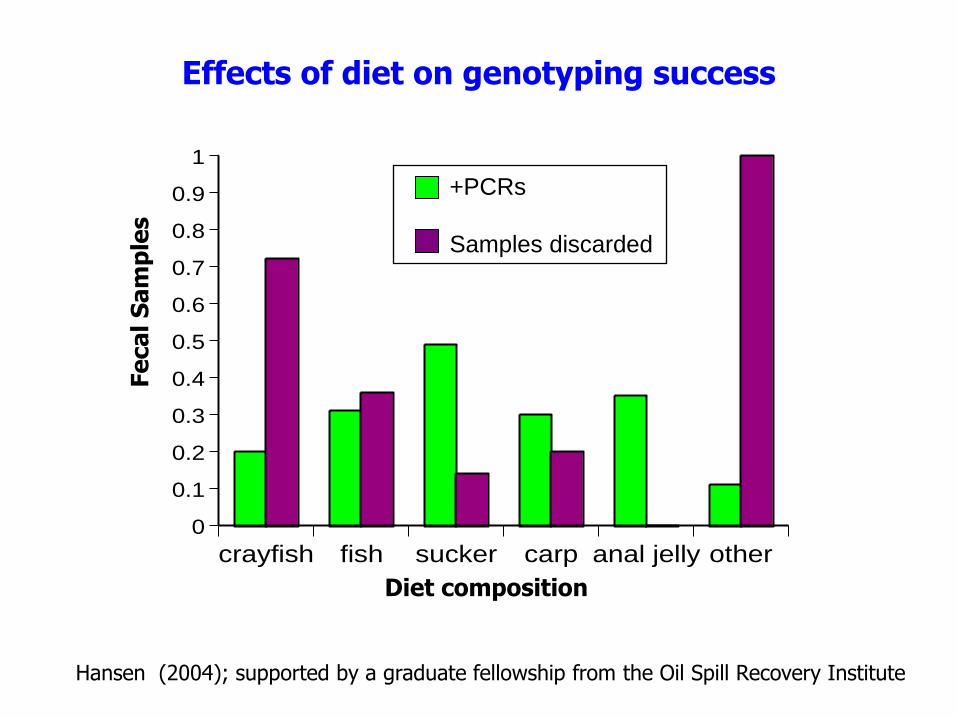
Effects of diet on genotyping success
crayfish fish sucker carp anal jelly other
0
0.1
0.2
0.3
0.4
0.5
0.6
0.7
0.8
0.9
1
+PCRs
Samples discarded
Fe
ca
l S
am
ple
s
Diet composition
Hansen (2004); supported by a graduate fellowship from the Oil Spill Recovery Institute

overstory
120100806040200-20
SU
CC
ES
S
1.2
1.0
.8
.6
.4
.2
0.0
-.2
ASPECT
1086420
SU
CC
ES
S
1.2
1.0
.8
.6
.4
.2
0.0
-.2
VEGSLOP
706050403020100
SU
CC
ES
S1.2
1.0
.8
.6
.4
.2
0.0
-.2
Effects of habitat characteristics on genotyping success
None of 12 habitat variables could explain differences in genotyping success (logistic regression with successful sites coded as 1 and unsuccessful sites coded 0)

1271512219N =
DATE
10-JUL-0409-JUL-0408-JUL-0407-JUL-0406-JUL-0405-JUL-04
PE
RC
SU
CC
120
100
80
60
40
20
0
-20
35
1271512219N =
DATE
10-JUL-0409-JUL-0408-JUL-0407-JUL-0406-JUL-0405-JUL-04
NE
WC
OL
L
22
18
14
10
6
2
-2
71
70
37
1
43
No difference in the number of feces collected per day in Kenai Fjords National Park in July 2004 (ANOVA, P = 0.38)
Effects of environmental conditions on genotyping success
Significant reduction in genotyping success (percent success) per day in Kenai Fjords National Park in July 2004 (ANOVA, P = 0.009)

1012151016121213137616N =
DATE
21-AUG
-04
20-AUG
-04
19-AUG
-04
18-AUG
-04
17-AUG
-04
16-AUG
-04
15-AUG
-04
14-AUG
-04
13-AUG
-04
12-AUG
-04
11-AUG
-04
10-AUG
-04
PE
RS
UC
120
100
80
60
40
20
0
-20
62
1012151016121213137616N =
DATE
21-AUG
-04
20-AUG
-04
19-AUG
-04
18-AUG
-04
17-AUG
-04
16-AUG
-04
15-AUG
-04
14-AUG
-04
13-AUG
-04
12-AUG
-04
11-AUG
-04
10-AUG
-04
NE
WC
OL
L
22
18
14
10
6
2
-2
138
141
139
130
131108
118
96
83
91
75
43
31
32
26
15
9
No difference in the number of feces collected per day in Prince William Sound in August 2004 (ANOVA, P = 0.86)
Effects of environmental conditions on genotyping success
No difference in genotyping success (percent success) per day in Prince William Sound in August 2004 (ANOVA, P = 0.25)

0
10
20
30
40
50
60
10.0 12.0 14.0 16.0 18.0 20.0 22.0 24.0
Average Daily Temperature
Pe
rce
nt
ge
no
typ
ing
su
cce
ss
PWS
Effects of environmental conditions on genotyping success
0
10
20
30
40
50
60
70
10.0 12.0 14.0 16.0 18.0 20.0 22.0 24.0
KEFJ
Pe
rce
nt
ge
no
typ
ing
su
cce
ss
Average Daily Temperature
No effect of temperature alone on genotyping success in Kenai Fjords National Park in July 2004 (Regression, P = 0.41)
No effect of temperature alone on genotyping success in Prince William Sound in August 2004 (Regression, P = 0.27)

0
5
10
15
20
25
30
10.0 10.5 11.0 11.5 12.0 12.5 13.0 13.5
Temperature – Humidity Index
Nu
mb
er
of
sa
mp
les
su
cce
ssfu
lly g
en
oty
pe
d
Effects of environmental conditions on genotyping success
0
10
20
30
40
50
60
70
10.0 10.5 11.0 11.5 12.0 12.5 13.0 13.5
Pe
rce
nt
ge
no
typ
ing
su
cce
ss
Temperature – Humidity Index
Reduction in genotyping success with increasing temperature humidity index in Kenai Fjords National Park in July 2004 (Linear regression)
R2 = 0. 40, P = 0.18
R2 = 0.66, P = 0.05

Observer bias? NO!
HH MBD KEO0
10
20
30
40
50
60
Ge
no
typ
ing
su
cce
ss
Observer
No difference in genotyping success of feces collected by different observers in Kenai Fjords National Park in July 2004 (ANOVA, P = 0.38)

Effects of intestinal parasites on genotyping success
Location Prevalence of parasites
Percent of genotyping success in infested feces
Percent of genotyping success in non-infested feces
KEFJ 36% 19.8% 49.1%
PWS 10% NA NA

Future work: 1. Determine diet composition to evaluate its effect on
genotyping success 2. Complete amplifications with all 9 hypervariable primers
to obtain individual fingerprints 3. Evaluate the need for double sampling (mark and re-
capture occasions) 4. Estimate otter population size and density in KEFJ and
PWS 5. Assess the relation between latrine density and fecal
deposition rate to otter density
Related Documents