J. Hydrol. Hydromech., 57, 2009, 4, 250–263 DOI: 10.2478/v10098-009-0022-0 250 RISKS DUE TO VARIABILITY OF K-DAY EXTREME PRECIPITATION TOTALS AND OTHER K-DAY EXTREME EVENTS PAVOL BRUNOVSKÝ, MILAN LAPIN, IGOR MELICHERČÍK, JÁN SOMORČÍK, DANIEL ŠEVČOVIČ Faculty of Mathematics, Physics and Informatics, Mlynská dolina, SK-842 48 Bratislava, Slovak Republic; Mailto: [email protected], [email protected], [email protected]; [email protected], [email protected] Several alternative definitions of extreme events are proposed. As the first step a statistical analysis of daily precipitation measurement time series from the Hurbanovo SHMI Observatory and elaboration of potentially dangerous precipitation events is carried out. Then, combined characteristics based on daily temperature, daily air humidity and daily precipitation totals are computed. The drought index based on normalized deviations from long-term averages is defined. Alternatively, to define extreme events "Data envelopment analysis" (DEA) is employed with K-day periods of values of temperature, humidity and precipitation corresponding to decision making units. In this paper we have used the period of K = 10 days for both methodologies for identification of extreme events. The results of all definitions of extreme events are compared. KEY WORDS: Extreme Events, Precipitation, Humidity, Temperature, Drought Index, DEA Analysis. Pavol Brunovský, Milan Lapin, Igor Melicherčík, Ján Somorčík, Daniel Ševčovič: RIZIKÁ SPÔSOBENÉ VARIABILITOU K-DENNÝCH EXTRÉMNYCH ÚHRNOV ZRÁŽOK A INÝMI EXTRÉMNYMI UDALOSŤAMI. J. Hydrol. Hydromech., 57, 2009, 4, 11 lit., 17. obr., 2 tab. V článku navrhujeme niekoľko definícií extrémnych udalostí. Ako prvý krok je vypracovaná štatistická analýza denných úhrnov zrážok z observatória SHMÚ v Hurbanove, na základe ktorej označujeme extrémne udalosti. Následne počítame kombinované charakteristiky období sucha založené na denných údajoch teploty, vlhkosti vzduchu a denných úhrnoch zrážok. Index sucha je založený na normalizovaných odchýlkach od dlhodobých priemerov. Alternatívne definujeme extrémne udalosti na základe DEA analýzy, kde K-denné periódy teploty, vlhkosti a zrážok slúžia ako rozhodovacie jednotky. V tomto článku sme na identifikáciu extrémnych udalostí pre obe metodológie použili periódu K = 10 dní. Výsledky všetkých prístupov nakoniec porovnávame. KĽÚČOVÉ SLOVÁ: extrémne udalosti, atmosférické zrážky, vlhkosť, teplota, index sucha, DEA analýza. Introduction It is commonly accepted that one of the features of the climatic changes in the past is an increasing number of extreme weather events of various kind – droughts, floods, windstorms, etc. But what is an extreme event? For instance, drought cannot be fully characterized by a single quantity. Rather, it is a combination of high temperature, low humidity, low precipitation and possibly other quantities like duration. Extreme events are commonly being character- ized by drought indices synthesizing several kinds of data (Klementová, Litschman, 2001). The disad- vantage of this method is that it involves subjective components, e.g. the choice of weights of the data and the choice of the threshold. The main goal of this paper is to introduce a completely new methodology of the identification of extreme events, the Data Envelopment Analysis (DEA). We compare its results with the results of the drought index approach in the case of long term meteorological data observations obtained from the station in Hurbanovo, Slovakia. We recall that DEA has been widely used in the field of operations re- search as a tool for the evaluation of "decision mak- ing units" (see e.g. Cooper et al., 2000, Knox Lovell, Pastor, 1995, Ševčovič et al., 2001). To our

Welcome message from author
This document is posted to help you gain knowledge. Please leave a comment to let me know what you think about it! Share it to your friends and learn new things together.
Transcript
J. Hydrol. Hydromech., 57, 2009, 4, 250–263 DOI: 10.2478/v10098-009-0022-0
250
RISKS DUE TO VARIABILITY OF K-DAY EXTREME PRECIPITATION TOTALS AND OTHER K-DAY EXTREME EVENTS PAVOL BRUNOVSKÝ, MILAN LAPIN, IGOR MELICHERČÍK, JÁN SOMORČÍK, DANIEL ŠEVČOVIČ Faculty of Mathematics, Physics and Informatics, Mlynská dolina, SK-842 48 Bratislava, Slovak Republic; Mailto: [email protected], [email protected], [email protected]; [email protected], [email protected]
Several alternative definitions of extreme events are proposed. As the first step a statistical analysis of daily precipitation measurement time series from the Hurbanovo SHMI Observatory and elaboration of potentially dangerous precipitation events is carried out. Then, combined characteristics based on daily temperature, daily air humidity and daily precipitation totals are computed. The drought index based on normalized deviations from long-term averages is defined. Alternatively, to define extreme events "Data envelopment analysis" (DEA) is employed with K-day periods of values of temperature, humidity and precipitation corresponding to decision making units. In this paper we have used the period of K = 10 days for both methodologies for identification of extreme events. The results of all definitions of extreme events are compared.
KEY WORDS: Extreme Events, Precipitation, Humidity, Temperature, Drought Index, DEA Analysis.
Pavol Brunovský, Milan Lapin, Igor Melicherčík, Ján Somorčík, Daniel Ševčovič: RIZIKÁ SPÔSOBENÉ VARIABILITOU K-DENNÝCH EXTRÉMNYCH ÚHRNOV ZRÁŽOK A INÝMI EXTRÉMNYMI UDALOSŤAMI. J. Hydrol. Hydromech., 57, 2009, 4, 11 lit., 17. obr., 2 tab.
V článku navrhujeme niekoľko definícií extrémnych udalostí. Ako prvý krok je vypracovaná štatistická
analýza denných úhrnov zrážok z observatória SHMÚ v Hurbanove, na základe ktorej označujeme extrémne udalosti. Následne počítame kombinované charakteristiky období sucha založené na denných údajoch teploty, vlhkosti vzduchu a denných úhrnoch zrážok. Index sucha je založený na normalizovaných odchýlkach od dlhodobých priemerov. Alternatívne definujeme extrémne udalosti na základe DEA analýzy, kde K-denné periódy teploty, vlhkosti a zrážok slúžia ako rozhodovacie jednotky. V tomto článku sme na identifikáciu extrémnych udalostí pre obe metodológie použili periódu K = 10 dní. Výsledky všetkých prístupov nakoniec porovnávame.
KĽÚČOVÉ SLOVÁ: extrémne udalosti, atmosférické zrážky, vlhkosť, teplota, index sucha, DEA analýza.
Introduction
It is commonly accepted that one of the features of the climatic changes in the past is an increasing number of extreme weather events of various kind – droughts, floods, windstorms, etc. But what is an extreme event? For instance, drought cannot be fully characterized by a single quantity. Rather, it is a combination of high temperature, low humidity, low precipitation and possibly other quantities like duration.
Extreme events are commonly being character-ized by drought indices synthesizing several kinds of data (Klementová, Litschman, 2001). The disad-
vantage of this method is that it involves subjective components, e.g. the choice of weights of the data and the choice of the threshold.
The main goal of this paper is to introduce a completely new methodology of the identification of extreme events, the Data Envelopment Analysis (DEA). We compare its results with the results of the drought index approach in the case of long term meteorological data observations obtained from the station in Hurbanovo, Slovakia. We recall that DEA has been widely used in the field of operations re-search as a tool for the evaluation of "decision mak-ing units" (see e.g. Cooper et al., 2000, Knox Lovell, Pastor, 1995, Ševčovič et al., 2001). To our
Risks due to variability of K-day extreme precipitation totals and other K-day extreme events
251
knowledge this is the first application of DEA for the definition of extreme events. Extreme precipitation totals
We studied the time series of daily precipitation totals at Hurbanovo from 1901 to 2006. Hurbanovo Observatory (115 m a.s.l.) is a representative mete-orological station for the Danubian lowland in Slo-vakia. It is considered to be one of the best mete-orological stations in Central Europe with suffi-ciently long and good-quality observations since 1871 (Melo, 2005; Lapin, Melo, 2004). Method of extreme one-day and 10-day precipitation totals analysis and its application in Slovakia was pre-sented also in Kohnová et al. (2006), Hlavčová et al. (2008) and Szolgay et al. (2009).
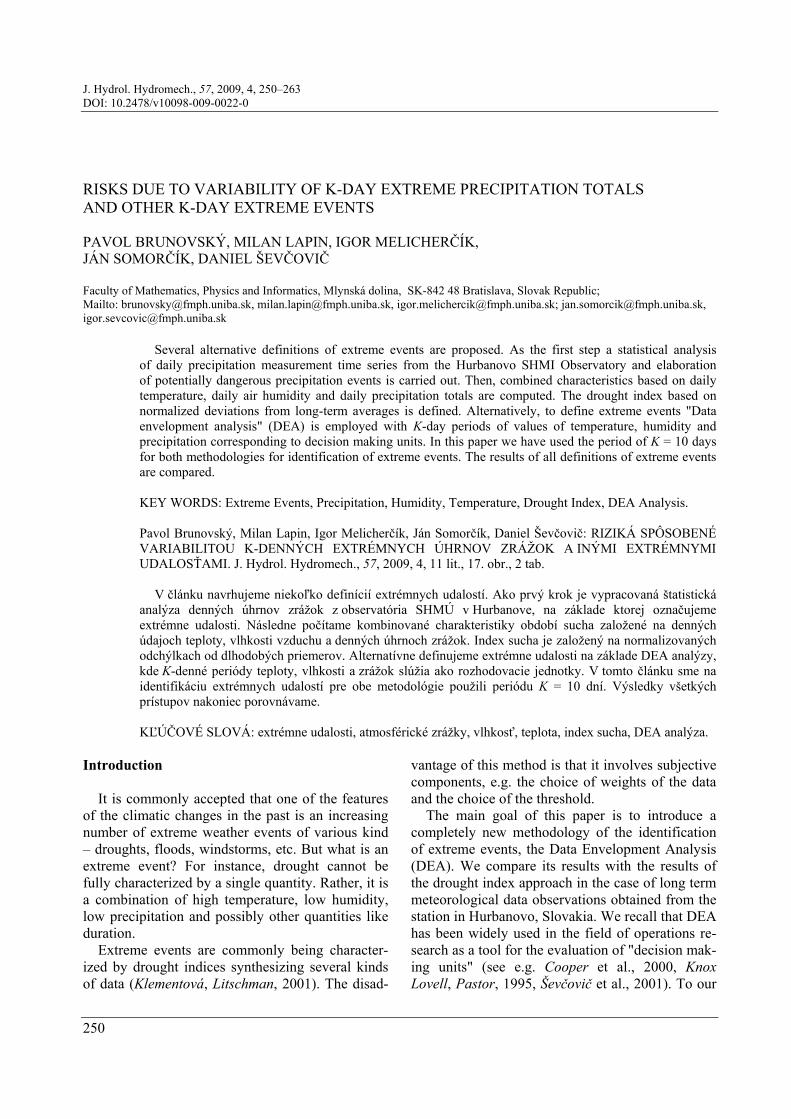
Complete data series including precipitation, humidity and temperature from 1951 to 2006 were used in our qualitative and quantitative analysis of the Drought index and DEA methodology for iden-tification of extreme events. Initially we computed yearly averages of daily precipitation totals (Fig. 1). The dots stand for yearly averages of precipitation totals over rainy days (with precipitation total > 0.0 mm) whereas triangles represent yearly averages over all days of particular years. The dots lie visibly above the triangles. The U-shape of the solid line suggests that daily precipitation totals over rainy days during the beginning of the 20th century as well as during several last years were higher than in
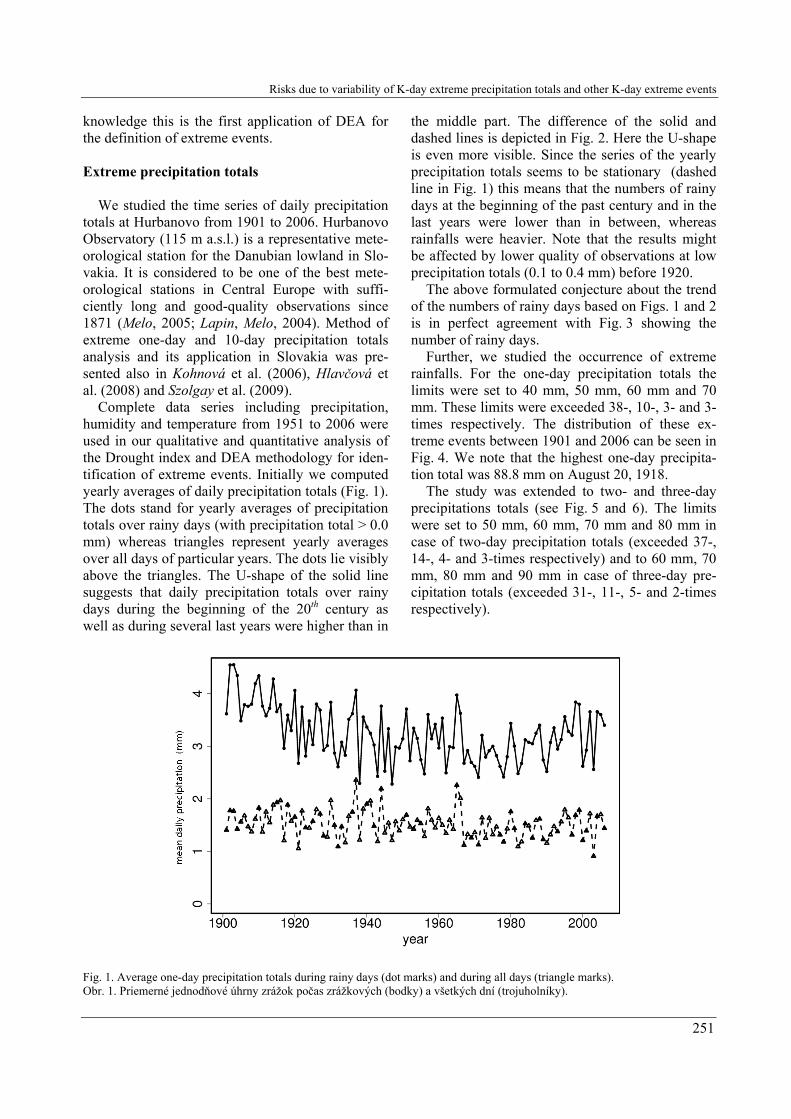
the middle part. The difference of the solid and dashed lines is depicted in Fig. 2. Here the U-shape is even more visible. Since the series of the yearly precipitation totals seems to be stationary (dashed line in Fig. 1) this means that the numbers of rainy days at the beginning of the past century and in the last years were lower than in between, whereas rainfalls were heavier. Note that the results might be affected by lower quality of observations at low precipitation totals (0.1 to 0.4 mm) before 1920.
The above formulated conjecture about the trend of the numbers of rainy days based on Figs. 1 and 2 is in perfect agreement with Fig. 3 showing the number of rainy days.
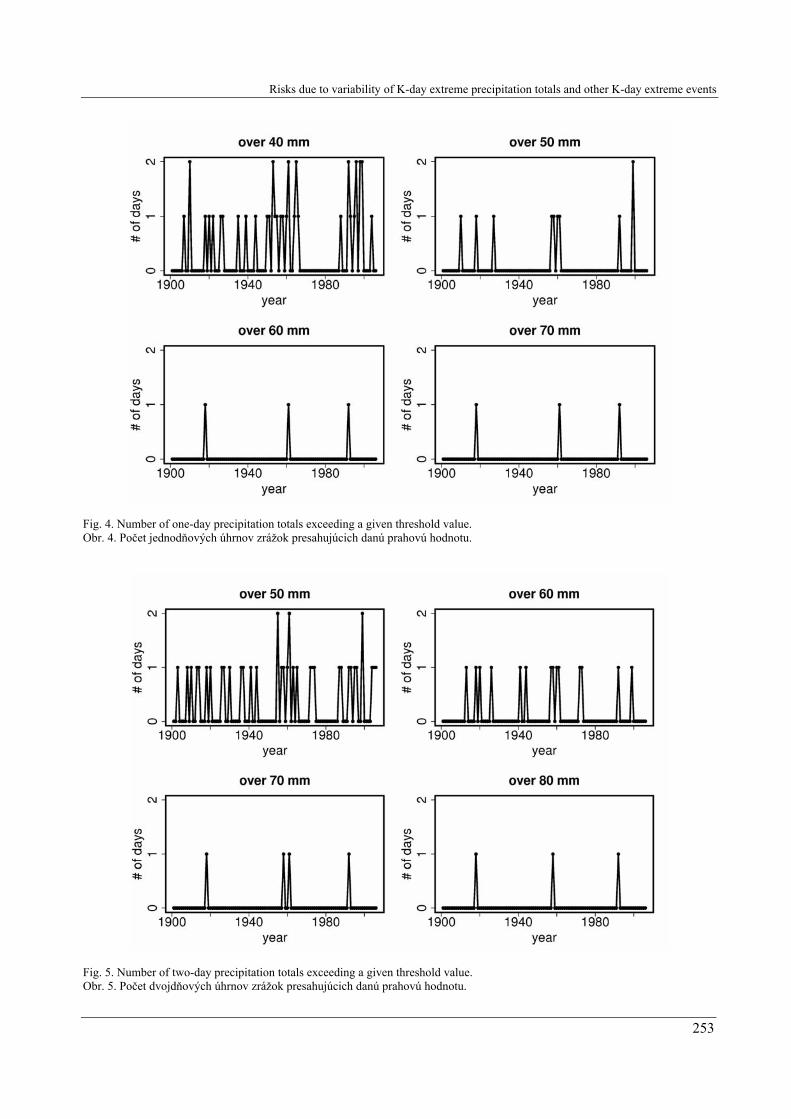
Further, we studied the occurrence of extreme rainfalls. For the one-day precipitation totals the limits were set to 40 mm, 50 mm, 60 mm and 70 mm. These limits were exceeded 38-, 10-, 3- and 3-times respectively. The distribution of these ex-treme events between 1901 and 2006 can be seen in Fig. 4. We note that the highest one-day precipita-tion total was 88.8 mm on August 20, 1918.
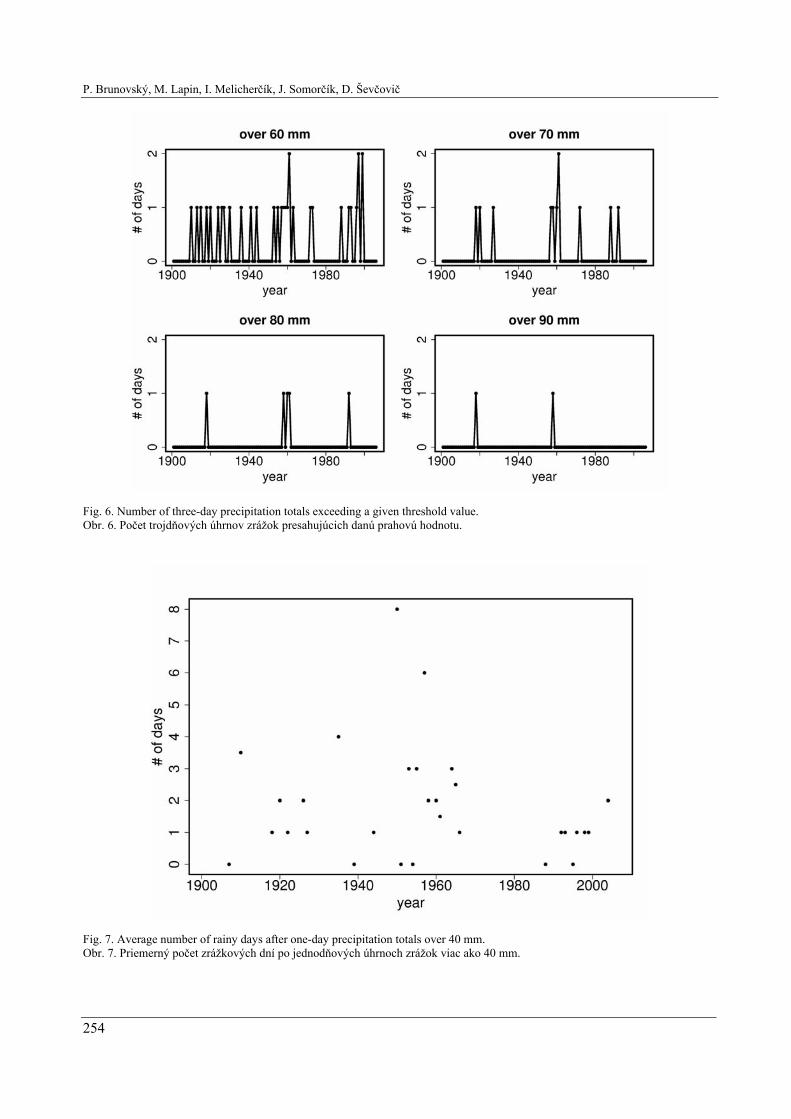
The study was extended to two- and three-day precipitations totals (see Fig. 5 and 6). The limits were set to 50 mm, 60 mm, 70 mm and 80 mm in case of two-day precipitation totals (exceeded 37-, 14-, 4- and 3-times respectively) and to 60 mm, 70 mm, 80 mm and 90 mm in case of three-day pre-cipitation totals (exceeded 31-, 11-, 5- and 2-times respectively).
Fig. 1. Average one-day precipitation totals during rainy days (dot marks) and during all days (triangle marks). Obr. 1. Priemerné jednodňové úhrny zrážok počas zrážkových (bodky) a všetkých dní (trojuholníky).
P. Brunovský, M. Lapin, I. Melicherčík, J. Somorčík, D. Ševčovič
252
Fig. 2. Difference between average one-day precipitation totals during rainy days and during all days. Obr. 2. Rozdiel medzi priemernými jednodňovými úhrnmi zrážok počas zrážkových a všetkých dní.
Fig. 3. Number of rainy days. Obr. 3. Počet zrážkových dní.
Figs. 4, 5 and 6 suggest that the distribution of heavy rainfalls in the period from 1901 to 2006 is rather uniform.
The effect of a heavy rainfall can become really serious when it continues to rain in the following days. This motivated us to look at the average
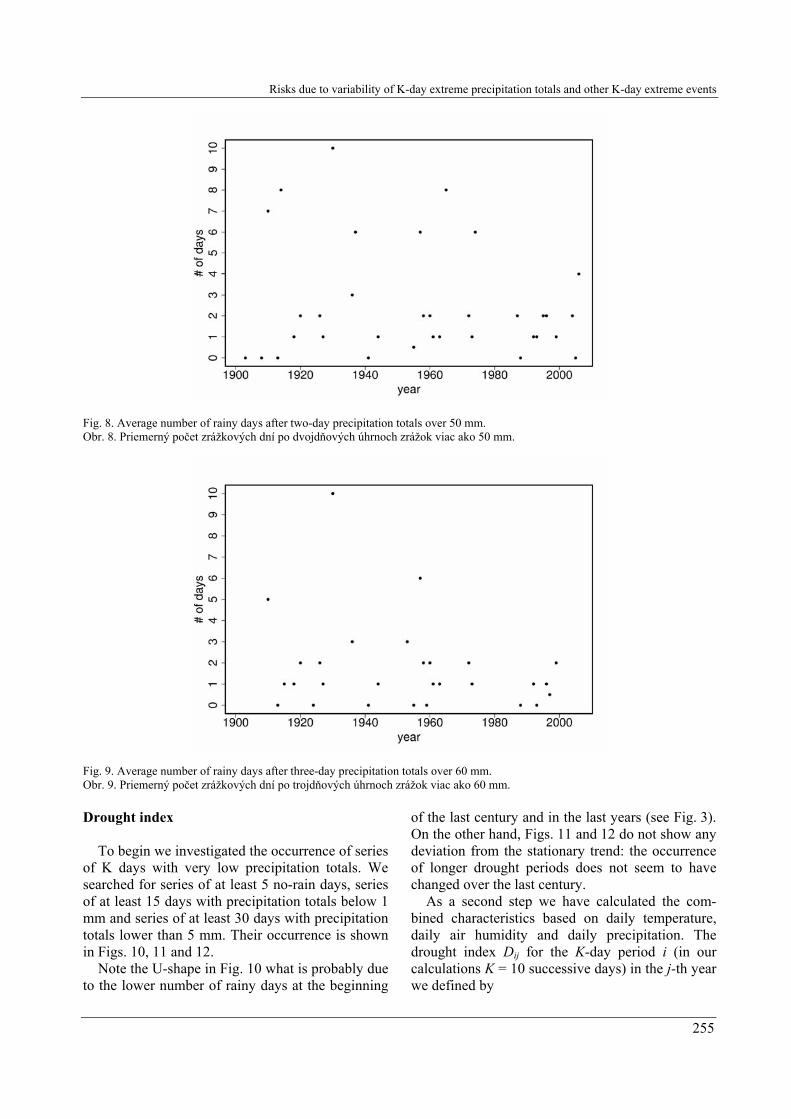
number of rainy days after one- two- or three-days with precipitation totals over 40 mm, 50 mm or 60 mm respectively (the average is taken through all extreme events in a particular year). The results are in Figs. 7, 8 and 9. No increasing or decreasing trend can be seen there.
Risks due to variability of K-day extreme precipitation totals and other K-day extreme events
253
Fig. 4. Number of one-day precipitation totals exceeding a given threshold value. Obr. 4. Počet jednodňových úhrnov zrážok presahujúcich danú prahovú hodnotu.
Fig. 5. Number of two-day precipitation totals exceeding a given threshold value. Obr. 5. Počet dvojdňových úhrnov zrážok presahujúcich danú prahovú hodnotu.
P. Brunovský, M. Lapin, I. Melicherčík, J. Somorčík, D. Ševčovič
254
Fig. 6. Number of three-day precipitation totals exceeding a given threshold value. Obr. 6. Počet trojdňových úhrnov zrážok presahujúcich danú prahovú hodnotu.
Fig. 7. Average number of rainy days after one-day precipitation totals over 40 mm. Obr. 7. Priemerný počet zrážkových dní po jednodňových úhrnoch zrážok viac ako 40 mm.
Risks due to variability of K-day extreme precipitation totals and other K-day extreme events
Fig. 8. Average number of rainy days after two-day precipitation totals over 50 mm. Obr. 8. Priemerný počet zrážkových dní po dvojdňových úhrnoch zrážok viac ako 50 mm.
Fig. 9. Average number of rainy days after three-day precipitation totals over 60 mm. Obr. 9. Priemerný počet zrážkových dní po trojdňových úhrnoch zrážok viac ako 60 mm. Drought index
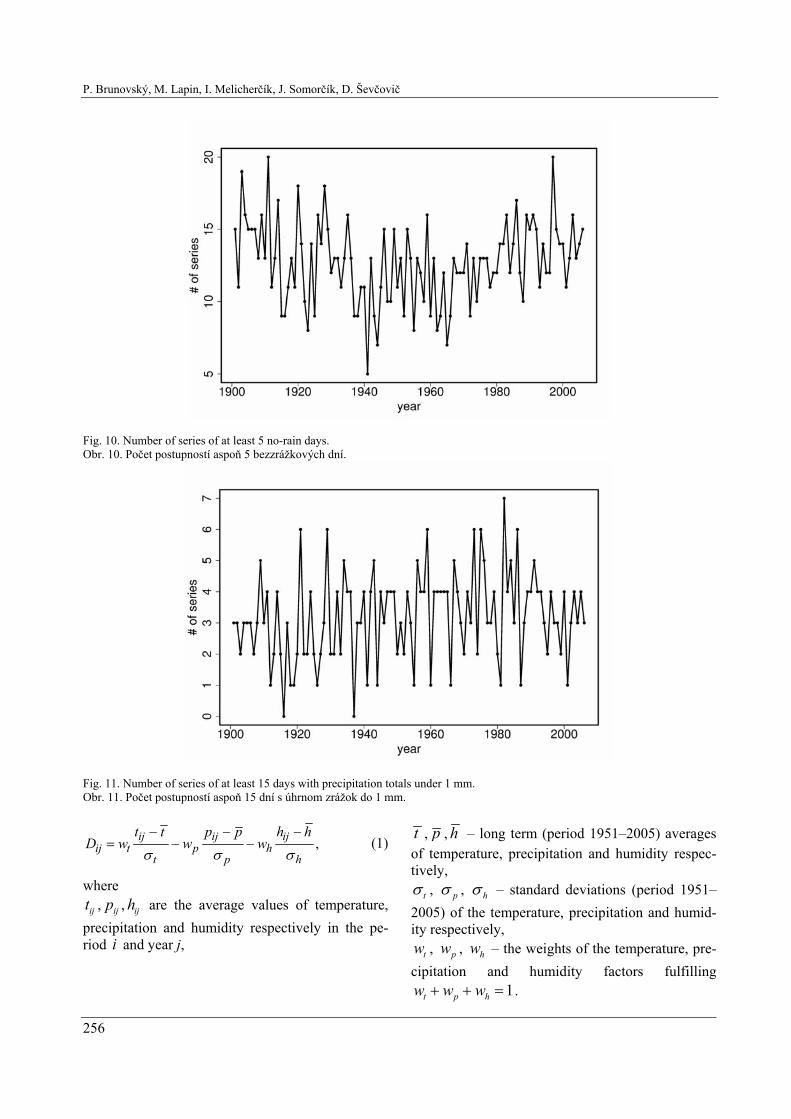
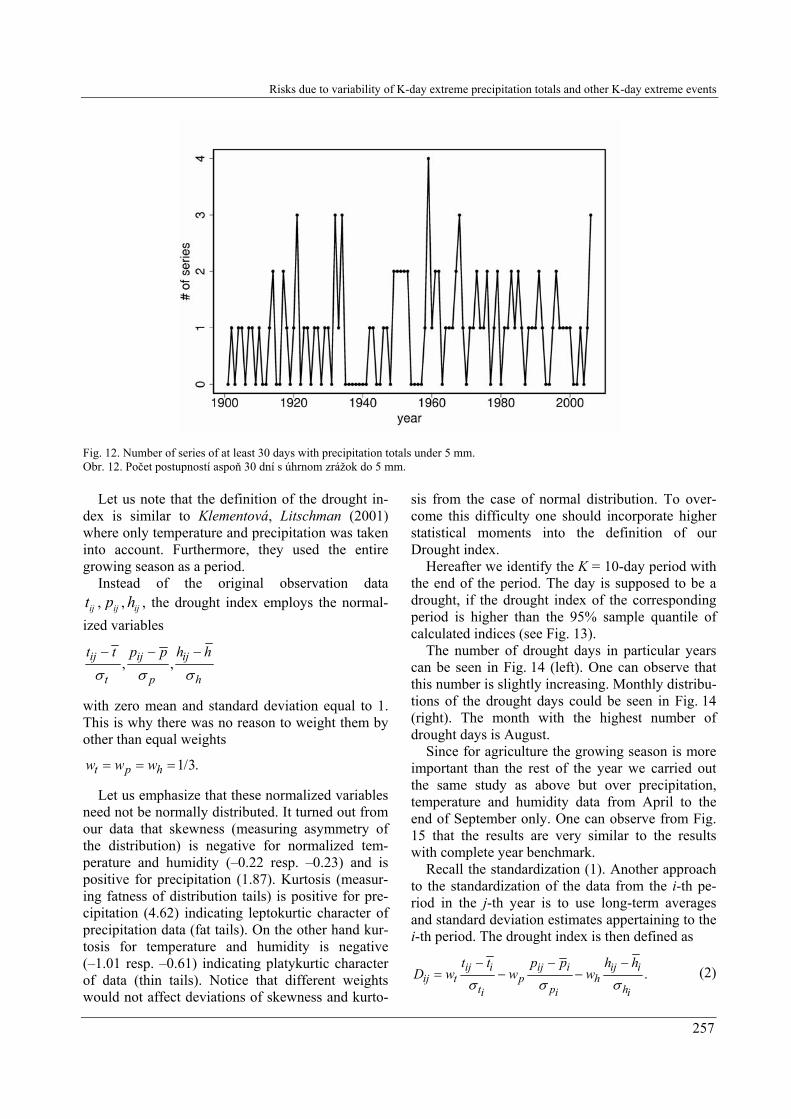
To begin we investigated the occurrence of series of K days with very low precipitation totals. We searched for series of at least 5 no-rain days, series of at least 15 days with precipitation totals below 1 mm and series of at least 30 days with precipitation totals lower than 5 mm. Their occurrence is shown in Figs. 10, 11 and 12.
Note the U-shape in Fig. 10 what is probably due to the lower number of rainy days at the beginning
of the last century and in the last years (see Fig. 3). On the other hand, Figs. 11 and 12 do not show any deviation from the stationary trend: the occurrence of longer drought periods does not seem to have changed over the last century.
As a second step we have calculated the com-bined characteristics based on daily temperature, daily air humidity and daily precipitation. The drought index Dij for the K-day period i (in our calculations K = 10 successive days) in the j-th year we defined by
255
P. Brunovský, M. Lapin, I. Melicherčík, J. Somorčík, D. Ševčovič
256
Fig. 10. Number of series of at least 5 no-rain days. Obr. 10. Počet postupností aspoň 5 bezzrážkových dní.
Fig. 11. Number of series of at least 15 days with precipitation totals under 1 mm. Obr. 11. Počet postupností aspoň 15 dní s úhrnom zrážok do 1 mm.
,ij ij ijij t p h
t p
t t p p h hD w w w
σ σ σ− −
= − −h
− (1)
where
ijt , ijp ,
i
ijh
and
are the average values of temperature, precipitation and humidity respectively in the pe-
year j, riod
t , p , h – long term (period 1951–2005) averages of temperature, precipitation and humidity respec-tively,
tσ , pσ , hσ – standard deviations (period 1951–2005) of the temperature, precipitation and humid-ity respectively,
– the weights of the temperature, pre-idity factors fulfilling
tw , pw ,
t pw w
hwcipitation and hum
w 1h+ + = .
Risks due to variability of K-day extreme precipitation totals and other K-day extreme events
257
Fig. 12. Number of series of at least 30 days with precipitation totals under 5 mm. Obr. 12. Počet postupností aspoň 30 dní s úhrnom zrážok do 5 mm.
Let us note that the definition of the drought in-dex is similar to Klementová, Litschman (2001) where only temperature and precipitation was taken into account. Furthermore, they used the entire growing season as a period.
Instead of the original observation data ijt , ijp , ijh , the drought index employs the normal-
ized variables
, ,ij ij ij
t p h
t t p p h hσ σ σ− − −
with zero mean and standard deviation equal to 1. This is why there was no reason to weight them by other than equal weights
1 3t p hw w w= = = /
.
Let us emphasize that these normalized variables need not be normally distributed. It turned out from our data that skewness (measuring asymmetry of the distribution) is negative for normalized tem-perature and humidity (–0.22 resp. –0.23) and is positive for precipitation (1.87). Kurtosis (measur-ing fatness of distribution tails) is positive for pre-cipitation (4.62) indicating leptokurtic character of precipitation data (fat tails). On the other hand kur-tosis for temperature and humidity is negative (–1.01 resp. –0.61) indicating platykurtic character of data (thin tails). Notice that different weights would not affect deviations of skewness and kurto-
sis from the case of normal distribution. To over-come this difficulty one should incorporate higher statistical moments into the definition of our Drought index.
Hereafter we identify the K = 10-day period with the end of the period. The day is supposed to be a drought, if the drought index of the corresponding period is higher than the 95% sample quantile of calculated indices (see Fig. 13).
The number of drought days in particular years can be seen in Fig. 14 (left). One can observe that this number is slightly increasing. Monthly distribu-tions of the drought days could be seen in Fig. 14 (right). The month with the highest number of drought days is August.
Since for agriculture the growing season is more important than the rest of the year we carried out the same study as above but over precipitation, temperature and humidity data from April to the end of September only. One can observe from Fig. 15 that the results are very similar to the results with complete year benchmark.
Recall the standardization (1). Another approach to the standardization of the data from the i-th pe-riod in the j-th year is to use long-term averages and standard deviation estimates appertaining to the i-th period. The drought index is then defined as
.ij i ij i ij iij t p h
t pi i
t t p p h hD w w w
σ σ σhi
− − −= − − (2)

P. Brunovský, M. Lapin, I. Melicherčík, J. Somorčík, D. Ševčovič
258
Fig. 13. Histogram of drought indices and the sample 95% quantile. Obr. 13. Histogram indexov sucha a výberový 95% kvantil.
Fig. 14. Number of drought days in corresponding years (left) and monthly distribution (right). Obr. 14. Počty suchých dní v príslušných rokoch (vľavo) a mesačné rozloženie (vpravo).
Fig. 15. Growing season (April–September): number of drought days in corresponding years (left) and monthly distribution (right). Obr. 15. Vegetačné obdobie (apríl–september): počty suchých dní v príslušných rokoch (vľavo) a mesačné rozloženie (vpravo).
Risks due to variability of K-day extreme precipitation totals and other K-day extreme events
259
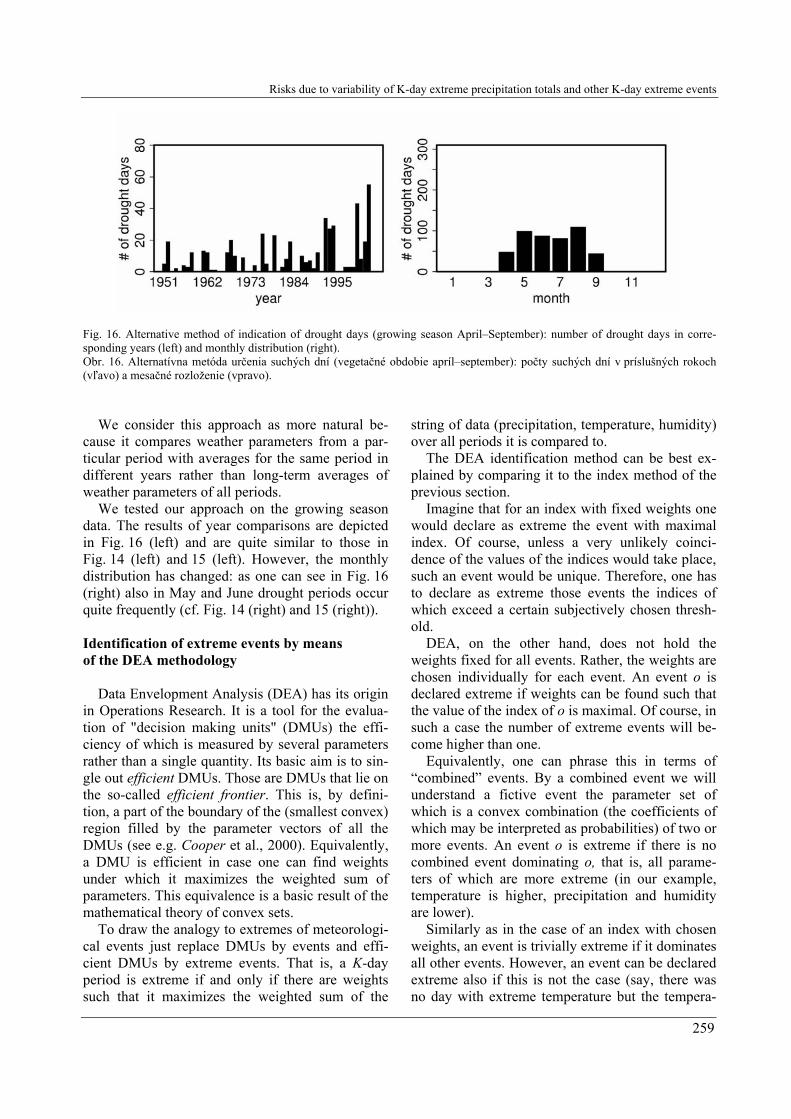
Fig. 16. Alternative method of indication of drought days (growing season April–September): number of drought days in corre-sponding years (left) and monthly distribution (right). Obr. 16. Alternatívna metóda určenia suchých dní (vegetačné obdobie apríl–september): počty suchých dní v príslušných rokoch (vľavo) a mesačné rozloženie (vpravo).
We consider this approach as more natural be-cause it compares weather parameters from a par-ticular period with averages for the same period in different years rather than long-term averages of weather parameters of all periods.
We tested our approach on the growing season data. The results of year comparisons are depicted in Fig. 16 (left) and are quite similar to those in Fig. 14 (left) and 15 (left). However, the monthly distribution has changed: as one can see in Fig. 16 (right) also in May and June drought periods occur quite frequently (cf. Fig. 14 (right) and 15 (right)). Identification of extreme events by means of the DEA methodology
Data Envelopment Analysis (DEA) has its origin in Operations Research. It is a tool for the evalua-tion of "decision making units" (DMUs) the effi-ciency of which is measured by several parameters rather than a single quantity. Its basic aim is to sin-gle out efficient DMUs. Those are DMUs that lie on the so-called efficient frontier. This is, by defini-tion, a part of the boundary of the (smallest convex) region filled by the parameter vectors of all the DMUs (see e.g. Cooper et al., 2000). Equivalently, a DMU is efficient in case one can find weights under which it maximizes the weighted sum of parameters. This equivalence is a basic result of the mathematical theory of convex sets.
To draw the analogy to extremes of meteorologi-cal events just replace DMUs by events and effi-cient DMUs by extreme events. That is, a K-day period is extreme if and only if there are weights such that it maximizes the weighted sum of the
string of data (precipitation, temperature, humidity) over all periods it is compared to.
The DEA identification method can be best ex-plained by comparing it to the index method of the previous section.
Imagine that for an index with fixed weights one would declare as extreme the event with maximal index. Of course, unless a very unlikely coinci-dence of the values of the indices would take place, such an event would be unique. Therefore, one has to declare as extreme those events the indices of which exceed a certain subjectively chosen thresh-old.
DEA, on the other hand, does not hold the weights fixed for all events. Rather, the weights are chosen individually for each event. An event o is declared extreme if weights can be found such that the value of the index of o is maximal. Of course, in such a case the number of extreme events will be-come higher than one.
Equivalently, one can phrase this in terms of “combined” events. By a combined event we will understand a fictive event the parameter set of which is a convex combination (the coefficients of which may be interpreted as probabilities) of two or more events. An event o is extreme if there is no combined event dominating o, that is, all parame-ters of which are more extreme (in our example, temperature is higher, precipitation and humidity are lower).
Similarly as in the case of an index with chosen weights, an event is trivially extreme if it dominates all other events. However, an event can be declared extreme also if this is not the case (say, there was no day with extreme temperature but the tempera-

P. Brunovský, M. Lapin, I. Melicherčík, J. Somorčík, D. Ševčovič
260
ture was high for an extended period and there was little precipitation).
So, what is then the difference to the index method? Unlike the index method, DEA is com-pletely free of subjective components. Because weights are automatically computed for every event individually, there is no need of their advance sub-jective choice. Further, the selection of extreme events is qualitative, not requiring a choice of a quantitative threshold.
In our application we chose the period of K = 10 days. Consequently, an event is characterized by 3K(= 30 in our case) parameters.
There are several computation methods for DEA, all of them based on linear programming algo-rithms. We have employed the weighted “additive model” method used in Ševčovič et al. (2001). It was first described by Knox Lovell and Pastor (1995). In what follows, we briefly describe this model for our particular case.
As above, we use the notation t, p, h for tempera-ture, precipitation and humidity, respectively and keep the index j to label all the r periods of the pool, the value j = o being used for the period tested for extreme. In addition, we introduce the upper index i = 1,…, K(= 10 in our case) for the particular day of the period. That is, tj
i will stand for the temperature during the ith day of the period labeled by j etc. In order to evaluate efficiency of the period labeled by o one solves the normalized weighted additive DEA model, which is described by the following linear program: Find multiplica-tors λj and “slacks” sj ti, sj pi, sj hi so as to minimize
1 1 1
K K Kp pit ti h hi
i i iv s v s v s∑ ∑ ∑
= = =− − −
1
1
1
under the constraints
r i ti ij j o
jr i pi i
j j ojr i hi i
j j oj
t s t
p s p
h s h
λ
λ
λ
∑=
∑=
∑=
− = ,
+ =
+ = ,
,(3)
The v’s are normalization constants defined by
11 0 1
rj j
jj rλ λ∑
== , ≥ , = ,..., ,
0, 0 0, 1,..., ( 10)ti pi his s s i K≥ ≥ , ≥ = =
(1 ) (1 ), (1 )pt ht pv v v hσ σ σ= / , = / = / , , ,t p hσ σ σ
being the sample standard deviations (period 1951––2005) of temperature, precipitation and humidity respectively. The period labeled o is rated as ex-treme if the optimal value to (3) is zero, or equiva-lently, all the slacks vanish.
It is not immediately obvious that the events with zero slacks are precisely the extreme events intro-duced above. Intuitively, slacks measure the extent to which an event is dominated by combined events. Zero slacks mean that the event is not dominated at all. A precise formulation requires knowledge of mathematical duality theory.
Further note that this computation method does not yield the choice of weights for the tested period o. Their existence is mathematically proven and can be computed. We skip their computation because it is not important for our purpose. Dry and hot extreme periods
In accord with the previous section we define the extreme period as a period with high temperature, low precipitation and low humidity.
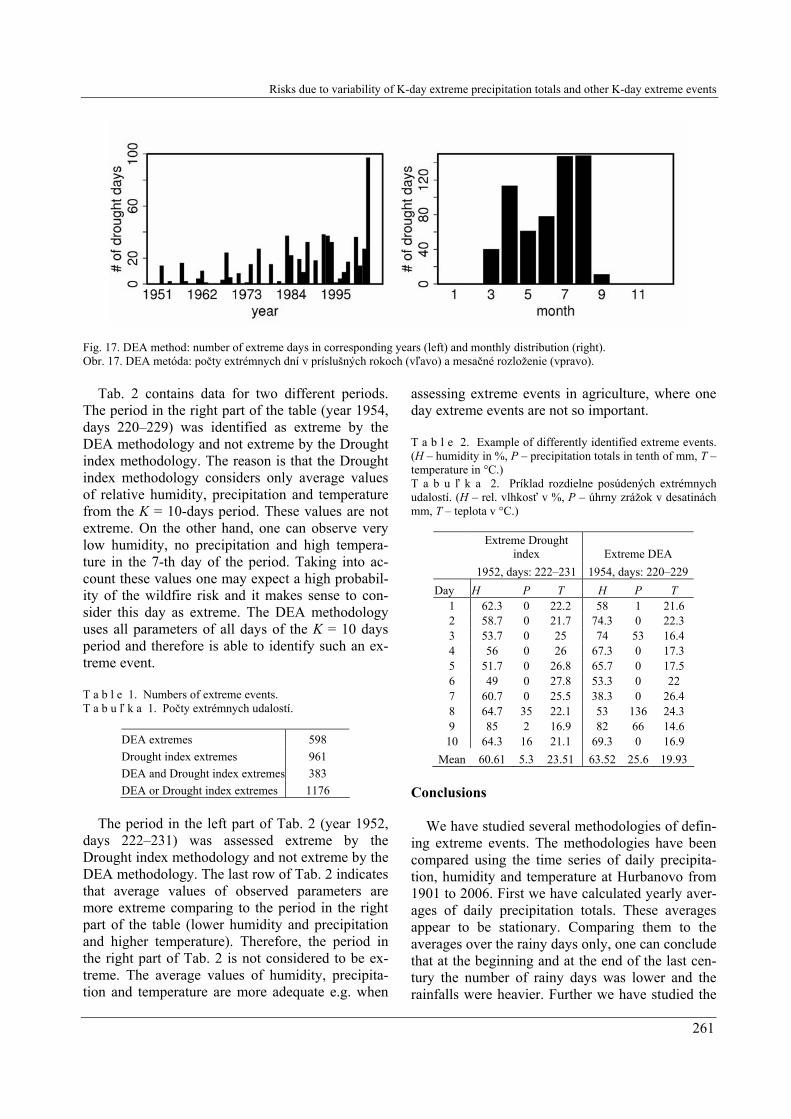
The number of drought days in corresponding years can be seen in Fig. 17 (left). One can observe that this number is slightly increasing. The highest number of drought days (97) was observed in the year 2003. This is in accordance with the index method (see Fig. 14–16 (left)). The monthly distri-bution of the drought days could be seen in Fig. 17 (right). The months with the highest number of drought days are July and August. Quantitative comparison of Drought index and DEA methodologies
Tab. 1 summarizes extreme events assessed by both methodologies. One can see that 1176 periods were assessed as extreme using alternatively DEA or Drought index methodology and only 383 of them were extreme using both methodologies. Number of DEA extremes (598) is smaller compar-ing to Drought index extremes (961). One can ob-serve that 383/598 = 64% of DEA extremes are also Drought index extremes and only 383/961 = 39.9% of Drought index extremes are also DEA extremes. The DEA methodology seems to be more conserva-tive for identification of extreme events.
Risks due to variability of K-day extreme precipitation totals and other K-day extreme events
Fig. 17. DEA method: number of extreme days in corresponding years (left) and monthly distribution (right). Obr. 17. DEA metóda: počty extrémnych dní v príslušných rokoch (vľavo) a mesačné rozloženie (vpravo).
Tab. 2 contains data for two different periods. The period in the right part of the table (year 1954, days 220–229) was identified as extreme by the DEA methodology and not extreme by the Drought index methodology. The reason is that the Drought index methodology considers only average values of relative humidity, precipitation and temperature from the K = 10-days period. These values are not extreme. On the other hand, one can observe very low humidity, no precipitation and high tempera-ture in the 7-th day of the period. Taking into ac-count these values one may expect a high probabil-ity of the wildfire risk and it makes sense to con-sider this day as extreme. The DEA methodology uses all parameters of all days of the K = 10 days period and therefore is able to identify such an ex-treme event. T a b l e 1. Numbers of extreme events. T a b u ľ k a 1. Počty extrémnych udalostí.
DEA extremes 598
261
Drought index extremes 961 DEA and Drought index extremes 383 DEA or Drought index extremes 1176
The period in the left part of Tab. 2 (year 1952,
days 222–231) was assessed extreme by the Drought index methodology and not extreme by the DEA methodology. The last row of Tab. 2 indicates that average values of observed parameters are more extreme comparing to the period in the right part of the table (lower humidity and precipitation and higher temperature). Therefore, the period in the right part of Tab. 2 is not considered to be ex-treme. The average values of humidity, precipita-tion and temperature are more adequate e.g. when
assessing extreme events in agriculture, where one day extreme events are not so important. T a b l e 2. Example of differently identified extreme events. (H – humidity in %, P – precipitation totals in tenth of mm, T – temperature in °C.) T a b u ľ k a 2. Príklad rozdielne posúdených extrémnych udalostí. (H – rel. vlhkosť v %, P – úhrny zrážok v desatinách mm, T – teplota v °C.)
Extreme Drought
index Extreme DEA 1952, days: 222–231 1954, days: 220–229Day H P T H P T
1 62.3 0 22.2 58 1 21.62 58.7 0 21.7 74.3 0 22.3 3 53.7 0 25 74 53 16.4 4 56 0 26 67.3 0 17.3 5 51.7 0 26.8 65.7 0 17.5 6 49 0 27.8 53.3 0 22 7 60.7 0 25.5 38.3 0 26.4 8 64.7 35 22.1 53 136 24.3 9 85 2 16.9 82 66 14.6 10 64.3 16 21.1 69.3 0 16.9
Mean 60.61 5.3 23.51 63.52 25.6 19.93 Conclusions
We have studied several methodologies of defin-ing extreme events. The methodologies have been compared using the time series of daily precipita-tion, humidity and temperature at Hurbanovo from 1901 to 2006. First we have calculated yearly aver-ages of daily precipitation totals. These averages appear to be stationary. Comparing them to the averages over the rainy days only, one can conclude that at the beginning and at the end of the last cen-tury the number of rainy days was lower and the rainfalls were heavier. Further we have studied the
P. Brunovský, M. Lapin, I. Melicherčík, J. Somorčík, D. Ševčovič
262
occurrence of 1–3 days extreme rainfalls. The dis-tribution of heavy rainfalls in the period from 1901 to 2006 is quite uniform.
As a second step we have considered the drought index that combines characteristics based on daily temperature, relative air humidity and precipitation. The number of drought days seems to be increas-ing.
Finally, we have used the DEA methodology for the definition of extreme events. To our knowledge this is the first application of the DEA method to the determination of extreme events of any kind rather than efficiency of performance. Unlike the index method, DEA method is not subject to sub-jective choices of the weights and the threshold but is more computationally involved. The DEA results largely confirm the ones obtained by the drought index: The number of extreme drought periods is increasing over years, their highest occurrence be-ing in July and August. Continuation of this study may contribute to science of disasters (Bunde et al., 2002). Preliminary results indicate that DEA method is more adequate for identifying short-term extreme events, whereas the Drought index meth-odology should be preferred for long-term ones. Acknowledgments. This research was supported by the European Commission under the 6th framework programme project No. 037063 “GEO-BENE”. Some parts of this paper are based on the results of projects VEGA No. 1/4033/07 and observed SHMI data; the authors thank SHMI for making these data series available. List of symbols D – drought index for period i and year j, ij
h – long term average of humidity,
ih – long term average humidity appertaining to fixed pe-riod i in every year,
h – average value of humidity (period i, year j), ijp – long term average of precipitation totals,
ip – long term average of precipitation totals appertaining to fixed period i in every year,
p – average value of precipitation totals (period i, year j), ijt – long term average of temperature, it – long term average of temperature appertaining to fixed
period i in every year, t – average value of temperature (period i, year j), ij
hσ – standard deviation of humidity,
hiσ – standard deviation of humidity appertaining to fixed
period i in every year, pσ – standard deviation of precipitation totals,
piσ – standard deviation of precipitation totals appertaining
to fixed period i in every year, tσ – standard deviation of temperature,
tiσ – standard deviation of temperature appertaining to fixed
period i in every year, hw – weight of the humidity factor,
pw – weight of the precipitation totals factor,
tw – weight of the temperature factor.
REFERENCES BUNDE A., KROPP J., SCHELLNHUBER H.J. (Eds.), 2002:
The Science of Disasters (Climate Disruptions, Heart At-tacks, and Market Crashes). Springer Verlag, Berlin Heidel-berg, 453 pp.
COOPER W.W., SEIFORD L.M., TONE K., 2000: Data En-velopment Analysis (a comprehensive text with models, ap-plications, references and DEA-solver software). Kluwer Academic Publishers, Boston 2000.
HLAVČOVÁ K., SZOLGAY J., KOHNOVÁ S., HLÁSNY T., 2008: Simulation of hydrological response to the future cli-mate in the Hron River basin. J. Hydrol. Hydromech., 56, 3, 163–175.
KLEMENTOVÁ E., LITSCHMAN T., 2001: Výsledky hod-notenia sucha v oblasti Hurbanova. Sucho, hodnocení a predikce. Pracovní seminář, ČHMÚ, Brno 19. 11. 2001.
KOHNOVÁ S., GAÁL L., SZOLGAY J., HLAVČOVÁ K.: Regional estimation of design 10-day precipitation totals in the upper Hron region. Slovak Journal of Civil Engineering, XIV, 2006, 1, 10–18.
LAPIN M., FAŠKO P., 1997: Inter-sequential variability of atmospheric precipitation totals in Slovakia. Acta Meteo-rologica Universitatis Comenianae, XXVI, 33–74.
LAPIN M., MELO M., 2004: Methods of climate change scenarios projection in Slovakia and selected results. J. Hy-drol. Hydromech., 52, 4, 224–238.
MELO M., 2005: Warmer periods in the Slovak mountains according to analogue method and coupled GCM. Hrvatski meteorološki časopis, Vol. 40, 589–592.
KNOX LOVELL C.A., PASTOR J.T., 1995: Units invariant and translation invariant DEA models. Operations Research Letters, 18, 3 1995, 147–151.
SZOLGAY J., PARAJKA J., KOHNOVÁ S., HLAVČOVÁ K., 2009: Comparison of mapping approaches of design an-nual maximum daily precipitation. Atmospheric Research, 92, 289–307.
ŠEVČOVIČ D., HALICKÁ M., BRUNOVSKÝ P., 2001: DEA analysis for a large structured bank branch network. Central European Journal of Operational Research, 9, 329–342.
Received 6 February 2009
Scientific paper accepted 14 October 2009
Risks due to variability of K-day extreme precipitation totals and other K-day extreme events
RIZIKÁ SPÔSOBENÉ VARIABILITOU K-DENNÝCH EXTRÉMNYCH ÚHRNOV ZRÁŽOK A INÝMI EXTRÉMNYMI UDALOSŤAMI Pavol Brunovský, Milan Lapin, Igor Melicherčík, Ján Somorčík, Daniel Ševčovič
Mimoriadne počasie ako zhoda okolností viacerých meteorologických prvkov máva často rad nepriaznivých dôsledkov na socio-ekonomické systémy. Nezriedka môže takéto počasie byť označené za prírodnú katastro-fu. V článku navrhujeme niekoľko definícií extrémnych udalostí. Ako prvý krok je vykonaná štatistická analýza denných úhrnov zrážok z observatória SHMÚ v Hurba-nove, na základe ktorej identifikujeme extrémne udalos-ti. Treba zdôrazniť, že pozorovania z Hurbanova sú na tento účel osobitne vhodné pre ich overenú dlhodobú spoľahlivosť a časovú homogenitu. Následne počítame kombinované charakteristiky, založené na denných úda-joch teploty vzduchu, relatívnej vlhkosti vzduchu a denných úhrnoch zrážok. Index sucha je založený na normalizovaných odchýlkach od dlhodobých priemerov. Takto je zabezpečený výpočet indexu sucha iba málo ovplyvnený ročným chodom. Alternatívne definujeme extrémne udalosti na základe DEA analýzy, kde K-denné periódy teploty, vlhkosti a zrážok zodpovedajú rozhodo-vacím jednotkám v pôvodnej oblasti jej použitia. Vý-sledky všetkých prístupov nakoniec porovnáme. Metodi-ka spracovania a aj prezentované výsledky predstavujú otvorený systém, ktorý sa bude dať priebežne dopĺňať, rozširovať a spresňovať.
Zoznam použitých symbolov D – index sucha pre periódu i a rok j, ij
h – dlhodobý priemer vlhkosti,
ih – dlhodobý priemer vlhkosti pre fixné obdobie i v každom roku,
h – priemerná vlhkosť (perióda i, rok j), ijp – dlhodobý priemer úhrnov zrážok,
ip – dlhodobý priemer úhrnov zrážok pre fixné obdobie i v každom roku,
p – priemer úhrnov zrážok (perióda i, rok j), ijt – dlhodobý priemer teploty, it – dlhodobý priemer teploty pre fixné obdobie i v každom
roku, t – priemerná teplota (perióda i, rok j), ij
hσ – smerodajná odchýlka vlhkosti, – smerodajná odchýlka vlhkosti pre fixné obdobie i v
každom roku, hiσ
pσ – smerodajná odchýlka úhrnov zrážok,
– smerodajná odchýlka úhrnov zrážok pre fixné obdobie i
v každom roku, piσ
tσ – smerodajná odchýlka teploty, – smerodajná odchýlka teploty pre fixné obdobie i v
každom roku, tiσ
hw – váha faktora vlhkosti,
pw – váha faktora úhrnov zrážok,
tw – váha faktora teploty.
263
Related Documents

![[XPday.vn] is XP still eXtreme? {keynote talk} (at) [XP Day Vietnam 2015]](https://static.cupdf.com/doc/110x72/55c8195cbb61eb153f8b456a/xpdayvn-is-xp-still-extreme-keynote-talk-at-xp-day-vietnam-2015.jpg)