Risks & Mitigation for Health Insurance Companies Sponsored by Society of Actuaries Health Section Prepared by Alice Rosenblatt, FSA, MAAA, CERA Manager, AFR Consulting 23679 Calabasas Road #1019 Calabasas, CA 91302 Phone: (818) 216-3690 Email: [email protected] Sim Segal, FSA, CERA President, SimErgy Consulting Chrysler Building 405 Lexington Ave., 26 th Flr New York, NY 10174 Phone: (646) 862-6134 Email: [email protected] © 2012 Society of Actuaries, All Rights Reserved The opinions expressed and conclusions reached by the authors are their own and do not represent any official position or opinion of the sponsoring organizations or their members. The sponsoring organizations make no representation or warranty to the accuracy of the information.

Welcome message from author
This document is posted to help you gain knowledge. Please leave a comment to let me know what you think about it! Share it to your friends and learn new things together.
Transcript
Risks & Mitigation for Health Insurance Companies
Sponsored by Society of Actuaries
Health Section
Prepared by
Alice Rosenblatt, FSA, MAAA, CERA Manager, AFR Consulting
23679 Calabasas Road #1019 Calabasas, CA 91302
Phone: (818) 216-3690
Email: [email protected]
Sim Segal, FSA, CERA President, SimErgy Consulting
Chrysler Building 405 Lexington Ave., 26th Flr New York, NY 10174
Phone: (646) 862-6134
Email: [email protected]
© 2012 Society of Actuaries, All Rights Reserved
The opinions expressed and conclusions reached by the authors are their own and do not represent any official position or opinion of the sponsoring organizations or their members. The sponsoring organizations make no representation or warranty to the accuracy of the information.
©2012 Society of Actuaries AFR Consulting and SimErgy Consulting
2
TABLE OF CONTENTS
Executive summary
3
Participating companies
4
Project Oversight Group
4
Approach
5
Results
11
Appendix A: Key Risks Common to Health Insurance Companies
14
Appendix B: KRIs and Mitigation for Top-20 Risks Common to Health Insurance Companies
18

©2012 Society of Actuaries AFR Consulting and SimErgy Consulting
3
EXECUTIVE SUMMARY
The objectives of this research project sponsored by the Society of Actuaries are to “document the identification, management and mitigation of the risks with which health actuaries need to contend.”i
Given the timing of this study, it is not surprising that many of the key risks identified were connected to the Affordable Care Act (ACA) implementation, regulatory review of rates, and changes in reimbursement to government-funded programs such as Medicare Advantage and Medicaid. At the time of this study, companies were actively involved in planning for the implementation of major components of the ACA in 2014. The first set of interviews was conducted in late March and April of 2012, and the second set of interviews was conducted in August of 2012. Thus, the first set of interviews was conducted prior to the June 28th Supreme Court decision concerning the ACA, while the second set of interviews was conducted after the Supreme Court decision. All work on the report was done prior to the November 2012 Presidential election, during a time when a great deal of controversy and uncertainty existed concerning implementation of the ACA. In addition, there was a great deal of political uncertainty concerning federal and state budgetary pressures on programs such as Medicare and Medicaid.
Interviews were conducted with ten large U.S. health insurance companies to identify their key risks and to rank the key risks using likelihood and severity estimates. For the top-20 key risks, the carriers were asked to identify the key risk indicators (KRIs) they use for monitoring and the activities they use, or plan to use, to mitigate the likelihood of occurrence and/or the severity of impact.
The top five risks identified were:
1. State and/or Federal regulators do not approve actuarially justified rate increases.
2. Pricing assumptions not realized due to unexpected behaviors of state exchange regulators and consumers.
3. Federal budget pressures result in reduction of reimbursements for Medicare Advantage
4. State exchanges commoditize the market resulting in a loss of market share
5. Mispricing medical trend
There were 45 risks identified. Appendix A provides a compilation of all 45 of these risks and their relative rankings. Of the 45 risks, 11 (24%) were connected to the ACA.ii There were eight (18%) risks connected to Medicare and Medicaid programs.iii Increased regulatory scrutiny, and the associated actions, such as the number one risk above, accounted for five (11%) of the risks identified.iv Trend issues (such as number five above) accounted for five (11%) of the risks.v
The most popular risk category, representing 80% of the key risks identified, was strategic risk. This is consistent with industry studies on sources of risk. However, this often surprises insurance companies that have not yet conducted a thorough and formal qualitative risk assessment and have been instead focusing most of their ERM efforts on financial and insurance risks.
The Key Result Indicators (KRIs) were identified for the top 20 risks and consolidated. (See the table on page 12 and Appendix B). There was a great deal of consistency among carriers. KRIs mentioned frequently included:
• Changes in the political/regulatory environment from news releases or industry association releases
• Emerging results such as loss ratios, financial results and trend reporting and analyses
©2012 Society of Actuaries AFR Consulting and SimErgy Consulting
4
• Information on competitors from publicly available rate filings, earnings reports, and industry studies such as HCCI.
Mitigation techniques are those that will reduce the likelihood or severity of the identified risk. These were also identified for the top 20 risks, and as with the KRIs, there were similarities between the companies’ responses. (See the table on page 12 and Appendix B).
The most common mitigation actions were:
• Carriers with broader product lines and in diverse geographic areas, identified diversification or selective participation in exchanges by state or product or customer segment as mitigating actions
• Communication with regulators and legislators
• Improved rate filings and pricing changes
• Plan design changes
• Provider contracting and network changes
• Increased medical management
• Expense management
The researchers’ recommend that Enterprise Risk Management be an ongoing research topic, with a study similar to this one conducted periodically, since the health care risks will vary greatly with the economic and political environment, as well as new medical advances. We also recommend that Enterprise Risk Management for Health Insurance continue to be a part of both basic and continuing education for health actuaries.
PARTICIPATING COMPANIES
Ten U.S. health insurance companies participated in this research study. The authors wish to thank these companies for their assistance and valuable input. This study would not have been possible without their contributions of time and knowledge.
PROJECT OVERSIGHT GROUP
The authors would also like to thank Steve Siegel from the Society of Actuaries and the volunteers in the Project Oversight Group who provided valuable guidance and input. The members of the Project Oversight Group were Jeffrey Allen, Joan Barrett, Patrick Collins, Robert Hanes, Rafi Herzfeld, Trevor Pollitt, Bernie Rabinowitz, Sudha Shenoy and Robert Wolf.
©2012 Society of Actuaries AFR Consulting and SimErgy Consulting
5
APPROACH
The research was structured in two parts:
A. Identify and rank key risks
B. Identify key risk indicators (KRIs) and mitigation
A. Identify and Rank Key Risks
We conducted a qualitative risk assessment interview to identify and rank each organization’s key risks. We used the value-based ERM approach, as outlined in Sim Segal’s book Corporate Value of Enterprise Risk Management, modified for use across multiple companies (as opposed to use within a single enterprise, as is more common in ERM). This involved four stages:
1. Identify qualitative risk assessment survey participants
2. Provide advance communication
3. Conduct qualitative risk assessment interviews
4. Conduct consensus scoring
1. Identify Qualitative Risk Assessment Survey Participants
We invited each company to have two representatives participate in the qualitative risk assessment survey: the chief actuary and the chief risk officer or equivalent head of the ERM program. Chief actuaries or actuaries involved in ERM programs attended all 10 interviews. Chief risk officers or equivalent heads of the ERM program attended seven of the 10 interviews.
2. Provide Advance Communication
We provided an advance communication to each company. The advance communication provided guidance on the type of information to provide. This included some background on, and definitions of terms used in, the value-based ERM approach; this helped to enhance the consistency of results, since ERM approaches and definitions typically vary across companies. The advance communication provided guidance on the following:
• Input needed from participants
• Definition of key risk
• Categories of risk
• Specifying a scenario
• Defining risks by source
• Scoring criteria
• Sample risk categorization and definition tool
©2012 Society of Actuaries AFR Consulting and SimErgy Consulting
6
Input needed from participants
We asked survey participants to prepare to provide the following information during the qualitative risk assessment survey (each of these items is further defined below):
• The key risks to their organization
• For each key risk, the credible-worst-case scenario
• For each key risk, as manifested by its credible-worst-case scenario:
o Likelihood score
o Severity score
Definition of key risk
We defined key risks as those that, if they were to occur, would have a large negative impact on company value, where company value, while somewhat analogous to market capitalization, is an internal valuation calculated as the present value of distributable cash flows (where distributable cash flows are fairly close to post-tax statutory earnings less the increase in required capital) that would result if the strategic plan were to be perfectly achieved.
One reason to use value as the single severity metric is that, for corporate entities, it is the only metric that fully captures the impacts of all types of risk. Whether the largest impact of a risk is a decrease in revenues, or an increase in expenses, or a balance sheet impact or an increase in the cost of capital, the value metric reflects all such impacts, and accounts for them in the correct time-value-discounted proportion. Another reason to use the value metric as the severity metric is that this allows the most direct comparisons between risks and also between companies.
Categories of risk
We specified that all risk categories should be considered when selecting the key risks. Risk categories include: strategic risks (e.g., strategic execution risk, competitor risk, regulatory risk, etc.); operational risks (e.g., technology risk, human resources risk, disaster risk, etc.); financial risk (e.g., market risk, credit risk, etc.); and insurance risk (e.g., mispricing, under-reserving, etc.).
Many financial services companies focus the majority of their efforts on financial and insurance risks. However, industry studies show that the vast majority of the volatility of results arises from strategic and operational risks rather than from financial and insurance risks. In addition, management does not care from where an unexpected event arises that results in the failure to achieve strategic plan expectations…management simply doesn’t want such surprises; therefore, ERM must include all categories of risk in its scope, and in a consistently-thorough manner.
Specifying a scenario
We advised against attempting to estimate likelihood and severity for a broad “risk.” Each risk may have a wide variety of risk scenarios and each survey participant might be imagining a different one when
©2012 Society of Actuaries AFR Consulting and SimErgy Consulting
7
providing their assessment. This distorts the results. Rather, to enhance the level of consistency in scoring, to the extent possible, it is preferable to specify a “credible-worst-case scenario” for the risk, and then provide likelihood and severity scores on that scenario. A credible-worst-case scenario is something that is rare and severe but still something that is a reasonable concern. For example, for a data breach involving privacy-related data, the credible-worst-case scenario might be a data breach involving a deliberately stolen set of unencrypted data comprised of a specific percentage of all current policyholders’ privacy-related data.
Defining risks by source
We indicated that risks should be identified by their originating source. Often, companies inconsistently define risks – some are defined by source and some by outcome. For example, “reputation risk” or “ratings downgrade risk” are both examples of risks improperly defined by outcome. There are multiple independent sources of risk that can trigger each of these, and each different source of risk should be identified and qualitatively scored separately, again, to avoid inconsistencies in the variations that survey participants are imagining when they provide their scores.
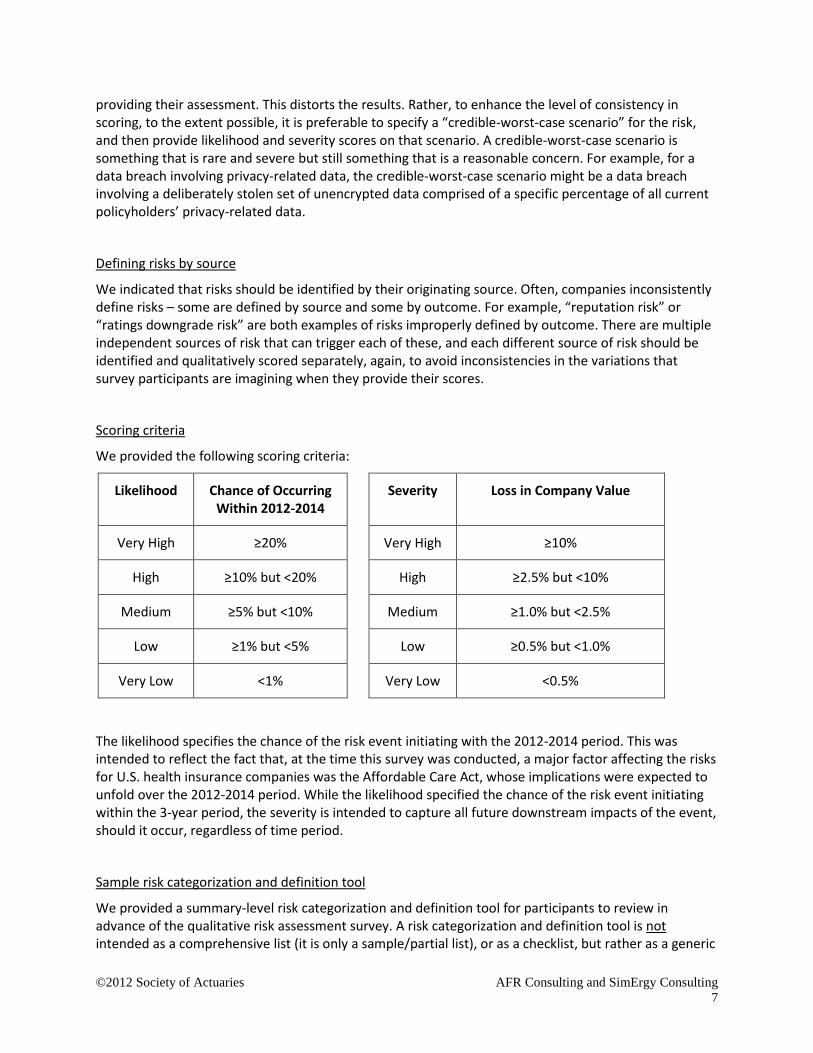
Scoring criteria
We provided the following scoring criteria:
Likelihood Chance of Occurring Within 2012-2014
Severity Loss in Company Value
Very High ≥20% Very High ≥10%
High ≥10% but <20% High ≥2.5% but <10%
Medium ≥5% but <10% Medium ≥1.0% but <2.5%
Low ≥1% but <5% Low ≥0.5% but <1.0%
Very Low <1% Very Low <0.5%
The likelihood specifies the chance of the risk event initiating with the 2012-2014 period. This was intended to reflect the fact that, at the time this survey was conducted, a major factor affecting the risks for U.S. health insurance companies was the Affordable Care Act, whose implications were expected to unfold over the 2012-2014 period. While the likelihood specified the chance of the risk event initiating within the 3-year period, the severity is intended to capture all future downstream impacts of the event, should it occur, regardless of time period.
Sample risk categorization and definition tool
We provided a summary-level risk categorization and definition tool for participants to review in advance of the qualitative risk assessment survey. A risk categorization and definition tool is not intended as a comprehensive list (it is only a sample/partial list), or as a checklist, but rather as a generic

©2012 Society of Actuaries AFR Consulting and SimErgy Consulting
8
high-level summary of some prominent risk categories and sub-categories, intended to illustrate both the broad range of risk types that are in scope for the qualitative risk assessment and the approach to defining risks by their source. The precise positioning of a risk sub-category within a specific category is not particularly important, since that varies company-to-company; rather, the holistic consideration of all risk types is paramount. For examples of risk categorization and definition tools, see Chapter 4 of Corporate Value of Enterprise Risk Management.
3. Conduct Qualitative Risk Assessment Interviews
We conducted phone interviews with survey participants to collect the key risks, the credible-worst-case scenarios, and the likelihood and severity scores. We allotted 90 minutes to each interview, although not all interviews required the full allotted time. We provided interactive guidance to interviewees on providing risks that fit our ERM approach, such as ensuring that risks were properly defined by source.
These interviews were conducted during late March and April 2012. During this timeframe, companies were actively involved in planning for the implementation of the major provisions of the ACA in January of 2014. Thus, it is not surprising that many of the identified risks were connected with the regulatory environment and the many unknowns about how states would implement the ACA provisions.
We received from four to twelve risks from each company, with the majority providing five risks.
In addition, the interviews were conducted in a way that protected the anonymity of the survey participants. Only the two consultants conducting the interviews had knowledge of which survey participants provided which risks. Following the individual interviews, the information was aggregated.
4. Conduct Consensus Scoring
The consensus scoring was performed in four steps:
1. Consolidation
2. Review
3. Scoring
4. Finalizing results
1. Consolidation
We consolidated the total list of key risks collected from all survey participants, eliminating similar or duplicate items. The initial list of key risks collected was 67 risks and this was consolidated down to 45 risks. Then one risk was eliminated when the Supreme Court decision on the ACA was announced on June 28, 2012. That particular risk was no longer relevant because of the final Supreme Court decision, resulting in 44 risks.
2. Review
The SOA Project Oversight Group (POG) for this research reviewed the consolidated list of risks. All of the risks were confirmed without change, with one exception: the POG added one risk to the list
©2012 Society of Actuaries AFR Consulting and SimErgy Consulting
9
because of the June 28th Supreme Court decision: “Various states do not implement Medicaid expansion.”
3. Scoring
The final consolidated list of risks, including the one addition by the POG, was circulated to the original survey participants, with a request to provide likelihood and severity scores (using the same guidance and scoring criteria as earlier) for each risk, or to provide “not applicable” where warranted (e.g., the risk related to business that is not a part of the company’s product portfolio).
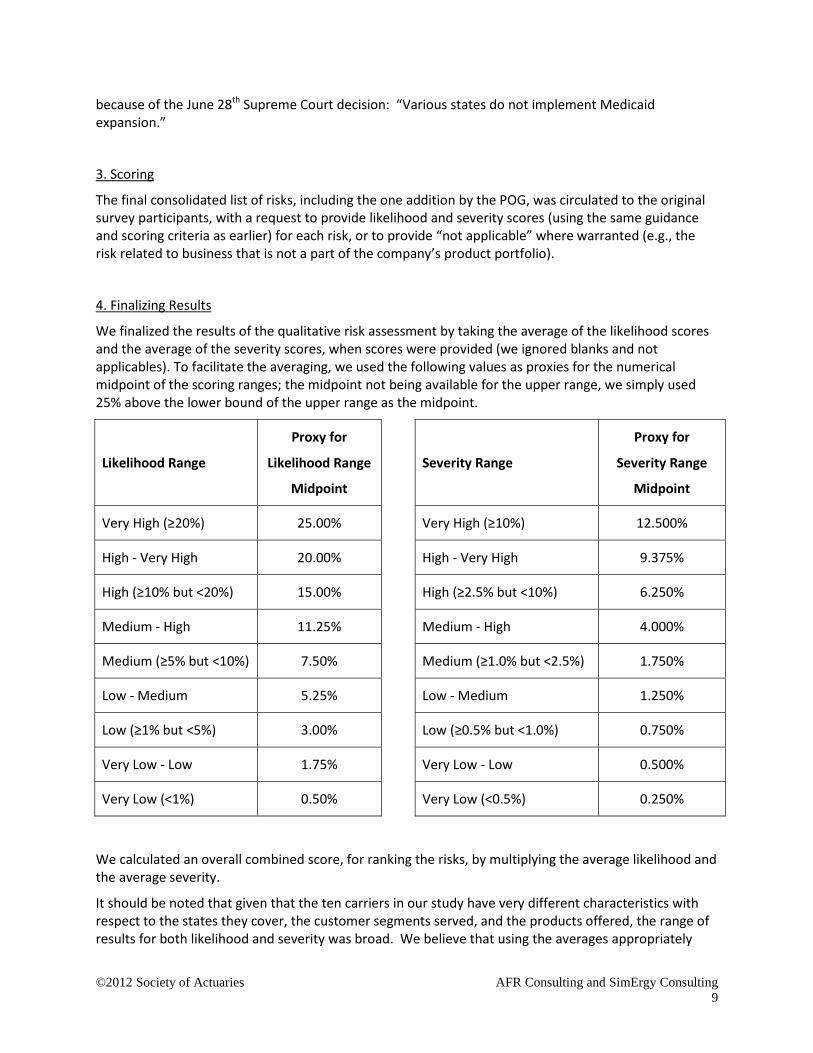
4. Finalizing Results
We finalized the results of the qualitative risk assessment by taking the average of the likelihood scores and the average of the severity scores, when scores were provided (we ignored blanks and not applicables). To facilitate the averaging, we used the following values as proxies for the numerical midpoint of the scoring ranges; the midpoint not being available for the upper range, we simply used 25% above the lower bound of the upper range as the midpoint.
Likelihood Range
Proxy for
Likelihood Range
Midpoint
Severity Range
Proxy for
Severity Range
Midpoint
Very High (≥20%) 25.00% Very High (≥10%) 12.500%
High - Very High 20.00% High - Very High 9.375%
High (≥10% but <20%) 15.00% High (≥2.5% but <10%) 6.250%
Medium - High 11.25% Medium - High 4.000%
Medium (≥5% but <10%) 7.50% Medium (≥1.0% but <2.5%) 1.750%
Low - Medium 5.25% Low - Medium 1.250%
Low (≥1% but <5%) 3.00% Low (≥0.5% but <1.0%) 0.750%
Very Low - Low 1.75% Very Low - Low 0.500%
Very Low (<1%) 0.50% Very Low (<0.5%) 0.250%
We calculated an overall combined score, for ranking the risks, by multiplying the average likelihood and the average severity.
It should be noted that given that the ten carriers in our study have very different characteristics with respect to the states they cover, the customer segments served, and the products offered, the range of results for both likelihood and severity was broad. We believe that using the averages appropriately

©2012 Society of Actuaries AFR Consulting and SimErgy Consulting
10
adjusted for these differences. However, numerous other methods could have been used to consolidate the risks and to rank them. For example, another method might have been to exclude the lowest and highest responses for each risk and then use the average of the remaining eight responses. We decided not to use this alternate approach given that we would have then had only eight responses to use in the calculation of the average.
B. Identify Key Risk Indicators (KRIs) and Mitigation
In the second part of the research, we conducted a second set of interviews with participating companies to identify, for each of the top-20 key risks identified in the first part of the research:
• Which key risk indicators (KRIs) they used (KRIs are leading indicators used to monitor the emergence of each risk); and
• What mitigation actions they used, or planned to use, or may optionally use, for each risk (mitigation is actions taken to lower the likelihood and/or severity of the risk)
As in the first part of the research, we conducted phone interviews with survey participants to collect this information. The participating interviewees were similar to those in the first part of the research, with some exceptions where additional individuals with more specific information were included. We allotted 90 minutes to each interview, although not all interviews required the full allotted time. We provided interactive guidance to interviewees on providing specific KRIs and on clarifying specific actions associated with mitigation. These interviews were conducted during August 2012.
In addition, as in the first part of the research, the interviews were conducted in a way that protected the anonymity of the survey participants. Only the two consultants conducting the interviews had knowledge of which survey participants provided which KRIs and mitigation. Following the individual interviews, the information was consolidated to remove exact or near duplicates.

©2012 Society of Actuaries AFR Consulting and SimErgy Consulting
11
RESULTS
The 45 consolidated risks identified by these ten health insurance companies are shown in Appendix A.
The top five risks were:
1. State and/or Federal regulators do not approve actuarially justified rate increases.
2. Pricing assumptions not realized due to unexpected behaviors of state exchange regulators and consumers.
3. Federal budget pressures result in reduction of reimbursements for Medicare Advantage.
4. State exchanges commoditize the market resulting in a loss of market share
5. Mispricing medical trend.
Given the timing of this study, in the midst of carriers preparing for the implementation of major portions of the ACA in January 2014, it is not surprising that many of the risks involved the ACA. The following table provides a distribution of the 45 risks:
Type of Risk Number of Risks Percent of total
ACA related ii 11 24%
Medicaid/Medicare related iii 8 18%
Increased regulatory scrutiny iv 5 11%
Trend v 5 11%
Other 16 36%
As mentioned in the “Categories of risk” description on page 6, we specified that all risk categories should be considered, including strategic risks, operational risks, financial risk and insurance risk. The most popular risk category, representing 80% of the key risks identified, was strategic risk. This is consistent with industry studies on sources of risk. However, this often surprises insurance companies that have not yet conducted a thorough and formal qualitative risk assessment and have been instead focusing most of their ERM efforts on financial and insurance risks.
The researchers and the Project Oversight Group were surprised that there was little mention of operational risks. The timing of the study and the focus of most companies on the implications of the ACA probably explains this.
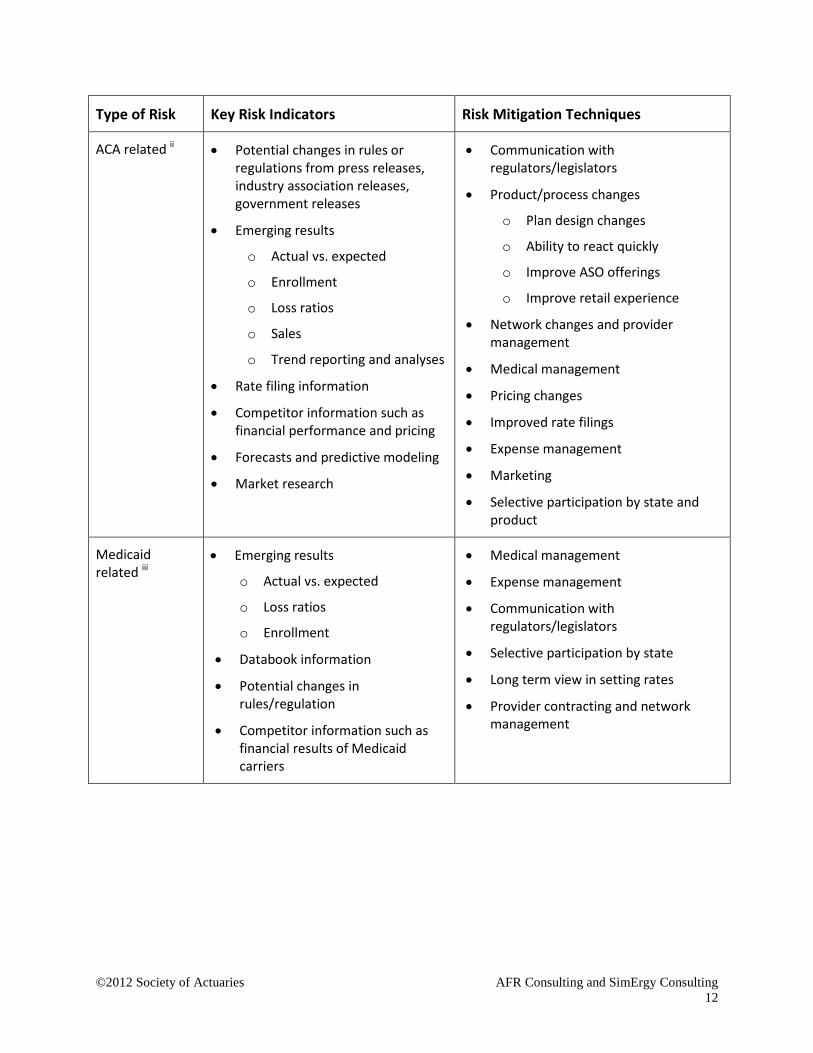
For the top 20 risks, each of the carriers was asked to provide KRIs and Mitigation actions. Given the diversity of the companies as to size, geographic presence, and products and customer segments served, the KRIs and Mitigation actions showed many similarities. The KRIs and Mitigation actions are shown in Appendix B, and a summary is provided in the following table.
©2012 Society of Actuaries AFR Consulting and SimErgy Consulting
12
Type of Risk Key Risk Indicators Risk Mitigation Techniques
ACA related ii • Potential changes in rules or regulations from press releases, industry association releases, government releases
• Emerging results
o Actual vs. expected
o Enrollment
o Loss ratios
o Sales
o Trend reporting and analyses
• Rate filing information
• Competitor information such as financial performance and pricing
• Forecasts and predictive modeling
• Market research
• Communication with regulators/legislators
• Product/process changes
o Plan design changes
o Ability to react quickly
o Improve ASO offerings
o Improve retail experience
• Network changes and provider management
• Medical management
• Pricing changes
• Improved rate filings
• Expense management
• Marketing
• Selective participation by state and product
Medicaid related iii
• Emerging results
o Actual vs. expected
o Loss ratios
o Enrollment
• Databook information
• Potential changes in rules/regulation
• Competitor information such as financial results of Medicaid carriers
• Medical management
• Expense management
• Communication with regulators/legislators
• Selective participation by state
• Long term view in setting rates
• Provider contracting and network management
©2012 Society of Actuaries AFR Consulting and SimErgy Consulting
13
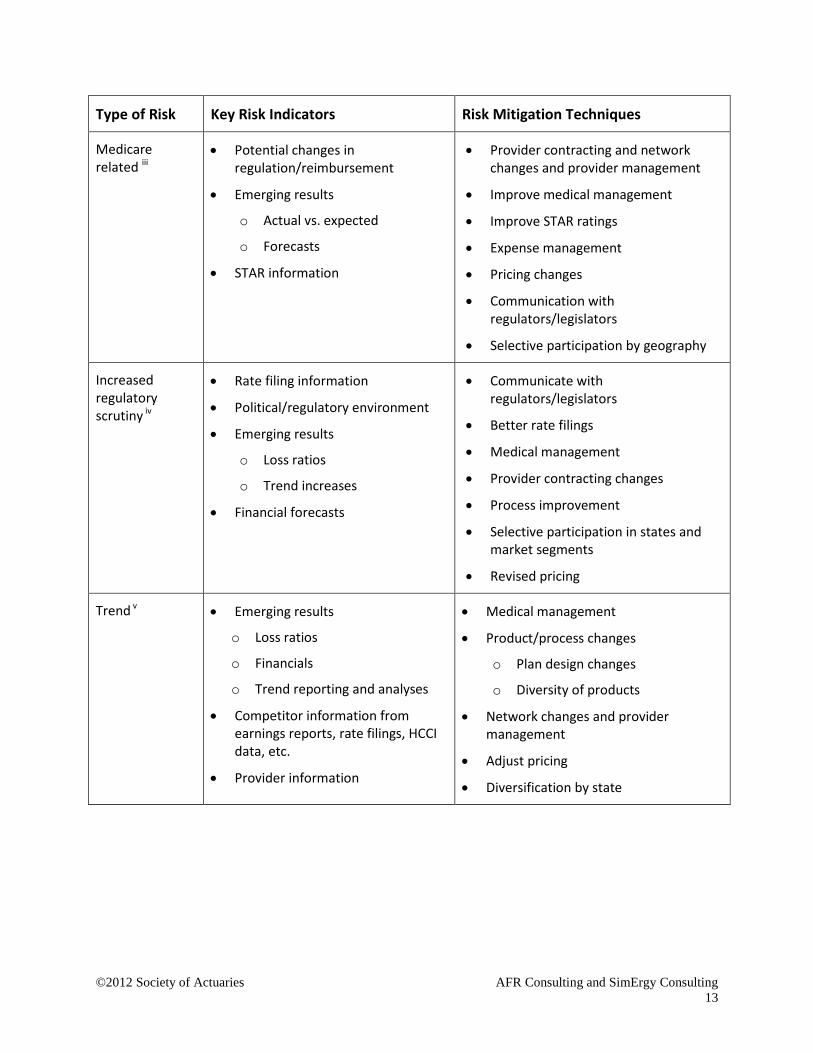
Type of Risk Key Risk Indicators Risk Mitigation Techniques
Medicare related iii
• Potential changes in regulation/reimbursement
• Emerging results
o Actual vs. expected
o Forecasts
• STAR information
• Provider contracting and network changes and provider management
• Improve medical management
• Improve STAR ratings
• Expense management
• Pricing changes
• Communication with regulators/legislators
• Selective participation by geography
Increased regulatory scrutiny iv
• Rate filing information
• Political/regulatory environment
• Emerging results
o Loss ratios
o Trend increases
• Financial forecasts
• Communicate with regulators/legislators
• Better rate filings
• Medical management
• Provider contracting changes
• Process improvement
• Selective participation in states and market segments
• Revised pricing
Trend v • Emerging results
o Loss ratios
o Financials
o Trend reporting and analyses
• Competitor information from earnings reports, rate filings, HCCI data, etc.
• Provider information
• Medical management
• Product/process changes
o Plan design changes
o Diversity of products
• Network changes and provider management
• Adjust pricing
• Diversification by state

©2012 Society of Actuaries AFR Consulting and SimErgy Consulting
14
Appendix A: Key Risks Common to Health Insurance Companies
Rank Category Subcategory Division Risk Average Likelihood
Average Severity
Combined Score
1 Strategic Regulatory Regulatory practices
State and/or Federal regulators do not approve actuarially justified rate increases 16.86% 5.50% 0.927%
2 Insurance Pricing Pricing assumptions not realized due to unexpected behaviors of state exchange regulators and consumers 20.83% 3.83% 0.799%
3 Strategic Economic Federal budget pressures result in reduction of reimbursements for Medicare Advantage 15.83% 4.56% 0.721%
4 Strategic Strategy
Channel-related and
Market-related
State exchanges commoditize the market resulting in a loss of market share 12.86% 4.75% 0.611%
5 Insurance Pricing Mispricing medical trend 10.68% 5.59% 0.596%
6 Insurance Pricing ACA stays in place as is, and antiselection results in our attracting more than our fair share of poor risks 11.81% 4.86% 0.574%
7 Strategic Regulatory New regulation
Regulatory changes (ACA) result in larger-than-expected rate increases by all carriers leading to a public backlash against the healthcare market resulting in regulatory actions and/or rate increase restrictions
16.56% 3.31% 0.548%
8 Strategic Strategy execution
Product/ services-related
Inadequate medical cost management 8.23% 6.35% 0.522%
9 Strategic Regulatory New regulation
The ACA or a replacement health care reform law creates a change from an employer-based market to an individual market impacting capital requirements, market share, and profitability
12.60% 4.00% 0.504%
10 Strategic Strategy execution
Market-related Loss of large account/accounts 13.13% 3.61% 0.474%
11 Strategic Competitor Competitor action
Competitors (such as other carriers, ACOs, other provider organizations, etc.) negotiate for better medical provider unit costs
9.23% 4.68% 0.431%
12 Strategic Strategy execution
Product-related
Loss of small group market share as small groups drop employer-sponsored coverage 12.17% 3.34% 0.407%
©2012 Society of Actuaries AFR Consulting and SimErgy Consulting
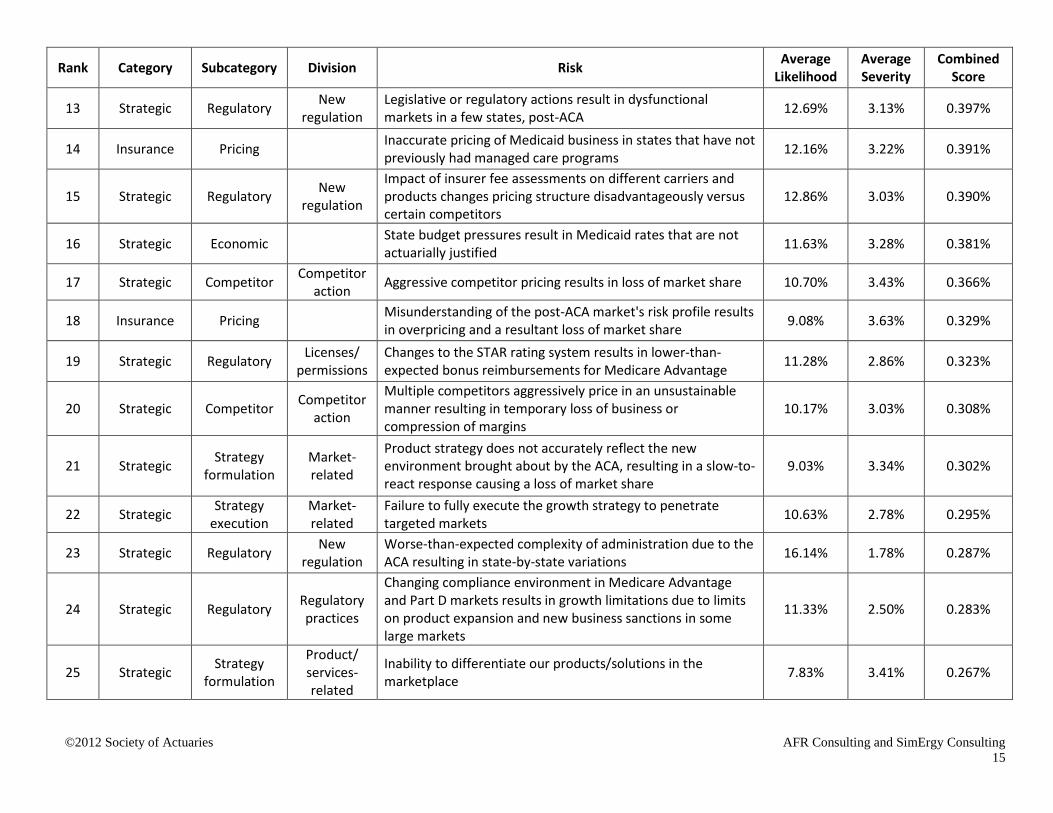
15
Rank Category Subcategory Division Risk Average Likelihood
Average Severity
Combined Score
13 Strategic Regulatory New regulation
Legislative or regulatory actions result in dysfunctional markets in a few states, post-ACA 12.69% 3.13% 0.397%
14 Insurance Pricing Inaccurate pricing of Medicaid business in states that have not previously had managed care programs 12.16% 3.22% 0.391%
15 Strategic Regulatory New regulation
Impact of insurer fee assessments on different carriers and products changes pricing structure disadvantageously versus certain competitors
12.86% 3.03% 0.390%
16 Strategic Economic State budget pressures result in Medicaid rates that are not actuarially justified 11.63% 3.28% 0.381%
17 Strategic Competitor Competitor action Aggressive competitor pricing results in loss of market share 10.70% 3.43% 0.366%
18 Insurance Pricing Misunderstanding of the post-ACA market's risk profile results in overpricing and a resultant loss of market share 9.08% 3.63% 0.329%
19 Strategic Regulatory Licenses/ permissions
Changes to the STAR rating system results in lower-than-expected bonus reimbursements for Medicare Advantage 11.28% 2.86% 0.323%
20 Strategic Competitor Competitor action
Multiple competitors aggressively price in an unsustainable manner resulting in temporary loss of business or compression of margins
10.17% 3.03% 0.308%
21 Strategic Strategy formulation
Market-related
Product strategy does not accurately reflect the new environment brought about by the ACA, resulting in a slow-to-react response causing a loss of market share
9.03% 3.34% 0.302%
22 Strategic Strategy execution
Market-related
Failure to fully execute the growth strategy to penetrate targeted markets 10.63% 2.78% 0.295%
23 Strategic Regulatory New regulation
Worse-than-expected complexity of administration due to the ACA resulting in state-by-state variations 16.14% 1.78% 0.287%
24 Strategic Regulatory Regulatory practices
Changing compliance environment in Medicare Advantage and Part D markets results in growth limitations due to limits on product expansion and new business sanctions in some large markets
11.33% 2.50% 0.283%
25 Strategic Strategy formulation
Product/ services-related
Inability to differentiate our products/solutions in the marketplace 7.83% 3.41% 0.267%

©2012 Society of Actuaries AFR Consulting and SimErgy Consulting
16
Rank Category Subcategory Division Risk Average Likelihood
Average Severity
Combined Score
26 Strategic Regulatory Regulatory practices
Unexpected increase in state regulatory scrutiny and associated requirements 13.50% 1.75% 0.236%
27 Strategic Regulatory Regulatory practices
Pricing constraints in rating reforms leads to loss of better risks and/or loss of volume of business 10.75% 2.13% 0.228%
28 Strategic Strategy execution
Product/ services
innovation
Data analytics not keeping pace with those of competitors leading to poorer-than-expected benefits of customer segmentation, marketing, acquisition, and execution of behavioral incentives
9.53% 2.31% 0.220%
29 Strategic Regulatory Regulatory practices
State regulations impose upper limits on insurance company capital requiring excess capital be refunded or used to lower premiums
8.61% 2.53% 0.218%
30 Strategic Industry practices
Allegations of inappropriate industry practices result in media coverage and new regulations which increase the levels of scrutiny and costs
8.53% 2.50% 0.213%
31 Insurance Pricing Upcoding accompanying the conversion of ICD-9 to ICD-10 results in claim costs worse than expected 8.65% 2.38% 0.205%
32 Insurance Pricing Hospital cost trend is higher than expected 8.20% 2.48% 0.203%
33 Strategic Competitor Competitor action
Competitors exit certain markets increasing antiselection yet our exiting the market is not viable (either because of the cost or political considerations)
8.00% 2.50% 0.200%
34 Strategic Regulatory Regulatory practices Various states do not implement Medicaid expansion 13.22% 1.47% 0.194%
35 Operational Disaster Natural disaster
Epidemic (such as avian flu) occurs with severity 2-3 times worse than H1N1 3.55% 4.89% 0.174%
36 Strategic Competitor New entrant A new type of competitor enters and disrupts the market 4.93% 3.50% 0.172% 37 Strategic Economic The economy experiences a double-dip recession 7.55% 2.18% 0.164%
38 Strategic Strategy formulation
Product/ services-related
Unexpected increase in customer-related technology requirements 7.50% 2.06% 0.154%
39 Strategic Strategy execution
Product/ services-related
Inability of I/T-supported customer service quality to keep pace with competitors resulting in loss of market share 9.10% 1.56% 0.142%
©2012 Society of Actuaries AFR Consulting and SimErgy Consulting
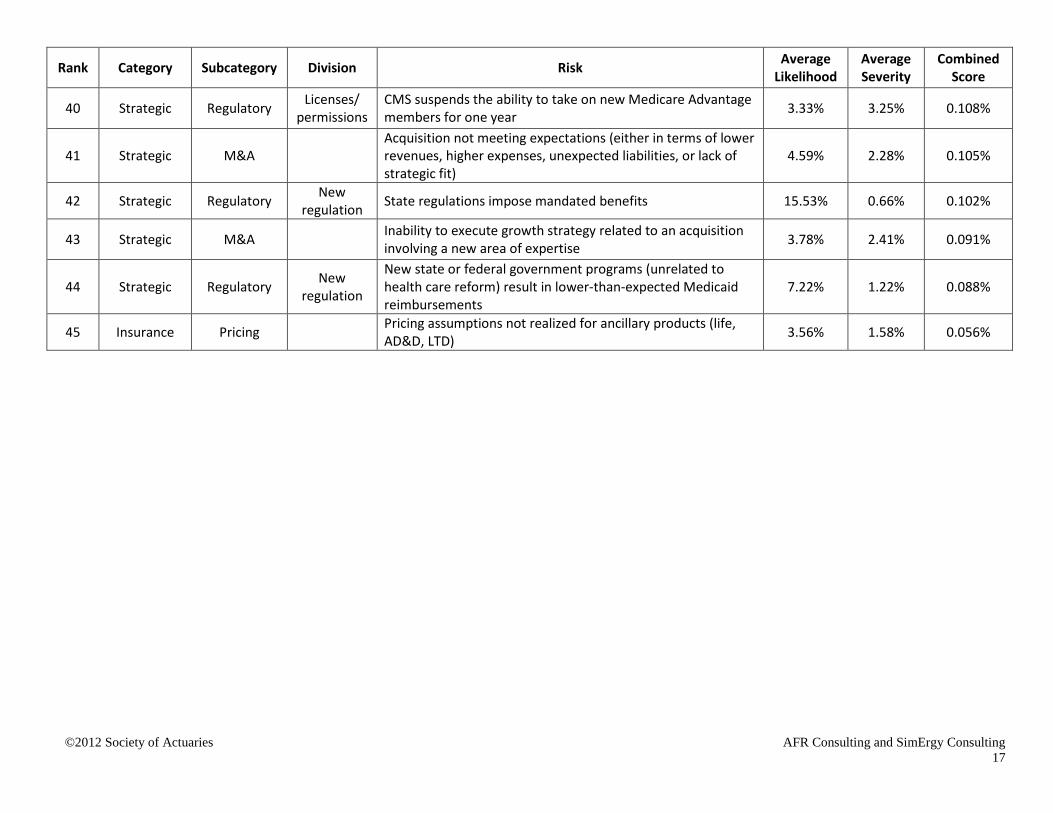
17
Rank Category Subcategory Division Risk Average Likelihood
Average Severity
Combined Score
40 Strategic Regulatory Licenses/ permissions
CMS suspends the ability to take on new Medicare Advantage members for one year 3.33% 3.25% 0.108%
41 Strategic M&A
Acquisition not meeting expectations (either in terms of lower revenues, higher expenses, unexpected liabilities, or lack of strategic fit)
4.59% 2.28% 0.105%
42 Strategic Regulatory New regulation State regulations impose mandated benefits 15.53% 0.66% 0.102%
43 Strategic M&A Inability to execute growth strategy related to an acquisition involving a new area of expertise 3.78% 2.41% 0.091%
44 Strategic Regulatory New regulation
New state or federal government programs (unrelated to health care reform) result in lower-than-expected Medicaid reimbursements
7.22% 1.22% 0.088%
45 Insurance Pricing Pricing assumptions not realized for ancillary products (life, AD&D, LTD) 3.56% 1.58% 0.056%
©2012 Society of Actuaries AFR Consulting and SimErgy Consulting
18
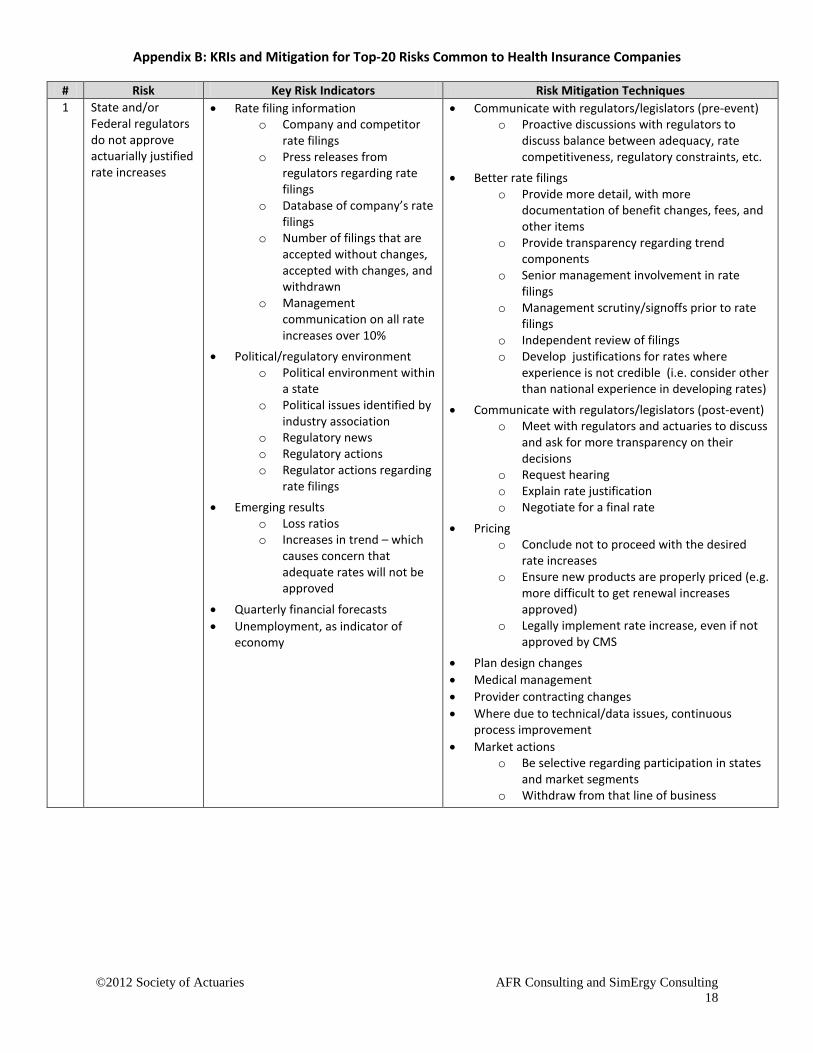
Appendix B: KRIs and Mitigation for Top-20 Risks Common to Health Insurance Companies
# Risk Key Risk Indicators Risk Mitigation Techniques 1 State and/or
Federal regulators do not approve actuarially justified rate increases
• Rate filing information o Company and competitor
rate filings o Press releases from
regulators regarding rate filings
o Database of company’s rate filings
o Number of filings that are accepted without changes, accepted with changes, and withdrawn
o Management communication on all rate increases over 10%
• Political/regulatory environment o Political environment within
a state o Political issues identified by
industry association o Regulatory news o Regulatory actions o Regulator actions regarding
rate filings • Emerging results
o Loss ratios o Increases in trend – which
causes concern that adequate rates will not be approved
• Quarterly financial forecasts • Unemployment, as indicator of
economy
• Communicate with regulators/legislators (pre-event) o Proactive discussions with regulators to
discuss balance between adequacy, rate competitiveness, regulatory constraints, etc.
• Better rate filings o Provide more detail, with more
documentation of benefit changes, fees, and other items
o Provide transparency regarding trend components
o Senior management involvement in rate filings
o Management scrutiny/signoffs prior to rate filings
o Independent review of filings o Develop justifications for rates where
experience is not credible (i.e. consider other than national experience in developing rates)
• Communicate with regulators/legislators (post-event) o Meet with regulators and actuaries to discuss
and ask for more transparency on their decisions
o Request hearing o Explain rate justification o Negotiate for a final rate
• Pricing o Conclude not to proceed with the desired
rate increases o Ensure new products are properly priced (e.g.
more difficult to get renewal increases approved)
o Legally implement rate increase, even if not approved by CMS
• Plan design changes • Medical management • Provider contracting changes • Where due to technical/data issues, continuous
process improvement • Market actions
o Be selective regarding participation in states and market segments
o Withdraw from that line of business
©2012 Society of Actuaries AFR Consulting and SimErgy Consulting
19
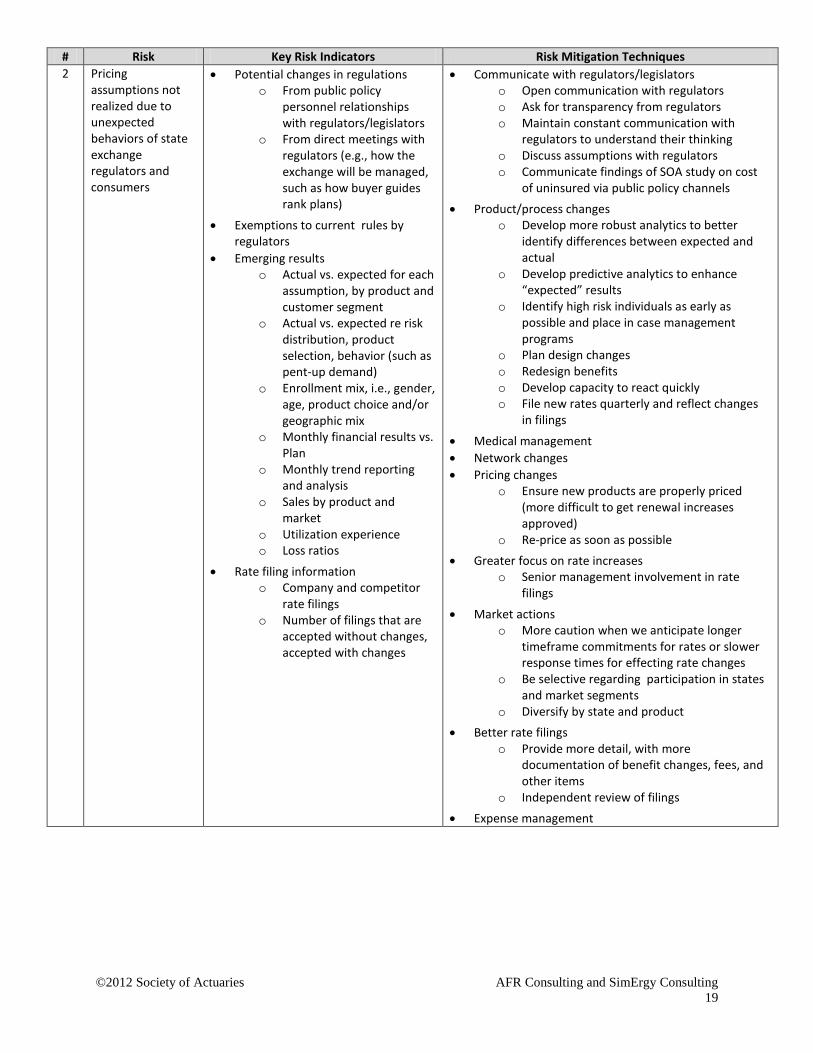
# Risk Key Risk Indicators Risk Mitigation Techniques 2 Pricing
assumptions not realized due to unexpected behaviors of state exchange regulators and consumers
• Potential changes in regulations o From public policy
personnel relationships with regulators/legislators
o From direct meetings with regulators (e.g., how the exchange will be managed, such as how buyer guides rank plans)
• Exemptions to current rules by regulators
• Emerging results o Actual vs. expected for each
assumption, by product and customer segment
o Actual vs. expected re risk distribution, product selection, behavior (such as pent-up demand)
o Enrollment mix, i.e., gender, age, product choice and/or geographic mix
o Monthly financial results vs. Plan
o Monthly trend reporting and analysis
o Sales by product and market
o Utilization experience o Loss ratios
• Rate filing information o Company and competitor
rate filings o Number of filings that are
accepted without changes, accepted with changes
• Communicate with regulators/legislators o Open communication with regulators o Ask for transparency from regulators o Maintain constant communication with
regulators to understand their thinking o Discuss assumptions with regulators o Communicate findings of SOA study on cost
of uninsured via public policy channels • Product/process changes
o Develop more robust analytics to better identify differences between expected and actual
o Develop predictive analytics to enhance “expected” results
o Identify high risk individuals as early as possible and place in case management programs
o Plan design changes o Redesign benefits o Develop capacity to react quickly o File new rates quarterly and reflect changes
in filings
• Medical management • Network changes • Pricing changes
o Ensure new products are properly priced (more difficult to get renewal increases approved)
o Re-price as soon as possible • Greater focus on rate increases
o Senior management involvement in rate filings
• Market actions o More caution when we anticipate longer
timeframe commitments for rates or slower response times for effecting rate changes
o Be selective regarding participation in states and market segments
o Diversify by state and product • Better rate filings
o Provide more detail, with more documentation of benefit changes, fees, and other items
o Independent review of filings • Expense management
©2012 Society of Actuaries AFR Consulting and SimErgy Consulting
20
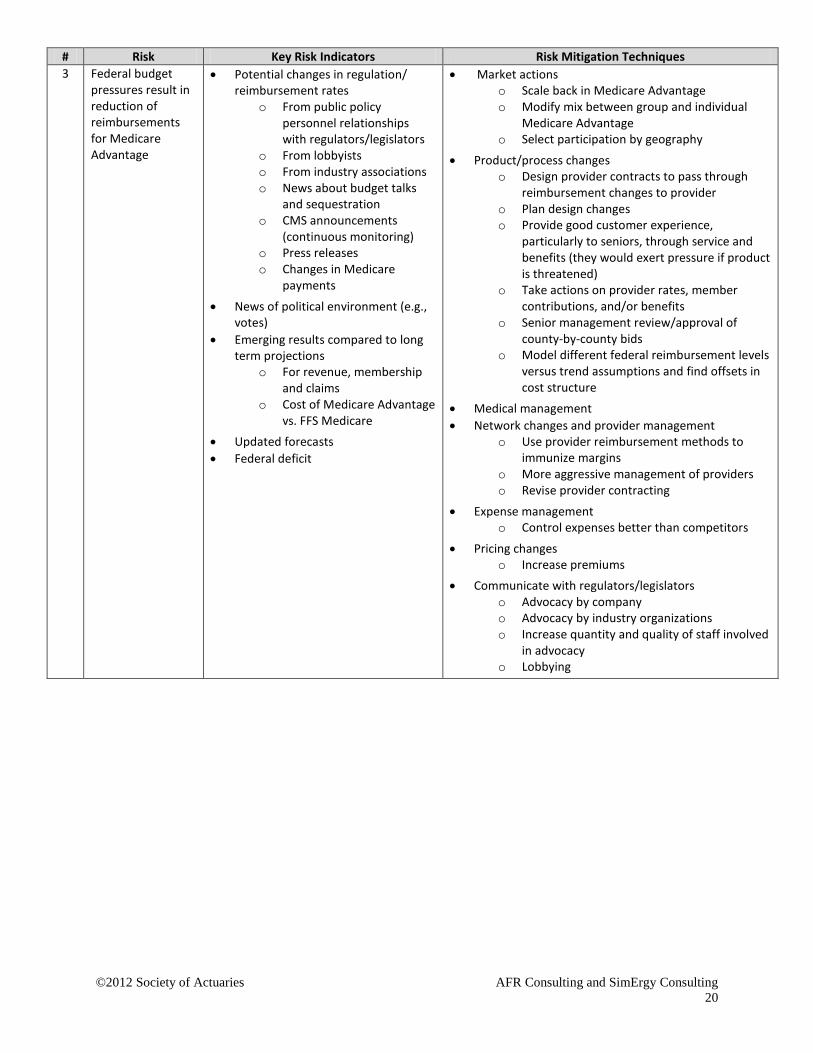
# Risk Key Risk Indicators Risk Mitigation Techniques 3 Federal budget
pressures result in reduction of reimbursements for Medicare Advantage
• Potential changes in regulation/ reimbursement rates
o From public policy personnel relationships with regulators/legislators
o From lobbyists o From industry associations o News about budget talks
and sequestration o CMS announcements
(continuous monitoring) o Press releases o Changes in Medicare
payments
• News of political environment (e.g., votes)
• Emerging results compared to long term projections
o For revenue, membership and claims
o Cost of Medicare Advantage vs. FFS Medicare
• Updated forecasts • Federal deficit
• Market actions o Scale back in Medicare Advantage o Modify mix between group and individual
Medicare Advantage o Select participation by geography
• Product/process changes o Design provider contracts to pass through
reimbursement changes to provider o Plan design changes o Provide good customer experience,
particularly to seniors, through service and benefits (they would exert pressure if product is threatened)
o Take actions on provider rates, member contributions, and/or benefits
o Senior management review/approval of county-by-county bids
o Model different federal reimbursement levels versus trend assumptions and find offsets in cost structure
• Medical management • Network changes and provider management
o Use provider reimbursement methods to immunize margins
o More aggressive management of providers o Revise provider contracting
• Expense management o Control expenses better than competitors
• Pricing changes o Increase premiums
• Communicate with regulators/legislators o Advocacy by company o Advocacy by industry organizations o Increase quantity and quality of staff involved
in advocacy o Lobbying
©2012 Society of Actuaries AFR Consulting and SimErgy Consulting
21
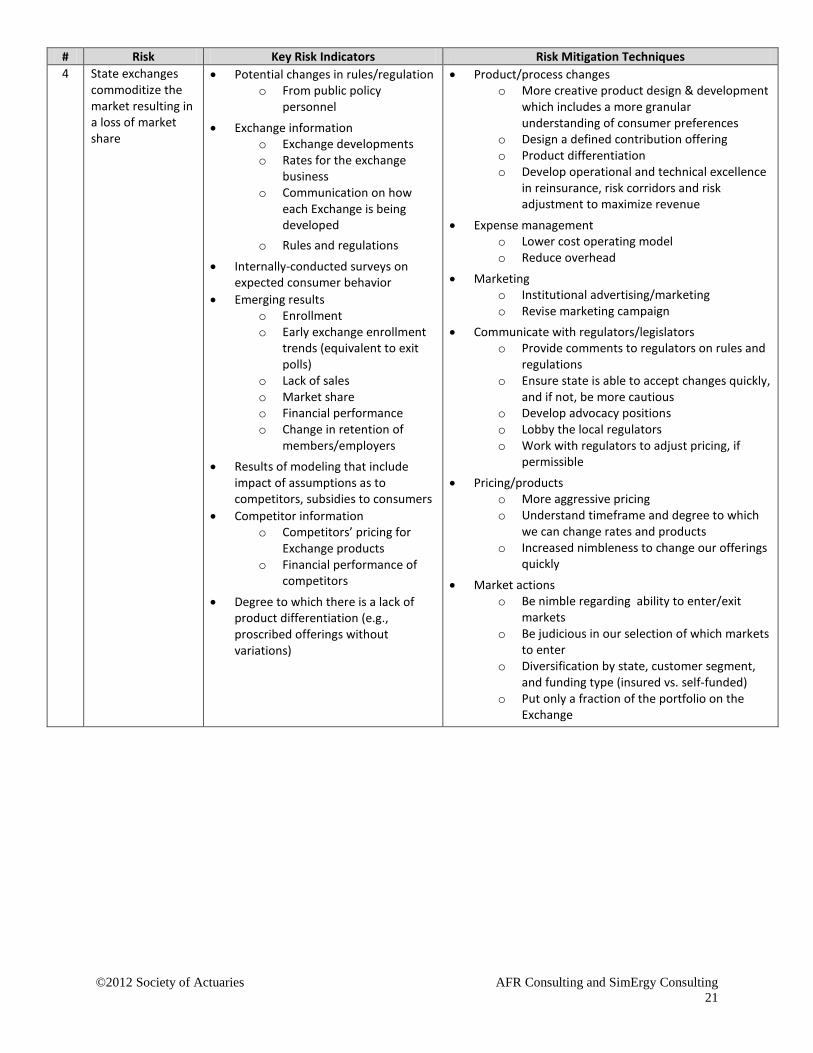
# Risk Key Risk Indicators Risk Mitigation Techniques 4 State exchanges
commoditize the market resulting in a loss of market share
• Potential changes in rules/regulation o From public policy
personnel
• Exchange information o Exchange developments o Rates for the exchange
business o Communication on how
each Exchange is being developed
o Rules and regulations
• Internally-conducted surveys on expected consumer behavior
• Emerging results o Enrollment o Early exchange enrollment
trends (equivalent to exit polls)
o Lack of sales o Market share o Financial performance o Change in retention of
members/employers • Results of modeling that include
impact of assumptions as to competitors, subsidies to consumers
• Competitor information o Competitors’ pricing for
Exchange products o Financial performance of
competitors
• Degree to which there is a lack of product differentiation (e.g., proscribed offerings without variations)
• Product/process changes o More creative product design & development
which includes a more granular understanding of consumer preferences
o Design a defined contribution offering o Product differentiation o Develop operational and technical excellence
in reinsurance, risk corridors and risk adjustment to maximize revenue
• Expense management o Lower cost operating model o Reduce overhead
• Marketing o Institutional advertising/marketing o Revise marketing campaign
• Communicate with regulators/legislators o Provide comments to regulators on rules and
regulations o Ensure state is able to accept changes quickly,
and if not, be more cautious o Develop advocacy positions o Lobby the local regulators o Work with regulators to adjust pricing, if
permissible
• Pricing/products o More aggressive pricing o Understand timeframe and degree to which
we can change rates and products o Increased nimbleness to change our offerings
quickly
• Market actions o Be nimble regarding ability to enter/exit
markets o Be judicious in our selection of which markets
to enter o Diversification by state, customer segment,
and funding type (insured vs. self-funded) o Put only a fraction of the portfolio on the
Exchange
©2012 Society of Actuaries AFR Consulting and SimErgy Consulting
22
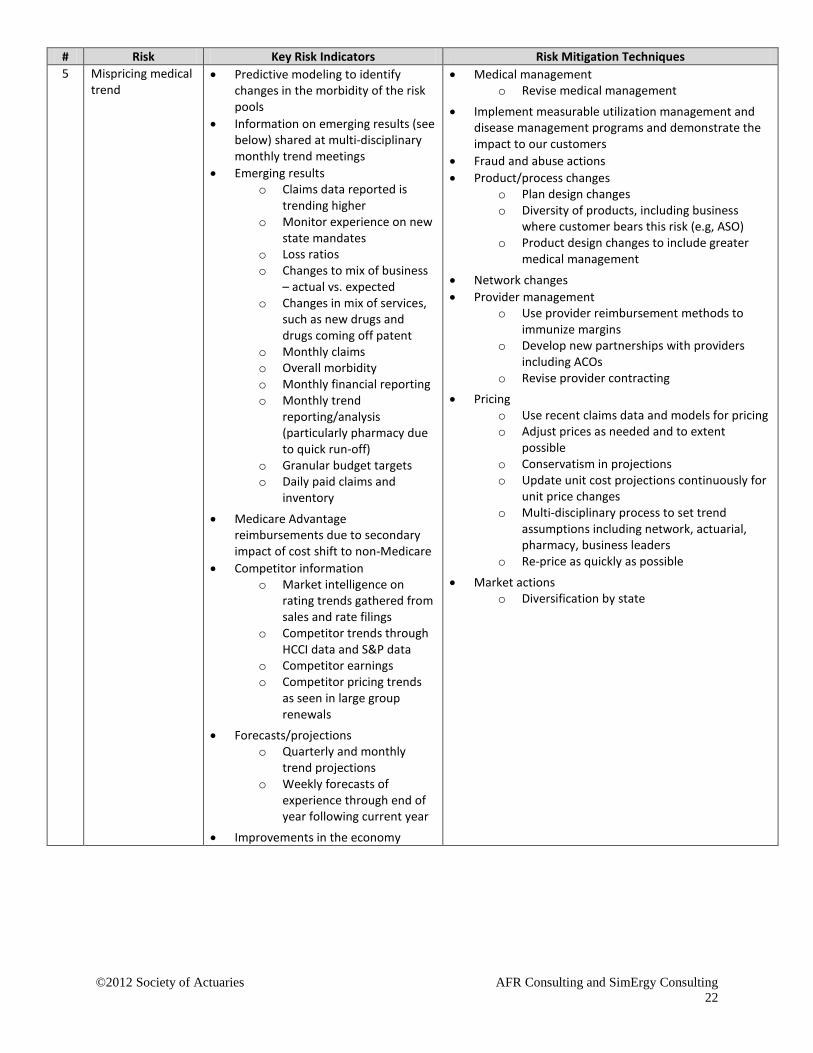
# Risk Key Risk Indicators Risk Mitigation Techniques 5 Mispricing medical
trend • Predictive modeling to identify
changes in the morbidity of the risk pools
• Information on emerging results (see below) shared at multi-disciplinary monthly trend meetings
• Emerging results o Claims data reported is
trending higher o Monitor experience on new
state mandates o Loss ratios o Changes to mix of business
– actual vs. expected o Changes in mix of services,
such as new drugs and drugs coming off patent
o Monthly claims o Overall morbidity o Monthly financial reporting o Monthly trend
reporting/analysis (particularly pharmacy due to quick run-off)
o Granular budget targets o Daily paid claims and
inventory
• Medicare Advantage reimbursements due to secondary impact of cost shift to non-Medicare
• Competitor information o Market intelligence on
rating trends gathered from sales and rate filings
o Competitor trends through HCCI data and S&P data
o Competitor earnings o Competitor pricing trends
as seen in large group renewals
• Forecasts/projections o Quarterly and monthly
trend projections o Weekly forecasts of
experience through end of year following current year
• Improvements in the economy
• Medical management o Revise medical management
• Implement measurable utilization management and disease management programs and demonstrate the impact to our customers
• Fraud and abuse actions • Product/process changes
o Plan design changes o Diversity of products, including business
where customer bears this risk (e.g, ASO) o Product design changes to include greater
medical management
• Network changes • Provider management
o Use provider reimbursement methods to immunize margins
o Develop new partnerships with providers including ACOs
o Revise provider contracting • Pricing
o Use recent claims data and models for pricing o Adjust prices as needed and to extent
possible o Conservatism in projections o Update unit cost projections continuously for
unit price changes o Multi-disciplinary process to set trend
assumptions including network, actuarial, pharmacy, business leaders
o Re-price as quickly as possible
• Market actions o Diversification by state

©2012 Society of Actuaries AFR Consulting and SimErgy Consulting
23
# Risk Key Risk Indicators Risk Mitigation Techniques 6 ACA stays in place
as is, and anti-selection results in our attracting more than our fair share of poor risks
• Emerging results o Unexpected enrollment
mix, i.e., gender, age, product choice and/or geographic mix (rural vs. city)
o Increased morbidity o Utilization rates o Monthly financial reporting o Monthly trend
reporting/analysis o Results vs. granular budget
targets o Sales volumes o Early claims experience o Actual vs. expected risk
scores o Enrollment o Material increase in loss
ratios o Catastrophic claims
• Forecasts/projections o Predictive modeling
• Risk assessment o Health risk assessment of
new members through a survey form if permissible
o Early look at risk profiles o Internal risk tool scores
• Information from consultant study done at request of state, such as information on uninsured, risk scores of various carriers, etc.
• Competitor information o Enrollment data of
competitors
• Market actions o Utilize predictive analytics to better
understand where those risks are and which markets best align with our strategy and scale back offerings in geographies where severe adverse selection is occurring
o Start slowly where not able to change rates or products quickly or where there is bigger risk
o Exit the market
• Product/process changes o Focused and thoughtful product design to
reduce anti-selection such as revised pharmacy benefits or revised out-of-pocket maximums
o Create products with narrower networks o Plan design changes o Create nimble internal processes for changing
rates and products o Develop tools to monitor risk levels earlier
than usual
• Medical management o Enroll high risk members in case management
as soon as possible o Manage high risk individuals better than
assumed in risk adjustment factor
• Network changes • Provider management
o Use provider reimbursement methods to immunize margins
• Pricing o Pricing to reflect ACA changes o Price to reflect the risk / build anti-selection
into price o Understand how risk adjustment, reinsurance
and risk corridors affect revenue and build this into pricing
o Adjust future rates as soon as possible • Expense management • Communicate with regulators/legislators
o Work with regulators to make sure reinsurance, risk adjustment, and risk corridors are working as intended
o Communicate findings of SOA study on cost of uninsured via public policy channels

©2012 Society of Actuaries AFR Consulting and SimErgy Consulting
24
# Risk Key Risk Indicators Risk Mitigation Techniques 7 Regulatory
changes (ACA) result in larger-than-expected rate increases by all carriers leading to a public backlash against the healthcare market resulting in regulatory actions and/or rate increase restrictions
• Potential changes in rules/regulation o From public policy
personnel o Political issues identified by
industry associations
• Regulatory activity o Bills introduced o Regulation changes o Government news releases
(the administration, Congress)
o NAIC actions o Press releases about rate
actions by commissioners
• Competitor information o Competitor activities from
dedicated internal teams and external consultants
o Planned competitor actions from brokers, press releases, and public statements
• Rate filing information o Insurance department
responses to rate filings o Competitors’ rate increase
actions and rates for new products
o Announcements of federal and state rate filings
o Statistics on rate approvals/denials
• Press on public backlash • Social media information on
consumer responses to rates • Complaints
o Increase in customer service calls with rate complaints
o Increase in number of consumer complaints to regulators about rates
• Internal scores of relationships with regulators
• Increased questioning by regulators
• Better rate filings o Good data used in filings to support the filings
• Communicate with regulators/legislators/general public
o Proactive discussions with regulators o Negotiate with Department of Insurance for a
final rate o Enhance communication with HHS and state
insurance departments o Partnering with other stakeholders of the
system (i.e., broker community, providers, etc.) to educate policymakers and the public on how increases in rates were calculated and justified
o Utilize trade organizations such as AHIP to advocate on behalf of the industry
o Support the Health Care Cost Institute (HCCI) and its trend reports
o Support explanations of trend by industry groups such as AHIP
o Increased advocacy o Public education o Educate public, employers and brokers
regarding impact of fees, guaranteed issue, benefit changes, etc.
• Pricing o Cross-functional committee meeting to
discuss proposed rate filings and potential implications
o Conclude not to proceed with the desired rate increases
o Careful in pricing new business o Price as necessary and document justification
for the assumptions
• Product/process changes o Plan design changes o Move business to ASO and stop-loss
• Medical management • Network changes and provider management • Market actions
o Selective participation by state and market o Withdraw from that line of business
• Marketing o Target marketing
• Forecast various scenarios and plan accordingly

©2012 Society of Actuaries AFR Consulting and SimErgy Consulting
25
# Risk Key Risk Indicators Risk Mitigation Techniques 8 Inadequate
medical cost management
• Competitor information o Best practices in medical
management o Competitive data on
provider unit costs
• Emerging results o Monthly financial results o Performance vs. granular
budget targets o Claims experience o Changes in mix of services
such as new drugs and drugs coming off patent
o Information from multi-disciplinary monthly trend meetings
o Monthly review of medical cost management initiatives
o Cost/benefit ratios of each program
o Actual vs. expected (e.g., re-admission rates) for each initiative
o Monthly trend data/analysis o Detailed trend reports
showing increased utilization in certain service categories
• Changes in predictive modeling risk scores
• Product/process changes o Invest and transform – innovative solutions to
address gaps in our approach from industry best practices
o Data mining and predictive modeling to find opportunities to enhance medical cost management
o External review of medical management o Diversity of products, including business
where customer bears this risk (e.g, ASO) o Identify problem areas and develop action
plans to correct
• Provider management o Use provider reimbursement methods to
immunize margins o Enhance provider contracting
• Pricing o Use recent claims data and models for pricing o Adjust prices as needed o Conservative pricing of impact of medical cost
management initiatives
• Claims o Explore ways of lowering unit costs if out of
line with competition o Develop programs targeted at specific
conditions with measurable results o Increase the number of medical cost
management initiatives o Develop initiatives to mitigate the spike in
utilization o Analyze results of initiatives and if one is not
providing results, stop the program o Continuous introduction of pilots of new
programs and rollout of successful pilots o Analyze if new programs can be implemented o Perform additional care management o Identify high-cost members and enroll them
in care management or medical homes

©2012 Society of Actuaries AFR Consulting and SimErgy Consulting
26
# Risk Key Risk Indicators Risk Mitigation Techniques 9 The ACA or a
replacement health care reform law creates a change from an employer-based market to an individual market impacting capital requirements, market share, and profitability
• Potential changes in rules/regulation o From public policy
personnel
• Level of migration from employer to individual market evident from Massachusetts experience
• Regulatory activity o Developments o Regulations
• Market research on small group employers’ intentions to keep or drop coverage
• Public press reports, both regionally and nationally, of carriers dropping out
• Emerging results o Group lapses o Enrollment o Shift of enrollment between
segments o New business pipeline
• Industry reports on such trends
• Product/process changes o Design a defined contribution offering o Become industry leader in consumer
experience thus attracting a disproportionate share of market
o Prepare for retail environment, in part by using scenario planning to envision alternate future states and preparing mitigation plans
o Build enhanced capabilities for servicing individual consumers
o Improve the retail experience o Restructure company to reflect the increased
importance of retail market o Manage individual business more effectively o Offer attractive small group products –
narrower networks, lower cost o Reassess product offering o Engage senior management and prepare for a
“defined contribution world” • Communicate with regulators/legislators • Provider management
o Communicate implications to provider partners, in terms of needed changes to customer service
• Pricing o Develop better market prediction
econometric models and use for pricing o Perform sensitivity tests on RBC and adjust
margins as needed o Keep pricing adequate
• Risk management o Consider new risk/retention profile and
manage accordingly
• Reduce claim costs (cost and utilization) • Market actions
o Exit the market
• Change communication to employers and members • Study states like Massachusetts

©2012 Society of Actuaries AFR Consulting and SimErgy Consulting
27
# Risk Key Risk Indicators Risk Mitigation Techniques 10 Loss of large
account/accounts • Financial viability of large cases
o Financial results (for largest cases only)
o Management changes at large accounts
• Service metrics • Results of customer audits of
company’s performance • Competitor information
o Competitive studies on standing regarding disease management and contract negotiations
o New competitors entering the market
• Emerging results o Information from multi-
disciplinary (sales, underwriting, division head, actuarial) weekly meetings on new business and renewals for 500+ lives cases
o Enrollment o Trend analysis o Pipeline of RFPs o RFP results/close rates o Account retention rates o Accounts converting from
insured to self-funded
• Increase in price pressure at point of sale
• Communication with large groups
• Expense management o Expense reduction to eliminate variable
expenses - low cost operating model o Administrative reductions
• Product/process changes o Design a defined contribution offering o Scenario planning to identify actions and
develop plans o Improve the retail experience o Diversify book of business o Focus on operational excellence o Evaluate product design o Increase ancillary product penetration to
make the customer “stickier” o Diversification by customer segment
• Account management o Account representatives to maintain close
relationships with accounts o Up-front marketing with large groups o Communication with large groups
• Value proposition o Strong value proposition o Keep product competitive (e.g., disease
management, contract negotiations and/or adjust prices strategically by geography if necessary)
• Risk management o Decisions at meetings to optimize risks and
set boundaries on risk-taking • Pricing
o Engage in some marginal pricing
• Claims o Manage claim costs well (cost and utilization) o Improve quality of claim operations
(continuous) • Marketing
o Work with sales/marketing to develop a better sales story
©2012 Society of Actuaries AFR Consulting and SimErgy Consulting
28
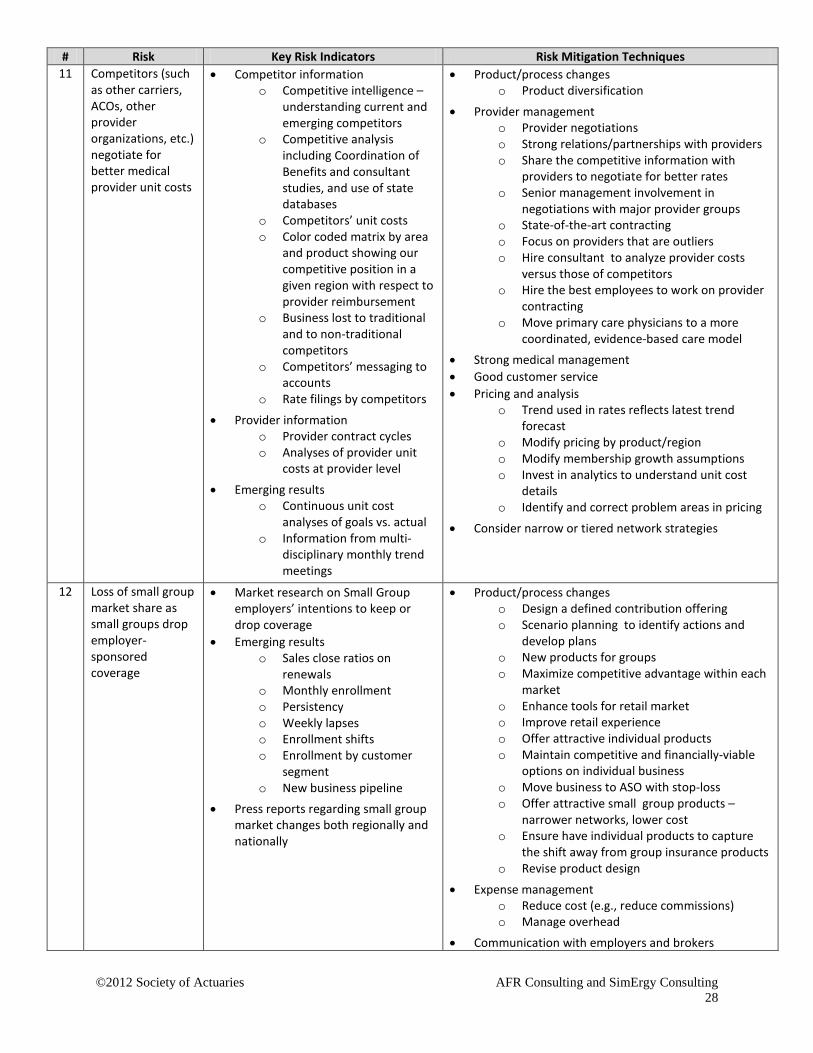
# Risk Key Risk Indicators Risk Mitigation Techniques 11 Competitors (such
as other carriers, ACOs, other provider organizations, etc.) negotiate for better medical provider unit costs
• Competitor information o Competitive intelligence –
understanding current and emerging competitors
o Competitive analysis including Coordination of Benefits and consultant studies, and use of state databases
o Competitors’ unit costs o Color coded matrix by area
and product showing our competitive position in a given region with respect to provider reimbursement
o Business lost to traditional and to non-traditional competitors
o Competitors’ messaging to accounts
o Rate filings by competitors
• Provider information o Provider contract cycles o Analyses of provider unit
costs at provider level
• Emerging results o Continuous unit cost
analyses of goals vs. actual o Information from multi-
disciplinary monthly trend meetings
• Product/process changes o Product diversification
• Provider management o Provider negotiations o Strong relations/partnerships with providers o Share the competitive information with
providers to negotiate for better rates o Senior management involvement in
negotiations with major provider groups o State-of-the-art contracting o Focus on providers that are outliers o Hire consultant to analyze provider costs
versus those of competitors o Hire the best employees to work on provider
contracting o Move primary care physicians to a more
coordinated, evidence-based care model • Strong medical management • Good customer service • Pricing and analysis
o Trend used in rates reflects latest trend forecast
o Modify pricing by product/region o Modify membership growth assumptions o Invest in analytics to understand unit cost
details o Identify and correct problem areas in pricing
• Consider narrow or tiered network strategies
12 Loss of small group market share as small groups drop employer-sponsored coverage
• Market research on Small Group employers’ intentions to keep or drop coverage
• Emerging results o Sales close ratios on
renewals o Monthly enrollment o Persistency o Weekly lapses o Enrollment shifts o Enrollment by customer
segment o New business pipeline
• Press reports regarding small group market changes both regionally and nationally
• Product/process changes o Design a defined contribution offering o Scenario planning to identify actions and
develop plans o New products for groups o Maximize competitive advantage within each
market o Enhance tools for retail market o Improve retail experience o Offer attractive individual products o Maintain competitive and financially-viable
options on individual business o Move business to ASO with stop-loss o Offer attractive small group products –
narrower networks, lower cost o Ensure have individual products to capture
the shift away from group insurance products o Revise product design
• Expense management o Reduce cost (e.g., reduce commissions) o Manage overhead
• Communication with employers and brokers
©2012 Society of Actuaries AFR Consulting and SimErgy Consulting
29
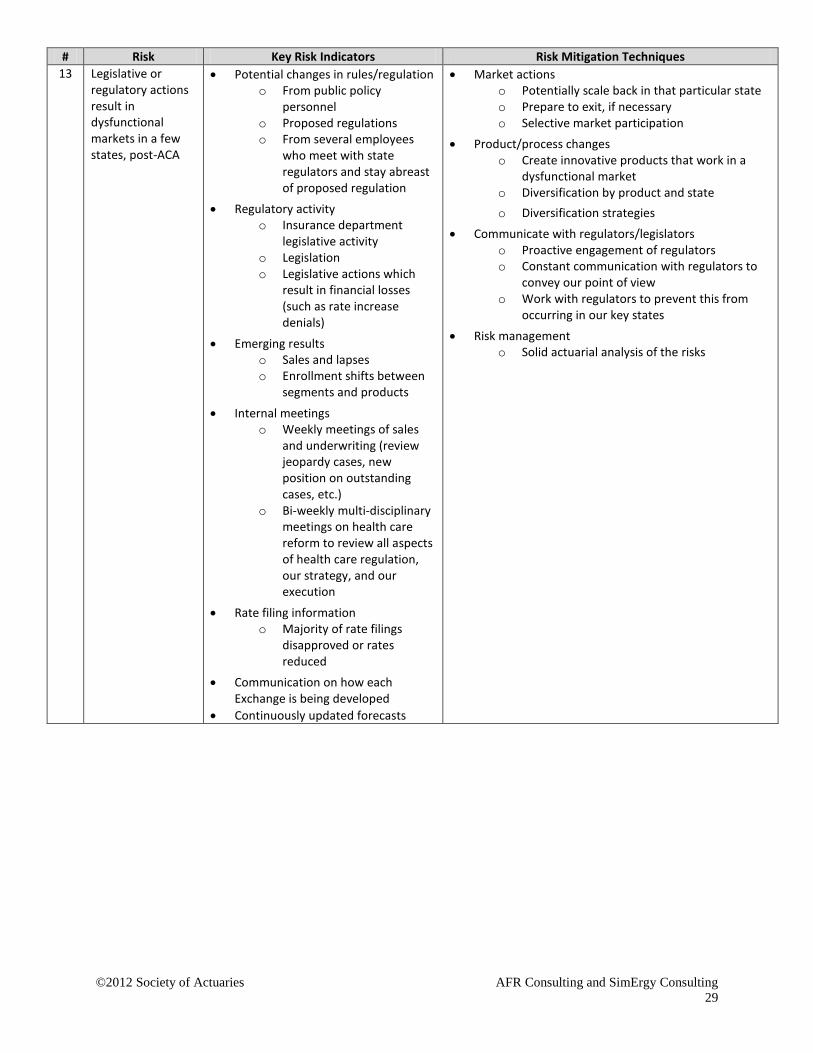
# Risk Key Risk Indicators Risk Mitigation Techniques 13 Legislative or
regulatory actions result in dysfunctional markets in a few states, post-ACA
• Potential changes in rules/regulation o From public policy
personnel o Proposed regulations o From several employees
who meet with state regulators and stay abreast of proposed regulation
• Regulatory activity o Insurance department
legislative activity o Legislation o Legislative actions which
result in financial losses (such as rate increase denials)
• Emerging results o Sales and lapses o Enrollment shifts between
segments and products
• Internal meetings o Weekly meetings of sales
and underwriting (review jeopardy cases, new position on outstanding cases, etc.)
o Bi-weekly multi-disciplinary meetings on health care reform to review all aspects of health care regulation, our strategy, and our execution
• Rate filing information o Majority of rate filings
disapproved or rates reduced
• Communication on how each Exchange is being developed
• Continuously updated forecasts
• Market actions o Potentially scale back in that particular state o Prepare to exit, if necessary o Selective market participation
• Product/process changes o Create innovative products that work in a
dysfunctional market o Diversification by product and state o Diversification strategies
• Communicate with regulators/legislators o Proactive engagement of regulators o Constant communication with regulators to
convey our point of view o Work with regulators to prevent this from
occurring in our key states • Risk management
o Solid actuarial analysis of the risks
©2012 Society of Actuaries AFR Consulting and SimErgy Consulting
30
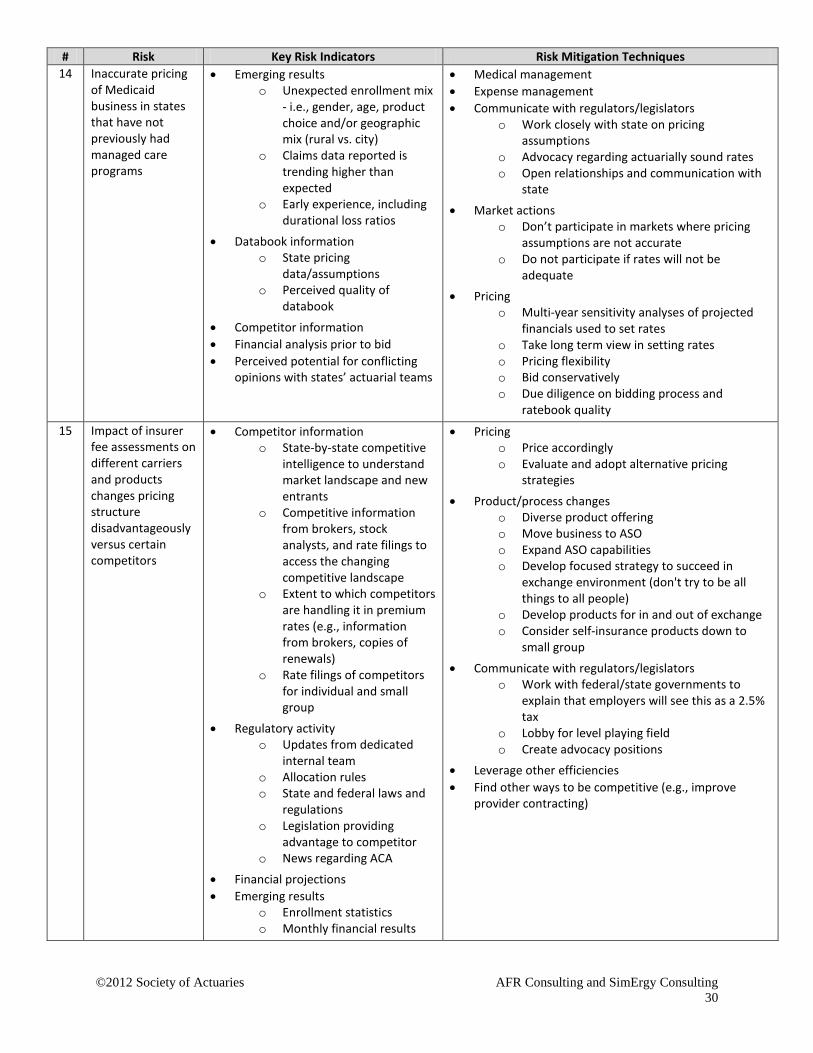
# Risk Key Risk Indicators Risk Mitigation Techniques 14 Inaccurate pricing
of Medicaid business in states that have not previously had managed care programs
• Emerging results o Unexpected enrollment mix
- i.e., gender, age, product choice and/or geographic mix (rural vs. city)
o Claims data reported is trending higher than expected
o Early experience, including durational loss ratios
• Databook information o State pricing
data/assumptions o Perceived quality of
databook
• Competitor information • Financial analysis prior to bid • Perceived potential for conflicting
opinions with states’ actuarial teams
• Medical management • Expense management • Communicate with regulators/legislators
o Work closely with state on pricing assumptions
o Advocacy regarding actuarially sound rates o Open relationships and communication with
state
• Market actions o Don’t participate in markets where pricing
assumptions are not accurate o Do not participate if rates will not be
adequate • Pricing
o Multi-year sensitivity analyses of projected financials used to set rates
o Take long term view in setting rates o Pricing flexibility o Bid conservatively o Due diligence on bidding process and
ratebook quality 15 Impact of insurer
fee assessments on different carriers and products changes pricing structure disadvantageously versus certain competitors
• Competitor information o State-by-state competitive
intelligence to understand market landscape and new entrants
o Competitive information from brokers, stock analysts, and rate filings to access the changing competitive landscape
o Extent to which competitors are handling it in premium rates (e.g., information from brokers, copies of renewals)
o Rate filings of competitors for individual and small group
• Regulatory activity o Updates from dedicated
internal team o Allocation rules o State and federal laws and
regulations o Legislation providing
advantage to competitor o News regarding ACA
• Financial projections • Emerging results
o Enrollment statistics o Monthly financial results
• Pricing o Price accordingly o Evaluate and adopt alternative pricing
strategies
• Product/process changes o Diverse product offering o Move business to ASO o Expand ASO capabilities o Develop focused strategy to succeed in
exchange environment (don't try to be all things to all people)
o Develop products for in and out of exchange o Consider self-insurance products down to
small group
• Communicate with regulators/legislators o Work with federal/state governments to
explain that employers will see this as a 2.5% tax
o Lobby for level playing field o Create advocacy positions
• Leverage other efficiencies • Find other ways to be competitive (e.g., improve
provider contracting)
©2012 Society of Actuaries AFR Consulting and SimErgy Consulting
31
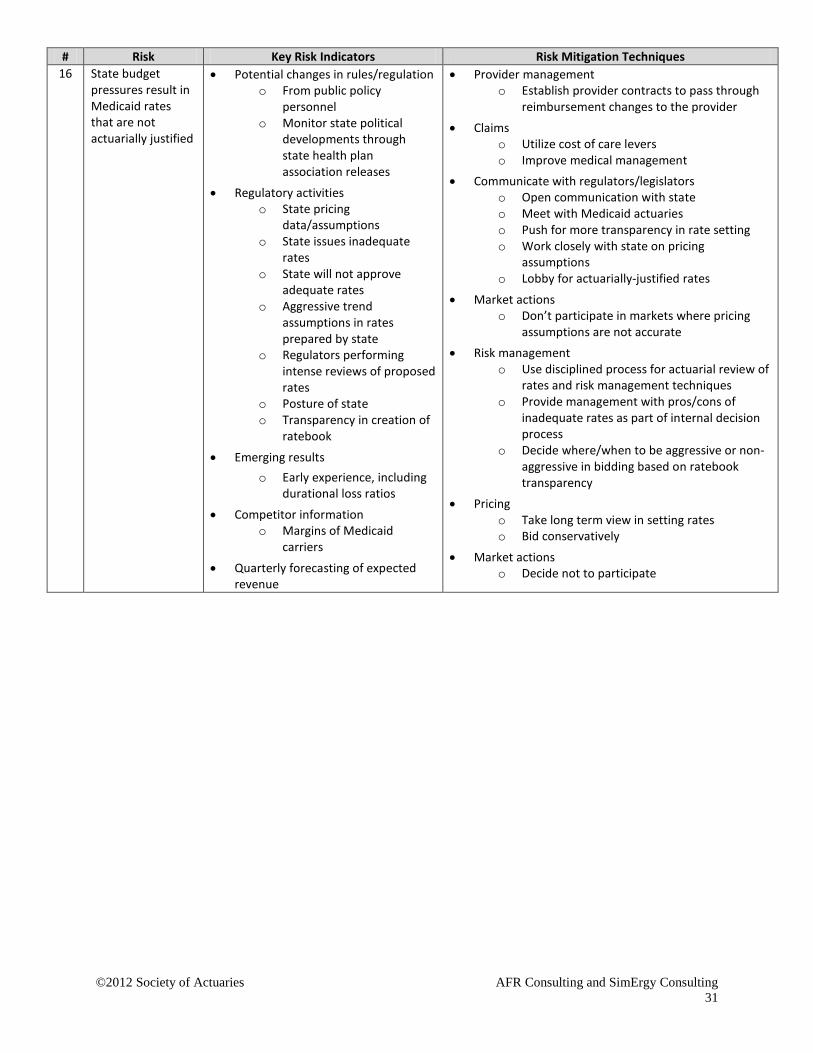
# Risk Key Risk Indicators Risk Mitigation Techniques 16 State budget
pressures result in Medicaid rates that are not actuarially justified
• Potential changes in rules/regulation o From public policy
personnel o Monitor state political
developments through state health plan association releases
• Regulatory activities o State pricing
data/assumptions o State issues inadequate
rates o State will not approve
adequate rates o Aggressive trend
assumptions in rates prepared by state
o Regulators performing intense reviews of proposed rates
o Posture of state o Transparency in creation of
ratebook
• Emerging results o Early experience, including
durational loss ratios
• Competitor information o Margins of Medicaid
carriers
• Quarterly forecasting of expected revenue
• Provider management o Establish provider contracts to pass through
reimbursement changes to the provider
• Claims o Utilize cost of care levers o Improve medical management
• Communicate with regulators/legislators o Open communication with state o Meet with Medicaid actuaries o Push for more transparency in rate setting o Work closely with state on pricing
assumptions o Lobby for actuarially-justified rates
• Market actions o Don’t participate in markets where pricing
assumptions are not accurate • Risk management
o Use disciplined process for actuarial review of rates and risk management techniques
o Provide management with pros/cons of inadequate rates as part of internal decision process
o Decide where/when to be aggressive or non-aggressive in bidding based on ratebook transparency
• Pricing o Take long term view in setting rates o Bid conservatively
• Market actions o Decide not to participate
©2012 Society of Actuaries AFR Consulting and SimErgy Consulting
32
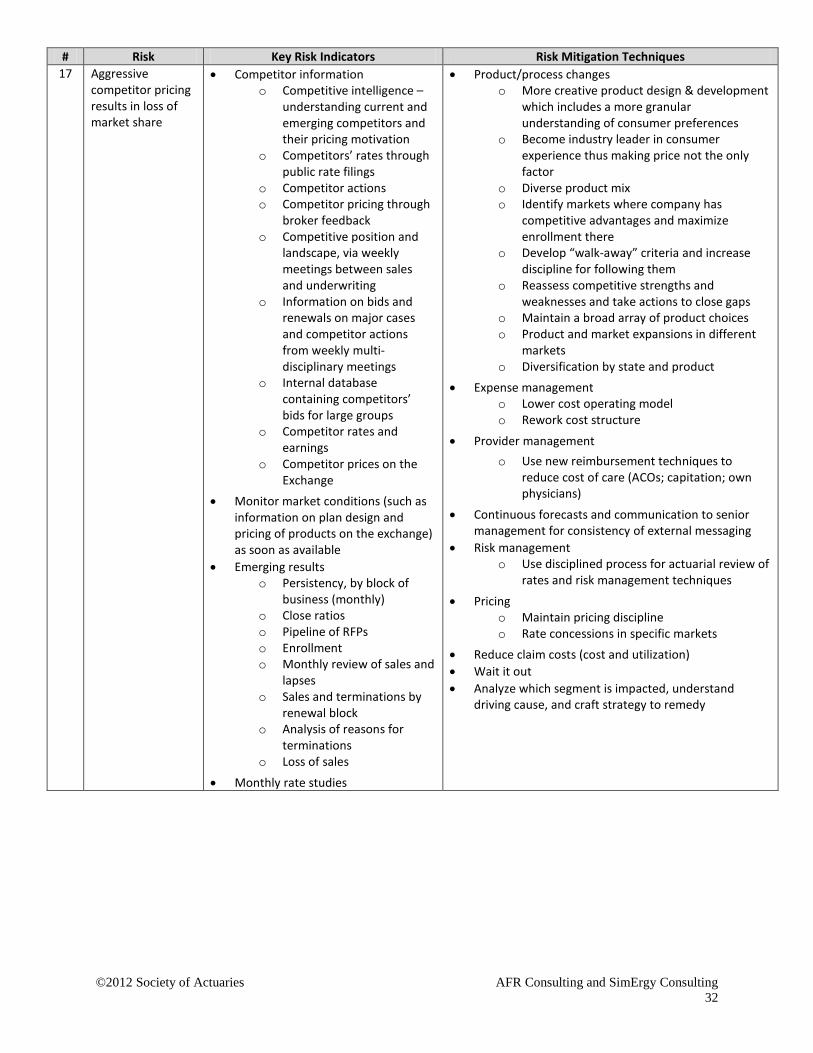
# Risk Key Risk Indicators Risk Mitigation Techniques 17 Aggressive
competitor pricing results in loss of market share
• Competitor information o Competitive intelligence –
understanding current and emerging competitors and their pricing motivation
o Competitors’ rates through public rate filings
o Competitor actions o Competitor pricing through
broker feedback o Competitive position and
landscape, via weekly meetings between sales and underwriting
o Information on bids and renewals on major cases and competitor actions from weekly multi-disciplinary meetings
o Internal database containing competitors’ bids for large groups
o Competitor rates and earnings
o Competitor prices on the Exchange
• Monitor market conditions (such as information on plan design and pricing of products on the exchange) as soon as available
• Emerging results o Persistency, by block of
business (monthly) o Close ratios o Pipeline of RFPs o Enrollment o Monthly review of sales and
lapses o Sales and terminations by
renewal block o Analysis of reasons for
terminations o Loss of sales
• Monthly rate studies
• Product/process changes o More creative product design & development
which includes a more granular understanding of consumer preferences
o Become industry leader in consumer experience thus making price not the only factor
o Diverse product mix o Identify markets where company has
competitive advantages and maximize enrollment there
o Develop “walk-away” criteria and increase discipline for following them
o Reassess competitive strengths and weaknesses and take actions to close gaps
o Maintain a broad array of product choices o Product and market expansions in different
markets o Diversification by state and product
• Expense management o Lower cost operating model o Rework cost structure
• Provider management o Use new reimbursement techniques to
reduce cost of care (ACOs; capitation; own physicians)
• Continuous forecasts and communication to senior management for consistency of external messaging
• Risk management o Use disciplined process for actuarial review of
rates and risk management techniques
• Pricing o Maintain pricing discipline o Rate concessions in specific markets
• Reduce claim costs (cost and utilization) • Wait it out • Analyze which segment is impacted, understand
driving cause, and craft strategy to remedy
©2012 Society of Actuaries AFR Consulting and SimErgy Consulting
33
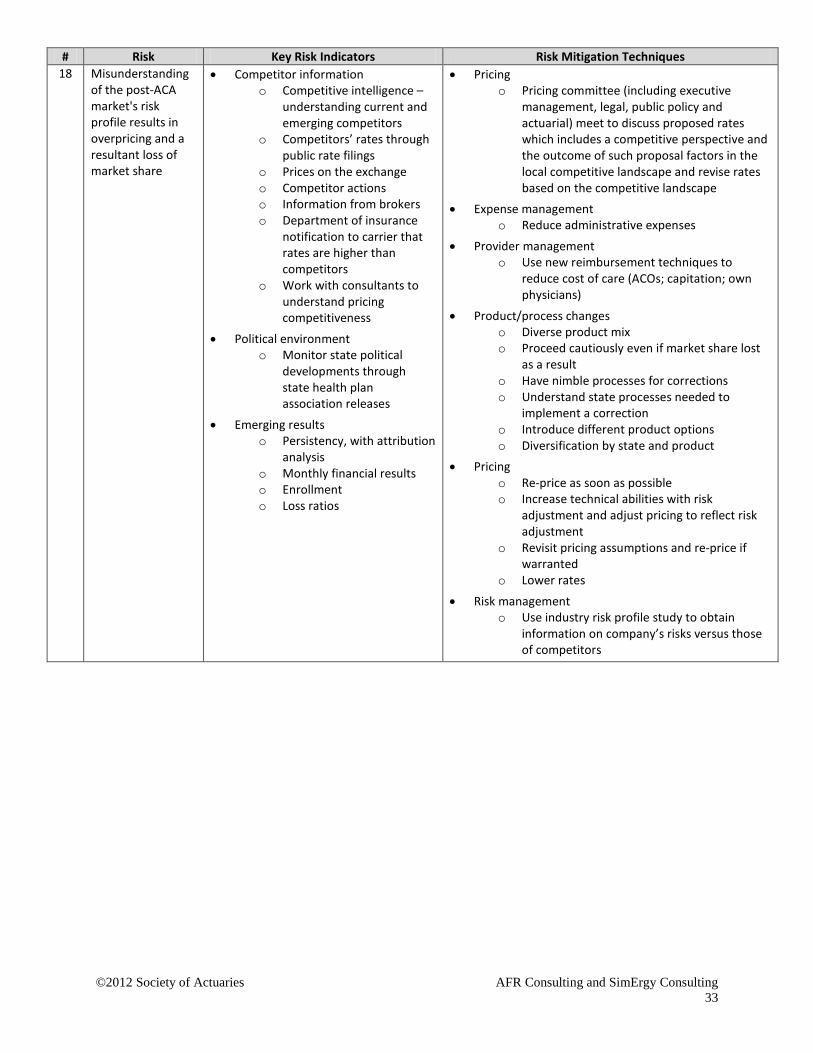
# Risk Key Risk Indicators Risk Mitigation Techniques 18 Misunderstanding
of the post-ACA market's risk profile results in overpricing and a resultant loss of market share
• Competitor information o Competitive intelligence –
understanding current and emerging competitors
o Competitors’ rates through public rate filings
o Prices on the exchange o Competitor actions o Information from brokers o Department of insurance
notification to carrier that rates are higher than competitors
o Work with consultants to understand pricing competitiveness
• Political environment o Monitor state political
developments through state health plan association releases
• Emerging results o Persistency, with attribution
analysis o Monthly financial results o Enrollment o Loss ratios
• Pricing o Pricing committee (including executive
management, legal, public policy and actuarial) meet to discuss proposed rates which includes a competitive perspective and the outcome of such proposal factors in the local competitive landscape and revise rates based on the competitive landscape
• Expense management o Reduce administrative expenses
• Provider management o Use new reimbursement techniques to
reduce cost of care (ACOs; capitation; own physicians)
• Product/process changes o Diverse product mix o Proceed cautiously even if market share lost
as a result o Have nimble processes for corrections o Understand state processes needed to
implement a correction o Introduce different product options o Diversification by state and product
• Pricing o Re-price as soon as possible o Increase technical abilities with risk
adjustment and adjust pricing to reflect risk adjustment
o Revisit pricing assumptions and re-price if warranted
o Lower rates
• Risk management o Use industry risk profile study to obtain
information on company’s risks versus those of competitors
©2012 Society of Actuaries AFR Consulting and SimErgy Consulting
34
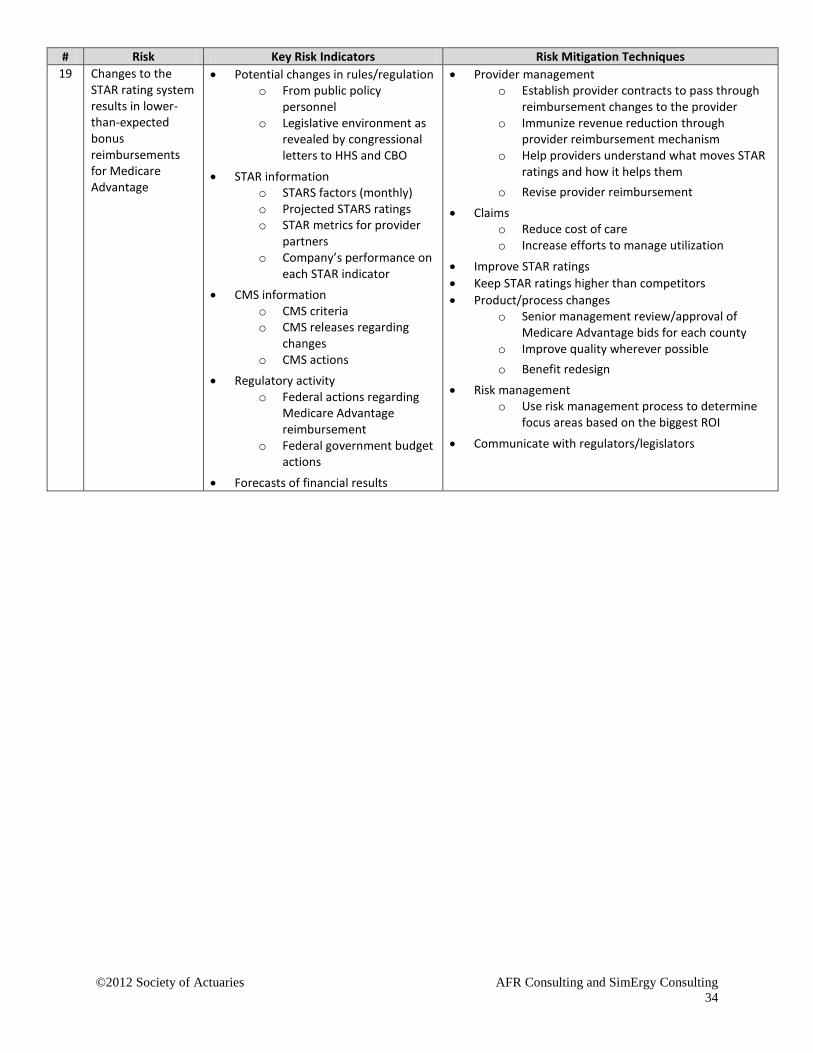
# Risk Key Risk Indicators Risk Mitigation Techniques 19 Changes to the
STAR rating system results in lower-than-expected bonus reimbursements for Medicare Advantage
• Potential changes in rules/regulation o From public policy
personnel o Legislative environment as
revealed by congressional letters to HHS and CBO
• STAR information o STARS factors (monthly) o Projected STARS ratings o STAR metrics for provider
partners o Company’s performance on
each STAR indicator • CMS information
o CMS criteria o CMS releases regarding
changes o CMS actions
• Regulatory activity o Federal actions regarding
Medicare Advantage reimbursement
o Federal government budget actions
• Forecasts of financial results
• Provider management o Establish provider contracts to pass through
reimbursement changes to the provider o Immunize revenue reduction through
provider reimbursement mechanism o Help providers understand what moves STAR
ratings and how it helps them o Revise provider reimbursement
• Claims o Reduce cost of care o Increase efforts to manage utilization
• Improve STAR ratings • Keep STAR ratings higher than competitors • Product/process changes
o Senior management review/approval of Medicare Advantage bids for each county
o Improve quality wherever possible o Benefit redesign
• Risk management o Use risk management process to determine
focus areas based on the biggest ROI
• Communicate with regulators/legislators
©2012 Society of Actuaries AFR Consulting and SimErgy Consulting
35
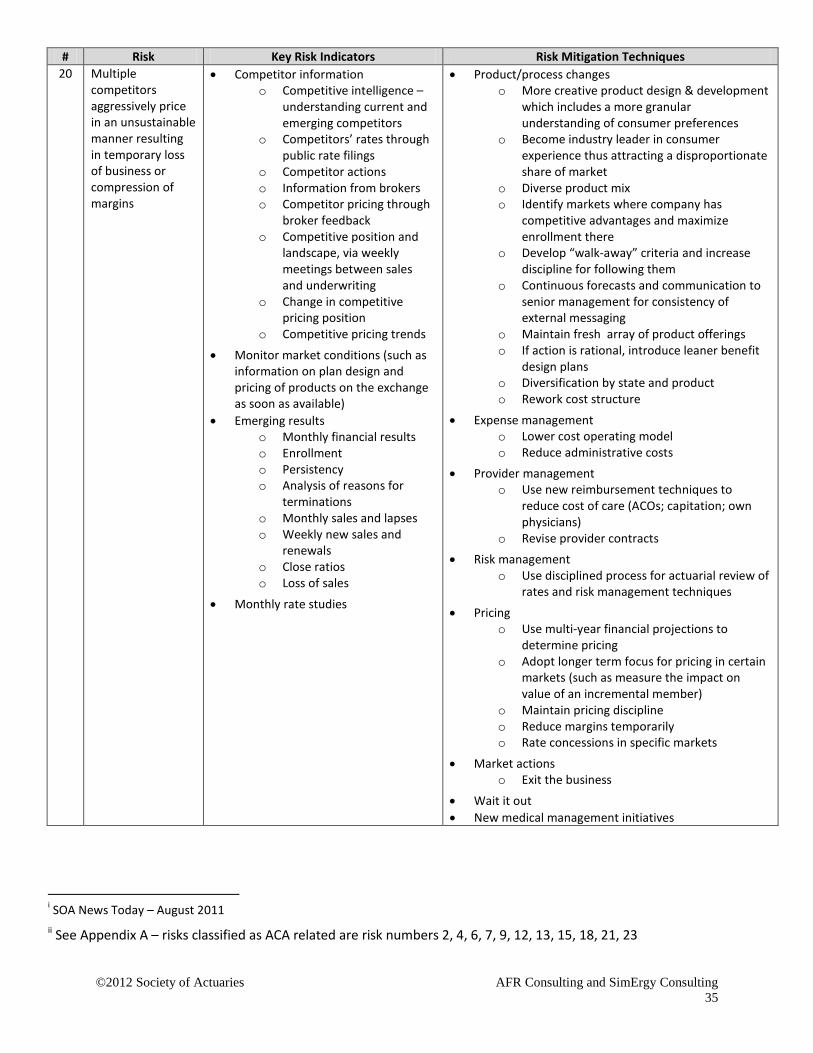
# Risk Key Risk Indicators Risk Mitigation Techniques 20 Multiple
competitors aggressively price in an unsustainable manner resulting in temporary loss of business or compression of margins
• Competitor information o Competitive intelligence –
understanding current and emerging competitors
o Competitors’ rates through public rate filings
o Competitor actions o Information from brokers o Competitor pricing through
broker feedback o Competitive position and
landscape, via weekly meetings between sales and underwriting
o Change in competitive pricing position
o Competitive pricing trends
• Monitor market conditions (such as information on plan design and pricing of products on the exchange as soon as available)
• Emerging results o Monthly financial results o Enrollment o Persistency o Analysis of reasons for
terminations o Monthly sales and lapses o Weekly new sales and
renewals o Close ratios o Loss of sales
• Monthly rate studies
• Product/process changes o More creative product design & development
which includes a more granular understanding of consumer preferences
o Become industry leader in consumer experience thus attracting a disproportionate share of market
o Diverse product mix o Identify markets where company has
competitive advantages and maximize enrollment there
o Develop “walk-away” criteria and increase discipline for following them
o Continuous forecasts and communication to senior management for consistency of external messaging
o Maintain fresh array of product offerings o If action is rational, introduce leaner benefit
design plans o Diversification by state and product o Rework cost structure
• Expense management o Lower cost operating model o Reduce administrative costs
• Provider management o Use new reimbursement techniques to
reduce cost of care (ACOs; capitation; own physicians)
o Revise provider contracts • Risk management
o Use disciplined process for actuarial review of rates and risk management techniques
• Pricing o Use multi-year financial projections to
determine pricing o Adopt longer term focus for pricing in certain
markets (such as measure the impact on value of an incremental member)
o Maintain pricing discipline o Reduce margins temporarily o Rate concessions in specific markets
• Market actions o Exit the business
• Wait it out • New medical management initiatives
i SOA News Today – August 2011 ii See Appendix A – risks classified as ACA related are risk numbers 2, 4, 6, 7, 9, 12, 13, 15, 18, 21, 23

©2012 Society of Actuaries AFR Consulting and SimErgy Consulting
36
iii See Appendix A – risks classified as Medicare and Medicaid related are risk numbers 3, 14, 16, 19, 24, 34, 39, 44 iv See Appendix A – risks classified as connected to increased regulatory scrutiny are risk numbers 1, 26, 27, 29, 30 v See Appendix A – risks classified as trend related are risk numbers 5, 8, 11, 31, 32
Related Documents


