International Journal of Case Studies in Business, IT, and Education (IJCSBE), ISSN: 2581-6942, Vol. 5, No. 2, September 2021 SRINIVAS PUBLICATION Sonia Lobo, et al, (2021); www.srinivaspublication.com PAGE 111 Risk Return Analysis of Selected Stocks of Indian Financial Sector Sonia Lobo 1, 2 , & Ganesh Bhat S. 3 1 Research Scholar, College of Management & Commerce, Srinivas University, Mangalore, Karnataka, India. 2 Assistant Professor, Department of Humanities, NMAM Institute of Technology, Nitte, Karnataka, India. OrcidID: 0000-0002-8177-8855; E-mail: [email protected] 3 Research Professor, College of Management & Commerce, Srinivas University, Mangalore, Karnataka, India. OrcidID: 0000-0003-1950-8536; E-mail: [email protected] Area of the Paper: Business Management. Type of the Paper: Research Case Study. Type of Review: Peer Reviewed as per |C|O|P|E| guidance. Indexed In: OpenAIRE. DOI: https://doi.org/10.5281/zenodo.5463885 Google Scholar Citation: IJCSBE International Journal of Case Studies in Business, IT and Education (IJCSBE) A Refereed International Journal of Srinivas University, India. Crossref DOI : https://doi.org/10.47992/IJCSBE.2581.6942.0124 © With Authors. This work is licensed under a Creative Commons Attribution Non-Commercial 4.0 International License subject to proper citation to the publication source of the work. Disclaimer: The scholarly papers as reviewed and published by the Srinivas Publications (S.P.), India are the views and opinions of their respective authors and are not the views or opinions of the S.P. The S.P. disclaims of any harm or loss caused due to the published content to any party. How to Cite this Paper: Sonia Lobo, & Ganesh Bhat, S., (2021). Risk Return Analysis of Selected Stocks of Indian Financial Sector. International Journal of Case Studies in Business, IT, and Education (IJCSBE), 5(2), 111-124. DOI: https://doi.org/10.5281/zenodo.5463885

Welcome message from author
This document is posted to help you gain knowledge. Please leave a comment to let me know what you think about it! Share it to your friends and learn new things together.
Transcript
International Journal of Case Studies in Business, IT, and Education
(IJCSBE), ISSN: 2581-6942, Vol. 5, No. 2, September 2021 SRINIVAS
PUBLICATION
Sonia Lobo, et al, (2021); www.srinivaspublication.com PAGE 111
Risk Return Analysis of Selected Stocks of
Indian Financial Sector
Sonia Lobo 1, 2, & Ganesh Bhat S. 3
1Research Scholar, College of Management & Commerce, Srinivas University, Mangalore,
Karnataka, India. 2Assistant Professor, Department of Humanities, NMAM Institute of Technology, Nitte,
Karnataka, India.
OrcidID: 0000-0002-8177-8855; E-mail: [email protected] 3 Research Professor, College of Management & Commerce, Srinivas University, Mangalore,
Karnataka, India.
OrcidID: 0000-0003-1950-8536; E-mail: [email protected]
Area of the Paper: Business Management.
Type of the Paper: Research Case Study.
Type of Review: Peer Reviewed as per |C|O|P|E| guidance.
Indexed In: OpenAIRE.
DOI: https://doi.org/10.5281/zenodo.5463885
Google Scholar Citation: IJCSBE
International Journal of Case Studies in Business, IT and Education (IJCSBE)
A Refereed International Journal of Srinivas University, India.
Crossref DOI : https://doi.org/10.47992/IJCSBE.2581.6942.0124
© With Authors.
This work is licensed under a Creative Commons Attribution Non-Commercial 4.0
International License subject to proper citation to the publication source of the work.
Disclaimer: The scholarly papers as reviewed and published by the Srinivas Publications
(S.P.), India are the views and opinions of their respective authors and are not the views or
opinions of the S.P. The S.P. disclaims of any harm or loss caused due to the published content
to any party.
How to Cite this Paper:
Sonia Lobo, & Ganesh Bhat, S., (2021). Risk Return Analysis of Selected Stocks of Indian
Financial Sector. International Journal of Case Studies in Business, IT, and Education
(IJCSBE), 5(2), 111-124. DOI: https://doi.org/10.5281/zenodo.5463885
International Journal of Case Studies in Business, IT, and Education
(IJCSBE), ISSN: 2581-6942, Vol. 5, No. 2, September 2021 SRINIVAS
PUBLICATION
Sonia Lobo, et al, (2021); www.srinivaspublication.com PAGE 112
Risk Return Analysis of Selected Stocks of Indian
Financial Sector
Sonia Lobo 1, 2, & Ganesh Bhat S. 3
1Research Scholar, College of Management & Commerce, Srinivas University, Mangalore,
Karnataka, India. 2Assistant Professor, Department of Humanities, NMAM Institute of Technology, Nitte,
Karnataka, India.
OrcidID: 0000-0002-8177-8855; E-mail: [email protected] 3 Research Professor, College of Management & Commerce, Srinivas University, Mangalore,
Karnataka, India.
OrcidID: 0000-0003-1950-8536; E-mail: [email protected]
ABSTRACT
Purpose: Indian stock markets are channelizing financial resources for the economic progress
of the country. The Indian Financial Services sector is the subset of the stock market which is
playing a key role in stock trading. The Indian Financial Services industry is multifaceted and
is growing rapidly both in terms of the robust growth of existing firms and the entry of new
players playing a stellar role. This surge in growth of the Financial Services sector led many
investors to divert their investment towards the financial services segment. To construct an
attractive portfolio, the individual investor should perform a risk-return analysis well in
advance. This will assist the investor in determining the risk-return relationship in various
securities. Given this background, the study is undertaken to evaluate the risk-return patterns
of the Indian Financial Services sector securities.
Design/Methodology/Approach: The risk and return of sample group of companies belonging
to the Indian Financial Services sector are analyzed to arrive at a monthly return by taking the
monthly closing price of five financial investment companies belonging to the Standard &
Poor’s BSE Finance Index for the period January 2020 to July 2021. To achieve the objectives
various statistical tools such as descriptive statistics, correlation, and Beta are adopted. Also,
a paired t-test is performed to check the validity of the hypothesis.
Findings: The study has brought to light that India Infoline Finance Ltd (IIFL Finance) has
provided the highest monthly returns with a high beta value. Further, the tested hypothesis
reveals that there exists a significant difference in the monthly returns of the S&P BSE Finance
Index and JSW Holdings.
Originality/value: The study emphasizes the risk-return analysis of selected stocks of the
Indian Financial Services sector. Potential investors will benefit from this equity analysis
because it will enable them to make more intelligent and accurate investment decisions.
Paper Type: A case study of the Indian Financial Services Industry
Keywords: Risk and Return, Financial Services, Investors, Beta, S&P BSE Finance Index.
1. INTRODUCTION :
The Indian capital market has captivated the attention of both domestic and international investors and
is recognized as one of the most dynamic markets in the world. Being an entity, it provides a platform
for the various financial instruments to trade. Broadly, capital markets are classified into two types: the
primary market and the secondary market. Initial Public Offerings (IPOs), Follow on Public Offerings
(FPOs), Right issues, Preferential issues, and Bonds are first offered to the general public on the primary
market. After duly completing the process of listing on the stock exchanges such as the Bombay Stock
Exchange (BSE) and National Stock Exchange (NSE) and upon receiving the approval of the Securities
and Exchange Board of India (SEBI) they are traded on the secondary market. In other words, on the
International Journal of Case Studies in Business, IT, and Education
(IJCSBE), ISSN: 2581-6942, Vol. 5, No. 2, September 2021 SRINIVAS
PUBLICATION
Sonia Lobo, et al, (2021); www.srinivaspublication.com PAGE 113
secondary market, investors can purchase and sell securities. The primary market’s progress is
contingent on the secondary market’s expansion.
In India, the financial services industry rose to its prominence after the economic liberalization of the
1990s. Indian financial sector consists of the institutions such as Commercial Banks, Insurance
Companies, Non-banking Financial Institutions, Cooperatives, Pension Funds, Mutual Funds, and other
smaller financial institutions of different shades and colors. These financial intermediaries offer a
diverse range of services and these services are regarded as financial services (Goyal, 2015) [1]. The
spectrum of financial services provided by financial service organizations is critical to the successful
operation of any financial system. In recent times, the Indian financial services sector has emerged
gigantic because of growing demand, technological innovations, regulatory backing, and growing
penetration by financial firms in rural areas. The central government has brought a range of reforms to
liberalize, regulate, and strengthen the financial sector’s operations. The central government and the
Reserve Bank of India (RBI) have taken appropriate measures to make it easier for Micro, Small, and
Medium Enterprises (MSMEs) to secure funding. Though the financial services sector is growing
rapidly, there are many challenges that the financial industry is facing in terms of changes in client
preference, technological changes, and mainly the threats that are posted due to the globalization of
financial firms (Jain, 2013) [2]. Since the financial sector’s pros outweigh the cons, it appears to be
more promising and appealing for investors to venture in. However, getting down to the technicalities
of the business is always a good idea because it gives a better picture of how the industry is performing
financially. Given the above setting, this study is undertaken wherein a detailed evaluation of risk and
return of the Indian financial services stocks is ascertained.
The concept of risk and return has gained popularity, particularly in the aftermath of global economic
catastrophes like the Subprime crisis of 2007 to 2010. The term ‘return’ refers to the profits made or
losses incurred through security trading. Meanwhile, the ‘risk’ of an investment refers to the probability
of the investor losing his/her money. There are several types of risks, but the two major forms of risks
in the investment are systematic and unsystematic risks (Sharma & Bodla, 2012) [3].
• The risk that is connected with the market return is known as systematic risk. Macroeconomic
variables like inflation, interest rate changes, currency rate fluctuations, recessions, and wars
are responsible for causing systematic risk. Systematic risk is beyond the control of any
corporate enterprise. Systematic risk is calculated using the beta coefficient.
• Unsystematic risk is a risk that is idiosyncratic to a firm or sector. This risk is unique to a single
investment or a small set of investments. Business risk, Financial Risk, Credit-Related Risk,
Product Risk, Legal Risk, Liquidity Risk, Operational Issues, and so on are examples of the
risks that are specific to the organization or industry. Normally, the company or industry can
handle these types of unsystematic risks.
In equity investment, risk and return are highly interrelated concepts. Normally, if the return on
investment is small the risk is low. On the contrary, with greater risk comes a bigger return. The stock
market return also depends on the volatility of the market. Developed markets continue to give better
returns with minimal volatility over extended periods and in comparison to developed countries, the
Indian market has evolved to become more informational (Yadav, 2017) [4], (Patjoshi, 2016) [5]. The
desired degree of return and level of risk tolerance decides the choice of an investor in selecting the
various stocks. To make a smarter investment decision, performing the risk-return analysis ahead of
time will prove to be beneficial for the investors. This study primarily focuses on the performance of
the five financial services companies enlisted on the S&P BSE Finance Index with an emphasis on
determining the monthly rate of return of the individual stock and exposing the risk associated with
each particular stock. The S&P BSE Finance Index is taken as a benchmark for the study.
2. LITERATURE REVIEW :
Several researchers have significantly contributed to the area of risk and return analysis. A gist of some
of the scholarly publications published in this field is discussed in this section. Prabhu, (2018) [6]
analyzed the performance of Nifty stocks in the Indian capital market using the risk and return approach.
The research was done to examine the risk and return of the fifty stocks that make up the Nifty 50 Index.
Also, the study aims to establish the relationship of return with standard deviation and beta. The findings
reveal that during the research period market return and market volatility were negatively correlated. In
the article Suresh, (2018b) [7] has looked into the risk and return of private and public sector banks that

International Journal of Case Studies in Business, IT, and Education
(IJCSBE), ISSN: 2581-6942, Vol. 5, No. 2, September 2021 SRINIVAS
PUBLICATION
Sonia Lobo, et al, (2021); www.srinivaspublication.com PAGE 114
are part of the Bank Nifty Index. In addition, each bank’s performance is compared to a benchmark
Index. The study suggests that private sector banks have reported the highest portfolio return. On the
other hand, Karthika & Karthikeyan, (2011) [8] attempted to find the volatility of the shares using the
beta. The outcome of the research indicates that during the study period pharmaceutical, housing-
related, and automobile companies are the least risky companies for investment whereas banking,
power, construction, and oil-gas companies are the riskiest sectors for investment.
Nagarajan & Prabhakaran, (2013) [9] performed an equity evaluation on several NSE-listed FMCG
firms. The share price fluctuation of FMCG companies on NSE and the risk involved in the selected
companies' share price was ascertained. The findings revealed that all the companies share prices moved
in a positive direction with Nifty Index. Also, Vikkraman & Varadharajan, (2009) [10] in their article
have discussed risk and return analysis of the Indian automobile sector. Systematic risk, unsystematic
risk, market return, and stock return were assessed. It is noticed that during the study period based on
the risk-return trade-off, Mahindra & Mahindra company has topped the rest of the companies that were
considered for the study. Bora & Adhikary, 2015 [11] in their research have explained the association
between stock returns and market returns of the selected companies under the study. It is discovered
that the returns on securities and market returns have a positive association. Patjoshi & Nandini, (2020)
[12] have demonstrated the link between risk and return of Sensex and sample Steel businesses in India.
The mean, kurtosis, skewness were measured. The analysis discloses that Sensex’s average daily returns
were positive, but all of the sample steel businesses had negative returns.
Bantwa & Ansari, (2019) [13] evaluated the IT sector using the risk and return analysis approach. The
yearly absolute return and volatility of absolute return were calculated. According to the extensive data
analysis conducted, Tata Elxsi, Infibeam Avenues, and NIIT technologies have reported the highest rate
of return during the study period. Balaji et al., (2018) [14] have used Statistical tools like expected
returns and beta to measure the risk and return of the Automobile industry. It is found from the study
that investors could choose to invest in Eicher Motors and Force Motors, as the risk is consistently low
and the returns are consistently high during the study period. Joghee, (2021) [15] investigated risk-
return analysis of selected companies in the banking sector. The mean, standard deviation, covariance,
variance, correlation, and beta were calculated. It is disclosed from that the study that among the seven
banks taken for the study the Kotak Mahindra bank has yielded the highest return with low risk.
Investing in IndusInd Bank, on the other hand, was found to have a greater risk than other banks. Suresh,
(2018a) [16] in his study has examined the performance of the logistic sector taking into consideration
the risk and return elements. The findings suggest that the shares of Corporate Courier and Cargo
Limited have given tremendous returns whereas; the returns of Skypack service were low. Also, the
beta of all the companies taken for the study was found to be very high indicating greater risk. Rao et
al., (2020) [17] have made an effort to carry out a detailed analysis of the risk-return variables of the
companies listed on Bank Nifty. A risk-return comparison is made between the public and private sector
banks across two time periods i.e., during the UPA and NDA administrations. It is observed that during
the tenure of UPA governance, all the sample stocks have given a positive rate of return. However,
during the NDA governance, only 8 out of 12 stocks have rendered a positive rate of return. A.S. &
Bandi, (2021) [18] explained the volatility and return of Nifty Energy Index stocks listed on NSE. The
descriptive statistics used for the calculation showcased that the stocks understudy has exhibited
positive returns. Further, the application of the GARCH and ARCH model indicates that the NIFTY
Energy Index stocks are highly volatile. Savsani & Rathod, (2018) [19] discussed the risk-return
analysis of the Bombay Stock Exchange in comparison to chosen Indian banking equities. Researchers
have adopted paired t-test and regression techniques. It was revealed through the study that Sensex has
provided high returns as compared to all other selected stocks. Also, the Sensex was positively
correlated with all the bank’s returns and charted high correlation with ICICI Bank returns. Further, the
literature review on performing the company/industry analysis, Aithal, (2017) [20] has explained the
general framework to design the industry analysis. This case study framework will help aspiring
researchers develop case studies related to business management. Aithal, (2017) [21] [22] has also
created an outline to perform company analysis explaining in detail the systematic procedure to be
followed while drafting a business case study that will help the novice researchers.
3. RESEARCH METHODOLOGY :
3.1 Objectives:
International Journal of Case Studies in Business, IT, and Education
(IJCSBE), ISSN: 2581-6942, Vol. 5, No. 2, September 2021 SRINIVAS
PUBLICATION
Sonia Lobo, et al, (2021); www.srinivaspublication.com PAGE 115
The purpose of this piece of research is to highlight the risk-return analysis of a sample group of
securities of the Indian financial services sector. The study will assist the present and prospective
investors in comprehending the risk-reward trade-off of the selected financial services sector stocks
within the ambit of the S&P BSE Finance Index. The objectives of the present study are as follows:
1. To analyze the risk and return of chosen financial services companies covered by the S&P
BSE Finance Index.
2. To examine the relationship between the monthly return of the S&P BSE Finance Index and
selected securities monthly return.
3. To rank, the sample companies scrips based on the return yielded.
4. To assess the beta consistency of the selected companies on the S&P BSE Finance Index.
5. To determine the correlation coefficient of stocks with S&P BSE Finance Index to measure
the correlation.
3.2 Statement of Hypothesis:
While keeping the second objective in mind the following specific hypothesis is framed:
H0: There exists no significant relationship between the return of the S&P BSE Finance Index and the
return of sample financial services companies taken for the study.
H1: There exists a significant relationship between the return of the S&P BSE Finance Index and the
return of sample financial services companies taken for the study.
3.3 Nature of the Study:
The current study is empirical in nature. The monthly closing price of the Stock Market Index- S&P
BSE Finance Index and the monthly closing price of five financial services companies enlisted on the
S&P BSE Finance Index are considered for the study. Descriptive statistics are also used along with
performing a t-test.
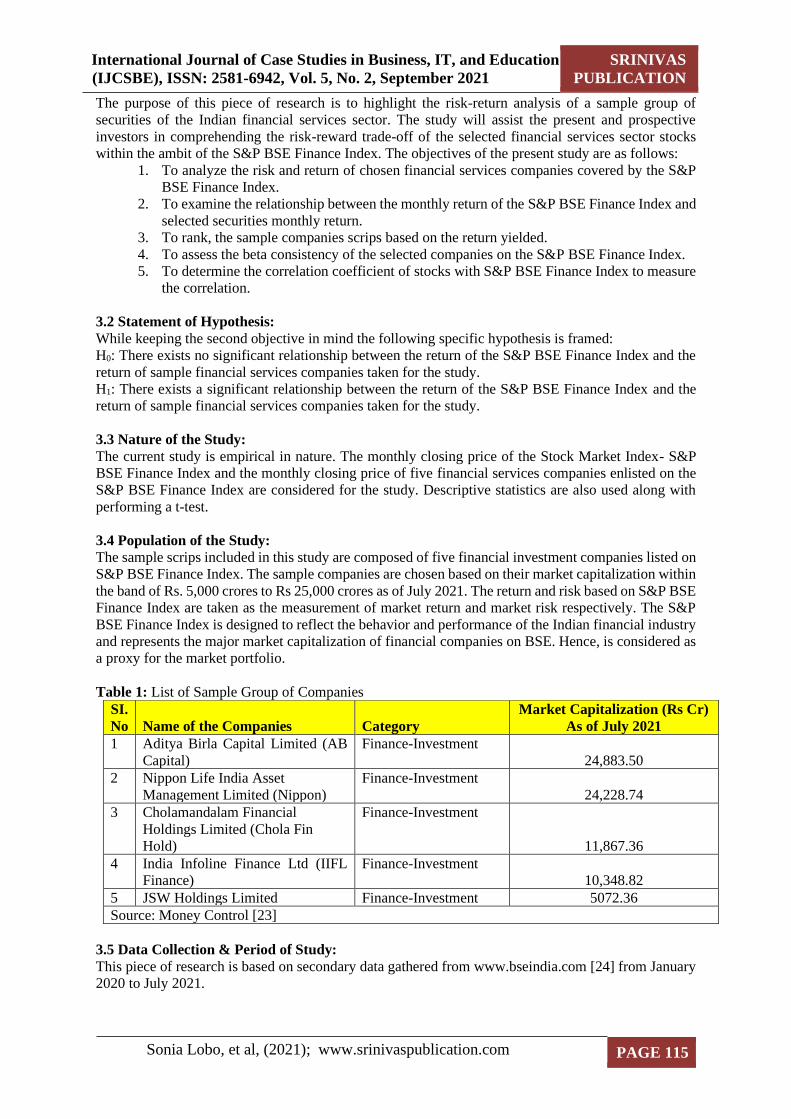
3.4 Population of the Study:
The sample scrips included in this study are composed of five financial investment companies listed on
S&P BSE Finance Index. The sample companies are chosen based on their market capitalization within
the band of Rs. 5,000 crores to Rs 25,000 crores as of July 2021. The return and risk based on S&P BSE
Finance Index are taken as the measurement of market return and market risk respectively. The S&P
BSE Finance Index is designed to reflect the behavior and performance of the Indian financial industry
and represents the major market capitalization of financial companies on BSE. Hence, is considered as
a proxy for the market portfolio.
3.5 Data Collection & Period of Study:
This piece of research is based on secondary data gathered from www.bseindia.com [24] from January
2020 to July 2021.
Table 1: List of Sample Group of Companies
SI.
No Name of the Companies Category
Market Capitalization (Rs Cr)
As of July 2021
1 Aditya Birla Capital Limited (AB
Capital)
Finance-Investment
24,883.50
2 Nippon Life India Asset
Management Limited (Nippon)
Finance-Investment
24,228.74
3 Cholamandalam Financial
Holdings Limited (Chola Fin
Hold)
Finance-Investment
11,867.36
4 India Infoline Finance Ltd (IIFL
Finance)
Finance-Investment
10,348.82
5 JSW Holdings Limited Finance-Investment 5072.36
Source: Money Control [23]

International Journal of Case Studies in Business, IT, and Education
(IJCSBE), ISSN: 2581-6942, Vol. 5, No. 2, September 2021 SRINIVAS
PUBLICATION
Sonia Lobo, et al, (2021); www.srinivaspublication.com PAGE 116
3.6 Tools Used for Data Analysis:
Each month’s closing price is used to compute the security return, which is calculated using the formula:
Ir= (Ct−Ct−1
Ct−1)
Where,
Ir=Monthly rate of return of the individual company.
Ct= Current month’s closing price of the individual security.
Ct-1=Previous month’s closing price of the individual security.
The following formula is used to calculate the market’s monthly rate of return:
Mk= (Ft−Ft−1
Ft−1)
Where, Mk= Monthly Rate of return on market.
Ft= Monthly closing value of S&P BSE Finance Index for the current month.
Ft-1= Monthly closing value of S&P BSE Finance Index for the previous month.
The measure of stock volatility related to the overall market is represented by Beta, which is calculated
using the following formula:
Beta (ꞵ) = (Covariance of Ir∗Covariance of M𝑘
Variance of Mk)
The correlation coefficient function is used to figure out how two variables are related linearly. The
measure of the correlation coefficient is computed by using the following formula:
r=n(∑xy)−(∑x)(∑y)
√[n∑x2−(∑x)2][n∑y2−(∑y)2]
A standard deviation is a statistical technique for measuring the dispersion of a dataset from its mean.
The following formula is used to compute the standard deviation:
SD=√∑(x−x ̅)
n
Skewness is defined as a measure of symmetry in distribution. The formula for skewness is as follows:
Skewness=𝑛
(𝑛−1)(𝑛−2)∑ (
𝑥𝑖−�̄�
𝑆)𝑛
𝑖=1
3
Kurtosis reveals how far the tails of a distribution diverge from those of a normal distribution. In other
words, kurtosis defines whether the distribution tails have extreme values. The formula to calculate
kurtosis is as follows:
Kurtosis=𝑛(𝑛+1)
𝑛(𝑛−1)(𝑛−2)(𝑛−3)∑ (
𝑥𝑖−�̄�
𝑆)𝑛
𝑖=1
4
3.7 Limitations of the Study:
The following are some of the constraints of the study:
1. The research is entirely grounded on historical data obtained from the BSE and Money Control
Websites. As the result, the findings of the research are fully reliant on the accuracy of the data.
2. On the subject of risk-return analysis, different specialists have differing perspectives.
Therefore, the point of view adopted in this study cannot be regarded as absolute or flawless.
4. DATA ANALYSIS & INTERPRETATION :
Table 2 below provides the calculated descriptive statistics of monthly returns of the sample financial
services companies.
International Journal of Case Studies in Business, IT, and Education
(IJCSBE), ISSN: 2581-6942, Vol. 5, No. 2, September 2021 SRINIVAS
PUBLICATION
Sonia Lobo, et al, (2021); www.srinivaspublication.com PAGE 117
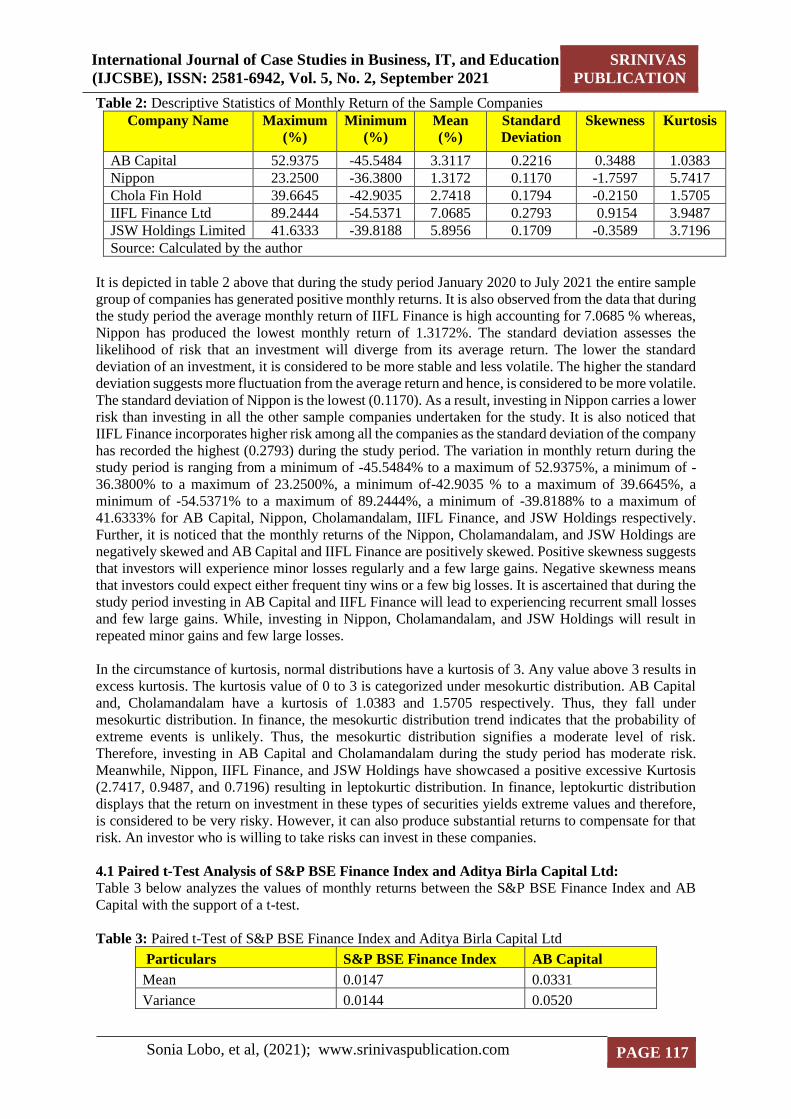
Table 2: Descriptive Statistics of Monthly Return of the Sample Companies
Company Name Maximum
(%)
Minimum
(%)
Mean
(%)
Standard
Deviation
Skewness Kurtosis
AB Capital 52.9375 -45.5484 3.3117 0.2216 0.3488 1.0383
Nippon 23.2500 -36.3800 1.3172 0.1170 -1.7597 5.7417
Chola Fin Hold 39.6645 -42.9035 2.7418 0.1794 -0.2150 1.5705
IIFL Finance Ltd 89.2444 -54.5371 7.0685 0.2793 0.9154 3.9487
JSW Holdings Limited 41.6333 -39.8188 5.8956 0.1709 -0.3589 3.7196
Source: Calculated by the author
It is depicted in table 2 above that during the study period January 2020 to July 2021 the entire sample
group of companies has generated positive monthly returns. It is also observed from the data that during
the study period the average monthly return of IIFL Finance is high accounting for 7.0685 % whereas,
Nippon has produced the lowest monthly return of 1.3172%. The standard deviation assesses the
likelihood of risk that an investment will diverge from its average return. The lower the standard
deviation of an investment, it is considered to be more stable and less volatile. The higher the standard
deviation suggests more fluctuation from the average return and hence, is considered to be more volatile.
The standard deviation of Nippon is the lowest (0.1170). As a result, investing in Nippon carries a lower
risk than investing in all the other sample companies undertaken for the study. It is also noticed that
IIFL Finance incorporates higher risk among all the companies as the standard deviation of the company
has recorded the highest (0.2793) during the study period. The variation in monthly return during the
study period is ranging from a minimum of -45.5484% to a maximum of 52.9375%, a minimum of -
36.3800% to a maximum of 23.2500%, a minimum of-42.9035 % to a maximum of 39.6645%, a
minimum of -54.5371% to a maximum of 89.2444%, a minimum of -39.8188% to a maximum of
41.6333% for AB Capital, Nippon, Cholamandalam, IIFL Finance, and JSW Holdings respectively.
Further, it is noticed that the monthly returns of the Nippon, Cholamandalam, and JSW Holdings are
negatively skewed and AB Capital and IIFL Finance are positively skewed. Positive skewness suggests
that investors will experience minor losses regularly and a few large gains. Negative skewness means
that investors could expect either frequent tiny wins or a few big losses. It is ascertained that during the
study period investing in AB Capital and IIFL Finance will lead to experiencing recurrent small losses
and few large gains. While, investing in Nippon, Cholamandalam, and JSW Holdings will result in
repeated minor gains and few large losses.
In the circumstance of kurtosis, normal distributions have a kurtosis of 3. Any value above 3 results in
excess kurtosis. The kurtosis value of 0 to 3 is categorized under mesokurtic distribution. AB Capital
and, Cholamandalam have a kurtosis of 1.0383 and 1.5705 respectively. Thus, they fall under
mesokurtic distribution. In finance, the mesokurtic distribution trend indicates that the probability of
extreme events is unlikely. Thus, the mesokurtic distribution signifies a moderate level of risk.
Therefore, investing in AB Capital and Cholamandalam during the study period has moderate risk.
Meanwhile, Nippon, IIFL Finance, and JSW Holdings have showcased a positive excessive Kurtosis
(2.7417, 0.9487, and 0.7196) resulting in leptokurtic distribution. In finance, leptokurtic distribution
displays that the return on investment in these types of securities yields extreme values and therefore,
is considered to be very risky. However, it can also produce substantial returns to compensate for that
risk. An investor who is willing to take risks can invest in these companies.
4.1 Paired t-Test Analysis of S&P BSE Finance Index and Aditya Birla Capital Ltd:
Table 3 below analyzes the values of monthly returns between the S&P BSE Finance Index and AB
Capital with the support of a t-test.
Table 3: Paired t-Test of S&P BSE Finance Index and Aditya Birla Capital Ltd
Particulars S&P BSE Finance Index AB Capital
Mean 0.0147 0.0331
Variance 0.0144 0.0520
International Journal of Case Studies in Business, IT, and Education
(IJCSBE), ISSN: 2581-6942, Vol. 5, No. 2, September 2021 SRINIVAS
PUBLICATION
Sonia Lobo, et al, (2021); www.srinivaspublication.com PAGE 118
Observations 18 18
Pearson Correlation 0.8361
Hypothesized Mean Difference 0
Df 17
t Stat -0.5449
P(T<=t) one-tail 0.2965
t Critical one-tail 1.7396
P(T<=t) two-tail 0.5929
t Critical two-tail 2.1098
Source: Calculated at 5% level of significance
The t-test result indicates that the monthly average return of the AB Capital is (0.0331) healthier than
the monthly returns of the S&P BSE Finance Index (0.0147); which denotes that the monthly return of
the AB Capital has performed better than the S&P BSE Finance Index. Meanwhile, the smaller variance
of the S&P BSE Finance Index (0.0144) compared to AB Capital (0.0520) undoubtedly agrees that in
comparison to the latter, the former is more consistent. Again, the correlation values of 0.8361indicates
a significant positive relationship between the S&P BSE Finance Index and AB Capital. The p-value of
0.2965 is more than 0.05, which points out that there is no significant difference between the monthly
returns of S&P BSE Finance and AB Capital at a level of significance of 5 percent. Subsequently, the
null hypothesis (H0) is accepted.
4.2 Paired t-Test Analysis of S&P BSE Finance Index and Nippon Life India Asset Management
Limited:
Table 4 reveals the outcome of the paired t-test reflecting the significance between the monthly return
of the S&P BSE Finance Index and Nippon Life India Asset Management Ltd for the study period
January 2020 to July 2021.
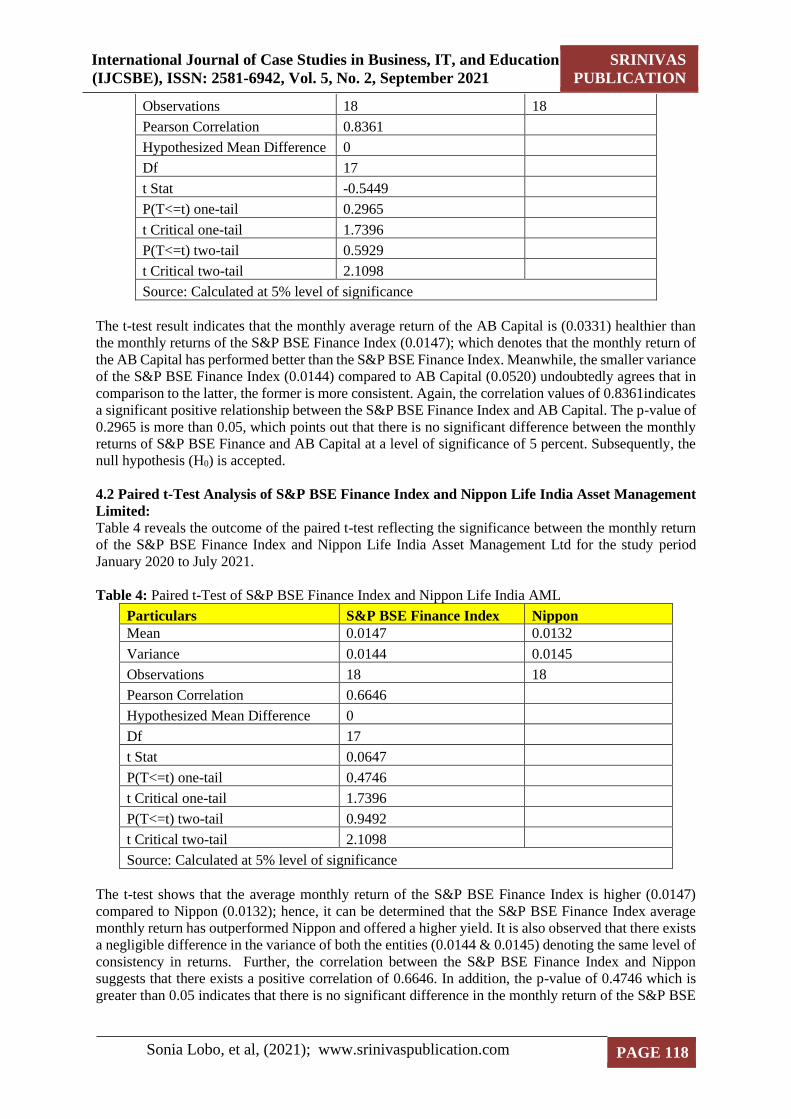
Table 4: Paired t-Test of S&P BSE Finance Index and Nippon Life India AML
Particulars S&P BSE Finance Index Nippon
Mean 0.0147 0.0132
Variance 0.0144 0.0145
Observations 18 18
Pearson Correlation 0.6646
Hypothesized Mean Difference 0
Df 17
t Stat 0.0647
P(T<=t) one-tail 0.4746
t Critical one-tail 1.7396
P(T<=t) two-tail 0.9492
t Critical two-tail 2.1098
Source: Calculated at 5% level of significance
The t-test shows that the average monthly return of the S&P BSE Finance Index is higher (0.0147)
compared to Nippon (0.0132); hence, it can be determined that the S&P BSE Finance Index average
monthly return has outperformed Nippon and offered a higher yield. It is also observed that there exists
a negligible difference in the variance of both the entities (0.0144 & 0.0145) denoting the same level of
consistency in returns. Further, the correlation between the S&P BSE Finance Index and Nippon
suggests that there exists a positive correlation of 0.6646. In addition, the p-value of 0.4746 which is
greater than 0.05 indicates that there is no significant difference in the monthly return of the S&P BSE
International Journal of Case Studies in Business, IT, and Education
(IJCSBE), ISSN: 2581-6942, Vol. 5, No. 2, September 2021 SRINIVAS
PUBLICATION
Sonia Lobo, et al, (2021); www.srinivaspublication.com PAGE 119
Finance Index and Nippon at a 5 percent level of significance. Accordingly, in this case, the null
hypothesis (H0) is accepted.
4.3 Paired t-Test Analysis of S&P BSE Finance Index and Cholamandalam Financial Holdings
Ltd:
Table 5 below appraisals the significance of the monthly return of the S&P BSE Finance Index and
Cholamandalam Financial Holdings Ltd. with the aid of a t-test.
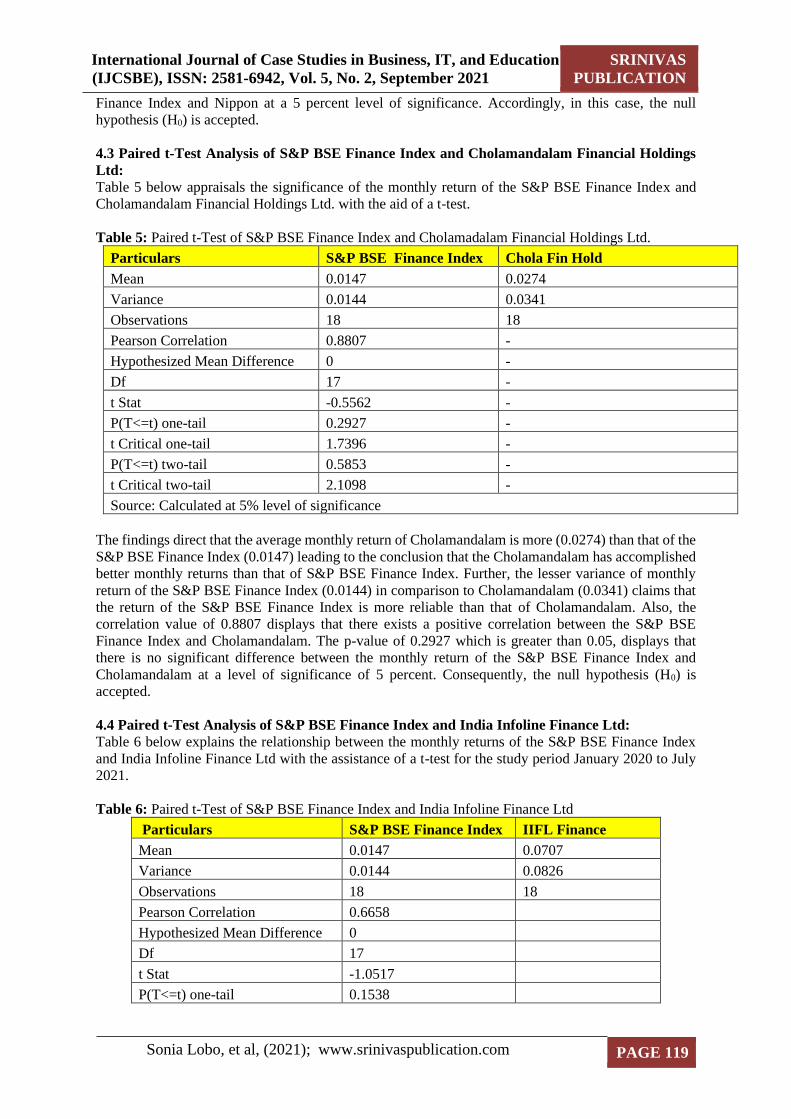
Table 5: Paired t-Test of S&P BSE Finance Index and Cholamadalam Financial Holdings Ltd.
Particulars S&P BSE Finance Index Chola Fin Hold
Mean 0.0147 0.0274
Variance 0.0144 0.0341
Observations 18 18
Pearson Correlation 0.8807 -
Hypothesized Mean Difference 0 -
Df 17 -
t Stat -0.5562 -
P(T<=t) one-tail 0.2927 -
t Critical one-tail 1.7396 -
P(T<=t) two-tail 0.5853 -
t Critical two-tail 2.1098 -
Source: Calculated at 5% level of significance
The findings direct that the average monthly return of Cholamandalam is more (0.0274) than that of the
S&P BSE Finance Index (0.0147) leading to the conclusion that the Cholamandalam has accomplished
better monthly returns than that of S&P BSE Finance Index. Further, the lesser variance of monthly
return of the S&P BSE Finance Index (0.0144) in comparison to Cholamandalam (0.0341) claims that
the return of the S&P BSE Finance Index is more reliable than that of Cholamandalam. Also, the
correlation value of 0.8807 displays that there exists a positive correlation between the S&P BSE
Finance Index and Cholamandalam. The p-value of 0.2927 which is greater than 0.05, displays that
there is no significant difference between the monthly return of the S&P BSE Finance Index and
Cholamandalam at a level of significance of 5 percent. Consequently, the null hypothesis (H0) is
accepted.
4.4 Paired t-Test Analysis of S&P BSE Finance Index and India Infoline Finance Ltd:
Table 6 below explains the relationship between the monthly returns of the S&P BSE Finance Index
and India Infoline Finance Ltd with the assistance of a t-test for the study period January 2020 to July
2021.
Table 6: Paired t-Test of S&P BSE Finance Index and India Infoline Finance Ltd
Particulars S&P BSE Finance Index IIFL Finance
Mean 0.0147 0.0707
Variance 0.0144 0.0826
Observations 18 18
Pearson Correlation 0.6658
Hypothesized Mean Difference 0
Df 17
t Stat -1.0517
P(T<=t) one-tail 0.1538
International Journal of Case Studies in Business, IT, and Education
(IJCSBE), ISSN: 2581-6942, Vol. 5, No. 2, September 2021 SRINIVAS
PUBLICATION
Sonia Lobo, et al, (2021); www.srinivaspublication.com PAGE 120
t Critical one-tail 1.7396
P(T<=t) two-tail 0.3077
t Critical two-tail 2.1098
Source: Calculated at 5% level of significance
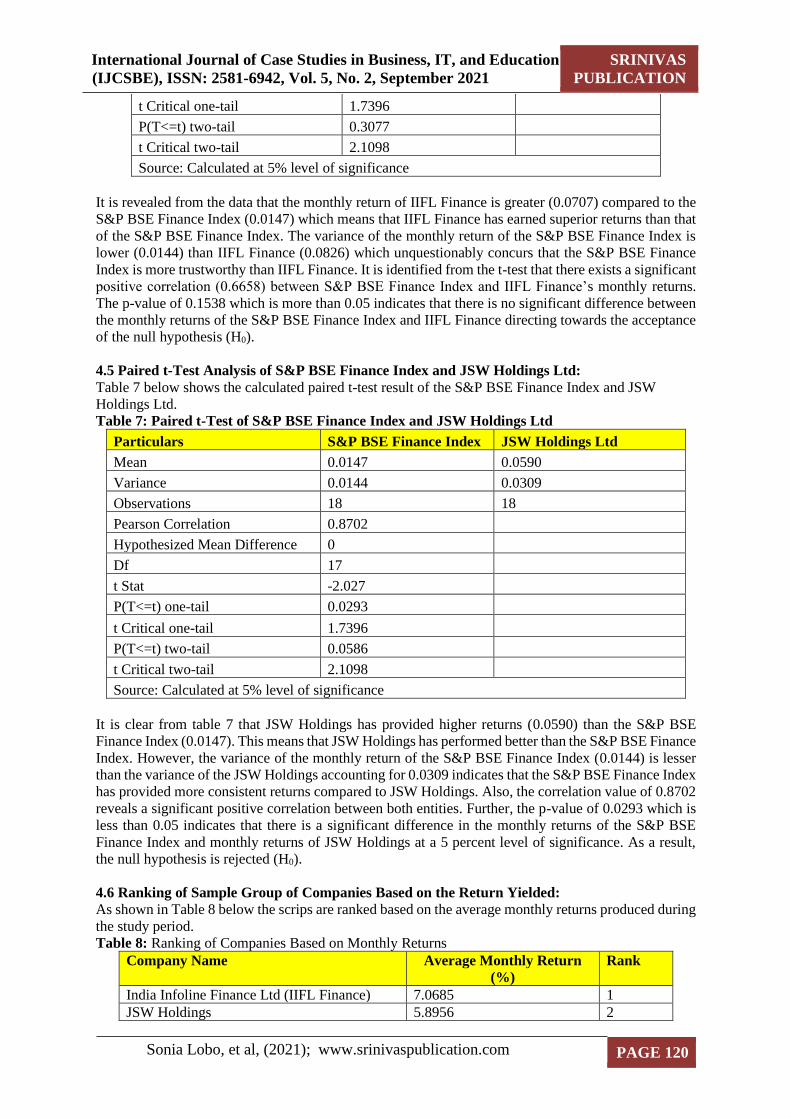
It is revealed from the data that the monthly return of IIFL Finance is greater (0.0707) compared to the
S&P BSE Finance Index (0.0147) which means that IIFL Finance has earned superior returns than that
of the S&P BSE Finance Index. The variance of the monthly return of the S&P BSE Finance Index is
lower (0.0144) than IIFL Finance (0.0826) which unquestionably concurs that the S&P BSE Finance
Index is more trustworthy than IIFL Finance. It is identified from the t-test that there exists a significant
positive correlation (0.6658) between S&P BSE Finance Index and IIFL Finance’s monthly returns.
The p-value of 0.1538 which is more than 0.05 indicates that there is no significant difference between
the monthly returns of the S&P BSE Finance Index and IIFL Finance directing towards the acceptance
of the null hypothesis (H0).
4.5 Paired t-Test Analysis of S&P BSE Finance Index and JSW Holdings Ltd:
Table 7 below shows the calculated paired t-test result of the S&P BSE Finance Index and JSW
Holdings Ltd.
Table 7: Paired t-Test of S&P BSE Finance Index and JSW Holdings Ltd
Particulars S&P BSE Finance Index JSW Holdings Ltd
Mean 0.0147 0.0590
Variance 0.0144 0.0309
Observations 18 18
Pearson Correlation 0.8702
Hypothesized Mean Difference 0
Df 17
t Stat -2.027
P(T<=t) one-tail 0.0293
t Critical one-tail 1.7396
P(T<=t) two-tail 0.0586
t Critical two-tail 2.1098
Source: Calculated at 5% level of significance
It is clear from table 7 that JSW Holdings has provided higher returns (0.0590) than the S&P BSE
Finance Index (0.0147). This means that JSW Holdings has performed better than the S&P BSE Finance
Index. However, the variance of the monthly return of the S&P BSE Finance Index (0.0144) is lesser
than the variance of the JSW Holdings accounting for 0.0309 indicates that the S&P BSE Finance Index
has provided more consistent returns compared to JSW Holdings. Also, the correlation value of 0.8702
reveals a significant positive correlation between both entities. Further, the p-value of 0.0293 which is
less than 0.05 indicates that there is a significant difference in the monthly returns of the S&P BSE
Finance Index and monthly returns of JSW Holdings at a 5 percent level of significance. As a result,
the null hypothesis is rejected (H0).
4.6 Ranking of Sample Group of Companies Based on the Return Yielded:
As shown in Table 8 below the scrips are ranked based on the average monthly returns produced during
the study period.
Table 8: Ranking of Companies Based on Monthly Returns
Company Name Average Monthly Return
(%)
Rank
India Infoline Finance Ltd (IIFL Finance) 7.0685 1
JSW Holdings 5.8956 2
International Journal of Case Studies in Business, IT, and Education
(IJCSBE), ISSN: 2581-6942, Vol. 5, No. 2, September 2021 SRINIVAS
PUBLICATION
Sonia Lobo, et al, (2021); www.srinivaspublication.com PAGE 121
AB Capital 3.3117 3
Chola Fin Holdings 2.7418 4
Nippon 1.3172 5
Source: Calculated by the author
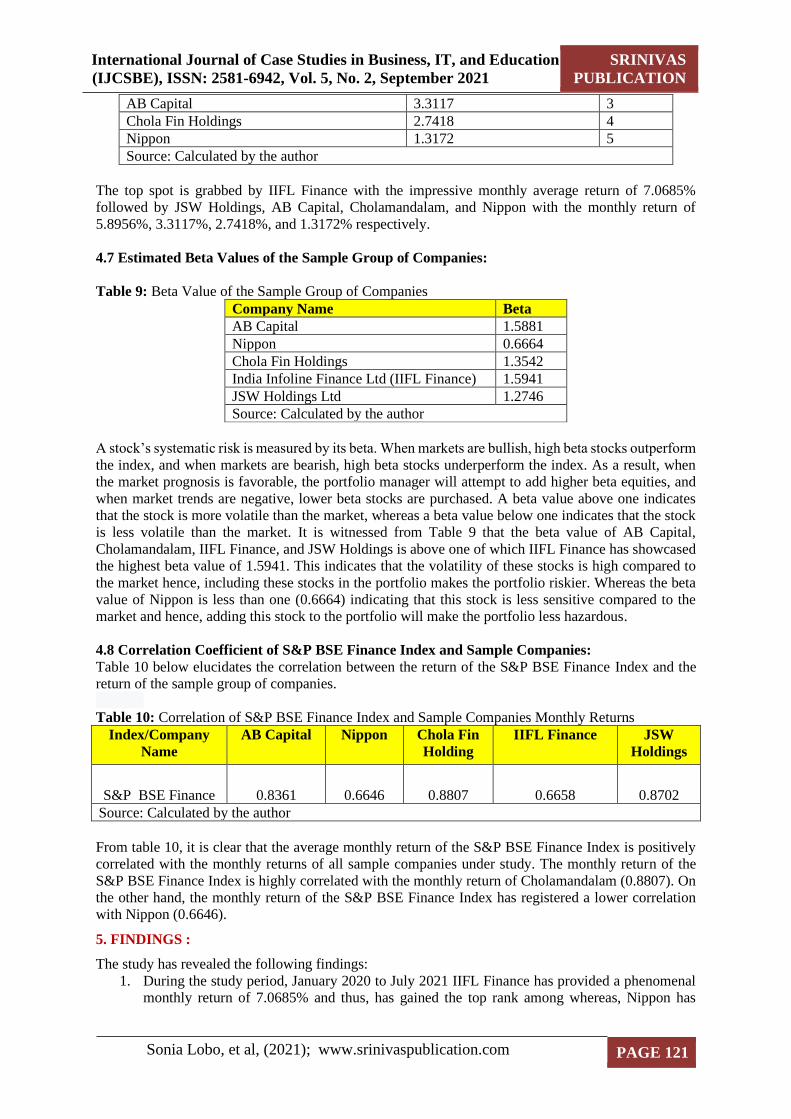
The top spot is grabbed by IIFL Finance with the impressive monthly average return of 7.0685%
followed by JSW Holdings, AB Capital, Cholamandalam, and Nippon with the monthly return of
5.8956%, 3.3117%, 2.7418%, and 1.3172% respectively.
4.7 Estimated Beta Values of the Sample Group of Companies:
Table 9: Beta Value of the Sample Group of Companies
Company Name Beta
AB Capital 1.5881
Nippon 0.6664
Chola Fin Holdings 1.3542
India Infoline Finance Ltd (IIFL Finance) 1.5941
JSW Holdings Ltd 1.2746
Source: Calculated by the author
A stock’s systematic risk is measured by its beta. When markets are bullish, high beta stocks outperform
the index, and when markets are bearish, high beta stocks underperform the index. As a result, when
the market prognosis is favorable, the portfolio manager will attempt to add higher beta equities, and
when market trends are negative, lower beta stocks are purchased. A beta value above one indicates
that the stock is more volatile than the market, whereas a beta value below one indicates that the stock
is less volatile than the market. It is witnessed from Table 9 that the beta value of AB Capital,
Cholamandalam, IIFL Finance, and JSW Holdings is above one of which IIFL Finance has showcased
the highest beta value of 1.5941. This indicates that the volatility of these stocks is high compared to
the market hence, including these stocks in the portfolio makes the portfolio riskier. Whereas the beta
value of Nippon is less than one (0.6664) indicating that this stock is less sensitive compared to the
market and hence, adding this stock to the portfolio will make the portfolio less hazardous.
4.8 Correlation Coefficient of S&P BSE Finance Index and Sample Companies:
Table 10 below elucidates the correlation between the return of the S&P BSE Finance Index and the
return of the sample group of companies.
Table 10: Correlation of S&P BSE Finance Index and Sample Companies Monthly Returns
Index/Company
Name
AB Capital Nippon Chola Fin
Holding
IIFL Finance JSW
Holdings
S&P BSE Finance 0.8361 0.6646 0.8807 0.6658 0.8702
Source: Calculated by the author
From table 10, it is clear that the average monthly return of the S&P BSE Finance Index is positively
correlated with the monthly returns of all sample companies under study. The monthly return of the
S&P BSE Finance Index is highly correlated with the monthly return of Cholamandalam (0.8807). On
the other hand, the monthly return of the S&P BSE Finance Index has registered a lower correlation
with Nippon (0.6646).
5. FINDINGS :
The study has revealed the following findings:
1. During the study period, January 2020 to July 2021 IIFL Finance has provided a phenomenal
monthly return of 7.0685% and thus, has gained the top rank among whereas, Nippon has
International Journal of Case Studies in Business, IT, and Education
(IJCSBE), ISSN: 2581-6942, Vol. 5, No. 2, September 2021 SRINIVAS
PUBLICATION
Sonia Lobo, et al, (2021); www.srinivaspublication.com PAGE 122
produced the least monthly return of 1.3172% and stands at fifth place among the sample group
of companies taken for the study.
2. The standard deviation and beta value of the Nippon have accounted for the lowest indicating
more stable returns and suggesting low risk of investment. Meantime, IIFL Finance has
reported the highest standard deviation and beta value reflecting a heavy risk of investment in
this company. It is evident from the analysis that when the risk is lower the returns are poorer
and when the risk is higher the reward is greater.
3. Nippon, Cholamandalam, and JSW Holding’s monthly returns are negatively skewed, whereas
AB Capital and IIFL Finance’s monthly returns are positively skewed.
4. In terms of kurtosis Nippon, IIFL Finance and JSW Holdings have resulted in producing
leptokurtic distribution pointing that investing in these securities results in producing extreme
values and is considered to be riskier. However, in some cases, the securities may provide
excellent returns for bearing the huge risk. It is clear from the study that IIFL Finance and JSW
Holdings have given better returns; whereas, Nippon has produced lower returns during the
study period. The study also shows that AB Capital and Cholamandalam have generated
mesokurtic distribution displaying that investment in these companies’ equities comes with a
moderate level of risk. It is also noted that AB Capital and Cholamandalam have supplied
moderate returns in exchange for a moderate level of risk.
5. The t-test performed suggests that there is a significant difference between the monthly return
of the S&P BSE Finance Index and JSW Holdings. Conversely, it was found through the t-test
that there exists no significant difference between the monthly returns of the S&P BSE Finance
Index and AB Capital, Nippon, Cholamandalam, and IIFL Finance.
6. The beta value of AB Capital, Cholamandalm, IIFL Finance, and JSW Holdings is greater than
one; pointing out that these stocks are more volatile compared to the market, and adding them
to the portfolio will cause greater risk. Further, Nippon has rendered a beta of less than one
leading to the conclusion that this stock is less volatile than the market and therefore, considered
to be defensive stock.
7. Finally, the outcome of the correlation coefficient calculation reveals that all the stocks were
positively correlated with S&P BSE Finance Index. The correlation coefficient of
Cholamandalam recorded the highest with S&P BSE Finance Index and the correlation
coefficient of Nippon logged the least with S&P BSE Finance Index.
6. SUGGESTIONS :
The following suggestions are made, keeping in mind the above findings:
1. Based on the observations it is suggested that during the study period the investor could invest
in IIFL Finance as the return generated is handsome. However, the standard deviation and beta
value of the stock indicate that there is a greater risk associated with investing in this stock, but
it has produced the best reward in exchange for the risk. Therefore, it is a highly recommended
stock for investors who are willing to take the risk.
2. JSW Holdings has also delivered impressive monthly returns. Meanwhile, AB Capital has
rendered a moderate monthly return. However, the analysis shows that the risk associated with
these stocks varies from medium to high. Hence, depending on the risk-bearing capacity of the
investor, the stock/s can be chosen for investment.
3. During the study period, investors could prefer to invest in positively skewed securities such as
AB Capital and IIFL Finance since; the few huge gains obtained may offset the frequent tiny
losses incurred. However, the investors may also consider investing in negatively skewed
securities such as Nippon, Cholamandalam, and JSW holdings if they prefer regular small gains
over a few massive losses.
4. Before investing in securities, investors should conduct fundamental analysis rather than
relying solely on technical analysis.
5. Respecting the universal truth, diversifying the portfolio will reduce the unsystematic risk.
7. CONCLUSIONS :
This study has primarily evaluated the risk and return of selected financial services companies listed on
the S&P BSE Finance Index. The statistical tools such as mean, standard deviation, skewness, kurtosis,
International Journal of Case Studies in Business, IT, and Education
(IJCSBE), ISSN: 2581-6942, Vol. 5, No. 2, September 2021 SRINIVAS
PUBLICATION
Sonia Lobo, et al, (2021); www.srinivaspublication.com PAGE 123
beta, and correlation coefficient have been adopted to carry out the analysis. In addition, a paired t-test
is performed to assess the relationship between the monthly return of the S&P BSE Finance Index and
the sample group of companies. It is found from the study that over the study period January 2020 to
July 2021, IIFL Finance has displayed an excellent monthly return but it incorporates higher risk as the
beta value of the stock is greater than one. Therefore, the investor who is willing to opt for the risk can
invest in this company. The standard deviation and beta of Nippon were the lowest as compared to all
other sample companies implying greater consistency in return and lower risk of investment. However,
the return generated by Nippon is the lowest. In the circumstance of skewness, the monthly returns of
AB Capital and IIFL Finance have produced positive skewness whereas; Nippon, Cholamandalam, and
JSW Holding's monthly returns have displayed negative skewness. The kurtosis of monthly returns of
Nippon, IIFL Finance, and JSW Holdings have generated leptokurtic distribution whereas, AB Capital
and Cholamandalam have given mesokurtic distribution. The paired t-test carried out signals that there
is a significant difference between the monthly return of the S&P BSE Finance and JSW Holdings. On
the other hand, it is revealed from the result of the t-test that there exists no significant difference
between the monthly return of the S&P BSE Finance Index and the monthly return of AB Capital,
Nippon, Cholamandalam, and IIFL Finance. Finally, it is found that there exists a positive correlation
between the S&P BSE Finance Index monthly returns and all of the sample companies’ monthly returns
with Cholamandalam and Nippon reporting the highest and lowest correlation respectively with the
S&P BSE Finance Index.
REFERENCES :
[1] Goyal, P. K. (2015). An Overview of Financial Services in Indian Context. International Research
Journal of Commerce Arts and Science, 6(7), 180–188.
[2] Jain, Y. (2013). Financial Services Sector at the center stage of Indian economy: Opportunities &
Challenges. Asia Pacific Journal of Management & Entrepreneurship Research, 2(1), 209–220.
[3] Sharma, G. D., & Bodla, B. S. (2012). Rewards & Risks in Stock Markets: A Case of South Asia.
The International Journal of Applied Economics & Finance, 6(2), 37–52.
[4] Yadav, S. (2017). Stock Market Volatility-A Study of Indian Stock market. Global Journal for
Research Analysis, 6(4), 629–632.
[5] Patjoshi, P. K. (2016). Comparative risk return analysis of Bombay stock market with selected
banking stocks in India. International Journal of Management & Social Sciences, 4(1), 2016.
[6] Prabhu, R. N. (2018). Risk & return analysis of nifty stock in Indian capital market. International
Journal of Multidisciplinary Research and Development, 5(3), 8-12.
[7] Suresh, A. S. (2018b). Study on Comparison of Risk—Return Analysis of Public and Private
Sector Banks listed on Bank Nifty. Economic Research, 2(1), 1–8.
[8] Karthika, D. P., & Karthikeyan, P. (2011). A Study on Comparative Analysis of Risk and Return
with reference to Selected stocks of BSE Sensex Index, India. The International Journal’s
Research Journal of Social Science and Research, 1(04), 101-114.
[9] Nagarajan, S., & Prabhakaran, K. (2013). A Study on Equity Analysis of Selected FMCG
Companies Listed on NSE. International Journal of Management Focus, 1(1), 1–7.
[10] Vikkraman, P., & Varadharajan, P. (2009). A Study on Risk & Return analysis of Automobile
industry in India (2004-2007). Journal of Contemporary Research in Management, 1(1), 35–40.
[11] Bora, B., & Adhikary, A. (2015). Risk and Return Relationship-An Empirical Study of BSE Sensex
Companies in India. Universal Journal of Accounting and Finance, 3(2), 45–51.
[12] Patjoshi, P. K., & Nandini, G. (2020). Comparative Risk and Return Analysis of Bombay Stock
Exchanges and Steel Sector in India. Gedrag & Organisatie Review, 33(2), 795–802.
[13] Bantwa, A., & Ansari, F. U. (2019). Risk Return Analysis of Equity Stocks: A Study of Selected
Indian IT Companies. MUDRA : Journal of Finance and Accounting, 6(1), 31–43.
https://doi.org/10.17492/mudra.v6i1.182822

International Journal of Case Studies in Business, IT, and Education
(IJCSBE), ISSN: 2581-6942, Vol. 5, No. 2, September 2021 SRINIVAS
PUBLICATION
Sonia Lobo, et al, (2021); www.srinivaspublication.com PAGE 124
[14] Balaji, C., Kusuma, G. D. V., & Kumar, B. R. (2018). Risk and Return Analysis of Equity Shares
of Selected Companies in Automobile Industry. Asian Journal of Multi-Disciplinary Research,
4(2), 37–42. http://dx.doi.org/10.20468/ajmdr.2018.02.09.
[15] Joghee, M. V. (2021). A Study on Risk and Return Analysis of Selected Banking Securities.
Turkish Journal of Computer and Mathematics Education (TURCOMAT), 12(11), 122–127.
[16] Suresh, A. S. (2018a). Equity analysis of selected Logistics sectors stocks. Asian Journal of
Management, 9(4), 1301–1304
[17] Rao, D., Srinivasa, M., Podile, D., & Navvula, D. (2020). Risk and Return Analysis of Selected
Nifty Banking Stocks. European Journal of Molecular & Clinical Medicine, 7(4), 1010–1018.
[18] Suresh, A. S., & Bandi, S. (2021), Volatility Modelling for Nifty Energy Index Stocks Listed in
NSE. International Journal of Advance Research in Management and Social Science, 10(2), 1-10.
[19] Savsani, M., & Rathod, U. (2018). Comparative Risk Return Analysis of Bombay Stock Market
with Selected Banking Stocks in India. International Journal of Scientific Research in Science and
Technology, 4(5), 908-916.
[20] Aithal, P. S. (2017). Industry Analysis–The First Step in Business Management Scholarly
Research. International Journal of Case Studies in Business, IT and Education (IJCSBE), 1(1), 1-
13.
[21] Aithal P. S. (2017). An effective method of developing business case studies based on company
analysis. International Journal of Engineering Research and Modern Education (IJERME), 2(1),
16-27.
[22] Aithal, P. S. (2017). Company Analysis–The Beginning Step for Scholarly Research. International
Journal of Case Studies in Business, IT and Education (IJCSBE), 1(1), 1-18.
[23] www.moneycontrol.com/stocks/market info/marketcap/bse/finance-investment.html?classic=true
last accessed on 28.07.2021
[24] www.bseindia.com retrieved on 30.07.2021
**********
Related Documents