Risk of Cardiovascular Disease and Total Mortality in Adults with Type 1 Diabetes: Scottish Registry Linkage Study Shona J. Livingstone 1 , Helen C. Looker 1 , Eleanor J. Hothersall 1 , Sarah H. Wild 2 , Robert S. Lindsay 3 , John Chalmers 4 , Stephen Cleland 5 , Graham P. Leese 1 , John McKnight 2,6 , Andrew D. Morris 1 , Donald W. M. Pearson 7 , Norman R. Peden 8 , John R. Petrie 3 , Sam Philip 7 , Naveed Sattar 3 , Frank Sullivan 1 , Helen M. Colhoun 1,4 * 1 University of Dundee, Dundee, United Kingdom, 2 University of Edinburgh, Edinburgh, United Kingdom, 3 University of Glasgow, Glasgow, United Kingdom, 4 National Health Service (NHS) Fife, Kirkcaldy, United Kingdom, 5 NHS Greater Glasgow, Glasgow, United Kingdom, 6 NHS Lothian, Edinburgh, United Kingdom, 7 University of Aberdeen, Aberdeen, United Kingdom, 8 NHS Forth Valley, Falkirk, United Kingdom Abstract Background: Randomized controlled trials have shown the importance of tight glucose control in type 1 diabetes (T1DM), but few recent studies have evaluated the risk of cardiovascular disease (CVD) and all-cause mortality among adults with T1DM. We evaluated these risks in adults with T1DM compared with the non-diabetic population in a nationwide study from Scotland and examined control of CVD risk factors in those with T1DM. Methods and Findings: The Scottish Care Information-Diabetes Collaboration database was used to identify all people registered with T1DM and aged $20 years in 2005–2007 and to provide risk factor data. Major CVD events and deaths were obtained from the national hospital admissions database and death register. The age-adjusted incidence rate ratio (IRR) for CVD and mortality in T1DM (n =21,789) versus the non-diabetic population (3.96 million) was estimated using Poisson regression. The age-adjusted IRR for first CVD event associated with T1DM versus the non-diabetic population was higher in women (3.0: 95% CI 2.4–3.8, p,0.001) than men (2.3: 2.0–2.7, p,0.001) while the IRR for all-cause mortality associated with T1DM was comparable at 2.6 (2.2–3.0, p,0.001) in men and 2.7 (2.2–3.4, p,0.001) in women. Between 2005–2007, among individuals with T1DM, 34 of 123 deaths among 10,173 who were ,40 years and 37 of 907 deaths among 12,739 who were $40 years had an underlying cause of death of coma or diabetic ketoacidosis. Among individuals 60–69 years, approximately three extra deaths per 100 per year occurred among men with T1DM (28.51/1,000 person years at risk), and two per 100 per year for women (17.99/1,000 person years at risk). 28% of those with T1DM were current smokers, 13% achieved target HbA 1c of ,7% and 37% had very poor ($9%) glycaemic control. Among those aged $40, 37% had blood pressures above even conservative targets ($140/90 mmHg) and 39% of those $40 years were not on a statin. Although many of these risk factors were comparable to those previously reported in other developed countries, CVD and mortality rates may not be generalizable to other countries. Limitations included lack of information on the specific insulin therapy used. Conclusions: Although the relative risks for CVD and total mortality associated with T1DM in this population have declined relative to earlier studies, T1DM continues to be associated with higher CVD and death rates than the non-diabetic population. Risk factor management should be improved to further reduce risk but better treatment approaches for achieving good glycaemic control are badly needed. Please see later in the article for the Editors’ Summary. Citation: Livingstone SJ, Looker HC, Hothersall EJ, Wild SH, Lindsay RS, et al. (2012) Risk of Cardiovascular Disease and Total Mortality in Adults with Type 1 Diabetes: Scottish Registry Linkage Study. PLoS Med 9(10): e1001321. doi:10.1371/journal.pmed.1001321 Academic Editor: Richard Lehman, Yale University, United States of America Received March 15, 2012; Accepted August 22, 2012; Published October 2, 2012 Copyright: ß 2012 Livingstone et al. This is an open-access article distributed under the terms of the Creative Commons Attribution License, which permits unrestricted use, distribution, and reproduction in any medium, provided the original author and source are credited. Funding: This work was supported by the Wellcome Trust through the Scottish Health Informatics Programme (SHIP) Grant (Ref WT086113), the Chief Scientist Office Scotland and NHS Research Scotland (NRS). The funders had no role in study design, data collection and analysis, decision to publish, or preparation of the manuscript. Competing Interests: The authors have declared the following competing interests: Sarah H. Wild has received two honoraria from Novo Nordisk, paid to her research funds in December 2010 and March 2011, for speaking at an advisory board and symposium on the topic of diabetes and cancer. Norman R. Peden has received travel grants from Pfizer Inc., Novo Nordisk, and Eli Lilly, and he holds shares in GlaxoSmithKline. John R. Petrie is the recipient of lecture honoraria, travel support and consultancy fees from pharmaceutical companies manufacturing thiazolodinediones (Takeda & GlaxoSmithKline), as well as from companies manufacturing other diabetes products (Novo Nordisk, Sanofi-Aventis). Recipient of support in kind from Merck-Serono for a charity-funded investigator-led study (REMOVAL NCT01483560). Helen M. Colhoun has served on clinical trial advisory panels for Sanofi-Aventis, Pfizer Inc., Novartis Pharmaceuticals, and Eli Lilly. She has also received research support from Roche Pharmaceuticals, Pfizer Inc., Eli Lilly, Boehringer Ingelheim, and Astra Zeneca as part of an EU Innovative Medicines Initiative research grant. None of these activities directly relate to this manuscript. Shona J. Livingstone, Helen C. Looker, Eleanor J. Hothersall, Robert S. Lindsay, John Chalmers, Stephen Cleland, Graham P. Leese, John McKnight, Andrew D. Morris, Donald W. M. Pearson, Sam Philip, Naveed Sattar, and Frank Sullivan have no conflicts of interest to declare. Abbreviations: BMI, body mass index; BP, blood pressure; CHD, coronary heart disease; CVD, cardiovascular disease; eGFR, estimated glomerular filtration rate; IRR, incidence rate ratio; SMR, standardised mortality ratio; T1DM, type 1 diabetes * E-mail: [email protected] PLOS Medicine | www.plosmedicine.org 1 October 2012 | Volume 9 | Issue 10 | e1001321

Welcome message from author
This document is posted to help you gain knowledge. Please leave a comment to let me know what you think about it! Share it to your friends and learn new things together.
Transcript
Risk of Cardiovascular Disease and Total Mortality inAdults with Type 1 Diabetes: Scottish Registry LinkageStudyShona J. Livingstone1, Helen C. Looker1, Eleanor J. Hothersall1, Sarah H. Wild2, Robert S. Lindsay3,
John Chalmers4, Stephen Cleland5, Graham P. Leese1, John McKnight2,6, Andrew D. Morris1,
Donald W. M. Pearson7, Norman R. Peden8, John R. Petrie3, Sam Philip7, Naveed Sattar3, Frank Sullivan1,
Helen M. Colhoun1,4*
1 University of Dundee, Dundee, United Kingdom, 2 University of Edinburgh, Edinburgh, United Kingdom, 3 University of Glasgow, Glasgow, United Kingdom, 4 National
Health Service (NHS) Fife, Kirkcaldy, United Kingdom, 5 NHS Greater Glasgow, Glasgow, United Kingdom, 6 NHS Lothian, Edinburgh, United Kingdom, 7 University of
Aberdeen, Aberdeen, United Kingdom, 8 NHS Forth Valley, Falkirk, United Kingdom
Abstract
Background: Randomized controlled trials have shown the importance of tight glucose control in type 1 diabetes (T1DM),but few recent studies have evaluated the risk of cardiovascular disease (CVD) and all-cause mortality among adults withT1DM. We evaluated these risks in adults with T1DM compared with the non-diabetic population in a nationwide studyfrom Scotland and examined control of CVD risk factors in those with T1DM.
Methods and Findings: The Scottish Care Information-Diabetes Collaboration database was used to identify all peopleregistered with T1DM and aged $20 years in 2005–2007 and to provide risk factor data. Major CVD events and deaths wereobtained from the national hospital admissions database and death register. The age-adjusted incidence rate ratio (IRR) forCVD and mortality in T1DM (n = 21,789) versus the non-diabetic population (3.96 million) was estimated using Poissonregression. The age-adjusted IRR for first CVD event associated with T1DM versus the non-diabetic population was higher inwomen (3.0: 95% CI 2.4–3.8, p,0.001) than men (2.3: 2.0–2.7, p,0.001) while the IRR for all-cause mortality associated withT1DM was comparable at 2.6 (2.2–3.0, p,0.001) in men and 2.7 (2.2–3.4, p,0.001) in women. Between 2005–2007, amongindividuals with T1DM, 34 of 123 deaths among 10,173 who were ,40 years and 37 of 907 deaths among 12,739 who were$40 years had an underlying cause of death of coma or diabetic ketoacidosis. Among individuals 60–69 years, approximatelythree extra deaths per 100 per year occurred among men with T1DM (28.51/1,000 person years at risk), and two per 100 peryear for women (17.99/1,000 person years at risk). 28% of those with T1DM were current smokers, 13% achieved target HbA1c
of ,7% and 37% had very poor ($9%) glycaemic control. Among those aged $40, 37% had blood pressures above evenconservative targets ($140/90 mmHg) and 39% of those $40 years were not on a statin. Although many of these risk factorswere comparable to those previously reported in other developed countries, CVD and mortality rates may not be generalizableto other countries. Limitations included lack of information on the specific insulin therapy used.
Conclusions: Although the relative risks for CVD and total mortality associated with T1DM in this population have declinedrelative to earlier studies, T1DM continues to be associated with higher CVD and death rates than the non-diabeticpopulation. Risk factor management should be improved to further reduce risk but better treatment approaches forachieving good glycaemic control are badly needed.
Please see later in the article for the Editors’ Summary.
Citation: Livingstone SJ, Looker HC, Hothersall EJ, Wild SH, Lindsay RS, et al. (2012) Risk of Cardiovascular Disease and Total Mortality in Adults with Type 1Diabetes: Scottish Registry Linkage Study. PLoS Med 9(10): e1001321. doi:10.1371/journal.pmed.1001321
Academic Editor: Richard Lehman, Yale University, United States of America
Received March 15, 2012; Accepted August 22, 2012; Published October 2, 2012
Copyright: � 2012 Livingstone et al. This is an open-access article distributed under the terms of the Creative Commons Attribution License, which permitsunrestricted use, distribution, and reproduction in any medium, provided the original author and source are credited.
Funding: This work was supported by the Wellcome Trust through the Scottish Health Informatics Programme (SHIP) Grant (Ref WT086113), the Chief Scientist OfficeScotland and NHS Research Scotland (NRS). The funders had no role in study design, data collection and analysis, decision to publish, or preparation of the manuscript.
Competing Interests: The authors have declared the following competing interests: Sarah H. Wild has received two honoraria from Novo Nordisk, paid to herresearch funds in December 2010 and March 2011, for speaking at an advisory board and symposium on the topic of diabetes and cancer. Norman R. Peden has receivedtravel grants from Pfizer Inc., Novo Nordisk, and Eli Lilly, and he holds shares in GlaxoSmithKline. John R. Petrie is the recipient of lecture honoraria, travel support andconsultancy fees from pharmaceutical companies manufacturing thiazolodinediones (Takeda & GlaxoSmithKline), as well as from companies manufacturing otherdiabetes products (Novo Nordisk, Sanofi-Aventis). Recipient of support in kind from Merck-Serono for a charity-funded investigator-led study (REMOVAL NCT01483560).Helen M. Colhoun has served on clinical trial advisory panels for Sanofi-Aventis, Pfizer Inc., Novartis Pharmaceuticals, and Eli Lilly. She has also received research supportfrom Roche Pharmaceuticals, Pfizer Inc., Eli Lilly, Boehringer Ingelheim, and Astra Zeneca as part of an EU Innovative Medicines Initiative research grant. None of theseactivities directly relate to this manuscript. Shona J. Livingstone, Helen C. Looker, Eleanor J. Hothersall, Robert S. Lindsay, John Chalmers, Stephen Cleland, Graham P.Leese, John McKnight, Andrew D. Morris, Donald W. M. Pearson, Sam Philip, Naveed Sattar, and Frank Sullivan have no conflicts of interest to declare.
Abbreviations: BMI, body mass index; BP, blood pressure; CHD, coronary heart disease; CVD, cardiovascular disease; eGFR, estimated glomerular filtration rate;IRR, incidence rate ratio; SMR, standardised mortality ratio; T1DM, type 1 diabetes
* E-mail: [email protected]
PLOS Medicine | www.plosmedicine.org 1 October 2012 | Volume 9 | Issue 10 | e1001321
Introduction
Type 1 diabetes (T1DM) is associated with an elevation in the
risk of cardiovascular disease (CVD) and all-cause mortality [1].
Almost two decades ago the landmark Diabetes Care and
Complications Trial (DCCT) demonstrated the preventability of
many diabetic complications with tight glycaemic control [2] and
longer term follow-up of the participants showed a reduction in
CVD [3]. Since then guidelines have emphasised tighter glycaemic
control as well as smoking cessation and blood pressure control.
Above 40 y of age, statins are recommended for most patients
[4,5].
Whether these guidelines for management are now having an
impact on the relative risks of CVD and mortality in those with
T1DM is unclear, as contemporary nationwide data on risks
relative to the non-diabetic population are sparse. Whilst several
studies report CVD incidence among those with T1DM, there are
few studies that have directly compared CVD incidence in T1DM
with the general population [6] and most studies of mortality rates
present long-term follow-up reflecting historical risks across the
period of follow-up [7–9]. To obtain a comprehensive picture of
the current relative CVD and mortality rates associated with
T1DM we used a nationwide diabetes register from Scotland UK
and data from the total non-diabetic population. To examine the
scope for future reduction in relative risks we also examined
achievement of current risk factor target levels.
Methods
Ethics StatementApproval was obtained from the Scotland A Research Ethics
Committee, Privacy (Caldicott) Guardians for the 14 Scottish
Health Boards, and the Information Services Division (ISD) of
National Health Service (NHS) Scotland Privacy Advisory
Committee.
Data SourcesIn Scotland, primary and secondary health care is free in the
NHS. Since 2000, a single nationwide clinical information system;
the Scottish Care Information-Diabetes Collaboration (SCI-DC)
database has captured registration of patients with T1DM.The
registration occurs automatically when a patient is assigned a Read
Code [10] for diabetes in a primary or secondary care health care
information system. Since all but five of 1,076 general practices
nationwide contribute data, it is estimated to capture over 99% of
all patients nationally assigned a diagnostic Read Code for
diabetes. From SCI-DC we extracted information on all people
with T1DM aged $20 y who were alive anytime from 1st January
2005 to 31st May 2008. Thus, prevalent cases as of January 2005
(n = 19,161) and any incident cases of T1DM (n = 2,628) were
included in the analysis. For the population of T1DM alive as of
31st May 2008 (the latest data available for research) we also
extracted current risk factor (non-fasting lipids, blood pressure,
current smoking, body mass index [BMI]) and prescribed
medication (rather than encashed prescriptions) history. These
data are uploaded into SCI-DC from all clinical encounters
experienced by patients once registered. Risk factor data were not
directly available for the general population but we provide
comparisons with national surveys [11]. We defined T1DM on the
basis of the type of diabetes assigned by the clinician but with the
additional requirement that the prescription history not contradict
this (i.e., no evidence of lengthy period of diabetes before insulin
and no co-prescribing of non-metformin oral diabetes drugs).
We identified all major hospitalised CVD events for T1DM
patients in 2005–2007 by linkage to the national hospital admissions
data (the Scottish Morbidity Record SMR-01) held by the
Information Services Division (ISD) of the NHS and death data
provided by the National Records of Scotland (NRS). The SMR-01
captures all national public sector hospital admissions from 1981
onwards [12]. ISD also provided the counts of events and population
denominators for the non-diabetic general population of Scotland
aged $20 y for 2005–2007. CVD events were defined as hospital
admissions or death with main/underlying cause with an ICD code
for ischaemic/coronary heart disease (CHD) (ICD-9: 410–414, or
ICD-10: I20–I25) or for cerebrovascular disease including transient
cerebral ischaemic attacks and related syndromes (ICD-9: 430–438
or ICD-10: I60–I69 and G45). These ICD codes were chosen as they
are used in the official national statistics for CVD. Since under ICD
rules diabetes can be given as the underlying cause of death in certain
situations even when an acute coronary event is present [13], we
conducted a sensitivity analysis defining CVD deaths as those with
the above CVD codes anywhere in the death certificate for those with
diabetes as the underlying cause of death.
Statistical MethodsData for the total population were available in the form of
counts of persons with an event in each calendar year, with the
corresponding mid-year population estimates as an approximation
of the person years, broken down by sex and age bands. To obtain
counts of persons with events and denominators for the non-
diabetic population we subtracted from the mid-year total
population all those with any type of diabetes at any point in
that year and we subtracted from the counts of persons with events
for the total population all those with diabetes who had an event at
any point in that year. This simplified approach means that a few
months of person time pre-diabetes is also excluded for those with
a diagnosis in the second half of the year. In practice the effect of
this is negligible especially when one considers the arbitrariness of
dates of diagnosis of type 2 diabetes. We chose to exclude all types
of diabetes from the comparator group as it is the risk compared to
a non-diabetic population that is of most clinical interest, to
facilitate comparison with other studies and to ensure that changes
in future estimates of IRRs are not confounded by changes in the
prevalence or severity of type 2 diabetes. Inclusion of type 2
diabetes in the comparator group would be expected to reduce the
IRRs. Individual level data on those with T1DM were grouped
similarly to give counts of persons with events in each calendar
year and the total person years observed within each calendar
year. Incidence rate ratios (IRR) were estimated from a Poisson
model with robust standard errors to allow for overdispersion. The
IRRs associated with T1DM for a given attained age/sex group
therefore represent the average effect of T1DM in that group
across the 3 y of the study compared to those without any type of
diabetes. IRR calculations were restricted to end December 2007
since partial year data for 2008 were not available for the non-
diabetic population. All models adjust for a linear trend in
calendar year, and age using 5-y age bands. We found significant
interactions between sex and diabetes on the outcomes considered
so we then analysed and have presented the data separately for
men and women.
Results
Population StudiedDuring the period of study, between 2005 and 2007 inclusive,
26,026 people registered with T1DM were observed of whom
Current Risks of CVD and Death in Type 1 Diabetes
PLOS Medicine | www.plosmedicine.org 2 October 2012 | Volume 9 | Issue 10 | e1001321
21,789 were $20 y old. The median duration of diabetes
(interquartile range) was 17.5 y (9.3–27.0) in prevalent cases of
T1DM at baseline. 20,668 of those had no CVD admission in the
10 y prior to start of follow-up. These people contributed 59,785
person years of observation for total mortality, 56,400 for first
CVD event, and 57,060 for first CHD event. The non-diabetic
population without a prior CVD event in the previous 10 y
comprised 3.6 million people aged $20 and contributing 10.86
million person years of observation.
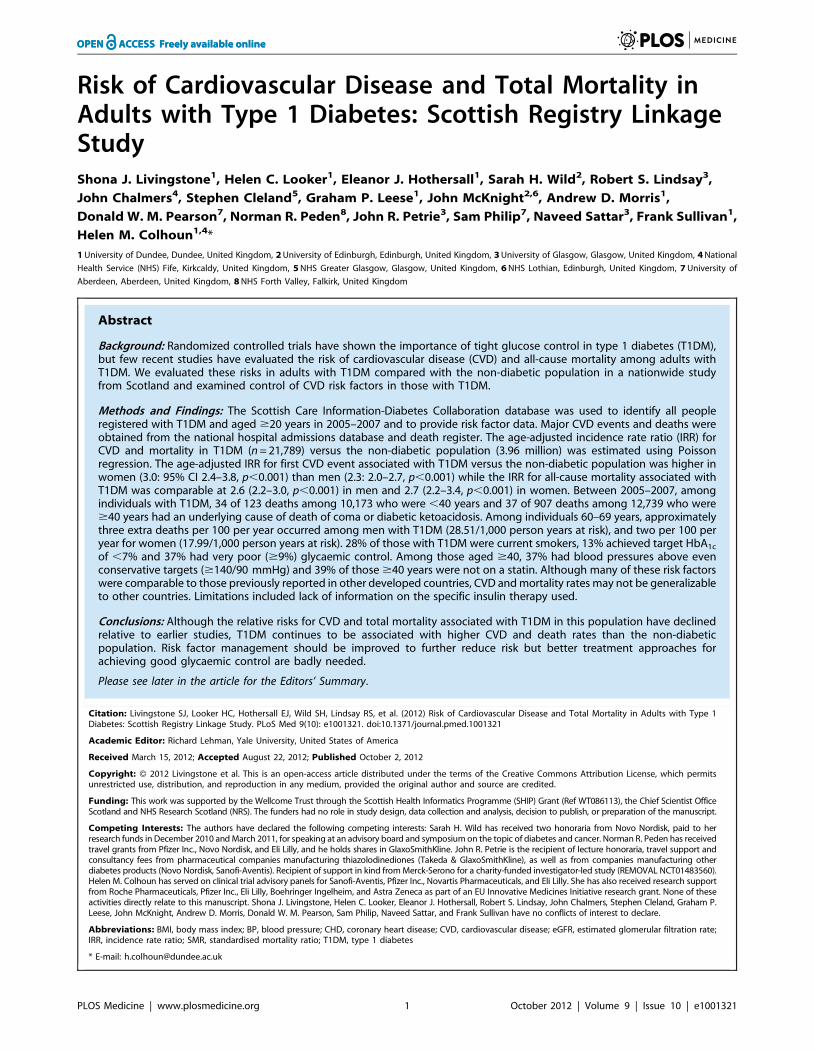
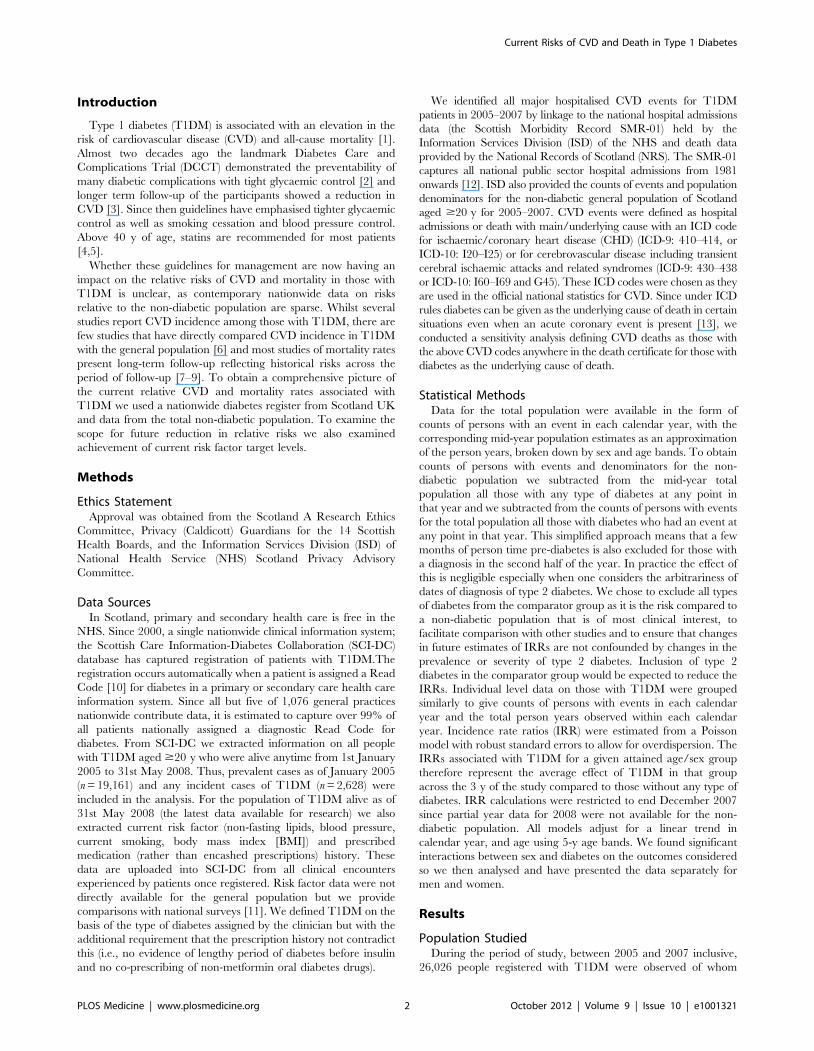
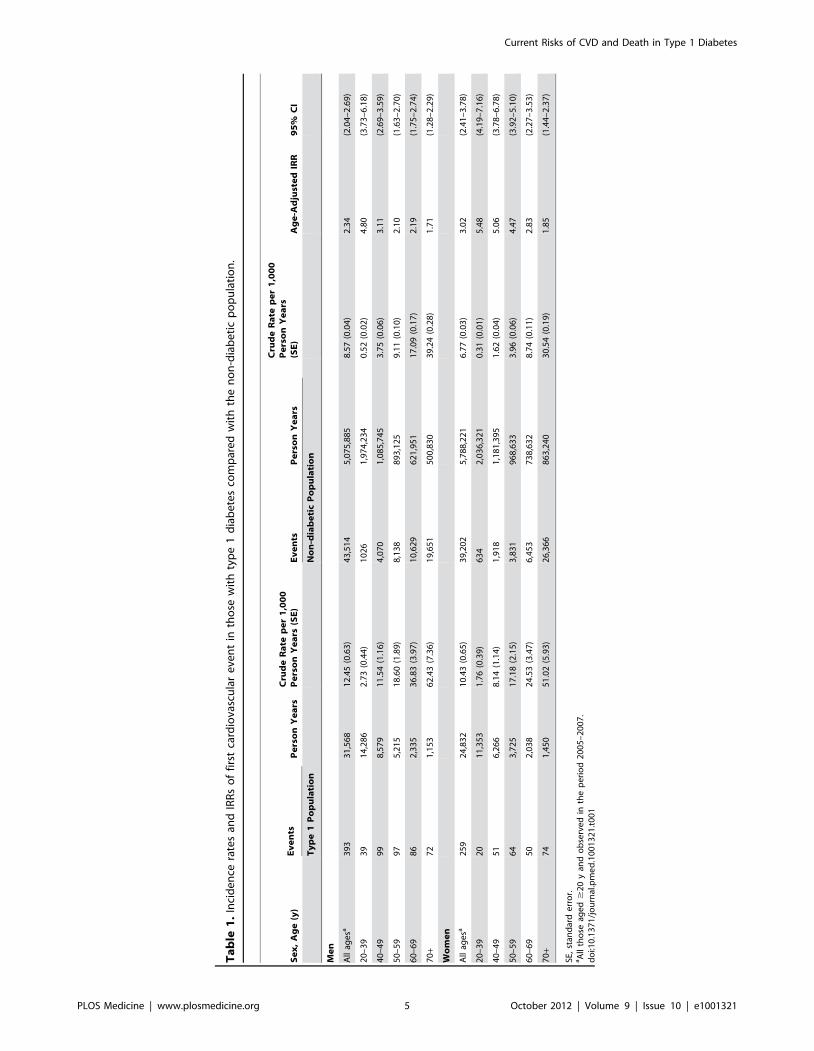
CVD and Coronary EventsTable 1 shows the crude IRRs and the relative risks by age band
for first major CVD events in those with T1DM compared to the
non-diabetic population. Age-standardised rates are shown in
Figure 1 with the lines shown being interpolations. Risk ratios were
substantial, greater in women than men (p = 0.012 for the diabetes
x sex interaction), and were highest in the younger age bands.
Overall men with T1DM had an age-adjusted IRR of 2.3 (95% CI
2.0–2.7) and women with T1DM had an IRR of 3.0 (2.4–3.8)
compared with the non-diabetic population. When CVD codes
anywhere on the death record were considered as CVD deaths for
those where diabetes was given as the underlying cause of death,
then the IRR for first CVD event associated with T1DM was 2.5
(2.2–2.9) in men and 3.2 (2.6–3.9) in women. For first coronary
events examined separately as with CVD, the IRR was higher in
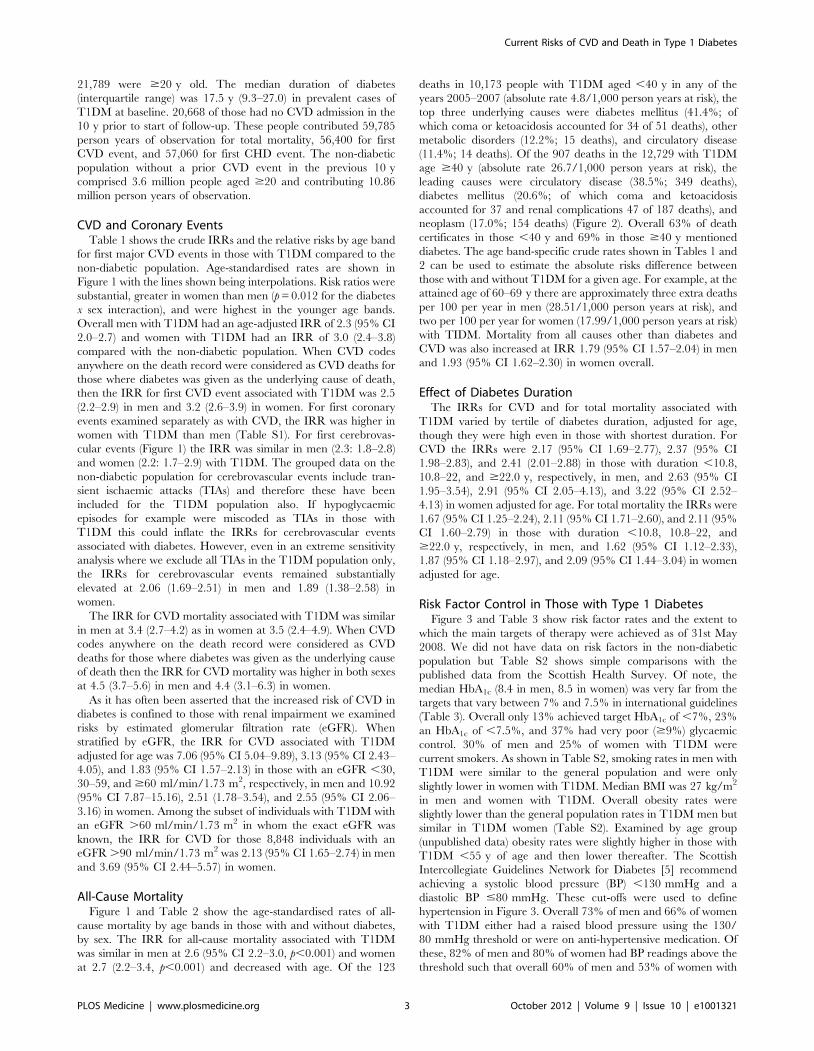
women with T1DM than men (Table S1). For first cerebrovas-
cular events (Figure 1) the IRR was similar in men (2.3: 1.8–2.8)
and women (2.2: 1.7–2.9) with T1DM. The grouped data on the
non-diabetic population for cerebrovascular events include tran-
sient ischaemic attacks (TIAs) and therefore these have been
included for the T1DM population also. If hypoglycaemic
episodes for example were miscoded as TIAs in those with
T1DM this could inflate the IRRs for cerebrovascular events
associated with diabetes. However, even in an extreme sensitivity
analysis where we exclude all TIAs in the T1DM population only,
the IRRs for cerebrovascular events remained substantially
elevated at 2.06 (1.69–2.51) in men and 1.89 (1.38–2.58) in
women.
The IRR for CVD mortality associated with T1DM was similar
in men at 3.4 (2.7–4.2) as in women at 3.5 (2.4–4.9). When CVD
codes anywhere on the death record were considered as CVD
deaths for those where diabetes was given as the underlying cause
of death then the IRR for CVD mortality was higher in both sexes
at 4.5 (3.7–5.6) in men and 4.4 (3.1–6.3) in women.
As it has often been asserted that the increased risk of CVD in
diabetes is confined to those with renal impairment we examined
risks by estimated glomerular filtration rate (eGFR). When
stratified by eGFR, the IRR for CVD associated with T1DM
adjusted for age was 7.06 (95% CI 5.04–9.89), 3.13 (95% CI 2.43–
4.05), and 1.83 (95% CI 1.57–2.13) in those with an eGFR ,30,
30–59, and $60 ml/min/1.73 m2, respectively, in men and 10.92
(95% CI 7.87–15.16), 2.51 (1.78–3.54), and 2.55 (95% CI 2.06–
3.16) in women. Among the subset of individuals with T1DM with
an eGFR .60 ml/min/1.73 m2 in whom the exact eGFR was
known, the IRR for CVD for those 8,848 individuals with an
eGFR .90 ml/min/1.73 m2 was 2.13 (95% CI 1.65–2.74) in men
and 3.69 (95% CI 2.44–5.57) in women.
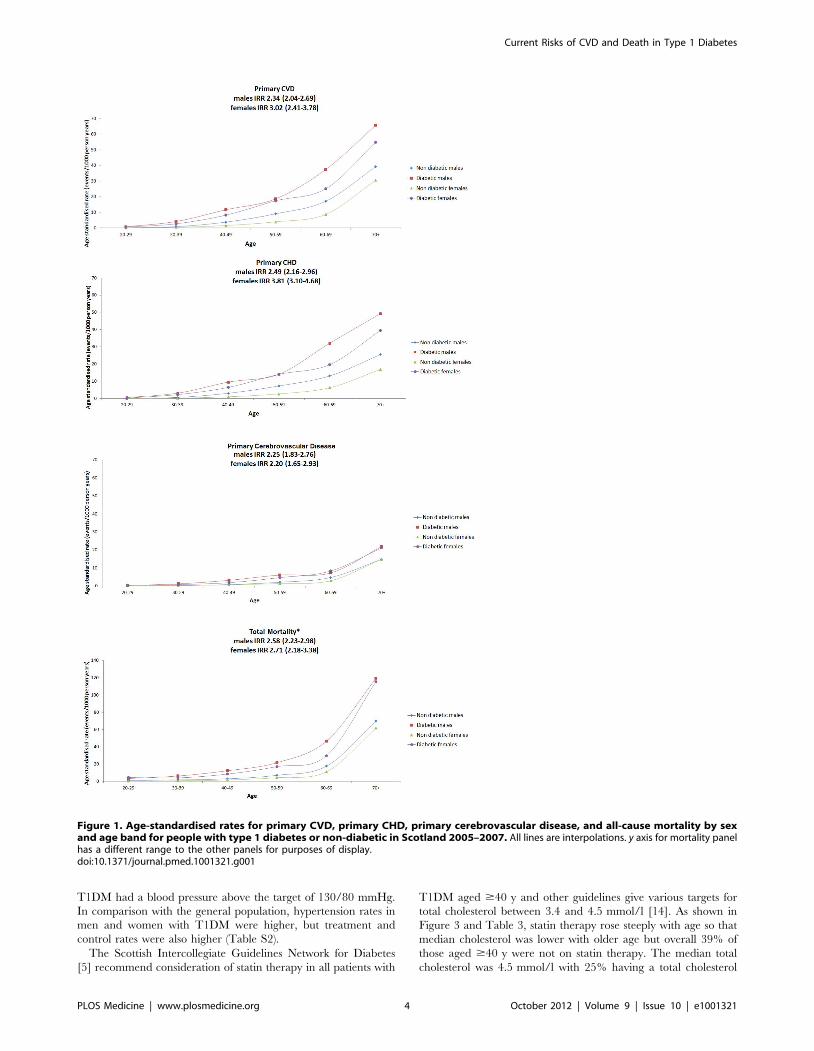
All-Cause MortalityFigure 1 and Table 2 show the age-standardised rates of all-
cause mortality by age bands in those with and without diabetes,
by sex. The IRR for all-cause mortality associated with T1DM
was similar in men at 2.6 (95% CI 2.2–3.0, p,0.001) and women
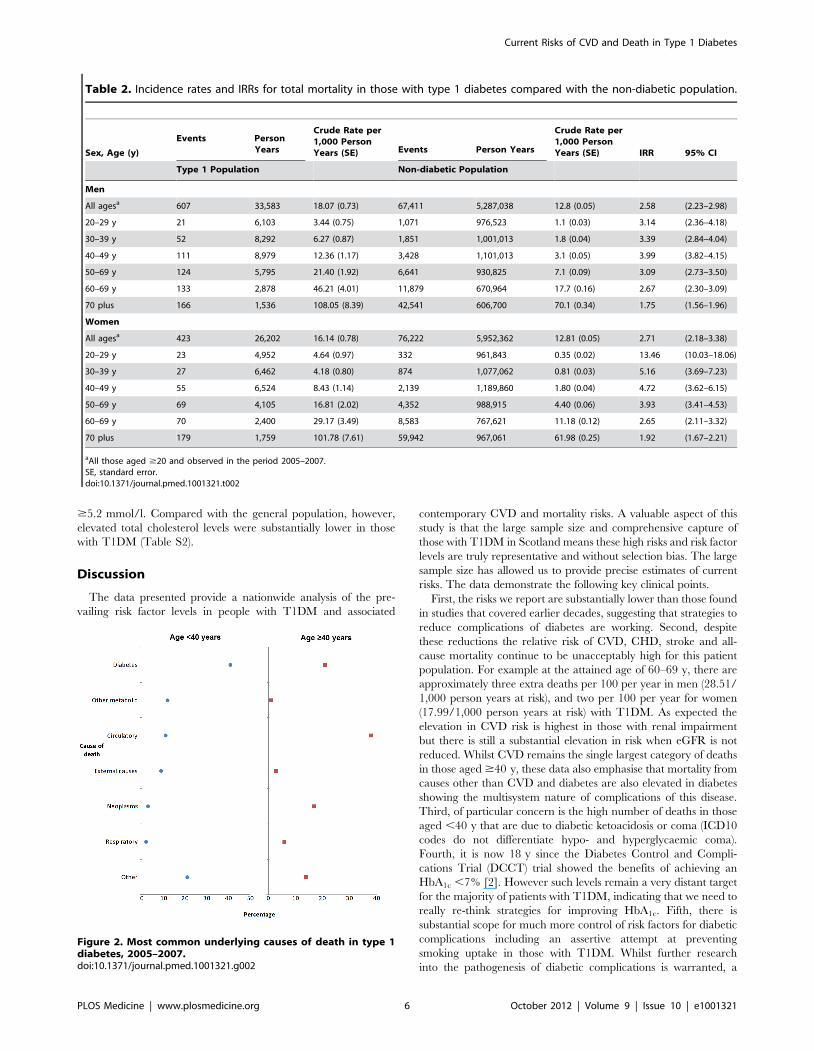
at 2.7 (2.2–3.4, p,0.001) and decreased with age. Of the 123
deaths in 10,173 people with T1DM aged ,40 y in any of the
years 2005–2007 (absolute rate 4.8/1,000 person years at risk), the
top three underlying causes were diabetes mellitus (41.4%; of
which coma or ketoacidosis accounted for 34 of 51 deaths), other
metabolic disorders (12.2%; 15 deaths), and circulatory disease
(11.4%; 14 deaths). Of the 907 deaths in the 12,729 with T1DM
age $40 y (absolute rate 26.7/1,000 person years at risk), the
leading causes were circulatory disease (38.5%; 349 deaths),
diabetes mellitus (20.6%; of which coma and ketoacidosis
accounted for 37 and renal complications 47 of 187 deaths), and
neoplasm (17.0%; 154 deaths) (Figure 2). Overall 63% of death
certificates in those ,40 y and 69% in those $40 y mentioned
diabetes. The age band-specific crude rates shown in Tables 1 and
2 can be used to estimate the absolute risks difference between
those with and without T1DM for a given age. For example, at the
attained age of 60–69 y there are approximately three extra deaths
per 100 per year in men (28.51/1,000 person years at risk), and
two per 100 per year for women (17.99/1,000 person years at risk)
with TIDM. Mortality from all causes other than diabetes and
CVD was also increased at IRR 1.79 (95% CI 1.57–2.04) in men
and 1.93 (95% CI 1.62–2.30) in women overall.
Effect of Diabetes DurationThe IRRs for CVD and for total mortality associated with
T1DM varied by tertile of diabetes duration, adjusted for age,
though they were high even in those with shortest duration. For
CVD the IRRs were 2.17 (95% CI 1.69–2.77), 2.37 (95% CI
1.98–2.83), and 2.41 (2.01–2.88) in those with duration ,10.8,
10.8–22, and $22.0 y, respectively, in men, and 2.63 (95% CI
1.95–3.54), 2.91 (95% CI 2.05–4.13), and 3.22 (95% CI 2.52–
4.13) in women adjusted for age. For total mortality the IRRs were
1.67 (95% CI 1.25–2.24), 2.11 (95% CI 1.71–2.60), and 2.11 (95%
CI 1.60–2.79) in those with duration ,10.8, 10.8–22, and
$22.0 y, respectively, in men, and 1.62 (95% CI 1.12–2.33),
1.87 (95% CI 1.18–2.97), and 2.09 (95% CI 1.44–3.04) in women
adjusted for age.
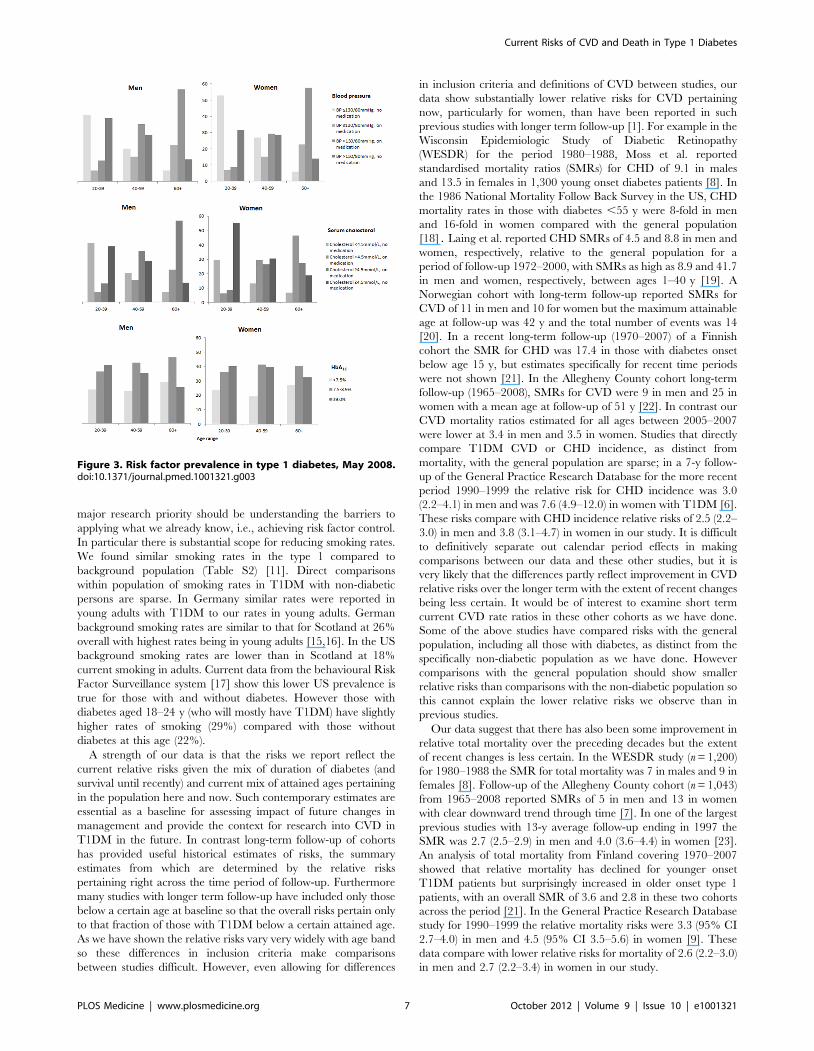
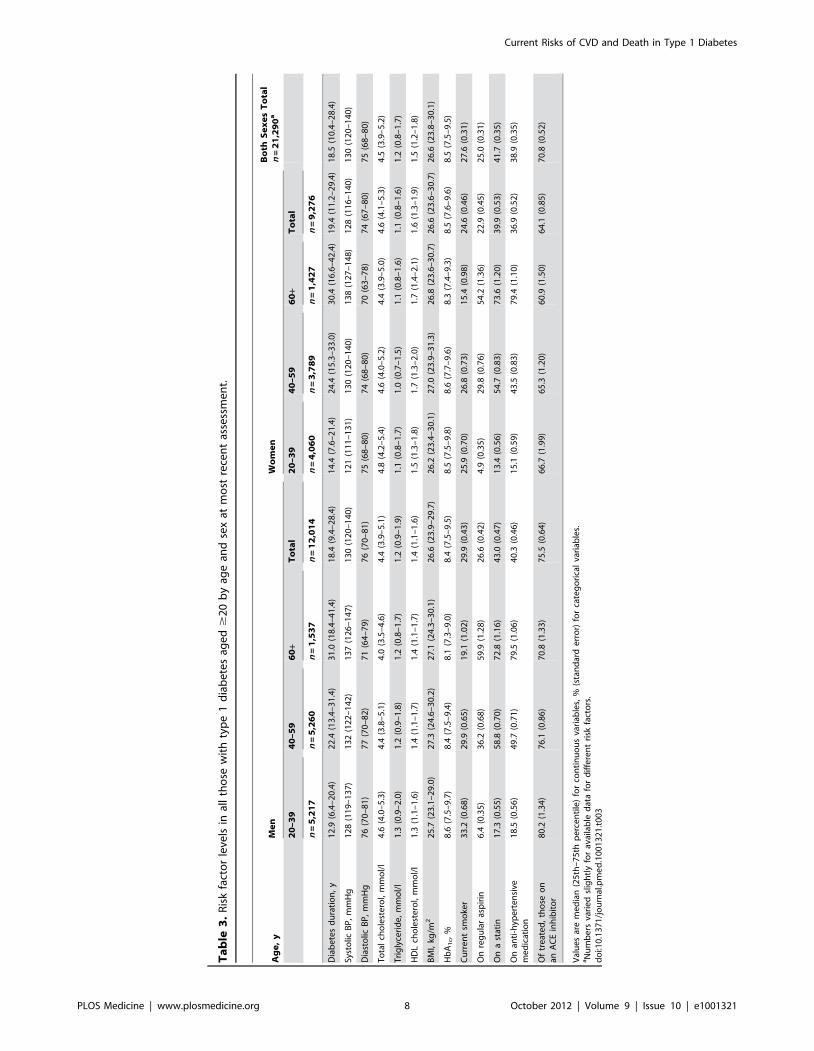
Risk Factor Control in Those with Type 1 DiabetesFigure 3 and Table 3 show risk factor rates and the extent to
which the main targets of therapy were achieved as of 31st May
2008. We did not have data on risk factors in the non-diabetic
population but Table S2 shows simple comparisons with the
published data from the Scottish Health Survey. Of note, the
median HbA1c (8.4 in men, 8.5 in women) was very far from the
targets that vary between 7% and 7.5% in international guidelines
(Table 3). Overall only 13% achieved target HbA1c of ,7%, 23%
an HbA1c of ,7.5%, and 37% had very poor ($9%) glycaemic
control. 30% of men and 25% of women with T1DM were
current smokers. As shown in Table S2, smoking rates in men with
T1DM were similar to the general population and were only
slightly lower in women with T1DM. Median BMI was 27 kg/m2
in men and women with T1DM. Overall obesity rates were
slightly lower than the general population rates in T1DM men but
similar in T1DM women (Table S2). Examined by age group
(unpublished data) obesity rates were slightly higher in those with
T1DM ,55 y of age and then lower thereafter. The Scottish
Intercollegiate Guidelines Network for Diabetes [5] recommend
achieving a systolic blood pressure (BP) ,130 mmHg and a
diastolic BP #80 mmHg. These cut-offs were used to define
hypertension in Figure 3. Overall 73% of men and 66% of women
with T1DM either had a raised blood pressure using the 130/
80 mmHg threshold or were on anti-hypertensive medication. Of
these, 82% of men and 80% of women had BP readings above the
threshold such that overall 60% of men and 53% of women with
Current Risks of CVD and Death in Type 1 Diabetes
PLOS Medicine | www.plosmedicine.org 3 October 2012 | Volume 9 | Issue 10 | e1001321
T1DM had a blood pressure above the target of 130/80 mmHg.
In comparison with the general population, hypertension rates in
men and women with T1DM were higher, but treatment and
control rates were also higher (Table S2).
The Scottish Intercollegiate Guidelines Network for Diabetes
[5] recommend consideration of statin therapy in all patients with
T1DM aged $40 y and other guidelines give various targets for
total cholesterol between 3.4 and 4.5 mmol/l [14]. As shown in
Figure 3 and Table 3, statin therapy rose steeply with age so that
median cholesterol was lower with older age but overall 39% of
those aged $40 y were not on statin therapy. The median total
cholesterol was 4.5 mmol/l with 25% having a total cholesterol
Figure 1. Age-standardised rates for primary CVD, primary CHD, primary cerebrovascular disease, and all-cause mortality by sexand age band for people with type 1 diabetes or non-diabetic in Scotland 2005–2007. All lines are interpolations. y axis for mortality panelhas a different range to the other panels for purposes of display.doi:10.1371/journal.pmed.1001321.g001
Current Risks of CVD and Death in Type 1 Diabetes
PLOS Medicine | www.plosmedicine.org 4 October 2012 | Volume 9 | Issue 10 | e1001321
Ta
ble
1.
Inci
de
nce
rate
san
dIR
Rs
of
firs
tca
rdio
vasc
ula
re
ven
tin
tho
sew
ith
typ
e1
dia
be
tes
com
par
ed
wit
hth
en
on
-dia
be
tic
po
pu
lati
on
.
Se
x,
Ag
e(y
)E
ve
nts
Pe
rso
nY
ea
rsC
rud
eR
ate
pe
r1
,00
0P
ers
on
Ye
ars
(SE
)E
ve
nts
Pe
rso
nY
ea
rs
Cru
de
Ra
tep
er
1,0
00
Pe
rso
nY
ea
rs(S
E)
Ag
e-A
dju
ste
dIR
R9
5%
CI
Ty
pe
1P
op
ula
tio
nN
on
-dia
be
tic
Po
pu
lati
on
Me
n
All
age
sa3
93
31
,56
81
2.4
5(0
.63
)4
3,5
14
5,0
75
,88
58
.57
(0.0
4)
2.3
4(2
.04
–2
.69
)
20
–3
93
91
4,2
86
2.7
3(0
.44
)1
02
61
,97
4,2
34
0.5
2(0
.02
)4
.80
(3.7
3–
6.1
8)
40
–4
99
98
,57
91
1.5
4(1
.16
)4
,07
01
,08
5,7
45
3.7
5(0
.06
)3
.11
(2.6
9–
3.5
9)
50
–5
99
75
,21
51
8.6
0(1
.89
)8
,13
88
93
,12
59
.11
(0.1
0)
2.1
0(1
.63
–2
.70
)
60
–6
98
62
,33
53
6.8
3(3
.97
)1
0,6
29
62
1,9
51
17
.09
(0.1
7)
2.1
9(1
.75
–2
.74
)
70
+7
21
,15
36
2.4
3(7
.36
)1
9,6
51
50
0,8
30
39
.24
(0.2
8)
1.7
1(1
.28
–2
.29
)
Wo
me
n
All
age
sa2
59
24
,83
21
0.4
3(0
.65
)3
9,2
02
5,7
88
,22
16
.77
(0.0
3)
3.0
2(2
.41
–3
.78
)
20
–3
92
01
1,3
53
1.7
6(0
.39
)6
34
2,0
36
,32
10
.31
(0.0
1)
5.4
8(4
.19
–7
.16
)
40
–4
95
16
,26
68
.14
(1.1
4)
1,9
18
1,1
81
,39
51
.62
(0.0
4)
5.0
6(3
.78
–6
.78
)
50
–5
96
43
,72
51
7.1
8(2
.15
)3
,83
19
68
,63
33
.96
(0.0
6)
4.4
7(3
.92
–5
.10
)
60
–6
95
02
,03
82
4.5
3(3
.47
)6
,45
37
38
,63
28
.74
(0.1
1)
2.8
3(2
.27
–3
.53
)
70
+7
41
,45
05
1.0
2(5
.93
)2
6,3
66
86
3,2
40
30
.54
(0.1
9)
1.8
5(1
.44
–2
.37
)
SE,
stan
dar
de
rro
r.aA
llth
ose
age
d$
20
yan
do
bse
rve
din
the
pe
rio
d2
00
5–
20
07
.d
oi:1
0.1
37
1/j
ou
rnal
.pm
ed
.10
01
32
1.t
00
1
Current Risks of CVD and Death in Type 1 Diabetes
PLOS Medicine | www.plosmedicine.org 5 October 2012 | Volume 9 | Issue 10 | e1001321
$5.2 mmol/l. Compared with the general population, however,
elevated total cholesterol levels were substantially lower in those
with T1DM (Table S2).
Discussion
The data presented provide a nationwide analysis of the pre-
vailing risk factor levels in people with T1DM and associated
contemporary CVD and mortality risks. A valuable aspect of this
study is that the large sample size and comprehensive capture of
those with T1DM in Scotland means these high risks and risk factor
levels are truly representative and without selection bias. The large
sample size has allowed us to provide precise estimates of current
risks. The data demonstrate the following key clinical points.
First, the risks we report are substantially lower than those found
in studies that covered earlier decades, suggesting that strategies to
reduce complications of diabetes are working. Second, despite
these reductions the relative risk of CVD, CHD, stroke and all-
cause mortality continue to be unacceptably high for this patient
population. For example at the attained age of 60–69 y, there are
approximately three extra deaths per 100 per year in men (28.51/
1,000 person years at risk), and two per 100 per year for women
(17.99/1,000 person years at risk) with T1DM. As expected the
elevation in CVD risk is highest in those with renal impairment
but there is still a substantial elevation in risk when eGFR is not
reduced. Whilst CVD remains the single largest category of deaths
in those aged $40 y, these data also emphasise that mortality from
causes other than CVD and diabetes are also elevated in diabetes
showing the multisystem nature of complications of this disease.
Third, of particular concern is the high number of deaths in those
aged ,40 y that are due to diabetic ketoacidosis or coma (ICD10
codes do not differentiate hypo- and hyperglycaemic coma).
Fourth, it is now 18 y since the Diabetes Control and Compli-
cations Trial (DCCT) trial showed the benefits of achieving an
HbA1c ,7% [2]. However such levels remain a very distant target
for the majority of patients with T1DM, indicating that we need to
really re-think strategies for improving HbA1c. Fifth, there is
substantial scope for much more control of risk factors for diabetic
complications including an assertive attempt at preventing
smoking uptake in those with T1DM. Whilst further research
into the pathogenesis of diabetic complications is warranted, a
Table 2. Incidence rates and IRRs for total mortality in those with type 1 diabetes compared with the non-diabetic population.
Sex, Age (y)
Events PersonYears
Crude Rate per1,000 PersonYears (SE) Events Person Years
Crude Rate per1,000 PersonYears (SE) IRR 95% CI
Type 1 Population Non-diabetic Population
Men
All agesa 607 33,583 18.07 (0.73) 67,411 5,287,038 12.8 (0.05) 2.58 (2.23–2.98)
20–29 y 21 6,103 3.44 (0.75) 1,071 976,523 1.1 (0.03) 3.14 (2.36–4.18)
30–39 y 52 8,292 6.27 (0.87) 1,851 1,001,013 1.8 (0.04) 3.39 (2.84–4.04)
40–49 y 111 8,979 12.36 (1.17) 3,428 1,101,013 3.1 (0.05) 3.99 (3.82–4.15)
50–69 y 124 5,795 21.40 (1.92) 6,641 930,825 7.1 (0.09) 3.09 (2.73–3.50)
60–69 y 133 2,878 46.21 (4.01) 11,879 670,964 17.7 (0.16) 2.67 (2.30–3.09)
70 plus 166 1,536 108.05 (8.39) 42,541 606,700 70.1 (0.34) 1.75 (1.56–1.96)
Women
All agesa 423 26,202 16.14 (0.78) 76,222 5,952,362 12.81 (0.05) 2.71 (2.18–3.38)
20–29 y 23 4,952 4.64 (0.97) 332 961,843 0.35 (0.02) 13.46 (10.03–18.06)
30–39 y 27 6,462 4.18 (0.80) 874 1,077,062 0.81 (0.03) 5.16 (3.69–7.23)
40–49 y 55 6,524 8.43 (1.14) 2,139 1,189,860 1.80 (0.04) 4.72 (3.62–6.15)
50–69 y 69 4,105 16.81 (2.02) 4,352 988,915 4.40 (0.06) 3.93 (3.41–4.53)
60–69 y 70 2,400 29.17 (3.49) 8,583 767,621 11.18 (0.12) 2.65 (2.11–3.32)
70 plus 179 1,759 101.78 (7.61) 59,942 967,061 61.98 (0.25) 1.92 (1.67–2.21)
aAll those aged $20 and observed in the period 2005–2007.SE, standard error.doi:10.1371/journal.pmed.1001321.t002
Figure 2. Most common underlying causes of death in type 1diabetes, 2005–2007.doi:10.1371/journal.pmed.1001321.g002
Current Risks of CVD and Death in Type 1 Diabetes
PLOS Medicine | www.plosmedicine.org 6 October 2012 | Volume 9 | Issue 10 | e1001321
major research priority should be understanding the barriers to
applying what we already know, i.e., achieving risk factor control.
In particular there is substantial scope for reducing smoking rates.
We found similar smoking rates in the type 1 compared to
background population (Table S2) [11]. Direct comparisons
within population of smoking rates in T1DM with non-diabetic
persons are sparse. In Germany similar rates were reported in
young adults with T1DM to our rates in young adults. German
background smoking rates are similar to that for Scotland at 26%
overall with highest rates being in young adults [15,16]. In the US
background smoking rates are lower than in Scotland at 18%
current smoking in adults. Current data from the behavioural Risk
Factor Surveillance system [17] show this lower US prevalence is
true for those with and without diabetes. However those with
diabetes aged 18–24 y (who will mostly have T1DM) have slightly
higher rates of smoking (29%) compared with those without
diabetes at this age (22%).
A strength of our data is that the risks we report reflect the
current relative risks given the mix of duration of diabetes (and
survival until recently) and current mix of attained ages pertaining
in the population here and now. Such contemporary estimates are
essential as a baseline for assessing impact of future changes in
management and provide the context for research into CVD in
T1DM in the future. In contrast long-term follow-up of cohorts
has provided useful historical estimates of risks, the summary
estimates from which are determined by the relative risks
pertaining right across the time period of follow-up. Furthermore
many studies with longer term follow-up have included only those
below a certain age at baseline so that the overall risks pertain only
to that fraction of those with T1DM below a certain attained age.
As we have shown the relative risks vary very widely with age band
so these differences in inclusion criteria make comparisons
between studies difficult. However, even allowing for differences
in inclusion criteria and definitions of CVD between studies, our
data show substantially lower relative risks for CVD pertaining
now, particularly for women, than have been reported in such
previous studies with longer term follow-up [1]. For example in the
Wisconsin Epidemiologic Study of Diabetic Retinopathy
(WESDR) for the period 1980–1988, Moss et al. reported
standardised mortality ratios (SMRs) for CHD of 9.1 in males
and 13.5 in females in 1,300 young onset diabetes patients [8]. In
the 1986 National Mortality Follow Back Survey in the US, CHD
mortality rates in those with diabetes ,55 y were 8-fold in men
and 16-fold in women compared with the general population
[18]. Laing et al. reported CHD SMRs of 4.5 and 8.8 in men and
women, respectively, relative to the general population for a
period of follow-up 1972–2000, with SMRs as high as 8.9 and 41.7
in men and women, respectively, between ages 1–40 y [19]. A
Norwegian cohort with long-term follow-up reported SMRs for
CVD of 11 in men and 10 for women but the maximum attainable
age at follow-up was 42 y and the total number of events was 14
[20]. In a recent long-term follow-up (1970–2007) of a Finnish
cohort the SMR for CHD was 17.4 in those with diabetes onset
below age 15 y, but estimates specifically for recent time periods
were not shown [21]. In the Allegheny County cohort long-term
follow-up (1965–2008), SMRs for CVD were 9 in men and 25 in
women with a mean age at follow-up of 51 y [22]. In contrast our
CVD mortality ratios estimated for all ages between 2005–2007
were lower at 3.4 in men and 3.5 in women. Studies that directly
compare T1DM CVD or CHD incidence, as distinct from
mortality, with the general population are sparse; in a 7-y follow-
up of the General Practice Research Database for the more recent
period 1990–1999 the relative risk for CHD incidence was 3.0
(2.2–4.1) in men and was 7.6 (4.9–12.0) in women with T1DM [6].
These risks compare with CHD incidence relative risks of 2.5 (2.2–
3.0) in men and 3.8 (3.1–4.7) in women in our study. It is difficult
to definitively separate out calendar period effects in making
comparisons between our data and these other studies, but it is
very likely that the differences partly reflect improvement in CVD
relative risks over the longer term with the extent of recent changes
being less certain. It would be of interest to examine short term
current CVD rate ratios in these other cohorts as we have done.
Some of the above studies have compared risks with the general
population, including all those with diabetes, as distinct from the
specifically non-diabetic population as we have done. However
comparisons with the general population should show smaller
relative risks than comparisons with the non-diabetic population so
this cannot explain the lower relative risks we observe than in
previous studies.
Our data suggest that there has also been some improvement in
relative total mortality over the preceding decades but the extent
of recent changes is less certain. In the WESDR study (n = 1,200)
for 1980–1988 the SMR for total mortality was 7 in males and 9 in
females [8]. Follow-up of the Allegheny County cohort (n = 1,043)
from 1965–2008 reported SMRs of 5 in men and 13 in women
with clear downward trend through time [7]. In one of the largest
previous studies with 13-y average follow-up ending in 1997 the
SMR was 2.7 (2.5–2.9) in men and 4.0 (3.6–4.4) in women [23].
An analysis of total mortality from Finland covering 1970–2007
showed that relative mortality has declined for younger onset
T1DM patients but surprisingly increased in older onset type 1
patients, with an overall SMR of 3.6 and 2.8 in these two cohorts
across the period [21]. In the General Practice Research Database
study for 1990–1999 the relative mortality risks were 3.3 (95% CI
2.7–4.0) in men and 4.5 (95% CI 3.5–5.6) in women [9]. These
data compare with lower relative risks for mortality of 2.6 (2.2–3.0)
in men and 2.7 (2.2–3.4) in women in our study.
Figure 3. Risk factor prevalence in type 1 diabetes, May 2008.doi:10.1371/journal.pmed.1001321.g003
Current Risks of CVD and Death in Type 1 Diabetes
PLOS Medicine | www.plosmedicine.org 7 October 2012 | Volume 9 | Issue 10 | e1001321
Ta
ble
3.
Ris
kfa
cto
rle
vels
inal
lth
ose
wit
hty
pe
1d
iab
ete
sag
ed
$2
0b
yag
ean
dse
xat
mo
stre
cen
tas
sess
me
nt.
Ag
e,
yM
en
Wo
me
nB
oth
Se
xe
sT
ota
ln
=2
1,2
90
a
20
–3
94
0–
59
60
+T
ota
l2
0–
39
40
–5
96
0+
To
tal
n=
5,2
17
n=
5,2
60
n=
1,5
37
n=
12
,01
4n
=4
,06
0n
=3
,78
9n
=1
,42
7n
=9
,27
6
Dia
be
tes
du
rati
on
,y
12
.9(6
.4–
20
.4)
22
.4(1
3.4
–3
1.4
)3
1.0
(18
.4–
41
.4)
18
.4(9
.4–
28
.4)
14
.4(7
.6–
21
.4)
24
.4(1
5.3
–3
3.0
)3
0.4
(16
.6–
42
.4)
19
.4(1
1.2
–2
9.4
)1
8.5
(10
.4–
28
.4)
Syst
olic
BP
,m
mH
g1
28
(11
9–
13
7)
13
2(1
22
–1
42
)1
37
(12
6–
14
7)
13
0(1
20
–1
40
)1
21
(11
1–
13
1)
13
0(1
20
–1
40
)1
38
(12
7–
14
8)
12
8(1
16
–1
40
)1
30
(12
0–
14
0)
Dia
sto
licB
P,
mm
Hg
76
(70
–8
1)
77
(70
–8
2)
71
(64
–7
9)
76
(70
–8
1)
75
(68
–8
0)
74
(68
–8
0)
70
(63
–7
8)
74
(67
–8
0)
75
(68
–8
0)
To
tal
cho
lest
ero
l,m
mo
l/l
4.6
(4.0
–5
.3)
4.4
(3.8
–5
.1)
4.0
(3.5
–4
.6)
4.4
(3.9
–5
.1)
4.8
(4.2
–5
.4)
4.6
(4.0
–5
.2)
4.4
(3.9
–5
.0)
4.6
(4.1
–5
.3)
4.5
(3.9
–5
.2)
Tri
gly
ceri
de
,m
mo
l/l
1.3
(0.9
–2
.0)
1.2
(0.9
–1
.8)
1.2
(0.8
–1
.7)
1.2
(0.9
–1
.9)
1.1
(0.8
–1
.7)
1.0
(0.7
–1
.5)
1.1
(0.8
–1
.6)
1.1
(0.8
–1
.6)
1.2
(0.8
–1
.7)
HD
Lch
ole
ste
rol,
mm
ol/
l1
.3(1
.1–
1.6
)1
.4(1
.1–
1.7
)1
.4(1
.1–
1.7
)1
.4(1
.1–
1.6
)1
.5(1
.3–
1.8
)1
.7(1
.3–
2.0
)1
.7(1
.4–
2.1
)1
.6(1
.3–
1.9
)1
.5(1
.2–
1.8
)
BM
I,kg
/m2
25
.7(2
3.1
–2
9.0
)2
7.3
(24
.6–
30
.2)
27
.1(2
4.3
–3
0.1
)2
6.6
(23
.9–
29
.7)
26
.2(2
3.4
–3
0.1
)2
7.0
(23
.9–
31
.3)
26
.8(2
3.6
–3
0.7
)2
6.6
(23
.6–
30
.7)
26
.6(2
3.8
–3
0.1
)
Hb
A1
c,
%8
.6(7
.5–
9.7
)8
.4(7
.5–
9.4
)8
.1(7
.3–
9.0
)8
.4(7
.5–
9.5
)8
.5(7
.5–
9.8
)8
.6(7
.7–
9.6
)8
.3(7
.4–
9.3
)8
.5(7
.6–
9.6
)8
.5(7
.5–
9.5
)
Cu
rre
nt
smo
ker
33
.2(0
.68
)2
9.9
(0.6
5)
19
.1(1
.02
)2
9.9
(0.4
3)
25
.9(0
.70
)2
6.8
(0.7
3)
15
.4(0
.98
)2
4.6
(0.4
6)
27
.6(0
.31
)
On
reg
ula
ras
pir
in6
.4(0
.35
)3
6.2
(0.6
8)
59
.9(1
.28
)2
6.6
(0.4
2)
4.9
(0.3
5)
29
.8(0
.76
)5
4.2
(1.3
6)
22
.9(0
.45
)2
5.0
(0.3
1)
On
ast
atin
17
.3(0
.55
)5
8.8
(0.7
0)
72
.8(1
.16
)4
3.0
(0.4
7)
13
.4(0
.56
)5
4.7
(0.8
3)
73
.6(1
.20
)3
9.9
(0.5
3)
41
.7(0
.35
)
On
anti
-hyp
ert
en
sive
me
dic
atio
n1
8.5
(0.5
6)
49
.7(0
.71
)7
9.5
(1.0
6)
40
.3(0
.46
)1
5.1
(0.5
9)
43
.5(0
.83
)7
9.4
(1.1
0)
36
.9(0
.52
)3
8.9
(0.3
5)
Of
tre
ate
d,
tho
seo
nan
AC
Ein
hib
ito
r8
0.2
(1.3
4)
76
.1(0
.86
)7
0.8
(1.3
3)
75
.5(0
.64
)6
6.7
(1.9
9)
65
.3(1
.20
)6
0.9
(1.5
0)
64
.1(0
.85
)7
0.8
(0.5
2)
Val
ue
sar
em
ed
ian
(25
th–
75
thp
erc
en
tile
)fo
rco
nti
nu
ou
sva
riab
les,
%(s
tan
dar
de
rro
r)fo
rca
teg
ori
cal
vari
able
s.aN
um
be
rsva
rie
dsl
igh
tly
for
avai
lab
led
ata
for
dif
fere
nt
risk
fact
ors
.d
oi:1
0.1
37
1/j
ou
rnal
.pm
ed
.10
01
32
1.t
00
3
Current Risks of CVD and Death in Type 1 Diabetes
PLOS Medicine | www.plosmedicine.org 8 October 2012 | Volume 9 | Issue 10 | e1001321
Mean HbA1c in the Pittsburgh Epidemiology of Diabetes
Complications (EDC) was 10.3% considerably higher than the
median of 8.4% for men and 8.5% for women that we report [24],
but our results compare with findings elsewhere in Europe and
Australia [25,26]. These observations suggest that in most health
care situations maintenance of tight glycaemic control is extremely
difficult to achieve in the majority of T1DM patients. Blood
pressure control was considerably poorer that that seen in other
reports from the UK [26,27] and the EURODIAB PCS [28] and
FinnDiane cohorts [29]. In contrast, median cholesterol values
were close to ESC/EASD recommended levels [14], and lower
than those seen in comparable studies across Europe [27–30].
We report, consistent with previous studies, that the relative risk
for CVD and CHD events was greater for women than men [6,31].
It is not clear why relatively speaking T1DM affects CVD risk more
in women than men, or in other words that the sex difference in
CVD found in the non-diabetic population is narrowed in T1DM.
Previous work suggests that the greater relative risk in women is not
explained by a more adverse known CVD risk factor profile for
women than men with T1DM [31], though we found a more
favourable difference in BMI and total cholesterol levels in T1DM
men than women relative to the general population. These greater
risks for events in women than men with T1DM are not found when
fatal CVD events alone are examined. This finding could be
explained either by a diagnostic bias whereby admissions are more
likely to be classified as due to CVD in women than men or CVD
deaths being less likely to be classified as due to CVD in women.
Alternatively perhaps more effective treatment reduces the case
fatality more in women than men. Some limitations of our analysis
are that since the establishment of the diabetes register is relatively
recent we cannot report time trends in risk ratios. Another limitation
is that we did not have individual level data on events and risk
factors in the non-diabetic population. While our data are quite
contemporary in comparison with many published analyses, any
further improvement in risk factor control, including statin usage, in
the past 5 y might be expected to reduce current rates even further,
emphasising the need for ongoing monitoring of IRRs for
improvements.
A striking feature of the data is the very low rate of achievement
of glycaemic control targets. The need for improved provision of
structured patient education to enable self-management strategies
has been emphasised [5,14]. Increased patient education may
have been available to the minority of patients in the study period
but it is currently being expanded across the UK. The role of
continuous subcutaneous insulin infusion (CSII) in improving
overall glycaemic control remains controversial. Whilst we did not
have individual level data on insulin regime or pump usage we
know that currently only 2.5% of patients in the Scottish
population receive CSII therapy [32]. This number is lower than
even conservative guidelines on CSII usage, but a recently
announced increase in provision of CSII [33] is likely to improve
HbA1c for some patients. However our data emphasise the need
for more adjunctive therapies beyond insulin to help patients
achieve better control whilst maintaining quality of life and
avoiding hypoglycaemia. We are currently investigating metfor-
min as one such therapy in the Juvenile Diabetes Research
Foundation (JDRF)-funded REMOVAL trial [34]. Other impor-
tant trials of risk reduction in T1DM include the ongoing AdDIT
trial of statin therapy in teenagers with diabetes [35]. Finally,
whilst here we provide data on crude rates of CVD by age,
clinicians need better data on absolute risk of CVD for different
combinations of risk factors for patients with T1DM, i.e., a risk
engine, to tailor more intensive management and early statin
therapy to those most at risk. This area is the focus of our ongoing
work.
Supporting Information
Table S1 Incidence rates and IRR of first CHD event in those
with type 1 diabetes compared with the non-diabetic population.
(DOCX)
Table S2 Hypertension and raised cholesterol in population
with type 1 diabetes and general population [11].
(DOCX)
Acknowledgments
We thank the diabetes patients in Scotland and the Scottish Care
Information-Diabetes Collaboration and NHS National Services Informa-
tion Services Division Scotland who provided data for this study.
Author Contributions
Conceived and designed the experiments: HMC SL HL JM AM JP SP.
Performed the experiments: HMC SL HL. Analyzed the data: HMC SL
HL EH SW GL JM DP. Contributed reagents/materials/analysis tools:
RL JM AM NP SP NS HMC. Wrote the first draft of the manuscript: SL
HMC HL EH FS. Contributed to the writing of the manuscript: SL HL
EH SW RL JC SC GL JM AM DP NP JP SP NS FS HMC. ICMJE
criteria for authorship read and met: SL HL EH SW RL JC SC GL JM
AM DP NP JP SP NS FS HMC. Agree with manuscript results and
conclusions: SL HL EH SW RL JC SC GL JM AM DP NP JP SP NS FS
HMC.
References
1. Orchard TJ, Costacou T, Kretowski A, Nesto RW (2006) Type 1 diabetes and
coronary artery disease. Diabetes Care 29: 2528–2538.
2. The Diabetes Control and Complications Trial Research Group (1993) The effect of
intensive treatment of diabetes on the development and progression of long-term
complications in insulin-dependent diabetes mellitus. New Engl J Med 329: 977–986.
3. Nathan DM, Cleary PA, Backlund J-YC, Genuth SM, Lachin JM, et al. (2005)
Intensive diabetes treatment and cardiovascular disease in patients with type 1
diabetes. New Engl J Med 353: 2643–2653.
4. American Diabetes Association (2011) Standards of medical care in diabetes—
2011. Diabetes Care 34: S11–S61.
5. Scottish Intercollegiate Guidelines Network (2010) SIGN 116: management of
diabetes. A national clinical guideline. Available: http://www.sign.ac.uk/pdf/
sign116.pdf. Accessed 14 March 2012.
6. Soedamah-Muthu SS, Fuller JH, Mulnier HE, Raleigh VS, Lawrenson RA, et
al. (2006) High risk of cardiovascular disease in patients with type 1 diabetes in
the U.K.: a cohort study using the general practice research database. Diabetes
Care 29: 798–804.
7. Secrest AM, Becker DJ, Kelsey SF, LaPorte RE, Orchard TJ (2010) All-cause
mortality trends in a large population-based cohort with long-standing
childhood-onset type 1 diabetes. Diabetes Care 33: 2573–2579.
8. Moss SE, Klein R, Klein BE (1991) Cause-specific mortality in a population-
based study of diabetes. Am J Public Health 81: 1158–1162.
9. Soedamah-Muthu SS, Fuller JH, Mulnier HE, Raleigh VS, Lawrenson RA, et
al. (2006) All-cause mortality rates in patients with type 1 diabetes mellitus
compared with a non-diabetic population from the UK general practice research
database, 1992–1999. Diabetologia 49: 660–666.
10. NHS Connecting for Health (2011) Read codes. Available: http://www.
connectingforhealth.nhs.uk/systemsandservices/data/uktc/readcodes. Accessed
14 March 2012.
11. The Scottish Government (2009) Scottish Health Survey, 2008. Available:
http://scotland.gov.uk/Topics/Statistics/Browse/Health/scottish-health-
survey/Publications Accessed 14 March 2012.
12. Kendrick S (1993) The Scottish Record Linkage System. Health Bulletin 51: 72–
79.
13. Roper NA, Bilous RW, Kelly WF, Unwin NC, Connolly VM (2002) Cause-
specific mortality in a population with diabetes: South Tees Diabetes Mortality
Study. Diabetes Care 25: 43–48.
14. Ryden L, Standl E, Bartnik M, Van den Berghe G, Betteridge J, et al. (2007)
Guidelines on diabetes, pre-diabetes, and cardiovascular diseases: Executive
summary. Eur Heart J 28: 88–136.
Current Risks of CVD and Death in Type 1 Diabetes
PLOS Medicine | www.plosmedicine.org 9 October 2012 | Volume 9 | Issue 10 | e1001321
15. Schwab KO, Doerfer J, Hecker W, Grulich-Henn J, Wiemann D, et al. (2006)
Spectrum and prevalence of atherogenic risk factors in 27,358 children,
adolescents, and young adults with type 1 diabetes: cross-sectional data from the
German diabetes documentation and quality management system (DPV).
Diabetes Care 29:218–225.
16. World Health Organization (2011) WHO report on the global tobacco
epidemic, 2011. Available: http://www.who.int/tobacco/surveillance/policy/
country_profile/deu.pdf. Accessed 13 August 2012.
17. Centre for Disease Control (2008) Prevalence and trends data: nationwide
(states, DC, and territories) - 2008 tobacco use. Available: http://apps.nccd.cdc.
gov/brfss/display.asp?yr = 2008&cat = TU&qkey = 4396&state = US. Accessed
13 August 2012.
18. DeStefano F, Ford ES, Newman J, Stevenson JM, Wetterhall SF, et al. (1993)
Risk factors for coronary heart disease mortality among persons with diabetes.
Ann Epidemiol 3: 27–34.
19. Laing SP, Swerdlow AJ, Slater SD, Burden AC, Morris A, et al. (2003) Mortality
from heart disease in a cohort of 23,000 patients with insulin-treated diabetes.
Diabetologia 46: 760–765.
20. Skrivarhaug T, Bangstad HJ, Stene LC, Sandvik L, Hanssen KF, et al. (2006)
Long-term mortality in a nationwide cohort of childhood-onset type 1 diabetic
patients in Norway. Diabetologia 49: 298–305.
21. Harjutsalo V, Forsblom C, Groop P-H (2011) Time trends in mortality in
patients with type 1 diabetes: nationwide population based cohort study. BMJ
343: d5364.
22. Secrest AM, Becker DJ, Kelsey SF, LaPorte RE, Orchard TJ (2010) Cause-
specific mortality trends in a large population-based cohort with long-standing
childhood-onset type 1 diabetes. Diabetes 59: 3216–3222.
23. Laing SP, Swerdlow AJ, Slater SD, Botha JL, Burden AC, et al. (1999) The
British Diabetic Association Cohort Study, I: all-cause mortality in patients with
insulin-treated diabetes mellitus. Diabetic Med 16: 459–465.
24. Pambianco G, Costacou T, Orchard TJ (2007) The prediction of major
outcomes of type 1 diabetes: a 12-year prospective evaluation of three separate
definitions of the metabolic syndrome and their components and estimated
glucose disposal rate: the Pittsburgh Epidemiology of Diabetes Complications
Study experience. Diabetes Care 30: 1248–1254.25. Donovan PJ, McIntyre HD (2010) Achievement of cardiovascular risk factor targets in
young adults with diabetes mellitus. Diabetes Metab Syndr Obes 16: 387–394.
26. Saunders SA, Wallymhamed M, Macfarlane IA (2009) Improvements inglycaemic control and cardiovascular risk factors in a cohort of patients with type
1 diabetes over a 5-year period. QJM 102: 29–34.27. Calvert M, Shankar A, McManus RJ, Lester H, Freemantle N (2009) Effect of
the quality and outcomes framework on diabetes care in the United Kingdom:
retrospective cohort study. BMJ 338: b1870.28. Soedamah-Muthu S, Chaturvedi N, Witte D, Stevens L, Porta M, et al. (2008)
Relationship between risk factors and mortality in type 1 diabetic patients inEurope: the EURODIAB Prospective Complications Study (PCS). Diabetes
Care 31: 1360–1366.29. Tolonen N (2008) Relationship between lipid profiles and kidney function in
patients with type 1 diabetes. Diabetologia 51: 12–20.
30. Cederholm J, Eliasson B, Nilsson PM, Weiss L, Gudbjornsdottir S (2005)Microalbuminuria and risk factors in type 1 and type 2 diabetic patients.
Diabetes Res Clin Pract 67: 258–266.31. Colhoun HM, Rubens MB, Underwood SR, Fuller JH (2000) The effect of type
1 diabetes mellitus on the gender difference in coronary artery calcification. J Am
Coll Cardiol 36: 2160–2167.32. Scottish Diabetes Survey Monitoring Group (2010) Scottish diabetes survey
2010. Available: http://www.diabetesinscotland.org.uk/Publications/SDS%202010.pdf. Accessed 14 March 2012.
33. The Scottish Government (2011) Increase in insulin pumps. Available: http://www.scotland.gov.uk/News/Releases/2011/10/21153640. Accessed 14 March
2012.
34. Juvenile Diabetes Research Foundation (2011) JDRF-Funded study seeks toreduce cardiovascular risk in adults with Type 1 diabetes. Available: http://
www.jdrf.org/index.cfm?page_id = 116707. Accessed 14 March 2012.35. Adolescent type 1 Diabetes cardio-renal Intervention Trial Research Group
(2009) Adolescent type 1 Diabetes Cardio-renal Intervention Trial (AdDIT).
BMC Pediatr 9: 79.
Current Risks of CVD and Death in Type 1 Diabetes
PLOS Medicine | www.plosmedicine.org 10 October 2012 | Volume 9 | Issue 10 | e1001321
Editors’ Summary
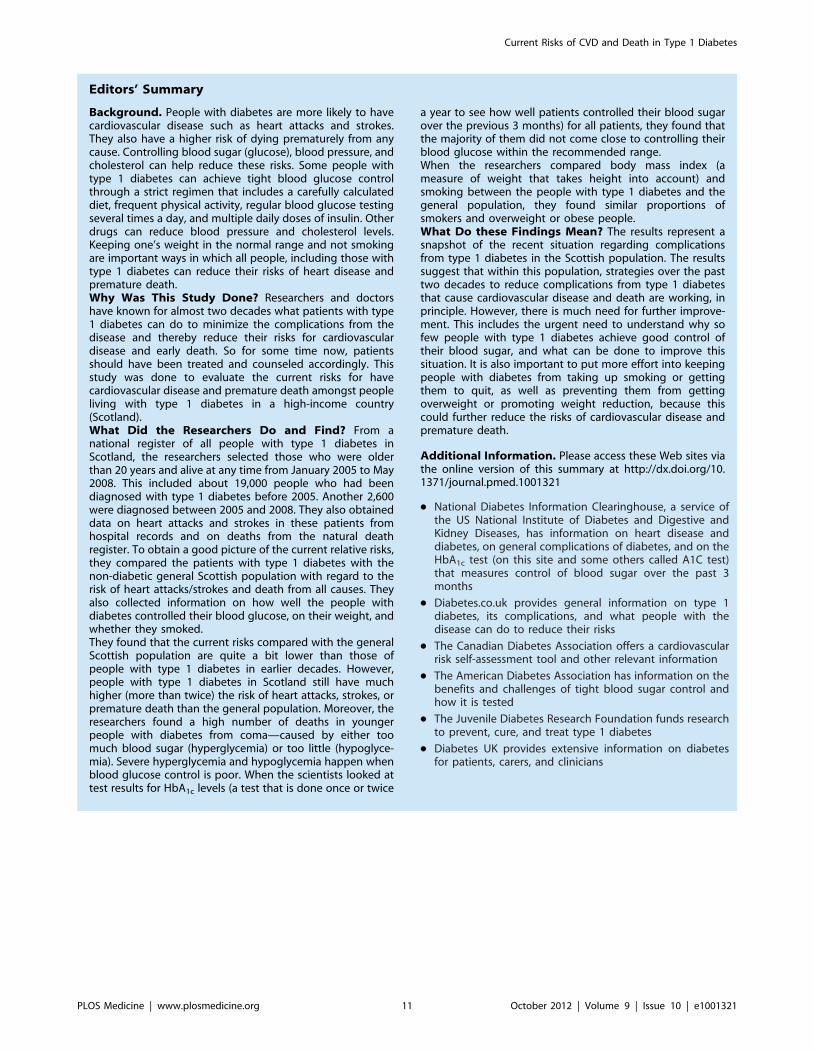
Background. People with diabetes are more likely to havecardiovascular disease such as heart attacks and strokes.They also have a higher risk of dying prematurely from anycause. Controlling blood sugar (glucose), blood pressure, andcholesterol can help reduce these risks. Some people withtype 1 diabetes can achieve tight blood glucose controlthrough a strict regimen that includes a carefully calculateddiet, frequent physical activity, regular blood glucose testingseveral times a day, and multiple daily doses of insulin. Otherdrugs can reduce blood pressure and cholesterol levels.Keeping one’s weight in the normal range and not smokingare important ways in which all people, including those withtype 1 diabetes can reduce their risks of heart disease andpremature death.Why Was This Study Done? Researchers and doctorshave known for almost two decades what patients with type1 diabetes can do to minimize the complications from thedisease and thereby reduce their risks for cardiovasculardisease and early death. So for some time now, patientsshould have been treated and counseled accordingly. Thisstudy was done to evaluate the current risks for havecardiovascular disease and premature death amongst peopleliving with type 1 diabetes in a high-income country(Scotland).What Did the Researchers Do and Find? From anational register of all people with type 1 diabetes inScotland, the researchers selected those who were olderthan 20 years and alive at any time from January 2005 to May2008. This included about 19,000 people who had beendiagnosed with type 1 diabetes before 2005. Another 2,600were diagnosed between 2005 and 2008. They also obtaineddata on heart attacks and strokes in these patients fromhospital records and on deaths from the natural deathregister. To obtain a good picture of the current relative risks,they compared the patients with type 1 diabetes with thenon-diabetic general Scottish population with regard to therisk of heart attacks/strokes and death from all causes. Theyalso collected information on how well the people withdiabetes controlled their blood glucose, on their weight, andwhether they smoked.They found that the current risks compared with the generalScottish population are quite a bit lower than those ofpeople with type 1 diabetes in earlier decades. However,people with type 1 diabetes in Scotland still have muchhigher (more than twice) the risk of heart attacks, strokes, orpremature death than the general population. Moreover, theresearchers found a high number of deaths in youngerpeople with diabetes from coma—caused by either toomuch blood sugar (hyperglycemia) or too little (hypoglyce-mia). Severe hyperglycemia and hypoglycemia happen whenblood glucose control is poor. When the scientists looked attest results for HbA1c levels (a test that is done once or twice
a year to see how well patients controlled their blood sugarover the previous 3 months) for all patients, they found thatthe majority of them did not come close to controlling theirblood glucose within the recommended range.When the researchers compared body mass index (ameasure of weight that takes height into account) andsmoking between the people with type 1 diabetes and thegeneral population, they found similar proportions ofsmokers and overweight or obese people.What Do these Findings Mean? The results represent asnapshot of the recent situation regarding complicationsfrom type 1 diabetes in the Scottish population. The resultssuggest that within this population, strategies over the pasttwo decades to reduce complications from type 1 diabetesthat cause cardiovascular disease and death are working, inprinciple. However, there is much need for further improve-ment. This includes the urgent need to understand why sofew people with type 1 diabetes achieve good control oftheir blood sugar, and what can be done to improve thissituation. It is also important to put more effort into keepingpeople with diabetes from taking up smoking or gettingthem to quit, as well as preventing them from gettingoverweight or promoting weight reduction, because thiscould further reduce the risks of cardiovascular disease andpremature death.
Additional Information. Please access these Web sites viathe online version of this summary at http://dx.doi.org/10.1371/journal.pmed.1001321
N National Diabetes Information Clearinghouse, a service ofthe US National Institute of Diabetes and Digestive andKidney Diseases, has information on heart disease anddiabetes, on general complications of diabetes, and on theHbA1c test (on this site and some others called A1C test)that measures control of blood sugar over the past 3months
N Diabetes.co.uk provides general information on type 1diabetes, its complications, and what people with thedisease can do to reduce their risks
N The Canadian Diabetes Association offers a cardiovascularrisk self-assessment tool and other relevant information
N The American Diabetes Association has information on thebenefits and challenges of tight blood sugar control andhow it is tested
N The Juvenile Diabetes Research Foundation funds researchto prevent, cure, and treat type 1 diabetes
N Diabetes UK provides extensive information on diabetesfor patients, carers, and clinicians
Current Risks of CVD and Death in Type 1 Diabetes
PLOS Medicine | www.plosmedicine.org 11 October 2012 | Volume 9 | Issue 10 | e1001321
Related Documents