Can J Cardiol Vol 19 No 11 October 2003 1249 Risk factors for cardiovascular disease in Canada Peter Tanuseputro MHSc 1 , Douglas G Manuel MD MSc 1,2 , Mark Leung BSc 1 , Kathy Nguyen BSc 3 , Helen Johansen PhD 3 , for the Canadian Cardiovascular Outcomes Research Team 1 Institute for Clinical Evaluative Sciences, Toronto, Ontario; 2 Department of Public Health Sciences, University of Toronto, Toronto, Ontario; and 3 Statistics Canada, Ottawa, Ontario Correspondence and reprints: Dr Douglas G Manuel, Institute for Clinical Evaluative Sciences, G106-2075 Bayview Avenue, Toronto, Ontario M4N 3M5. Telephone 416-480-4055 x3892, fax 416-480-6048, e-mail [email protected] Received for publication July 30, 2003. Accepted August 14, 2003 P Tanuseputro, DG Manuel, M Leung, K Nguyen, H Johansen. Risk factors for cardiovascular disease in Canada. Can J Cardiol 2003;19(11):1249-1259. BACKGROUND: This paper provides an update of the prevalence of important cardiovascular disease (CVD) risk factors in subgroups of the Canadian population. To improve awareness of the impact of CVD risk factor variations on disease burden, smoking-attributable mortality (SAM) has been estimated for the first time for each health region in Canada. METHODS: The 2000/01 Canadian Community Health Survey (CCHS) was used to estimate the prevalence of current smoking, obesity, physical inactivity, low income, diabetes and hypertension. Combining smoking prevalence data from the 2000/01 CCHS, mor- tality data from the 1995 to 1997 Canadian Mortality Database, and relative risk estimates (relating smoking and smoking-associated deaths) from the American Cancer Society’s Cancer Prevention Study II, SAM values were generated using population-attributable risk techniques. RESULTS: Based on self-reported data, the 2000/01 CCHS shows that 26.0% of Canadians currently smoke, 14.9% are obese, 53.5% are physically inactive, 11.3% have low income, 13.0% have hyper- tension and 4.2% have diabetes. Cardiovascular and all-cause SAM were estimated at 18,209 and 44,271 annual deaths, and contributed to 23% and 22% of total CVD and all-cause mortality in Canada, respectively. There are large variations in the prevalence of CVD risk factors and in SAM estimates between sexes and across age groups and geographic regions. CONCLUSIONS: The high prevalence of potentially modifiable CVD risk factors and the large variation that exists between sub- groups of the Canadian population suggest that the burden of CVD could be reduced through risk factor modification. While prevalence data for risk factors in a population give an initial understanding of some of the contributing causes of a disease, the actual burden of dis- ease caused by a risk factor is also modified by the magnitude of the increased risk to mortality and morbidity, and is best represented by its estimated attributable mortality and morbidity. Key Words: Hypertension; Obesity; Population health; Prevention; Risk factors; Smoking Facteurs de risque de maladie cardiovasculaire au Canada CONTEXTE : Cet article présente une mise à jour de la prévalence des facteurs de risque de maladies cardiovasculaires (MCV) importants chez des sous groupes de la population canadienne. Pour mieux faire compren- dre l’impact des variations des facteurs de risque de MCV sur le fardeau de la maladie, la mortalité attribuable au tabagisme (MAT) a été estimée pour la première fois dans chacune des régions socio-sanitaires du Canada. MÉTHODES : L’Enquête sur la santé dans les collectivités canadiennes (ESCC) de 2000-2001 a été utilisée pour estimer la prévalence du tabag- isme, de l’obésité, de l’inactivité physique, du faible revenu, du diabète et de l’hypertension. En combinant les données de prévalence du tabagisme de l’ESCC de 2000-2001, les données de mortalité de 1995 à 1997 de la Base canadienne de données sur la mortalité et les estimations du risque relatif (reliant le tabagisme et les décès associés au tabagisme) de la Cancer Prevention Study II de l’American Cancer Society, il a été possi- ble de produire des valeurs de MAT en utilisant les techniques d’évalua- tion de la fraction étiologique du risque. RÉSULTATS : S’appuyant sur les données rapportées par les patients, l’ESCC de 2000-2001 révèle ce qui suit : 26,0 % des Canadiens fumaient au moment de l’enquête, 14,9 % étaient obèses, 53,5 % étaient physique- ment inactifs, 11,3 % avaient un faible revenu, 13,0 % souffraient d’hy- pertension et 4,2 % étaient atteints de diabète. Au Canada, la MAT d’origine cardiovasculaire et de toutes causes a été estimée à 18 209 et à 44 271 décès par année, et a contribué à 23 % et à 22 % de la mortalité totale de cause CV et de toutes causes, respectivement. La prévalence des facteurs de risque de MCV et les estimations de la MAT présentent de grandes variations entre les sexes, les différents groupes d’âge et les régions géographiques. CONCLUSIONS : La prévalence élevée des facteurs de risque de MCV modifiables et l’importante variation qui existe entre les sous groupes de la population canadienne semblent indiquer que le fardeau des MCV pourrait être réduit par une correction des facteurs de risque. Bien que les données de prévalence des facteurs de risque dans une population puissent aider à comprendre certaines des causes d’une maladie, le fardeau de la maladie engendré par un facteur de risque donné est également modifié par l’ampleur de l’accroissement du risque de mortalité et de morbidité, et ce sont les estimations de la mortalité et de la morbidité qui lui sont attribuables qui représentent le mieux ce fardeau. R esearch efforts in recent decades have identified many risk factors that can contribute to the development of cardiovas- cular disease (CVD). Encouragingly, because many risk factors for CVD such as smoking, physical inactivity, unfavourable lipid cholesterol profile and hypertension are considered to be largely modifiable, many deaths and disabilities due to CVD could be prevented. Other major and potentially modifiable CVD risk fac- tors include obesity, diabetes and low income. Previous Canadian reports such as the 2003 Growing Burden of Heart Disease and Stroke in Canada (1) have outlined differences in the prevalence of these risk factors across the sexes, different age groups and broad geographical regions. In recognizing these differences, health practitioners and program planners may focus their efforts on specific groups of the population that are in greatest need. This paper updates the prevalence of important CVD risk factors across subgroups of the Canadian population. ©2003 Pulsus Group Inc. All rights reserved CCORT ATLAS PAPER

Welcome message from author
This document is posted to help you gain knowledge. Please leave a comment to let me know what you think about it! Share it to your friends and learn new things together.
Transcript
Can J Cardiol Vol 19 No 11 October 2003 1249
Risk factors for cardiovascular disease in Canada
Peter Tanuseputro MHSc1, Douglas G Manuel MD MSc1,2, Mark Leung BSc1, Kathy Nguyen BSc3,Helen Johansen PhD3, for the Canadian Cardiovascular Outcomes Research Team
1Institute for Clinical Evaluative Sciences, Toronto, Ontario; 2Department of Public Health Sciences, University of Toronto, Toronto, Ontario;and 3Statistics Canada, Ottawa, Ontario
Correspondence and reprints: Dr Douglas G Manuel, Institute for Clinical Evaluative Sciences, G106-2075 Bayview Avenue, Toronto, OntarioM4N 3M5. Telephone 416-480-4055 x3892, fax 416-480-6048, e-mail [email protected]
Received for publication July 30, 2003. Accepted August 14, 2003
P Tanuseputro, DG Manuel, M Leung, K Nguyen, H Johansen.Risk factors for cardiovascular disease in Canada. Can J Cardiol2003;19(11):1249-1259.
BACKGROUND: This paper provides an update of the prevalenceof important cardiovascular disease (CVD) risk factors in subgroupsof the Canadian population. To improve awareness of the impact ofCVD risk factor variations on disease burden, smoking-attributablemortality (SAM) has been estimated for the first time for each healthregion in Canada.METHODS: The 2000/01 Canadian Community Health Survey(CCHS) was used to estimate the prevalence of current smoking,obesity, physical inactivity, low income, diabetes and hypertension.Combining smoking prevalence data from the 2000/01 CCHS, mor-tality data from the 1995 to 1997 Canadian Mortality Database, andrelative risk estimates (relating smoking and smoking-associateddeaths) from the American Cancer Society’s Cancer PreventionStudy II, SAM values were generated using population-attributablerisk techniques.RESULTS: Based on self-reported data, the 2000/01 CCHS showsthat 26.0% of Canadians currently smoke, 14.9% are obese, 53.5%are physically inactive, 11.3% have low income, 13.0% have hyper-tension and 4.2% have diabetes. Cardiovascular and all-cause SAMwere estimated at 18,209 and 44,271 annual deaths, and contributedto 23% and 22% of total CVD and all-cause mortality in Canada,respectively. There are large variations in the prevalence of CVD riskfactors and in SAM estimates between sexes and across age groupsand geographic regions.CONCLUSIONS: The high prevalence of potentially modifiableCVD risk factors and the large variation that exists between sub-groups of the Canadian population suggest that the burden of CVDcould be reduced through risk factor modification. While prevalencedata for risk factors in a population give an initial understanding ofsome of the contributing causes of a disease, the actual burden of dis-ease caused by a risk factor is also modified by the magnitude of theincreased risk to mortality and morbidity, and is best represented byits estimated attributable mortality and morbidity.
Key Words: Hypertension; Obesity; Population health; Prevention;Risk factors; Smoking
Facteurs de risque de maladie cardiovasculaireau Canada
CONTEXTE : Cet article présente une mise à jour de la prévalence desfacteurs de risque de maladies cardiovasculaires (MCV) importants chezdes sous groupes de la population canadienne. Pour mieux faire compren-dre l’impact des variations des facteurs de risque de MCV sur le fardeau dela maladie, la mortalité attribuable au tabagisme (MAT) a été estiméepour la première fois dans chacune des régions socio-sanitaires du Canada. MÉTHODES : L’Enquête sur la santé dans les collectivités canadiennes(ESCC) de 2000-2001 a été utilisée pour estimer la prévalence du tabag-isme, de l’obésité, de l’inactivité physique, du faible revenu, du diabète etde l’hypertension. En combinant les données de prévalence du tabagismede l’ESCC de 2000-2001, les données de mortalité de 1995 à 1997 de laBase canadienne de données sur la mortalité et les estimations du risquerelatif (reliant le tabagisme et les décès associés au tabagisme) de laCancer Prevention Study II de l’American Cancer Society, il a été possi-ble de produire des valeurs de MAT en utilisant les techniques d’évalua-tion de la fraction étiologique du risque.RÉSULTATS : S’appuyant sur les données rapportées par les patients,l’ESCC de 2000-2001 révèle ce qui suit : 26,0 % des Canadiens fumaientau moment de l’enquête, 14,9 % étaient obèses, 53,5 % étaient physique-ment inactifs, 11,3 % avaient un faible revenu, 13,0 % souffraient d’hy-pertension et 4,2 % étaient atteints de diabète. Au Canada, la MATd’origine cardiovasculaire et de toutes causes a été estimée à 18 209 et à44 271 décès par année, et a contribué à 23 % et à 22 % de la mortalitétotale de cause CV et de toutes causes, respectivement. La prévalence desfacteurs de risque de MCV et les estimations de la MAT présentent degrandes variations entre les sexes, les différents groupes d’âge et les régionsgéographiques. CONCLUSIONS : La prévalence élevée des facteurs de risque de MCVmodifiables et l’importante variation qui existe entre les sous groupes dela population canadienne semblent indiquer que le fardeau des MCVpourrait être réduit par une correction des facteurs de risque. Bien que lesdonnées de prévalence des facteurs de risque dans une population puissentaider à comprendre certaines des causes d’une maladie, le fardeau de lamaladie engendré par un facteur de risque donné est également modifiépar l’ampleur de l’accroissement du risque de mortalité et de morbidité, etce sont les estimations de la mortalité et de la morbidité qui lui sontattribuables qui représentent le mieux ce fardeau.
Research efforts in recent decades have identified many riskfactors that can contribute to the development of cardiovas-
cular disease (CVD). Encouragingly, because many risk factors forCVD such as smoking, physical inactivity, unfavourable lipidcholesterol profile and hypertension are considered to be largelymodifiable, many deaths and disabilities due to CVD could beprevented. Other major and potentially modifiable CVD risk fac-tors include obesity, diabetes and low income. Previous Canadian
reports such as the 2003 Growing Burden of Heart Disease andStroke in Canada (1) have outlined differences in the prevalenceof these risk factors across the sexes, different age groups andbroad geographical regions. In recognizing these differences,health practitioners and program planners may focus their effortson specific groups of the population that are in greatest need.
This paper updates the prevalence of important CVD riskfactors across subgroups of the Canadian population.
©2003 Pulsus Group Inc. All rights reserved
CCORT ATLAS PAPER
Nationwide prevalence estimates were produced at thehealth regional level, using the 2000/01 Canadian CommunityHealth Survey (CCHS) (2). Each examined risk factor hasimplications for morbidity and mortality because it con-tributes to the increased incidence of cardiovascular andother associated diseases. To illustrate the deleterious effectsof a major risk factor for CVD, smoking-attributable cardio-vascular and all-cause mortality estimates have been calcu-lated for the first time for each health region. Recognizingthat smoking is only one of the many modifiable risk factorsfor CVD, and that death is but one of the many possiblehealth consequences of a disease, these numbers reveal onlya portion of the significant potential health benefits thathealth care systems may achieve through effective risk man-agement programs at both the population and individuallevels.
METHODSData sourcesRisk factor prevalence estimates for CVD were derived usingresponses from the 2000/01 CCHS 1.1 conducted by StatisticsCanada (2,3). This survey provides cross-sectional estimates ofhealth determinants, health status and health system use at asub-provincial level (health region or combination of healthregions). The target population of the CCHS included house-hold residents in all provinces and territories; the principalexclusions were populations on Indian Reserves, CanadianForces Bases and some remote areas. There was one randomlyselected respondent per household, although planned oversam-pling of youths resulted in a second member of certain house-holds being interviewed. For the first collection cycle, only those12 years of age and over were eligible for selection. The CCHScycle 1.1 began data collection in September 2000 and the totalsample size was 131,535 household respondents, representing aresponse rate of 84.7%. Both computer-assisted personal andtelephone interviews were performed. Data from the NationalPopulation Health Survey (NPHS), a methodologically similarsurvey conducted by Statistics Canada in the past, was used forthe comparison years of 1996/97 (3). Statistical testing for com-parisons of prevalence data was conducted using weighted boot-strap resampling techniques (4-7).
To conduct the calculations for smoking-attributable mortality(SAM), in addition to smoking prevalence estimates from theCCHS, disease-specific mortality counts that were partially attrib-utable to smoking were obtained from the 1995 to 1997 CanadianMortality Database (8). Disease-specific relative risk estimates forcurrent smokers and former smokers, compared with never smok-ers, were also required for the calculation of SAM. This informa-tion was obtained from the Cancer Prevention Study II (9), aprospective study of 1,185,106 adults over the age of 30 living inthe United States (10).
Variable definitionsThe prevalences of six risk factors for CVD – smoking, obesity,sedentary lifestyle, low income, diabetes and hypertension – wereobtained from the CCHS and the NPHS (2,3). For all compar-isons, the CCHS and the NPHS used matching variable defini-tions. Current smokers were those who reported smokingcigarettes daily or occasionally at the time of the survey. Formersmokers, the prevalence of whom (from the CCHS) was used inthe calculation of SAM, were those who reported smoking at least100 cigarettes in their lifetime. Body mass index (BMI) was used
as an indicator of obesity. Following the World HealthOrganization’s guidelines, people with a BMI of at least 30 wereconsidered obese and had an increased risk of developing healthproblems (11). Sedentary lifestyle was determined using thePhysical Activity Index (PAI). PAI took into account the fre-quency, duration and intensity (using standard metabolic equiva-lent values) of current leisure activities (12). A person with acalculated PAI less than 1.5 kcal/kg/day was classified as physicallyinactive. Income questions were asked of respondents aged 15years and over; low income was defined as less than CDN$15,000for households with one or two people, less than CDN$20,000 forthree or four people, and less than CDN$30,000 for more than fivepeople (12). The prevalence of diagnosed diabetes and hyperten-sion were self-reported.
SAMSmoking-attributable fraction (SAF) estimated the proportion ofdeaths, due to a given disease, that were caused by smoking in apopulation. SAF was calculated using Levin’s formula for popula-tion-attributable risk (13), modified to take into account multipleexposure levels of smoking (14):
where po, p1 and p2 represented the percentage prevalence of nev-er, current and former smokers, respectively, while RR1 and RR2represented the relative risk of death due to a given disease for cur-rent and former smokers, with never smokers as the referencegroup.
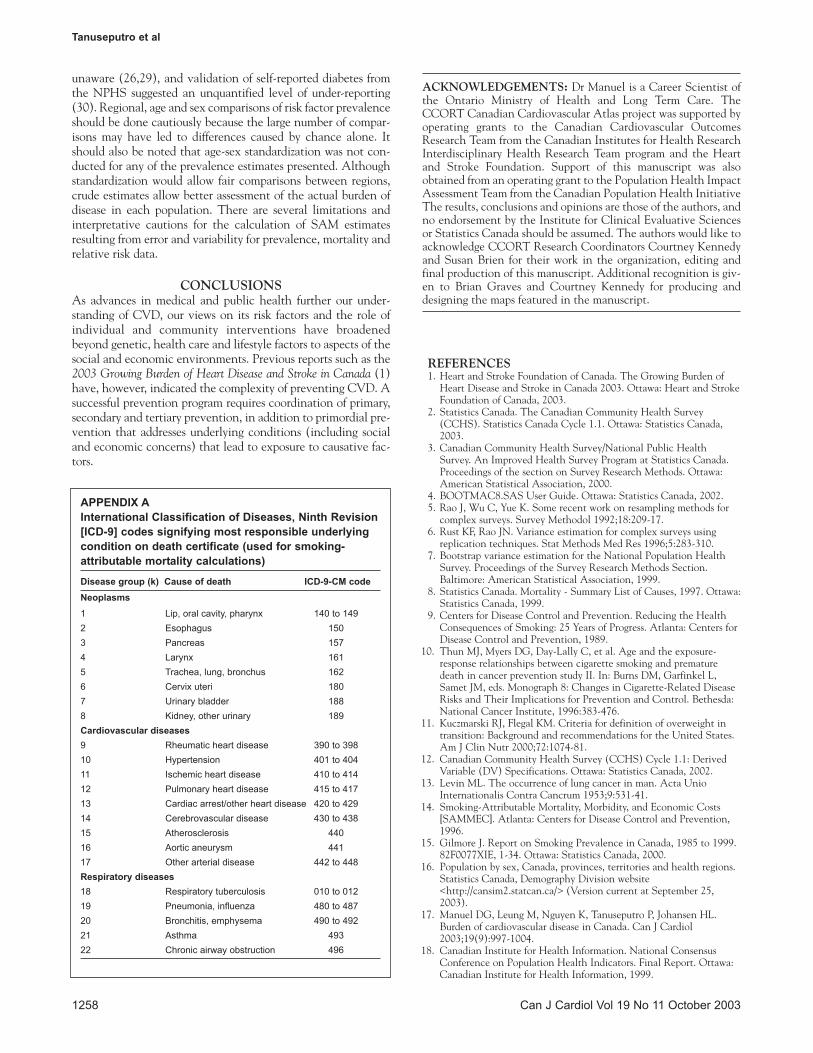
Similarly, SAM estimated the number of excess deaths thatresulted from smoking. The calculation for SAM involved mul-tiplying the SAF and mortality count. SAM was calculated foreach disease group, k (Appendix A), sex, age group (five-yearage groups for those between 35 and 90 years, and 90+), and foreach geographic region. The number of all-cause SAM was sim-ply the sum of SAM from all k disease groups, while the numberof CVD SAM was the sum of SAM calculated from a subset ofCVD related deaths (Appendix A).
Five-year age- and sex-specific relative risk estimates forischemic heart disease, cerebrovascular disease, lung cancer andchronic obstructive pulmonary disease were used (10). For all oth-er diseases, sex-specific relative risk estimates for adults over 35years of age were used. Conservatively, all deaths among peopleunder 35 years of age, as well as all deaths due to perinatal condi-tions, burns and environmental tobacco smoke among people inall age groups, were excluded.
To take into account the lag time that exists between recentchanges in the prevalence of current cigarette smoking andpresent SAM, smoking prevalence estimates from the CCHSwere corrected back in time using smoking data from past sur-veys. For SAFs associated with neoplasms and selected respira-tory diseases, this was done by using an adjustment factorcalculated as the difference between the national current smok-ing prevalence estimate from the 2000/01 CCHS and the 1985General Social Survey (ie, a 15- or 16-year lag time) (15). Thisfactor was applied to CCHS current smoking prevalence esti-mates at all levels of analyses. For CVD-associated SAFs, datafrom the 1991 General Social Survey were used (15). For com-parison purposes, all region-specific SAM rates were age-sexstandardized to the 1991 Canadian population using the directmethod.
] RR p RR p [p0 1] ) RR p RR1 p [(p0 Fraction le Attributab Smoking
2 2 1 1 2 2 1
× + × + − × + × +
=
Tanuseputro et al
Can J Cardiol Vol 19 No 11 October 20031250
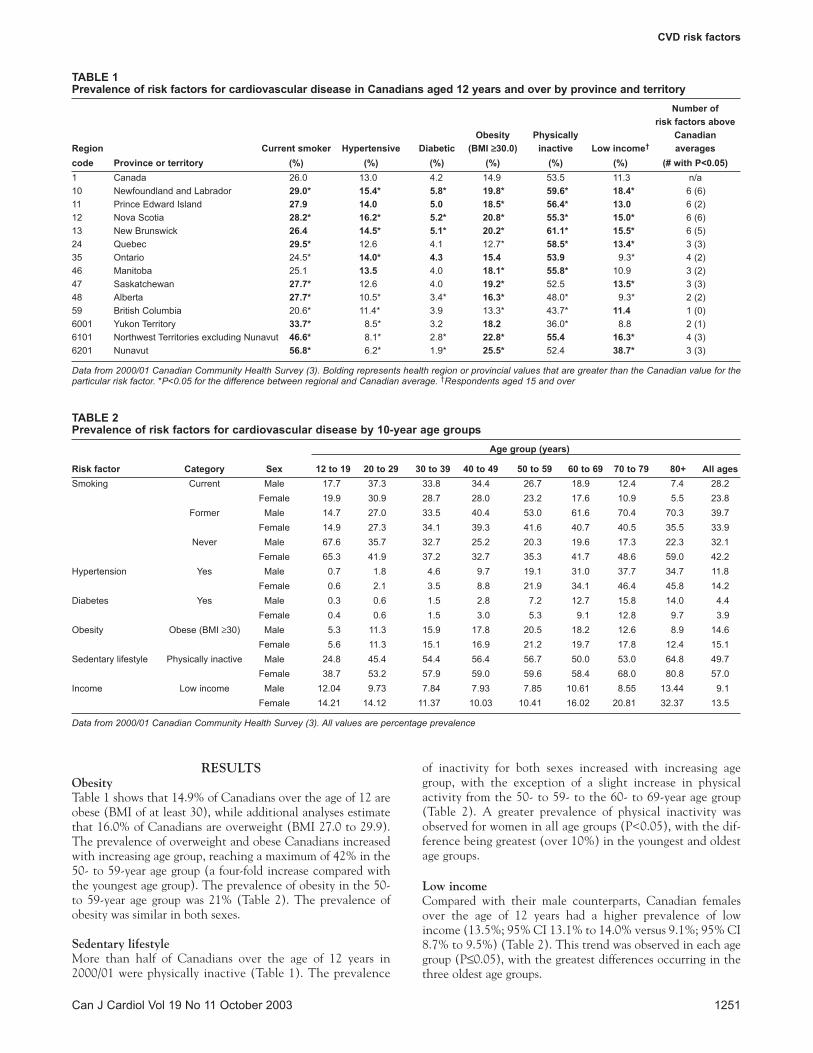
RESULTSObesityTable 1 shows that 14.9% of Canadians over the age of 12 areobese (BMI of at least 30), while additional analyses estimatethat 16.0% of Canadians are overweight (BMI 27.0 to 29.9).The prevalence of overweight and obese Canadians increasedwith increasing age group, reaching a maximum of 42% in the50- to 59-year age group (a four-fold increase compared withthe youngest age group). The prevalence of obesity in the 50-to 59-year age group was 21% (Table 2). The prevalence ofobesity was similar in both sexes.
Sedentary lifestyleMore than half of Canadians over the age of 12 years in2000/01 were physically inactive (Table 1). The prevalence
of inactivity for both sexes increased with increasing agegroup, with the exception of a slight increase in physicalactivity from the 50- to 59- to the 60- to 69-year age group(Table 2). A greater prevalence of physical inactivity wasobserved for women in all age groups (P<0.05), with the dif-ference being greatest (over 10%) in the youngest and oldestage groups.
Low incomeCompared with their male counterparts, Canadian femalesover the age of 12 years had a higher prevalence of lowincome (13.5%; 95% CI 13.1% to 14.0% versus 9.1%; 95% CI8.7% to 9.5%) (Table 2). This trend was observed in each agegroup (P≤0.05), with the greatest differences occurring in thethree oldest age groups.
CVD risk factors
Can J Cardiol Vol 19 No 11 October 2003 1251
TABLE 1Prevalence of risk factors for cardiovascular disease in Canadians aged 12 years and over by province and territory
Number of risk factors above
Obesity Physically CanadianRegion Current smoker Hypertensive Diabetic (BMI ≥≥30.0) inactive Low income† averagescode Province or territory (%) (%) (%) (%) (%) (%) (# with P<0.05)1 Canada 26.0 13.0 4.2 14.9 53.5 11.3 n/a10 Newfoundland and Labrador 29.0* 15.4* 5.8* 19.8* 59.6* 18.4* 6 (6)11 Prince Edward Island 27.9 14.0 5.0 18.5* 56.4* 13.0 6 (2)12 Nova Scotia 28.2* 16.2* 5.2* 20.8* 55.3* 15.0* 6 (6)13 New Brunswick 26.4 14.5* 5.1* 20.2* 61.1* 15.5* 6 (5)24 Quebec 29.5* 12.6 4.1 12.7* 58.5* 13.4* 3 (3)35 Ontario 24.5* 14.0* 4.3 15.4 53.9 9.3* 4 (2)46 Manitoba 25.1 13.5 4.0 18.1* 55.8* 10.9 3 (2)47 Saskatchewan 27.7* 12.6 4.0 19.2* 52.5 13.5* 3 (3)48 Alberta 27.7* 10.5* 3.4* 16.3* 48.0* 9.3* 2 (2)59 British Columbia 20.6* 11.4* 3.9 13.3* 43.7* 11.4 1 (0)6001 Yukon Territory 33.7* 8.5* 3.2 18.2 36.0* 8.8 2 (1)6101 Northwest Territories excluding Nunavut 46.6* 8.1* 2.8* 22.8* 55.4 16.3* 4 (3)6201 Nunavut 56.8* 6.2* 1.9* 25.5* 52.4 38.7* 3 (3)
Data from 2000/01 Canadian Community Health Survey (3). Bolding represents health region or provincial values that are greater than the Canadian value for theparticular risk factor. *P<0.05 for the difference between regional and Canadian average. †Respondents aged 15 and over
TABLE 2Prevalence of risk factors for cardiovascular disease by 10-year age groups
Age group (years)
Risk factor Category Sex 12 to 19 20 to 29 30 to 39 40 to 49 50 to 59 60 to 69 70 to 79 80+ All agesSmoking Current Male 17.7 37.3 33.8 34.4 26.7 18.9 12.4 7.4 28.2
Female 19.9 30.9 28.7 28.0 23.2 17.6 10.9 5.5 23.8Former Male 14.7 27.0 33.5 40.4 53.0 61.6 70.4 70.3 39.7
Female 14.9 27.3 34.1 39.3 41.6 40.7 40.5 35.5 33.9Never Male 67.6 35.7 32.7 25.2 20.3 19.6 17.3 22.3 32.1
Female 65.3 41.9 37.2 32.7 35.3 41.7 48.6 59.0 42.2Hypertension Yes Male 0.7 1.8 4.6 9.7 19.1 31.0 37.7 34.7 11.8
Female 0.6 2.1 3.5 8.8 21.9 34.1 46.4 45.8 14.2Diabetes Yes Male 0.3 0.6 1.5 2.8 7.2 12.7 15.8 14.0 4.4
Female 0.4 0.6 1.5 3.0 5.3 9.1 12.8 9.7 3.9Obesity Obese (BMI ≥30) Male 5.3 11.3 15.9 17.8 20.5 18.2 12.6 8.9 14.6
Female 5.6 11.3 15.1 16.9 21.2 19.7 17.8 12.4 15.1Sedentary lifestyle Physically inactive Male 24.8 45.4 54.4 56.4 56.7 50.0 53.0 64.8 49.7
Female 38.7 53.2 57.9 59.0 59.6 58.4 68.0 80.8 57.0Income Low income Male 12.04 9.73 7.84 7.93 7.85 10.61 8.55 13.44 9.1
Female 14.21 14.12 11.37 10.03 10.41 16.02 20.81 32.37 13.5
Data from 2000/01 Canadian Community Health Survey (3). All values are percentage prevalence
DiabetesAbout 4% of CCHS respondents reported having diabetes(Table 1). Increasing age group was associated with increasingprevalence of self-reported diabetes. Men had a slightly higherprevalence of diabetes than women in the four oldest agegroups (P<0.05).
HypertensionData from the CCHS showed that 13.0% of Canadians self-reported hypertension (Table 1). Similar to diabetes, theprevalence of hypertension generally increased with increasedage (Table 2). Women in the four oldest age groups had a high-er prevalence of hypertension, and the difference was magni-fied with increasing age.
SmokingAmong Canadians over the age of 12, 26% currently smoke(Table 1). Current smoking prevalence was higher for males
(28.2%; 95% CI 27.6% to 28.7%) than females (23.8%; 95%CI 23.3% to 24.3%). This observation was true of all agegroups, with the exception of 12- to 19-year-old females, whohad a higher smoking prevalence (19.9%; 95% CI 18.8% to21.0%) than their male counterparts (17.7%; 95% CI 16.6%to 18.8%). For both sexes, the highest prevalence of currentsmokers was observed in the 20- to 29-year age group (37.3%for males and 30.9% for females).
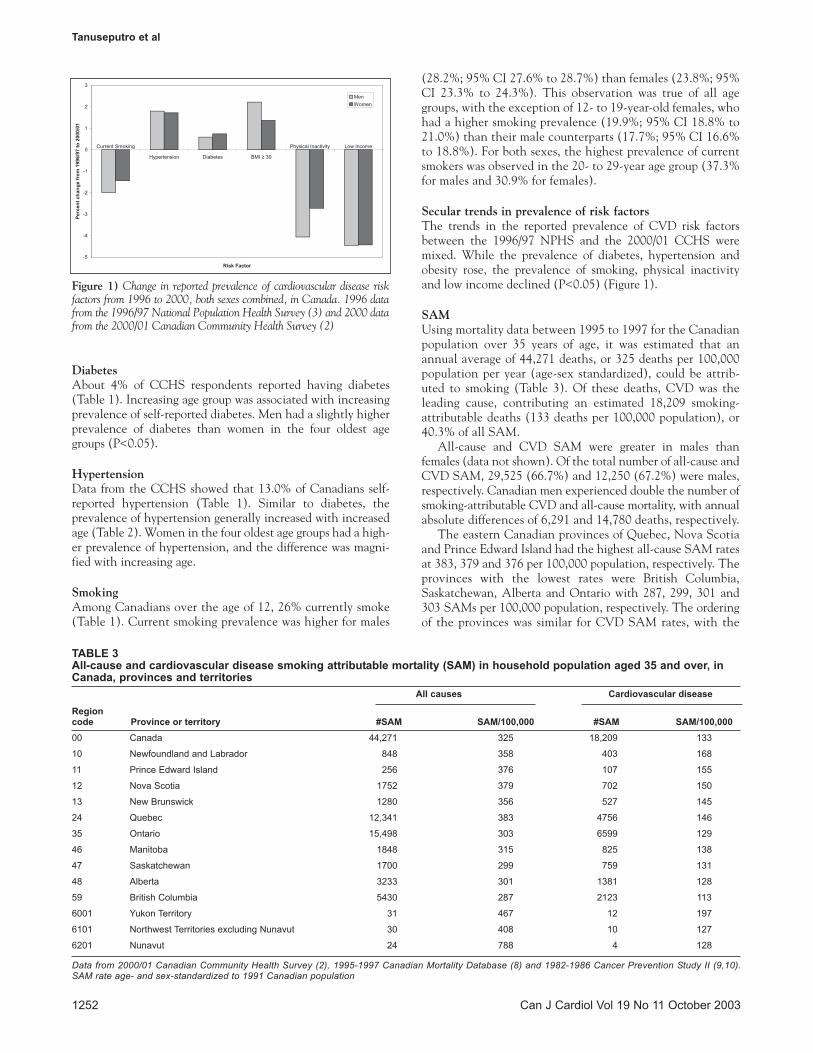
Secular trends in prevalence of risk factorsThe trends in the reported prevalence of CVD risk factorsbetween the 1996/97 NPHS and the 2000/01 CCHS weremixed. While the prevalence of diabetes, hypertension andobesity rose, the prevalence of smoking, physical inactivityand low income declined (P<0.05) (Figure 1).
SAMUsing mortality data between 1995 to 1997 for the Canadianpopulation over 35 years of age, it was estimated that anannual average of 44,271 deaths, or 325 deaths per 100,000population per year (age-sex standardized), could be attrib-uted to smoking (Table 3). Of these deaths, CVD was theleading cause, contributing an estimated 18,209 smoking-attributable deaths (133 deaths per 100,000 population), or40.3% of all SAM.
All-cause and CVD SAM were greater in males thanfemales (data not shown). Of the total number of all-cause andCVD SAM, 29,525 (66.7%) and 12,250 (67.2%) were males,respectively. Canadian men experienced double the number ofsmoking-attributable CVD and all-cause mortality, with annualabsolute differences of 6,291 and 14,780 deaths, respectively.
The eastern Canadian provinces of Quebec, Nova Scotiaand Prince Edward Island had the highest all-cause SAM ratesat 383, 379 and 376 per 100,000 population, respectively. Theprovinces with the lowest rates were British Columbia,Saskatchewan, Alberta and Ontario with 287, 299, 301 and303 SAMs per 100,000 population, respectively. The orderingof the provinces was similar for CVD SAM rates, with the
Tanuseputro et al
Can J Cardiol Vol 19 No 11 October 20031252
Figure 1) Change in reported prevalence of cardiovascular disease riskfactors from 1996 to 2000, both sexes combined, in Canada. 1996 datafrom the 1996/97 National Population Health Survey (3) and 2000 datafrom the 2000/01 Canadian Community Health Survey (2)
TABLE 3All-cause and cardiovascular disease smoking attributable mortality (SAM) in household population aged 35 and over, inCanada, provinces and territories
All causes Cardiovascular disease
Region code Province or territory #SAM SAM/100,000 #SAM SAM/100,00000 Canada 44,271 325 18,209 133
10 Newfoundland and Labrador 848 358 403 168
11 Prince Edward Island 256 376 107 155
12 Nova Scotia 1752 379 702 150
13 New Brunswick 1280 356 527 145
24 Quebec 12,341 383 4756 146
35 Ontario 15,498 303 6599 129
46 Manitoba 1848 315 825 138
47 Saskatchewan 1700 299 759 131
48 Alberta 3233 301 1381 128
59 British Columbia 5430 287 2123 113
6001 Yukon Territory 31 467 12 197
6101 Northwest Territories excluding Nunavut 30 408 10 127
6201 Nunavut 24 788 4 128
Data from 2000/01 Canadian Community Health Survey (2), 1995-1997 Canadian Mortality Database (8) and 1982-1986 Cancer Prevention Study II (9,10).SAM rate age- and sex-standardized to 1991 Canadian population
exception of Newfoundland and Labrador, which had thehighest rate among all provinces.
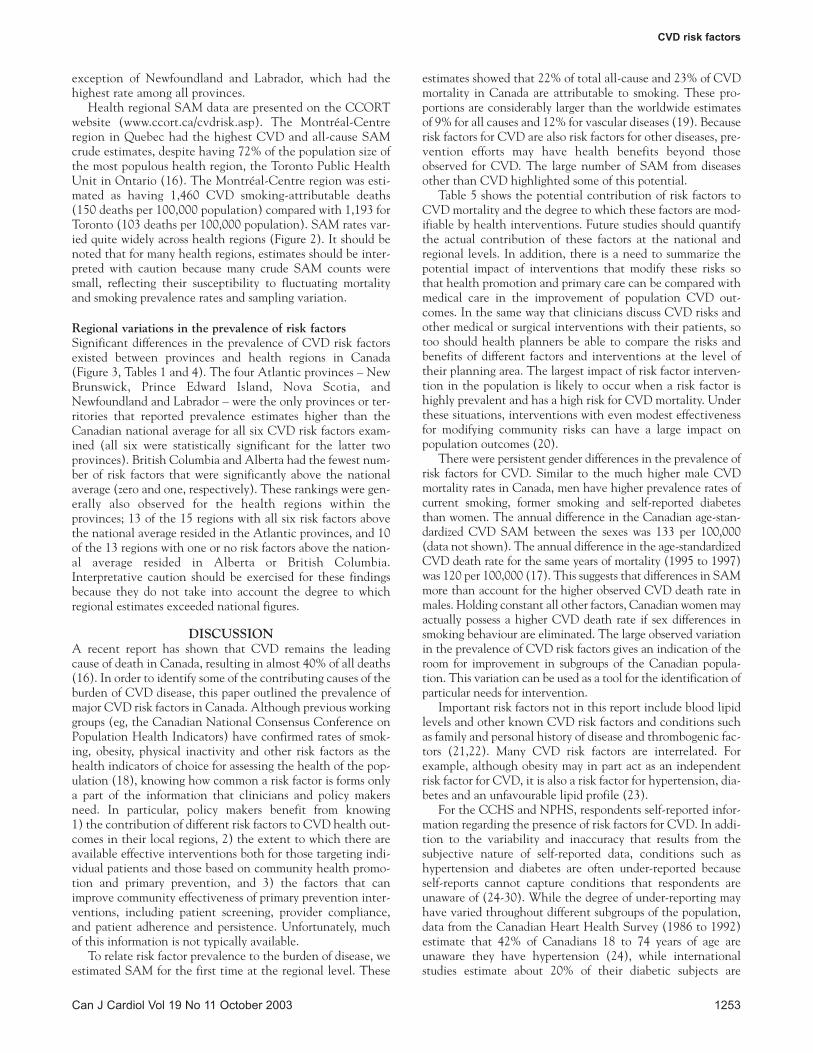
Health regional SAM data are presented on the CCORTwebsite (www.ccort.ca/cvdrisk.asp). The Montréal-Centreregion in Quebec had the highest CVD and all-cause SAMcrude estimates, despite having 72% of the population size ofthe most populous health region, the Toronto Public HealthUnit in Ontario (16). The Montréal-Centre region was esti-mated as having 1,460 CVD smoking-attributable deaths(150 deaths per 100,000 population) compared with 1,193 forToronto (103 deaths per 100,000 population). SAM rates var-ied quite widely across health regions (Figure 2). It should benoted that for many health regions, estimates should be inter-preted with caution because many crude SAM counts weresmall, reflecting their susceptibility to fluctuating mortalityand smoking prevalence rates and sampling variation.
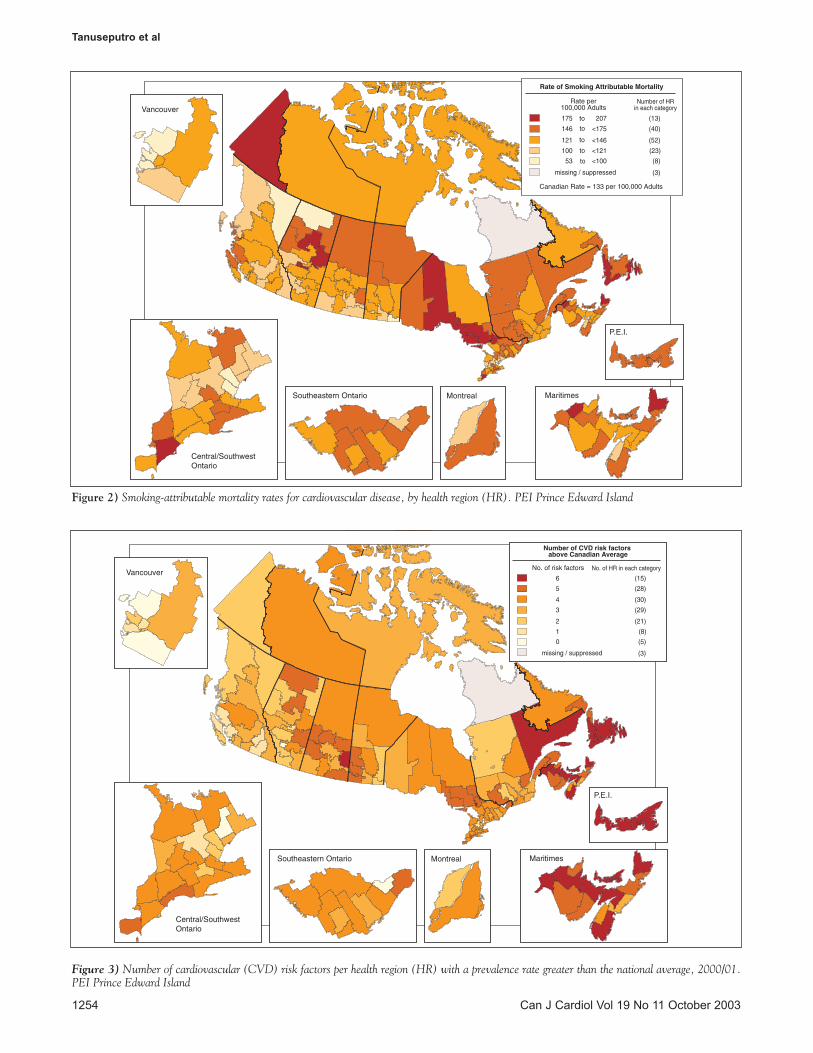
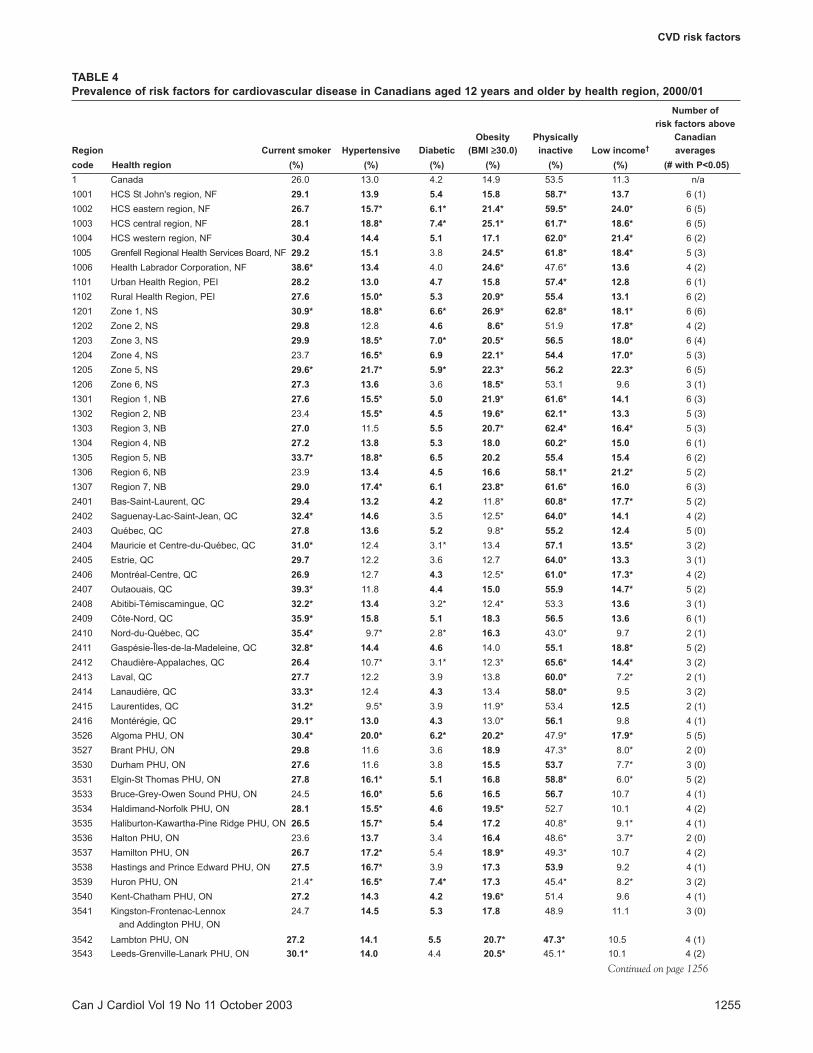
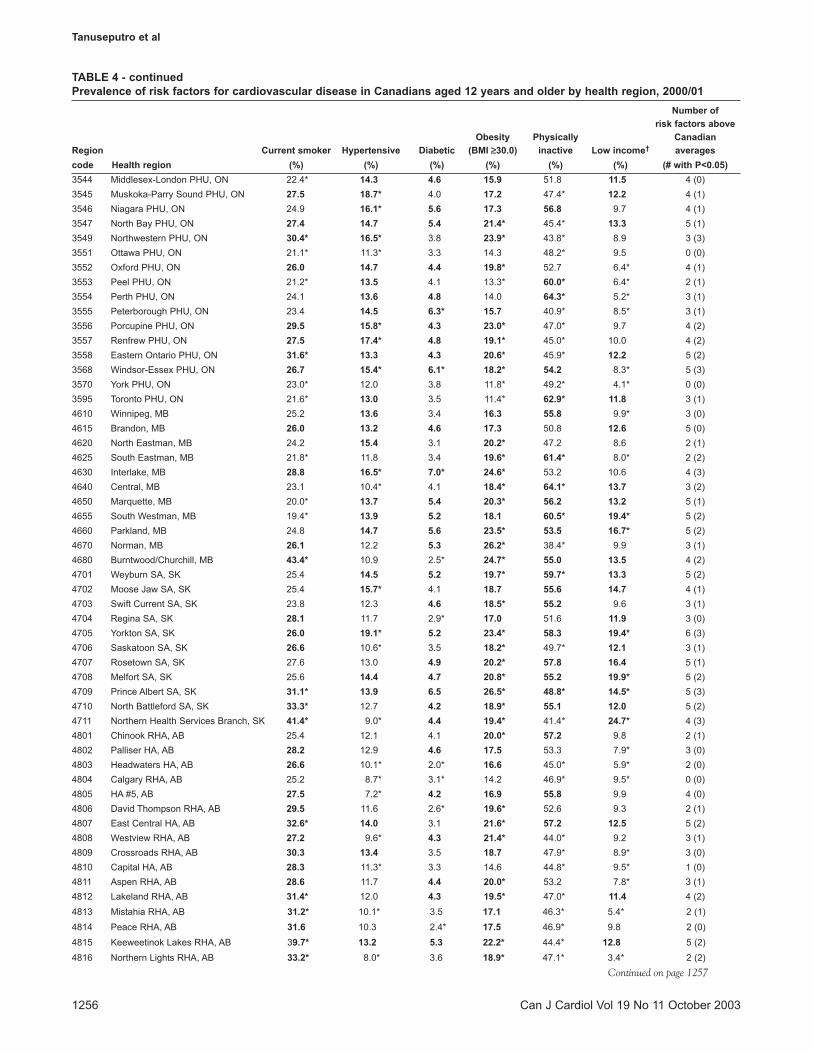
Regional variations in the prevalence of risk factorsSignificant differences in the prevalence of CVD risk factorsexisted between provinces and health regions in Canada(Figure 3, Tables 1 and 4). The four Atlantic provinces – NewBrunswick, Prince Edward Island, Nova Scotia, andNewfoundland and Labrador – were the only provinces or ter-ritories that reported prevalence estimates higher than theCanadian national average for all six CVD risk factors exam-ined (all six were statistically significant for the latter twoprovinces). British Columbia and Alberta had the fewest num-ber of risk factors that were significantly above the nationalaverage (zero and one, respectively). These rankings were gen-erally also observed for the health regions within theprovinces; 13 of the 15 regions with all six risk factors abovethe national average resided in the Atlantic provinces, and 10of the 13 regions with one or no risk factors above the nation-al average resided in Alberta or British Columbia.Interpretative caution should be exercised for these findingsbecause they do not take into account the degree to whichregional estimates exceeded national figures.
DISCUSSIONA recent report has shown that CVD remains the leadingcause of death in Canada, resulting in almost 40% of all deaths(16). In order to identify some of the contributing causes of theburden of CVD disease, this paper outlined the prevalence ofmajor CVD risk factors in Canada. Although previous workinggroups (eg, the Canadian National Consensus Conference onPopulation Health Indicators) have confirmed rates of smok-ing, obesity, physical inactivity and other risk factors as thehealth indicators of choice for assessing the health of the pop-ulation (18), knowing how common a risk factor is forms onlya part of the information that clinicians and policy makersneed. In particular, policy makers benefit from knowing 1) the contribution of different risk factors to CVD health out-comes in their local regions, 2) the extent to which there areavailable effective interventions both for those targeting indi-vidual patients and those based on community health promo-tion and primary prevention, and 3) the factors that canimprove community effectiveness of primary prevention inter-ventions, including patient screening, provider compliance,and patient adherence and persistence. Unfortunately, muchof this information is not typically available.
To relate risk factor prevalence to the burden of disease, weestimated SAM for the first time at the regional level. These
estimates showed that 22% of total all-cause and 23% of CVDmortality in Canada are attributable to smoking. These pro-portions are considerably larger than the worldwide estimatesof 9% for all causes and 12% for vascular diseases (19). Becauserisk factors for CVD are also risk factors for other diseases, pre-vention efforts may have health benefits beyond thoseobserved for CVD. The large number of SAM from diseasesother than CVD highlighted some of this potential.
Table 5 shows the potential contribution of risk factors toCVD mortality and the degree to which these factors are mod-ifiable by health interventions. Future studies should quantifythe actual contribution of these factors at the national andregional levels. In addition, there is a need to summarize thepotential impact of interventions that modify these risks sothat health promotion and primary care can be compared withmedical care in the improvement of population CVD out-comes. In the same way that clinicians discuss CVD risks andother medical or surgical interventions with their patients, sotoo should health planners be able to compare the risks andbenefits of different factors and interventions at the level oftheir planning area. The largest impact of risk factor interven-tion in the population is likely to occur when a risk factor ishighly prevalent and has a high risk for CVD mortality. Underthese situations, interventions with even modest effectivenessfor modifying community risks can have a large impact onpopulation outcomes (20).
There were persistent gender differences in the prevalence ofrisk factors for CVD. Similar to the much higher male CVDmortality rates in Canada, men have higher prevalence rates ofcurrent smoking, former smoking and self-reported diabetesthan women. The annual difference in the Canadian age-stan-dardized CVD SAM between the sexes was 133 per 100,000(data not shown). The annual difference in the age-standardizedCVD death rate for the same years of mortality (1995 to 1997)was 120 per 100,000 (17). This suggests that differences in SAMmore than account for the higher observed CVD death rate inmales. Holding constant all other factors, Canadian women mayactually possess a higher CVD death rate if sex differences insmoking behaviour are eliminated. The large observed variationin the prevalence of CVD risk factors gives an indication of theroom for improvement in subgroups of the Canadian popula-tion. This variation can be used as a tool for the identification ofparticular needs for intervention.
Important risk factors not in this report include blood lipidlevels and other known CVD risk factors and conditions suchas family and personal history of disease and thrombogenic fac-tors (21,22). Many CVD risk factors are interrelated. Forexample, although obesity may in part act as an independentrisk factor for CVD, it is also a risk factor for hypertension, dia-betes and an unfavourable lipid profile (23).
For the CCHS and NPHS, respondents self-reported infor-mation regarding the presence of risk factors for CVD. In addi-tion to the variability and inaccuracy that results from thesubjective nature of self-reported data, conditions such ashypertension and diabetes are often under-reported becauseself-reports cannot capture conditions that respondents areunaware of (24-30). While the degree of under-reporting mayhave varied throughout different subgroups of the population,data from the Canadian Heart Health Survey (1986 to 1992)estimate that 42% of Canadians 18 to 74 years of age areunaware they have hypertension (24), while internationalstudies estimate about 20% of their diabetic subjects are
CVD risk factors
Can J Cardiol Vol 19 No 11 October 2003 1253
Tanuseputro et al
Can J Cardiol Vol 19 No 11 October 20031254
Figure 2) Smoking-attributable mortality rates for cardiovascular disease, by health region (HR). PEI Prince Edward Island
Figure 3) Number of cardiovascular (CVD) risk factors per health region (HR) with a prevalence rate greater than the national average, 2000/01.PEI Prince Edward Island
CVD risk factors
Can J Cardiol Vol 19 No 11 October 2003 1255
TABLE 4Prevalence of risk factors for cardiovascular disease in Canadians aged 12 years and older by health region, 2000/01
Number of risk factors above
Obesity Physically CanadianRegion Current smoker Hypertensive Diabetic (BMI ≥≥30.0) inactive Low income† averagescode Health region (%) (%) (%) (%) (%) (%) (# with P<0.05)1 Canada 26.0 13.0 4.2 14.9 53.5 11.3 n/a1001 HCS St John's region, NF 29.1 13.9 5.4 15.8 58.7* 13.7 6 (1)1002 HCS eastern region, NF 26.7 15.7* 6.1* 21.4* 59.5* 24.0* 6 (5)1003 HCS central region, NF 28.1 18.8* 7.4* 25.1* 61.7* 18.6* 6 (5)1004 HCS western region, NF 30.4 14.4 5.1 17.1 62.0* 21.4* 6 (2)1005 Grenfell Regional Health Services Board, NF 29.2 15.1 3.8 24.5* 61.8* 18.4* 5 (3)1006 Health Labrador Corporation, NF 38.6* 13.4 4.0 24.6* 47.6* 13.6 4 (2)1101 Urban Health Region, PEI 28.2 13.0 4.7 15.8 57.4* 12.8 6 (1)1102 Rural Health Region, PEI 27.6 15.0* 5.3 20.9* 55.4 13.1 6 (2)1201 Zone 1, NS 30.9* 18.8* 6.6* 26.9* 62.8* 18.1* 6 (6)1202 Zone 2, NS 29.8 12.8 4.6 8.6* 51.9 17.8* 4 (2)1203 Zone 3, NS 29.9 18.5* 7.0* 20.5* 56.5 18.0* 6 (4)1204 Zone 4, NS 23.7 16.5* 6.9 22.1* 54.4 17.0* 5 (3)1205 Zone 5, NS 29.6* 21.7* 5.9* 22.3* 56.2 22.3* 6 (5)1206 Zone 6, NS 27.3 13.6 3.6 18.5* 53.1 9.6 3 (1)1301 Region 1, NB 27.6 15.5* 5.0 21.9* 61.6* 14.1 6 (3)1302 Region 2, NB 23.4 15.5* 4.5 19.6* 62.1* 13.3 5 (3)1303 Region 3, NB 27.0 11.5 5.5 20.7* 62.4* 16.4* 5 (3)1304 Region 4, NB 27.2 13.8 5.3 18.0 60.2* 15.0 6 (1)1305 Region 5, NB 33.7* 18.8* 6.5 20.2 55.4 15.4 6 (2)1306 Region 6, NB 23.9 13.4 4.5 16.6 58.1* 21.2* 5 (2)1307 Region 7, NB 29.0 17.4* 6.1 23.8* 61.6* 16.0 6 (3)2401 Bas-Saint-Laurent, QC 29.4 13.2 4.2 11.8* 60.8* 17.7* 5 (2)2402 Saguenay-Lac-Saint-Jean, QC 32.4* 14.6 3.5 12.5* 64.0* 14.1 4 (2)2403 Québec, QC 27.8 13.6 5.2 9.8* 55.2 12.4 5 (0)2404 Mauricie et Centre-du-Québec, QC 31.0* 12.4 3.1* 13.4 57.1 13.5* 3 (2)2405 Estrie, QC 29.7 12.2 3.6 12.7 64.0* 13.3 3 (1)2406 Montréal-Centre, QC 26.9 12.7 4.3 12.5* 61.0* 17.3* 4 (2)2407 Outaouais, QC 39.3* 11.8 4.4 15.0 55.9 14.7* 5 (2)2408 Abitibi-Témiscamingue, QC 32.2* 13.4 3.2* 12.4* 53.3 13.6 3 (1)2409 Côte-Nord, QC 35.9* 15.8 5.1 18.3 56.5 13.6 6 (1)2410 Nord-du-Québec, QC 35.4* 9.7* 2.8* 16.3 43.0* 9.7 2 (1)2411 Gaspésie-Îles-de-la-Madeleine, QC 32.8* 14.4 4.6 14.0 55.1 18.8* 5 (2)2412 Chaudière-Appalaches, QC 26.4 10.7* 3.1* 12.3* 65.6* 14.4* 3 (2)2413 Laval, QC 27.7 12.2 3.9 13.8 60.0* 7.2* 2 (1)2414 Lanaudière, QC 33.3* 12.4 4.3 13.4 58.0* 9.5 3 (2)2415 Laurentides, QC 31.2* 9.5* 3.9 11.9* 53.4 12.5 2 (1)2416 Montérégie, QC 29.1* 13.0 4.3 13.0* 56.1 9.8 4 (1)3526 Algoma PHU, ON 30.4* 20.0* 6.2* 20.2* 47.9* 17.9* 5 (5)3527 Brant PHU, ON 29.8 11.6 3.6 18.9 47.3* 8.0* 2 (0)3530 Durham PHU, ON 27.6 11.6 3.8 15.5 53.7 7.7* 3 (0)3531 Elgin-St Thomas PHU, ON 27.8 16.1* 5.1 16.8 58.8* 6.0* 5 (2)3533 Bruce-Grey-Owen Sound PHU, ON 24.5 16.0* 5.6 16.5 56.7 10.7 4 (1)3534 Haldimand-Norfolk PHU, ON 28.1 15.5* 4.6 19.5* 52.7 10.1 4 (2)3535 Haliburton-Kawartha-Pine Ridge PHU, ON 26.5 15.7* 5.4 17.2 40.8* 9.1* 4 (1)3536 Halton PHU, ON 23.6 13.7 3.4 16.4 48.6* 3.7* 2 (0)3537 Hamilton PHU, ON 26.7 17.2* 5.4 18.9* 49.3* 10.7 4 (2)3538 Hastings and Prince Edward PHU, ON 27.5 16.7* 3.9 17.3 53.9 9.2 4 (1)3539 Huron PHU, ON 21.4* 16.5* 7.4* 17.3 45.4* 8.2* 3 (2)3540 Kent-Chatham PHU, ON 27.2 14.3 4.2 19.6* 51.4 9.6 4 (1)3541 Kingston-Frontenac-Lennox 24.7 14.5 5.3 17.8 48.9 11.1 3 (0)
and Addington PHU, ON3542 Lambton PHU, ON 27.2 14.1 5.5 20.7* 47.3* 10.5 4 (1)3543 Leeds-Grenville-Lanark PHU, ON 30.1* 14.0 4.4 20.5* 45.1* 10.1 4 (2)
Continued on page 1256
Tanuseputro et al
Can J Cardiol Vol 19 No 11 October 20031256
TABLE 4 - continuedPrevalence of risk factors for cardiovascular disease in Canadians aged 12 years and older by health region, 2000/01
Number of risk factors above
Obesity Physically CanadianRegion Current smoker Hypertensive Diabetic (BMI ≥≥30.0) inactive Low income† averagescode Health region (%) (%) (%) (%) (%) (%) (# with P<0.05)3544 Middlesex-London PHU, ON 22.4* 14.3 4.6 15.9 51.8 11.5 4 (0)3545 Muskoka-Parry Sound PHU, ON 27.5 18.7* 4.0 17.2 47.4* 12.2 4 (1)3546 Niagara PHU, ON 24.9 16.1* 5.6 17.3 56.8 9.7 4 (1)3547 North Bay PHU, ON 27.4 14.7 5.4 21.4* 45.4* 13.3 5 (1)3549 Northwestern PHU, ON 30.4* 16.5* 3.8 23.9* 43.8* 8.9 3 (3)3551 Ottawa PHU, ON 21.1* 11.3* 3.3 14.3 48.2* 9.5 0 (0)3552 Oxford PHU, ON 26.0 14.7 4.4 19.8* 52.7 6.4* 4 (1)3553 Peel PHU, ON 21.2* 13.5 4.1 13.3* 60.0* 6.4* 2 (1)3554 Perth PHU, ON 24.1 13.6 4.8 14.0 64.3* 5.2* 3 (1)3555 Peterborough PHU, ON 23.4 14.5 6.3* 15.7 40.9* 8.5* 3 (1)3556 Porcupine PHU, ON 29.5 15.8* 4.3 23.0* 47.0* 9.7 4 (2)3557 Renfrew PHU, ON 27.5 17.4* 4.8 19.1* 45.0* 10.0 4 (2)3558 Eastern Ontario PHU, ON 31.6* 13.3 4.3 20.6* 45.9* 12.2 5 (2)3568 Windsor-Essex PHU, ON 26.7 15.4* 6.1* 18.2* 54.2 8.3* 5 (3)3570 York PHU, ON 23.0* 12.0 3.8 11.8* 49.2* 4.1* 0 (0)3595 Toronto PHU, ON 21.6* 13.0 3.5 11.4* 62.9* 11.8 3 (1)4610 Winnipeg, MB 25.2 13.6 3.4 16.3 55.8 9.9* 3 (0)4615 Brandon, MB 26.0 13.2 4.6 17.3 50.8 12.6 5 (0)4620 North Eastman, MB 24.2 15.4 3.1 20.2* 47.2 8.6 2 (1)4625 South Eastman, MB 21.8* 11.8 3.4 19.6* 61.4* 8.0* 2 (2)4630 Interlake, MB 28.8 16.5* 7.0* 24.6* 53.2 10.6 4 (3)4640 Central, MB 23.1 10.4* 4.1 18.4* 64.1* 13.7 3 (2)4650 Marquette, MB 20.0* 13.7 5.4 20.3* 56.2 13.2 5 (1)4655 South Westman, MB 19.4* 13.9 5.2 18.1 60.5* 19.4* 5 (2)4660 Parkland, MB 24.8 14.7 5.6 23.5* 53.5 16.7* 5 (2)4670 Norman, MB 26.1 12.2 5.3 26.2* 38.4* 9.9 3 (1)4680 Burntwood/Churchill, MB 43.4* 10.9 2.5* 24.7* 55.0 13.5 4 (2)4701 Weyburn SA, SK 25.4 14.5 5.2 19.7* 59.7* 13.3 5 (2)4702 Moose Jaw SA, SK 25.4 15.7* 4.1 18.7 55.6 14.7 4 (1)4703 Swift Current SA, SK 23.8 12.3 4.6 18.5* 55.2 9.6 3 (1)4704 Regina SA, SK 28.1 11.7 2.9* 17.0 51.6 11.9 3 (0)4705 Yorkton SA, SK 26.0 19.1* 5.2 23.4* 58.3 19.4* 6 (3)4706 Saskatoon SA, SK 26.6 10.6* 3.5 18.2* 49.7* 12.1 3 (1)4707 Rosetown SA, SK 27.6 13.0 4.9 20.2* 57.8 16.4 5 (1)4708 Melfort SA, SK 25.6 14.4 4.7 20.8* 55.2 19.9* 5 (2)4709 Prince Albert SA, SK 31.1* 13.9 6.5 26.5* 48.8* 14.5* 5 (3)4710 North Battleford SA, SK 33.3* 12.7 4.2 18.9* 55.1 12.0 5 (2)4711 Northern Health Services Branch, SK 41.4* 9.0* 4.4 19.4* 41.4* 24.7* 4 (3)4801 Chinook RHA, AB 25.4 12.1 4.1 20.0* 57.2 9.8 2 (1)4802 Palliser HA, AB 28.2 12.9 4.6 17.5 53.3 7.9* 3 (0)4803 Headwaters HA, AB 26.6 10.1* 2.0* 16.6 45.0* 5.9* 2 (0)4804 Calgary RHA, AB 25.2 8.7* 3.1* 14.2 46.9* 9.5* 0 (0)4805 HA #5, AB 27.5 7.2* 4.2 16.9 55.8 9.9 4 (0)4806 David Thompson RHA, AB 29.5 11.6 2.6* 19.6* 52.6 9.3 2 (1)4807 East Central HA, AB 32.6* 14.0 3.1 21.6* 57.2 12.5 5 (2)4808 Westview RHA, AB 27.2 9.6* 4.3 21.4* 44.0* 9.2 3 (1)4809 Crossroads RHA, AB 30.3 13.4 3.5 18.7 47.9* 8.9* 3 (0)4810 Capital HA, AB 28.3 11.3* 3.3 14.6 44.8* 9.5* 1 (0)4811 Aspen RHA, AB 28.6 11.7 4.4 20.0* 53.2 7.8* 3 (1)4812 Lakeland RHA, AB 31.4* 12.0 4.3 19.5* 47.0* 11.4 4 (2)4813 Mistahia RHA, AB 31.2* 10.1* 3.5 17.1 46.3* 5.4* 2 (1)4814 Peace RHA, AB 31.6 10.3 2.4* 17.5 46.9* 9.8 2 (0)4815 Keeweetinok Lakes RHA, AB 39.7* 13.2 5.3 22.2* 44.4* 12.8 5 (2)4816 Northern Lights RHA, AB 33.2* 8.0* 3.6 18.9* 47.1* 3.4* 2 (2)
Continued on page 1257
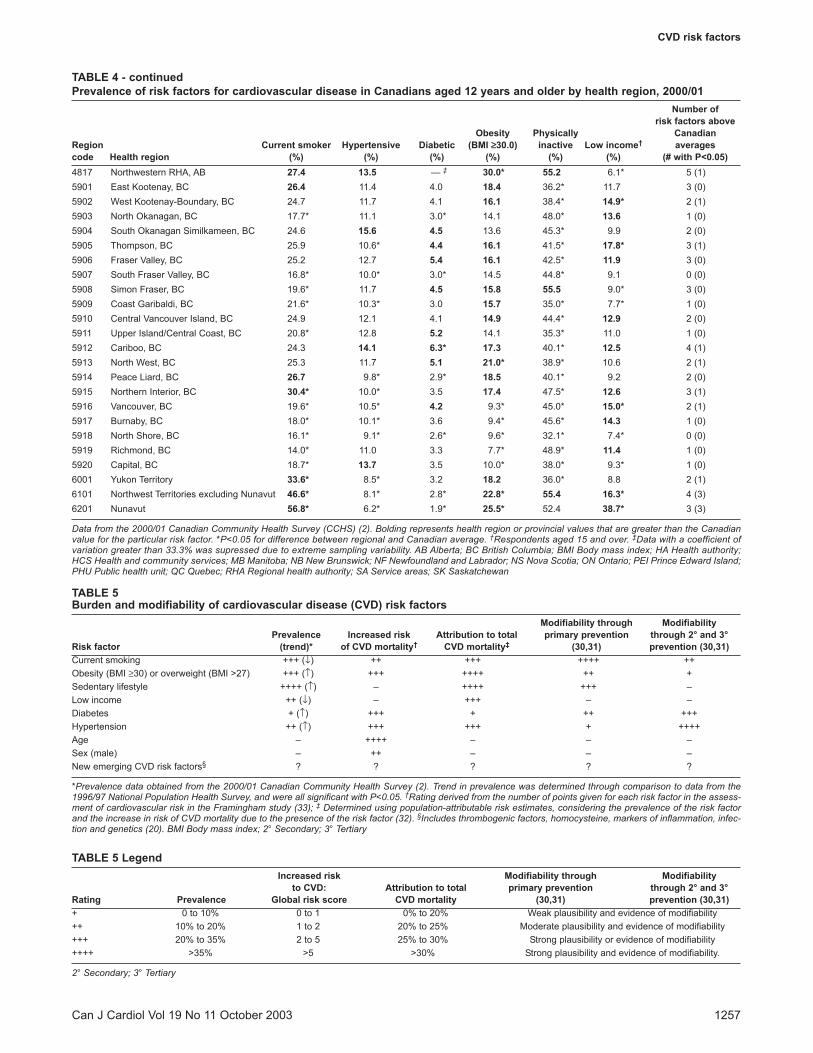
TABLE 4 - continuedPrevalence of risk factors for cardiovascular disease in Canadians aged 12 years and older by health region, 2000/01
Number of risk factors above
Obesity Physically CanadianRegion Current smoker Hypertensive Diabetic (BMI ≥≥30.0) inactive Low income† averagescode Health region (%) (%) (%) (%) (%) (%) (# with P<0.05)4817 Northwestern RHA, AB 27.4 13.5 — ‡ 30.0* 55.2 6.1* 5 (1)5901 East Kootenay, BC 26.4 11.4 4.0 18.4 36.2* 11.7 3 (0)5902 West Kootenay-Boundary, BC 24.7 11.7 4.1 16.1 38.4* 14.9* 2 (1)5903 North Okanagan, BC 17.7* 11.1 3.0* 14.1 48.0* 13.6 1 (0)5904 South Okanagan Similkameen, BC 24.6 15.6 4.5 13.6 45.3* 9.9 2 (0)5905 Thompson, BC 25.9 10.6* 4.4 16.1 41.5* 17.8* 3 (1)5906 Fraser Valley, BC 25.2 12.7 5.4 16.1 42.5* 11.9 3 (0)5907 South Fraser Valley, BC 16.8* 10.0* 3.0* 14.5 44.8* 9.1 0 (0)5908 Simon Fraser, BC 19.6* 11.7 4.5 15.8 55.5 9.0* 3 (0)5909 Coast Garibaldi, BC 21.6* 10.3* 3.0 15.7 35.0* 7.7* 1 (0)5910 Central Vancouver Island, BC 24.9 12.1 4.1 14.9 44.4* 12.9 2 (0)5911 Upper Island/Central Coast, BC 20.8* 12.8 5.2 14.1 35.3* 11.0 1 (0)5912 Cariboo, BC 24.3 14.1 6.3* 17.3 40.1* 12.5 4 (1)5913 North West, BC 25.3 11.7 5.1 21.0* 38.9* 10.6 2 (1)5914 Peace Liard, BC 26.7 9.8* 2.9* 18.5 40.1* 9.2 2 (0)5915 Northern Interior, BC 30.4* 10.0* 3.5 17.4 47.5* 12.6 3 (1)5916 Vancouver, BC 19.6* 10.5* 4.2 9.3* 45.0* 15.0* 2 (1)5917 Burnaby, BC 18.0* 10.1* 3.6 9.4* 45.6* 14.3 1 (0)5918 North Shore, BC 16.1* 9.1* 2.6* 9.6* 32.1* 7.4* 0 (0)5919 Richmond, BC 14.0* 11.0 3.3 7.7* 48.9* 11.4 1 (0)5920 Capital, BC 18.7* 13.7 3.5 10.0* 38.0* 9.3* 1 (0)6001 Yukon Territory 33.6* 8.5* 3.2 18.2 36.0* 8.8 2 (1)6101 Northwest Territories excluding Nunavut 46.6* 8.1* 2.8* 22.8* 55.4 16.3* 4 (3)6201 Nunavut 56.8* 6.2* 1.9* 25.5* 52.4 38.7* 3 (3)
Data from the 2000/01 Canadian Community Health Survey (CCHS) (2). Bolding represents health region or provincial values that are greater than the Canadianvalue for the particular risk factor. *P<0.05 for difference between regional and Canadian average. †Respondents aged 15 and over. ‡Data with a coefficient ofvariation greater than 33.3% was supressed due to extreme sampling variability. AB Alberta; BC British Columbia; BMI Body mass index; HA Health authority;HCS Health and community services; MB Manitoba; NB New Brunswick; NF Newfoundland and Labrador; NS Nova Scotia; ON Ontario; PEI Prince Edward Island;PHU Public health unit; QC Quebec; RHA Regional health authority; SA Service areas; SK Saskatchewan
CVD risk factors
Can J Cardiol Vol 19 No 11 October 2003 1257
TABLE 5Burden and modifiability of cardiovascular disease (CVD) risk factors
Modifiability through Modifiability Prevalence Increased risk Attribution to total primary prevention through 2° and 3°
Risk factor (trend)* of CVD mortality† CVD mortality‡ (30,31) prevention (30,31)Current smoking +++ (↓) ++ +++ ++++ ++Obesity (BMI ≥30) or overweight (BMI >27) +++ (↑) +++ ++++ ++ +Sedentary lifestyle ++++ (↑) – ++++ +++ –Low income ++ (↓) – +++ – –Diabetes + (↑) +++ + ++ +++Hypertension ++ (↑) +++ +++ + ++++Age – ++++ – – –Sex (male) – ++ – – –New emerging CVD risk factors§ ? ? ? ? ?
*Prevalence data obtained from the 2000/01 Canadian Community Health Survey (2). Trend in prevalence was determined through comparison to data from the1996/97 National Population Health Survey, and were all significant with P<0.05. †Rating derived from the number of points given for each risk factor in the assess-ment of cardiovascular risk in the Framingham study (33); ‡ Determined using population-attributable risk estimates, considering the prevalence of the risk factorand the increase in risk of CVD mortality due to the presence of the risk factor (32). §Includes thrombogenic factors, homocysteine, markers of inflammation, infec-tion and genetics (20). BMI Body mass index; 2° Secondary; 3° Tertiary
TABLE 5 LegendIncreased risk Modifiability through Modifiability
to CVD: Attribution to total primary prevention through 2° and 3°Rating Prevalence Global risk score CVD mortality (30,31) prevention (30,31)+ 0 to 10% 0 to 1 0% to 20% Weak plausibility and evidence of modifiability++ 10% to 20% 1 to 2 20% to 25% Moderate plausibility and evidence of modifiability+++ 20% to 35% 2 to 5 25% to 30% Strong plausibility or evidence of modifiability++++ >35% >5 >30% Strong plausibility and evidence of modifiability.
2° Secondary; 3° Tertiary
unaware (26,29), and validation of self-reported diabetes fromthe NPHS suggested an unquantified level of under-reporting(30). Regional, age and sex comparisons of risk factor prevalenceshould be done cautiously because the large number of compar-isons may have led to differences caused by chance alone. Itshould also be noted that age-sex standardization was not con-ducted for any of the prevalence estimates presented. Althoughstandardization would allow fair comparisons between regions,crude estimates allow better assessment of the actual burden ofdisease in each population. There are several limitations andinterpretative cautions for the calculation of SAM estimatesresulting from error and variability for prevalence, mortality andrelative risk data.
CONCLUSIONSAs advances in medical and public health further our under-standing of CVD, our views on its risk factors and the role ofindividual and community interventions have broadenedbeyond genetic, health care and lifestyle factors to aspects of thesocial and economic environments. Previous reports such as the2003 Growing Burden of Heart Disease and Stroke in Canada (1)have, however, indicated the complexity of preventing CVD. Asuccessful prevention program requires coordination of primary,secondary and tertiary prevention, in addition to primordial pre-vention that addresses underlying conditions (including socialand economic concerns) that lead to exposure to causative fac-tors.
ACKNOWLEDGEMENTS: Dr Manuel is a Career Scientist ofthe Ontario Ministry of Health and Long Term Care. TheCCORT Canadian Cardiovascular Atlas project was supported byoperating grants to the Canadian Cardiovascular OutcomesResearch Team from the Canadian Institutes for Health ResearchInterdisciplinary Health Research Team program and the Heartand Stroke Foundation. Support of this manuscript was alsoobtained from an operating grant to the Population Health ImpactAssessment Team from the Canadian Population Health InitiativeThe results, conclusions and opinions are those of the authors, andno endorsement by the Institute for Clinical Evaluative Sciencesor Statistics Canada should be assumed. The authors would like toacknowledge CCORT Research Coordinators Courtney Kennedyand Susan Brien for their work in the organization, editing andfinal production of this manuscript. Additional recognition is giv-en to Brian Graves and Courtney Kennedy for producing anddesigning the maps featured in the manuscript.
Tanuseputro et al
Can J Cardiol Vol 19 No 11 October 20031258
APPENDIX AInternational Classification of Diseases, Ninth Revision[ICD-9] codes signifying most responsible underlyingcondition on death certificate (used for smoking-attributable mortality calculations)Disease group (k) Cause of death ICD-9-CM codeNeoplasms1 Lip, oral cavity, pharynx 140 to 1492 Esophagus 1503 Pancreas 1574 Larynx 1615 Trachea, lung, bronchus 1626 Cervix uteri 1807 Urinary bladder 1888 Kidney, other urinary 189Cardiovascular diseases9 Rheumatic heart disease 390 to 39810 Hypertension 401 to 40411 Ischemic heart disease 410 to 41412 Pulmonary heart disease 415 to 41713 Cardiac arrest/other heart disease 420 to 42914 Cerebrovascular disease 430 to 43815 Atherosclerosis 44016 Aortic aneurysm 44117 Other arterial disease 442 to 448Respiratory diseases18 Respiratory tuberculosis 010 to 01219 Pneumonia, influenza 480 to 48720 Bronchitis, emphysema 490 to 49221 Asthma 49322 Chronic airway obstruction 496
REFERENCES1. Heart and Stroke Foundation of Canada. The Growing Burden of
Heart Disease and Stroke in Canada 2003. Ottawa: Heart and StrokeFoundation of Canada, 2003.
2. Statistics Canada. The Canadian Community Health Survey(CCHS). Statistics Canada Cycle 1.1. Ottawa: Statistics Canada,2003.
3. Canadian Community Health Survey/National Public HealthSurvey. An Improved Health Survey Program at Statistics Canada.Proceedings of the section on Survey Research Methods. Ottawa:American Statistical Association, 2000.
4. BOOTMAC8.SAS User Guide. Ottawa: Statistics Canada, 2002.5. Rao J, Wu C, Yue K. Some recent work on resampling methods for
complex surveys. Survey Methodol 1992;18:209-17.6. Rust KF, Rao JN. Variance estimation for complex surveys using
replication techniques. Stat Methods Med Res 1996;5:283-310.7. Bootstrap variance estimation for the National Population Health
Survey. Proceedings of the Survey Research Methods Section.Baltimore: American Statistical Association, 1999.
8. Statistics Canada. Mortality - Summary List of Causes, 1997. Ottawa:Statistics Canada, 1999.
9. Centers for Disease Control and Prevention. Reducing the HealthConsequences of Smoking: 25 Years of Progress. Atlanta: Centers forDisease Control and Prevention, 1989.
10. Thun MJ, Myers DG, Day-Lally C, et al. Age and the exposure-response relationships between cigarette smoking and prematuredeath in cancer prevention study II. In: Burns DM, Garfinkel L,Samet JM, eds. Monograph 8: Changes in Cigarette-Related DiseaseRisks and Their Implications for Prevention and Control. Bethesda:National Cancer Institute, 1996:383-476.
11. Kuczmarski RJ, Flegal KM. Criteria for definition of overweight intransition: Background and recommendations for the United States.Am J Clin Nutr 2000;72:1074-81.
12. Canadian Community Health Survey (CCHS) Cycle 1.1: DerivedVariable (DV) Specifications. Ottawa: Statistics Canada, 2002.
13. Levin ML. The occurrence of lung cancer in man. Acta UnioInternationalis Contra Cancrum 1953;9:531-41.
14. Smoking-Attributable Mortality, Morbidity, and Economic Costs[SAMMEC]. Atlanta: Centers for Disease Control and Prevention,1996.
15. Gilmore J. Report on Smoking Prevalence in Canada, 1985 to 1999.82F0077XIE, 1-34. Ottawa: Statistics Canada, 2000.
16. Population by sex, Canada, provinces, territories and health regions.Statistics Canada, Demography Division website<http://cansim2.statcan.ca/> (Version current at September 25,2003).
17. Manuel DG, Leung M, Nguyen K, Tanuseputro P, Johansen HL.Burden of cardiovascular disease in Canada. Can J Cardiol2003;19(9):997-1004.
18. Canadian Institute for Health Information. National ConsensusConference on Population Health Indicators. Final Report. Ottawa:Canadian Institute for Health Information, 1999.
CVD risk factors
Can J Cardiol Vol 19 No 11 October 2003 1259
19. World Health Organization. World Health Report 2002. ReducingRisks: Promoting Healthy Life. Geneva: World Health Organization,2002.
20. Rose GA. The strategy of preventive medicine. New York: OxfordUniversity Press, 1992.
21. Wood D. Established and emerging cardiovascular risk factors. AmHeart J 2001;141(Suppl 2):S49-57.
22. Grundy SM, Pasternak R, Greenland P, Smith S Jr, Fuster V.Assessment of cardiovascular risk by use of multiple-risk-factorassessment equations: A statement for healthcare professionals fromthe American Heart Association and the American College ofCardiology. Circulation 1999;100:1481-92.
23. Hubert HB, Feinleib M, McNamara PM, Castelli WP. Obesity as anindependent risk factor for cardiovascular disease: A 26-year follow-up of participants in the Framingham Heart Study.Circulation 1983;67:968-77.
24. Giles WH, Croft JB, Keenan NL, Lane MJ, Wheeler FC. Thevalidity of self-reported hypertension and correlates of hypertensionawareness among blacks and whites within the stroke belt. Am JPrev Med 1995;11:163-9.
25. Joffres MR, Ghadirian P, Fodor JG, Petrasovits A, Chockalingam A,Hamet P. Awareness, treatment and control of hypertension inCanada. Am J Hypertens 1997;10:1097-102.
26. Gnasso A, Calindro MC, Carallo C, et al. Awareness, treatment andcontrol of hyperlipidaemia, hypertension and diabetes mellitus in aselected population of southern Italy. Eur J Epidemiol 1997;13:421-8.
27. Colditz GA, Martin P, Stampfer MJ, et al. Validation of questionnaire
information on risk factors and disease outcomes in a prospectivecohort study of women. Am J Epidemiol 1986;123:894-900.
28. Joffres MR, Hamet P, Rabkin SW, Gelskey D, Hogan K, Fodor G.Prevalence, control and awareness of high blood pressure amongCanadian adults. Canadian Heart Health Surveys Research Group.CMAJ 1992;146:1997-2005.
29. Mackenbach JP, Looman CW, van der Meer JB. Differences in themisreporting of chronic conditions, by level of education: Theeffect on inequalities in prevalence rates. Am J Public Health1996;86:706-11.
30. Hux JE, Ivis F, Flintoft V, Bica A. Diabetes in Ontario:Determination of prevalence and incidence using a validatedadministrative data algorithm. Diabetes Care 2002;25:512-6.
31. Forrester JS, Merz CN, Bush TL, Cohn JN, Hunninghake DB,Parthasarathy S, Superko HR. Matching the Intensity of Risk FactorManagement with the Hazard for Coronary Disease Events. 27thBethesda Conference, September 14-15, 1995. J Am Coll Cardiol1996;27:957-1047.
32. New Zealand Public Health Intelligence. Evidence-based healthobjectives for the New Zealand Health Strategy. OccasionalBulletin Number 2. New Zealand: New Zealand Public HealthIntelligence, 2001.
33. Public health focus: Physical activity and the prevention of coronaryheart disease. MMWR Morb Mortal Wkly Rep 1993;42:669-72.
34. Wilson PW, D’Agostino RB, Levy D, Belanger AM, Silbershatz H,Kannel WB. Prediction of coronary heart disease using risk factorcategories. Circulation 1998;97:1837-47.
Related Documents