SEATTLE | 206.622.3700 LOS ANGELES | 310.297.1777 www.wurts.com February 2012 RISK ALLOCATION IN THE 21 ST CENTURY

Welcome message from author
This document is posted to help you gain knowledge. Please leave a comment to let me know what you think about it! Share it to your friends and learn new things together.
Transcript
SEATTLE | 206.622.3700 LOS ANGELES | 310.297.1777 www.wurts.com
February 2012
RISK ALLOCATION IN THE 21ST CENTURY
A G E N D A
2
INVESTMENT APPROACH
SAMPLE RISK DASHBOARD
GOVERNANCE
I N V E S T M E N T A P P R O A C H
3
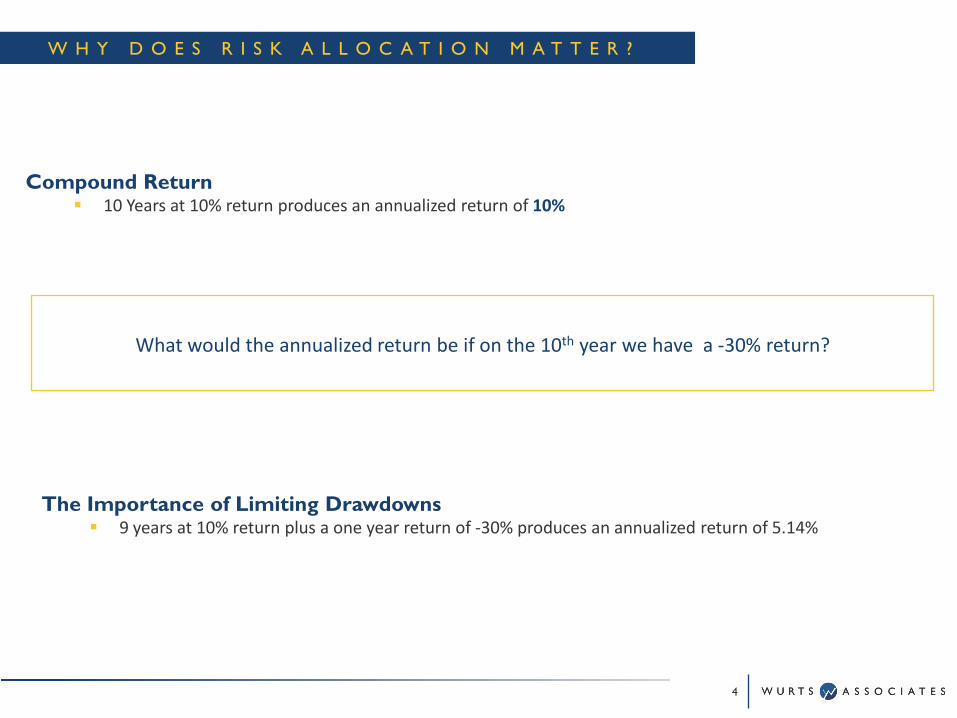
Compound Return 10 Years at 10% return produces an annualized return of 10%
What would the annualized return be if on the 10th year we have a -30% return?
The Importance of Limiting Drawdowns 9 years at 10% return plus a one year return of -30% produces an annualized return of 5.14%
4
W H Y D O E S R I S K A L L O C A T I O N M A T T E R ?
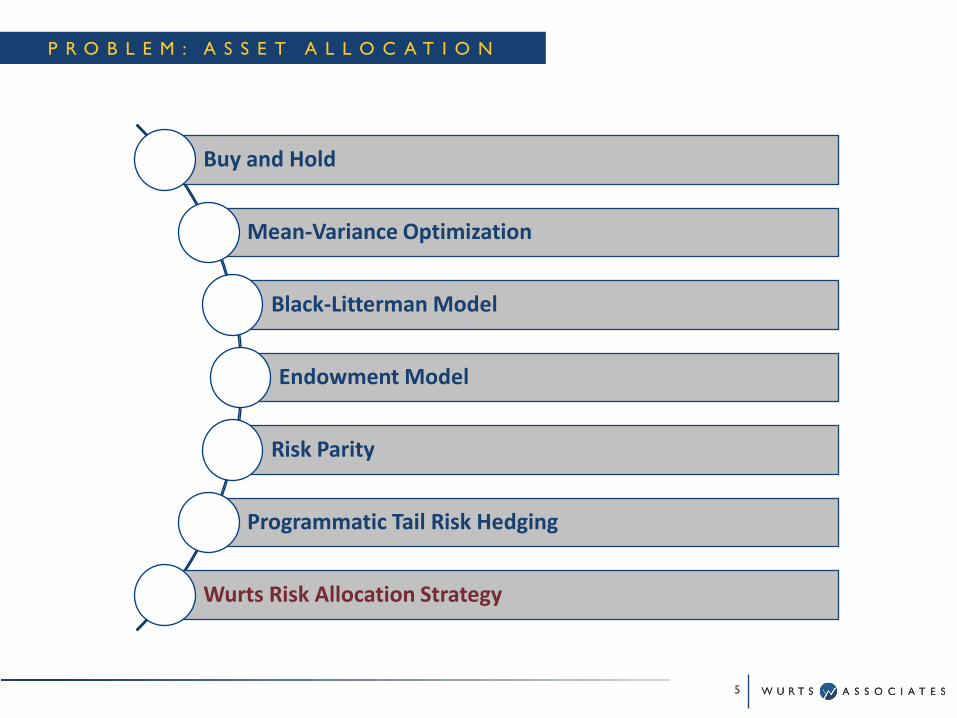
P R O B L E M : A S S E T A L L O C A T I O N
Buy and Hold
Mean-Variance Optimization
Black-Litterman Model
Endowment Model
Risk Parity
Programmatic Tail Risk Hedging
Wurts Risk Allocation Strategy
5
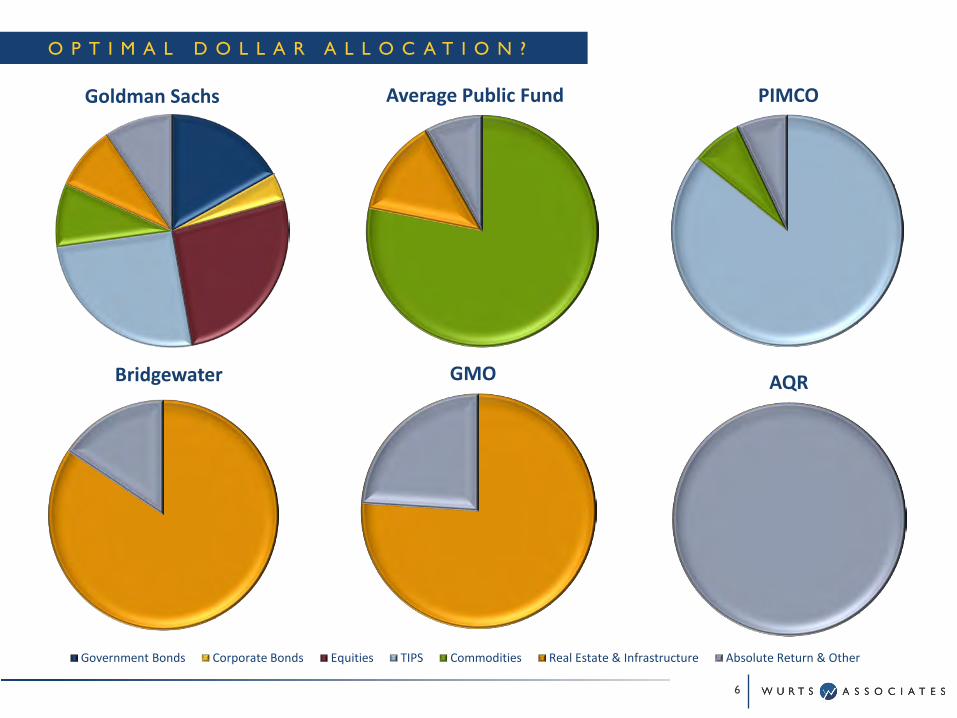
Government Bonds Corporate Bonds Equities TIPS Commodities Real Estate & Infrastructure Absolute Return & Other
O P T I M A L D O L L A R A L L O C A T I O N ?
Average Public Fund
Bridgewater GMO AQR
PIMCOGoldman Sachs
6
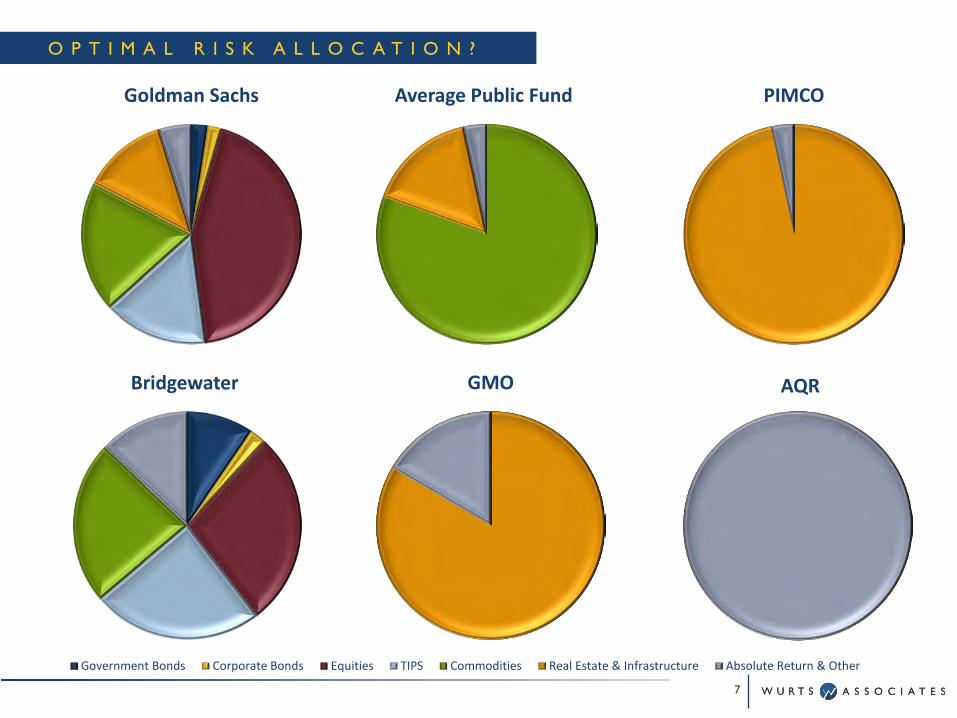
Government Bonds Corporate Bonds Equities TIPS Commodities Real Estate & Infrastructure Absolute Return & Other
Average Public FundGoldman Sachs PIMCO
Bridgewater AQRGMO
O P T I M A L R I S K A L L O C A T I O N ?
7
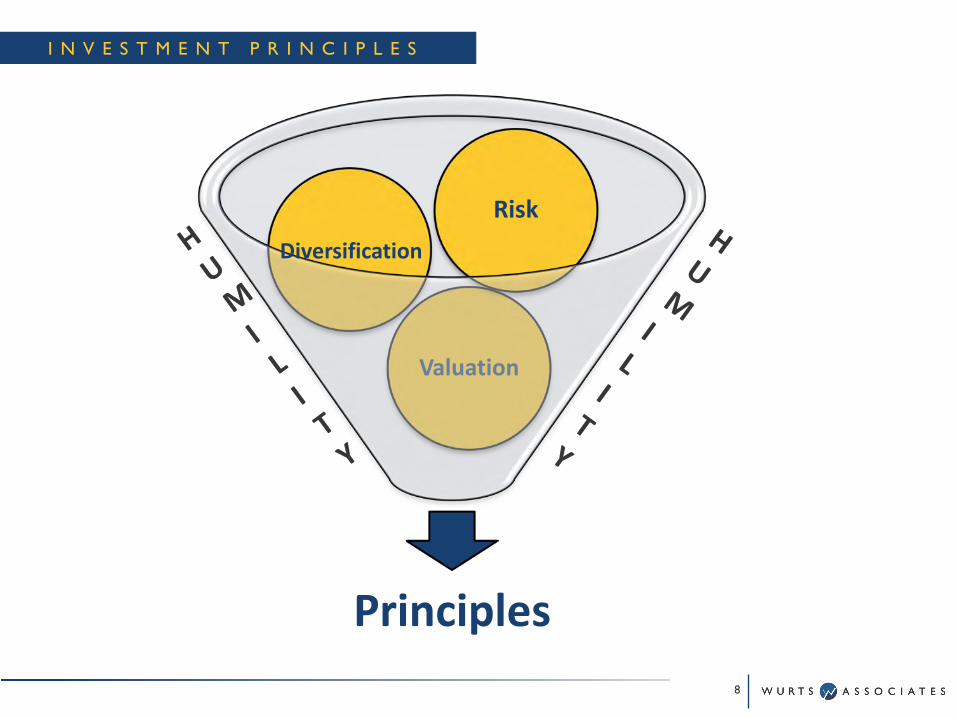
I N V E S T M E N T P R I N C I P L E S
Principles
Valuation
Risk
Diversification
8
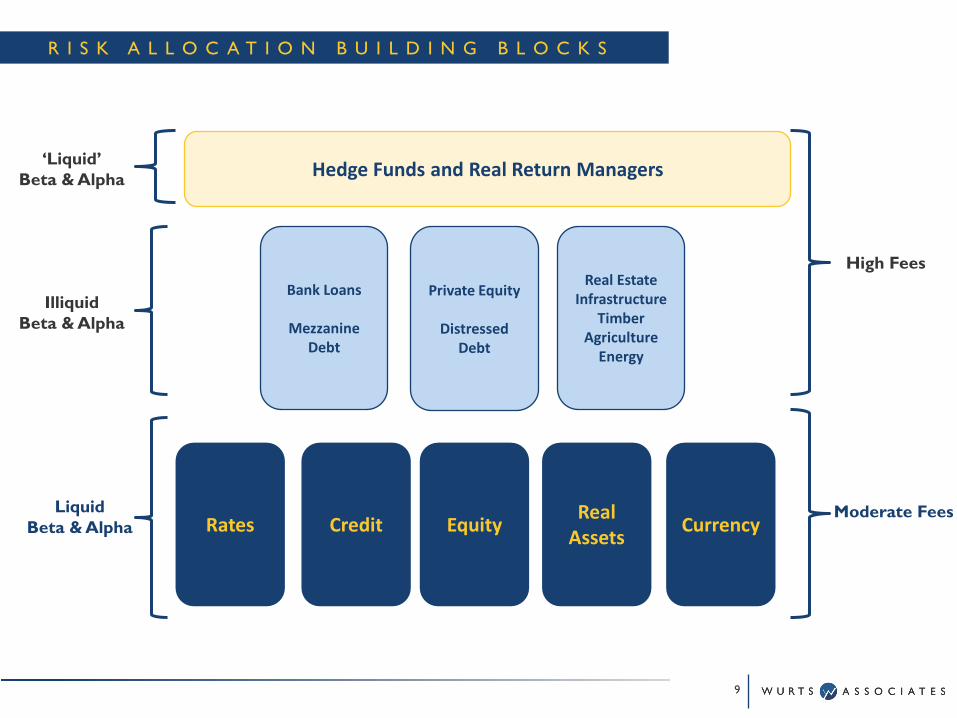
R I S K A L L O C A T I O N B U I L D I N G B L O C K S
‘Liquid’Beta & Alpha
Illiquid Beta & Alpha
Liquid Beta & Alpha
High Fees
Moderate Fees
Hedge Funds and Real Return Managers
Real EstateInfrastructure
TimberAgriculture
Energy
Private Equity
Distressed Debt
Bank Loans
Mezzanine Debt
Rates Credit EquityReal
AssetsCurrency
9
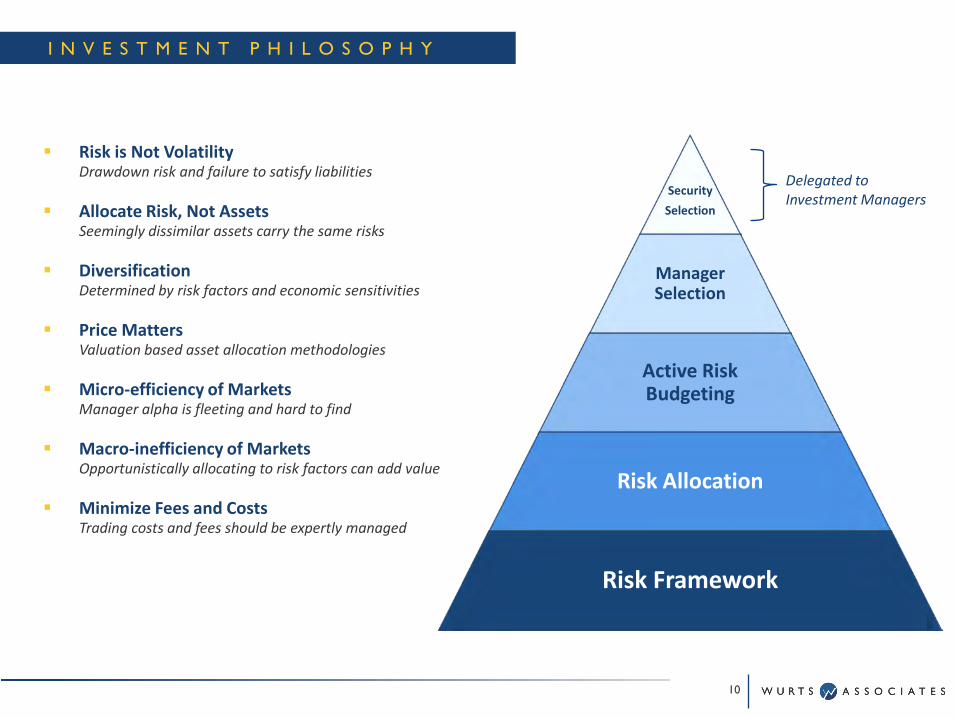
Security
Selection
Manager Selection
Active Risk Budgeting
Risk Allocation
Risk Framework
I N V E S T M E N T P H I L O S O P H Y
Risk is Not VolatilityDrawdown risk and failure to satisfy liabilities
Allocate Risk, Not AssetsSeemingly dissimilar assets carry the same risks
DiversificationDetermined by risk factors and economic sensitivities
Price MattersValuation based asset allocation methodologies
Micro-efficiency of Markets Manager alpha is fleeting and hard to find
Macro-inefficiency of Markets Opportunistically allocating to risk factors can add value
Minimize Fees and CostsTrading costs and fees should be expertly managed
Delegated to Investment Managers
10
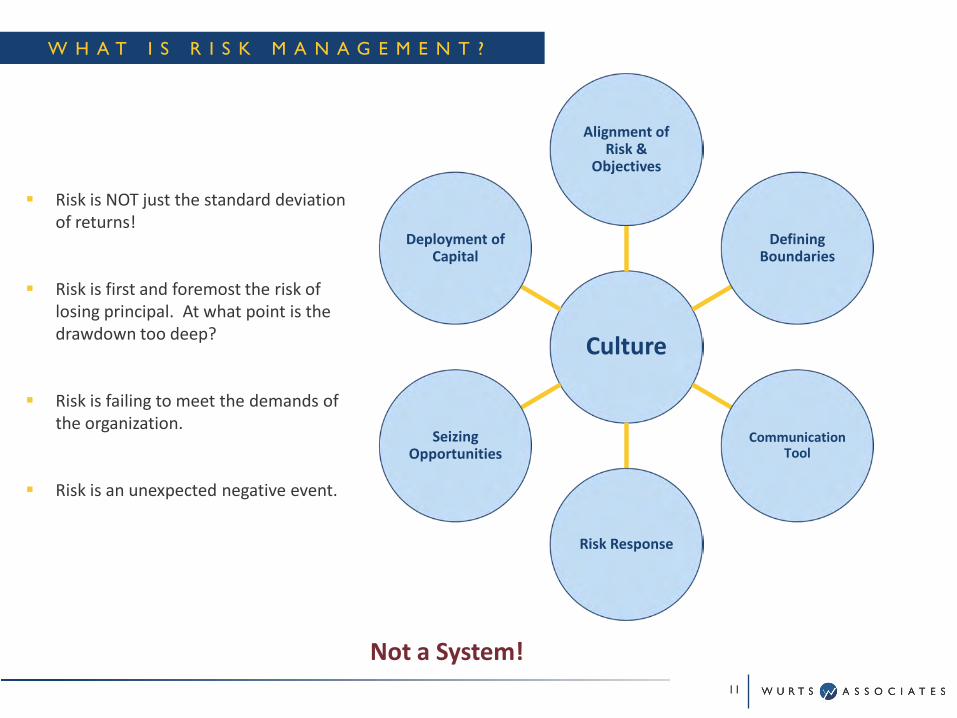
W H A T I S R I S K M A N A G E M E N T ?
Culture
Alignment of Risk &
Objectives
Defining Boundaries
Communication Tool
Risk Response
Seizing Opportunities
Deployment of Capital
Not a System!
Risk is NOT just the standard deviation of returns!
Risk is first and foremost the risk of losing principal. At what point is the drawdown too deep?
Risk is failing to meet the demands of the organization.
Risk is an unexpected negative event.
11
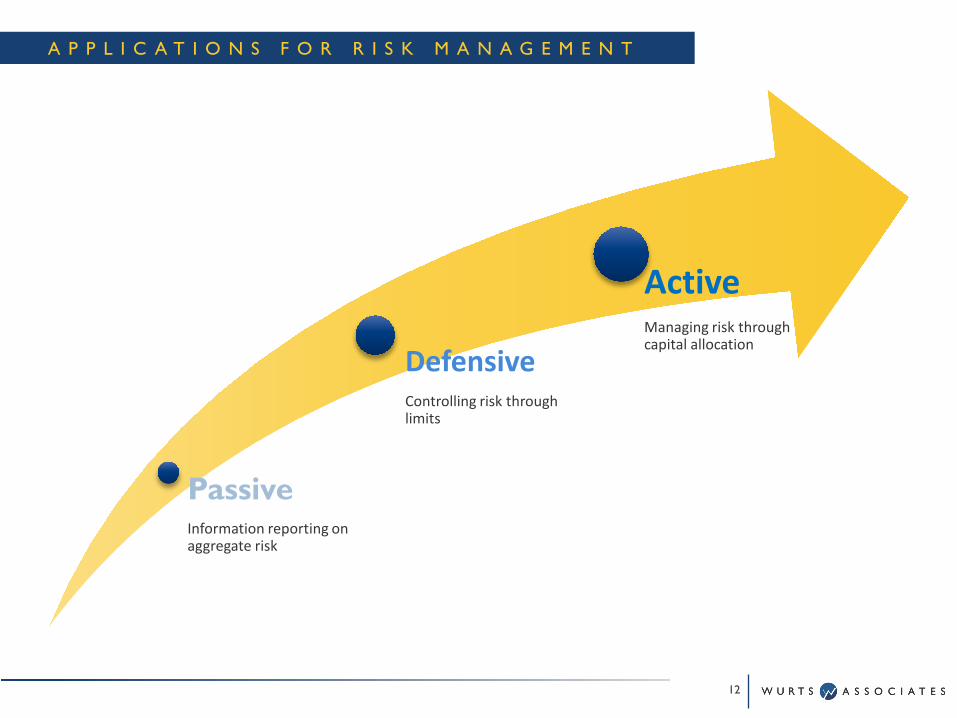
A P P L I C A T I O N S F O R R I S K M A N A G E M E N T
PassiveInformation reporting on aggregate risk
DefensiveControlling risk through limits
ActiveManaging risk through capital allocation
12
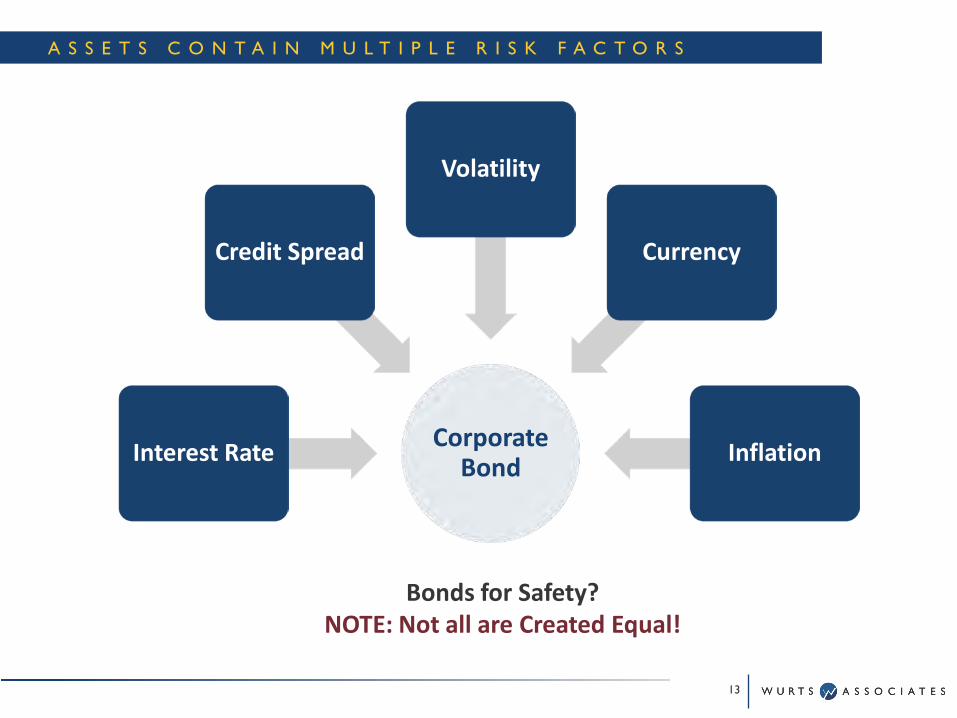
A S S E T S C O N T A I N M U L T I P L E R I S K F A C T O R S
Corporate BondInterest Rate
Credit Spread
Volatility
Currency
Inflation
Bonds for Safety?NOTE: Not all are Created Equal!
13
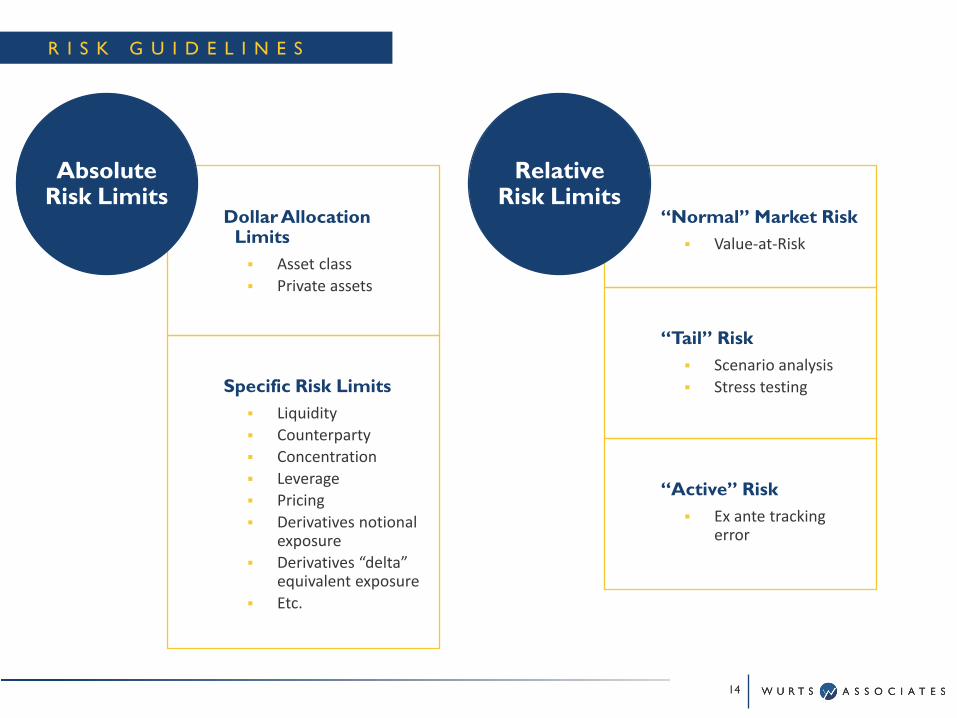
R I S K G U I D E L I N E S
Dollar Allocation Limits Asset class Private assets
Specific Risk Limits Liquidity Counterparty Concentration Leverage Pricing Derivatives notional
exposure Derivatives “delta”
equivalent exposure Etc.
Absolute Risk Limits
“Normal” Market Risk Value-at-Risk
“Tail” Risk Scenario analysis Stress testing
“Active” Risk Ex ante tracking
error
Relative Risk Limits
14
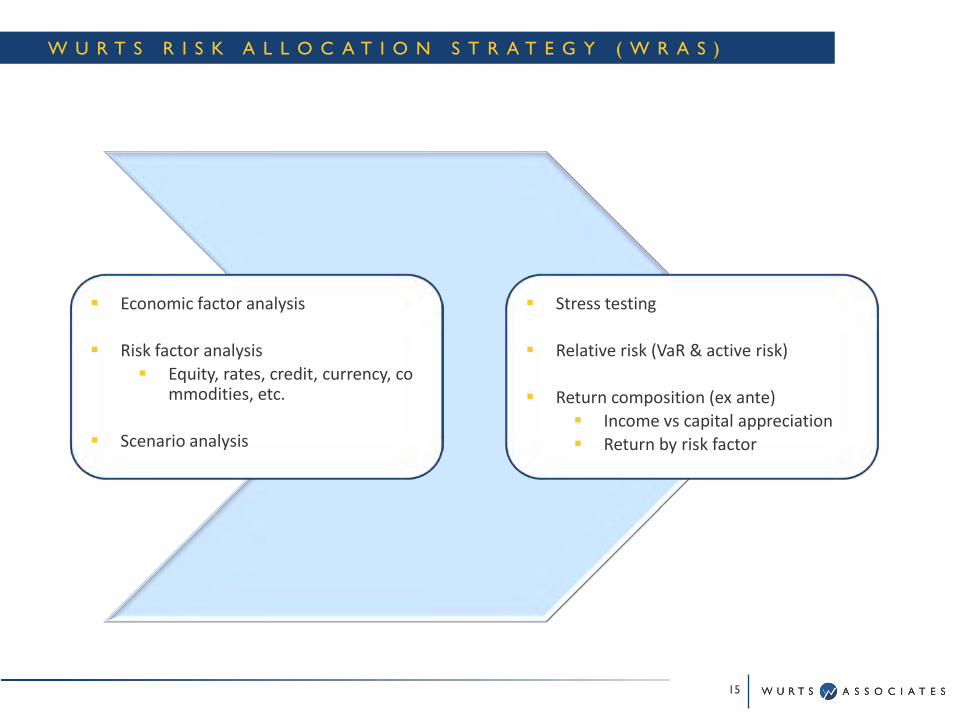
W U R T S R I S K A L L O C A T I O N S T R A T E G Y ( W R A S )
15
Economic factor analysis
Risk factor analysis Equity, rates, credit, currency, co
mmodities, etc.
Scenario analysis
Stress testing
Relative risk (VaR & active risk)
Return composition (ex ante) Income vs capital appreciation Return by risk factor
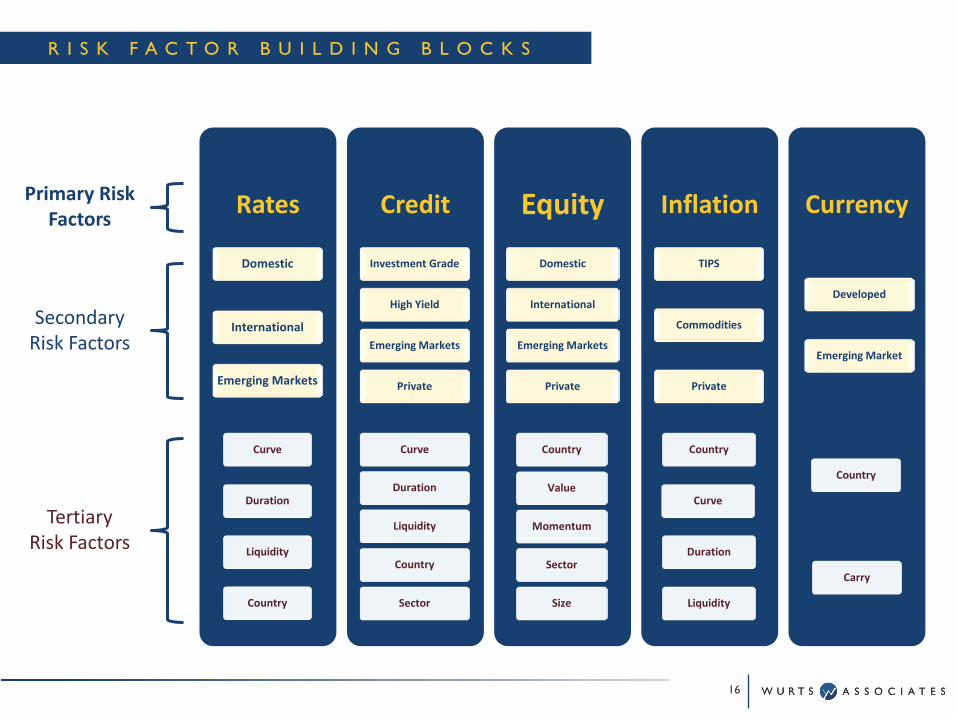
Rates
Domestic
International
Emerging Markets
Curve
Duration
Liquidity
Country
Credit
Investment Grade
High Yield
Emerging Markets
Private
Curve
Duration
Liquidity
Country
Sector
Equity
Domestic
International
Emerging Markets
Private
Country
Value
Momentum
Sector
Size
Inflation
TIPS
Commodities
Private
Country
Curve
Duration
Liquidity
Currency
Developed
Emerging Market
Country
Carry
Primary Risk Factors
Secondary Risk Factors
TertiaryRisk Factors
R I S K F A C T O R B U I L D I N G B L O C K S
16
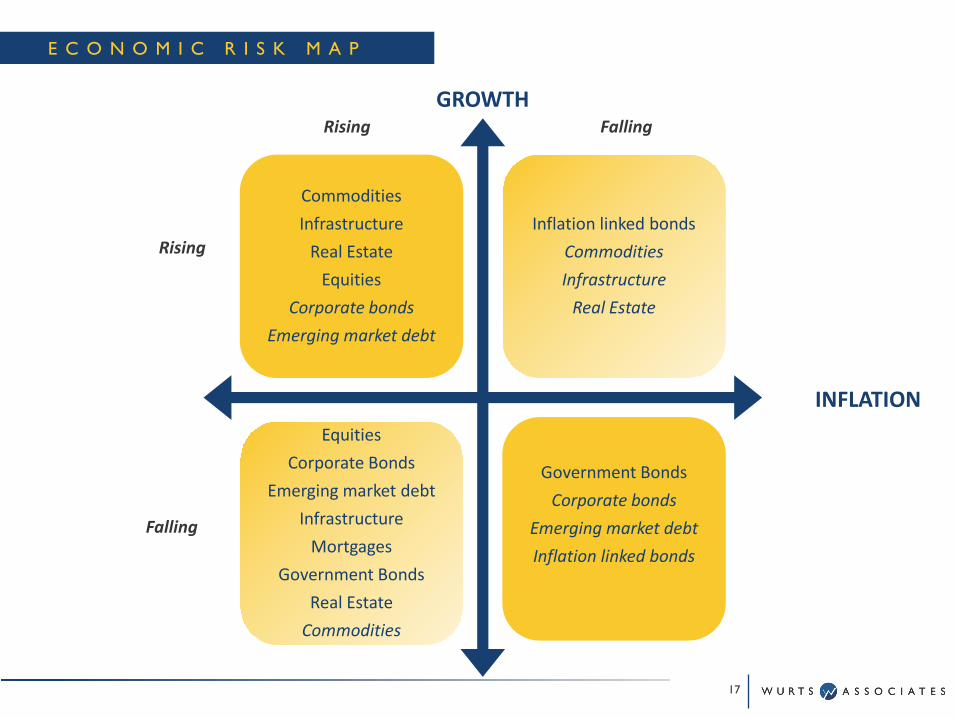
Commodities
Infrastructure
Real Estate
Equities
Corporate bonds
Emerging market debt
Inflation linked bonds
Commodities
Infrastructure
Real Estate
Equities
Corporate Bonds
Emerging market debt
Infrastructure
Mortgages
Government Bonds
Real Estate
Commodities
Government Bonds
Corporate bonds
Emerging market debt
Inflation linked bonds
GROWTHRising Falling
INFLATION
Rising
Falling
E C O N O M I C R I S K M A P
17
I N V E S T M E N T P R O C E S S
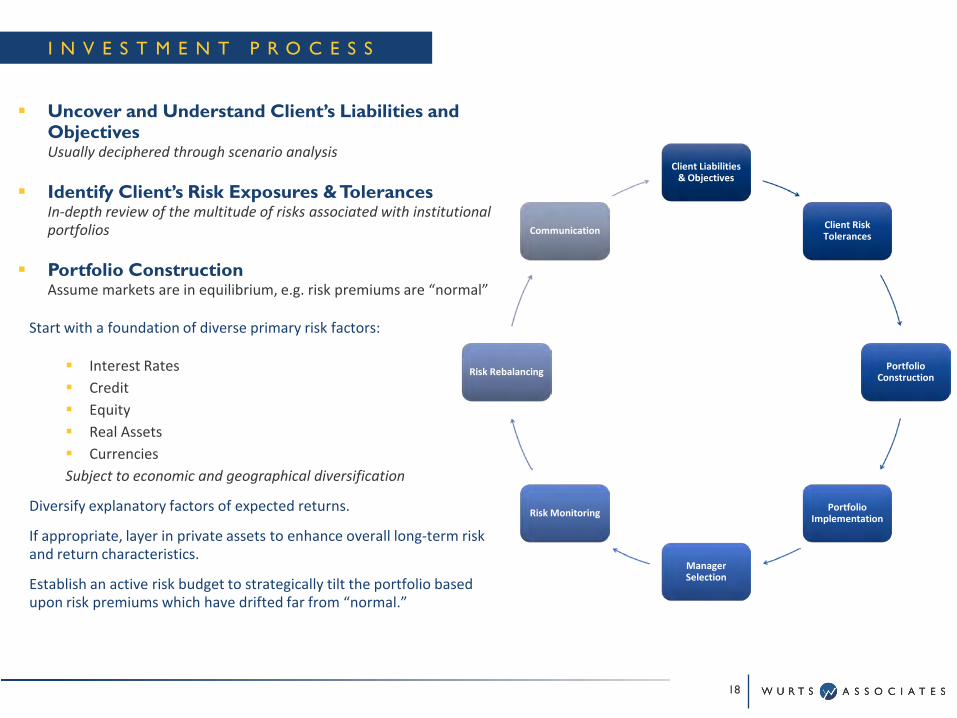
Uncover and Understand Client’s Liabilities and Objectives Usually deciphered through scenario analysis
Identify Client’s Risk Exposures & TolerancesIn-depth review of the multitude of risks associated with institutional portfolios
Portfolio ConstructionAssume markets are in equilibrium, e.g. risk premiums are “normal”
Start with a foundation of diverse primary risk factors:
Interest Rates Credit Equity Real Assets CurrenciesSubject to economic and geographical diversification
Diversify explanatory factors of expected returns.
If appropriate, layer in private assets to enhance overall long-term risk and return characteristics.
Establish an active risk budget to strategically tilt the portfolio based upon risk premiums which have drifted far from “normal.”
Client Liabilities & Objectives
Client Risk Tolerances
Portfolio Construction
Portfolio Implementation
Manager Selection
Risk Monitoring
Risk Rebalancing
Communication
18
I N V E S T M E N T P R O C E S S
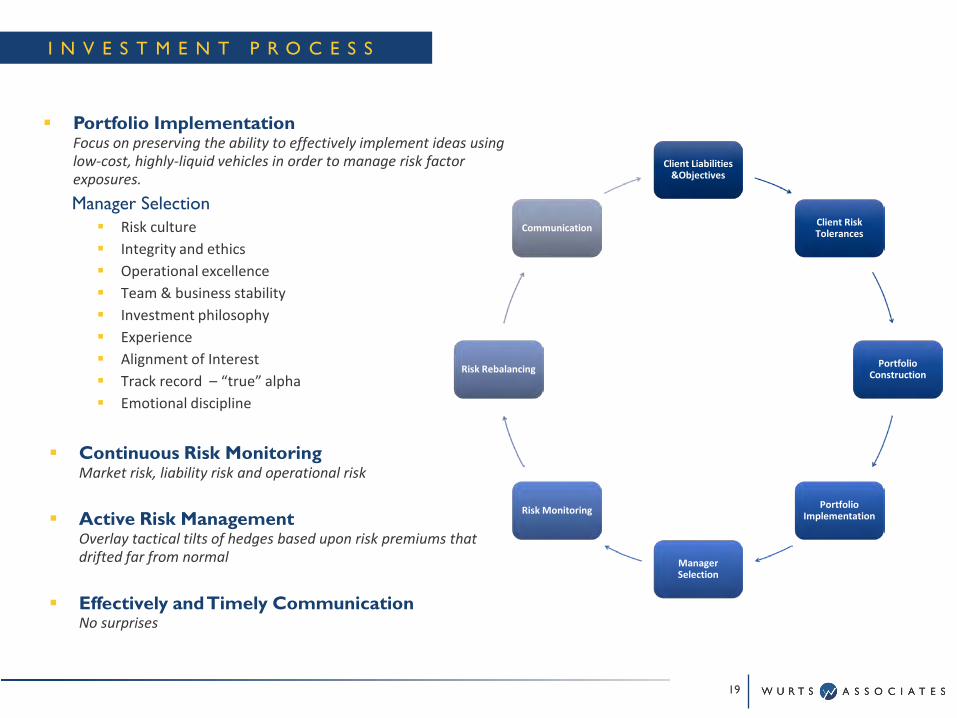
Portfolio ImplementationFocus on preserving the ability to effectively implement ideas using low-cost, highly-liquid vehicles in order to manage risk factor exposures.
Manager Selection Risk culture Integrity and ethics Operational excellence Team & business stability Investment philosophy Experience Alignment of Interest Track record – “true” alpha Emotional discipline
Continuous Risk Monitoring Market risk, liability risk and operational risk
Active Risk ManagementOverlay tactical tilts of hedges based upon risk premiums that drifted far from normal
Effectively and Timely Communication No surprises
Client Liabilities &Objectives
Client Risk Tolerances
Portfolio Construction
Portfolio Implementation
Manager Selection
Risk Monitoring
Risk Rebalancing
Communication
19
S A M P L E R I S K D A S H B O A R D
20
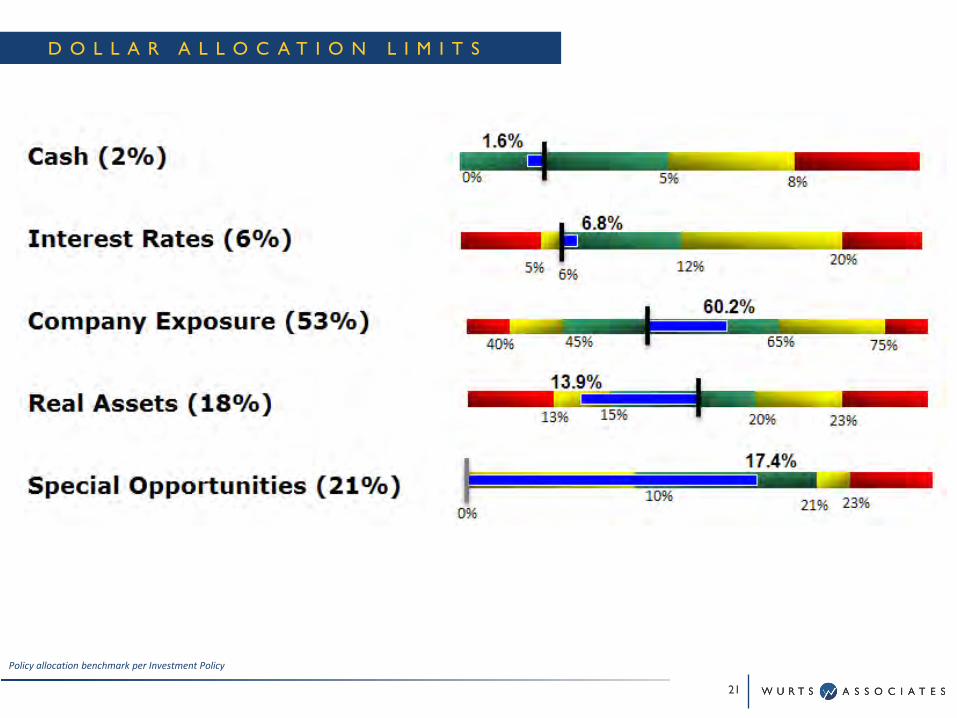
Policy allocation benchmark per Investment Policy
D O L L A R A L L O C A T I O N L I M I T S
21
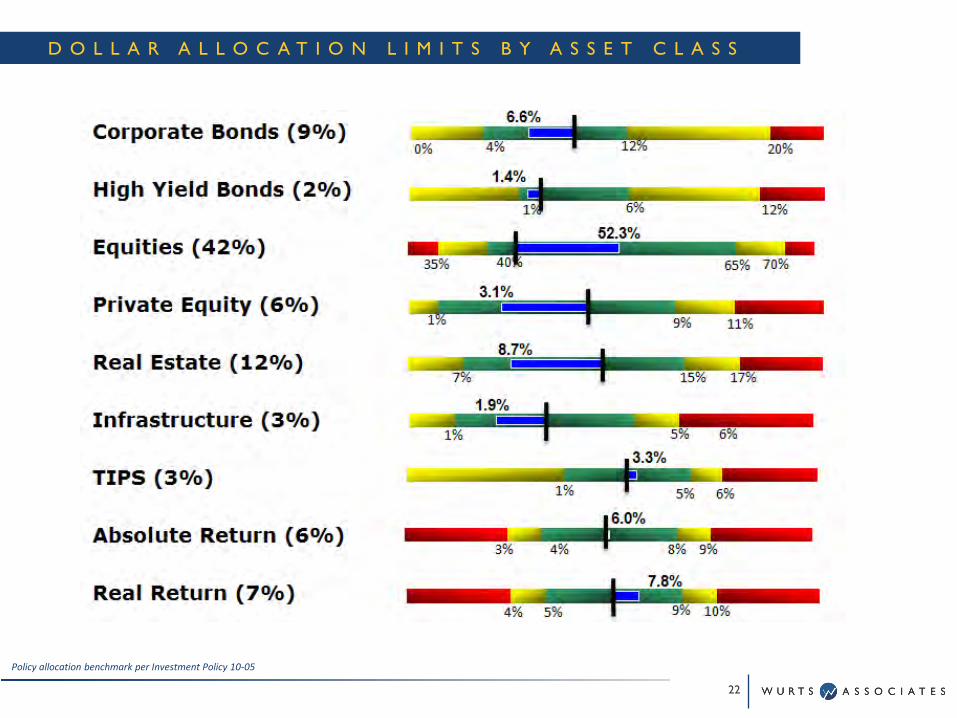
Policy allocation benchmark per Investment Policy 10-05
D O L L A R A L L O C A T I O N L I M I T S B Y A S S E T C L A S S
22
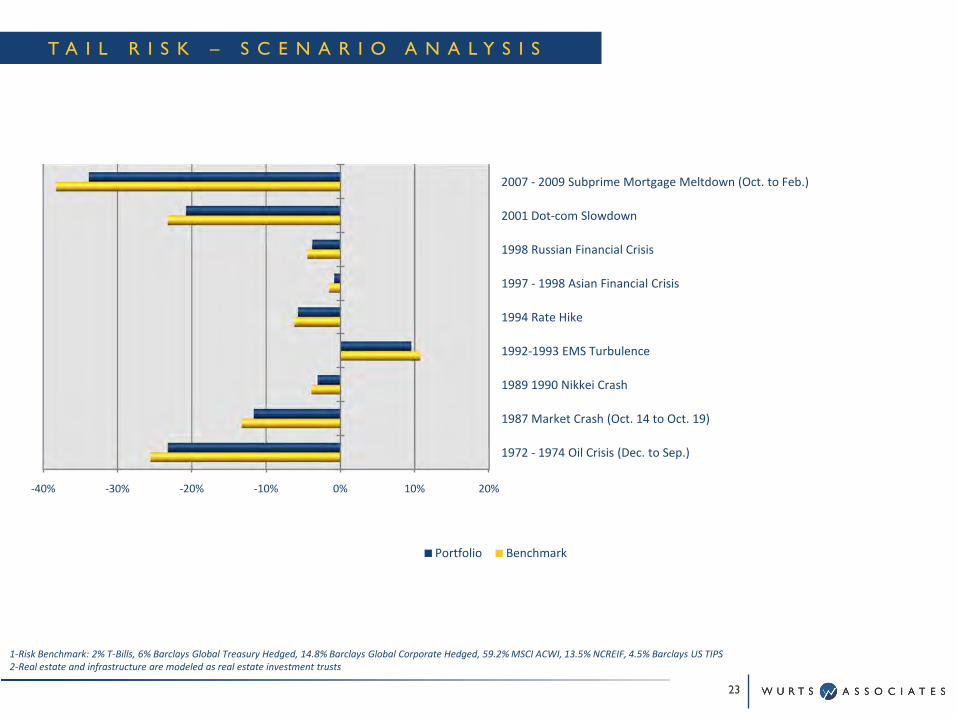
1-Risk Benchmark: 2% T-Bills, 6% Barclays Global Treasury Hedged, 14.8% Barclays Global Corporate Hedged, 59.2% MSCI ACWI, 13.5% NCREIF, 4.5% Barclays US TIPS2-Real estate and infrastructure are modeled as real estate investment trusts
-40% -30% -20% -10% 0% 10% 20%
1972 - 1974 Oil Crisis (Dec. to Sep.)
1987 Market Crash (Oct. 14 to Oct. 19)
1989 1990 Nikkei Crash
1992-1993 EMS Turbulence
1994 Rate Hike
1997 - 1998 Asian Financial Crisis
1998 Russian Financial Crisis
2001 Dot-com Slowdown
2007 - 2009 Subprime Mortgage Meltdown (Oct. to Feb.)
Portfolio Benchmark
T A I L R I S K – S C E N A R I O A N A L Y S I S
23
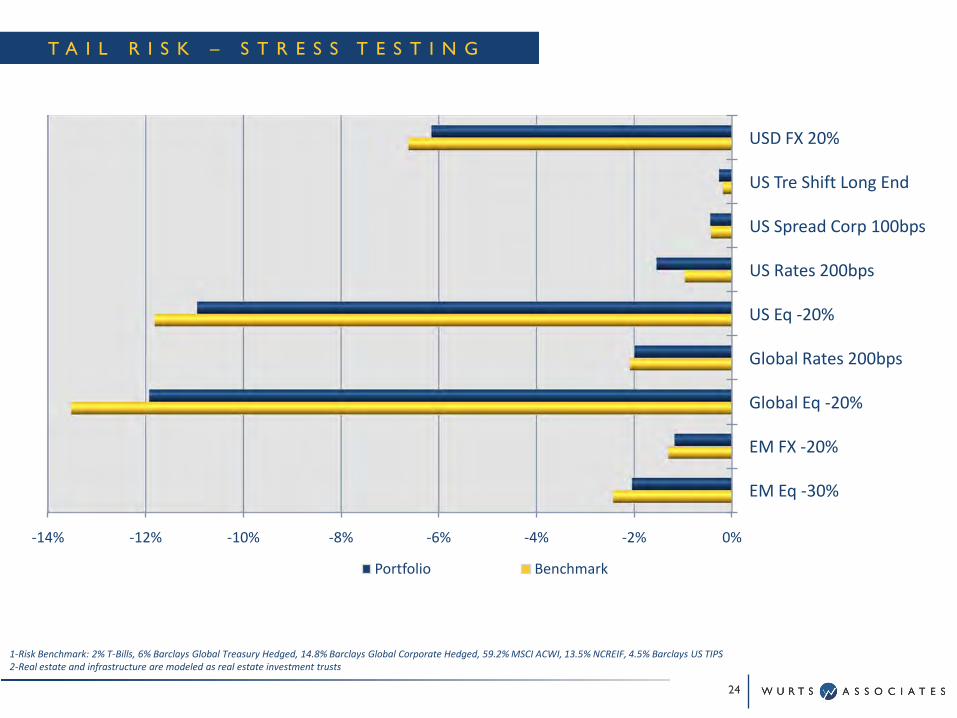
1-Risk Benchmark: 2% T-Bills, 6% Barclays Global Treasury Hedged, 14.8% Barclays Global Corporate Hedged, 59.2% MSCI ACWI, 13.5% NCREIF, 4.5% Barclays US TIPS2-Real estate and infrastructure are modeled as real estate investment trusts
-14% -12% -10% -8% -6% -4% -2% 0%
EM Eq -30%
EM FX -20%
Global Eq -20%
Global Rates 200bps
US Eq -20%
US Rates 200bps
US Spread Corp 100bps
US Tre Shift Long End
USD FX 20%
Portfolio Benchmark
T A I L R I S K – S T R E S S T E S T I N G
24
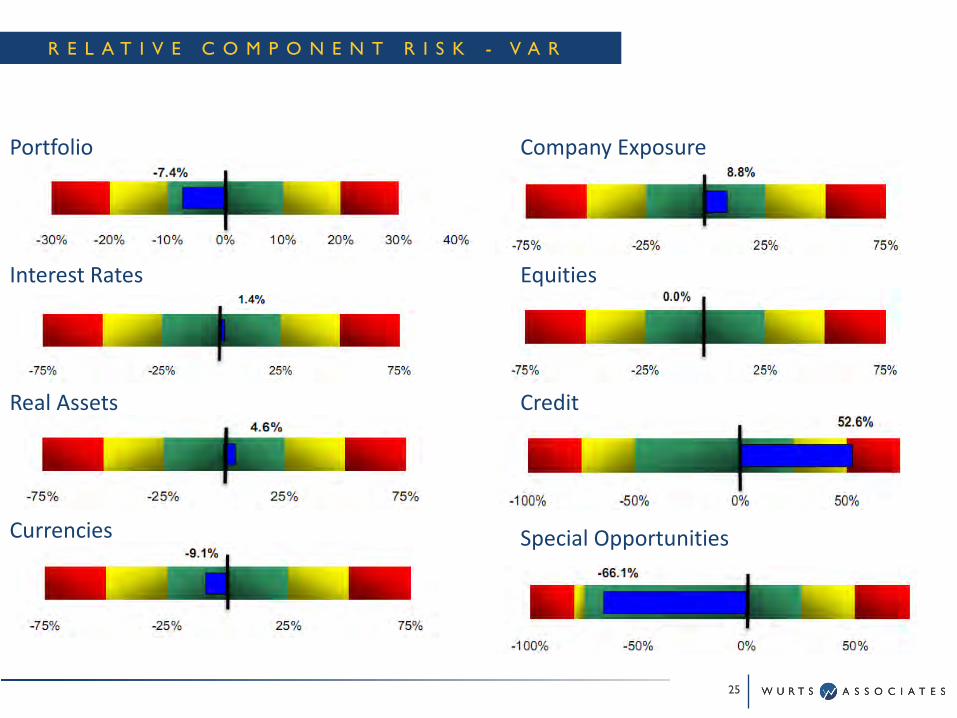
Portfolio
Real Assets
Currencies Special Opportunities
EquitiesInterest Rates
Credit
Company Exposure
R E L A T I V E C O M P O N E N T R I S K - V A R
25
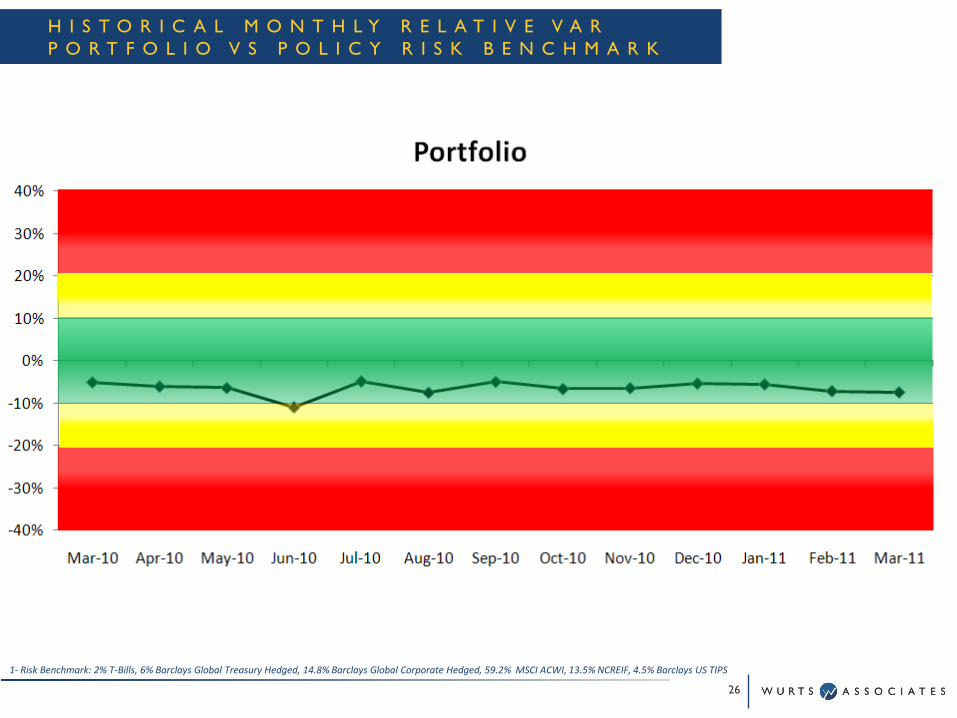
1- Risk Benchmark: 2% T-Bills, 6% Barclays Global Treasury Hedged, 14.8% Barclays Global Corporate Hedged, 59.2% MSCI ACWI, 13.5% NCREIF, 4.5% Barclays US TIPS
H I S T O R I C A L M O N T H L Y R E L A T I V E V A RP O R T F O L I O V S P O L I C Y R I S K B E N C H M A R K
26
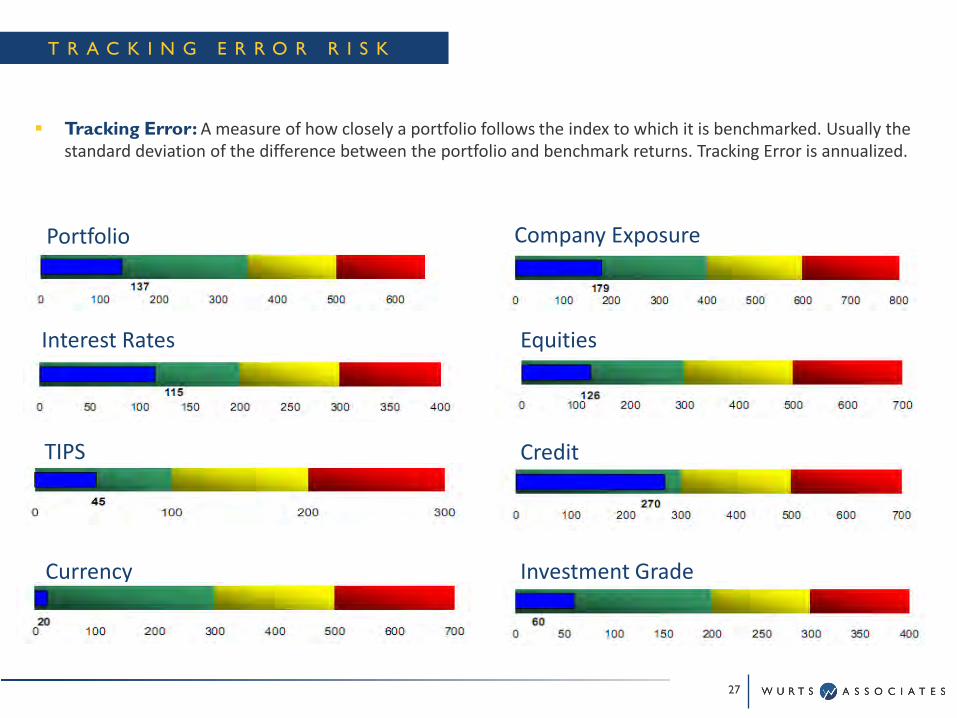
Portfolio
Interest Rates
Company Exposure
TIPS Credit
Investment Grade
Equities
Currency
Tracking Error: A measure of how closely a portfolio follows the index to which it is benchmarked. Usually the standard deviation of the difference between the portfolio and benchmark returns. Tracking Error is annualized.
T R A C K I N G E R R O R R I S K
27
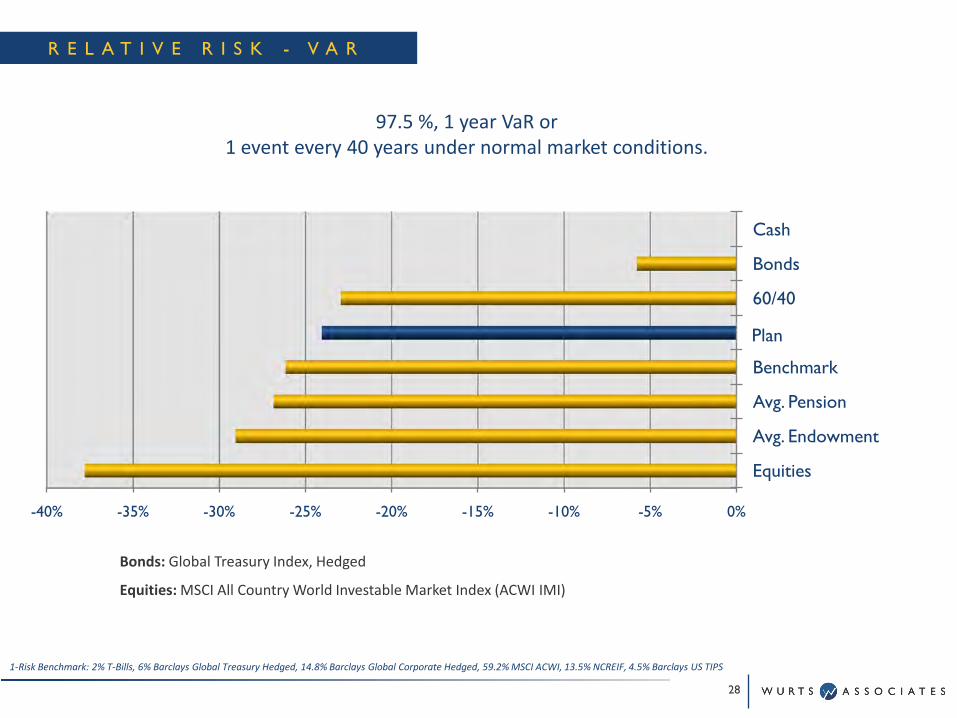
-40% -35% -30% -25% -20% -15% -10% -5% 0%
Equities
Avg. Endowment
Avg. Pension
Benchmark
APFC
60/40
Bonds
Cash
97.5 %, 1 year VaR or 1 event every 40 years under normal market conditions.
Bonds: Global Treasury Index, Hedged
Equities: MSCI All Country World Investable Market Index (ACWI IMI)
1-Risk Benchmark: 2% T-Bills, 6% Barclays Global Treasury Hedged, 14.8% Barclays Global Corporate Hedged, 59.2% MSCI ACWI, 13.5% NCREIF, 4.5% Barclays US TIPS
Plan
R E L A T I V E R I S K - V A R
28
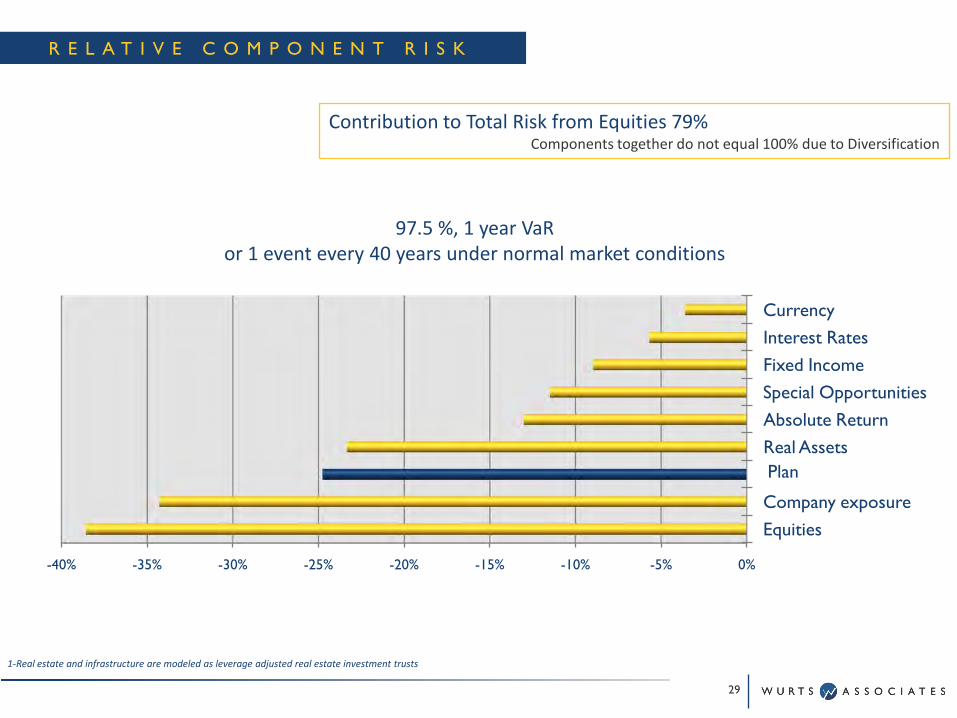
-40% -35% -30% -25% -20% -15% -10% -5% 0%
EquitiesCompany exposureAPFCReal AssetsAbsolute ReturnSpecial OpportunitiesFixed IncomeInterest RatesCurrency
97.5 %, 1 year VaR or 1 event every 40 years under normal market conditions
Contribution to Total Risk from Equities 79%Components together do not equal 100% due to Diversification
1-Real estate and infrastructure are modeled as leverage adjusted real estate investment trusts
R E L A T I V E C O M P O N E N T R I S K
29
Plan
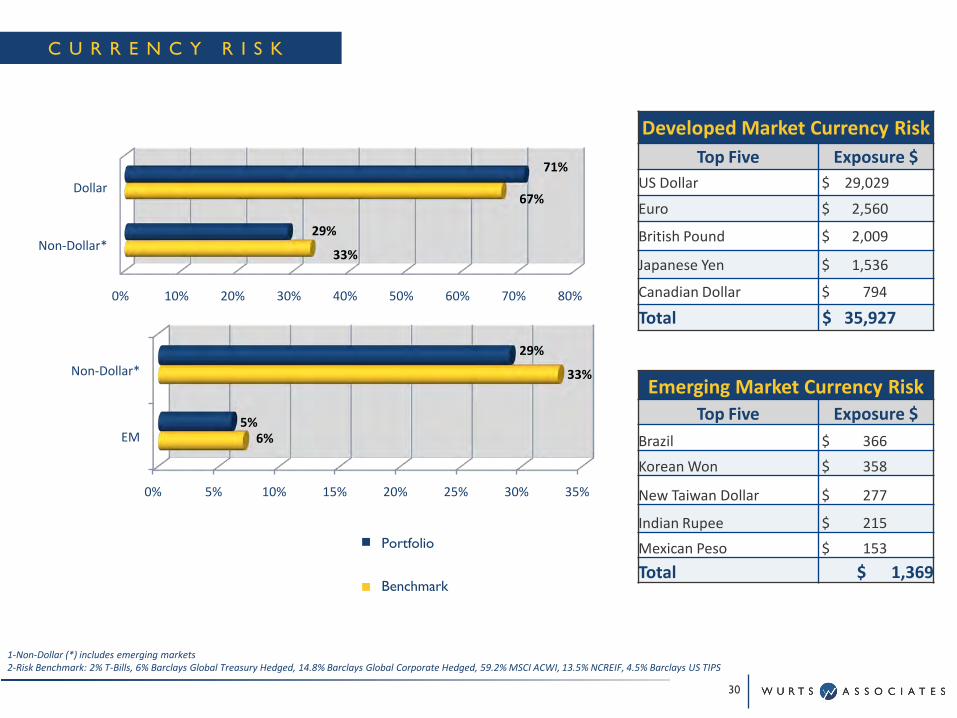
Emerging Market Currency RiskTop Five Exposure $
Brazil $ 366
Korean Won $ 358
New Taiwan Dollar $ 277
Indian Rupee $ 215
Mexican Peso $ 153
Total $ 1,369
Developed Market Currency RiskTop Five Exposure $
US Dollar $ 29,029
Euro $ 2,560
British Pound $ 2,009
Japanese Yen $ 1,536
Canadian Dollar $ 794
Total $ 35,927
1-Non-Dollar (*) includes emerging markets2-Risk Benchmark: 2% T-Bills, 6% Barclays Global Treasury Hedged, 14.8% Barclays Global Corporate Hedged, 59.2% MSCI ACWI, 13.5% NCREIF, 4.5% Barclays US TIPS
0% 10% 20% 30% 40% 50% 60% 70% 80%
Non-Dollar*
Dollar
71%
67%
29%
33%
0% 5% 10% 15% 20% 25% 30% 35%
EM
Non-Dollar*
29%
33%
5%6%
C U R R E N C Y R I S K
30
Portfolio
Benchmark

0%
10%
20%
30%
40%
50%
60%
70%
North America
Europe Pacific EM Asia Other Latin America
EM Europe &
Middle East
DevelopingCountry Exposure $
China $ 491Korea $ 355 Taiwan $ 263 Brazil $ 248India $ 211 South Africa $ 133 Mexico $ 120Israel $ 110Indonesia $ 105Turkey $ 103 Total $ 2,140
1-Risk Benchmark: 2% T-Bills, 6% Barclays Global Treasury Hedged, 14.8% Barclays Global Corporate Hedged, 59.2% MSCI ACWI, 13.5% NCREIF, 4.5% Barclays US TIPS
C O U N T R Y R I S K
31
Portfolio
Benchmark
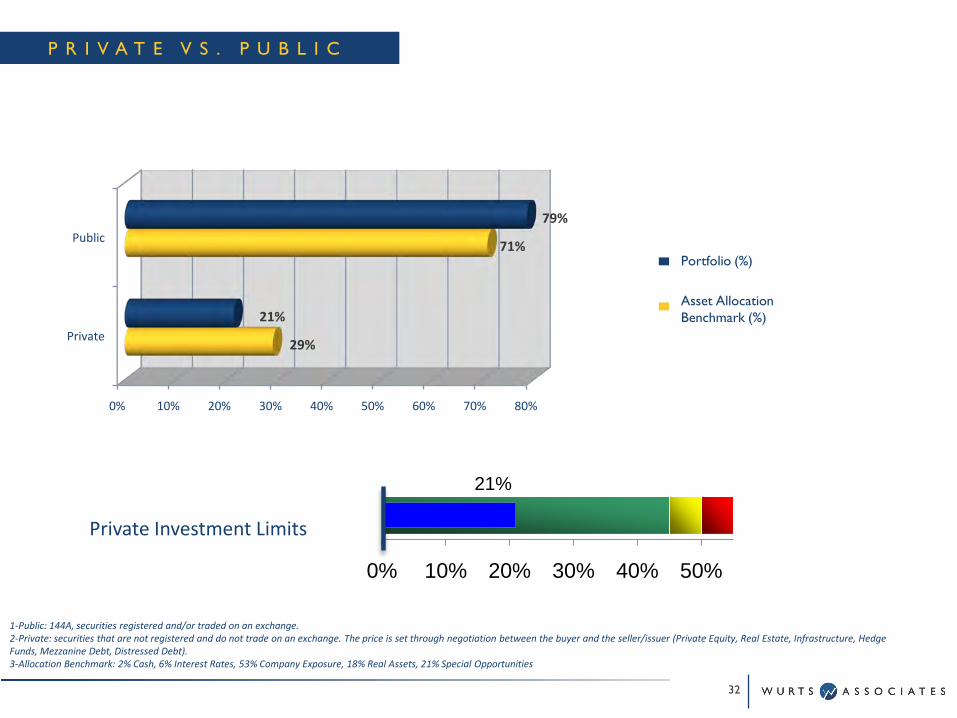
21%
0% 10% 20% 30% 40% 50%
Private Investment Limits
1-Public: 144A, securities registered and/or traded on an exchange.2-Private: securities that are not registered and do not trade on an exchange. The price is set through negotiation between the buyer and the seller/issuer (Private Equity, Real Estate, Infrastructure, Hedge Funds, Mezzanine Debt, Distressed Debt).3-Allocation Benchmark: 2% Cash, 6% Interest Rates, 53% Company Exposure, 18% Real Assets, 21% Special Opportunities
0% 10% 20% 30% 40% 50% 60% 70% 80%
Private
Public
29%
71%
21%
79%
P R I V A T E V S . P U B L I C
32
Portfolio (%)
Asset Allocation Benchmark (%)
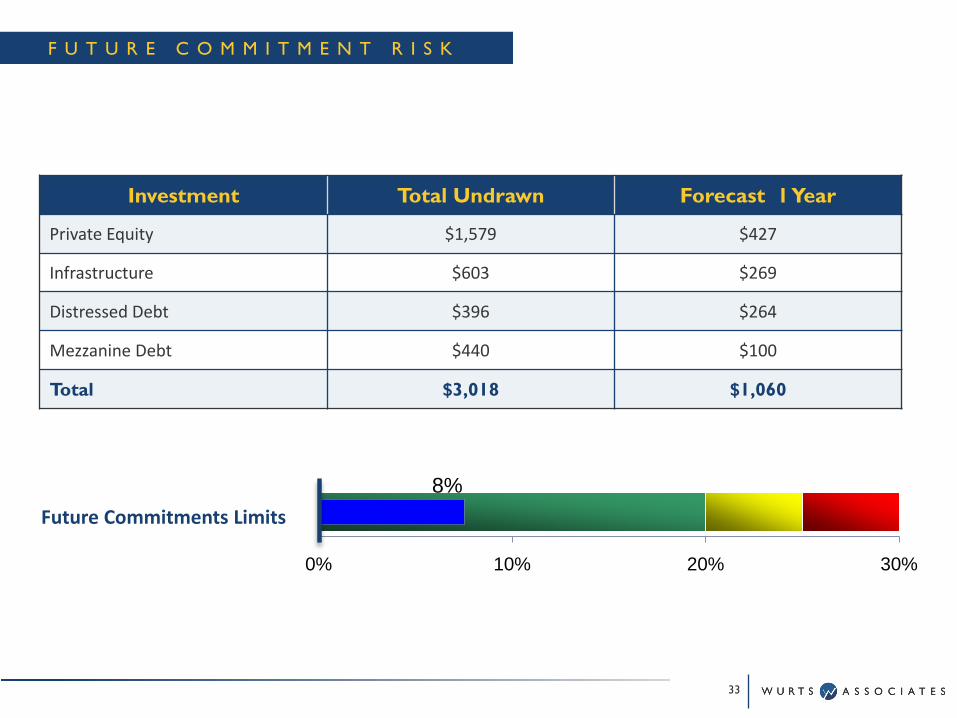
8%
0% 10% 20% 30%
F U T U R E C O M M I T M E N T R I S K
Investment Total Undrawn Forecast 1 Year
Private Equity $1,579 $427
Infrastructure $603 $269
Distressed Debt $396 $264
Mezzanine Debt $440 $100
Total $3,018 $1,060
Future Commitments Limits
33
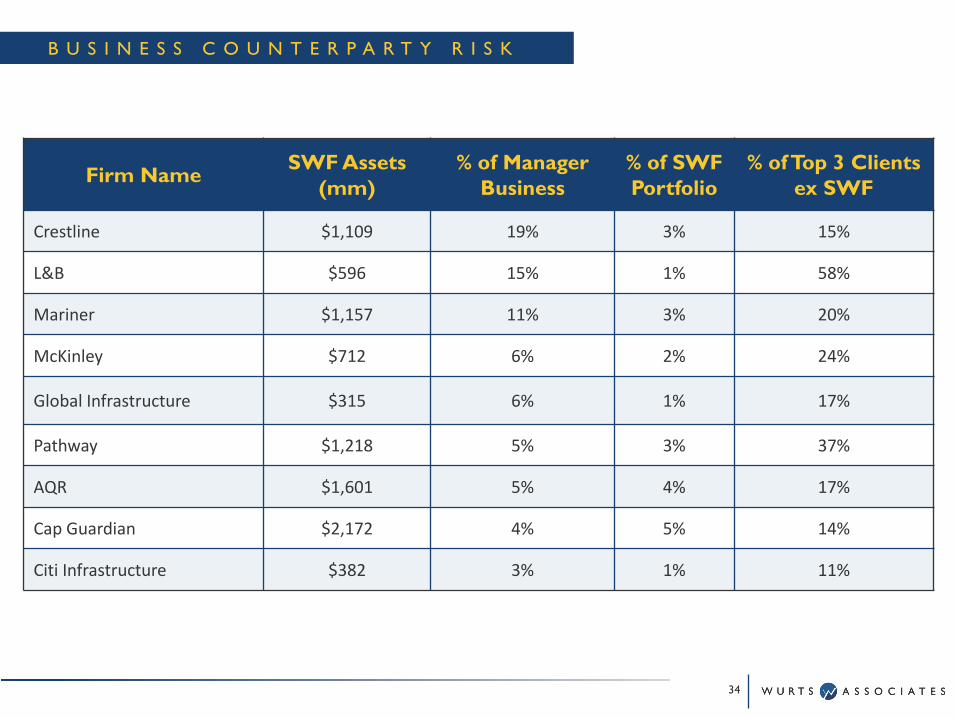
Firm Name SWF Assets (mm)
% of Manager Business
% of SWF Portfolio
% of Top 3 Clients ex SWF
Crestline $1,109 19% 3% 15%
L&B $596 15% 1% 58%
Mariner $1,157 11% 3% 20%
McKinley $712 6% 2% 24%
Global Infrastructure $315 6% 1% 17%
Pathway $1,218 5% 3% 37%
AQR $1,601 5% 4% 17%
Cap Guardian $2,172 4% 5% 14%
Citi Infrastructure $382 3% 1% 11%
B U S I N E S S C O U N T E R P A R T Y R I S K
34
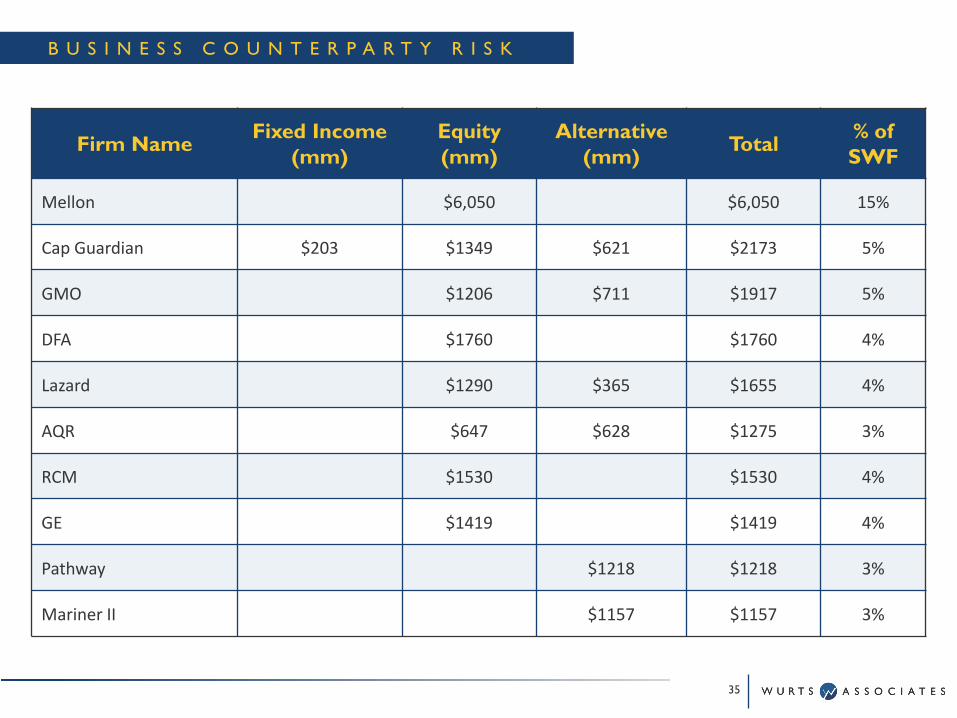
Firm Name Fixed Income(mm)
Equity (mm)
Alternative(mm) Total % of
SWF
Mellon $6,050 $6,050 15%
Cap Guardian $203 $1349 $621 $2173 5%
GMO $1206 $711 $1917 5%
DFA $1760 $1760 4%
Lazard $1290 $365 $1655 4%
AQR $647 $628 $1275 3%
RCM $1530 $1530 4%
GE $1419 $1419 4%
Pathway $1218 $1218 3%
Mariner II $1157 $1157 3%
B U S I N E S S C O U N T E R P A R T Y R I S K
35
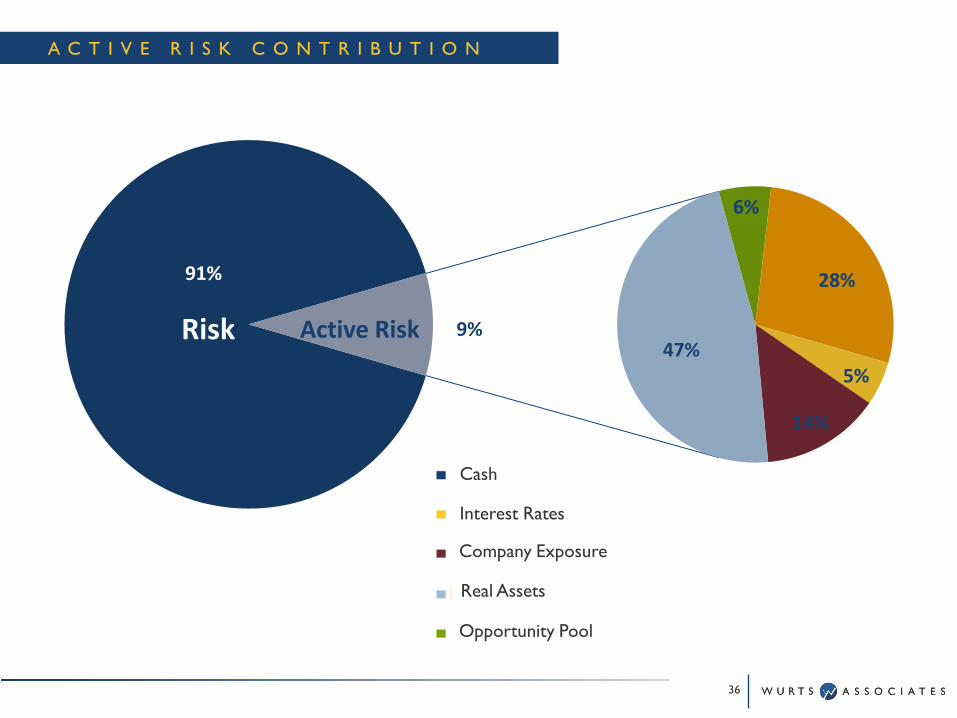
Risk5%
14%
47%
6%
28%
Active Risk 9%
91%
A C T I V E R I S K C O N T R I B U T I O N
36
Cash
Interest Rates
Company Exposure
Real Assets
Opportunity Pool
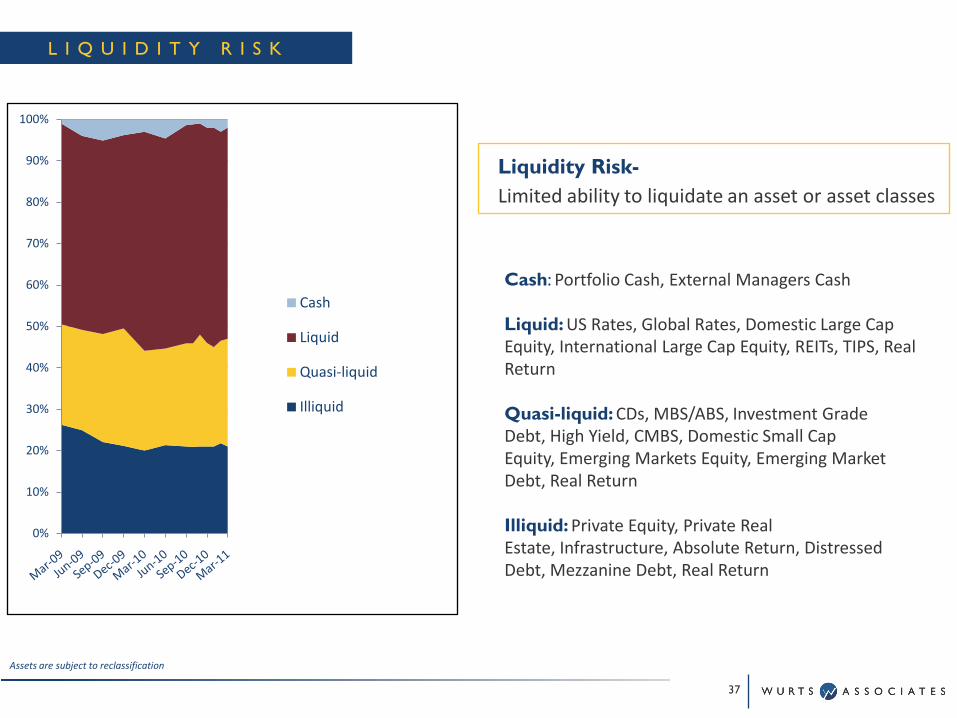
L I Q U I D I T Y R I S K
Liquidity Risk-Limited ability to liquidate an asset or asset classes
Cash: Portfolio Cash, External Managers Cash
Liquid: US Rates, Global Rates, Domestic Large Cap Equity, International Large Cap Equity, REITs, TIPS, Real Return
Quasi-liquid: CDs, MBS/ABS, Investment Grade Debt, High Yield, CMBS, Domestic Small Cap Equity, Emerging Markets Equity, Emerging Market Debt, Real Return
Illiquid: Private Equity, Private Real Estate, Infrastructure, Absolute Return, Distressed Debt, Mezzanine Debt, Real Return
Assets are subject to reclassification
0%
10%
20%
30%
40%
50%
60%
70%
80%
90%
100%
Cash
Liquid
Quasi-liquid
Illiquid
37
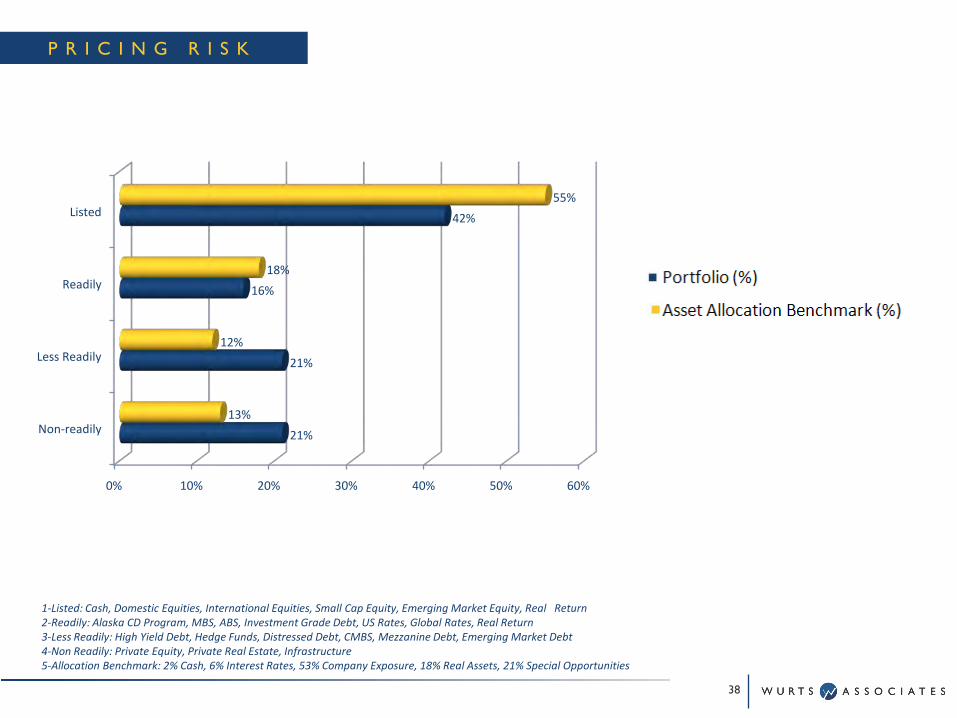
1-Listed: Cash, Domestic Equities, International Equities, Small Cap Equity, Emerging Market Equity, Real Return2-Readily: Alaska CD Program, MBS, ABS, Investment Grade Debt, US Rates, Global Rates, Real Return3-Less Readily: High Yield Debt, Hedge Funds, Distressed Debt, CMBS, Mezzanine Debt, Emerging Market Debt4-Non Readily: Private Equity, Private Real Estate, Infrastructure5-Allocation Benchmark: 2% Cash, 6% Interest Rates, 53% Company Exposure, 18% Real Assets, 21% Special Opportunities
0% 10% 20% 30% 40% 50% 60%
Non-readily
Less Readily
Readily
Listed
21%
21%
16%
42%
13%
12%
18%
55%
P R I C I N G R I S K
38
G O V E R N A N C E
39
D E F I N I T I O N O F F U N D G O V E R N A N C E
40
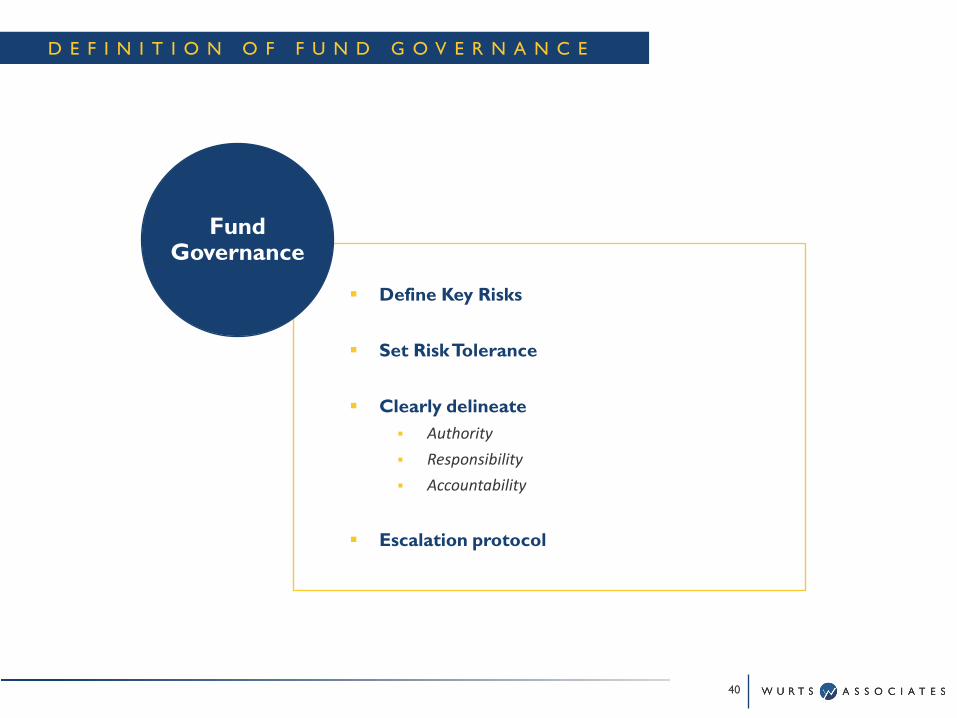
Define Key Risks
Set Risk Tolerance
Clearly delineate Authority
Responsibility
Accountability
Escalation protocol
Fund Governance
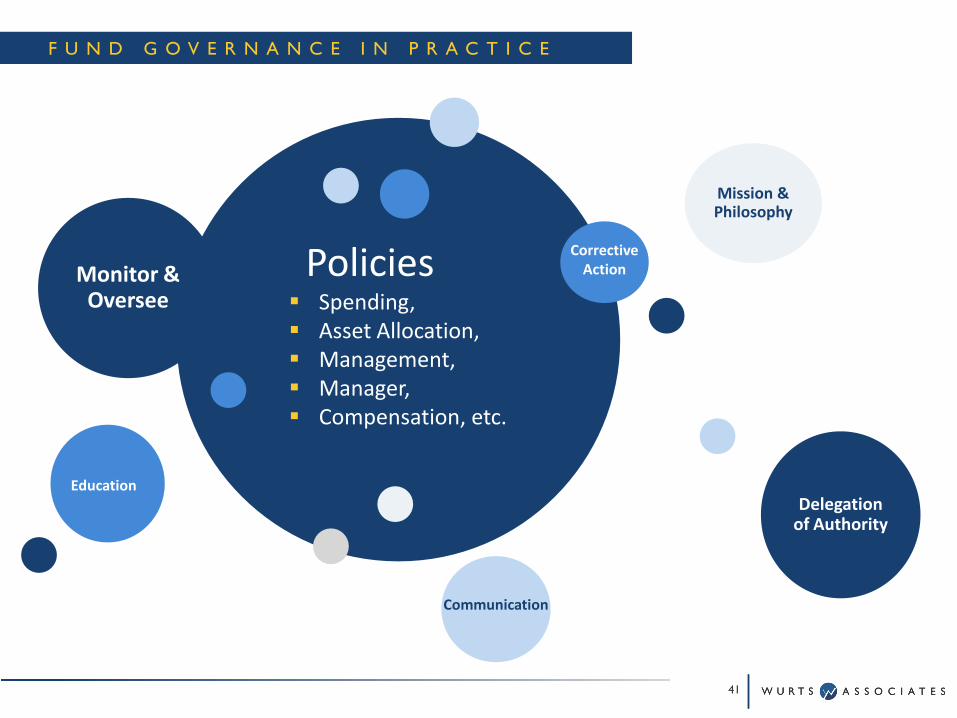
Monitor & Oversee
Mission & Philosophy
Delegation of Authority
Policies Spending, Asset Allocation, Management, Manager, Compensation, etc.
Education
Communication
Corrective Action
F U N D G O V E R N A N C E I N P R A C T I C E
41
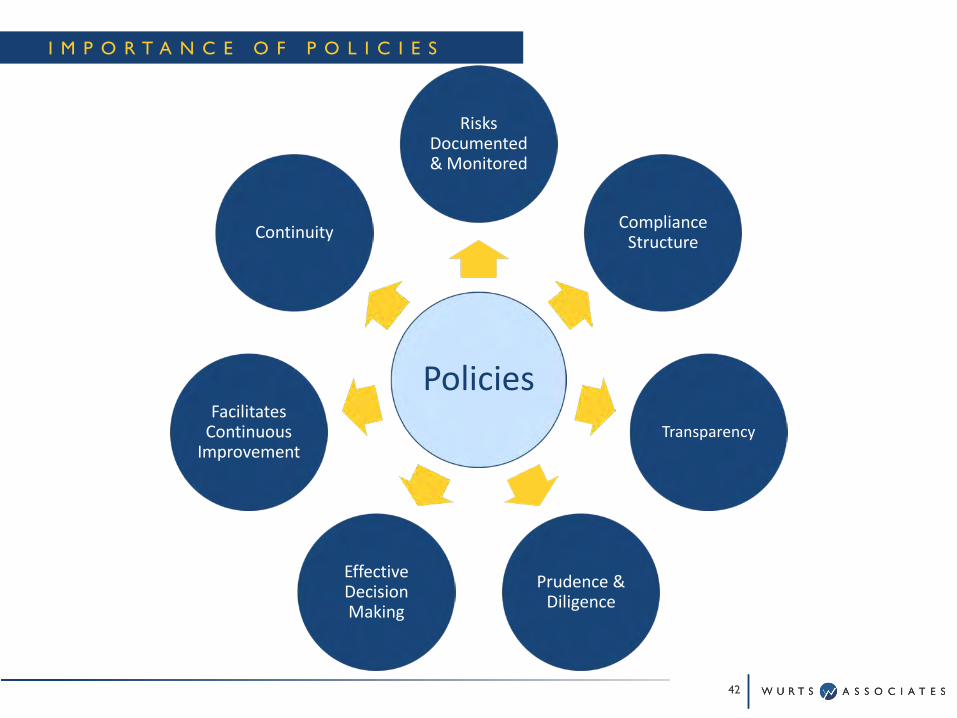
I M P O R T A N C E O F P O L I C I E S
Policies
Risks Documented & Monitored
Compliance Structure
Transparency
Prudence & Diligence
Effective Decision Making
Facilitates Continuous
Improvement
Continuity
42
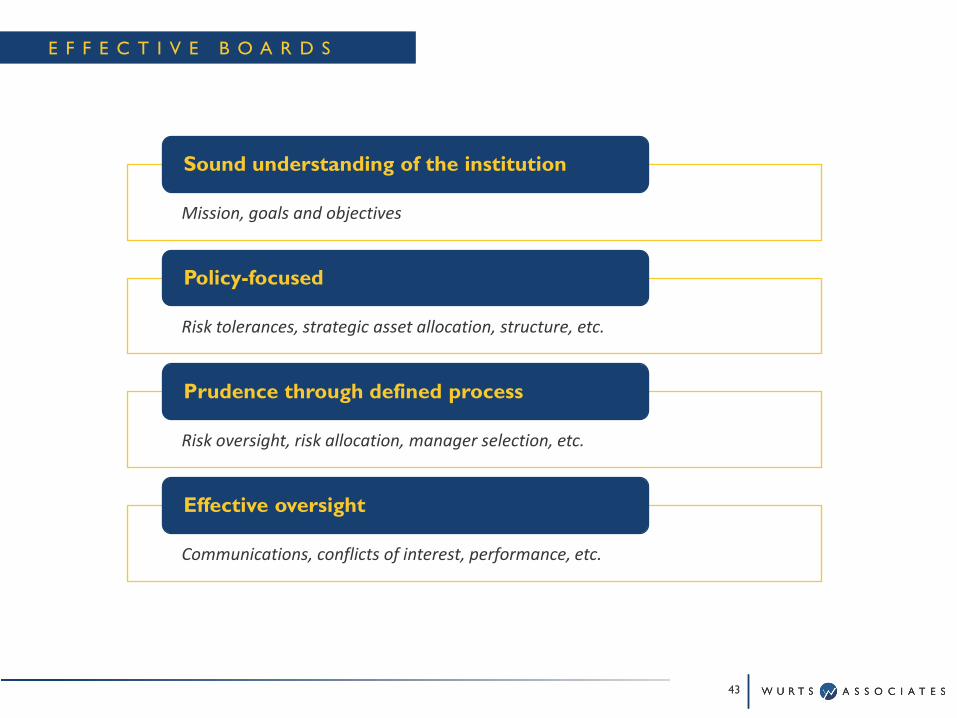
E F F E C T I V E B O A R D S
Mission, goals and objectives
Sound understanding of the institution
Risk tolerances, strategic asset allocation, structure, etc.
Policy-focused
Risk oversight, risk allocation, manager selection, etc.
Prudence through defined process
Communications, conflicts of interest, performance, etc.
Effective oversight
43
Related Documents