Electronic copy available at: http://ssrn.com/abstract=1941070 Electronic copy available at: http://ssrn.com/abstract=1941070 1 Risk-Based Student Loans Michael Simkovic * Table of Contents I. Introduction .......................................................................... 3 II. Government Support for Higher Education ....................... 5 A. Higher Education as an Investment in Human Capital ............................................................................ 6 B. The Demand for Skilled Labor and Social Mobility......................................................................... 22 C. Values-Based Arguments for Higher Education Funding ........................................................................ 25 D. Education Funding and Independent Research ......... 27 E. Higher Education Funding Options: Student Debt or General Taxes ................................................. 29 III. U.S. Federal Student Loan Programs ............................... 34 A. Student Eligibility Criteria Are Generally Not Risk-Based.................................................................... 35 B. Only Exceptionally Poorly Performing Institutions Are Excluded ................................................................ 36 C. Borrowing Limits Depend on Grade Level and Dependent Status ................................................. 38 D. Federal Student Loan Pricing is Statutory, Not Risk-Based.................................................................... 39 * Associate Professor of Law, Seton Hall University School of Law. Thanks go to Professors Peter Arcidiacono, Douglas G. Baird, Dan Black, Jean Braucher, David G. Carlson, Jonathan Glater, Rachel Godsil, Thomas H. Jackson, Stephen J. Lubben, Frank McIntyre, John Morley, Chrystin Ondersma, Rafael Pardo, Frank Pasquale, Mark Poirier, John A.E. Pottow, Robert K. Rasmussen, and Richard Squire for helpful comments and suggestions. Thanks also to Michael Amalfe, Cynthia Furmanek, William Pugh, Timothy Malacrida, and Arkell Weygandt for research assistance, and to Luke Spreen and Steve Hipple at the U.S. Department of Labor, Bureau of Labor Statistics for assistance with access to data.

Welcome message from author
This document is posted to help you gain knowledge. Please leave a comment to let me know what you think about it! Share it to your friends and learn new things together.
Transcript
Electronic copy available at: http://ssrn.com/abstract=1941070Electronic copy available at: http://ssrn.com/abstract=1941070
1
Risk-Based Student Loans
Michael Simkovic*
Table of Contents
I. Introduction .......................................................................... 3!
II. Government Support for Higher Education ....................... 5! A. Higher Education as an Investment in Human Capital ............................................................................ 6! B. The Demand for Skilled Labor and Social Mobility ......................................................................... 22! C. Values-Based Arguments for Higher Education Funding ........................................................................ 25! D. Education Funding and Independent Research ......... 27! E. Higher Education Funding Options: Student Debt or General Taxes ................................................. 29!
III. U.S. Federal Student Loan Programs ............................... 34! A. Student Eligibility Criteria Are Generally Not Risk-Based .................................................................... 35! B. Only Exceptionally Poorly Performing Institutions Are Excluded ................................................................ 36! C. Borrowing Limits Depend on Grade Level and Dependent Status ................................................. 38! D. Federal Student Loan Pricing is Statutory, Not Risk-Based .................................................................... 39!
* Associate Professor of Law, Seton Hall University School of Law. Thanks go to Professors Peter Arcidiacono, Douglas G. Baird, Dan Black, Jean Braucher, David G. Carlson, Jonathan Glater, Rachel Godsil, Thomas H. Jackson, Stephen J. Lubben, Frank McIntyre, John Morley, Chrystin Ondersma, Rafael Pardo, Frank Pasquale, Mark Poirier, John A.E. Pottow, Robert K. Rasmussen, and Richard Squire for helpful comments and suggestions. Thanks also to Michael Amalfe, Cynthia Furmanek, William Pugh, Timothy Malacrida, and Arkell Weygandt for research assistance, and to Luke Spreen and Steve Hipple at the U.S. Department of Labor, Bureau of Labor Statistics for assistance with access to data.
Electronic copy available at: http://ssrn.com/abstract=1941070Electronic copy available at: http://ssrn.com/abstract=1941070
2 70 WASH. & LEE L. REV. 0000 (2013)
IV. Higher Education and Labor Market Coordination Problems ............................................................................. 41! A. Students as Customers Create Pressure to Reduce Academic Standards ....................................... 41! B. Educational Institutions May Have Incentives to Funnel Students into Areas That Do Not Maximize Students’ Future Incomes or Employment Prospects ................................................ 44 C. Many Students May Not Understand the Connection Between Their Chosen Course of Study and Future Income and Employment Prospects ................................................ 57! D. Skilled Labor Markets Suffer from Periodic Booms and Busts ...................................................................... 61! E. Skills Mismatches Reduce Employment and Output .......................................................................... 62!
V. The Theory of Risk-Based Credit Pricing ......................... 63! A. A Simple Risk-based Credit Pricing Model ................ 68! B. Data-Driven Risk-Based Pricing ................................. 70! C. Risk-Based Pricing Is Not Necessarily the Same as Market-Based Pricing ................................... 71! D. Government’s Incentives Are Uniquely Well Aligned with Students’ ................................................ 73! E. Forecasting Change Is Both Necessary and Perilous ......................................................................... 76! F. Private Lenders Could Be Enlisted to Correct Forecast Errors ............................................................ 80! G. Limited Dischargeability of Student Loans in Bankruptcy Reduces Lender Incentives to Monitor Students and Risk-Adjust Student Loan Pricing ................................................... 81! H. Income-Based Repayment Plans ................................. 91!
VI. Ethical Considerations and the Limits of Risk-Based Pricing ............................................................. 94! A. Factors That Predict Student Loan Defaults ............. 94! B. Preserving Equal Opportunity, Social Mobility, and Individual Choice .................................................. 97! C. Risk-Based Pricing and Choice of Major .................... 99! D. The Promise and Perils of “Meritocratic”
RISK-BASED STUDENT LOANS 3
Risk-Based Pricing ..................................................... 104! E. Debt to Income Ratios and Paternalistic Borrowing Limits ....................................................... 106! F. Risk-Based Pricing and Institutional Autonomy ..... 109!
VII. Conclusion ........................................................................ 120
I. Introduction
Credit markets serve a vital function in capitalist economies: evaluating the riskiness of a range of possible investments and channeling resources toward those investments that investors believe are most likely to prove successful. This process is known as the “risk-based pricing” of credit. Ideally, risk-based pricing should lead to lower cost of capital for lower risk investment choices with larger rewards, and therefore more investment in such promising activities. Conversely, risk-based pricing should lead to higher costs of capital—and therefore less investment—in high-risk activities with relatively low rewards. If creditors are well informed and analytic, and borrowers respond to financial incentives, then risk-based pricing—compared to uniform credit pricing—leads to a more efficient allocation of society’s limited resources.
Although risk-based pricing is standard in business-loan markets, and may be increasingly common in consumer-credit markets such as mortgages and credit cards, risk-based pricing is seldom used in the market for student loans.1 Most student loans are extended under Federal Student Loan programs administered by the Department of Education. These federal programs have historically offered loans at rates lower than those offered by most private lenders, on terms that are more attractive to student borrowers, and without adjusting the pricing on loans
1. See Wendy Edelberg, Risk-Based Pricing of Interest Rates in Household Loan Markets 3–4 (Fin. & Econ. Discussion Series, Working Paper No. 2003-62, 2003), available at http://www.federalreserve.gov/pubs/feds/2003/200362/200362 pap.pdf (analyzing data from the 1980s and 1990s and documenting the growing use of risk-based pricing in credit cards, auto loans, and mortgages, but not student loans); cf. infra Part V.C (contrasting efficient risk-based credit pricing with “opportunistic” credit pricing).
4 70 WASH. & LEE L. REV. 0000 (2013)
according to the risks inherent in different courses of study or lending to different types of borrowers.
The Federal Student Loan programs—first established in the mid-twentieth century to increase the supply of skilled labor, promote economic and technological development, and provide upward socioeconomic mobility—are broadly successful. They have provided low-cost credit to millions of students, helped increase educational attainment, held administrative costs lower than those of the private sector, and generated a profit for the federal government.
However, Federal Student Loan programs have not incorporated many recent insights from financial, developmental, and labor economics that distinguish between different types of education. Because of this, Federal Student Loan programs, and more broadly, U.S. labor markets, are not performing at their full potential. There is a large mismatch between the skills workers have and employers’ needs, and this mismatch contributes to structural unemployment, reduced output, and student loan defaults.
This Article argues that introducing risk-based pricing in federal student loans would advance the interests and values that Congress articulated when it first established federal support for higher education. Risk-based pricing of student loans would signal the long-term financial risks inherent in different courses of study. This price signal would likely improve students’ ability to make informed decisions about the course of study that would best balance their innate abilities and individual preferences with postgraduate economic opportunities. Similarly, price signals would enhance post-secondary educational institutions’ abilities to adjust their programs to improve their students’ postgraduate prospects.
Allocating educational resources more efficiently would not only benefit individual students and their families. It would enhance the productivity and competitiveness of the U.S. labor force, with beneficial consequences for both the private sector and public finances. Over the long term, such efficiencies could increase the resources available for further investment in education and research.
Transparent, risk-based student loan pricing could greatly benefit students and educational institutions, particularly if it
RISK-BASED STUDENT LOANS 5
were data-driven and sensitive to the values of equal opportunity and independent research that are central to the academic enterprise. This Article discusses legal and policy reforms that could facilitate risk-based student loan pricing, potential hazards from a shift toward risk-based pricing, and safeguards that could help protect students and educators from abuse.
This Article focuses primarily on the economic consequences of education rather than on moral or philosophical views about the ideal purpose of education or its proper role in society. The economic focus of this Article is not intended to deny the intellectual merit of philosophical views about education, but rather to reflect the fact that government support for higher education in the United States has primarily been driven by economic considerations, particularly during the mid-twentieth century when Federal Student Loan programs were established.
Part I of this Article discusses rationales for government support for higher education, with an emphasis on Human Capital Theory. Part II discusses the U.S. federal student loan system. Part III discusses coordination, information, and incentive problems in the higher education and skilled labor markets. Part IV explains the theory of risk-based credit pricing and how risk-based pricing of federal student loans could ameliorate some of the coordination problems discussed in Part III. Part V discusses predictors of income, employment, and student loan default, and also considers ethical and moral considerations that might limit or preclude the use of certain predictors to risk-adjust student loan pricing.
II. Government Support for Higher Education
In most developed economies, government provides some form of public support for higher education, either through grants or loans.2 Rationales for government support for higher education
2. See ORG. FOR ECON. CO-OPERATION AND DEV. (OECD), EDUCATION AT A GLANCE: 2011 OECD INDICATORS 163 (2011), available at http://www. oecd.org/edu/highereducationandadultlearning/48631582.pdf; Gabrielle Demange, Robert Fenge & Silke Uebelmesser, The Provision of Higher Education in a Global World—Analysis and Policy Implications, 54 CESIFO ECON. STUD. 248, 253–54
6 70 WASH. & LEE L. REV. 0000 (2013)
generally relate to positive externalities beyond the direct benefits to the individual student.3 These externalities may be economic in nature, or may relate to more subjective values espoused by a given polity. Values-based rationales in the United States often cite the role of public investment in education in reducing inequality or providing socioeconomic mobility.4
A. Higher Education as an Investment in Human Capital
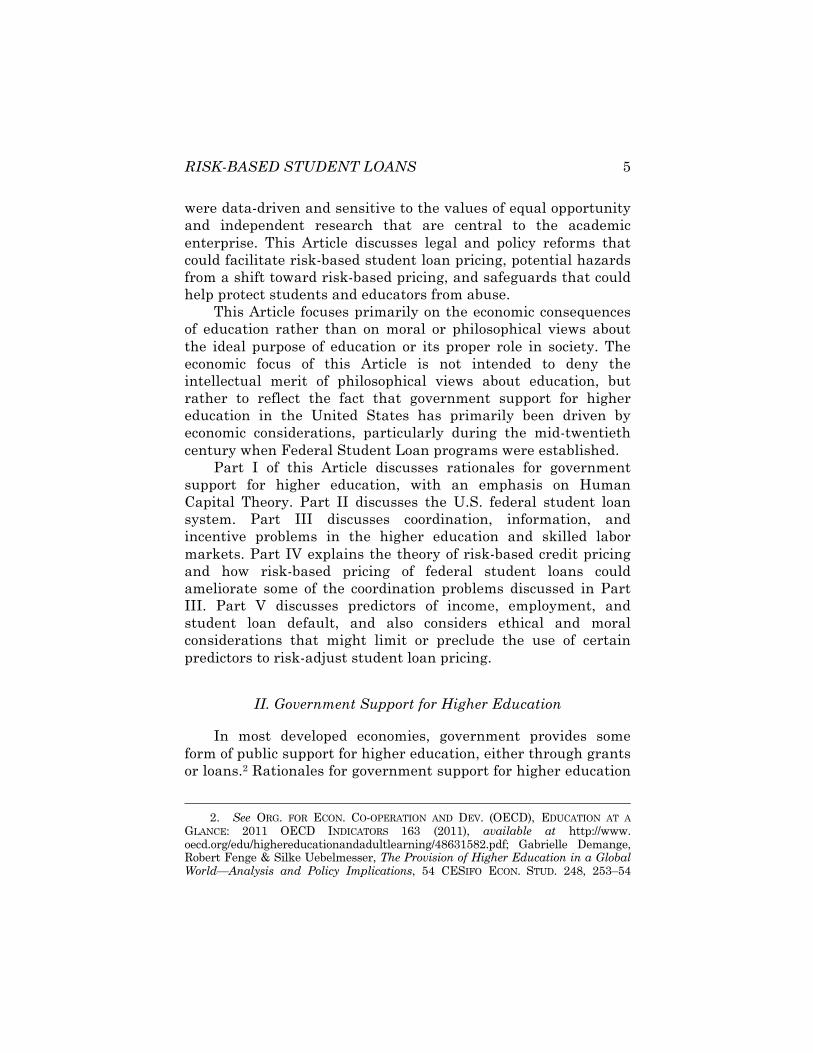
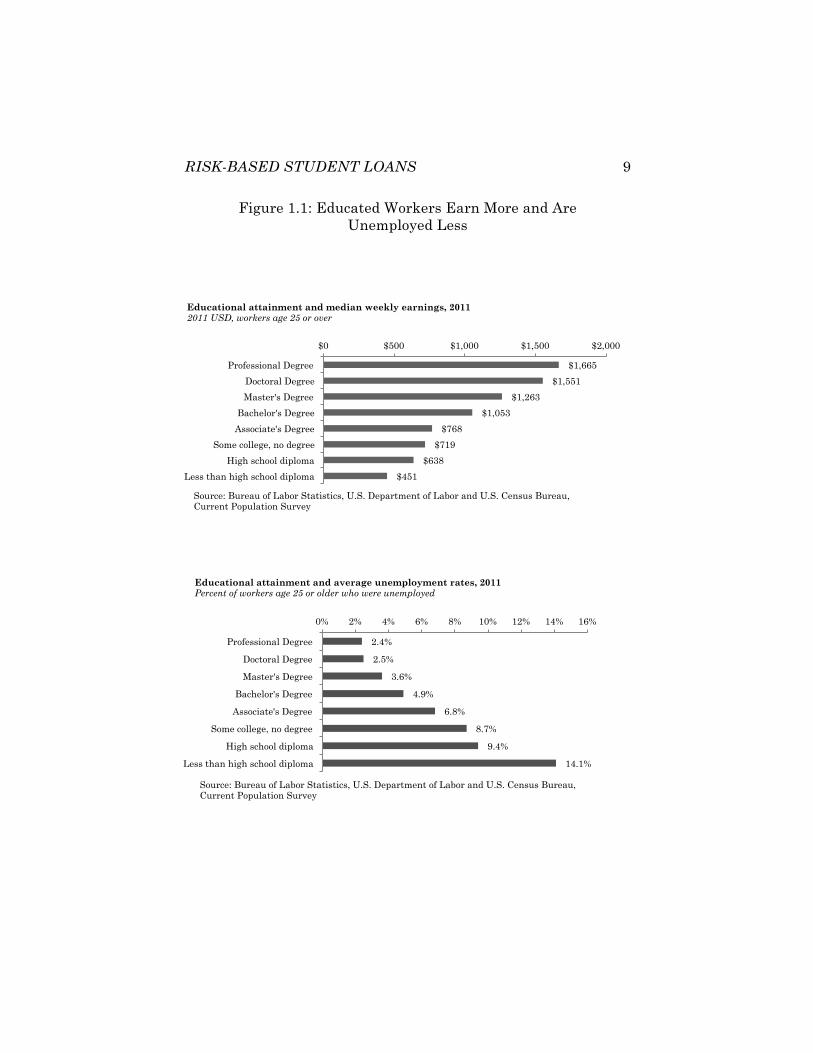
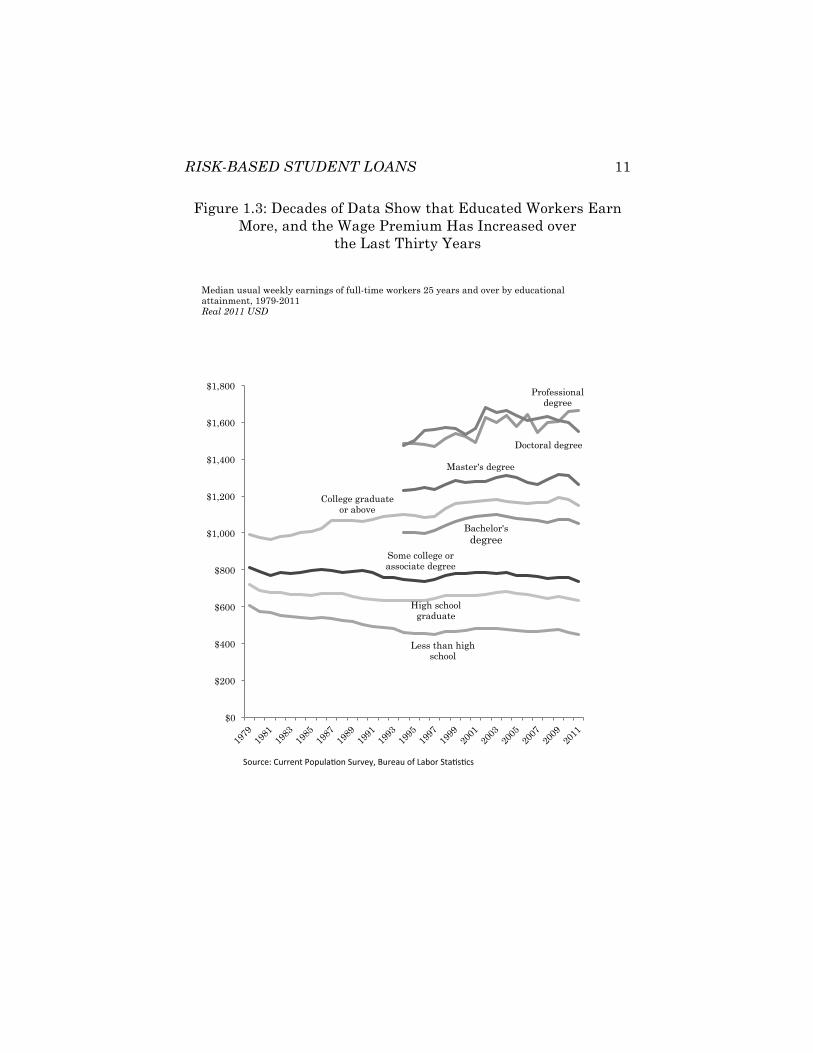
Economic benefits of higher education are well known: education increases wages5 and reduces the risk of
(2008); Panu Poutvaara, Educating Europe: Should Public Education Be Financed with Graduate Taxes or Income-Contingent Loans? 50 CESIFO ECON. STUD. 663, 665 (2004). 3. See John A.E. Pottow, The Nondischargeability of Student Loans in Personal Bankruptcy Proceedings: The Search for a Theory, 44 CAN. BUS. L.J. 245, 258–59 (2006); Anthony Stokes & Sarah Wright, Measuring the Social Rate of Return in Public Sector Labor Markets, 6 J. OF BUS. & ECON. RES. 1, 4 (2008). 4. See E. DIGBY BALTZELL, THE PROTESTANT ESTABLISHMENT: ARISTOCRACY AND CASTE IN AMERICA 351 (1964) (“[T]he campus community has now become the principal guardian of our traditional opportunarian ideals.”); JOHN A. DOUGLASS, THE CALIFORNIA IDEA AND AMERICAN HIGHER EDUCATION: 1850 TO THE 1960 MASTER PLAN 1–2 (2000) (“California was not alone in its efforts to nurture higher education as both a tool for socioeconomic mobility and an engine for economic growth.”); OECD, supra note 2, at 13 (“During the past 50 years, the expansion of education has contributed to a fundamental transformation of societies in OECD countries. In 1961, higher education was the privilege of the few . . . .”); Lani Guinier, The Supreme Court, 2002 Term: Comment: Admissions Rituals as Political Acts: Guardians at the Gates of our Democratic Ideals, 117 HARV. L. REV. 113, 137 (2003) (“I identify four important values associated with access to higher education: individualism, merit, democracy, and upward mobility. Of these four, the value that seems to integrate the other three with higher education is upward mobility.”). 5. See GARY S. BECKER, HUMAN CAPITAL: A THEORETICAL AND EMPIRICAL ANALYSIS WITH SPECIAL REFERENCE TO EDUCATION 246 (1994) (“The rate of return to an average college entrant is considerable, of the order of 10 or 12 percent per annum”); id. at 247 (“[A]bility explains only a relatively small part of the [earning] differentials [between high school and college educated workers] and college education explains the larger part.”); Orley Ashenfelter & Alan Krueger, Estimates of the Economic Return to Schooling from a New Sample of Twins, 84 AM. ECON. REV. 1157, 1157 (1994) (estimating from a sample of identical twins that an additional year of schooling increases wages by 12% to 16%, and reporting that this is probably not due to differences in innate ability); Thomas Lemieux, Postsecondary Education and Increasing Wage Inequality, 96 AM. ECON. REV. 195,
RISK-BASED STUDENT LOANS 7
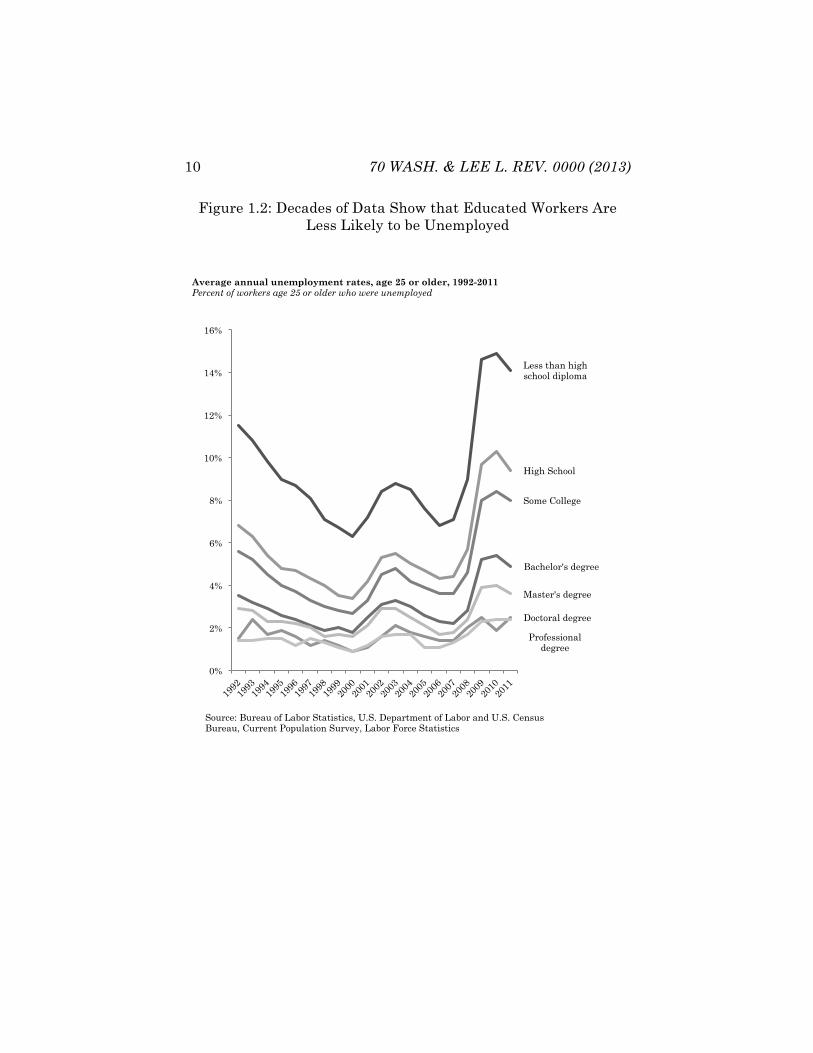
unemployment,6 presumably by increasing labor productivity.7 In addition to benefiting the student by facilitating higher future income, education may also lead to positive financial externalities such as increased tax revenues,8 reduced burdens on public services,9
196 (2006) (“By 2003–2005 . . . the return to post-secondary education is much higher than the return to elementary and secondary education.”); id. at 199 (“[P]ost secondary education plays a crucial role in explaining [increasing wage inequality]. By contrast, labor market experience, primary and secondary education, and the position of workers without postsecondary education in the wage distribution play a small role in explaining changes in the wage structure over the last 35 years.”); OECD, supra note 2, at 13 (“Among the 34 OECD countries, most of those in which college enrolment expanded the most over the past decades still see rising earnings differentials for college graduates . . . .”). 6. See Jacob Mincer, Education and Unemployment 22 (Nat’l Bureau of Econ. Research, Working Paper No. w3838, 1991), available at http:// papers.ssrn.com/sol3/papers.cfm?abstract_id=226736; W. Craig Ridell & Xueda Song, The Impact of Education on Unemployment Incidence and Re-Employment Success: Evidence from the U.S. Labor Market, 18 LABOUR ECON. 453, 462 (2011); OECD, supra note 2, at 116–17, Chart A7.1 (“Higher education improves job prospects, in general, and the likelihood of remaining employed in times of economic hardship.”). The differences in unemployment between those with post-secondary degrees and those without widens during times of financial distress. Id. at 118–20. 7. See Mincer, supra note 6, at 22; David A. Wise, Academic Achievement and Job Performance, 65 AM. ECON. REV. 350, 364 (1975) (providing evidence that college education increases productive ability); cf. Samuel Bowles & Herbert Gintis, Schooling in Capitalist America Revisited, 75. SOC. EDUC. 1, 1 (2002) (“[T]he contribution of schooling to individual economic success could be explained only partly by the cognitive development fostered in schools. . . . . [S]chools prepare people for adult work rules by socializing people to function well and without complaint in the hierarchical structure of the modern corporation.”); Joseph Stiglitz, The Theory of “Screening,” Education, and the Distribution of Income, 65 AM. ECON. REV. 283, 298 (1975) (arguing that education acts to provide information to employers about the innate abilities and characteristics of prospective employees and that education may not in and of itself improve labor productivity); Paul J. Taubman & Terence J. Wales, Higher Education, Mental Ability, and Screening, 81 J. POL. ECON. 28, 43 (1973) (supporting the screening hypothesis). 8. OECD, supra note 2, at 165 (“Investments in education also generate public returns from higher income levels in the form of income taxes, increased social insurance payments and lower social transfers.”). 9. See id. at 193
A large body of literature suggests that education is positively associated with a variety of social outcomes, such as better health, stronger civic engagement and reduced crime. A small but increasing number of studies further suggest that education has a positive causal effect on these social outcomes. There is also research suggesting that
8 70 WASH. & LEE L. REV. 0000 (2013)
and more rapid technological innovation and economic growth.10
education can be a relatively cost-effective means to improve health and reduce crime. (citations omitted).
Completion of postsecondary education is also associated with lower rates of bankruptcy filing. Abbye Atkinson, Race, Educational Loans and Bankruptcy, 16 MICH. J. RACE & L. 1, 2 (2010). High levels of education for spouses is associated with lower divorce rates, particularly if the education is completed prior to marriage. Torkild Hovde Lyngstad, The Impact of Parents’ and Spouses’ Education on Divorce Rates in Norway, 10 DEMOGRAPHIC RES. 121, 138 (2004); Jessie M. Tzeng & Robert D. Mare, Labor Market and Socioeconomic Effects on Marital Stability, 24 SOC. SCI. RES. 329, 343, 344 tbl.3 (1995). 10. See DEREK BOK, BEYOND THE IVORY TOWER: SOCIAL RESPONSIBILITIES OF THE MODERN UNIVERSITY 138–39 (1982) (discussing the importance of university research on technological innovations); DOUGLASS, supra note 4, at 1 (“We almost owe more of our economic gains in the last seven decades to investment in people than to saving and the amassment of capital. And the margin in favor of people is increasing.” (quoting John Kenneth Galbraith)); Philippe Aghion & Peter Howitt, A Model of Growth through Creative Destruction, 60 ECONOMETRICA 323, 324 (1992); Angel de la Fuente & Rafael Domenech, Human Capital in Growth Regressions: How Much Difference does Data Quality Make?, 4 J. EUR. ECON. ASSOC. 1, 1 (2006) (noting that the counterintuitive results on human capital and growth are partly due to inadequate data); Alan B. Krueger & Mikael Lindahl, Education for Growth: Why and For Whom?, 39 J. ECON. LIT. 1101, 1102 (2001) (arguing that studies that failed to find a connection between education and growth suffered from poor-quality data, and that such relationships are evident with better data); Paul Romer, Endogenous Technological Change, 98 J. POL. ECON. S71, S71 (1990) (“[T]he stock of human capital determines the rate of growth [and] too little human capital is devoted to research in equilibrium.”); Jacob Mincer, Human Capital and Economic Growth (Nat’l Bureau of Econ. Research, Working Paper No. 803, 1981), available at http://www.nber.org/papers/w0803
Just as accumulation of personal human capital produces individual (income) growth, so do the corresponding social or national aggregates. . . . growth of human capital is both a condition and consequence of economic growth . . . . [h]uman capital activities involve . . . the production of new knowledge which is the source of innovation and of technical change which propels all factors of production.
RISK-BASED STUDENT LOANS 9
Figure 1.1: Educated Workers Earn More and Are Unemployed Less
$1,665
$1,551
$1,263
$1,053
$768
$719
$638
$451
$0 $500 $1,000 $1,500 $2,000
Professional Degree
Doctoral Degree
Master's Degree
Bachelor's Degree
Associate's Degree
Some college, no degree
High school diploma
Less than high school diploma
Educational attainment and median weekly earnings, 2011 2011 USD, workers age 25 or over
Source: Bureau of Labor Statistics, U.S. Department of Labor and U.S. Census Bureau, Current Population Survey
2.4%
2.5%
3.6%
4.9%
6.8%
8.7%
9.4%
14.1%
0% 2% 4% 6% 8% 10% 12% 14% 16%
Professional Degree
Doctoral Degree
Master's Degree
Bachelor's Degree
Associate's Degree
Some college, no degree
High school diploma
Less than high school diploma
Educational attainment and average unemployment rates, 2011 Percent of workers age 25 or older who were unemployed
Source: Bureau of Labor Statistics, U.S. Department of Labor and U.S. Census Bureau, Current Population Survey
10 70 WASH. & LEE L. REV. 0000 (2013)
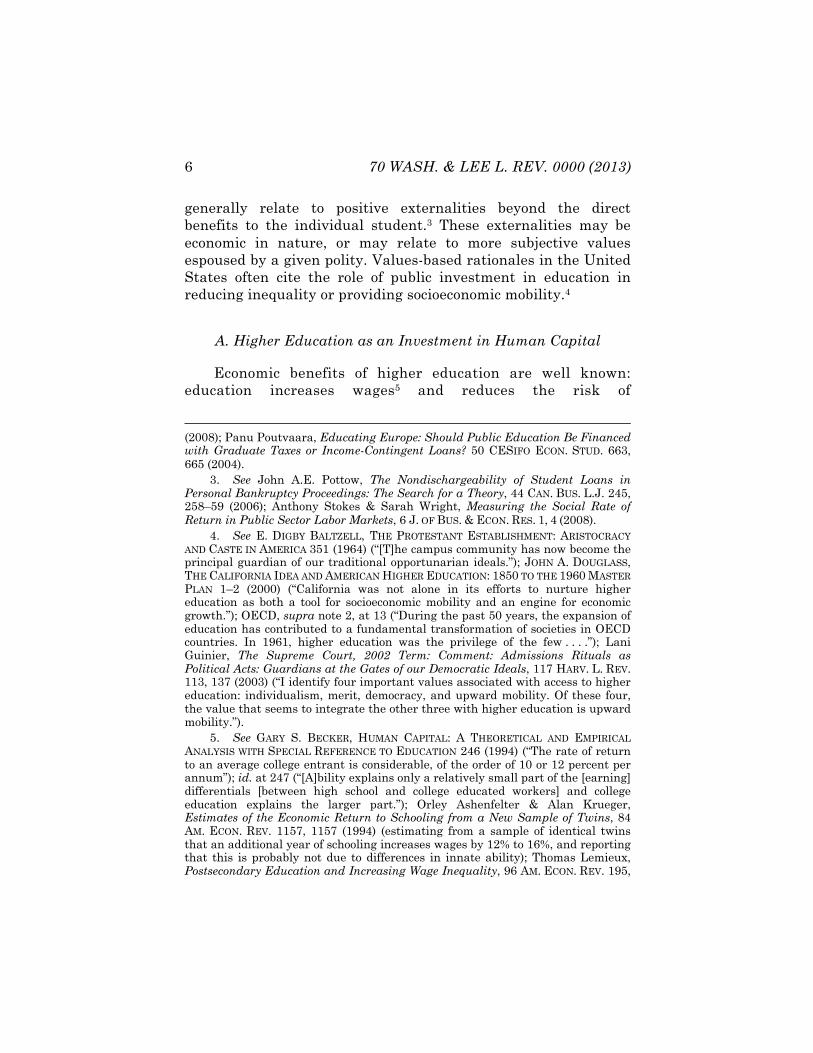
Figure 1.2: Decades of Data Show that Educated Workers Are Less Likely to be Unemployed
Less than high school diploma
High School
Some College
Bachelor's degree
Master's degree
Doctoral degree
Professional degree
0%
2%
4%
6%
8%
10%
12%
14%
16%
Average annual unemployment rates, age 25 or older, 1992-2011 Percent of workers age 25 or older who were unemployed
Source: Bureau of Labor Statistics, U.S. Department of Labor and U.S. Census Bureau, Current Population Survey, Labor Force Statistics
RISK-BASED STUDENT LOANS 11
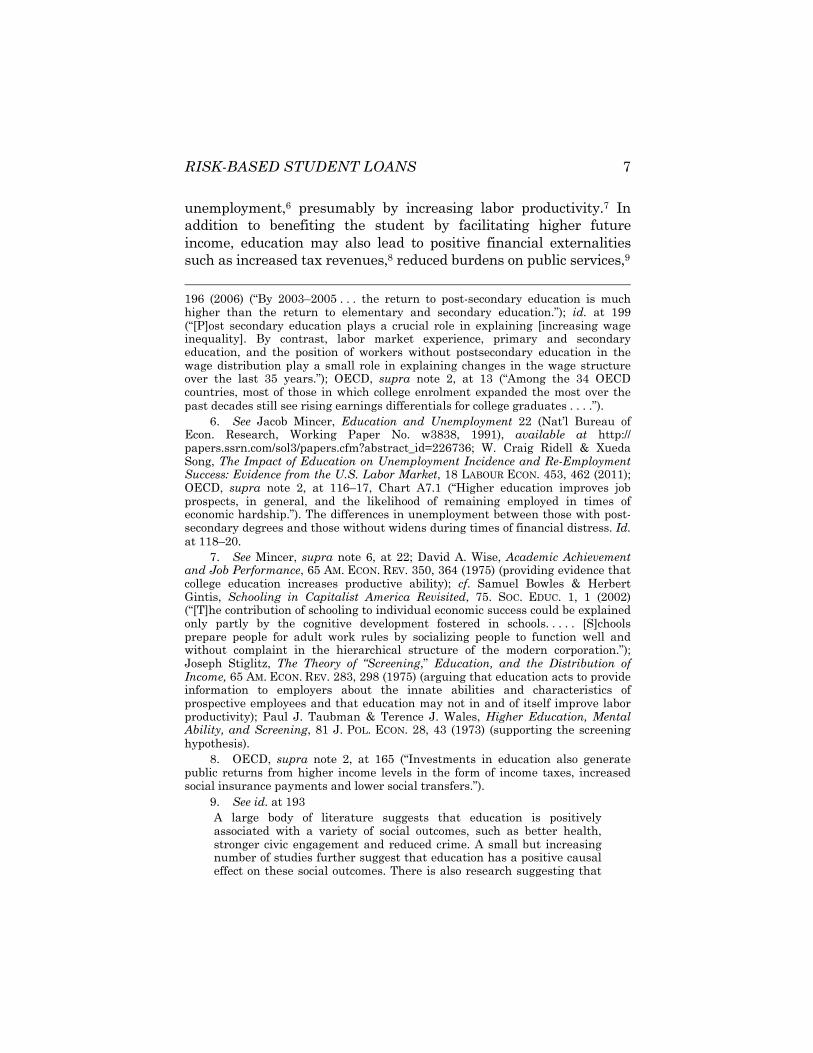
Figure 1.3: Decades of Data Show that Educated Workers Earn More, and the Wage Premium Has Increased over
the Last Thirty Years
Professional degree
Doctoral degree
Master's degree
College graduate or above
Bachelor's degree
Some college or associate degree
High school graduate
Less than high school
$0
$200
$400
$600
$800
$1,000
$1,200
$1,400
$1,600
$1,800
Median usual weekly earnings of full-time workers 25 years and over by educational attainment, 1979-2011 Real 2011 USD
"#$%&'(!)$%%'*+!,#-$./0#*!"$%1'23!4$%'/$!#5!6/7#%!"+/080&8!
12 70 WASH. & LEE L. REV. 0000 (2013)
This perspective—known as “Human Capital Theory”11—is the leading economic explanation for the higher wages of educated workers. An alternate view that developed during the 1970s, “Signaling Theory,” claims that education leads to a more efficient allocation of talent by sorting workers according to innate ability.12 Risk-based pricing of student loans is compatible with either a Human Capital or Signaling view, although the case for subsidized education is stronger under Human Capital Theory.
Empirical evidence in favor of Human Capital Theory has mounted over the last thirty-five years, including many studies of wage differences of identical twins who differed with respect to the number of years of education.13 In addition to the twin studies, there have been many careful econometric studies that controlled for various measures of innate ability.14 These studies
11. Gordon Marshall, Human-Capital Theory, in A DICTIONARY OF SOCIOLOGY 1998 (1998) (“Human capital arises out of any activity able to raise individual work productivity.”). 12. See Stiglitz, supra note 7, at 283 (discussing a “screening” process that allows individuals to be labeled by their productivity); Taubman & Wales, supra note 7, at 43–49 (suggesting using education as a screening device). Under Signaling Theory, education can create value because it enables the employers who value skilled workers the most to identify those workers and bid for their services, leading to a more efficient allocation of skilled labor. Signaling Theory implies that labor market outcomes should not depend on what students study, but only on how well they perform academically relative to other students with similar standardized test scores, or perhaps whether they demonstrate a strong work ethic by choosing a challenging major. 13. See, e.g., Ashenfelter, supra note 5, at 1157; Dorothe Bonjour et al., Returns to Education: Evidence from U.K. Twins, 93 AM. ECON. REV. 1799, 1799–1812 (2003); Colm Harmon & Ian Walker, Estimates of the Economic Return to Schooling for the United Kingdom, 85 AM. ECON. REV. 1278, 1278–86 (1995); Paul Miller, Charles Mulvey & Nick Martin, What Do Twins Studies Reveal About the Economic Returns to Education? A Comparison of Australian and U.S. Findings, 85 AM. ECON. REV. 586, 586–99 (1995); Oddbjorn Raaum & Tom Erik Aabo, The Effect of Schooling on Earnings: Evidence on the Role of Family Background From a Large Sample of Norwegian Twins, 26 NORDIC J. POL. ECON. 96 (2000); Cecelia Elena Rouse, Further Estimates of the Economic Returns to Schooling from a New Sample of Twins, 18 ECON. EDUC. REV. 149, 149–157 (1999); cf. David Neumark, Biases in Twin Estimates of Returns to Schooling, 18 ECON. EDUC. REV. 143–48 (1999) (discussing how within-twin estimates may result in an upward bias). 14. See David Card, The Causal Effect of Education on Earnings, in 3
RISK-BASED STUDENT LOANS 13
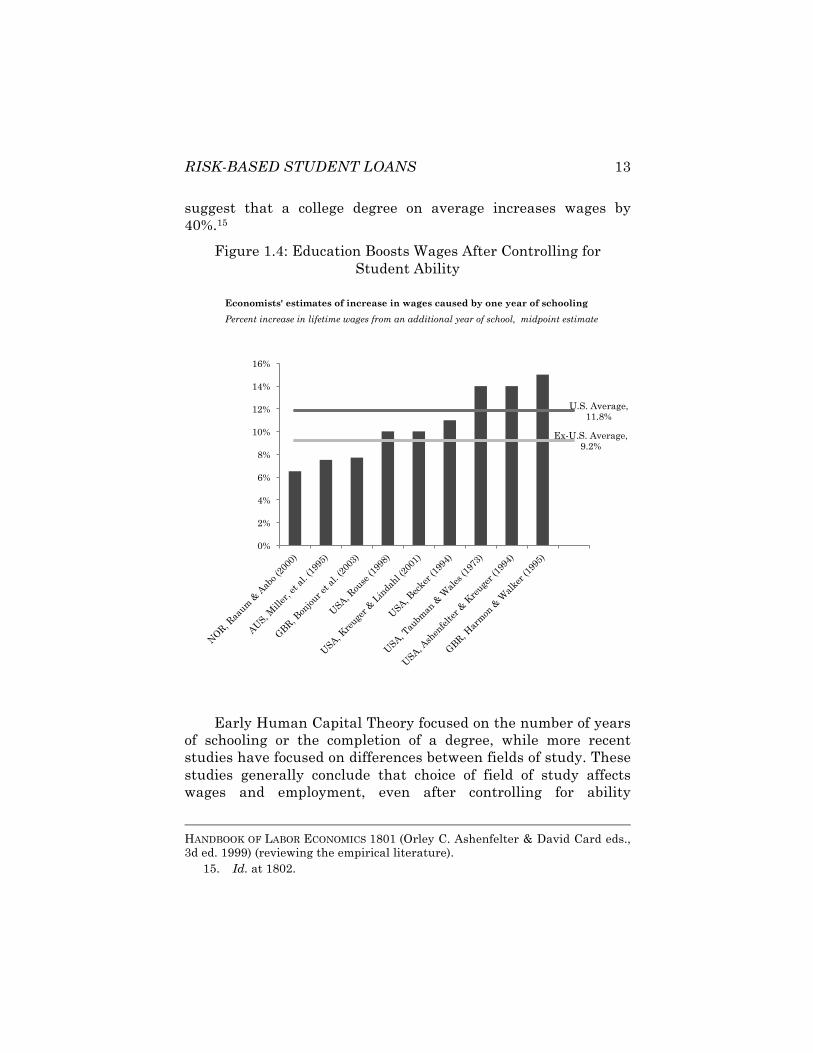
suggest that a college degree on average increases wages by 40%.15
Figure 1.4: Education Boosts Wages After Controlling for Student Ability
Early Human Capital Theory focused on the number of years of schooling or the completion of a degree, while more recent studies have focused on differences between fields of study. These studies generally conclude that choice of field of study affects wages and employment, even after controlling for ability
HANDBOOK OF LABOR ECONOMICS 1801 (Orley C. Ashenfelter & David Card eds., 3d ed. 1999) (reviewing the empirical literature). 15. Id. at 1802.
U.S. Average, 11.8%
Ex-U.S. Average, 9.2%
0%
2%
4%
6%
8%
10%
12%
14%
16%
Economists' estimates of increase in wages caused by one year of schooling
Percent increase in lifetime wages from an additional year of school, midpoint estimate !!
14 70 WASH. & LEE L. REV. 0000 (2013)
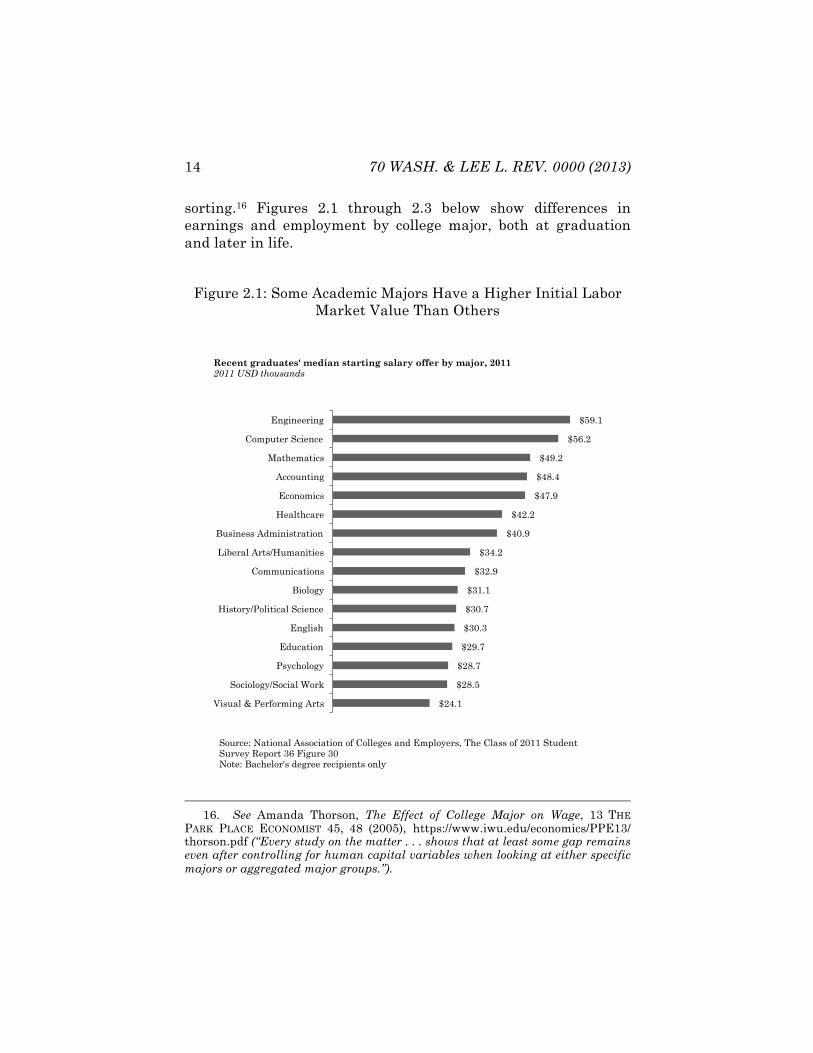
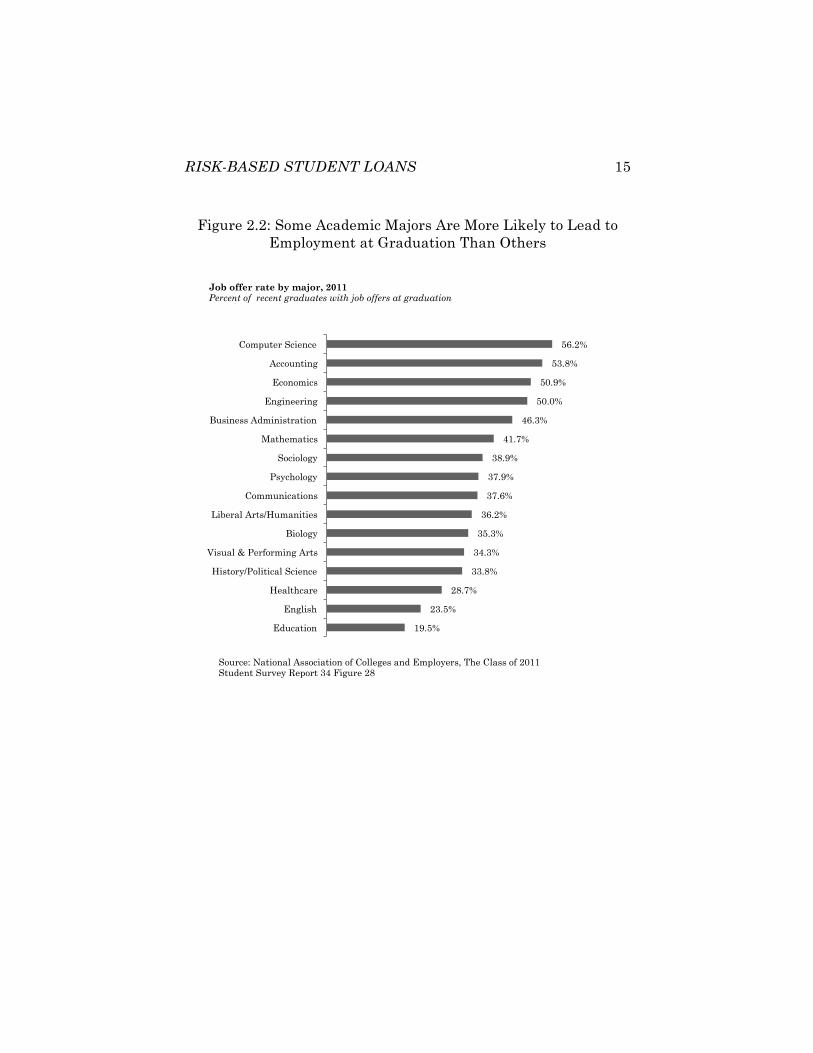
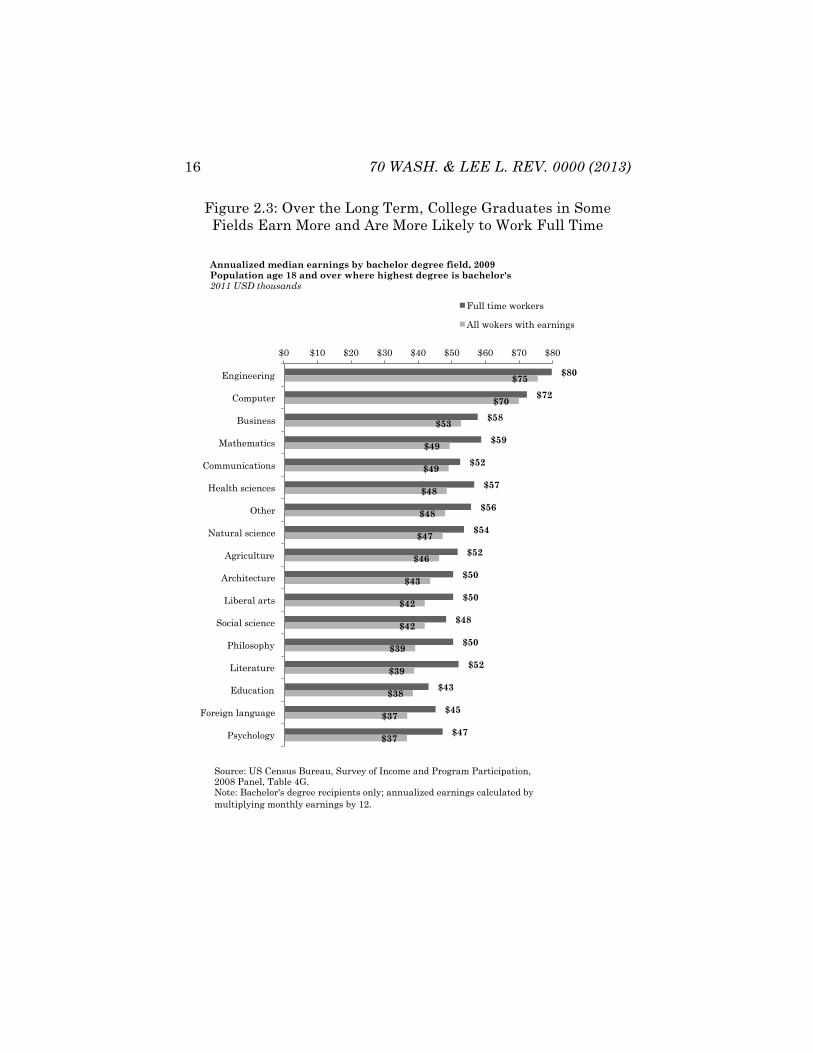
sorting.16 Figures 2.1 through 2.3 below show differences in earnings and employment by college major, both at graduation and later in life.
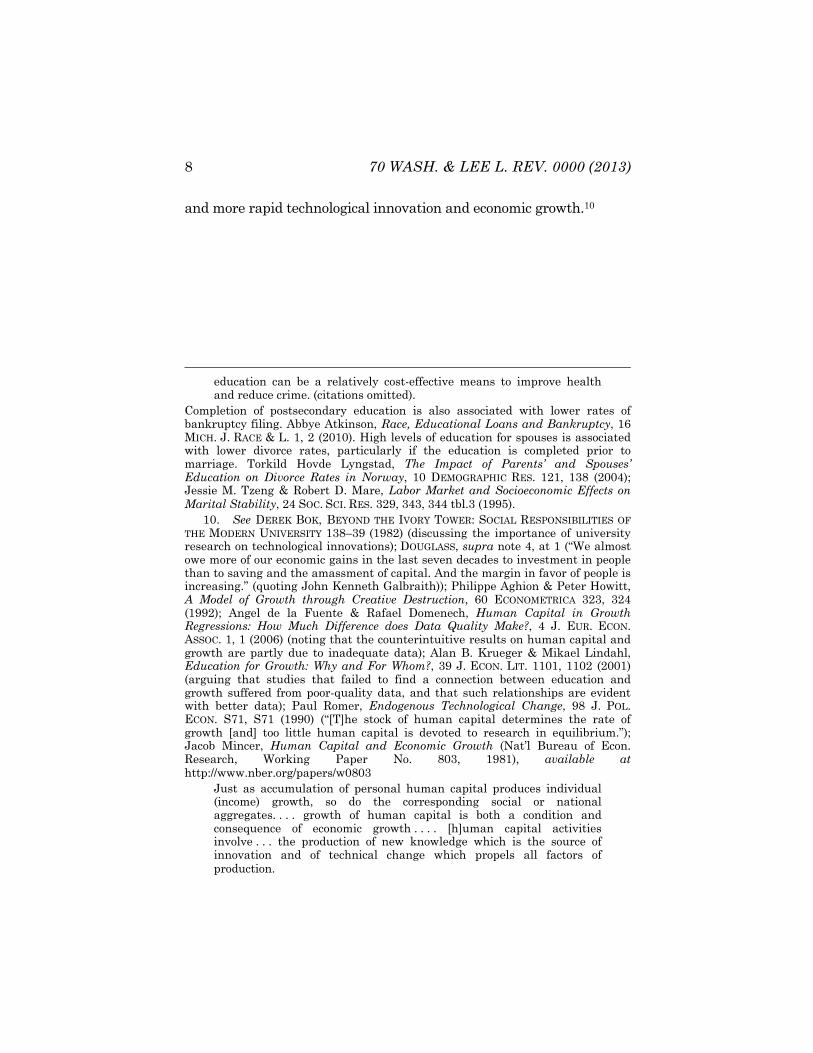
Figure 2.1: Some Academic Majors Have a Higher Initial Labor Market Value Than Others
16. See Amanda Thorson, The Effect of College Major on Wage, 13 THE PARK PLACE ECONOMIST 45, 48 (2005), https://www.iwu.edu/economics/PPE13/ thorson.pdf (“Every study on the matter . . . shows that at least some gap remains even after controlling for human capital variables when looking at either specific majors or aggregated major groups.”).
$59.1
$56.2
$49.2
$48.4
$47.9
$42.2
$40.9
$34.2
$32.9
$31.1
$30.7
$30.3
$29.7
$28.7
$28.5
$24.1
Engineering
Computer Science
Mathematics
Accounting
Economics
Healthcare
Business Administration
Liberal Arts/Humanities
Communications
Biology
History/Political Science
English
Education
Psychology
Sociology/Social Work
Visual & Performing Arts
Recent graduates' median starting salary offer by major, 2011 2011 USD thousands
Source: National Association of Colleges and Employers, The Class of 2011 Student Survey Report 36 Figure 30 Note: Bachelor's degree recipients only
RISK-BASED STUDENT LOANS 15
Figure 2.2: Some Academic Majors Are More Likely to Lead to
Employment at Graduation Than Others
56.2%
53.8%
50.9%
50.0%
46.3%
41.7%
38.9%
37.9%
37.6%
36.2%
35.3%
34.3%
33.8%
28.7%
23.5%
19.5%
Computer Science
Accounting
Economics
Engineering
Business Administration
Mathematics
Sociology
Psychology
Communications
Liberal Arts/Humanities
Biology
Visual & Performing Arts
History/Political Science
Healthcare
English
Education
Job offer rate by major, 2011 Percent of recent graduates with job offers at graduation
Source: National Association of Colleges and Employers, The Class of 2011 Student Survey Report 34 Figure 28
16 70 WASH. & LEE L. REV. 0000 (2013)
Figure 2.3: Over the Long Term, College Graduates in Some Fields Earn More and Are More Likely to Work Full Time
$80
$72
$58
$59
$52
$57
$56
$54
$52
$50
$50
$48
$50
$52
$43
$45
$47
$75
$70
$53
$49
$49
$48
$48
$47
$46
$43
$42
$42
$39
$39
$38
$37
$37
$0 $10 $20 $30 $40 $50 $60 $70 $80
Engineering
Computer
Business
Mathematics
Communications
Health sciences
Other
Natural science
Agriculture
Architecture
Liberal arts
Social science
Philosophy
Literature
Education
Foreign language
Psychology
Full time workers
All wokers with earnings
Annualized median earnings by bachelor degree field, 2009 Population age 18 and over where highest degree is bachelor's 2011 USD thousands
Source: US Census Bureau, Survey of Income and Program Participation, 2008 Panel, Table 4G. Note: Bachelor's degree recipients only; annualized earnings calculated by multiplying monthly earnings by 12.
RISK-BASED STUDENT LOANS 17
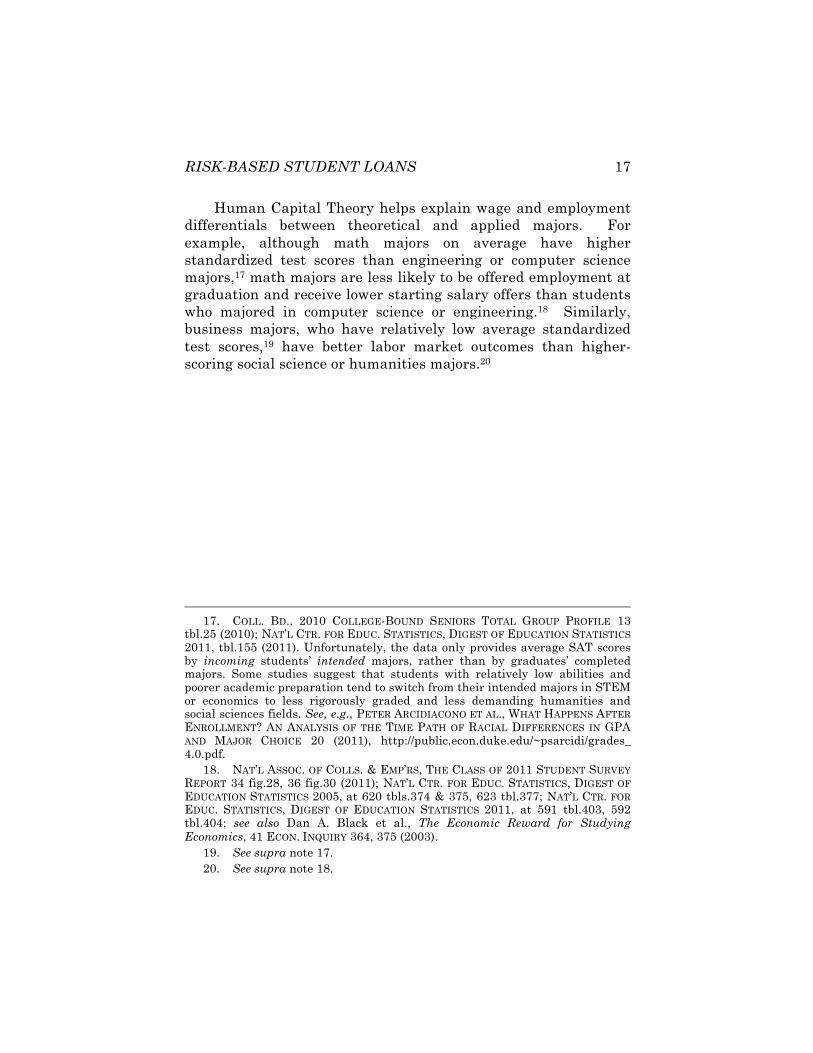
Human Capital Theory helps explain wage and employment differentials between theoretical and applied majors. For example, although math majors on average have higher standardized test scores than engineering or computer science majors,17 math majors are less likely to be offered employment at graduation and receive lower starting salary offers than students who majored in computer science or engineering.18 Similarly, business majors, who have relatively low average standardized test scores,19 have better labor market outcomes than higher-scoring social science or humanities majors.20
17. COLL. BD., 2010 COLLEGE-BOUND SENIORS TOTAL GROUP PROFILE 13 tbl.25 (2010); NAT’L CTR. FOR EDUC. STATISTICS, DIGEST OF EDUCATION STATISTICS 2011, tbl.155 (2011). Unfortunately, the data only provides average SAT scores by incoming students’ intended majors, rather than by graduates’ completed majors. Some studies suggest that students with relatively low abilities and poorer academic preparation tend to switch from their intended majors in STEM or economics to less rigorously graded and less demanding humanities and social sciences fields. See, e.g., PETER ARCIDIACONO ET AL., WHAT HAPPENS AFTER ENROLLMENT? AN ANALYSIS OF THE TIME PATH OF RACIAL DIFFERENCES IN GPA AND MAJOR CHOICE 20 (2011), http://public.econ.duke.edu/~psarcidi/grades_ 4.0.pdf. 18. NAT’L ASSOC. OF COLLS. & EMP’RS, THE CLASS OF 2011 STUDENT SURVEY REPORT 34 fig.28, 36 fig.30 (2011); NAT’L CTR. FOR EDUC. STATISTICS, DIGEST OF EDUCATION STATISTICS 2005, at 620 tbls.374 & 375, 623 tbl.377; NAT’L CTR. FOR EDUC. STATISTICS, DIGEST OF EDUCATION STATISTICS 2011, at 591 tbl.403, 592 tbl.404; see also Dan A. Black et al., The Economic Reward for Studying Economics, 41 ECON. INQUIRY 364, 375 (2003). 19. See supra note 17. 20. See supra note 18.
18 70 WASH. & LEE L. REV. 0000 (2013)
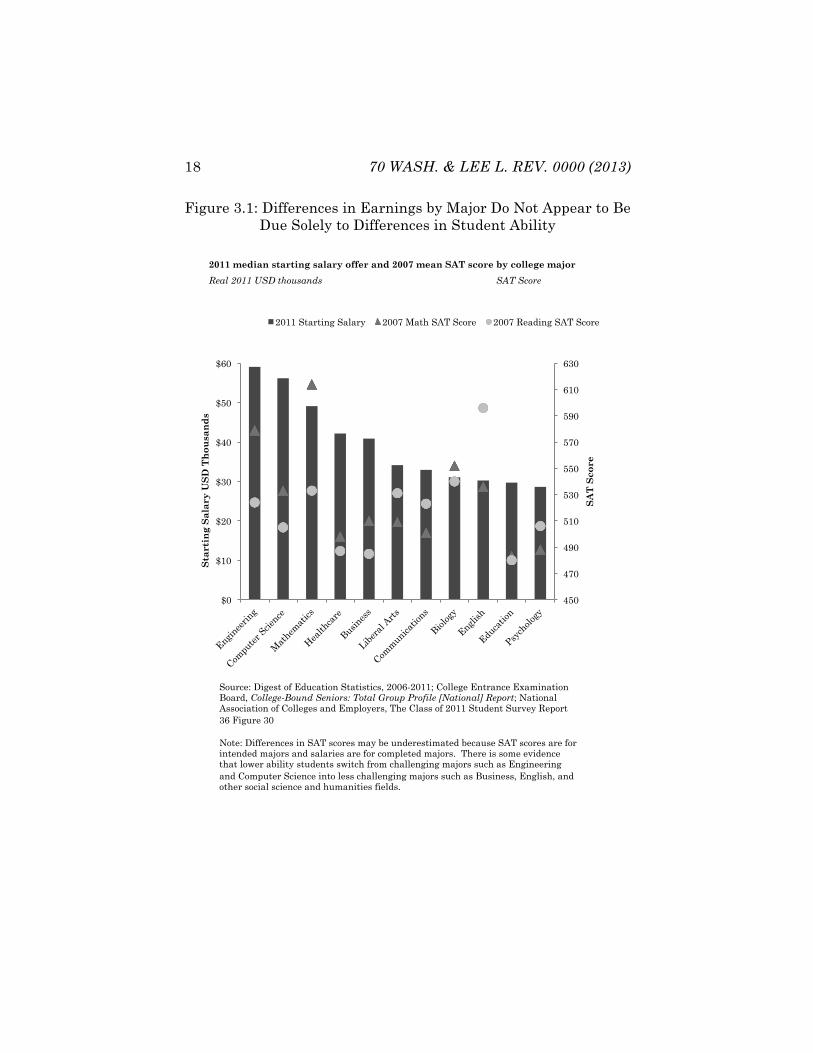
Figure 3.1: Differences in Earnings by Major Do Not Appear to Be Due Solely to Differences in Student Ability
450
470
490
510
530
550
570
590
610
630
$0
$10
$20
$30
$40
$50
$60
SA
T S
core
Sta
rtin
g S
ala
ry U
SD
Th
ou
san
ds
2011 Starting Salary 2007 Math SAT Score 2007 Reading SAT Score
2011 median starting salary offer and 2007 mean SAT score by college major
Real 2011 USD thousands ! !SAT Score !!
Source: Digest of Education Statistics, 2006-2011; College Entrance Examination Board, College-Bound Seniors: Total Group Profile [National] Report; National Association of Colleges and Employers, The Class of 2011 Student Survey Report 36 Figure 30 Note: Differences in SAT scores may be underestimated because SAT scores are for intended majors and salaries are for completed majors. There is some evidence that lower ability students switch from challenging majors such as Engineering and Computer Science into less challenging majors such as Business, English, and other social science and humanities fields.
RISK-BASED STUDENT LOANS 19
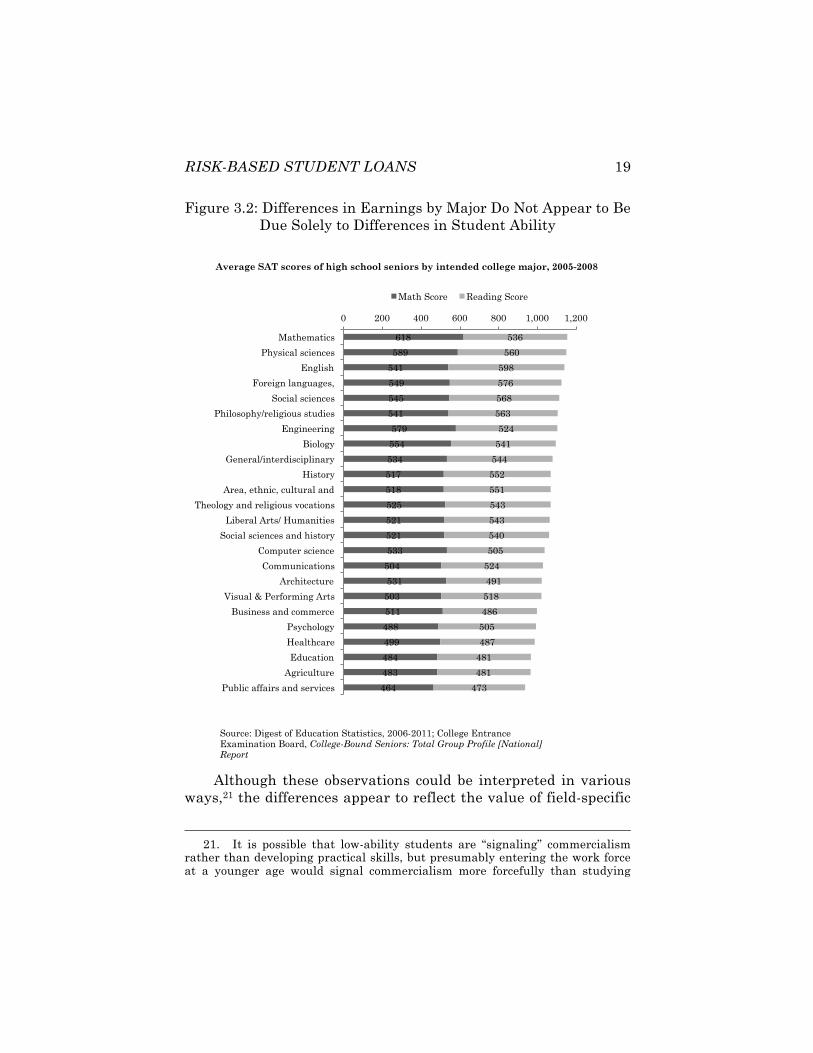
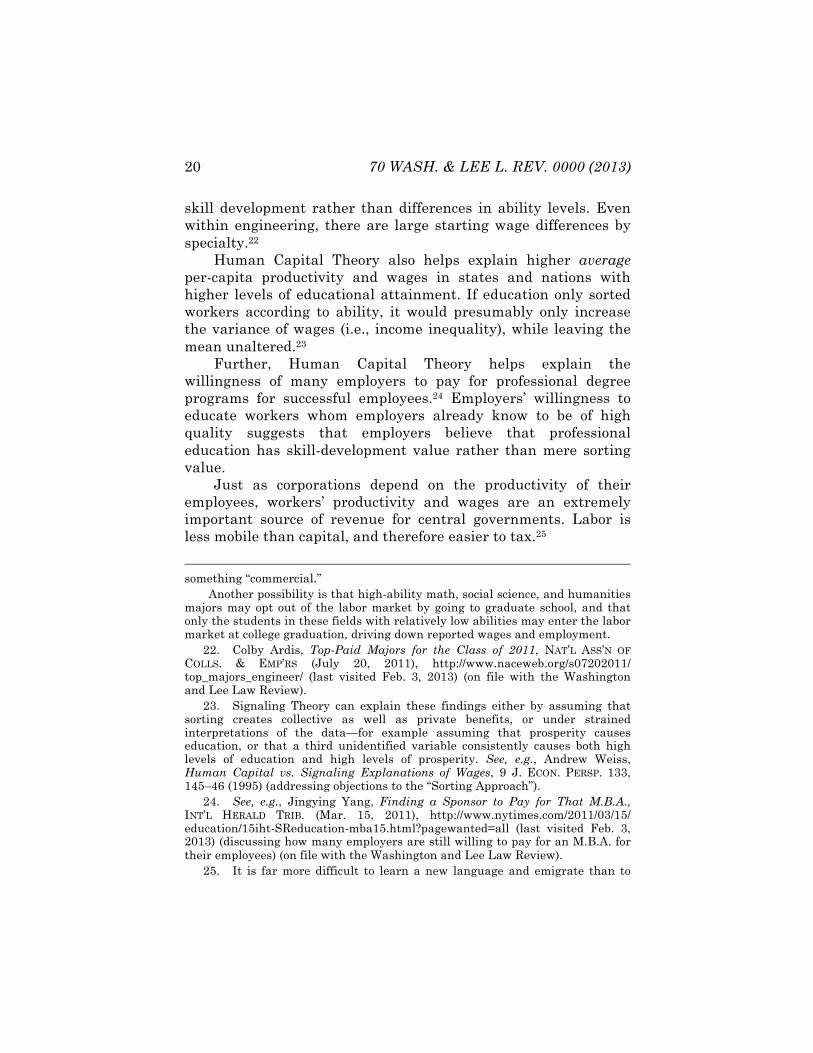
Figure 3.2: Differences in Earnings by Major Do Not Appear to Be Due Solely to Differences in Student Ability
Although these observations could be interpreted in various ways,21 the differences appear to reflect the value of field-specific
21. It is possible that low-ability students are “signaling” commercialism rather than developing practical skills, but presumably entering the work force at a younger age would signal commercialism more forcefully than studying
618
589
541
549
545
541
579
554
534
517
518
525
521
521
533
504
531
503
511
488
499
484
483
464
536
560
598
576
568
563
524
541
544
552
551
543
543
540
505
524
491
518
486
505
487
481
481
473
0 200 400 600 800 1,000 1,200
Mathematics
Physical sciences
English
Foreign languages,
Social sciences
Philosophy/religious studies
Engineering
Biology
General/interdisciplinary
History
Area, ethnic, cultural and
Theology and religious vocations
Liberal Arts/ Humanities
Social sciences and history
Computer science
Communications
Architecture
Visual & Performing Arts
Business and commerce
Psychology
Healthcare
Education
Agriculture
Public affairs and services
Math Score Reading Score
Average SAT scores of high school seniors by intended college major, 2005-2008
Source: Digest of Education Statistics, 2006-2011; College Entrance Examination Board, College-Bound Seniors: Total Group Profile [National] Report
20 70 WASH. & LEE L. REV. 0000 (2013)
skill development rather than differences in ability levels. Even within engineering, there are large starting wage differences by specialty.22
Human Capital Theory also helps explain higher average per-capita productivity and wages in states and nations with higher levels of educational attainment. If education only sorted workers according to ability, it would presumably only increase the variance of wages (i.e., income inequality), while leaving the mean unaltered.23
Further, Human Capital Theory helps explain the willingness of many employers to pay for professional degree programs for successful employees.24 Employers’ willingness to educate workers whom employers already know to be of high quality suggests that employers believe that professional education has skill-development value rather than mere sorting value.
Just as corporations depend on the productivity of their employees, workers’ productivity and wages are an extremely important source of revenue for central governments. Labor is less mobile than capital, and therefore easier to tax.25
something “commercial.”
Another possibility is that high-ability math, social science, and humanities majors may opt out of the labor market by going to graduate school, and that only the students in these fields with relatively low abilities may enter the labor market at college graduation, driving down reported wages and employment. 22. Colby Ardis, Top-Paid Majors for the Class of 2011, NAT’L ASS’N OF COLLS. & EMP’RS (July 20, 2011), http://www.naceweb.org/s07202011/ top_majors_engineer/ (last visited Feb. 3, 2013) (on file with the Washington and Lee Law Review). 23. Signaling Theory can explain these findings either by assuming that sorting creates collective as well as private benefits, or under strained interpretations of the data—for example assuming that prosperity causes education, or that a third unidentified variable consistently causes both high levels of education and high levels of prosperity. See, e.g., Andrew Weiss, Human Capital vs. Signaling Explanations of Wages, 9 J. ECON. PERSP. 133, 145–46 (1995) (addressing objections to the “Sorting Approach”). 24. See, e.g., Jingying Yang, Finding a Sponsor to Pay for That M.B.A., INT’L HERALD TRIB. (Mar. 15, 2011), http://www.nytimes.com/2011/03/15/ education/15iht-SReducation-mba15.html?pagewanted=all (last visited Feb. 3, 2013) (discussing how many employers are still willing to pay for an M.B.A. for their employees) (on file with the Washington and Lee Law Review). 25. It is far more difficult to learn a new language and emigrate than to
RISK-BASED STUDENT LOANS 21
In a country such as the United States, which taxes wages at much higher rates than capital, public expenditures that increase wages are more likely to benefit public finances through higher future tax revenues than public expenditures that increase the return on private capital.26
Whereas the capital gains tax rate is typically fifteen percent, the average effective tax rate on human capital—that is, the tax on the increase in wages attributable to education—will often be around thirty to fifty percent because the wage premium will fall into high federal, state, and local income tax brackets and will often also be subject to payroll taxes.27 In addition, education is not treated as favorably under the Tax Code as other forms of investment with respect to the ability to recover investment costs, deduct interest on loans, or smooth income across tax years.
convert capital to a new currency and invest across borders. See, e.g., OECD, TAX POLICY REFORM AND ECONOMIC GROWTH 19 (2010) (“Globalization may . . . increase the opportunities for tax avoidance and evasion especially as concerns mobile capital income tax bases.”); id. at 138–40 (describing increased capital mobility leading to tax competition and lower capital gains and corporate taxes in many developed countries). 26. Wages are subject to both federal income taxes and federal payroll taxes, whereas capital gains and dividends are subject only to income taxes. Income tax rates for capital gains and dividends are much lower than income tax rates for wages. The difference in tax treatment of income from wages and income from capital is so extreme that although the income tax is nominally progressive, in practice extremely wealthy individuals who derive most of their income from investments have much lower average federal tax rates than middle class workers who derive most of their income from wages. See Martin A. Sullivan, Economic Analysis: At the Helmsley Building, the Little People Pay the Taxes, 130 TAX NOTES 855, 855–56 (2011) (discussing how tax rates are lower for the very wealthy than for the average person). Some have countered that corporate income taxes should be counted as additional taxes on capital, but whether the incidence of corporate tax is primarily on investors, employees, or customers remains hotly debated. See, e.g., Charles E. McLure, Jr., The Elusive Incidence of the Corporate Income Tax: The State Case, 9 PUB. FIN. Q. 395, 395–98 (1981) (discussing the controversies and approaches to the corporate income tax). 27. See, e.g., OECD, TAXING WAGES 2008–2009, at 109 (2010) (estimating total 2009 marginal tax burden on labor in the U.S. to be between 30% and 60% for workers earning at least 50% of the average wage, with the highest tax burdens on singles).
22 70 WASH. & LEE L. REV. 0000 (2013)
In sum, a large proportion of the benefits of human capital redound to public finances rather than to the educated worker. Education is generally a profitable public investment, not a mere expenditure.28 In fact, the public benefits from higher education in the United States are the highest in the developed world, while public costs are among the lowest,29 suggesting that public investment in higher education in the United States could be profitably increased.
B. The Demand for Skilled Labor and Social Mobility
Whereas private higher education in the United States was originally a form of luxury consumption—training for the financially secure children of the upper class that emphasized cultural refinement and social grace over technical skill30—federal government support for higher education emerged with a belief by business leaders that education can and should promote economic development by training skilled labor and supporting applied research.31 This emphasis on economic development is evident in the requirements of the Northwest Ordinances of 1785 and 178732 and the Morrill Act of 1862,33 under which the federal
28. OECD, supra note 2, at 158–60 (reporting that public and private benefits of education in OECD countries, including the U.S., greatly exceed public and private investment in education). 29. Id. at 165–67. 30. DOUGLASS, supra note 4, at 2; OECD, supra note 2, at 13. 31. DOUGLASS, supra note 4, at 2–3, 33–34. The strongest proponents of practical education were Northeastern business interests, while the principal opposition came from Southern conservatives. Id. 32. See the full text transcripts of Land Ordinance 1785, available at http://memory.loc.gov/cgibin/query/r?ammem/bdsdcc:@field(DOCID+@lit(bdsdcc13201)), and 1787 available at http://www.ourdocuments.gov/doc.php?doc=8 (last visited Feb. 3, 2013) (on file with the Washington and Lee Law Review); DOUGLASS, supra note 4, at 20 (“The constitutions of existing states provided for one or more state-supported institutions of higher learning as a means to further social and economic progress and as a legal mechanism for securing federal land grants for education under the Northwest Ordinances of 1785 and 1787.”). 33. Officially known as the Agricultural College Land Act. 7 U.S.C. §§ 301–49 (2012). See BOK, supra note 10, at 62 (“Americans tended to look on higher education as a means for providing the knowledge and trained man power that
RISK-BASED STUDENT LOANS 23
government granted land to state governments to fund public institutions of higher learning that would teach labor-market-relevant skills.34
Similarly, Congress emphasized the need for a technically skilled labor force, particularly in areas of science and technology, when it implemented the first federal student loan program through the National Defense Education Act of 1958 (NDEA).35 The need for greater central government support for higher education was made salient in 1957 by the Soviet Union’s launch of Sputnik I and II, the first man-made satellites.36 These early Soviet technological triumphs over the United States were generally attributed in the U.S. to the Soviet Unions’ seemingly superior system of education.37 The Soviet educational system, compared to the U.S. system, was believed to be more meritocratic, to focus more on science and technology, and to
a rapidly developing society required. In 1862, Congress embodies this spirit in the Morrill Act . . . .”); DOUGLASS, supra note 4, at 34 (“As a condition for accepting Federal scrip, by 1866 each state would need to charter either existing or new institutions to fulfill the purpose of the act: namely, to provide agricultural, mining, and mechanical education in support of the state’s economy.”). 34. DOUGLASS, supra note 4, at 33–34. 35. See id. at 198; Atkinson supra note 9, at 14 n.44 (citing National Defense Education Act of 1958, ch. 17, §§ 401–602, 72 Stat. 1589 (repealed 1970); Jonathan D. Glater, The Other Big Test: Why Congress Should Allow College Students to Borrow More Through Federal Aid Programs, 14 N.Y.U. J. LEGIS. & PUB. POL’Y 11, 37 (2011)
The guaranteed student loan program [established by the Higher Education Act of 1965] took as its model . . . loans offered under the National Defense Education Act (NDEA), a law passed in 1958 in reaction to the launch of the Sputnik satellite by the Soviet Union. At that time, lawmakers encouraged Americans to educate themselves in scientific and technical fields.
36. See DOUGLASS, supra note 4, at 198 (“[T]he substantial increases in direct student aid under post-Sputnik federal legislation initiated a new era of federal involvement in higher education.”); id. at 234 (“Sputnik was a technological marvel. It was the first intercontinental missile, opened the space age, and marked the beginning of satellite communications. It was also a profound political event.”). 37. See id. at 234 (“American popular opinion credited the Soviet Educational System with Sputnik’s success. Here was the source for its scientists and research. Conversely, the reason for America’s apparent second place position . . . was its faltering schools and universities.”).
24 70 WASH. & LEE L. REV. 0000 (2013)
more closely coordinate its efforts with national economic and military priorities.38 During the space race that followed, the U.S. shifted toward a centralized, taxpayer-funded, and government-coordinated model of university-based scientific and technical research, coupled with increased education subsidies.
In approving subsequent federal student loan programs, such as the guaranteed loan program established by the Higher Education Act of 1965,39 Congress emphasized the need for greater equality of opportunity and social mobility as well as the need for a skilled labor force.40
Recently, state governments have renewed their insistence that public support for higher education should be conditional on higher education serving the needs of the labor market and economic growth.41 And educational leaders have recognized the legitimacy of government efforts to coordinate universities’ activities with economic priorities.42
38. See id. (“The quick conclusion of many was that America’s system of education was disorganized, it failed to provide sufficient training in the sciences, and it catered to mediocrity at the expense of the promising student.”); see also BOK, supra note 10, at 40 (“We should also not suppose that the aggregate efforts of many hundreds of institutions and many thousands of professors will automatically distribute themselves in a pattern that matches the country’s needs.”). 39. Pub. L. No. 89-329, 79 Stat. 1219. 40. Glater, supra note 35, at 20, 35–38. 41. See ERIN SPARKS & MARY JO WAITS, NAT’L GOVERNORS ASS’N CTR. FOR BEST PRACTICES, DEGREES FOR WHAT JOBS? RAISING EXPECTATIONS FOR UNIVERSITIES AND COLLEGES IN A GLOBAL ECONOMY 40 (2011), http://www.nga.org/files/live/sites/NGA/files/pdf/1103DEGREESJOBS.PDF (“Governors and state policymakers are increasingly recognizing the importance of ensuring that students who graduate from institutions of higher education . . . are equipped with the skills to fill good, high-paying jobs that are in high demand by employers, thereby boosting the state’s economic growth.”). 42. See BOK, supra note 10, at 40.
[W]e cannot assume that . . . market forces will automatically lead colleges and universities to train physicians or doctoral students in numbers corresponding to society’s needs. If the government is subsidizing university programs or if these programs are important enough to the public, officials will naturally wish to intervene whenever the results stray too far from the nation’s interests.
RISK-BASED STUDENT LOANS 25
C. Values-Based Arguments for Higher Education Funding
In addition to financial benefits, many commentators have argued that education provides some ethical, spiritual, or political benefits, not only to the individual student, but also to society at large.43 Purported benefits of education range from promoting equality or social mobility, to safeguarding liberty, to reinforcing moral and ethical behavior, to fostering informed participation in democratic processes, to encouraging voluntarism and civic virtue.44
In the nineteenth century, private colleges—in contrast to state universities—often saw their role as the ethical and moral development of good parishioners and good citizens. However, by the mid-twentieth century, this moralistic view was largely supplanted even at elite private colleges by a focus on the role of higher education in promoting individual and collective economic advancement.45
In the United States, social mobility, equality of opportunity, and material progress were viewed not only as private goods, but also as public benefits that legitimized the United States’ political and economic systems, brought more talented individuals into leadership positions, and dampened the appeal of communism. Even as the Cold War has receded into distant memory, the prospects of equal opportunity and social mobility continue to be
43. See OECD, supra note 2, at 192 (“Adults aged 25 to 64 with higher levels of educational attainment are, on average, more satisfied with life, engaged in society and likely to report that they are in good health, even after accounting for differences in gender, age and income.”). 44. See Glater, supra note 35, at 12–13, 16–19; Guinier, supra note 3, at 115–33, 137. 45. See BOK, supra note 10, at 3–4.
[In the early 1900s,] the American University was evolving from a church-oriented college into a larger, more diverse institution with stronger graduate and professional programs capable of serving the needs of a developing economy. . . . [B]usinessmen and financiers quickly replaced the clergy as dominant figures on the boards of leading universities.
See also id. at 62–66; id. at 121 (“[B]y the mid-twentieth century, little remained of the earlier efforts of colleges and universities. Catalogues continued to speak of moral development as a prominent aim of the institution, but there was scant evidence of any serious effort to pursue this objective.”).
26 70 WASH. & LEE L. REV. 0000 (2013)
cited as justifications for inequality—in effect, the prospect of social mobility is a substitute in U.S. political discourse for equality.46
46. See SEYMOUR MARTIN LIPSET & REINHARD BENDIX, SOCIAL MOBILITY IN INDUSTRIAL SOCIETY 2–4, 11–12 (1991). See generally Thomas Piketty, Theories of Persistent Inequality and Intergenerational Mobility, in 1 HANDBOOK OF INCOME DISTRIBUTION 429 (Anthony B. Atkinson & François Bourguignon eds., 2000); Marco H.D. Van Leeuwen, Social Inequality and Mobility in History: An Introduction, 24 CONTINUITY & CHANGE 399 (2009).
There is also a conservative justification for both high inequality and low levels of social mobility, which rests on an assumption of very high heritability of talent or ability, and assumes that those who are poor are deficient in ways that are heritable and largely immutable. See, e.g., RICHARD HERRNSTEIN & CHARLES MURRAY, THE BELL CURVE: INTELLIGENCE AND CLASS STRUCTURE IN AMERICAN LIFE (2004) (arguing that genetically heritable intelligence determines class structure in the United States).
Most labor economists, demographers, sociologists, and psychologists reject this view as inconsistent with the data. See, e.g., MICHAEL HOUT ET AL., INEQUALITY BY DESIGN: CRACKING THE BELL CURVE MYTH (1996) (reanalyzing the data used in the Bell Curve and arguing that the authors overestimated the role of intelligence in setting wages and underweighted the role of manipulable factors such as education); Lisa Barrow & Cecilia Rouse, The Economic Value of Education by Race and Ethnicity, 2006 ECON. PERSP. 14, 23 (analyzing data and concluding that returns on education do not differ by race); James J. Heckman, Lessons from the Bell Curve, 103 J. POL. ECON. 1091, 1091–1120 (1995); Orley Ashenfelter & Cecilia Rouse, Schooling, Intelligence, and Income in America: Cracks in the Bell Curve (Nat’l Bureau of Econ. Research, Working Paper No. 6902, 1999), http://www.nber.org/papers/w6902.pdf (reviewing the econometric literature and concluding that the economic returns on schooling do not differ significantly by family background or by measures of ability of the student); Christopher Winship & Sanders Korenman, A Reanalysis of the Bell Curve 1, 21–22 (Nat’l Bureau of Econ. Res., Working Paper No. 5230, 1995), available at http://papers.ssrn.com/sol3/papers.cfm?abstract_id=225294 (arguing that the measure of parental socioeconomic status used in the Bell Curve did not capture important family characteristics such as single-parent family structure at age fourteen, and therefore overestimated the effects of intelligence).
Psychologists continue to debate the extent to which intelligence is genetically heritable. See, e.g., RICHARD E. NISBETT, INTELLIGENCE AND HOW TO GET IT: WHY SCHOOLS AND CULTURES COUNT 211 (2010) (arguing for a strong environmental role in shaping intelligence); cf. J. Philippe Rushton & Arthur R. Jensen, Race and IQ: A Theory-Based Review of the Research in Richard Nisbett’s Intelligence and How to Get It, 3 OPEN PSYCHOL. J. 9, 9–35 (2010) (arguing for heritability).
However, whatever the heritability of intelligence, there is substantial evidence from randomized controlled studies and quasi-experimental designs that early childhood interventions, smaller class sizes, career training programs, and college completion can improve educational and economic outcomes. See
RISK-BASED STUDENT LOANS 27
D. Higher Education Funding and Independent Research
Governments may also fund educational institutions because of the benefits of unbiased research47 conducted by experts who are insulated from political and market pressures. Notable leaders of educational institutions have expressed concerns that external funding can corrupt academic research.48 For example, industry funding of research is affiliated with scientifically questionable pro-industry conclusions in pharmaceutical research,49 nutritional research,50 and environmental research.51
JOSHUA D. ANGRIST & JORN-STEFFEN PISCHKE, MOSTLY HARMLESS ECONOMETRICS 3–24 (2009) (discussing studies regarding how certain external factors affect educational outcomes). 47. See Charles I. Jones, Sources of U.S. Economic Growth in a World of Ideas, 92 AM. ECON. REV. 220, 228 (2002) (arguing that 30% of U.S. growth between 1950 and 1993 is attributable to the rise in educational attainment and 50% is attributable to the rise in worldwide research intensity). 48. See, e.g., DEREK BOK, UNIVERSITIES IN THE MARKETPLACE: THE COMMERCIALIZATION OF HIGHER EDUCATION 76 (2003) (discussing how external sources of funding may distort the results found). 49. See, e.g., Justin E. Bekelman, Yan Li & Cary P. Gross, Scope and Impact of Financial Conflicts of Interest in Biomedical Research: A Systematic Review, 289 J. AM. MED. ASS’N 454, 455 (2003), http://jama.jamanetwork.com/data/Journals/ JAMA/4865/JRV20091.pdf; Joel Lexchin, Lise Bero, Benjamin Djulbegovic & Otavio Clark, Pharmaceutical Industry Sponsorship and Research Outcome and Quality: Systematic Review, 326 BMJ 1667, 1667 (2003), http://www. ncbi.nlm.nih.gov/pmc/articles/PMC156458/pdf/el-ppr1167.pdf; Sergio Sismondo, How Pharmaceutical Industry Funding Affects Trial Outcomes: Causal Structures and Responses, 66 SOC. SCI. & MED. 1909, 1909 (2008), http://post. queensu.ca/~sismondo/ssm_6194.pdf. 50. See, e.g., Tommy Boone, Is Sports Nutrition for Sale?, PROFESSIONALIZATION OF EXERCISE PHYSIOLOGY ONLINE (July 2004), http://faculty.css.edu/tboone2/asep/IsSportsNutritionForSale.html (last visited Feb. 3, 2013) (on file with the Washington and Lee Law Review); Barrie Margetts, Editorial, Stopping the Rot in Nutrition Science, 9 PUB. HEALTH NUTRITION 169, 171 (2006), http://journals.cambridge.org/action/displayAbstract? fromPage=online&aid=584696. 51. The hydrocarbon/energy industry has funded numerous attacks on the science behind global warming, although virtually none of them have survived peer review and virtually all peer-reviewed scientific research supports the theory of man-made global warming. See ROSS GELBSPAN, THE HEAT IS ON: THE CLIMATE CRISIS, THE COVER-UP, THE PRESCRIPTION 45 (1997); INTERGOVERNMENTAL PANEL ON CLIMATE CHANGE, CLIMATE CHANGE 2007: SYNTHESIS REPORT 30, http://www.ipcc.ch/pdf/assessment-report/ar4/syr/ar4_ syr.pdf (“Warming of the climate system is unequivocal . . . .”); id. at 37 (“There
28 70 WASH. & LEE L. REV. 0000 (2013)
When government funding comes with direct control by political leaders, such funding also creates the risk of attempts to politicize education or enforce a rigid ideology.52 Federal
is very high confidence that the global average net effect of human activities since 1750 has been one of warming . . . .”); id. at 39 (“Most of the observed increase in global average temperatures since the mid-20th century is very likely due to the observed increase in anthropogenic [greenhouse gas] concentrations.”); NAOMI ORESKES & ERIK M. CONWAY, MERCHANTS OF DOUBT: HOW A HANDFUL OF SCIENTISTS OBSCURED THE TRUTH ON ISSUES FROM TOBACCO SMOKE TO GLOBAL WARMING 2–9 (2010) (addressing the doubt cast upon scientific research in regard to the tobacco industry and global warming); JAMES LAWRENCE POWELL, THE INQUISITION OF CLIMATE SCIENCE 64–65 (2011) (noting the criticism of scientists who dissent from the findings of the IPCC); Riley E. Dunlap & Aaron M. McCright, Climate Change Denial: Sources, Actors, and Strategies, in ROUTLEDGE HANDBOOK OF CLIMATE CHANGE AND SOCIETY 240, 240–45 (Constance Lever-Tracy ed., 2010) (examining how uncertainty regarding climate change has been manufactured over time).
In one notable incident, the American Enterprise Institute (AEI), a pro-business “think tank” funded in part by the oil industry, offered scientists $10,000 to produce research that would cast doubt on the scientific consensus regarding global warming. Juliet Eilperin, AEI Critiques of Warming Questioned, WASH. POST, Feb. 5, 2007, http://www.washingtonpost.com/wp-dyn/content/article/2007/02/04/AR2007020401213.html (last visited Feb. 3, 2013) (on file with the Washington and Lee Law Review); Ian Sample, Scientists Offered Cash to Dispute Climate Study, GUARDIAN (UK), Feb. 1, 2007, http://www.guardian.co.uk/environment/2007/feb/02/frontpagenews.climatechange/ (last visited Feb. 3, 2013) (on file with the Washington and Lee Law Review). 52. See, e.g., RAYMOND S. BRADLEY, GLOBAL WARMING AND POLITICAL INTIMIDATION: HOW POLITICIANS CRACKED DOWN ON SCIENTISTS AS THE EARTH HEATED UP (2011); DOUGLASS, supra note 4, at 200–01, 206–13 (discussing politically motivated firings of University of California professors and other politically motivated attacks on academic freedom during the Red Scare and McCarthyism); ELLEN SCHRECKER, THE LOST SOUL OF HIGHER EDUCATION: CORPORATIZATION, THE ASSAULT ON ACADEMIC FREEDOM, AND THE END OF THE AMERICAN UNIVERSITY (2010) (discussing historical challenges by political leaders to academic freedom, particularly during the Red Scare and McCarthyism eras, and renewed attacks in modern times). Politically motivated purges of university professors are not a unique feature of right-wing populism in the United States—similar politically motivated attacks on higher education took place in Nazi Germany, Tsarist Russia, the Soviet Union, and both Nationalist and Communist China. ZHENGYUAN FU, AUTOCRATIC TRADITION AND CHINESE POLITICS 281 (1993); IGAL HALFIN, STALINIST CONFESSIONS: MESSIANISM AND TERROR AT THE LENINGRAD COMMUNIST UNIVERSITY 91–96 (2009); SAMUEL D. KASSOW, STUDENTS, PROFESSORS, AND THE STATE IN TSARIST RUSSIA 29–30 (1989); KRISTIE MACRAKIS, SURVIVING THE SWASTIKA: SCIENTIFIC RESEARCH IN NAZI GERMANY 74–76 (1993); Douglas Stiffler, Resistance to the Sovietization of Higher Education in China, in UNIVERSITIES UNDER DICTATORSHIP 213, 217–19 (John Connelly & Michael Grüttner eds., 2005); see also BOK, supra note 10, at 21–24
RISK-BASED STUDENT LOANS 29
government control over education curricula and personnel decisions is now restricted by statute.53 Tuition—and indirectly, student loans—can provide a neutral source of funding for unbiased research because students are unlikely to have a personal financial or partisan interest in the outcome of their professors’ research.
E. Higher Education Funding Options: Student Debt or General Taxes
To the extent that one accepts the existence of one or more positive externalities of education, education may be a natural public good that should be subsidized by government.54 However, a government’s ability to benefit from educating its citizens may be constrained when government-funded education provides portable skills and workers can readily seek employment across political borders.55 A government that generously funds education with the expectation of higher future tax revenues may fall prey to another government that actively seeks educated immigrants and can charge lower taxes because it does not provide as much public funding for education.56 Governments can reduce the financial risk of
(discussing attacks on academic freedom in the United States by conservatives in the 1950s and by the radical left in the 1960s). 53. Limits on U.S. government control over education are codified at 20 U.S.C. § 1232a. 54. Guinier, supra note 4, at 129–30 (“[The] shift in funding priorities [away from education] was driven in part by an ideological shift during the Reagan era. Higher education was presented as a private benefit to be financed by the individual, instead of a public good to be funded by the government.”). 55. See Demange, Fenge & Uebelmesser, supra note 2, at 248 (arguing that the mobility of students has made educational competition between countries more intense); Poutvaara, supra note 2, at 663 (stating that the training government does not fully realize return of educational investment for emigrants). 56. The United States has been particularly successful at attracting technically skilled immigrants educated in—and often at the expense of—other countries, but not particularly successful at providing technical education to its native population. See Frederic Docquier & Abdeslam Marfouk, International Migration by Education Attainment, 1990-2000, in INTERNATIONAL MIGRATION, REMITTANCES AND THE BRAIN DRAIN 151, 152–53, 187 (Caglar Ozden & Maurice
30 70 WASH. & LEE L. REV. 0000 (2013)
emigration by structuring public funding for education as loans rather than as outright grants.57
Higher education in the United States—a country where relatively few graduates have internationally transferable technical skills58 and out migration rates are relatively low59—is unusual because of heavy reliance on private funding rather than public funding.60 In much of the rest of the developed
Schiff eds., 2006), http://www.ime.gob.mx/2006/estudios/migracion/inter_ migration_remittances.pdf; infra notes 53, 61–62. The U.S. has also attempted to poach skilled workers for political rather than purely economic reasons. For example, the U.S. actively encourages medical doctors from Cuba to defect, according to some, partly to disrupt Cuban economic and foreign policy. Joel Millman, New Prize in Cold War: Cuban Doctors, WALL ST. J., Jan. 15, 2011, http://online.wsj.com/article/SB10001424052970203731004576045640711118766.html (last visited Feb. 3, 2013) (on file with the Washington and Lee Law Review). 57. See Poutvarra, supra note 2, at 680–82 (proposing income-contingent loans as one solution to problems facing European public education). 58. The percentage of U.S. graduates with science, math, computer science or engineering degrees is very low compared to the rest of the developed world. See JEFFREY J. KUENZI, CONG. RESEARCH SERV., SCIENCE, TECHNOLOGY, ENGINEERING, AND MATHEMATICS (STEM) EDUCATION: BACKGROUND, FEDERAL POLICY, AND LEGISLATIVE ACTION, at CRS-1 (2008) (“When compared to other nations, the math and science achievement of U.S. pupils and the rate of STEM degree attainment appear inconsistent with a nation considered the world leader in scientific innovation.”); OECD, supra note 2, at 80 (showing that the United States lags behind other countries in the number of tertiary graduates in science-related fields). A disproportionately large share of awarded and commercialized U.S. patents are authored by immigrants who were educated elsewhere. See Jennifer Hunt & Marjolaine Gauthier-Loiselle, How Much Does Immigration Status Boost Innovation? 23 (Nat’l Bureau of Econ. Research, Working Paper No. 14312, 2008), http://www.nber.org/papers/w 14312.pdf (“We find that a college graduate immigrant contributes at least twice as much to patenting as his or her native counterpart. The difference is fully explained by the greater share of immigrants with science and engineering education.”). 59. See Docquier & Marfouk, supra note 56, at 168–72 (estimating that North America had an emigration rate for skilled labor of only 0.9%, by far the lowest of any region studied). 60. See OECD, supra note 2, at 165 (“Direct costs for education are generally borne by the public sector, except in Australia, Japan, Korea, and the United States, where private direct costs such as tuition fees constitute over half of the overall direct investment costs.”); id. at 231–34 (showing the United States as having a much greater reliance on private funding for higher education than the average country); Demange, Fenge & Uebelmesser, supra note 2, at 253–54 (stating that unlike in the European Union, private sources of funding for education are more important than public sources in the United
RISK-BASED STUDENT LOANS 31
world, governments primarily finance higher education through general tax revenues.61 Students are expected to pay minimal tuition and fees while they are in school, and as a result, recent graduates are burdened with minimal debt. Access to university education may be allocated through competitive examination,62 but inequality in family financial resources generally has a limited impact on educational attainment.63 Because the government provides much of the funding for education, the government can readily prioritize certain fields of inquiry by devoting more resources to those subject areas, and can try to match educational offerings to employment opportunities.
By contrast, in the United States, federal government support to students is generally in the form of loans that must be repaid with interest,64 and students therefore graduate with high debt burdens.65 Although some state governments support States). 61. See Demange, Fenge & Uebelmesser, supra note 2, at 253 (stating that public funding based on tax revenues is dominant in European Union countries). 62. OECD, supra note 2, at 48 (“[I]n Finnish higher education . . . the number of entry places is restricted.”); Demange, Fenge & Uebelmesser, supra note 2, at 264–65 (discussing access restrictions in Germany and France). 63. See OECD, ECONOMIC POLICY REFORMS: GOING FOR GROWTH 2010, at 194 [hereinafter OECD, ECONOMIC POLICY REFORMS] (“In some countries, there exist social transfer programmes that are specifically directed to paying part of [parent costs in poor households of investing in the education of their children]. Such redistributive policies could thus reduce current income inequalities across parents so that their descendants’ income would converge more quickly.”); Charlene Marie Kalenkoski & Sabrina Wulff Pabilonia, Parental Transfers, Student Achievement, and the Labor Supply of College Students, 23 J. POPULATION ECON. 469, 494–95 (2010) (finding that students who receive less support from their parents work longer hours while in school, and that longer work hours reduce these students’ GPAs). 64. As of 2010, federal loans exceed federal grants by a factor of more than two to one. Earlier in the decade, the proportion of loans was even higher. COLLEGE BD., TRENDS IN STUDENT AID 2011, at 10 tbl.1 (2011), http://trends.collegeboard.org/sites/default/files/Student_Aid_2011.pdf. Total grants and total loans—not just federal—each account for roughly half of the aid to undergraduates, but for graduate students, loans exceed grants by a factor of two to one. Id. at 17, tbls.8A & 8B. Government support has declined as a share of U.S. educational institutions’ revenue since the early 1980s. Michael S. McPherson & Morton O. Schapiro, U.S. Higher Education Finance, in HANDBOOK OF ECONOMICS OF EDUCATION 1403, 1403–34 (Eric Alan Hanushek & Finis Welch eds., 2006). 65. See Elizabeth Warren, Sandy Baum & Ganesh Sitaraman, Service
32 70 WASH. & LEE L. REV. 0000 (2013)
public universities that offer lower tuition to residents, state support for higher education has been eroding for decades, and public universities increasingly resemble private universities in their dependence on tuition revenues.66 Parental financial resources are a strong predictor of educational achievement,67 and intergenerational social mobility is low by developed-world standards.68
Pays: Creating Opportunities by Linking College with Public Service, 1 HARV. L. & POL’Y REV. 127, 127 (“[S]tudents . . . are leaving college deep in debt.”); id. at 129 (stating that most United States college graduates take on debt to pay for college); Guinier, supra note 4, at 130 n.67. In 2009–2010, 56% of students who attended four-year public colleges borrowed money to do so, and they each borrowed an average of $22,000. Sixty-five percent of students who attended four-year private colleges borrowed, and they each borrowed an average of $28,000. The percent who borrowed and the average dollar value of debt (adjusted for inflation) have both increased over the last decade. COLLEGE BD., supra note 64, at 4, 19 figs.10A & 10B. 66. See Guinier, supra note 4, at 129 (“[S]tates shifted resources from education to the criminal justice system, the federal government cut Pell Grants, and state revenues plummeted, leading to higher tuition and reduced financial aid.”); see also COLLEGE BD., supra note 64, at 9 (discussing high and growing student debt levels at public colleges). The trend away from grants has changed slightly since 2008—Pell Grants and grants to Military Veterans grew dramatically, but are still dwarfed by loans. Id. at 10 tbl.1. European governments have also slightly reduced the proportion of public support for higher education, but public support still accounts for a much larger share than in the United States. See Demange, Fenge & Uebelmesser, supra note 2, at 265–66. 67. See OECD, ECONOMIC POLICY REFORMS, supra note 63, at 183
Parental or socio-economic background influences descendants’ educational, earnings and wage outcomes in practically all countries for which evidence is available. . . . The influence of parental socio-economic status on students’ achievement in secondary education is particularly strong in Belgium, France and the United States . . . . Inequalities in secondary education are likely to translate into inequalities in tertiary education and subsequent wage inequality.
See also Warren, Baum & Sitaraman, supra note 65, at 127 (“[A]lmost 20% of low income-high school graduates with high test scores do not manage to enroll in college at all within two years of graduating high school.”). 68. See OECD, ECONOMIC POLICY REFORMS, supra note 63, at 185 fig.5.1, 187 (finding that intergenerational wage mobility as measured by father-son pairs is lower in the United States than in Denmark, Australia, Norway, Finland, Canada, Sweden, Germany, Spain, or France; only Italy and the U.K. had less social mobility than the United States). The OECD notes that genetic heritability of innate ability should be constant across countries, but wage mobility seems to be higher in countries with more generous taxpayer funded
RISK-BASED STUDENT LOANS 33
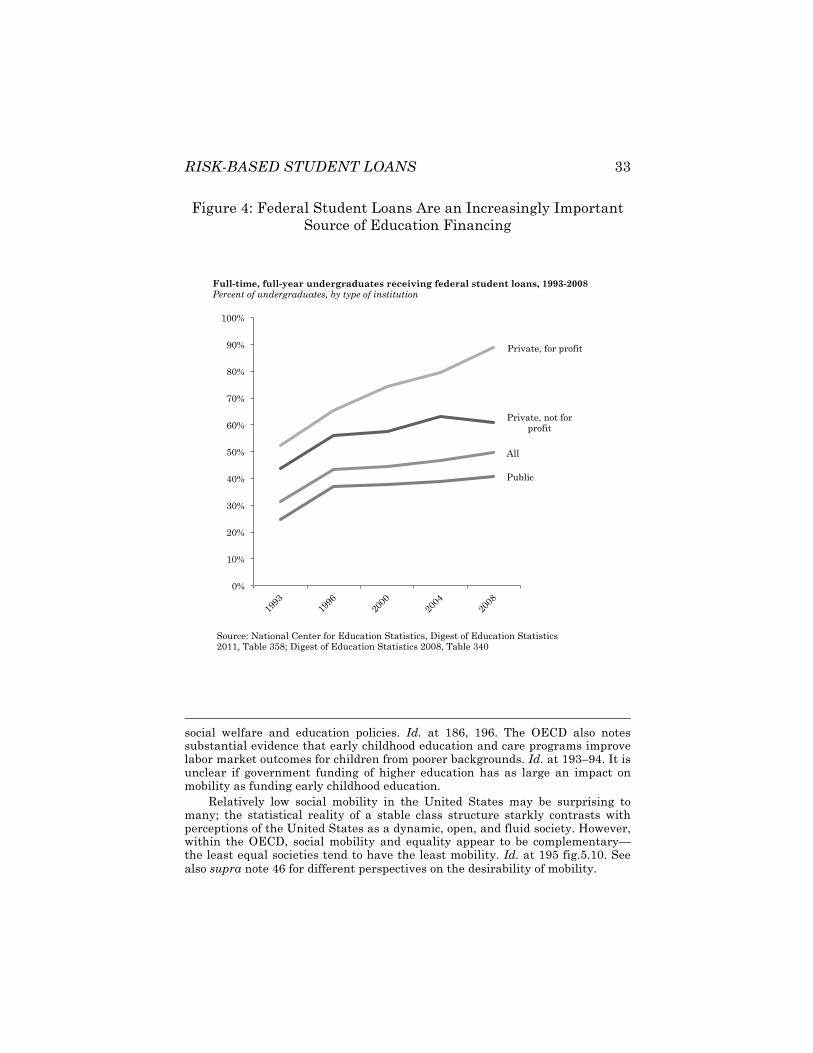
Figure 4: Federal Student Loans Are an Increasingly Important Source of Education Financing
social welfare and education policies. Id. at 186, 196. The OECD also notes substantial evidence that early childhood education and care programs improve labor market outcomes for children from poorer backgrounds. Id. at 193–94. It is unclear if government funding of higher education has as large an impact on mobility as funding early childhood education.
Relatively low social mobility in the United States may be surprising to many; the statistical reality of a stable class structure starkly contrasts with perceptions of the United States as a dynamic, open, and fluid society. However, within the OECD, social mobility and equality appear to be complementary—the least equal societies tend to have the least mobility. Id. at 195 fig.5.10. See also supra note 46 for different perspectives on the desirability of mobility.
Private, not for profit
Private, for profit
All
Public
0%
10%
20%
30%
40%
50%
60%
70%
80%
90%
100%
Full-time, full-year undergraduates receiving federal student loans, 1993-2008 Percent of undergraduates, by type of institution
Source: National Center for Education Statistics, Digest of Education Statistics 2011, Table 358; Digest of Education Statistics 2008, Table 340
34 70 WASH. & LEE L. REV. 0000 (2013)
III. U.S. Federal Student Loan Programs
The overwhelming majority of the U.S. student loan market consists of federal government loans.69 Prior to the emergence of federally-backed student loans, student loans were rare and expensive, and higher education was generally only available to the children of the wealthy.
Historically, the largest category of government-backed loans was federal guaranteed loans, which were guaranteed, subsidized, and regulated by the government, but originated and owned by private financial institutions or sold to private investors through securitization.70
However, Congress eliminated guaranteed loans in 2010 and shifted all lending to the government’s direct loan program.71 Guaranteed loans were eliminated because of a widespread
69. As of 2011, 90% of new student loans were federal government loans. Government loans have been a majority of the market for many years, but increased dramatically after 2008 as private lending collapsed. Jonathan Riber & Maxim Berger, U.S. Private Student Loan Landscape, 7 U.S. STRUCTURED FIN. NEWSL (DBRS, Toronto, Ont.) Oct. 5, 2011 (on file with the Washington and Lee Law Review). 70. Technically, the loans were guaranteed by a guarantee agency and reinsured by the Department of Education. CLAIRE J. MEZZONOTTE ET. AL., FITCH RESEARCH, STUDENT LOAN FINANCE 101, at 1 (1997). Most securitized private loans were federally guaranteed loans. See Kevin Drawbaugh, Securitizing Student Loan Debt, REUTERS (Aug. 28, 2007), available at http://www. reuters.com/article/2007/08/28/idUSN2723050420070828 (last visited Feb. 3, 2013) (on file with the Washington and Lee Law Review); Claire J. Mezzonotte et. al., 6 DBRS Structured Finance Newsletter, Feb. 22, 2010. According to the Securities Industry and Financial Markets Association (SIFMA), there were over $230 billion in student loan asset backed securitizations (SLABS) as of the end of 2011. New SLABS issuances peaked at $67 billion in 2006, plummeted during the U.S. financial crisis in 2008 to $28 billion, and continued to fall thereafter. SLABS issuance dropped below $14 billion in 2011. SIFMA, U.S. ABS Issuance and Outstanding, available at http://www.sifma.org/uploaded Files/Research/Statistics/StatisticsFiles/SF-US-A BS-SIFMA.xls (last visited Feb. 3, 2013) (on file with the Washington and Lee Law Review).
For an explanation of the process of securitization, its benefits, and its risks, see Michael Simkovic, Competition and Crisis in Mortgage Securitization, 88 IND. L. REV. 213 (2013) or Michael Simkovic, Secret Liens and the Financial Crisis of 2008, 83 AM. BANKR. L.J. 253 (2009). 71. Jean Braucher, Mortgaging Human Capital: Federally Funded Subprime Higher Education, 69 WASH. & LEE L. REV. 439, 462 n.111 (2011); Glater, supra note 35, at 57.
RISK-BASED STUDENT LOANS 35
perception that the guarantees and subsidies—which reduced the riskiness of the loans to only slightly higher than U.S. government Treasuries, but enabled private lenders to profit by charging far higher interest rates—represented a subsidy to private financial institutions and their investors rather than a benefit to students or taxpayers.72
Federal direct government loans are administered by the U.S. Department of Education. The government retains ownership of these direct loans, and can therefore profit when the interest rate spread above Treasuries exceeds losses from defaults and administrative costs. Federal student loans are generally less expensive than private loans, but the federal direct loan program is still a moneymaker for the federal government.73
A. Student Eligibility Criteria Are Generally Not Risk-Based
The borrower eligibility criteria for federal student loans are fairly minimal, and generally not risk-based. A student must be
72. See Glater, supra note 35, at 39–40 (discussing the preferences of Senator Edward Kennedy and President Bill Clinton for direct lending on grounds of cost effectiveness and aggressive lobbying by private lenders against direct lending); id. at 57 n.224 (discussing costs savings from ending the guaranteed loan program); see also Deborah J. Lucas & Damian Moore, Guaranteed versus Direct Lending: The Case of Student Loans, in MEASURING AND MANAGING FEDERAL FINANCIAL RISK 163, 164 (Deborah J. Lucas ed., 2010)
[T]he guaranteed program appears to be fundamentally more expensive than the direct program. . . . [G]uaranteed lenders are paid more than is required to induce them to lend at statutory terms. . . . To the extent that the market is not perfectly competitive, guaranteed lenders presumably are able to retain some of the surplus.
73. See DEBORAH KALCEVIC & JUSTIN HUMPHREY, CONG. BUDGET OFFICE, CBO MARCH 2012 BASELINE PROJECTIONS FOR THE STUDENT LOAN AND PELL GRANT PROGRAMS, tbls.2 & 3 (Mar. 13, 2012) (projecting a negative subsidy, i.e., profit, for federal student loans originated in 2013 of around 32% of lending volume, or $36.5 billion in profit). After subtracting $1.6 billion in administrative costs (equal to 1.4% of lending volume), projected 2013 profits are $34.9 billion. Id. at tbl.4. The student loan program remains profitable in every year projected, although profits decline to around $10 billion in later years. See also DEP’T OF EDUC., STUDENT LOANS OVERVIEW, FISCAL YEAR 2013 BUDGET REQUEST, at R-11 to R-12 (providing similar profit estimates for 2012 and noting that the federal student loan program was profitable in 2009-2012).
36 70 WASH. & LEE L. REV. 0000 (2013)
enrolled in a program at an accredited higher educational institution “leading to a recognized educational credential” such as a degree or certificate,74 must maintain “academic standing consistent with the requirements of graduation”75 unless there are “special circumstances,”76 must not currently be in default on a federal student loan,77 must be a U.S. citizen or on the path toward citizenship,78 and if previously convicted of defrauding the federal student loan program, must have made restitution.79 Eligibility can be suspended or terminated for drug offenses.80 The use of more restrictive eligibility criteria than those provided for by statute is generally prohibited.81
B. Only Exceptionally Poorly Performing Institutions Are Excluded
Similarly, the eligibility criteria for educational institutions are fairly minimal, with the Department of Education relying heavily on state accreditation agencies.82 Two sets of regulations have been established over the past two and a half decades to cull some of the worst performing institutions from student loan eligibility, but regulations do not seek to make fine performance-based distinctions among eligible institutions.
First, in response to high student loan default rates at some “proprietary” or “for-profit” educational institutions in the 1980s, Congress passed the Student Loan Default Prevention Initiative Act of 1990 (SLDPA).83 Under the SLDPA, institutions lost their
74. 20 U.S.C. § 1091(a)(1) (2012); id. § 1094. 75. Id. § 1091(c)(1)(B). 76. Id. § 1091(c)(3)(C). 77. Id. § 1091(a)(3). 78. Id. § 1091(a)(5). 79. Id. § 1091(a)(6). 80. Id. § 1091(r). 81. Id. § 1077A(e); id. § 1077A(f). 82. Braucher, supra note 71, at 446, n.19. 83. Student Loan Default Prevention Initiative Act of 1990, Pub. L. No. 101-508, 104 Stat. 1388 (codified as amended at 20 U.S.C. § 1001).
RISK-BASED STUDENT LOANS 37
eligibility for student loans if their cohort default rate (CDR)84 exceeded twenty-five percent for three years in a row.85
The CDR measure helped eliminate some small and poorly performing institutions, but sophisticated educational institutions increasingly manipulated the CDR statistic by moving recent students into deferment86 or forbearance87 so that they would not count as defaulters.88 CDR had a positive but limited effect.89
Recently, largely in response to another wave of high defaults at some proprietary educational institutions, the Department of Education established a Gainful Employment Rule (GER) that again attempts to cull the worst performing institutions.90 GER may be more difficult to manipulate than the older CDR measure
84. The CDR was the percent of students entering repayment in a given year who defaulted during the subsequent year, and CDR was therefore roughly a one-year default rate because students typically entered repayment in October or November. In 2008, the CDR measure was extended by one year (so that it captures students who enter repayment in one year and default by the end of the subsequent two years), and the maximum CDR was increased to 30%. Braucher, supra note 71, at 464–65 & n.121. 85. Id. at 464. 86. Deferment refers to a postponement of payment on a loan that is allowed under certain conditions and during which interest does not accrue for subsidized loans. Deferment is available for student borrowers who are enrolled at least half time in an eligible postsecondary school or studying full time in a graduate fellowship program or an approved disability rehabilitation program. It is also available for up to three years of unemployment and economic hardship, or for active duty military service. Direct Loans, Deferment and Forbearance, DEP’T OF EDUC., http://www.direct.ed.gov/postpone.html (last visited Feb. 3, 2013) (on file with the Washington and Lee Law Review). 87. Forbearance refers to a postponement of payment on a loan, typically if the borrower does not qualify for a deferment and is unable to make payments for a reason such as poor health. Interest continues to accrue during forbearance. Id. 88. Braucher, supra note 71, at 465 n.127. 89. Id. at 464–65 (finding that CDR regulation helped shut down some, but not all of the worst performers). 90. The Department of Education published its final Gainful Employment Rule on June 13, 2011. The Rule was scheduled to go into effect on July 1, 2012, and the earliest any educational institution might lose eligibility under the GER Rule is 2015. Id. at 466.
38 70 WASH. & LEE L. REV. 0000 (2013)
because GER measures performance based on repayment rates rather than default rates.91
GER uses two tests—one that looks at whether former students are in fact repaying their loans92 and another that looks at debt-service-to-income ratios to determine whether graduates have sufficient income to enable them to have a reasonable chance of repaying their loans.93 An educational institution may remain eligible for student loans if it passes either test in at least two out of four consecutive years.
C. Borrowing Limits Depend on Grade Level and Dependent Status
Federal student loan borrowing limits are set by statute.94 The loan limits are determined by the students’ grade level and, for undergraduates, students’ status as dependents. Annual Stafford Loan limits increase as undergraduates progress from year one to year three, and are higher for students who are “independent.”95 Stafford and Perkins Loan limits are higher for graduate students than for undergraduates.96
The federal loan limits are less than the total cost of attendance at most private colleges and many flagship public
91. Id. at 467–69. 92. A program can remain eligible if at least 35% of students are repaying at least some portion of the principal on their federal loans. Id. at 467–68. 93. A program can remain eligible if either the mean or the median annual student loan payment of graduates of their program is either 12% or less of annual earnings or 30% or less of discretionary income. Id. at 468. 94. 20 U.S.C. § 1078(b)(1)(A)&(B) (2006) (setting forth loan limits for Subsidized Stafford Loans); id. § 1078–8(d) (setting forth loan limits for Unsubsidized Stafford Loans); id. § 1087dd(a)(2) (setting forth loan limits for Perkins Loans); id. § 1087E(a)(1) (noting that limits on direct loans are the same as limits on guaranteed loans). 95. Undergraduate students are “independent” if they meet any of the following criteria: the student is at least age twenty-four, is married, is a veteran or on active duty in the military, is an orphan or a ward of the state, or has legal dependents other than a spouse. Direct Loans, Glossary, DEP’T OF EDUC., http://www.direct.ed.gov/glos.html#anchor388090 (last visited Feb. 3, 2013) (on file with the Washington and Lee Law Review). 96. See sources cited supra note 94.
RISK-BASED STUDENT LOANS 39
colleges, and students with financial need may therefore turn to private loans to help make up the difference.97 Graduate students and the parents of dependent undergraduate students with good credit histories also have access to PLUS Loans, under which borrowing is limited by the students’ financial need rather than a fixed dollar amount.98
The federal student loan limits could at best be described as crudely risk-based: as students exceed loan limits for less expensive lending programs, such as subsidized Stafford Loans and Perkins Loans, they will move on to more expensive programs such as PLUS Loans and their borrowing costs will increase. Students may also turn to higher cost private student loans or credit card debt when federal student loans are inadequate to finance their education.99
A fully risk-based approach to loan limits would focus on expected debt-service-payment-to-income ratios. The relevant question is not simply how much students borrow each year. Instead, the relevant question is whether students’ incomes at graduation and beyond will be sufficient to repay their debts over the next ten to thirty years.
D. Federal Student Loan Pricing is Statutory, Not Risk-Based
In theory, rather than cut off access to credit entirely to poor performing institutions and ignore risk differences above a minimal threshold, the Department of Education could embrace a more nuanced approach by incorporating risk levels into loan pricing. However, in practice, federal student loan pricing is largely uniform and not risk-based.
Interest rates on government loans are set by statute at the same level for all eligible borrowers under a particular loan program. Federal student loan rates are currently set at a fixed rate between 3.4% and 7.9%, with lower rates available to
97. Glater, supra note 35, at 42–43. 98. 20 U.S.C. § 1078-2(a)(1) (discussing eligibility for PLUS Loans); id. § 1078-2(b) (limiting PLUS Loan borrowing to a student’s estimated cost of attendance, minus other financial aid). 99. See generally Glater, supra note 35, at 42–46.
40 70 WASH. & LEE L. REV. 0000 (2013)
undergraduates than to graduate students.100 The rates have changed over time, but have historically been either a fixed interest rate, or a capped variable rate determined by adding a spread to a variable Treasury bill rate.101
The interest rates are not risk-based. A successful medical student with virtually no risk of becoming unemployed or defaulting on her debts would pay the graduate student rate—between 6.8% and 7.9%—while a struggling art history major with rather less secure employment prospects would pay the undergraduate rate of 3.4%.
100. The interest rate for new loans made under the William D. Ford Federal Direct Loan Program (DLP), made on or after July 1, 2006, is a fixed rate, generally either 6.8% or 7.9%, depending on the loan program. 6.8% is the rate for Federal Direct Stafford Loans and Federal Direct Unsubsidized Stafford Loans; 7.9% is the rate for PLUS Loans. 20 U.S.C. § 1087E(b)(7). Between July 1, 2008, and July 1, 2013, a lower interest rate was available for undergraduate student borrowers under DLP Loans—this rate was 3.4% for undergraduate DLP Loans originated between July 1, 2011, and July 1, 2013. Id. § 1087E(b)(7)(D). The interest rate for Perkins Loans made after October 1, 1981, is 5%. Id. § 1087dd(c)(1)(D). 101. For example, the interest rate for Stafford Loans dispersed between October 1, 1998, and July 1, 2006, was 2.3% plus a 91-day Treasury bill rate, capped at a maximum rate of 8.25%. Id. § 1087E(b)(6).
The interest rate for federal Perkins Loans is established by 20 U.S.C. § 1087DD(c)(1)(D). The interest rates for DLP Loans are established by 20 U.S.C. § 1087E(b)(7). Maximum interest rates for federal guaranteed loans made under the Federal Family Education Loan Program (FFELP), including PLUS Loans, were established under 20 U.S.C. § 1077A (“applicable interest rates”). Lenders were permitted to charge less than the maximum, but rarely did so. Glater, supra note 35, at 40 & n.139.
When student loan rates were variable, the most commonly used reference rate was the 91-day (3-month) Treasury bill rate, although the 52-week (1 year) Treasury bill rate was also used. The interest rate the borrower actually paid might have in some instances been lower because of interest subsidies described in 20 U.S.C. § 1078. Students can convert their variable-rate loans into fixed-rate loans through consolidation.
The same terms and conditions generally apply to loans made under the FFELP and DLP. 20 U.S.C. § 1087E(a)(1).
RISK-BASED STUDENT LOANS 41
IV. Higher Education and Labor Market Coordination Problems
Resources are increasingly allocated to U.S. educational institutions through a market-based process.102 Students with admissions offers from multiple schools resemble customers who pay for the education they receive and can choose from several different options. Educational institutions, like suppliers in any competitive market, offer discounts to preferred customers.103 Students with financial resources or access to credit decide where they will study, and what they will study. This market-based approach is consistent with values that emphasize autonomy for individual students and political independence for academic institutions.
However, this freedom may come at a steep price to employers, lenders, and ultimately to the students themselves. As discussed above, government support for mass higher education has always been intended to supply skilled labor, boost economic growth, and encourage social mobility through increased wages and employment.104 However, skewed incentives and information asymmetries have increasingly shifted educational resources away from human capital investment and toward present consumption.
A. Students as Customers Create Pressure to Reduce Academic Standards
The student-as-customer approach creates pressures toward grade inflation and lower educational standards.105 Because 102. See David D. Dill, Allowing the Market to Rule: The Case of the United States, 57 HIGHER ED. Q. 136 (2003) (noting the United States’ distinctly market-based approach to higher education, and expressing concerns that the United States’ market-based approach may lead to inefficiency because of information asymmetries and reliance on reputation as a gauge of quality). 103. Warren, Baum & Sitaraman, supra note 65, at 128 (“Over the past decade, the federal government, state governments, and colleges and universities have all directed increasing portions of their funds toward high-achieving middle- and upper-income students in order to influence their choices about where to go to college.”). 104. See generally supra Part II. 105. See infra notes 107–10. The same dynamic observed in U.S. higher
42 70 WASH. & LEE L. REV. 0000 (2013)
universities depend on enrollments for revenue, and students decide where to enroll, administrators and faculty have strong incentives to ensure that students enjoy their time at the university. Universities can and do cater to students’ appetites by offering amenities such as luxury dorms and athletic facilities—amenities many students appear to value more than good instruction.106 Emphasis on keeping the student-customer happy also extends into the classroom.
One of the ways that universities can encourage faculty to focus on student enjoyment is by linking departmental funding and professors’ promotion to student enrollment numbers and course evaluations.107 Professors can increase enrollments and
education—competition for enrollments contributing to grade inflation and reduced standards—has been observed in Sweden at the secondary-school level after the introduction of school choice. See Jonas Vlachos, Firskolor i förändring, 66, in Laura Hartman, SNS FÖRLAG, Konkurrensens Konsekvenser: Vad Händer Med Svensk Välfärd? (2011); Richard Orange, Doubts Grow Over the Success of Sweden’s Free Schools Experiment, GUARDIAN (UK), Sept. 10, 2011, http://www.guardian.co.uk/world/2011/sep/10/sweden-free-schools-experiment? INTCMP=SRCH (last visited Feb. 3, 2013) (on file with the Washington and Lee Law Review); cf. Gabriel H. Sahlgren, Opponents of School Choice are Misinterpreting the Data, INST. OF ECON. AFFAIRS (June 20, 2012), http://www.iea.org.uk/blog/opponents-of-school-choice-are-misinterpreting-the-data (last visited Feb. 3, 2013) (on file with the Washington and Lee Law Review). 106. See BRIAN JACOB, BRIAN MCCALL, & KEVIN STANGE, THE CONSUMPTION VALUE OF POSTSECONDARY EDUCATION 33 (2011), http://www.rand.org/content/ dam/rand/www/external/labor/seminars/adp/pdfs/2011/stange.pdf (presenting evidence from student enrollment decisions of the high school classes of 1992 and 2004 that most students are more willing to pay for spending on amenities like student activities, sports, and dormitories than on college instruction, but noting that high-achieving students tended to focus more on academic quality). 107. David Dill, Will Market Competition Assure Academic Quality? An Analysis of the UK and US Experience, 20 HIGHER EDUC. DYNAMICS 47, 66–67 (2007)
[T]he effects of market competition on academic behavior compromise the capacity of universities to maintain and improve academic standards. . . . Many universities have responded to the more competitive market by linking academic promotion to student evaluations of teachers and tying departmental budget allocations to student enrolments [sic]. [This] provides the opportunity for instructors to increase the demand for their individual courses and programmes by inflating grades and/or lowering academic standards rather than by actually improving student learning.
RISK-BASED STUDENT LOANS 43
boost course evaluations by assigning better grades for less work. Students actively shop for classes with professors who give generous grades.108 Students also give better course evaluations to professors who grade more generously and who flatter students—and worse evaluations to professors who demand more work and more substantive learning.109
Presumably, many professors respond to such incentives by reducing the rigor of their classes and inflating grades.110 The result is that student-customers study less, learn less,111 and are more satisfied with the experience—at least until it is time to
108. Talia Bar, Vrinda Kadiyali & Asaf Zussman, Grade Information and Grade Inflation: The Cornell Experiment, 23 J. ECON. PERSP. 93, 101–02 (2009) (presenting evidence “that the provision of [average] grade [and grade distribution] information [to Cornell students] led to increased enrollment into leniently graded courses” and that students of high ability were less likely than students of lower ability to pursue courses with more lenient grading). 109. See Scott E. Carrell & James E. West, Does Professor Quality Matter? Evidence from Random Assignment of Students to Professors, 118 J. POL. ECON. 409, 412, 430 (2010); Clifford H. Edwards, Grade Inflation: The Effects on Educational Quality and Personal Well Being, 120 EDUC. 538 (2000). 110. See Donald L. Crumbley et al., What is Ethical About Grade Inflation and Coursework Deflation?, 8 J. ACAD. ETHICS 187, 187 (2010) (arguing that course evaluations have “caused grade inflation, coursework deflation, and a reduction in student learning as a result of unethical behavior of professors and administrators”); Kiridaran Kanagaretnam et al., An Economic Analysis of the Use of Student Evaluations: Implications for Universities, 24 MANAGERIAL & DECISION ECON. 1, 1–13 (2003) (stating that excessive weight on student evaluations can have negative consequences); David A. Love & Matthew J. Kotchen, Grades, Course Evaluations, and Academic Incentives, 36 E. ECON. J. 151, 151 (2010) (modeling professor behavior and suggesting that increased emphasis on course evaluations can lead to grade inflation); Charles E. Snare, Implications of Considering Students as Consumers, 45 C. TEACHING 122, 122 (1997) (stating that the student-as-customer approach leads to grade inflation, reduced rigor, and less substantive learning); James J. Wallace & Wanda A. Wallace, Why the Costs of Student Evaluations Have Long Since Exceeded Their Value, 13 ISSUES IN ACCT. EDUC. 443, 445 (1998) (same); see also Brenda S. Sonner, A is for “Adjunct”: Examining Grade Inflation in Higher Education, 76 J. EDUC. BUS. 5, 7 (2000) (presenting evidence that adjunct instructors give higher grades than full-time faculty and suggesting that this may be because adjuncts face greater pressure to obtain high course evaluations so that their teaching contract will be renewed). 111. See generally Philip Babcock, Real Costs of Nominal Grade Inflation? New Evidence from Student Course Evaluations, 48 ECON. INQUIRY 983 (2010) (providing evidence that higher nominal grades (i.e., grade inflation) can dramatically reduce student effort and study time).
44 70 WASH. & LEE L. REV. 0000 (2013)
enter the labor market. Potential employers may not be so satisfied with the quality of the education job applicants have received, and recent graduates may not be very satisfied with the employment opportunities that are available to them.112
B. Educational Institutions May Have Incentives to Funnel Students into Areas That Do Not Maximize Students’
Future Incomes or Employment Prospects
Some college majors are more challenging than others. Grade inflation is generally more prevalent in humanities and social sciences and less prevalent in science, technology, engineering, and mathematical subject areas (STEM).113 STEM majors spend
112. BYRON AUGUSTE ET AL., MCKINSEY GLOBAL INST., AN ECONOMY THAT WORKS: JOB CREATION AND AMERICA’S FUTURE 57 (2011) (“[E]mployers still have trouble finding workers with specific skills. And many students lack a clear picture of which jobs and skills will be in high demand.”); ERIN SPARKS & MARY JO WAITS, NAT’L GOVERNORS ASS’N CTR. FOR BEST PRACTICES, DEGREES FOR WHAT JOBS? RAISING EXPECTATIONS FOR UNIVERSITIES AND COLLEGES IN A GLOBAL ECONOMY 8 (2011)
Currently, businesses and states are not getting the talent they want—and students and job seekers are not getting the jobs they want. There are problems with quality. For instance, employers responding to a recent survey estimated that 40 percent of college graduates available to them do not have the necessary applied skills required to meet their needs.
113. See VALEN E. JOHNSON, GRADE INFLATION: A CRISIS IN COLLEGE EDUCATION (2003) (reporting the most generous grading at Duke University in the humanities, intermediate grading in the social sciences, and the most stringent grading in sciences and engineering); Alexandra C. Achen & Paul N. Courant, What Are Grades Made Of?, 23 J. ECON. PERSP. 77, 81–82, 90 (presenting evidence that science and math classes at the University of Michigan generally offer lower average grades than social science and humanities classes, particularly for introductory level, required classes); Patrick D. Larkey, Comment: An Alternative to Traditional GPA for Evaluating Student Performance, 12 STAT. SCI. 269, 270 (1997) (“The few studies that have been done all indicate that there has been relatively more grade inflation in ‘softer’ subjects.”); Kevin Rask, Attrition in STEM Fields at a Liberal Arts College: The Importance of Grades and Pre-collegiate Preferences, 29 ECON. EDUC. REV. 892, 894 (2010) (“Grades given in the sciences are often among the lowest.”); Richard Sabot & John Wakeman-Linn, Grade Inflation and Course Choice, 5 J. ECON. PERSP. 159, 161–63 (1991) (presenting data from Williams College showing that humanities departments generally give the highest grades while science, math, and economics departments generally give lower grades); see also, e.g.,
RISK-BASED STUDENT LOANS 45
more hours studying and have fewer hours for paid work or leisure,114 and often take longer to complete their degrees.115 Yet STEM majors receive lower grades. A large proportion of incoming students report that they intend to study a STEM field. But before graduation, many students switch from STEM to the humanities or social sciences.116 Students switch even though their future employment prospects and wages might be higher if they majored in certain select STEM fields.117 This flight from
ARCIDIACONO ET AL., supra note 17, at 19 (presenting additional evidence from Duke University that grades are higher in the humanities and social sciences than in natural sciences, engineering, and economics). 114. See NATIONAL SURVEY OF STUDENT ENGAGEMENT, ANNUAL RESULTS 15 (2011) (reporting that engineering and science majors study more hours per week than humanities, education, or business majors, and that business, social science, and humanities majors spend more hours per week working). 115. See Sylvia Hurtado et al., Degrees of Success Bachelor’s Degree Completion Rates Among Initial STEM Majors, HIGHER ED. RES. INST. RES. BRIEF, Jan. 2010, at 3 fig.3, http://www.heri.ucla.edu/nih/ downloads/2010%20-%20Hurtado,%20Eagan,%20Chang%20-%20Degrees%20of%20Success.pdf (“[S]tudents who initially enter undergraduate STEM programs have substantially lower degree completion rates than their same-race peers who enter other academic disciplines.”). 116. See Paul M. Romer, Should the Government Subsidize Supply or Demand in the Market for Scientists and Engineers?, in INNOVATION POLICY AND THE ECONOMY 221, 237 (Adam B. Jaffee et al., eds., 2001); Ben Ost, The Role of Peers and Grades in Determining Major Persistence in the Sciences, 29 ECON. EDUC. REV. 923, 923–34 (2010); Rask, supra note 113, at 892–900. 117. See Mark C. Berger, Cohort Size Effects on Earnings: Differences by College Major, 7 ECON. EDUC. REV. 375, 381 (1988) (reporting that wages for science and liberal arts majors are depressed more by an increase in the size of their college cohort than are wages for engineering or business majors); Mark C. Berger, Predicted Future Earnings and Choice of College Major, 41. INDUS. & LAB. REL. REV. 418, 426 (1988) (reporting relatively high earnings for U.S. business and engineering graduates and relatively low earnings for liberal arts and education graduates); Black et al., supra note 18, at 365 (finding that engineers earn more than economics majors, who earn more than most other social science, business, and humanities majors, and that MBAs with chemical engineering undergraduate majors earn more than other MBAs and that “the measured differentials reflect in part real differences in the market returns to different fields of study”); Charlotte Christiansen et al., The Risk Return Trade-off in Human Capital Investment, 14 LABOUR ECON. 971, 984–85 (2007) (reporting relatively high risk-adjusted returns for engineering and health sciences degrees and relatively low risk-adjusted returns for humanities and education degrees for a sample of Danish graduates); Scott L. Thomas, Deferred Costs and Economic Returns to College Major, Quality, and Performance, 41 RES. HIGHER EDUC. 281, 301–02, 304–06 (2000) (reporting relatively low debt-to-
46 70 WASH. & LEE L. REV. 0000 (2013)
STEM is likely due at least in part to university-created grading incentives.118
income ratios for recent U.S. college graduates who majored in engineering, health science, or business and relatively high debt-to-income ratios for graduates who majored in education, humanities, or social sciences, primarily because of much higher incomes for majors in engineering, business, or science); infra note 162 (discussing substantial financial sacrifices by humanities and education students); cf. Morton Paglin & Anthony M. Rufolo, Heterogeneous Human Capital, Occupational Choice, and Male-Female Earnings Differences, 8 J. LAB. & ECON. 123, 140–41 (1990) (arguing that wage differences across majors are due in part to innate differences in mathematical ability and self-sorting by students).
However, not all STEM graduates fare well. There is evidence of an “oversupply” of science Ph.Ds seeking professorships within universities, and declining pay and working conditions for Ph.Ds in many fields. See B. Lindsay Lowell & Hal Salzman, Into the Eye of the Storm: Assessing the Evidence on Science and Engineering Education, Quality and Workforce Demand 2 (2007), http://www.urban.org/UploadedPDF/411562_salzman_Science.pdf (presenting evidence that there are three times as many U.S. science and engineering graduates as available job openings in these fields); B. Lindsay Lowell et al.,Paper Presented at the Annual Meetings of the Association for Public Policy: Steady as She Goes? Three Generations of Students through the Science and Engineering Pipeline 31–32 (Nov. 7, 2009) (presenting evidence that starting in the early 1990s, top performing students increasingly opted out of science and engineering employment) (on file with the Washington and Lee Law Review); Beryl Lieff Benderly, The Real Science Gap, MILLER-MCCUNE, July/Aug. 2010, at 30, 33 (“[B]ecoming a scientist now entails a penurious decade or more of graduate school and postdoc positions before joining the multitude vainly vying for the few available faculty-level openings.”); Romer, supra note 116, at 241 (arguing that there is a glut of scientists within universities but a shortage of scientists who can work in industry). 118. See Valen E. Johnson, An Alternative to Traditional GPA for Evaluating Student Performance, 12 STAT. SCI. 251, 251 (1997) (“[D]ifferences in grade distributions result in a substantial reduction in the number of courses taken by students in subjects like mathematics and the natural sciences, as well as other challenging upper-level undergraduate courses.”); Sabot & Wakeman-Linn, supra note 113 (providing evidence that students respond to grades as incentives and choose to study humanities rather than science and math, even though there is likely to be greater employment opportunity in STEM fields, because universities offer higher average grades and a narrower grading distribution in humanities classes); Larkey, supra note 113, at 270
[T]here has been relatively more grade inflation in “softer” subjects. Grade inflation has become an important edge for some fields in competing for students as core curricula have waned and student choices have waxed. It is a perverse form of price competition; they have been able to offer higher grades for equivalent or lesser amounts of work.
See also Ost, supra note 116, at 923–34 (presenting evidence that science majors
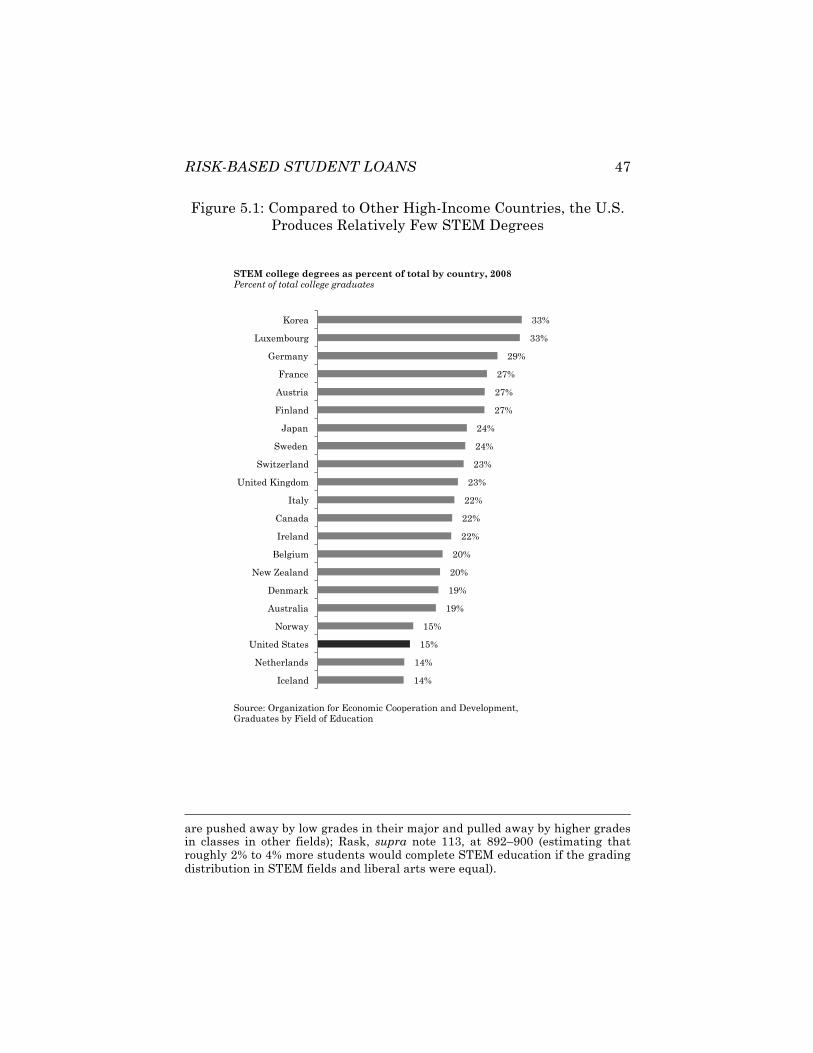
RISK-BASED STUDENT LOANS 47
Figure 5.1: Compared to Other High-Income Countries, the U.S. Produces Relatively Few STEM Degrees
are pushed away by low grades in their major and pulled away by higher grades in classes in other fields); Rask, supra note 113, at 892–900 (estimating that roughly 2% to 4% more students would complete STEM education if the grading distribution in STEM fields and liberal arts were equal).
33%
33%
29%
27%
27%
27%
24%
24%
23%
23%
22%
22%
22%
20%
20%
19%
19%
15%
15%
14%
14%
Korea
Luxembourg
Germany
France
Austria
Finland
Japan
Sweden
Switzerland
United Kingdom
Italy
Canada
Ireland
Belgium
New Zealand
Denmark
Australia
Norway
United States
Netherlands
Iceland
STEM college degrees as percent of total by country, 2008 Percent of total college graduates
Source: Organization for Economic Cooperation and Development, Graduates by Field of Education
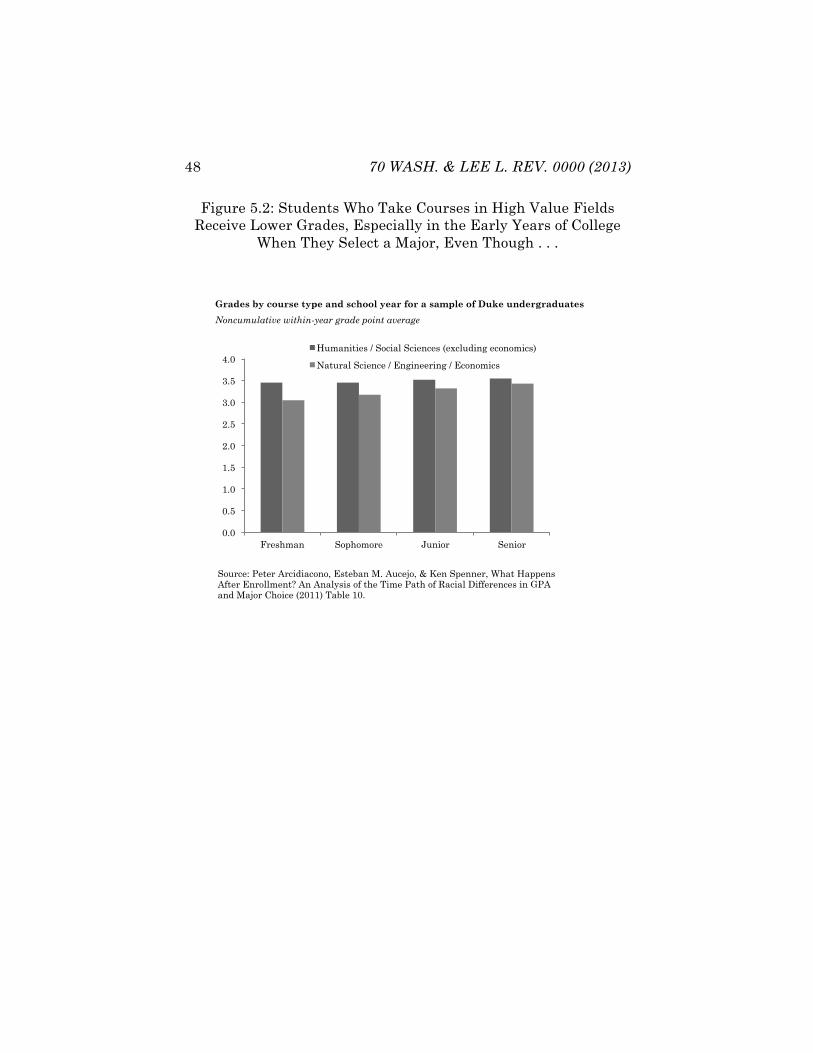
48 70 WASH. & LEE L. REV. 0000 (2013)
Figure 5.2: Students Who Take Courses in High Value Fields Receive Lower Grades, Especially in the Early Years of College
When They Select a Major, Even Though . . .
0.0
0.5
1.0
1.5
2.0
2.5
3.0
3.5
4.0
Freshman Sophomore Junior Senior
Humanities / Social Sciences (excluding economics)
Natural Science / Engineering / Economics
Grades by course type and school year for a sample of Duke undergraduates
Noncumulative within-year grade point average !!
Source: Peter Arcidiacono, Esteban M. Aucejo, & Ken Spenner, What Happens After Enrollment? An Analysis of the Time Path of Racial Differences in GPA and Major Choice (2011) Table 10.
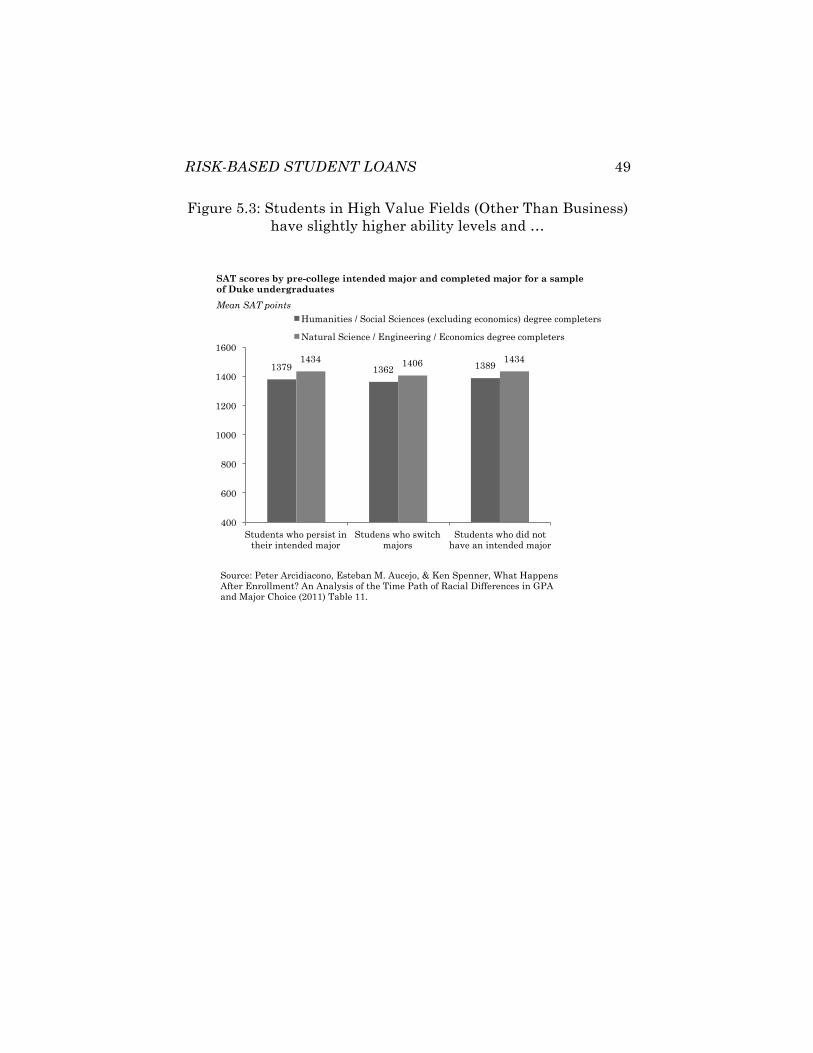
RISK-BASED STUDENT LOANS 49
Figure 5.3: Students in High Value Fields (Other Than Business) have slightly higher ability levels and …
1379 1362 1389 1434 1406 1434
400
600
800
1000
1200
1400
1600
Students who persist in their intended major
Studens who switch majors
Students who did not have an intended major
Humanities / Social Sciences (excluding economics) degree completers
Natural Science / Engineering / Economics degree completers
SAT scores by pre-college intended major and completed major for a sample of Duke undergraduates
Mean SAT points !!
Source: Peter Arcidiacono, Esteban M. Aucejo, & Ken Spenner, What Happens After Enrollment? An Analysis of the Time Path of Racial Differences in GPA and Major Choice (2011) Table 11.
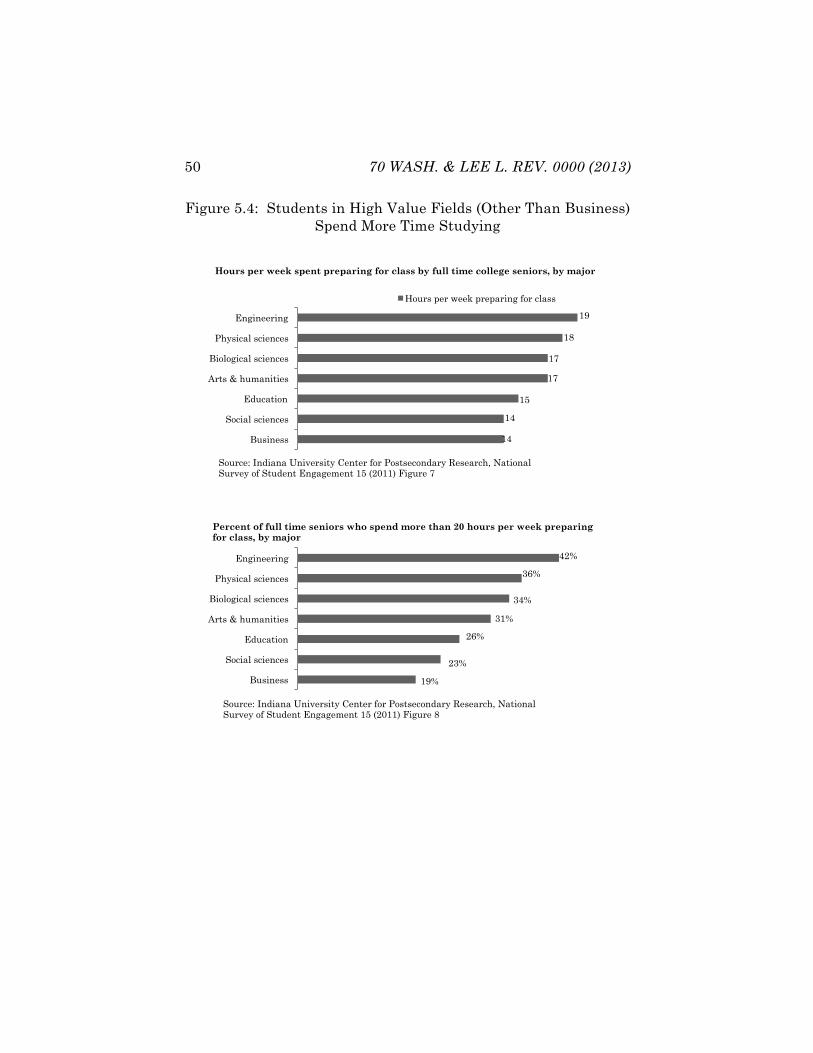
50 70 WASH. & LEE L. REV. 0000 (2013)
Figure 5.4: Students in High Value Fields (Other Than Business) Spend More Time Studying
19
18
17
17
15
14
14
Engineering
Physical sciences
Biological sciences
Arts & humanities
Education
Social sciences
Business
Hours per week preparing for class
Hours per week spent preparing for class by full time college seniors, by major
Source: Indiana University Center for Postsecondary Research, National Survey of Student Engagement 15 (2011) Figure 7
42%
36%
34%
31%
26%
23%
19%
Engineering
Physical sciences
Biological sciences
Arts & humanities
Education
Social sciences
Business
Percent of full time seniors who spend more than 20 hours per week preparing for class, by major
Source: Indiana University Center for Postsecondary Research, National Survey of Student Engagement 15 (2011) Figure 8
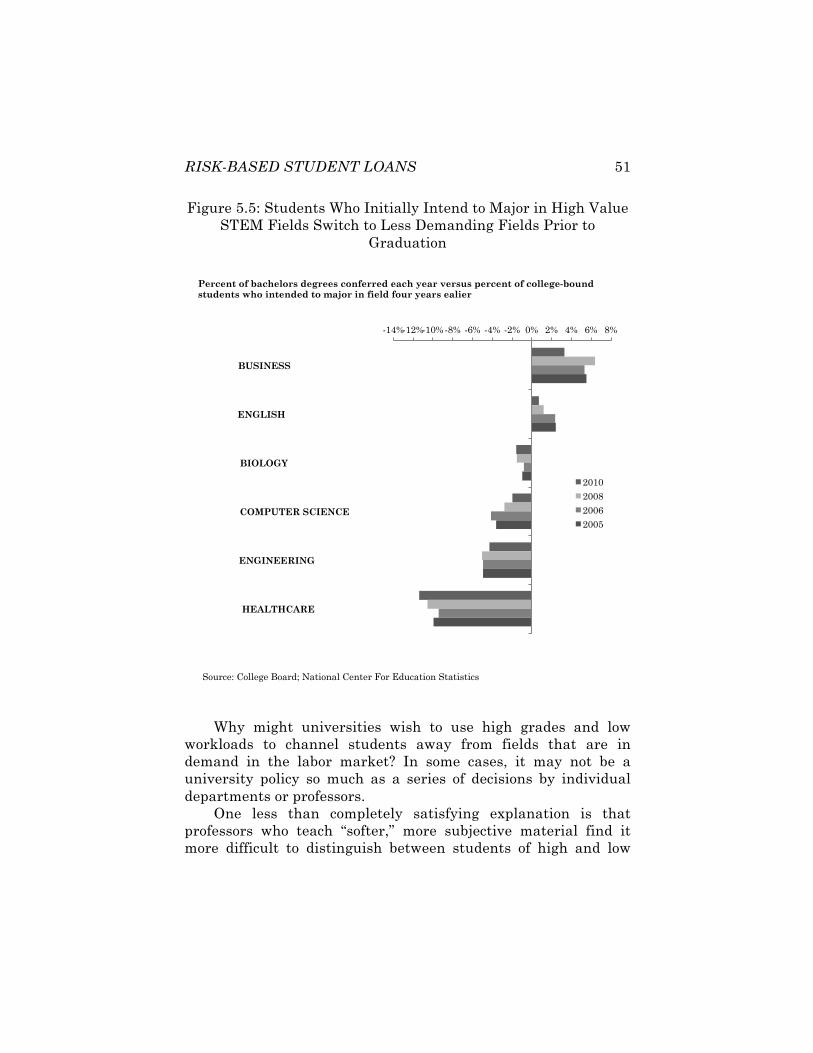
RISK-BASED STUDENT LOANS 51
Figure 5.5: Students Who Initially Intend to Major in High Value STEM Fields Switch to Less Demanding Fields Prior to
Graduation
Why might universities wish to use high grades and low workloads to channel students away from fields that are in demand in the labor market? In some cases, it may not be a university policy so much as a series of decisions by individual departments or professors.
One less than completely satisfying explanation is that professors who teach “softer,” more subjective material find it more difficult to distinguish between students of high and low
-14% -12% -10% -8% -6% -4% -2% 0% 2% 4% 6% 8%
BUSINESS
ENGLISH
BIOLOGY
COMPUTER SCIENCE
ENGINEERING
HEALTHCARE
2010
2008
2006
2005
Percent of bachelors degrees conferred each year versus percent of college-bound students who intended to major in field four years ealier
Source: College Board; National Center For Education Statistics
52 70 WASH. & LEE L. REV. 0000 (2013)
ability.119 A higher cost to professors of sorting students by ability would explain a narrower grading distribution, but not necessarily higher average grades or lower workloads. Some STEM professors might wish to “weed out” weaker students because of concern about the harm such students might cause if they graduate with satisfactory grades and then err on the job—imagine a poorly designed bridge—whereas liberal arts professors may be less concerned about the quality of graduates engaged in nonlethal endeavors. Of course, low grades, large class sizes, and limited academic support may deter even some high-ability students from pursuing STEM educations, and many STEM careers involve little risk to public safety.
Another possibility is that humanities and social sciences professors feel compelled to compete for student enrollments by offering better grades for less work, because they cannot compete by offering equally attractive post-graduation employment opportunities.120 STEM professors may feel less pressure than humanities professors to compete for student enrollments because STEM professors can generate revenue for the university by bringing in research grants or developing commercially useful patents.121
But why do universities tolerate such interdepartmental grade-based competition for enrollments? Universities could standardize grading by creating a mandatory grading curve across disciplines or requiring professors to rank students on a
119. See Achen & Courant, supra note 113, at 78 (“[D]epartments that evaluate student performance using interpretive methods will tend to have higher grades, because using these methods increases the personal cost to instructors of assigning and defending low grades.”); id. at 87–88; Larkey, supra note 113, at 270 (“[T]here is apparently more resistance to [grade] inflation in domains with more sharply and logically defined right and wrong answers.”). 120. See Achen &. Courant, supra note 113, at 78 (“Grades can be used in conjunction with other tools to attract students to departments that have low enrollments and to deter students from courses of study that are congested.”); Larkey, supra note 113, at 270. 121. BOK, supra note 10, at 74 (“[T]eaching loads . . . have dropped furthest . . . in scientific disciplines, such as mathematics and experimental physics, where the interests of undergraduates have steadily given way to the demands of pure research.”); id. at 140–42 (discussing efforts to commercialize university-developed technologies).
RISK-BASED STUDENT LOANS 53
percentile scale.122 Universities could make grading even more meaningful by using rankings adjusted for the difficulty of the course and the level of competing students. Indeed, one such proposal—complete with a workable methodology—was put forth by a professor of statistics at Duke University, considered, and ultimately rejected by his university.123
One possibility is internal university politics and interdepartmental rivalries.124 Another possibility is that such changes are simply not in the overall interests of universities.125
122. Larkey, supra note 113, at 270 (“There are many possible measures of aggregate performance for comparing students that are superior to GPA. They are superior in that they better represent comparative performance and remove incentives for students to choose courses and instructors based on their relative difficulty.”).
Similarly, universities could reduce the number of credits granted for each hour of instruction in humanities or social sciences, compared to each hour of instruction in STEM subjects, because the STEM subjects require more out-of-class work for each hour of instruction. 123. See Johnson, supra note 113, at 266–68 (explaining the benefits of using academic indexing for grade calculation instead of the traditional GPA approach); Charlie Mehl, Book: Grade Inflation Exists at Duke, CHRON. (Duke Univ.), Apr. 4, 2003, http://www.dukechronicle.com/article/book-grade-inflation-exists-duke (last visited Feb. 3, 2013) (reporting that Valen E. Johnson’s academic indexing proposal was rejected by the Duke Arts and Sciences Council in 1997) (on file with the Washington and Lee Law Review). 124. See Jessica Lichter, No Easy Solution for Grade Inflation Exists, Some Say, CHRON. (Duke Univ.), Mar. 19, 2009, http://www.dukechronicle. com/article/no-easy-solution-grade-inflation-exists-some-say (last visited Feb. 3, 2013) (noting that the Duke academic departments that voted against Valen E. Johnson’s grade indexing proposal all gave higher than average grades, while the departments that voted in favor almost all gave lower than average grades) (on file with the Washington and Lee Law Review). 125. See Romer, supra note 116, at 237
A liberal arts university that has a fixed investment in faculty who teach in areas outside of the sciences and that faces internal political pressures to maintain the relative sizes of different departments may respond to this pressure by making it more difficult for students to complete a degree in science. Faculty in the departments that teach the basic science courses will be happy to “keep professional standards high” and thereby keep teaching loads down. Faculty in other departments will be happy to make study in their departments more attractive, for example by inflating the average grade given in their courses.
Donald G. Freeman, Grade Divergence as a Market Outcome, 30 J. ECON. EDUC. 344, 344 (1999) (arguing that universities adjust their grading distributions to
54 70 WASH. & LEE L. REV. 0000 (2013)
Instruction in any area with attractive career opportunities outside academia—whether in medicine, law, business, or certain STEM fields—will be relatively expensive. Those with talent in such fields have attractive employment opportunities in the private sector or government, and those who agree to forgo those opportunities to teach at universities must therefore be offered higher wages than other professors.126
Undergraduate students usually pay the same tuition price per credit regardless of what they study,127 so students who are willing to study subjects with limited value in the labor market
channel students away from classes that are overcrowded relative to supply of qualified instructors and toward courses in which teaching capacity is underutilized). 126. See, e.g., RICHARD B. FREEMAN, THE MARKET FOR COLLEGE-TRAINED MANPOWER: A STUDY IN THE ECONOMICS OF CAREER CHOICE 165–67 (1971) (documenting shortages of faculty in high-demand fields in the United States in the 1960s when academic norms called for roughly equal pay across disciplines); GARY RHODES, MANAGED PROFESSIONALS: UNIONIZED FACULTY AND RESTRUCTURING ACADEMIC LABOR 75 (1998) (“The pattern of salary dispersion by field suggests that academic managers have been willing and able to respond to field-defined labor markets.”); Ronald Ehrenberg, Hirschel Kasper & Daniel Rees, Faculty Turnover at American Colleges and Universities: Analyses of AAUP Data, 10 ECON. EDUC. REV. 99, 99–110 (1991) (presenting data confirming the importance of salary to faculty retention); Faculty Salaries Vary by Institution Type, Discipline, CHRON. OF HIGHER EDUC., Apr. 11, 2011 (presenting data showing that faculty salaries are highest in law, business, economics, computer science, engineering, and health science, and lowest in performing arts, education, and the humanities); MIKE HORSLEY, ET AL., DEP’T OF EDUC., EMP’T & WORKPLACE RELATIONS, Salary Relatives and the Academic Labour Market 47–79 (2003) (documenting Australian universities’ difficulty hiring faculty when candidates were qualified for more highly paid private sector work, especially in finance and business, science, engineering, and information technology). 127. A few public universities charge a higher price for courses or majors in high cost, high value areas such as business or engineering, in part because these areas are expensive and state legislatures have refused to approve general tuition increases. There is some anecdotal evidence suggesting that differential tuition has reduced the likelihood that low-income students will study toward high value degrees. Universities that charge differential tuition or fees include the University of Wisconsin, Rutgers, the University of Illinois, the University of Kansas, and the University of Nebraska. See Jonathan D. Glater, Certain Degrees Now Cost More at Public Universities, N.Y. TIMES, July 29, 2007, http://www.nytimes.com/2007/07/29/education/29tuition.html?pagewanted=all&_r=0 (last visited Feb. 3, 2013) (on file with the Washington and Lee Law Review).
RISK-BASED STUDENT LOANS 55
may be more profitable to teach than students who insist on instruction with higher value in the labor market (i.e., engineering, business, or health science).128 Universities can use grades or higher student-to-faculty ratios to channel students away from fields in which instruction is expensive.129
Higher student-to-faculty ratios in STEM fields detract from the quality of instruction in these fields. Students in STEM majors are less likely to complete their degrees in four or five years, and frequently complain about inadequate academic support.130
As discussed in greater detail below, the government could counteract these perverse incentives through risk-based pricing, which would create constructive financial incentives for both students and universities. Students who persisted in challenging, high-value majors would be rewarded with lower interest rates and a lower total cost of education. Universities that channeled more students toward fields with high value in the labor market would find their “institutional interest rate” decrease, which would encourage prospective students to matriculate and increase university revenues. By contrast, students or universities that devoted resources toward low-value instruction would find their interest rates increase and their resources shrink. 128. See BOK, supra note 10, at 41 (“Universities may offer worthless instruction because of . . . financial pressure.”). 129. See Achen & Courant, supra note 113, at 78, 89 (arguing that universities adjust their grading distributions to channel students away from classes that are overcrowded relative to supply of qualified instructors and toward courses in which teaching capacity is underutilized); Freeman, supra note 125, at 344 (same). 130. See Hurtado et al., supra note 115 (stating that STEM majors have lower rates of degree completion than other college majors); Assia Boundauli, Why Would-be Engineers End Up as English Majors, CNN (May 21, 2011, 10:16 PM), http://www.cnn.com/2011/US/05/17/education.stem.graduation/index.html (last visited Feb. 3, 2013) (“Science and math programs are designed and taught to winnow down the number of students. University tenure systems often reward professors who conduct research and publish their work, but not those who teach well.”) (on file with the Washington and Lee Law Review); Christopher Drew, Why Science Majors Change Their Mind, N.Y. TIMES, Nov. 6, 2011, at ED16 (citing difficult coursework, intense competition, and grade inflation in non-STEM majors as reasons for the high attrition rate in STEM degree programs).
56 70 WASH. & LEE L. REV. 0000 (2013)
The federal government could also help universities obtain the resources they need to hire more qualified instructors in high demand, labor-market-relevant fields by boosting federal student loan limits. At a minimum, loan limits could be increased for students who are studying toward high-income, low unemployment careers, so that universities can obtain the revenues they need to offer competitive salaries to qualified instructors in these fields.131
But if universities are student-customer driven, why do students not already demand more instruction in fields that will prepare them better for the labor market? One possibility is that students prefer to enjoy a leisurely college experience and are relatively indifferent to the long-term financial consequences.132 A second possibility is that liberal arts majors correctly perceive that maximizing their undergraduate GPA will improve their chances of admission to an elite graduate program that will ultimately boost their long term income, and are more willing or able than STEM majors to delay entering the labor force.133 And indeed, some labor economists have suggested that studies
131. Cash-strapped colleges have already started to charge students more for high-demand classes. See Jordan Weissman, The Future of College: The Biggest Classes Are the Most Expensive, ATLANTIC, Mar. 16, 2012, http://www.theatlantic.com/business/archive/2012/03/the-future-of-college-the -biggest-classes-are-the-most-expensive/254589 (last visited Feb. 3, 2013) (on file with the Washington and Lee Law Review). 132. See supra note 97 (presenting evidence that many students place high value on leisure and personal enjoyment both during and after college). 133. Eric Eide & Geetha Waehrer, The Role of Option Value of College Attendance in College Major Choice, 17 ECON. EDUC. REV. 73, 73 (1998) (“[A]necdotal evidence suggests that many students choose to major in fields never intending to terminate their education with an undergraduate degree, but rather they intend to enroll in professional or academic graduate programs.”); Kimberly A. Goyette & Ann L. Mullen, Who Studies the Arts and Sciences? Social Background and the Choice and Consequences of Undergraduate Field of Study, 77 J. HIGHER EDUC. 497, 524–27 (2006) (reporting that lower socioeconomic status students are more likely to choose vocational majors and more likely to be employed in higher paying jobs four years after graduation, while higher socioeconomic status liberal arts majors are more likely to enroll in graduate school, which may lead to higher long-term incomes); Johnson, supra note 118, at 251–52 (“For those students whose primary objective is to gain admittance to medical school or law school . . . ‘grade shopping’ may represent an optimal career strategy.”).
RISK-BASED STUDENT LOANS 57
focusing on wages and employment at graduation undervalue humanities and social science degrees relative to engineering and business degrees because they ignore the option value nonvocational degrees confer by facilitating enrollment in graduate school.134 A third possibility is that students do not have good information about the labor market until it is too late.
C. Many Students May Not Understand the Connection Between Their Chosen Course of Study and Future Income and
Employment Prospects
Students—who are by definition still learning about their chosen field—may not have accurate information about post-graduation employment prospects and wages in their own or other fields. Empirical studies have documented systematic mistakes in undergraduate students’ perceptions about prospective wages by college major and occupation. According to
134. Eide & Waehrer, supra note 133, at 74, 77 (arguing that humanities and social science degrees may prepare students for a wider range of graduate schools than engineering, computer science, or business degrees and therefore have higher option value). The investigators only analyzed the probability of attending graduate school conditional on a certain choice of major, not the type of graduate school attended or wages after completion of graduate school.
The assumption that social science and humanities degrees are undervalued on a relative basis may not hold in the absence of grade inflation (which may improve chances of admission to elite programs) or with more nuanced analysis of different types of graduate degrees or post-graduate-school wages. At least with respect to professional schools, graduate students with undergraduate backgrounds in business, economics or STEM seem to have considerable advantages. See e.g., Black et al., supra note 18, at 365–66 (finding that economics majors make more money than most other majors when they enter the work force directly after graduation, and economics majors who attend law or business schools have higher wages than those who majored in other fields, except for MBAs with undergraduate degrees in Chemical Engineering).
Law students with technical backgrounds may find it easier to specialize in high-wage, high-demand areas of legal practice, such as patents, tax, bankruptcy, commercial law, healthcare regulation, energy regulation, financial regulation, or other technical fields. Business students who can manage engineers, evaluate technical companies, or analyze large data sets seem to be in higher demand than those with soft skills such as communications or marketing. And medical school requires that students have scientific backgrounds.
58 70 WASH. & LEE L. REV. 0000 (2013)
one study of undergraduates at the University of California at San Diego, students typically mistake expected wages by 20%.135 According to another study of male undergraduates at Duke, students typically overestimate wages in their own field, and 7.5% of students would switch majors if they optimally forecasted wages.136 It should be noted that this study controlled for the influence of students’ abilities and career preferences on choice of major.137
Studies also suggest that students generally learn about labor market prospects a year or so before graduation—too late to easily change majors.138 Students are better informed of starting salaries than about potential increases,139 and might overestimate the importance of starting salary relative to lifetime earnings. Disconcertingly, there is evidence that the students who know the least about major and occupational wage differences are those from poor families.140 This is not due to lower ability levels of less wealthy students; the investigators suggest it may be because such students have fewer college-educated relatives and friends who can inform them about the
135. Julian R. Betts, What Do Students Know About Wages? Evidence from a Survey of Undergraduates, 31 J. HUM. RESOURCES 27, 49 (1996). 136. See Peter Arcidiacono, V. Joseph Hotz & Songman Kang, Modeling College Major Choice using Elicited Measures Expectations and Counterfactuals, 1–2 (Nat’l Bureau of Econ. Research, Working Paper No. 15729, 2010), http://www.nber.org/papers/w15729.pdf
[S]tudents think the market premium is higher for their own major compared to those for majors they did not choose. . . . We estimate that over 7.5% of students would switch majors if this forecast error was not present. Thus, our results suggest an important role for informational differences in modeling the choice of college major.
137. See id. (“Our model-based estimates clearly indicate that expected earnings do matter for student’s choice of major, even after controlling for ability and career preferences.”). 138. See Betts, supra note 135, at 47–48 (reporting that students do not acquire most of their knowledge about wages until their final year of education). 139. See id. at 39 (“Students’ knowledge of salaries of younger workers is quite good, but becomes progressively worse as the experience of the worker in question increases.”). 140. See id. at 37–38, 43. All students surveyed were enrolled at UCSD. Id. at 29. The authors controlled for ability as measured by GPA, and even after controlling for GPA, students from lower income families were less knowledgeable about occupational wages. Id. at 35–36, 43.
RISK-BASED STUDENT LOANS 59
labor market for college-educated workers. Students are not simply uninformed, but in some instances, they are actively misled by aggressive and deceptive recruiting efforts.141
Studies have demonstrated that students choose their major based largely—but not exclusively—on expected post-graduation wages.142 Many students would switch to majors linked to higher 141. See Braucher, supra note 71 at 471 (noting market failures caused by information asymmetries and aggressive sales and marketing tactics by for-profit higher education institutions); Frontline, College, Inc.: The Sales and Marketing Story, PBS (Apr. 4, 2010), http://www.pbs.org/wgbh/pages/frontline/ teach/collegeinc/ (last visited Feb. 3, 2013) (detailing the marketing practices of for-profit higher education institutions and the debt accrued by their students) (on file with the Washington and Lee Law Review); Frontline, Educating Sergeant Pantzke, PBS (June 28, 2011), http://www. pbs.org/wgbh/pages/frontline/educating-sergeant-pantzke/ (last visited Feb. 3, 2013) (describing for-profit colleges’ efforts to recruit military veterans) (on file with the Washington and Lee Law Review); see also GREGORY D. KUTZ, GOV’T ACCOUNTABILITY OFF., FOR PROFIT COLLEGES: UNDERCOVER TESTING FINDS COLLEGES ENCOURAGED FRAUD AND ENGAGED IN DECEPTIVE AND QUESTIONABLE MARKETING PRACTICES 1 (2010) (“Undercover tests at 15 for-profit colleges found that 4 colleges encouraged fraudulent practices and that all 15 made deceptive or otherwise questionable statements to GAO’s undercover applicants.”). But cf. Nick Anderson, GAO Revises its Report Critical of Practices at For-Profit Schools, WASH. POST, Dec. 7, 2010, http://www.washingtonpost.com/wp-dyn/content/article/2010/12/07/AR2010120707412.html?sid=ST2010120800393 (last visited Feb. 3, 2013) (noting that the report was revised to correct errors and softened) (on file with the Washington and Lee Law Review).
It is unclear if marketing abuses also occur at non-profit institutions. Sales and marketing efforts appear to be more aggressive in the for-profit sector, which spends an average of 23% of revenue on sales and marketing compared to 0.5% in the nonprofit sector. See Emma Roller, Senate Bill Would Bar Colleges from Using Federal Student Aid for Marketing, CHRON. OF HIGHER EDUC., Apr. 18, 2012.
A study by the Government Accountability Office suggested that after controlling for student characteristics, graduates of for-profit institutions generally have worse outcomes, although some for-profit programs performed well. See GOV’T ACCOUNTABILITY OFF., POSTSECONDARY EDUCATION: STUDENT OUTCOMES VARY AT FOR-PROFIT, NONPROFIT, AND PUBLIC SCHOOLS 5–8 (2011) (comparing graduation rates, employment outcomes, student loan debt, default rates, and licensing exam results of students graduating from for-profit, nonprofit, and public institutions). 142. See Richard J. Cebula & Jerry Slopes, Determinants of Student Choice of Undergraduate Major Field, 19 AM. EDUC. RES. J. 303, 303 (1982) (presenting evidence that “earnings differentials among fields and differences in the rate of change in earnings among fields are the most important factors in the student’s decision”); Claude Montmarquette, Kathy Cannings & Sophie Mahseredjian, How Do Young People Choose College Majors?, 21 ECON. EDUC. REV. 543, 554
60 70 WASH. & LEE L. REV. 0000 (2013)
post-graduation wages if students had more accurate and timely information.143 Expected wages play a particularly important role in major choice for students from low socioeconomic status backgrounds.144 Choosing the right major could help poor students use education to achieve upward socioeconomic mobility.
Recently, there have been several attempts to make the education and labor markets more transparent. These include data supplied for free by the U.S. Departments of Labor and Education,145 new “scorecards” and “shopping sheets” for educational institutions,146 and entrepreneurial efforts to make labor market information more accessible.
As discussed in greater detail below, risk-based pricing of student loans could help make wages and employment prospects more transparent and salient to students at an earlier stage in their educational careers.
(2002) (“[C]hoice of college concentration depends decisively on the expected earnings in a particular concentration.”). But see Peter Arcidiacono, Ability Sorting and the Returns to College Major, 121 J. ECONOMETRICS 344, 372 (2004) (finding that the wage premium for certain college majors does not drive students of higher ability to select those majors as much as student subject matter preferences). 143. See Arcidiacono, Hotz & Kang, supra note 136, at 2–3 (stating that many students would switch their majors if they had more accurate salary information). 144. See Kimberly A. Goyette & Ann L. Mullen, supra note 133, at 524–27 (reporting that low socioeconomic status students are more likely to choose vocational majors and more likely to be employed in higher paying jobs four years after graduation, while higher socioeconomic status liberal arts majors are more likely to enroll in graduate school); Yingyi Ma, Family Socioeconomic Status, Parental Involvement, and College Major Choices—Gender, Race/Ethnic, and Nativity Patterns, 52 SOC. PERSP. 211, 211 (2009) (finding that lower socioeconomic students favor more lucrative majors compared to higher socioeconomic status students). 145. See Research and Statistics, U.S. DEP’T OF EDUC., http://www2.ed.gov/rschstat/landing.jhtml (last visited Feb. 3, 2013) (providing links to research and statistics on educational programs and job markets) (on file with the Washington and Lee Law Review). 146. What College Students Need to Know, N.Y. TIMES, Feb. 20, 2012, at A18.
RISK-BASED STUDENT LOANS 61
D. Skilled Labor Markets Suffer from Periodic Booms and Busts
Students generally do not have good information with which to forecast the likelihood of employment in a given field.147 Without a good forecast of decisions by employers (the demand side) and knowledge of how many other students are studying toward a particular field (the supply side), such prediction is difficult if not impossible. Instead, students appear to assume that the future will resemble the present.
This assumption and the long production lag for skilled labor leads to boom and bust cycles in the labor market known as “cobweb” cycles.148 At the start of the cycle, many students seek to study toward a high-income occupation. Years later, when they all simultaneously try to enter the labor force, the large supply of labor causes wages to crash in their occupation. In the second stage of the cycle, students choosing an occupation at the time of the crash then avoid training for the newly low income occupation, and years later, there will be a shortage of labor for that occupation, causing wages to rise and the cycle to repeat.
Cobweb cycles have been demonstrated in a wide range of skilled labor markets, including markets for engineers, lawyers, scientists, and professors. The number of years in the cycle is
147. See infra note 148 and accompanying text. 148. See ROBERT J. SHILLER, THE NEW FINANCIAL ORDER: RISK IN THE 21ST CENTURY 132 (2003) (explaining the concept of cobweb cycles); FREEMAN, supra note 126, at 22–26 (outlining the cobweb cycle theory); Richard B. Freeman, Supply and Salary Adjustments to the Changing Science Manpower Market: Physics, 1948–1973, 65 AM. ECON. REV. 27, 38 (1975) (“[L]arge numbers of physics graduates create a market setting likely to reduce enrollments and future degrees in the field in accord with the cobweb scenario.”); Richard B. Freeman, Legal Cobwebs: A Recursive Model of the Market for New Lawyers, 57 REV. ECON. & STAT. 171, 173–75 (1975) (applying the cobweb model to the legal market); Richard B. Freeman, A Cobweb Model of the Supply and Starting Salary of New Engineers, 29 INDUS. & LAB. REL. REV. 236, 248 (1976) (applying the cobweb model to the market for engineers); Christoph Engel & Hanjo Hamann, The Hog-Cycle of Law Professors (Max Planck Inst. for Research on the Collective Good, Working Paper No. 2012/8, 2012), available at http://papers.ssrn.com/sol3/papers.cfm?abstract_id=2046484 (documenting an eight-year cycle for German law professors); cf. Gary A. Zarkin, Cobweb Versus Rational Expectations Models: Lessons from the Market for Public School Teachers, 13 ECON. LETTERS 87, 87 (1983) (arguing that “cobweb” effects can be explained within a rational expectations model of occupational choice).
62 70 WASH. & LEE L. REV. 0000 (2013)
typically proportional to the number of years of advanced training required to enter the profession.
E. Skills Mismatches Reduce Employment and Output
Mismatches between skills and employment opportunities lead to an inefficient reduction in productivity and higher unemployment.149 Economists at the Federal Reserve have estimated that the mismatch between worker skills and employer needs accounts for more than one-fourth of unemployment in the United States.150 When employment opportunities are available but workers lack the required skills, the resulting reduction in employment is called “structural unemployment.”
As will be discussed below, even educational institutions themselves may not always have good information about the labor market or the resources to acquire that information. Some of the best information, such as confidential tax or social security records—which may have more accurate wage data than surveys—may only be available to or acquirable by the government.
Because the U.S. government’s role in the higher education market is primarily as a lender,151 risk-based pricing of federal student loans may offer the best approach to reconcile traditional academic values with the goals of a more transparent and 149. See AUGUSTE ET AL., supra note 112, at 57 (“[E]mployers still have trouble finding workers with specific skills. And many students lack a clear picture of which jobs and skills will be in high demand.”); Robert Shimer, Mismatch, 97 AM. ECON. REV. 1074, 1074 (2007) (arguing that geographic attachment and skills mismatch contribute to structural unemployment). 150. See Narayana Kocherlakota, President, Fed. Res. Bank of Minneapolis, President’s Speech at Missoula, Montana: Back Inside the FOMC (Sept. 8, 2010) available at http://www.minneapolisfed.org/news_events/pres/speech_display. cfm?id=4532 (last visited Feb. 3, 2013) (“How much of the current unemployment rate is really due to mismatch? The answer seems to be a lot. [With better matching] we would have an unemployment rate closer to 6.5 percent, not 9.6 percent. . . . [O]ver 2.5 percentage points of the current unemployment rate is attributable to mismatch.”). 151. See ANNE PRISCO ET AL., THE ALLIANCE FOR INT’L HIGHER EDUC. POLICY STUDIES, FEDERAL POLICIES AND HIGHER EDUCATION IN THE UNITED STATES 12 (2002) (“Student financial assistance is at the core of federal strategies for influencing higher education priorities and outcomes.”).
RISK-BASED STUDENT LOANS 63
efficient labor market, higher wages, and lower structural unemployment.
V. The Theory of Risk-Based Credit Pricing
Lenders are not like ordinary retail merchants. Whereas a merchant can complete a transaction at the time of sale, a lender will have an ongoing relationship with the borrower for the entire duration of the loan. The lender continues to bear risk that at some point the borrower will become unable to repay and will default on the debt.152
Risk-based credit pricing involves adjusting the interest rate on loans so that the interest rate compensates the lender not only for the time value of money,153 but also for the risk that borrowers will default on their debts and cause the lender to incur losses.
152. Default refers to late payment or partial or complete failure to repay. Defaults can be distinguished from one another by their severity, or the losses to the lender in the event of default, which can range from 0% to 100% of the loan value. See Understanding Default, FEDERAL STUDENT AID, http://studentaid.ed. gov/repay-loans/default (last visited Feb. 3, 2013) (defining and explaining default and its consequences) (on file with the Washington and Lee Law Review). 153. The time value of money is the idea that the value of money is higher in the present than in the future, either because money today could be invested to produce profit in the future, or because people tend to prefer instant gratification and would generally rather consume the same good or service now rather than in the future. See Michael Simkovic & Benjamin Kaminetzky, Leveraged Buyout Bankruptcies, the Problem of Hindsight Bias, and the Credit Default Swap Solution, 2011 COLUM. BUS. L. REV. 188, 188 n.214 (explaining the time value of money concept).
The time value of money is a broader concept than inflation, which refers to general changes in price levels, so that a dollar at one point in time will not purchase the same basket of goods and services in the future. Inflation is generally positive (i.e., the value of money declines over time). However, even with zero inflation, there would still be a positive time value of money because of the prospect of real (after-inflation) profitable investments and because of preferences for present consumption.
The time value of money is typically measured as the interest rate charged to a hypothetical debtor with no risk of defaulting, also called the risk-free rate. Although no debtor is completely risk-free, the risk-free rate for dollar-denominated loans is typically assumed to be the rate of interest on U.S. government securities. See id. at 188–89; Joost Driessen, Is Default Event Risk Priced in Corporate Bonds?, 18 REV. FIN. STUD. 165, 169 (2005) (noting that U.S.
64 70 WASH. & LEE L. REV. 0000 (2013)
From the perspective of risk-based credit pricing, uniform student loan pricing is a redistributive policy. Uniform pricing subsidizes the riskiest borrowers while profiting from the safest borrowers. In the student loan context, uniform credit pricing is a subsidy to students who are studying fields with the lowest value in the labor market and a tax on students who are studying fields with the highest value in the labor market and the best employment prospects.154 This subsidy creates perverse incentives—discouraging the most able students and most economically valuable programs, while encouraging the highest risk and least economically valuable programs.
Risk-based student loan pricing should reduce moral hazard by forcing student borrowers to internalize the risks created by their own decisions, encouraging students to study toward high-value occupations. Risk-based student loan pricing should reduce adverse selection by discouraging students with poor prospects from borrowing heavily to attend expensive education programs of dubious value, while encouraging the most promising students to borrow what they need to complete valuable degrees. Moreover, risk-based pricing would clarify the differential economic value of different courses of study, and help students make choices that are in their own long-term best interests.
Over time, risk-based student loan pricing should cause colleges to shift educational resources toward teaching subjects
Treasury bonds are assumed to be default-free); Francis A. Longstaff, Sanjay Mithal & Eric Neis, Corporate Yield Spreads: Default Risk or Liquidity? New Evidence from the Credit Default Swap Market, 60 J. FIN. 2213, 2223 (2005) (“[T]he Treasury curve . . . is the standard benchmark riskless curve in most empirical tests in finance.”); Robert C. Merton, On The Pricing of Corporate Debt: The Risk Structure of Interest Rates, 29 J. FIN. 449, 449 (1974) (noting that government bonds are essentially default-risk-free). For example, for a 10-year student loan, the yield on a 10-year Treasury bond might be used as the risk-free rate. 154. To be more precise, uniform pricing is a subsidy to those with the highest risk of default and a tax on those with the lowest risk of default. However, because students who need to borrow generally come from middle class backgrounds, and will therefore rely on their future labor income (or their spouse’s labor income) to repay their student loans, risk will in practice generally turn on career prospects. See JAQUELINE E. KING, FINANCING A COLLEGE EDUCATION: HOW IT WORKS, HOW IT’S CHANGING 27 (1999).
RISK-BASED STUDENT LOANS 65
and skills that are most valued in the labor market.155 This should improve the risk profile of borrowers, and reduce student loan defaults and structural unemployment.
Some may argue that wages in the labor market do not reflect the social value of certain occupations.156 For example, progressives frequently claim that teachers are undercompensated relative to their education levels and social contribution.157 Indeed, the original NDEA158 emphasized the importance of training more teachers as well as STEM specialists, and current student loan programs include special loan forgiveness provisions for teachers.159 By contrast, many economists have suggested that an individual’s willingness to sacrifice income to pursue less lucrative education and linked career paths suggest that such education or career paths may be more enjoyable and constitute a form of nonmonetary compensation.160
155. The transition may be gradual because the institution of tenure limits the flexibility of academic staffing. However, to the extent that untenured faculty, adjunct faculty, or graduate students teach classes in low-value fields, universities could adjust and reallocate resources toward higher value fields fairly rapidly. 156. See, e.g., EILIS LAWLOR, HELEN KERSLEY, SUSAN STEED & MARTIN COTTINGHAM, NEW ECON. FOUND., A BIT RICH: CALCULATING THE REAL VALUE TO SOCIETY OF DIFFERENT PROFESSIONS 27–28 (2009) (arguing that not all highly compensated occupations generate social value); Warren, Baum & Sitaraman, supra note 65, at 132–36 (advocating the value of military and civil service). 157. See LAWRENCE MISHEL, SYLVIA A. ALLEGRETTO & SEAN P. CORCORAN, ECON. POL’Y INST., THE TEACHING PENALTY: AN UPDATE THROUGH 2010 (2011) (arguing that teacher salaries are too low to attract top-performing graduates). There is little controversy that teacher compensation in the United States is not sufficient to attract and retain many top-performing college graduates. Whether the current workforce of teachers is “undercompensated” relative to its contributions is a separate question. 158. See National Defense Education Act of 1958, Title VIII, § 802, Pub. L. No. 85-864, 72 Stat. 1580, 1597–98 (codified as amended in scattered sections of 20 U.S.C.) (“Funds paid to a State under this title for area vocational education programs may be used, in carrying out such programs . . . for . . . maintenance of adequate programs of administration, supervision, and teacher-training . . . .”). 159. See Teacher Loan Forgiveness, FEDERAL STUDENT AID, http://student aid.ed.gov/repay-loans/forgiveness-cancellation/charts/teacher#what-are-the-eli gibility (last visited Feb. 3, 2013) (on file with the Washington and Lee Law Review). 160. See Annette Alstadsæter, Measuring the Consumption Value of
66 70 WASH. & LEE L. REV. 0000 (2013)
However, if public-sector workers are undercompensated, questions remain about whether public sector compensation should be increased through taxpayer-funded loan subsidies or through taxpayer-funded increase in starting salaries for college graduates entering public service.
Risk-based pricing does not demand a rigid embrace of laissez-faire. In every developed economy, both markets and governments set wages. If wages for public sector occupations are below socially optimal values, then this reflects a failure by governments to set taxes and spending at appropriate levels. If wages in socially destructive occupations are high, this reflects a failure of regulation and taxation to punish socially destructive behavior and channel profits toward productive activity. Risk-based student loan pricing does not create any of these failures—it simply reflects the current reality of U.S. political economy, and provides information and incentives to help college students navigate a challenging labor market.
To reject risk-based pricing outright in favor of uniform student loan pricing, one would have to believe that all low compensation occupations have positive externalities, all high compensation occupations have negative externalities, and that these externalities precisely match differences in wages and employability. In other words, one would have to believe that wage differentials are not only inefficient, but are the exact opposite of the efficient distribution of wages, and everyone with a college degree should earn the same income.
Furthermore, one would have to assume that supply-side subsidies such as low student loan interest rates are preferable to targeted demand-side subsidies such as higher taxpayer-funded wages for specific occupations.161
Education, 57 CESIFO ECON. STUD. 458, 468 (2010) (measuring the consumption value of education based on the expected income sacrificed by high ability students who attended teachers college in Norway in the 1960s instead of business school, and finding that students typically were willing to sacrifice 10–30% of their lifetime incomes); Annette Alstadsæter & Hans Henrik Sievertsen, The Consumption Value of Higher Education, (CESifo, Working Paper No. 2871, 2009) (finding that after controlling for ability, U.S. liberal arts college majors sacrifice 46% of their potential income in order to enjoy the consumption value of a liberal arts education). 161. Whereas demand-side subsidies would help workers to capture the
RISK-BASED STUDENT LOANS 67
There are many reasons to favor demand-side subsidies (higher wages) over lower interest rates. Loan subsidies would effectively increase public sector pay only for workers with student loans. Public sector employers might try to capture part of this subsidy by reducing entry-level base salary, thereby making public sector careers relatively less attractive to graduates who have no debts. Loan subsidies could unintentionally funnel the children of the poor into low paying public sector careers and affluent graduates into private sector careers with better long-term earnings. Such career sorting risks exacerbating class divisions and reducing social mobility.
By contrast, increased public service starting salaries would equally encourage students with debts and those without to enter public service. This could improve the quality of public service personnel by making such jobs attractive to a wider range of qualified applicants, increasing competition for public service jobs. It could also help prevent public service careers from becoming segregated along class divisions.
If certain occupations are “undercompensated,” then governments should increase compensation using the tax and spending power.162 Risk-based student loan pricing simply reflects the willingness—or unwillingness—of market participants and governments to pay for services, and channels human capital to where it is valued most. Indeed, governments may have no choice but to increase public sector compensation if college students become savvier about prospective wages in different occupations and refuse to accept low-wage (but supposedly valued) positions.
social benefits they arguably provide, subsidies that increase the supply of workers entering particular occupations help maintain low wages in those fields. See Douglas S. Massey, The Social and Economic Origins of Immigration, 510 ANNALS OF THE AM. ACAD. OF POL. & SOC. SCI. 60, 64 (1990). 162. See U.S. CONST. art. I, § 8, cl. 1 (“The Congress shall have Power To lay and collect Taxes, Duties, Imposts and Excises, to pay the Debts and provide for the common Defence and general Welfare of the United States . . . .”).
68 70 WASH. & LEE L. REV. 0000 (2013)
A. A Simple Risk-based Credit Pricing Model
Consider the following simplified example of risk-based credit pricing, adapted from Michael Simkovic & Benjamin Kaminetzky, Leveraged Buyout Bankruptcies, the Problem of Hindsight Bias and the Credit Default Swap Solution.163
Assumptions are listed below.
• Each group wants to borrow $100,000 • Each borrower borrows the same amount
of money • There are no transaction costs or
administrative costs • All payments and defaults are made at
the end of year 1 • The relevant risk-free rate is 3% per year • The lender is risk-neutral and not
subject to liquidity risk • The lender can borrow at the risk-free
rate • Group A
o Borrowers in Group A will repay their loans in full.
• Group B o Ten percent of the borrowers in
Group B will default on their loans in the first year, while 90% of the borrowers in Group B will repay their loans in full.
o The Group B borrowers who default will repay 70% of the balance of their loans.
Group A is risk-free. If the lender were to lend to Group A borrowers at 3%, the lender would end the year with $103,000 ($100,000 in principal repayment plus $3000 in interest payments). This would exactly match the lender’s cost of capital and—in the absence of any administrative costs—would cause the lender to break even. At any price above 3% interest, the
163. 2011 COLUM. BUS. L. REV. 118, 188–94, 218–21 (2011).
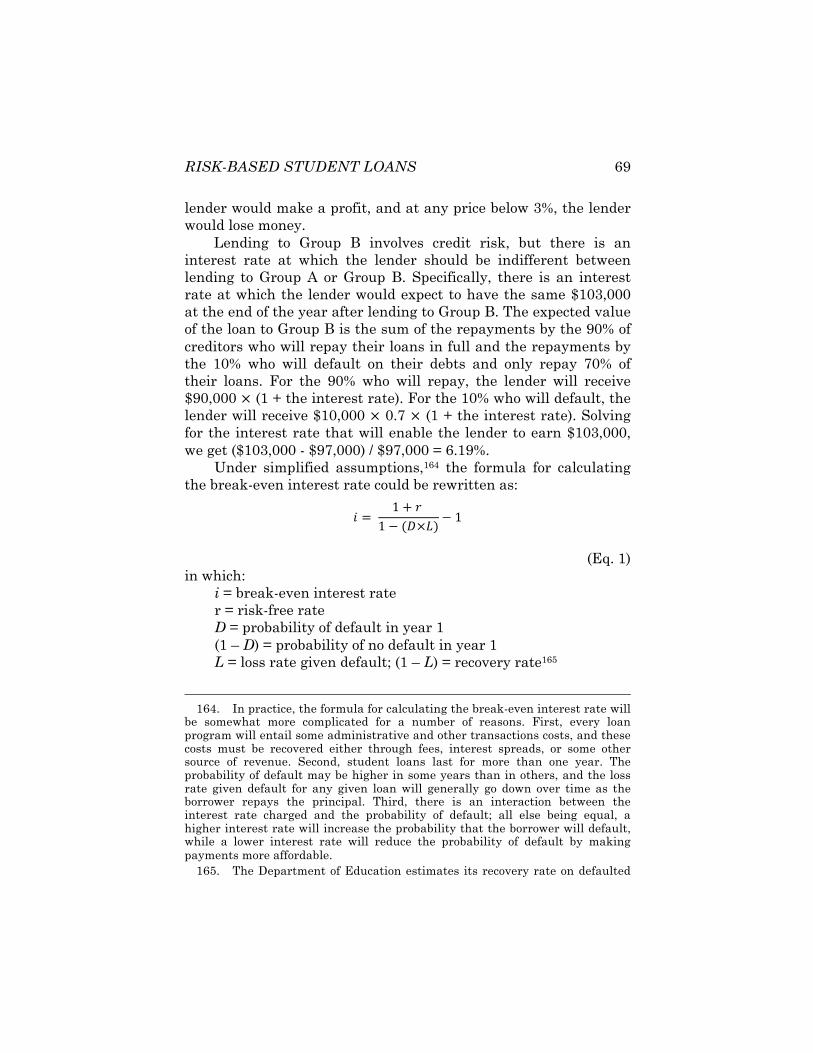
RISK-BASED STUDENT LOANS 69
lender would make a profit, and at any price below 3%, the lender would lose money.
Lending to Group B involves credit risk, but there is an interest rate at which the lender should be indifferent between lending to Group A or Group B. Specifically, there is an interest rate at which the lender would expect to have the same $103,000 at the end of the year after lending to Group B. The expected value of the loan to Group B is the sum of the repayments by the 90% of creditors who will repay their loans in full and the repayments by the 10% who will default on their debts and only repay 70% of their loans. For the 90% who will repay, the lender will receive $90,000 ! (1 + the interest rate). For the 10% who will default, the lender will receive $10,000 ! 0.7 ! (1 + the interest rate). Solving for the interest rate that will enable the lender to earn $103,000, we get ($103,000 - $97,000) / $97,000 = 6.19%.
Under simplified assumptions,164 the formula for calculating the break-even interest rate could be rewritten as:
! ! ! ! ! !!! ! !!!!! ! !
(Eq. 1) in which:
i = break-even interest rate r = risk-free rate D = probability of default in year 1 (1 – D) = probability of no default in year 1 L = loss rate given default; (1 – L) = recovery rate165
164. In practice, the formula for calculating the break-even interest rate will be somewhat more complicated for a number of reasons. First, every loan program will entail some administrative and other transactions costs, and these costs must be recovered either through fees, interest spreads, or some other source of revenue. Second, student loans last for more than one year. The probability of default may be higher in some years than in others, and the loss rate given default for any given loan will generally go down over time as the borrower repays the principal. Third, there is an interaction between the interest rate charged and the probability of default; all else being equal, a higher interest rate will increase the probability that the borrower will default, while a lower interest rate will reduce the probability of default by making payments more affordable. 165. The Department of Education estimates its recovery rate on defaulted
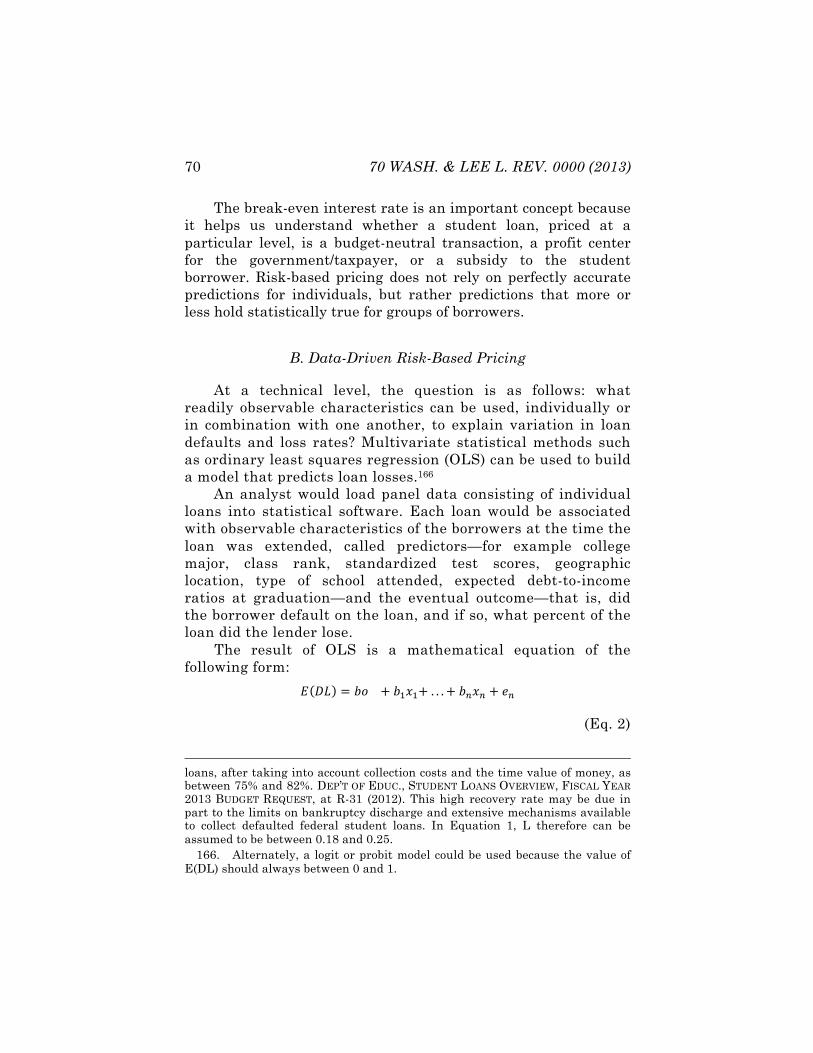
70 70 WASH. & LEE L. REV. 0000 (2013)
The break-even interest rate is an important concept because it helps us understand whether a student loan, priced at a particular level, is a budget-neutral transaction, a profit center for the government/taxpayer, or a subsidy to the student borrower. Risk-based pricing does not rely on perfectly accurate predictions for individuals, but rather predictions that more or less hold statistically true for groups of borrowers.
B. Data-Driven Risk-Based Pricing
At a technical level, the question is as follows: what readily observable characteristics can be used, individually or in combination with one another, to explain variation in loan defaults and loss rates? Multivariate statistical methods such as ordinary least squares regression (OLS) can be used to build a model that predicts loan losses.166
An analyst would load panel data consisting of individual loans into statistical software. Each loan would be associated with observable characteristics of the borrowers at the time the loan was extended, called predictors—for example college major, class rank, standardized test scores, geographic location, type of school attended, expected debt-to-income ratios at graduation—and the eventual outcome—that is, did the borrower default on the loan, and if so, what percent of the loan did the lender lose.
The result of OLS is a mathematical equation of the following form:
! !" ! !" ! !!!!!!! ! !!!!!!! ! !!
(Eq. 2)
loans, after taking into account collection costs and the time value of money, as between 75% and 82%. DEP’T OF EDUC., STUDENT LOANS OVERVIEW, FISCAL YEAR 2013 BUDGET REQUEST, at R-31 (2012). This high recovery rate may be due in part to the limits on bankruptcy discharge and extensive mechanisms available to collect defaulted federal student loans. In Equation 1, L therefore can be assumed to be between 0.18 and 0.25. 166. Alternately, a logit or probit model could be used because the value of E(DL) should always between 0 and 1.
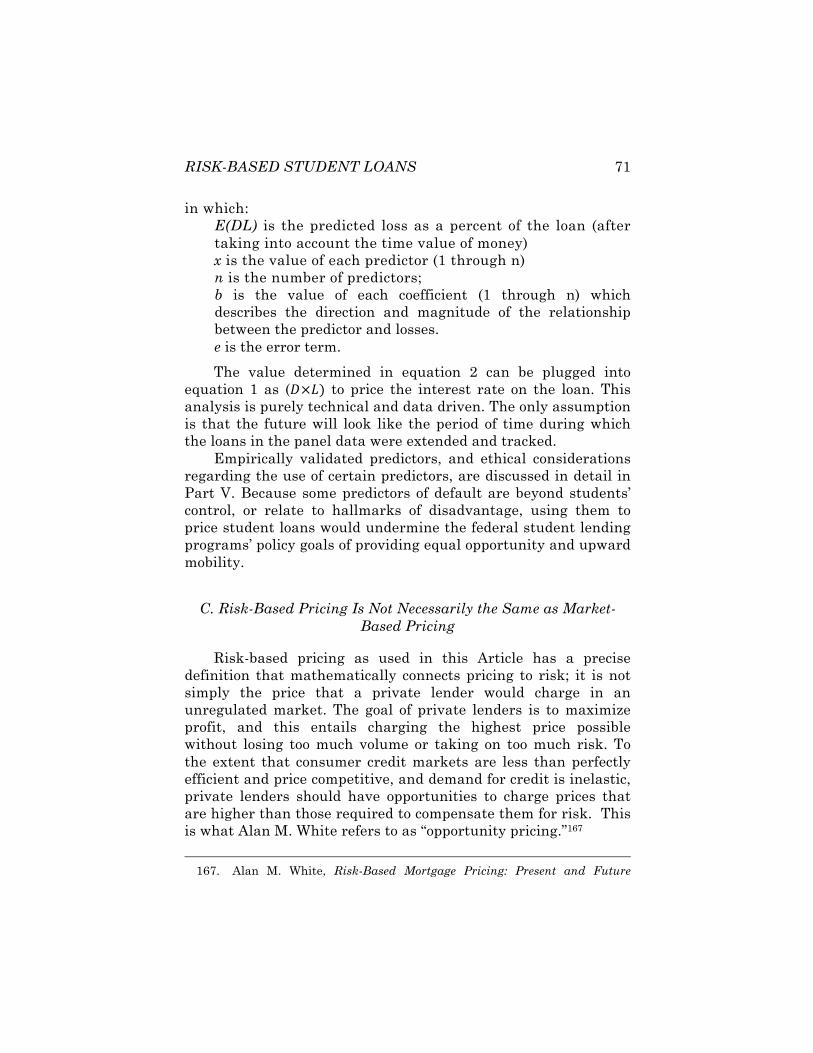
RISK-BASED STUDENT LOANS 71
in which: E(DL) is the predicted loss as a percent of the loan (after taking into account the time value of money) x is the value of each predictor (1 through n) n is the number of predictors; b is the value of each coefficient (1 through n) which describes the direction and magnitude of the relationship between the predictor and losses. e is the error term.
The value determined in equation 2 can be plugged into equation 1 as (!!!! to price the interest rate on the loan. This analysis is purely technical and data driven. The only assumption is that the future will look like the period of time during which the loans in the panel data were extended and tracked.
Empirically validated predictors, and ethical considerations regarding the use of certain predictors, are discussed in detail in Part V. Because some predictors of default are beyond students’ control, or relate to hallmarks of disadvantage, using them to price student loans would undermine the federal student lending programs’ policy goals of providing equal opportunity and upward mobility.
C. Risk-Based Pricing Is Not Necessarily the Same as Market-Based Pricing
Risk-based pricing as used in this Article has a precise definition that mathematically connects pricing to risk; it is not simply the price that a private lender would charge in an unregulated market. The goal of private lenders is to maximize profit, and this entails charging the highest price possible without losing too much volume or taking on too much risk. To the extent that consumer credit markets are less than perfectly efficient and price competitive, and demand for credit is inelastic, private lenders should have opportunities to charge prices that are higher than those required to compensate them for risk. This is what Alan M. White refers to as “opportunity pricing.”167
167. Alan M. White, Risk-Based Mortgage Pricing: Present and Future
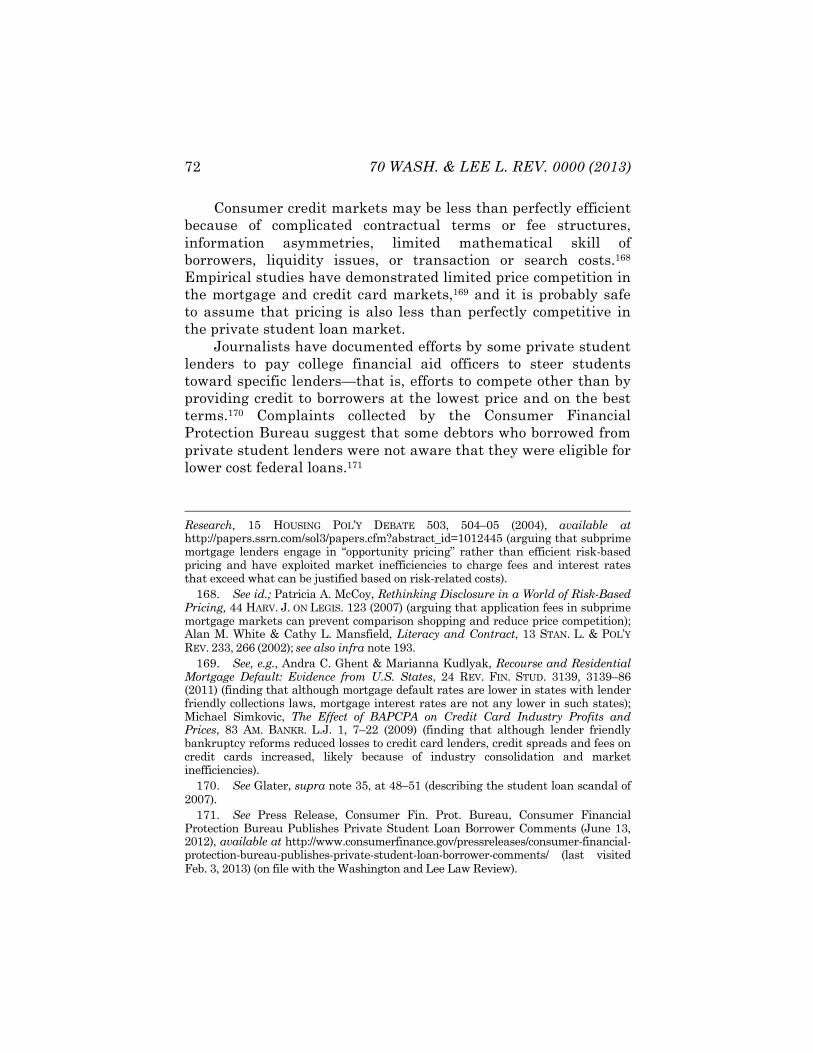
72 70 WASH. & LEE L. REV. 0000 (2013)
Consumer credit markets may be less than perfectly efficient because of complicated contractual terms or fee structures, information asymmetries, limited mathematical skill of borrowers, liquidity issues, or transaction or search costs.168 Empirical studies have demonstrated limited price competition in the mortgage and credit card markets,169 and it is probably safe to assume that pricing is also less than perfectly competitive in the private student loan market.
Journalists have documented efforts by some private student lenders to pay college financial aid officers to steer students toward specific lenders—that is, efforts to compete other than by providing credit to borrowers at the lowest price and on the best terms.170 Complaints collected by the Consumer Financial Protection Bureau suggest that some debtors who borrowed from private student lenders were not aware that they were eligible for lower cost federal loans.171
Research, 15 HOUSING POL’Y DEBATE 503, 504–05 (2004), available at http://papers.ssrn.com/sol3/papers.cfm?abstract_id=1012445 (arguing that subprime mortgage lenders engage in “opportunity pricing” rather than efficient risk-based pricing and have exploited market inefficiencies to charge fees and interest rates that exceed what can be justified based on risk-related costs). 168. See id.; Patricia A. McCoy, Rethinking Disclosure in a World of Risk-Based Pricing, 44 HARV. J. ON LEGIS. 123 (2007) (arguing that application fees in subprime mortgage markets can prevent comparison shopping and reduce price competition); Alan M. White & Cathy L. Mansfield, Literacy and Contract, 13 STAN. L. & POL’Y REV. 233, 266 (2002); see also infra note 193. 169. See, e.g., Andra C. Ghent & Marianna Kudlyak, Recourse and Residential Mortgage Default: Evidence from U.S. States, 24 REV. FIN. STUD. 3139, 3139–86 (2011) (finding that although mortgage default rates are lower in states with lender friendly collections laws, mortgage interest rates are not any lower in such states); Michael Simkovic, The Effect of BAPCPA on Credit Card Industry Profits and Prices, 83 AM. BANKR. L.J. 1, 7–22 (2009) (finding that although lender friendly bankruptcy reforms reduced losses to credit card lenders, credit spreads and fees on credit cards increased, likely because of industry consolidation and market inefficiencies). 170. See Glater, supra note 35, at 48–51 (describing the student loan scandal of 2007). 171. See Press Release, Consumer Fin. Prot. Bureau, Consumer Financial Protection Bureau Publishes Private Student Loan Borrower Comments (June 13, 2012), available at http://www.consumerfinance.gov/pressreleases/consumer-financial-protection-bureau-publishes-private-student-loan-borrower-comments/ (last visited Feb. 3, 2013) (on file with the Washington and Lee Law Review).
RISK-BASED STUDENT LOANS 73
Because opacity and limited price competition create a favorable business environment for lenders, private lenders may not volunteer transparent, simple information that would make credit markets more efficient and price competitive. And without such clear, simple disclosures, risk-based pricing may not influence students’ behavior.
Even in relatively efficient credit markets such as corporate bond markets, credit spreads will typically exceed default risk because credit spreads also incorporate factors such as liquidity risk, systemic risk, and investor risk aversion.172 However, the U.S. government is generally not subject to such risks—the U.S. government’s borrowing costs actually go down during financial crises as investors flood into Treasuries,173 and the Federal Reserve can provide liquidity in the event that investors are unwilling to do so. The U.S. government can therefore safely lend at lower interest rates than private lenders, and by lending directly to students, avoid leaky subsidies to private lenders such as guarantees and liquidity injections in times of crisis.174
D. Government’s Incentives Are Uniquely Well Aligned with Students’
The discussion in Parts IV.A–B above considers only the role of government as student lender, and ignores the role of government as tax collector and provider of social insurance. Taking into account the broader role of government suggests that the government should be more risk-tolerant. Under some scenarios, the government might even benefit by running a risk-based student loan program at a loss—that is, as a subsidy program.
172. See Simkovic & Kaminetzky, supra note 153, at 194–99 (discussing the components of credit spreads in the corporate bond market). 173. See id. at 198 (noting that banks’ funding costs increase relative to the federal governments’ in times of crisis). 174. See Simkovic, Competition and Crisis in Mortgage Securitization, supra note 70, at 61–64 (arguing for direct mortgage lending by the federal government to avoid moral hazard and subsidies to private lenders in times of crisis).
74 70 WASH. & LEE L. REV. 0000 (2013)
If the government were only a lender, its interests would diverge from those of student borrowers, who resemble equity holders. However, as a tax collector, the government is in effect an equity investor in the student borrowers’ future income, and the government’s interests are therefore more closely aligned with those of student borrowers.
Pure lenders wish to minimize defaults and loan losses; they are sensitive to downside risk, but indifferent to upside potential, because any upside will go to the borrower, not the lender.175 Student loan losses depend not only on average occupational income levels, but also on income distributions.176 Lenders prefer narrower income distributions, because lenders face asymmetric payoffs—the best lenders can hope for is full repayment of each loan.177 If an income distribution widens, a larger fraction of borrowers will have low incomes and will default on their loans, but the borrowers with higher incomes will not pay the lender any more than they are contractually required to pay.178
In other words, there is a difference in interests between student lenders—who should prefer lower risk occupations—and student borrowers, who should be more willing to take greater educational and occupational risks in return for higher expected returns.
Unlike a private lender, the government can benefit from student borrowers’ upside potential because the government collects payroll and income taxes. The government—like student 175. See Simkovic & Kaminetzky, supra note 153, at 214–18 (discussing the differing interests of equity and debt investors).
A private lender, Lumni, is currently experimenting with “human capital contracts,” or equity-like student loans, for a select handful of borrowers who have funding needs that exceed their eligibility for federal student loans. David Bornstein, Op-Ed., Instead of Student Loans, Investing in Futures, N.Y. TIMES OPINIONATOR (May 30, 2011, 8:25 PM), http://opinionator.blogs.nytimes.com/2011/05/30/ instead-of-student-loans-invest ing-in-futures/ (last visited Feb. 3, 2013) (on file with the Washington and Lee Law Review). Lumni provides relatively small amounts of money at what appear to be rates substantially higher than federal student loans, perhaps because of adverse selection problems and high risks, or small scale and high startup costs, or because of opportunity pricing. Id. 176. Simkovic & Kaminetzky, supra note 153, at 214–18. 177. Id. 178. Id.
RISK-BASED STUDENT LOANS 75
borrowers and unlike private lenders—should therefore be more willing to trade off greater risk (in the form of a wider distribution of incomes) in return for greater rewards (in the form of higher average income).
The extent to which the government should embrace risk will depend on a variety of factors, including labor tax rates,179 loan-to-income ratios,180 the likelihood of emigration,181 and social insurance levels.182
Under some scenarios, the government can improve public finances and overall welfare by intentionally running a student loan program at no profit, or even at a loss when measuring direct revenue against direct costs. This is because a subsidy may cause more workers to pursue education that will increase their lifetime incomes and therefore their lifetime tax contributions. Higher tax revenues from the additional student borrowers who succeed may more than offset higher loan losses from the additional student borrowers who fail. A subsidy is most likely to be welfare-enhancing when individual students are risk-averse—for example, because they cannot easily diversify their investment in human capital—and the government is risk neutral because it is more diversified.
The government should ideally view itself not as a mere lender, but rather as a diversified investor in the global competitiveness of the United States labor force.183
179. All else being equal, the government should be more risk-tolerant if labor tax rates are higher or more steeply progressive because tax revenue will be higher as average income increases and the distribution of incomes increases (more income will be taxed at higher rates). 180. All else being equal, the government should be more risk-tolerant if the size of the loan is smaller relative to the average lifetime income because the government’s potential loan losses will be smaller relative to the government’s potential tax revenues. 181. All else being equal, the government should be more risk-tolerant if the probability of skilled emigration is lower because expected future tax revenue will be higher. 182. All else being equal, the government should probably be more risk tolerant if social insurance levels are lower because downside risk for the student borrower will have less of an impact on public finances. However, to the extent that education can raise incomes or reduce unemployment, higher social insurance levels may weigh in favor of a larger subsidy for education. 183. The U.S. government should promote the interests of the U.S. work
76 70 WASH. & LEE L. REV. 0000 (2013)
Operationalizing such a view would require a complex behavioral and financial model that is beyond the scope of this Article.
For our purposes, it should simply be noted that credit spreads calculated using the methods described in Part IV.B do not take into account positive externalities associated with higher education, and could therefore be interpreted as an upward bound on the interest rate that the government should charge student borrowers.
E. Forecasting Change Is Both Necessary and Perilous
A purely data-driven analysis of student loan performance and labor markets is appealing because it is objective and ameliorates concerns about political influence or corruption. Any labor market forecasts used to price student loans might face political pressure.184 Employers in many industries may wish to channel students toward their field to drive down labor costs and upgrade their workforces.185 Conversely, skilled workers might wish to channel students away from their own fields to reduce competition and keep wages high.186 Employers may claim labor
force because the U.S. government cannot tax the work forces of other countries. The U.S. government is also elected to represent the interests of U.S. citizens, most of whom depend on wages as their primary source of income. 184. See Richard B. Freeman, Labor Market Imbalances: Shortages, Surpluses or What? 159, 171–73 (Fed. Reserve Bank of Bos. Conference Series Working Paper, 2006), http://www.bos.frb.org/economic/conf/conf51/conf51d.pdf. 185. Several scholars and journalists have claimed that business interests made empirically unsupported claims of labor shortages of scientists and engineers in the 1980s to drive down wages in those fields, and have continued in recent years to make empirically dubious claims of shortages. See id. at 171–73; Richard B. Freeman, Is A Great Labor Shortage Coming? Replacement Demand in the Global Economy 1, 10–11 (Nat’l Bureau of Econ. Research, Working Paper No. 12541, 2006); Eric Weinstein, How and Why Government, Universities, and Industry Create Domestic Labor Shortages of Scientists and High-Tech Workers (Nat’l Bureau of Econ. Research Working Paper), available at http://www.nber.org/~peat/PapersFolder/Papers/SG/NSF.html (last visited Feb. 3, 2013) (on file with the Washington and Lee Law Review); Benderly, supra note 117, at 31; Lowell et al., supra note 117, at 1–2. 186. The “scamblog” literature, in which ostensibly disgruntled lawyers and doctors advise others not to follow in their career footsteps, may reflect efforts by the shrewdest and most highly paid skilled workers to reduce competition and increase wages in their own fields. Department of Labor and Census data
RISK-BASED STUDENT LOANS 77
“shortages” and workers may claim “surpluses,” but these claims are amorphous in a market system in which supply-and-demand imbalances can be corrected by changes in wages.187 Risk-based lending policies should be based on hard numbers such as real wages and unemployment rates in different occupations, not on empirically unverifiable claims by interested parties. As suggested by the data in Figure 6 below, long-term historic wages by major are often a reasonably good predictor of future wages by major.
on wages and unemployment rates, and Department of Education data on student loan default rates, overwhelmingly suggest that attorneys and medical doctors remain among the highest paid and most secure of all workers in the United States. Michael Simkovic & Frank McIntyre, The Million Dollar Law Degree (Jan. 21, 2013) (unpublished manuscript) (on file with the Washington and Lee Law Review); see also Default Rates, FED. STUDENT AID, http://studentaid. ed.gov/about/data-center/student/default (last visited Feb. 3, 2013) (on file with the Washington and Lee Law Review); Default Rates Rise for Federal Student Loans, U.S. DEP’T OF EDUC. (Sept. 12, 2011), http://www.ed.gov/news/press-releases/default-rates-rise-federal-student-loans (last visited Feb. 3, 2013) (on file with the Washington and Lee Law Review); First Official Three-Year Student Loan Default Rates, U.S. DEP’T OF EDUC. (Sept. 28, 2012), http://www.ed.gov/news/press-releases/first-official-three-year-student-loan-de fault-rates-published (last visited Feb. 3, 2013) (on file with the Washington and Lee Law Review); U.S. Dep’t of Labor, Occupational Outlook Handbook, BUREAU OF LABOR STATISTICS, http://www.bls.gov/ooh/home.htm (last visited Feb. 3, 2013) (on file with the Washington and Lee Law Review); Wages, U.S. DEPARTMENT OF LABOR http://www.dol.gov/dol/topic/wages/index.htm#. UHWUgRXA-AY (last visited Feb. 3, 2013) (on file with the Washington and Lee Law Review). 187. As discussed above, labor and education markets are not perfectly efficient competitive markets that flawlessly and quickly adjust to reach equilibrium. See supra note 188. However, there is evidence that students respond to changes in starting salaries and that labor markets can thereby adjust, however imperfectly. See, e.g., RICHARD B. FREEMAN, THE OVEREDUCATED AMERICAN 62–63, 98–108 (1976) (explaining that the surplus of doctorate students in the 1970s led to a market drop in job prospects, which led to a decline in the number of students seeking a Ph.D. in the 1980s).
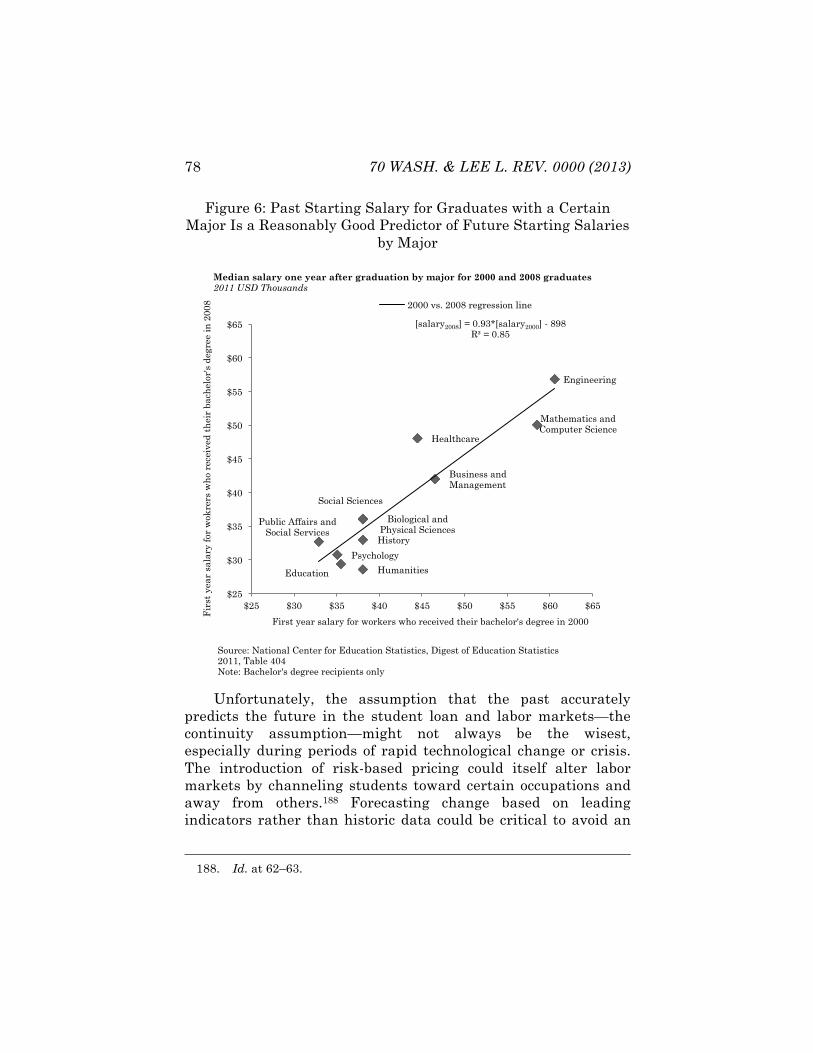
78 70 WASH. & LEE L. REV. 0000 (2013)
Figure 6: Past Starting Salary for Graduates with a Certain Major Is a Reasonably Good Predictor of Future Starting Salaries
by Major
Unfortunately, the assumption that the past accurately predicts the future in the student loan and labor markets—the continuity assumption—might not always be the wisest, especially during periods of rapid technological change or crisis. The introduction of risk-based pricing could itself alter labor markets by channeling students toward certain occupations and away from others.188 Forecasting change based on leading indicators rather than historic data could be critical to avoid an
188. Id. at 62–63.
Engineering
Mathematics and Computer Science
Healthcare
Business and Management
Biological and Physical Sciences
Social Sciences
History
Public Affairs and Social Services
Psychology
Education Humanities
[salary2008] = 0.93*[salary2000] - 898 R! = 0.85
$25
$30
$35
$40
$45
$50
$55
$60
$65
$25 $30 $35 $40 $45 $50 $55 $60 $65
Fir
st y
ear
sala
ry f
or w
okre
rs w
ho
rece
ived
th
eir
bach
elor
's d
egre
e in
200
8
First year salary for workers who received their bachelor's degree in 2000
2000 vs. 2008 regression line
Median salary one year after graduation by major for 2000 and 2008 graduates 2011 USD Thousands
Source: National Center for Education Statistics, Digest of Education Statistics 2011, Table 404 Note: Bachelor's degree recipients only
RISK-BASED STUDENT LOANS 79
overshoot.189 For example, there is some evidence that labor market policies to encourage more students to study science in the 1960s may have contributed to high unemployment rates and low wages for scientists such as physicists in the 1970s.190
The continuity assumption could be relaxed by incorporating additional information about the labor market to forecast changes, for example, by using a cobweb model including data about future labor supply (i.e., the total number of students in a city or state, across the United States or around the world studying toward each occupation and the number of years until they complete their training) and future demand (the number of job openings for each profession according to employer surveys or industry growth estimates combined with input-output tables). The Department of Education could be offered limited discretion—that is, it could be permitted to use a forecasting model to set an interest rate within a range of the rate suggested by the historic data.191 Or perhaps the Department of Education should establish the historic baseline and the discretionary forecast should be under the aegis of the U.S. Department of Labor’s Bureau of Labor Statistics.
Ideally, risk-based pricing could be used to help labor markets adjust more quickly and with less volatility than seen in traditional cobweb cycles. Reliable, detailed, and timely data is essential. Forecasting would benefit from greater integration of dispersed data sources and timelier reporting.
Existing data sources include government data—U.S. Bureau of Labor Statistics’ (BLS) Occupational Employment Statistics (OES), the BLS National Compensation Survey (NCS), the BLS Job Openings and Labor Turnover Survey (JOLTS), the Bureau of the Census Current Population Survey (CPS), Internal Revenue Service (IRS) data, Social Security Administration (SSA) data, and a variety of surveys compiled by the National Center
189. Id. 190. Id. at 62–73, 98–108. 191. For a discussion of limitations of existing employment forecasting models, see Richard B. Freeman, supra note 185, at 13 (arguing that global rather than national or local labor markets, market and technological changes, factor substitution, and other issues dramatically limit the accuracy of employment forecast models).
80 70 WASH. & LEE L. REV. 0000 (2013)
for Education Statistics (NCES); foundation data such as the College and Beyond Database (C&B) and Panel Study of Income Dynamics (PSID); and proprietary data from payroll processors or the National Association of Colleges and Employers (NACE).192
F. Private Lenders Could Be Enlisted to Correct Forecast Errors
The government could provide an additional safety-valve to correct for erroneous forecasts by providing private employers or other investors an opportunity to fund student loans at lower interest rates than the government if the investors believe that government forecasts are too conservative for particular fields of study.193 Such an approach would be less susceptible to
192. See e.g., College and Beyond Database: Andrew W. Mellon Foundation, 1994, DUKE UNIV. SANFORD SCHOOL OF PUB. POL’Y: PHILANTHROPY CENTRAL, http://cspcs.sanford.duke.edu/sites/default/files/descriptive/college_and_beyond_database.pdf; Current Population Survey (CPS), U.S. CENSUS BUREAU, http://www.census.gov/cps/ (last visited Feb. 3, 2013) (on file with the Washington and Lee Law Review); Job Openings and Labor Turnover Survey, U.S. BUREAU OF LABOR STATISTICS, http://www.bls.gov/jlt/ (last visited Feb. 3, 2013) (on file with the Washington and Lee Law Review); NACE – Salary Survey, NAT’L ASSOC. OF COLLEGES AND EMP’RS, http://www.naceweb.org/salary-survey-data/?referal=research&menuID=71&nodetype=4 (last visited Feb. 3, 2013) (on file with the Washington and Lee Law Review); National Compensation Survey , U.S BUREAU OF LABOR STATISTICS, http://www.bls.gov/eci/ (last visited Feb. 3, 2013) (on file with the Washington and Lee Law Review); Occupational Employment Statistics, U.S. BUREAU OF LABOR STATISTICS, http://www.bls.gov/oes/ (last visited Feb. 3, 2013) (on file with the Washington and Lee Law Review); Panel Study of Income Dynamics, INST. FOR SOC. RES., http://psidonline.isr.umich.edu/ (last visited Feb. 3, 2013) (on file with the Washington and Lee Law Review); Publications and Products—Annual Reports Program, NAT’L CTR. FOR EDUC. STATISTICS, http://nces.ed.gov/pubsearch/ getpubcats.asp?sid=091 (last visited Feb. 3, 2013) (on file with the Washington and Lee Law Review); Social Security Data, U.S. SOC. SEC. ADMIN., http://www.ssa.gov/open/data/ (last visited Feb. 3, 2013) (on file with the Washington and Lee Law Review); Tax Statistics, INTERNAL REVENUE SERV., http://www.irs.gov/uac/Tax-Stats-2 (last visited Feb. 3, 2013) (on file with the Washington and Lee Law Review). 193. For price competition to be most effective, it would probably be necessary to create a standard student loan contract that could vary only with respect to one or a few numeric price terms (i.e., the interest rate) and feature clear and easy-to-understand disclosures. Complex pricing schemes and varied contractual terms can reduce price competition in consumer credit markets by exploiting bounded rationality or cognitive biases, confusing borrowers, and
RISK-BASED STUDENT LOANS 81
manipulation than forecasts based on surveys of employers, because private lenders would face loan losses if they used overly optimistic forecasts.194
Indeed, two small lenders are already engaged in “cherry picking,” funding loans to low risk students at elite MBA programs at slightly below the federal governments’ rates.195
G. Limited Dischargeability of Student Loans in Bankruptcy Reduces Lender Incentives to Monitor Students and Risk-
Adjust Student Loan Pricing
Any investment, including education, involves some risk of failure and loss. Although investment risks are typically shared in part by lenders and in part by borrowers,196 risk sharing is limiting their ability to comparison-shop. Oren Bar-Gill & Elizabeth Warren, Making Credit Safer, 157 U. PA. L. REV. 1, 7–9 (2008); Oren Bar-Gill, Seduction by Plastic, 98 NW. U. L. REV. 1373, 1415–20 (2004); Susan Block-Lieb & Edward J. Janger, The Myth of the Rational Borrower: Rationality, Behavioralism, and the Misguided “Reform” of Bankruptcy Law, 48 TEX. L. REV. 1481, 1528–48 (2006); Simkovic, The Effect of BAPCPA on Credit Card Industry Profits and Prices, supra note 169, at 21; Cass R. Sunstein, Boundedly Rational Borrowing: A Consumer’s Guide 3–6 (Univ. of Chi., Olin Law & Econ. Program, Research Paper Series, Working Paper No. 253, 2006), available at http://papers. ssrn.com/sol3/papers.cfm?abstract_id=772186. 194. The incentive to make accurate forecasts could be enhanced by making student loans more readily dischargeable. 195. One lender, Social Finance (or SoFi), initially funded Stanford Business School students and is now expanding to other elite schools. The other, CommonBond, is starting at the University of Pennsylvania Wharton School of Business. Both offer in-school loans at 6.24%, slightly below the 6.8% and 7.9% rates charged by the federal student loan program. See Ann Carrns, SoFi Tapping Alumni to Help with Student Loans, N.Y. TIMES BUCKS BLOG (Apr. 3, 2012, 12:12 PM), http://bucks.blogs.nytimes.com/2012/04/03/sofi-tapping-alumni-to-help-with-student-loans/ (last visited Feb. 3, 2013) (on file with the Washington and Lee Law Review); COMMONBOND, http://www. commonbond.com/ (last visited Feb. 3, 2013) (on file with the Washington and Lee Law Review); Roberto Vargas, SoFi Loans Popular with GSB, STAN. DAILY (Apr. 11, 2012), http://www.stanforddaily.com/2012/04/11/sofi-loans-popular-with-gsb/ (last visited Feb. 3, 2013) (on file with the Washington and Lee Law Review); Erin Zlomek, To Fund Your MBA, Borrow From Alums, BLOOMBERG BUSINESSWEEK (July 5, 2012), http://www.businessweek.com/articles/2012-07-05/to-fund-your-mba-borrow-from-alums (last visited Feb. 3, 2013) (on file with the Washington and Lee Law Review). 196. See ROBERT CLARK, CORPORATE LAW 6–10 (1986) (discussing rationales
82 70 WASH. & LEE L. REV. 0000 (2013)
limited in U.S. education finance. Instead, risks are imposed primarily on student borrowers.197 Risks are shifted from lenders to student borrowers by restricting student-loan debtors’ access to a bankruptcy discharge and curbing exemptions from collections for income sources such as social security retirement and disability benefits.198
This risk-shifting toward student borrowers implicitly reflects an assumption that individual student borrowers are in a better position to assess and bear the risks of education than is the government or a private lender.199 However, as discussed above in Parts III and IV, there are strong theoretical and practical reasons to believe that the government as creditor may often be in a better position to evaluate the risk of education and spread that risk, and risk should therefore be shared more equally.200
for limited liability); THOMAS H. JACKSON, THE LOGIC AND LIMITS OF BANKRUPTCY LAW 229–30 (1986) (analogizing the bankruptcy discharge for individuals to limited liability for corporate investors); Paul Halpern, Michael Trebilcock & Stuart Turnbull, An Economic Analysis of Limited Liability in Corporation Law, 30 U. TORONTO L.J. 117, 127 (1980) (explaining risk sharing in the corporate context); Richard Posner, The Rights of Creditors of Affiliated Corporations, 43 U. CHI. L. REV. 499, 507–09 (1976) (arguing that limited liability for corporations is desirable because it enables shareholders to share risks of losses with creditors). 197. Understanding Default, supra note 152; see also infra notes 210–24 and accompanying text (discussing limits on dischargeability in bankruptcy); cf. Section V.H. (discussing a recent shift toward greater debt forgiveness for federal student loan borrowers through income based repayment plans). 198. Facing Loan Default, supra note 197. 199. See JACKSON, supra note 196, at 229 (“Recent scholarly treatments of discharge law have focused on whether the debtor or the creditor is the superior risk bearer and whether discharge should be presumptively available.”); Theodore Eisenberg, Bankruptcy Law in Perspective, 28 UCLA L. REV. 953, 982 (arguing that debtors are more able to control their financial activities and judge their financial circumstances than lenders, thus debtors are presumably more able to bear risks); id. at 981 (“A discharge system provides a technique for allocating the risk between a debtor and his creditors.”); id. at 982 (arguing that a debtor is presumably better able to bear risks than creditors because a debtor is “in greater control of [his] financial activities than any particular lender” and therefore a better judge of his own circumstances). 200. See, e.g., Barr-Gill & Warren, supra note 193, at 69–74 (discussing the need for safety regulation in various consumer credit markets because of limitations on information and rationality); Katherine Porter, College Lessons: The Financial Risks of Dropping Out, in BROKE: HOW DEBT BANKRUPTS THE
RISK-BASED STUDENT LOANS 83
Thomas Jackson explains the policy goals behind the bankruptcy discharge as one of nuanced paternalistic regulation of credit.201 The goal is to protect debtors by enlisting sophisticated creditors:
In each case [of risky activities] society decides—or should decide—at what point the expected costs of a given activity outweigh the prospective benefits to the individual and society. Borrowing, however, cannot be regulated by means of the rough and general rules . . . . Discharge policy provides an alternative . . . . Discharge . . . heightens creditors’ incentives to monitor: by providing for a right of discharge, society enlists creditors in the effort to oversee the individual’s credit decisions . . . . The availability of the right of discharge induces creditors to restrict the individual’s credit intake and thus to assist in ensuring that he does not seriously underestimate his future needs. 202
In theory, restricting access to discharge for student borrowers should reduce (though not eliminate) lenders’ risk of loss203 and thereby reduce lenders incentives to monitor borrowers and to ration and price credit according to risk.204
MIDDLE CLASS 97 (Katherine Porter ed., 2012) (discussing advantages of risk sharing through a more generous discharge and higher interest rates for student loans); Kenneth Ayotte, Bankruptcy and Entrepreneurship: The Value of a Fresh Start, 23 J.L. ECON. & ORG. 161, 164 (2007) (arguing that it is efficient to grant entrepreneurs more generous debt relief in bankruptcy to maintain ex-post incentives that reward effort by the entrepreneur); John A. E. Pottow, Private Liability for Reckless Consumer Lending, 2007 U. ILL. L. REV. 405, 431–32 (arguing that credit card lenders who lend to those who are unlikely to be able to repay should face legal liability because of their “competitive advantage in determining the repayment capacity of individuals”); John A. E. Pottow, Ability to Pay (U. Mich. Pub. L., Working Paper No. 237, 2011) available at http://ssrn.com/ abstract=1844570 (arguing in favor of the requirement under the Dodd-Frank Act of 2010 that mortgage lenders only lend to borrowers who they believe have the ability to repay the loans). 201. JACKSON, supra note 196, at 248–52. 202. Id. at 248–49. 203. See Ronald J. Mann, Bankruptcy Reform and the “Sweat Box” of Credit Card Debt, 2007 U. ILL. L. REV. 375, 379–81 (arguing that delaying bankruptcy discharge benefits creditors by extending the time period during which they can collect); Simkovic, supra note 169, at 1 (finding that bankruptcy reforms that restricted consumer borrowers’ access to a Chapter 7 discharge reduced credit card lenders’ losses). 204. See also Stephen J. Lubben, Derivatives and Bankruptcy: The Flawed
84 70 WASH. & LEE L. REV. 0000 (2013)
These predictions hold true with respect to the student loan market. Government and private lenders could protect themselves from losses due to default by engaging in good underwriting205—that is, by assessing the riskiness of different student borrowers and different courses of education, adjusting the pricing and availability of credit accordingly, and subsequently accepting and spreading losses. However, rather than undertake the socially useful task of evaluating students’ career and income prospects based on their academic performance and chosen field of study—and sharing this information with students through disclosures of differential loan pricing—lenders price loans uniformly and transfer as much of the risk as possible to student borrowers.206
There are few credit-market signals to warn students of danger when they decide where to enroll and what to study. The government does not restrict loans to students who wish to attend relatively high-risk educational institutions.207 Nor does the government differentially price student loans according to borrower-specific or program-specific risks.208 However, student borrowers are sorely in need of good information. The
Case for Special Treatment, 12 U. PA. J. BUS. L. 61, 62–64 (2009) (arguing that special protections in bankruptcy for derivatives reduce banks’ incentives to monitor derivatives counterparties and contribute to financial instability); Stephen J. Lubben, Repeal the Safe Harbors, 18 AM. BANKR. INST. L. REV. 319, 331–32 (2010) (same); Mark J. Roe, The Derivatives Market’s Payment Priorities as Financial Crisis Accelerator, 63 STAN. L. REV. 539, 550–51 (2011) (same); Jackson, supra note 196, at 248–49 (same); Simkovic, Secret Liens and the Financial Crisis of 2008, supra note 70, at 262 (same). 205. See Simkovic, Competition and Crisis in Mortgage Securitization, supra note 70 (explaining the underwriting process for mortgages). 206. Although many private student lenders purport to engage in “risk-based” pricing, they often do so based on credit scores, which may reflect the credit history of the student’s parents rather than the future earning potential and creditworthiness of the student. See Credit Scores, FINAID.ORG, http://www.finaid.org/loans/creditscores.phtml (last visited Feb. 3, 2013) (on file with the Washington and Lee Law Review); see also supra Part IV.C (discussing “opportunity pricing”). There are, however signs that at least some private lenders are beginning to price differences in earnings risks across programs. See supra notes 160, 173. 207. See supra Part II.B. 208. See supra Part II.D.
RISK-BASED STUDENT LOANS 85
consequences to student borrowers of making the wrong choice can be severe and lifelong.209
Whereas the U.S. Bankruptcy Code generally gives individual borrowers an “insurance policy” against failure in the form of a bankruptcy discharge,210 student loans are somewhat more difficult to discharge than most kinds of debt.211 Student loans have become more difficult to discharge through a series of amendments enacted over the last forty years, ostensibly to protect taxpayers by shifting risks onto students.
Federally-backed student loans have been available for many decades, first under the NDEA in the late 1950s and early 1960s, and subsequently under the HEA starting in 1965.212 Until 1976,
209. See Atkinson, supra note 9, at 5 n.13 (explaining that student loan debt can have negative consequences); Porter, supra note 200, at 85–100 (arguing that educational debt is risky because, although completing a four-year college degree reduces the risk of bankruptcy by increasing income, attending college without completing a four-year degree exacerbates financial distress by increasing debt without significantly increasing income); id. at 96–97
The burdens of student loan debt have consequences for people’s financial futures [including] a lower rate of saving . . . retarding opportunity for other family members . . . defer[ing] entry into the job market, losing seniority and reducing the number of working years they have to save for retirement.
See also Warren, Baum & Sitaraman, supra note 65, at 130 (discussing the impact of educational debt on life decisions). 210. See Barry Adler et al., Regulating Consumer Bankruptcy: A Theoretical Inquiry, 29 J. LEGAL STUD. 585, 591 (2000) (analogizing bankruptcy discharge to a form of social insurance, both in terms of its ability to mitigate poverty and in terms of ex-ante moral hazard concerns); JACKSON, supra note 196, at 230–32 (same). 211. In spite of formal language in the Bankruptcy Code limiting discharge, some student borrowers have received relief from their loans in bankruptcy. See Rafael I. Pardo & Michelle R. Lacey, The Real Student-Loan Scandal: Undue Hardship Discharge Litigation, 83 AM. BANKR. L.J. 179, 188 (2009) [hereinafter Pardo & Lacey, Real Student-Loan Scandal].
According to one scholar, relief is often offered to those who seek it, but too few bankruptcy lawyers attempt to discharge student loans in bankruptcy. See Jason Iuliano, An Empirical Assessment of Student Loan Discharges and the Bankruptcy Undue Hardship Standard, 86 AM. BANKR. L.J. 495 (2012). 212. See Rafael I. Pardo & Michelle R. Lacey, Undue Hardship in the Bankruptcy Courts: An Empirical Assessment of the Discharge of Educational Debt, 74 U. CIN. L. REV. 405, 420–21 (2005) [hereinafter Pardo & Lacey, Undue Hardship] (exploring the dischargeability status of federally insured and guaranteed student loans during the 1960s and 1970s) (citing 11 U.S.C. § 35(a)
86 70 WASH. & LEE L. REV. 0000 (2013)
these loans were dischargeable in bankruptcy, the same as credit card debt or any other unsecured loan.213
In the early 1970s, salacious stories began to circulate in Congress about young graduates discharging their debts en masse in bankruptcy shortly after completing their educations.214 According to the rumors, young professionals with few hard assets to lose and a lifetime of high future incomes around the corner were opportunistically trying to discharge their student loan obligations.215
The rumors of strategic default were largely unfounded. According to research by Professor Rafael Pardo, strategic default by high-income student debtors was extremely rare.216 Professor Pardo supports this assertion with both a contemporary study by the U.S. General Accounting Office (GAO)217 and comments by members of the House of Representatives.218 Similarly, empirical studies of student debtors in Canada have found that bankruptcy
(1976) (repealed 1978)). 213. See id. 214. See REPORT OF THE COMMISSION ON THE BANKRUPTCY LAWS OF THE UNITED STATES, H.R. DOC. NO. 137, at 140 (1973); Pardo & Lacey, Real Student Loan-Scandal, supra note 211, at 419–24. 215. See JACKSON, supra note 196, at 250–51
As a general rule, college and graduate students have few current assets but large future income streams. Using bankruptcy is relatively painless to them, as they have few assets to lose, and obtaining a discharge offers a substantial benefit, as it frees up the future income stream from the substantial obligation of repaying a student loan.
216. Pardo & Lacey, Undue Hardship, supra note 212, at 420 Despite evidence presented to the Commission [on the Bankruptcy Laws of the United States] that less than one percent of federally insured loans were discharged in bankruptcy, its recommendation essentially sought to preempt “potential abuses,” defaults that industry representatives of the student loan system anticipated would occur. The Commission thus reacted viscerally to anecdotal evidence.
217. Id. The General Accounting Office (GAO) was renamed the Government Accountability Office (GAO) in 2004. Id. at 423 (citing H.R. REP. NO. 95-595 (1997) reprinted in 1978 U.S.C.C.A.N. 5963, 6094, 6100–08). 218. Id. at 422–23 (quoting Representative James O’Hara’s critique of nondischargeability of student loans as treating student debtors like criminals or frauds).
RISK-BASED STUDENT LOANS 87
abuse by high-income professionals is rare, and a recent study has found extremely low student loan default rates among former U.S. law students.219
Nevertheless, tales of student opportunism may have persuaded Congress to tighten the rules for student loans. In 1976, a time delay was imposed so that debtors could not discharge student loans that were incurred within five years before the bankruptcy filing, unless denial would constitute an “undue hardship” for the debtor or his or her family.220 Over the next several decades, Congress further restricted dischargability of student loans221 and some bankruptcy courts interpreted this as a cue to raise the bar in their interpretation of “undue hardship.”222 In 1990, the time-bar was extended from five years to seven, and in 1998 it became indefinite (i.e., a debtor would be required to demonstrate “undue hardship,” no matter how long ago the student loan debts were incurred).223 In 2005, restrictions on dischargability were extended to fully private loans, not just guaranteed or direct loans.224
Although various judicial tests have been advanced to clarify the meaning of “undue hardship,” Professor Pardo’s research suggests that hardship remains in the eye of the beholder: in practice, discharge depends more on the particular bankruptcy judge than on the objectively measurable financial condition of the student debtor.225 219. Stephanie Ben-Ishai, Government Student Loans, Government Debts and Bankruptcy: A Comparative Study, 44 CAN. BUS. L.J. 211, 237–38 (2006-2007) (reviewing the Canadian literature); Simkovic & McIntyre, supra note 186 (showing very low student loan default rates among former law students who entered repayment from 1990 to 2010). 220. Pardo & Lacey, Undue Hardship, supra note 212, at 420–21 (citing Higher Education Amendments of 1976, Pub. L. No. 94-482, § 127(a), 90 Stat. 2081, 2141 (codified at 20 U.S.C. § 1087-3 (1976), repealed by Bankruptcy Reform Act of 1978, Pub. L. No. 95-598, § 316, 92 Stat. 2549, 2678 (effective Oct. 1, 1979))). 221. Id. at 427; John A.E. Pottow, The Nondischargeability of Student Loans in Personal Bankruptcy Proceedings: The Search for a Theory, 44 CAN. BUS. L.J. 245, 249–50 (2006); Braucher, supra note 71, at 473. 222. Pardo & Lacey, Undue Hardship, supra note 212, at 428. 223. Braucher, supra note 71, at 473–74. 224. Id. at 473–74. 225. Pardo & Lacey, Real Student-Loan Scandal, supra note 211, at 185;
88 70 WASH. & LEE L. REV. 0000 (2013)
Many scholars have questioned whether these special restrictions on discharge of student loans were needed to prevent abuse of the bankruptcy system by strategic defaulters. Most scholars conclude that special protections for student loans are unnecessary, empirically or theoretically unjustifiable, or that other factors weigh heavily in favor of a shift toward greater dischargeability.
For example, Thomas Jackson,226 Rafael Pardo,227 Katherine Porter,228 John Pottow,229 and Abbye Atkinson,230 have all pointed out that student loan abuse would be curtailed through other provisions of the Bankruptcy Code. In 1984, the Bankruptcy Code was amended so that a bankruptcy court could dismiss a case without granting a discharge if the petitioner’s debts were “primarily consumer debts” and if granting a discharge “would be a substantial abuse” of the bankruptcy system.231 These anti-abuse provisions were strengthened in 2005.232 Perhaps Congress was concerned that some student loans would not meet the threshold test as “consumer debts” because they were incurred with a “profit motive”—that is, the student borrower expected the degree to boost future income by more than direct educational costs and opportunity costs.233
Pardo & Lacey, Undue Hardship, supra note 212, at 411, 478–509; cf. Iuliano, supra note 211. 226. See JACKSON, supra note 196, at 251. 227. See Pardo & Lacey, Undue Hardship, supra note 212, at 430–31. 228. See Porter, supra note 200, at 98. 229. See Pottow, supra note 221, at 251–55. 230. See Atkinson, supra note 9, at 34–37. 231. 11 U.S.C. § 707(b) (2006); see also id. § 1325(a)(3) (requiring that a Chapter 13 plan be “proposed in good faith”). 232. The Bankruptcy Abuse and Consumer Protection Act of 2005 (BAPCPA) changed the standard for dismissal of a Chapter 7 petition from “substantial abuse” to “abuse” and eliminated a presumption in favor of granting the debtor relief. Id. § 707(b)(1); 6-707 COLLIER ON BANKRUPTCY 707.4 (16th ed. 2011). 233. See In re Dickerson, 193 B.R. 67, 70 (Bankr. M.D. Fla. 1996) (finding that student loans were not consumer debt); In re Gentri, 185 B.R. 368, 373 (Bankr. M.D. Fla. 1995) (finding that medical school loans were not consumer debts); In re Hill, No. 94-01881, 1994 WL 738663, at *1 (Bankr. D. Idaho Dec. 22, 1994) (finding that student loan debt was not consumer debt); In re Groves, 160 B.R. 121, 123 (Bankr. E.D. Mo. 1993) (finding that student loans were not
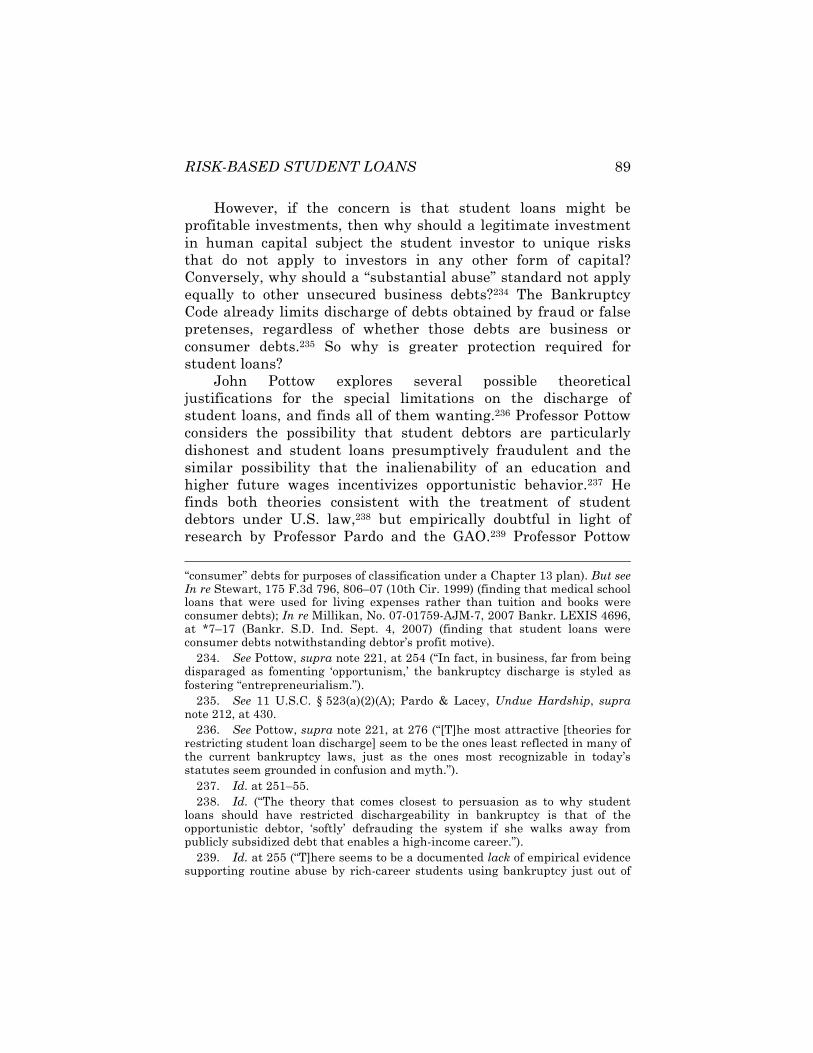
RISK-BASED STUDENT LOANS 89
However, if the concern is that student loans might be profitable investments, then why should a legitimate investment in human capital subject the student investor to unique risks that do not apply to investors in any other form of capital? Conversely, why should a “substantial abuse” standard not apply equally to other unsecured business debts?234 The Bankruptcy Code already limits discharge of debts obtained by fraud or false pretenses, regardless of whether those debts are business or consumer debts.235 So why is greater protection required for student loans?
John Pottow explores several possible theoretical justifications for the special limitations on the discharge of student loans, and finds all of them wanting.236 Professor Pottow considers the possibility that student debtors are particularly dishonest and student loans presumptively fraudulent and the similar possibility that the inalienability of an education and higher future wages incentivizes opportunistic behavior.237 He finds both theories consistent with the treatment of student debtors under U.S. law,238 but empirically doubtful in light of research by Professor Pardo and the GAO.239 Professor Pottow
“consumer” debts for purposes of classification under a Chapter 13 plan). But see In re Stewart, 175 F.3d 796, 806–07 (10th Cir. 1999) (finding that medical school loans that were used for living expenses rather than tuition and books were consumer debts); In re Millikan, No. 07-01759-AJM-7, 2007 Bankr. LEXIS 4696, at *7–17 (Bankr. S.D. Ind. Sept. 4, 2007) (finding that student loans were consumer debts notwithstanding debtor’s profit motive). 234. See Pottow, supra note 221, at 254 (“In fact, in business, far from being disparaged as fomenting ‘opportunism,’ the bankruptcy discharge is styled as fostering “entrepreneurialism.”). 235. See 11 U.S.C. § 523(a)(2)(A); Pardo & Lacey, Undue Hardship, supra note 212, at 430. 236. See Pottow, supra note 221, at 276 (“[T]he most attractive [theories for restricting student loan discharge] seem to be the ones least reflected in many of the current bankruptcy laws, just as the ones most recognizable in today’s statutes seem grounded in confusion and myth.”). 237. Id. at 251–55. 238. Id. (“The theory that comes closest to persuasion as to why student loans should have restricted dischargeability in bankruptcy is that of the opportunistic debtor, ‘softly’ defrauding the system if she walks away from publicly subsidized debt that enables a high-income career.”). 239. Id. at 255 (“T]here seems to be a documented lack of empirical evidence supporting routine abuse by rich-career students using bankruptcy just out of
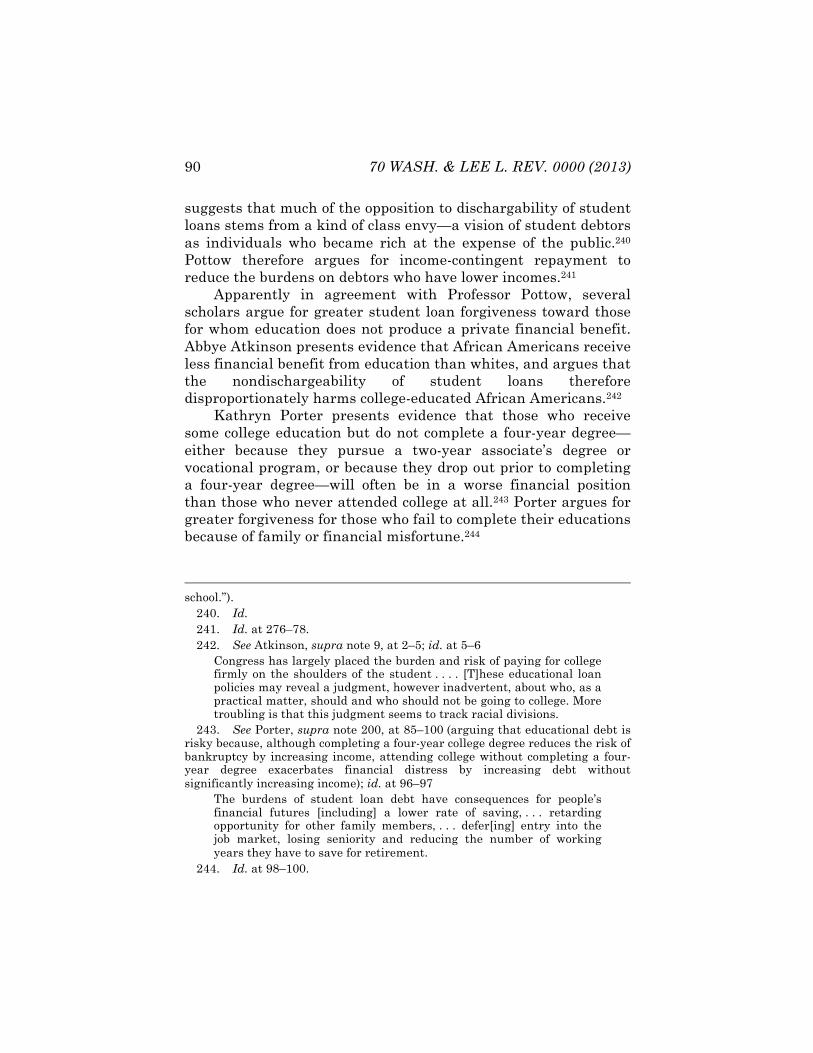
90 70 WASH. & LEE L. REV. 0000 (2013)
suggests that much of the opposition to dischargability of student loans stems from a kind of class envy—a vision of student debtors as individuals who became rich at the expense of the public.240 Pottow therefore argues for income-contingent repayment to reduce the burdens on debtors who have lower incomes.241
Apparently in agreement with Professor Pottow, several scholars argue for greater student loan forgiveness toward those for whom education does not produce a private financial benefit. Abbye Atkinson presents evidence that African Americans receive less financial benefit from education than whites, and argues that the nondischargeability of student loans therefore disproportionately harms college-educated African Americans.242
Kathryn Porter presents evidence that those who receive some college education but do not complete a four-year degree—either because they pursue a two-year associate’s degree or vocational program, or because they drop out prior to completing a four-year degree—will often be in a worse financial position than those who never attended college at all.243 Porter argues for greater forgiveness for those who fail to complete their educations because of family or financial misfortune.244
school.”). 240. Id. 241. Id. at 276–78. 242. See Atkinson, supra note 9, at 2–5; id. at 5–6
Congress has largely placed the burden and risk of paying for college firmly on the shoulders of the student . . . . [T]hese educational loan policies may reveal a judgment, however inadvertent, about who, as a practical matter, should and who should not be going to college. More troubling is that this judgment seems to track racial divisions.
243. See Porter, supra note 200, at 85–100 (arguing that educational debt is risky because, although completing a four-year college degree reduces the risk of bankruptcy by increasing income, attending college without completing a four-year degree exacerbates financial distress by increasing debt without significantly increasing income); id. at 96–97
The burdens of student loan debt have consequences for people’s financial futures [including] a lower rate of saving, . . . retarding opportunity for other family members, . . . defer[ing] entry into the job market, losing seniority and reducing the number of working years they have to save for retirement.
244. Id. at 98–100.
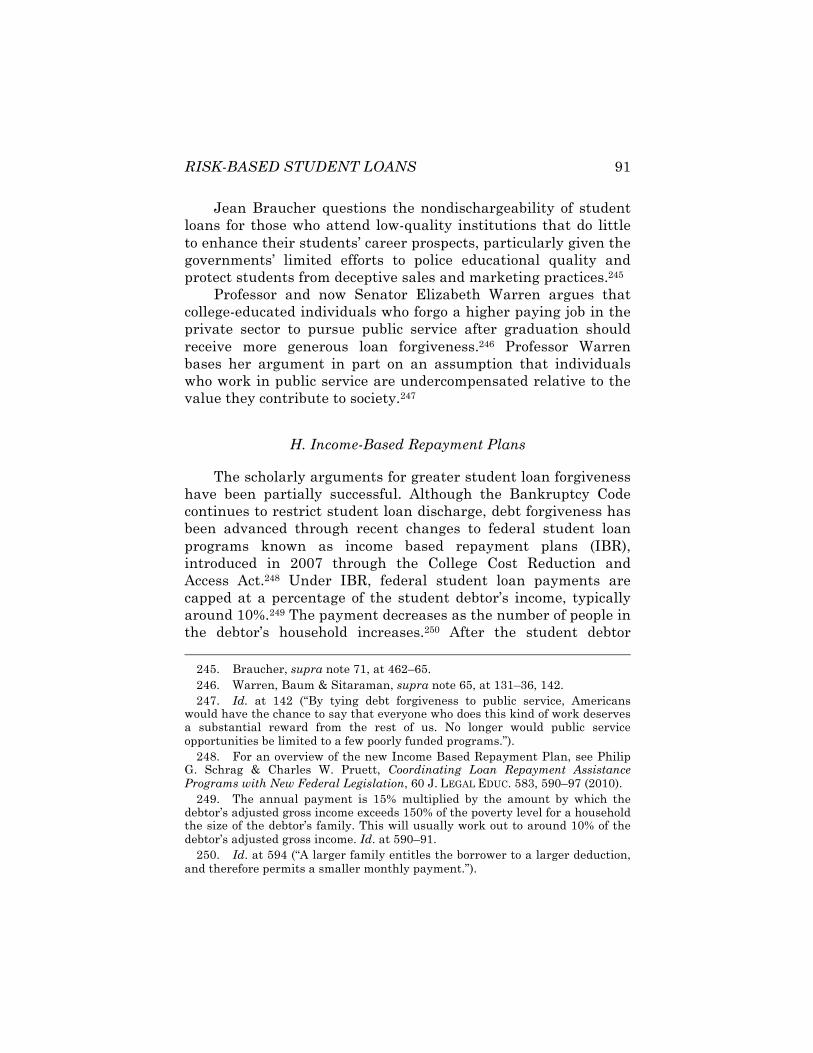
RISK-BASED STUDENT LOANS 91
Jean Braucher questions the nondischargeability of student loans for those who attend low-quality institutions that do little to enhance their students’ career prospects, particularly given the governments’ limited efforts to police educational quality and protect students from deceptive sales and marketing practices.245
Professor and now Senator Elizabeth Warren argues that college-educated individuals who forgo a higher paying job in the private sector to pursue public service after graduation should receive more generous loan forgiveness.246 Professor Warren bases her argument in part on an assumption that individuals who work in public service are undercompensated relative to the value they contribute to society.247
H. Income-Based Repayment Plans
The scholarly arguments for greater student loan forgiveness have been partially successful. Although the Bankruptcy Code continues to restrict student loan discharge, debt forgiveness has been advanced through recent changes to federal student loan programs known as income based repayment plans (IBR), introduced in 2007 through the College Cost Reduction and Access Act.248 Under IBR, federal student loan payments are capped at a percentage of the student debtor’s income, typically around 10%.249 The payment decreases as the number of people in the debtor’s household increases.250 After the student debtor
245. Braucher, supra note 71, at 462–65. 246. Warren, Baum & Sitaraman, supra note 65, at 131–36, 142. 247. Id. at 142 (“By tying debt forgiveness to public service, Americans would have the chance to say that everyone who does this kind of work deserves a substantial reward from the rest of us. No longer would public service opportunities be limited to a few poorly funded programs.”). 248. For an overview of the new Income Based Repayment Plan, see Philip G. Schrag & Charles W. Pruett, Coordinating Loan Repayment Assistance Programs with New Federal Legislation, 60 J. LEGAL EDUC. 583, 590–97 (2010). 249. The annual payment is 15% multiplied by the amount by which the debtor’s adjusted gross income exceeds 150% of the poverty level for a household the size of the debtor’s family. This will usually work out to around 10% of the debtor’s adjusted gross income. Id. at 590–91. 250. Id. at 594 (“A larger family entitles the borrower to a larger deduction, and therefore permits a smaller monthly payment.”).
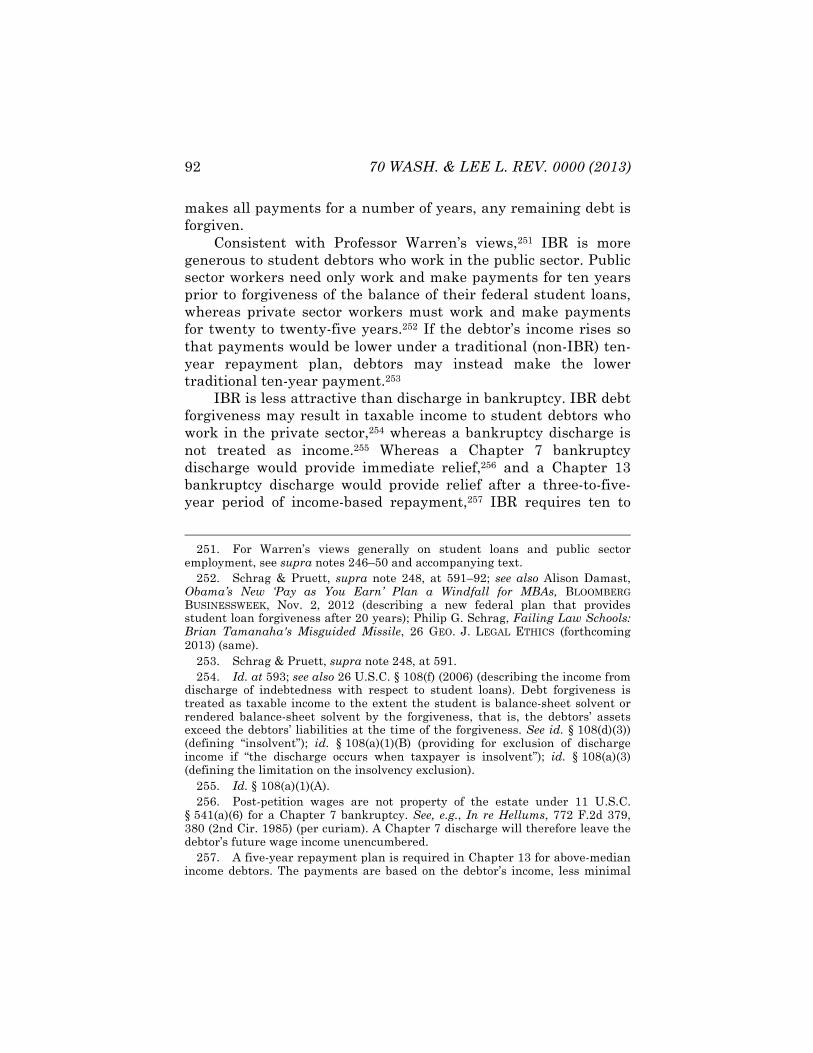
92 70 WASH. & LEE L. REV. 0000 (2013)
makes all payments for a number of years, any remaining debt is forgiven.
Consistent with Professor Warren’s views,251 IBR is more generous to student debtors who work in the public sector. Public sector workers need only work and make payments for ten years prior to forgiveness of the balance of their federal student loans, whereas private sector workers must work and make payments for twenty to twenty-five years.252 If the debtor’s income rises so that payments would be lower under a traditional (non-IBR) ten-year repayment plan, debtors may instead make the lower traditional ten-year payment.253
IBR is less attractive than discharge in bankruptcy. IBR debt forgiveness may result in taxable income to student debtors who work in the private sector,254 whereas a bankruptcy discharge is not treated as income.255 Whereas a Chapter 7 bankruptcy discharge would provide immediate relief,256 and a Chapter 13 bankruptcy discharge would provide relief after a three-to-five-year period of income-based repayment,257 IBR requires ten to
251. For Warren’s views generally on student loans and public sector employment, see supra notes 246–50 and accompanying text. 252. Schrag & Pruett, supra note 248, at 591–92; see also Alison Damast, Obama’s New ‘Pay as You Earn’ Plan a Windfall for MBAs, BLOOMBERG BUSINESSWEEK, Nov. 2, 2012 (describing a new federal plan that provides student loan forgiveness after 20 years); Philip G. Schrag, Failing Law Schools: Brian Tamanaha's Misguided Missile, 26 GEO. J. LEGAL ETHICS (forthcoming 2013) (same). 253. Schrag & Pruett, supra note 248, at 591. 254. Id. at 593; see also 26 U.S.C. § 108(f) (2006) (describing the income from discharge of indebtedness with respect to student loans). Debt forgiveness is treated as taxable income to the extent the student is balance-sheet solvent or rendered balance-sheet solvent by the forgiveness, that is, the debtors’ assets exceed the debtors’ liabilities at the time of the forgiveness. See id. § 108(d)(3)) (defining “insolvent”); id. § 108(a)(1)(B) (providing for exclusion of discharge income if “the discharge occurs when taxpayer is insolvent”); id. § 108(a)(3) (defining the limitation on the insolvency exclusion). 255. Id. § 108(a)(1)(A). 256. Post-petition wages are not property of the estate under 11 U.S.C. § 541(a)(6) for a Chapter 7 bankruptcy. See, e.g., In re Hellums, 772 F.2d 379, 380 (2nd Cir. 1985) (per curiam). A Chapter 7 discharge will therefore leave the debtor’s future wage income unencumbered. 257. A five-year repayment plan is required in Chapter 13 for above-median income debtors. The payments are based on the debtor’s income, less minimal
RISK-BASED STUDENT LOANS 93
twenty-five years of repayment. The lengthy repayment period under IBR may mitigate moral hazard.258 IBR is formulaic, and may therefore be less expensive to administer and more consistently applied than the “undue hardship” standard in bankruptcy.259
IBR reduces the downside risk of education, and may provide welcome relief to student debtors who are in a difficult financial position. However, IBR only provides relief ex-post. It does not generate information or establish incentives that lead to a more efficient allocation of educational resources ex-ante.
Risk-based pricing is compatible with IBR and could incorporate risk of loss due to borrowers entering IBR. To the extent that IBR is intended as a back-door wage subsidy for public service workers, losses from IBR for students entering public service could be excluded from risk-based pricing.
living expenses. 11 U.S.C. §§ 1322(d), 1325(b) (2012). 258. See D. Bruce Johnstone, Conventional Fixed-schedule versus Income Contingent Repayment Obligations: Is there a Best Loan Scheme? 34 HIGHER EDUC. EUR. 189, 190–91 (2009) (describing a proposed hybrid of income-contingent and traditional loans in which reduction in payments due to low incomes would be deferred over longer repayment periods, not necessarily fully forgiven at earlier stages); Pottow, supra note 221, at 267–68 (indicating that the use of longer time periods in loan forgiveness programs serves to “smoke out the false debtor”); Bruce Chapman, Income Contingent Loans for Higher Education: International Reform (Austl. Nat’l Univ. Ctr. for Econ. Pol’y Research, Discussion Paper No. 491, 2005), http://cbe.anu.edu.au/ research/papers/ceprdpapers/DP491.pdf; cf. SHILLER, supra note 148, at 140–46 (attributing the failure of Yale’s Tuition Postponement Option—a voluntary program in the 1970s that linked repayment obligations to wages and reflects general problems encountered by such programs—to moral hazard and adverse selection problems, exacerbated by a failure to distinguish between students with different majors); Marc Nerlove, Some Problems in the Use of Income-contingent Loans for the Finance of Higher Education, 83 J. POL. ECON. 157, 160–65, 180 (1975) (noting that previous IBR programs have suffered from moral hazard and adverse selection problems). 259. See Pottow, supra note 221, at 268 (describing the application of “the U.S. ‘undue hardship’ test” as “an unpredictable and expensive way” to “back-end income-contingency into the American system”).
94 70 WASH. & LEE L. REV. 0000 (2013)
VI. Ethical Considerations and the Limits of Risk-Based Pricing
A. Factors That Predict Student Loan Defaults
The most important predictor of default is probably the student borrower’s employment prospects and whether post-graduation income is adequate to service educational debts.260 Studies have also found that students are less likely to default if they are employed in a field that is related to their major.261 Some studies report that defaults are lower for STEM majors.262 Students who drop out are much more likely to default, and attrition can be predicted from poor academic performance both before college and during college. 263
260. See Thomas A. Flint, Predicting Student Loan Defaults, 68 J. HIGHER EDUC. 322, 344 (1997) (noting that in contrast to other factors, “the borrowers’ own disposable incomes do significantly influence default”); Jacob P. K. Gross et al., What Matters in Student Loan Default: A Review of the Research Literature, 39 J. STUDENT FIN. AID, no. 1, 2009, at 23 (“Most students who default do so because their personal income is inadequate to keep up with their payments.”); Laura G. Knapp & Terry G. Seaks, An Analysis of the Probability of Default on Federally Guaranteed Student Loans, 74 REV. ECON. & STAT. 404, 410 (1992) (noting that graduation correlates strongly with lower default, perhaps because it increases job and wage prospects); Kirk Montverde, Managing Student Loan Default Risk: Evidence from a Privately Guaranteed Portfolio, 41 RES. HIGHER EDUC. 331, 336, 350–52 (2000) (emphasizing the importance of the individual student’s ability to attain employment); J. Fredericks Volkwein et al., Factors Associated with Student Loan Default Among Different Racial and Ethnic Groups, 69 J. HIGHER EDUC. 206, 223, 228 (1998) (“[E]ven though student borrowers with advanced degrees emerge from college with higher levels of debt, their investment generally enables them to enter careers that . . . make loan repayment more likely.”). 261. Flint, supra note 260, at 346. 262. See id. at 330; Volkwein et al., supra note 260, at 222; see also J. Fredericks Volkwein & Bruce Szelest, Individual and Campus Characteristics Associated with Student Loan Default, 36 RES. HIGHER EDUC. 41, 41–72 (1995) (suggesting that while type of major is “not itself significantly influential in default,” a science or technology major may have “an indirect influence”). 263. See Flint, supra note 260, at 330 (higher grade point average and graduation both decrease the probability of nonpayment of loans); Knapp & Seaks, supra note 260, at 408 (noting that “[t]he single variable with the greatest statistical and economic significance is the occurrence of the student’s graduation”); Montverde, supra note 260, at 336 (noting that studies had found “degree completion” and “college GPA” as “significantly predictive of default risk”); Volkwein et al., supra note 260, at 222 (“[D]egree completion has a dramatic influence on lowering the rate of loan default.”).
RISK-BASED STUDENT LOANS 95
Other individual characteristics that have been shown to predict default include race,264 age,265 parental education
264. Student borrowers who are members of racial minority groups are more likely to default than white students, and African Americans are the most likely to default, and this relation holds true even after controlling for post-graduation income. Gross et. al, supra note 260, at 21–22; see also MATT STEINER & NATALI TESZLER, TEX. GUARANTEED & TEX. A&M UNIV., THE CHARACTERISTICS ASSOCIATED WITH STUDENT LOAN DEFAULT AT TEXAS A&M UNIVERSITY 48 (2003), http://www.tgslc.org/pdf/tamu_default_study.pdf (finding that white borrowers at Texas A&M in College Station “[had] default rates below the average,” while minorities had above-average rates, with “black borrowers hav[ing] the highest default rate”); J. Frederick Volkwein & Alberto Cabrera, Who Defaults on Student Loans? The Effects of Race, Class, and Gender on Borrower Behavior, in CONDEMNING STUDENTS TO DEBT: COLLEGE LOANS AND PUBLIC POLICY 105, 109 (Richard Fossey & Mark Bateman eds. 1998) [hereinafter Volkwein & Cabrera] (“African and Native American borrowers from all institution types have high default rates.”); Dana E. Christman, Multiple Realities: Characteristics of Loan Defaulters at a Two-year Public Institution, 27 COMMUNITY COLL. REV. 16, 23–25 (2000) (noting a study in which “default rates were found to be higher for minority students” and data to support the notion that “Non-Whites” are more likely to default); Laura L. Greene, An Economic Analysis of Student Loan Default, 11 EDUC. EVALUATION & POL’Y ANALYSIS 61, 61–68 (1989) (noting that African American status correlates with higher default and higher default amount); Elizabeth Herr & Larry Burt, Predicting Student Loan Default For The University Of Texas at Austin, 35 J. STUDENT FIN. AID, no. 2, 2005, at 37 (2005) (noting the results of the study “impl[y] that minority students, particularly Blacks and Hispanics, are at a greater risk of default); Knapp & Seaks, supra note 260, at 408 (noting that African Americans are more likely to default); Volkwein & Szelest, supra note 262, at 51–52 (showing data that indicates higher default rates for African Americans and Native Americans); Wellford W. Wilms, Richard W. Moore & Roger E. Bolus, Whose Fault Is Default? A Study of The Impact of Student Characteristics and Institutional Practices on Guaranteed Student Loan Default Rates in California. 9 EDUC. EVALUATION & POL’Y ANALYSIS 41, 46 (1987) (“Blacks have the highest propensity to default . . . .”). This may be due to higher dropout rates, higher divorce rates, lower wealth levels, and larger numbers of dependents. Volkwein, et al., supra note 260, at 224–25. A risk-based approach that focused on expected income as the sole proxy for ability to pay would probably under predict defaults by minority borrowers and help maintain educational access for students from diverse backgrounds. 265. Older students are more likely to default. See, e.g., JENNIE H. WOO, CLEARING ACCOUNTS: THE CAUSES OF STUDENT LOAN DEFAULT 6 (2002), http://cdm16254.contentdm.oclc.org/cdm/singleitem/collection/p178 601ccp2/id/29 08/rec/3 (“Older students default more often than younger ones.”); Christman, supra note 264, at 23 (noting that “being over 25 years old [was a] characteristic associated with high default rates’’); Flint, supra note 260, at 347 (noting that it is uncertain why “older borrowers constitute a greater risk for default”). But see STEINER & TESZLER, supra note 264, at 48 (finding that for
96 70 WASH. & LEE L. REV. 0000 (2013)
levels,266 family income levels,267 family structure,268 debt burdens, and (for law students) credit scores.269
Characteristics of educational institutions may not provide much additional predictive accuracy. Although two-year community colleges have higher default rates than traditional nonprofit four-year institutions—and wealthier institutions tend
students at Texas A&M in College Station that “[b]orrowers between the ages of 23 and 26 have the lowest default rate (3.2 percent), with both younger borrowers and older borrowers representing increased levels of default risk”); Herr & Burt, supra note 264, at 39 (noting that while students “over 40 have higher loan default rates than borrowers in their late twenties and thirties,” so do younger borrowers, i.e., “between the ages of 20–24”). 266. Students whose parents are less educated are more likely to default. See SANDRA BARONE, MATT STEINER & NATALI TESZLER, TEX. GUARANTEED STUDENT LOAN CORP., MULTIVARIATE ANALYSIS OF STUDENT LOAN DEFAULTERS AT TEXAS A&M UNIVERSITY-KINGSVILLE 23–24 (2005), available at http://www.tgslc.org/pdf/tamu_k_multivariate_analysis.pdf (indicating that parental education level, if sufficiently high, “may reflect a borrower’s previous exposure to responsibilities such as repaying a student loan”); STEINER & TESZLER, supra note 264, at 49, 51 (finding that for students of Texas A&M in College Station, parental education attainment generally relates inversely to rate of default); Volkwein, et al., supra note 260, at 215 (noting that one of the features “associated with low levels of loan default include . . . a college-educated parent”); Volkwein & Szelest, supra note 262, at 51–52 (showing tables indicating higher default rates for those whose parents have lower education levels); Herr & Burt, supra note 264, at 35 (showing higher rates of default for lower mother and father educational attainment levels). 267. Students whose parents have lower incomes are more likely to default. See STEINER & TESZLER, supra note 264, at 57 (finding that for students at Texas A&M in College Station, “[i]n general, default rates decrease as income increases”); WOO, supra note 265, at 5 (“[A]mple family resources, either higher incomes or assets, significantly lowered the probability of default.”); Knapp & Seaks, supra note 260, at 406 (indicating that parental income level is a significant factor and correlates negatively with default); Volkwein et al., supra note 260, at 221 (highlighting “parent income below $17,000” as one of three factors resulting in “significant increases in the probability of loan default”); Volkwein & Szelest, supra note 264, at 51–52 (showing higher rates of default for lower parental income levels); Wilms et al., supra note 264, at 42 (indicating that previous studies had shown that “[l]ow family income [is] also associated with high defaults”); Herr & Burt, supra note 264, at 37 (noting that, in line with the results of other studies, “students whose parents have higher incomes are less likely to default”). 268. Students who are divorced or separated or who have dependents are more likely to default. See Montverde, supra note 260, at 336; Volkwein & Szelest, supra note 262, at 57. 269. Montverde, supra note 260, at 340–44.
RISK-BASED STUDENT LOANS 97
to have lower default rates—studies suggest that higher default institutions’ loan performance may be due to these institutions disproportionately serving students whose individual characteristics make them more likely to default—for example, students who are from lower income or less wealthy families.270
B. Preserving Equal Opportunity, Social Mobility, and Individual Choice
Although risk-based pricing involves technical analysis of data, it also implicates important ethical considerations. As discussed above, risk-based pricing reduces the transfer of value from low-risk borrowers to high-risk borrowers by forcing all borrowers to internalize their own risks.
In some situations, differences in relative risk levels may be driven by choices and behaviors that can be changed, and that we might affirmatively wish to encourage borrowers to change. In such situations uniform pricing creates moral hazard—that is,
270. Gross et al., supra note 260, at 21; see also Flint, supra note 260, at 348 (noting that “[l]arge numbers of low-income and minority students enroll in proprietary schools,” which also tend to have higher rates of default); Knapp & Seaks, supra note 260, at 406–07, 410 (finding the variables of two-year versus four-year institution not statistically significant and concluding that “individual characteristics, and not institutional characteristics, [that] are key determinates of default”); Montverde, supra note 260, at 351–52 (indicating that personal characteristics like the “borrower-based credit effect” overcome institutional factors in determining default probability, and underlying factors that affect individual capacity to repay such as “location” or the “prevailing . . . labor market” are what “may actually lie behind the apparent school effect”); Volkwein & Cabrera, supra note 264, at 109–13 (finding, inter alia, that incidences of default at certain institutions are primarily attributed to certain minority groups and “organizational characteristics of institutions” do not have a significant effect on default); Volkwein et al., supra note 260, at 226, 231–33 (indicating that in controlling for student characteristics, institutional characteristics had no significant impact on probability of default and certain institutions tend to attract students with greater default risk that is beyond the control of the institution, dependent instead on personal characteristics); cf. GOV’T ACCOUNTABILITY OFF., POSTSECONDARY EDUCATION: STUDENT OUTCOMES VARY AT FOR-PROFIT, NONPROFIT, AND PUBLIC SCHOOLS 5–8 (2011) (finding worse outcomes at proprietary institutions after controlling for student characteristics).
98 70 WASH. & LEE L. REV. 0000 (2013)
uniform pricing encourages high-risk behavior.271 Risk-based pricing could improve efficiency by forcing borrowers to internalize risk and thereby cause them to make more responsible choices. The most obvious example would be choice of courses and major, which is almost entirely under the student’s control. Indeed, students from disadvantaged backgrounds already disproportionately choose fields of study linked to higher post-graduation wages.272 Risk-based pricing would benefit these students by reducing the total cost of their educations.
In other situations, relative risk levels may be driven by factors that are beyond the borrower’s control. In such cases, we might question the propriety of compounding misfortune by charging the unfortunate a higher interest rate than the fortunate. In such situations, risk-based pricing is unlikely to improve efficiency because borrowers cannot reduce their risk levels by making different decisions.
The most obvious examples of factors that are outside the realm of choice and may predict default risk include race273 and parents’ socio-economic status.274 Parental financial resources are
271. See Sam Ramsey Harking & M. Rashidian, Student Loan Default: Borrower Characteristics, Institutional Practices, and the Business Cycle, 20 J. EDUC. FIN. 449, 463 (1995). 272. See supra note 133 and accompanying text; see also WILLIAM G. BOWEN & DEREK BOK, THE SHAPE OF THE RIVER: LONG TERM CONSEQUENCES OF CONSIDERING RACE IN COLLEGE AND UNIVERSITY ADMISSIONS 70–72 (1998) (finding that black and white students at selective colleges were equally likely to major in engineering, natural science, and economics); id. at 99–103 (finding that black graduates of selective colleges were more likely than white graduates of selective colleges to attend law schools and medical schools, and also more likely to attend top programs in law, medicine, or business); cf. ARCIDIACONO ET AL., supra note 17, at 3 (“Although blacks and whites initially have similar interests regarding whether to major in the more strictly graded fields [of natural science, engineering, and economics], the patterns of switching result in 68% of blacks choosing humanities and social science majors compared to less than 55% of whites.”). 273. Black male college graduates earn less than white male college graduates, even after controlling for socioeconomic status, SAT scores, high school grades, college selectivity, college major, college class rank, graduate school, and sector of employment. BOWEN & BOK, supra note 272, at 144–48. 274. Students from higher socioeconomic status backgrounds earn more than those from low socioeconomic status backgrounds. BOWEN & BOK, supra note 272, at 136. The relation is partly due to higher socioeconomic students being more likely to attend graduate school. Id. However, higher SES students
RISK-BASED STUDENT LOANS 99
strong predictors of the likelihood of default, but students do not get to choose their parents.275 Even credit scores of students will sometimes reflect the credit histories of their parents rather than choices made by the individual student.
C. Risk-Based Pricing and Choice of Major
As discussed above, risk-based pricing reduces the transfer of value from low-risk borrowers to high-risk borrowers by forcing all borrowers to internalize their own risks. Choice of major or field of graduate study probably represents the clearest example of student loan risk driven by a borrower’s personal decision. The data suggests that there are certain majors that are much lower risk than others, as measured by post-graduation wages and debt to income ratios—specifically, engineering, certain science and technology majors, and business majors are relatively low-risk.276 By contrast, humanities and education majors are relatively high risk.277 Many of the differences in wages across majors and related occupations persist even after controlling for differences in student ability. Risk-based pricing of student loans would encourage more college students to choose majors that would better prepare them for post-graduation employment opportunities, could reduce unemployment rates, and reduce default rates on student loans.
Some may be concerned that risk-based pricing would channel too many students who are incapable of succeeding in STEM or business into these majors and produce a surplus of low-quality scientists or engineers. The data does not support this view. Although there are differences in average standardized test scores across majors, there is substantial overlap in the distribution of abilities across majors, and many students in
earn more even after controlling for race, gender, SAT scores, high school grades, college selectivity, college major, college class rank, graduate school, and sector of employment. Id. at 136–38. 275. See supra note 239 and accompanying text. 276. See supra note 108 and accompanying text; see also supra note 232 and accompanying text. 277. Supra note 108 and accompanying text.
100 70 WASH. & LEE L. REV. 0000 (2013)
majors with low value in the labor market should be capable of succeeding in fields that are more highly valued in the labor market. Indeed, business majors have among the lowest standardized test scores, but have above-average labor market outcomes.278 Figures 7.1 and 7.2 below highlight the overlapping distribution of abilities of students in different fields. Specifically, the charts show what percent of GRE test-takers intent on graduate study in various fields scored higher on the quantitative portion of the GRE than the median test taker intent on studying business (7.1) or engineering (7.2).
278. See supra notes 13–18 and accompanying text; see also EDUC. TESTING SERV., GRE GUIDE TO THE USE OF SCORES 2010–11, at 17–19 (2010), http://www.ets.org/s/gre/pdf/2010-11_gre_guide.pdf (providing in Table 4 GRE scores by intended major of those taking the test); Arcidiacono, supra note 142, at 344 (“Even after controlling for selection, large earnings premiums exist for certain majors.”); STEPHEN D.H. HSU & JAMES SCHOMBERT, UNIV. OF OR. DEP’T OF PHYSICS, DATA MINING THE UNIVERSITY: COLLEGE GPA PREDICTIONS FROM SAT SCORES (Apr. 15, 2010), http://arxiv.org/pdf/ 1004.2731v1.pdf (studying a sample of University of Oregon graduates and finding that SAT scores predict academic success, but even students with relatively low SAT scores are capable of succeeding in most college majors—including economics, chemistry, biology, and computer science).
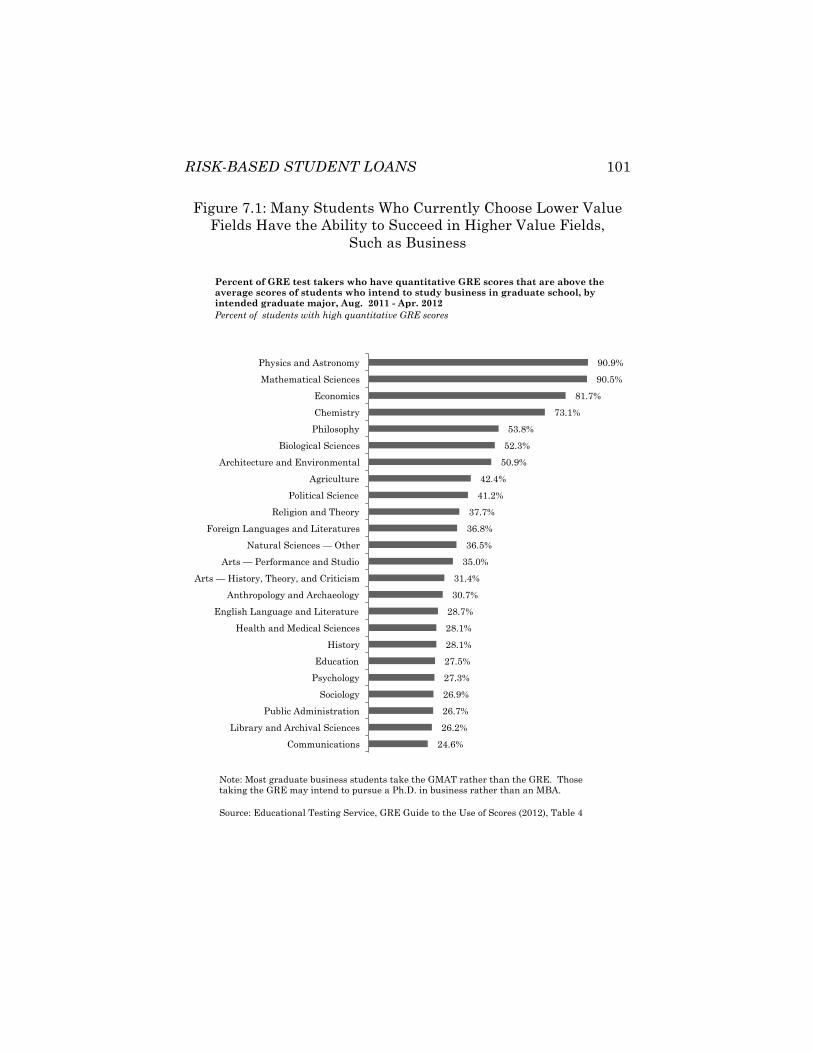
RISK-BASED STUDENT LOANS 101
Figure 7.1: Many Students Who Currently Choose Lower Value Fields Have the Ability to Succeed in Higher Value Fields,
Such as Business
90.9%
90.5%
81.7%
73.1%
53.8%
52.3%
50.9%
42.4%
41.2%
37.7%
36.8%
36.5%
35.0%
31.4%
30.7%
28.7%
28.1%
28.1%
27.5%
27.3%
26.9%
26.7%
26.2%
24.6%
Physics and Astronomy
Mathematical Sciences
Economics
Chemistry
Philosophy
Biological Sciences
Architecture and Environmental
Agriculture
Political Science
Religion and Theory
Foreign Languages and Literatures
Natural Sciences — Other
Arts — Performance and Studio
Arts — History, Theory, and Criticism
Anthropology and Archaeology
English Language and Literature
Health and Medical Sciences
History
Education
Psychology
Sociology
Public Administration
Library and Archival Sciences
Communications
Percent of GRE test takers who have quantitative GRE scores that are above the average scores of students who intend to study business in graduate school, by intended graduate major, Aug. 2011 - Apr. 2012 Percent of students with high quantitative GRE scores
Note: Most graduate business students take the GMAT rather than the GRE. Those taking the GRE may intend to pursue a Ph.D. in business rather than an MBA. Source: Educational Testing Service, GRE Guide to the Use of Scores (2012), Table 4
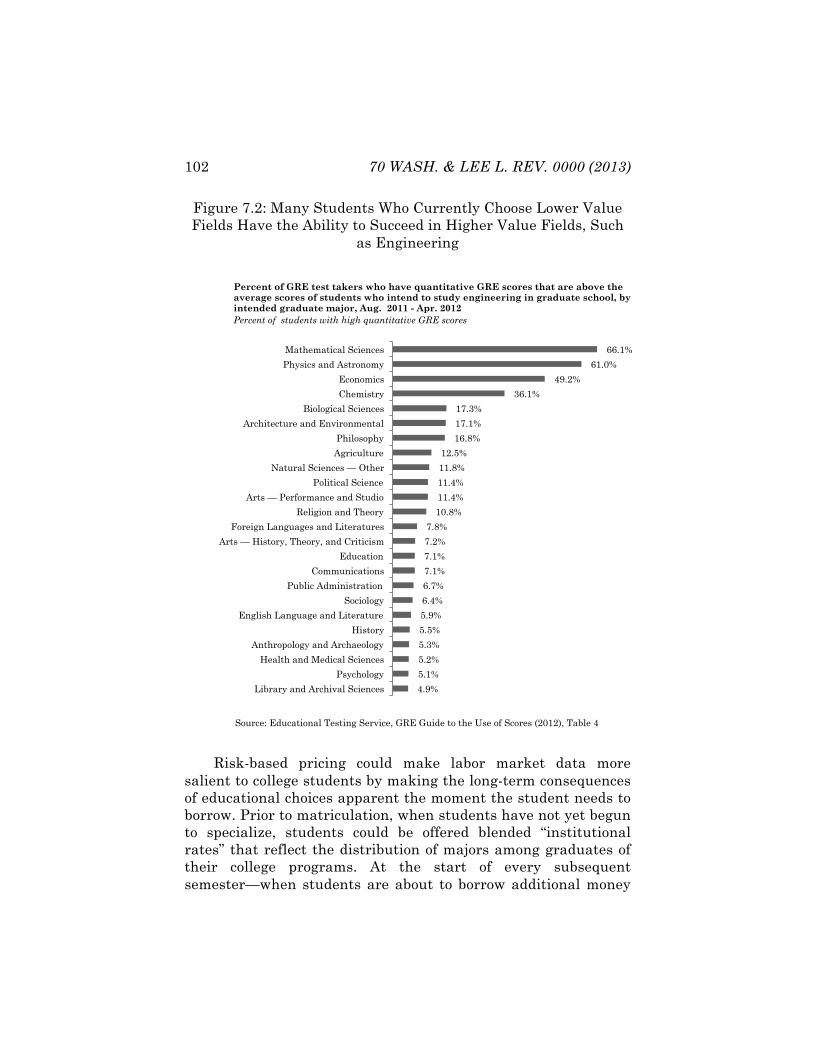
102 70 WASH. & LEE L. REV. 0000 (2013)
Figure 7.2: Many Students Who Currently Choose Lower Value Fields Have the Ability to Succeed in Higher Value Fields, Such
as Engineering
Risk-based pricing could make labor market data more salient to college students by making the long-term consequences of educational choices apparent the moment the student needs to borrow. Prior to matriculation, when students have not yet begun to specialize, students could be offered blended “institutional rates” that reflect the distribution of majors among graduates of their college programs. At the start of every subsequent semester—when students are about to borrow additional money
66.1%
61.0%
49.2%
36.1%
17.3%
17.1%
16.8%
12.5%
11.8%
11.4%
11.4%
10.8%
7.8%
7.2%
7.1%
7.1%
6.7%
6.4%
5.9%
5.5%
5.3%
5.2%
5.1%
4.9%
Mathematical Sciences
Physics and Astronomy
Economics
Chemistry
Biological Sciences
Architecture and Environmental
Philosophy
Agriculture
Natural Sciences — Other
Political Science
Arts — Performance and Studio
Religion and Theory
Foreign Languages and Literatures
Arts — History, Theory, and Criticism
Education
Communications
Public Administration
Sociology
English Language and Literature
History
Anthropology and Archaeology
Health and Medical Sciences
Psychology
Library and Archival Sciences
Percent of GRE test takers who have quantitative GRE scores that are above the average scores of students who intend to study engineering in graduate school, by intended graduate major, Aug. 2011 - Apr. 2012 Percent of students with high quantitative GRE scores
Source: Educational Testing Service, GRE Guide to the Use of Scores (2012), Table 4
RISK-BASED STUDENT LOANS 103
to pay tuition—students could be presented with a fixed interest rate for their new loans279 that reflects the individual students’ course selections280 and developments in the labor market.
Students could also be given an explanation of the implications of the interest rate for the long-term cost of their education, and a list of actions they could take that would reduce their interest rate, such as changing majors and/or courses.281 This could be especially helpful to students from low-income backgrounds, who may be the least informed about occupational
279. It would be unfair and impractical to change the interest rate for outstanding loans based on new information that was not available to students at the time they borrowed. It may also be sensible to permit students to lock in a rate for a certain number of semesters or years if providing predictability is more important than encouraging mid-course adjustments. 280. It makes more sense to focus on observable behavior—such as the courses students actually complete—rather than declarations of intent (i.e., a declared major). For example, a student might receive the pre-med interest rate after successfully completing a gatekeeper class such as organic chemistry. Declarations of intent can more easily be gamed by students seeking a low interest rate for the early years of a high-risk course of study. 281. Whether risk-based pricing of student loans or economically equivalent grants would be more effective to change student behavior is an empirical question. The empirical literature on whether borrowers react rationally to interest rates is somewhat mixed. See, e.g., Sumit Agarwal, Souphala Chomsisengphet, Chunlin Liu & Nicholas S. Souleles, Do Consumers Choose the Right Credit Contracts? 15–17 (Working Paper, 2007), available at http://papers.ssrn.com/sol3/papers.cfm?abstract_id=843826 (finding that a significant proportion of borrowers make suboptimal choices when trading off between upfront fees and interest rates, although mistakes become less common as the amount of money at stake increases); Sumit Agarwal, Paige Marta Skiba & Jeremy Tobacman, Payday Loans and Credit Cards: New Liquidity and Credit Scoring Puzzles?, in 99 AM. ECON. REV., PAPERS AND PROCEEDINGS OF THE 121ST MEETING OF THE AM. ECON. ASS’N 412, 416 (2009) (concluding that some consumers will borrow using more expensive payday loans even when less expensive credit card debt is available to them); Block-Lieb & Janger, supra note 193, at 1535–48 (discussing limitations on consumer borrowers comprehension of interest rates); David B. Gross & Nicholas S. Souleles, Do Liquidity Constraints and Interest Rates Matter for Consumer Behavior? Evidence from Credit Card Data, 117 Q. J. ECON. 149, 150–52, 182 (2002) (finding that borrowers react strongly to credit card interest rates by adjusting their borrowing up when rates decrease and down when rates increase, and arguing that previous studies that have found a limited impact of interest rates suffered from inadequate data on household-specific interest rates). Much of the literature has focused on subprime consumer debtors, and it is unclear to what extent it can be generalized to college students.
104 70 WASH. & LEE L. REV. 0000 (2013)
wages and the most likely to borrow. And by studying toward higher wage and lower risk occupations, students from low-income backgrounds might be able to maximize the economic value of higher education and their own opportunities for upward social mobility.
We need not assume that every student chooses a course of study based purely on financial considerations. All that is required for risk-based pricing to change behavior is that some proportion of students are motivated at least in part by financial considerations, and that monetary incentives coupled with additional information could change those students’ behavior.
Over the long run, if risk-based pricing of student loans succeeds in channeling enough students toward high-demand occupations, the gap between wages in different occupations and for different college majors could shrink, reducing inequality.
D. The Promise and Perils of “Meritocratic” Risk-Based Pricing
The distinction between risks driven by student choice and risks driven by misfortune is not always clear-cut. Factors like class ranking282 or standardized test scores283 may be driven in part by choice—how much time to devote to studying and how much to leisure—and in part by innate ability or advantages related to being from a prosperous family.
However, the use of class ranking284 or test scores could help channel students toward the areas in which they have the greatest competitive advantage and therefore the greatest opportunity for success. For example, notwithstanding the strong average career prospects for engineers and doctors, it might be
282. Higher grades predict higher earnings, even after controlling for race, socioeconomic status, gender, SAT scores, college selectivity, college major, college class rank, graduate school, and sector of employment. BOWEN & BOK, supra note 272, at 140–42. 283. SAT scores somewhat predict earnings, particularly between low scores and moderate scores. Id. at 133–35. 284. GPA is a poor measure because of differences in grading distributions across institutions, majors, courses, and professors. See supra notes 113–23 and accompanying text. Standardized percentile rankings within each course and aggregated by major would be more meaningful.
RISK-BASED STUDENT LOANS 105
preferable for great writers with limited spatial abilities to pursue careers in law or journalism. Risk-based pricing that incorporates some measure of field-specific ability would do a better job of sorting students into areas that are the best fit for the individual student’s talents.
The decision to use factors such as rankings and test scores as predictors may involve a tradeoff between equality and efficiency. On average, minorities and students from less prosperous backgrounds tend to have lower test scores and grades.285 Nevertheless, grades and test scores remain good predictors of academic and financial success, even after controlling for race and socioeconomic status.286 One possible compromise would be to use class ranking or standardized test scores that have been adjusted to remove differences that might be explained by race or parental socioeconomic status.287 However, such an approach would entail subjective and potentially controversial judgments.288
285. See, e.g., RICHARD D. KAHLENBERG, REWARDING STRIVERS: HELPING LOW INCOME STUDENTS SUCCEED IN COLLEGE 10–13 (2010) (noting significantly lower predicted SAT scores for those who are disadvantaged and black as opposed to advantaged and white, respectively). 286. Many studies that have questioned the predictive value of the SAT have used statistically questionable techniques, such as over-controlling (by using grades or other standardized test scores, which are meant to measure academic ability and correlate with SAT scores), or truncating the range of scores by only examining students who already have very similar SAT scores because they attend the same caliber of institution. Some studies have also failed to correct for differences in grading distributions. See, e.g., Christopher M. Berry & Paul R. Sackett, Individual Differences in Course Choice Results in Underestimation of the Validity of College Admissions Systems, 20 PSYCHOL. SCI. 822, 822 (2009) (“[T]he validity of SAT scores and high school [GPAs] as predictors of academic performance has been underestimated because of previous studies’ reliance on flawed performance indicators . . . .”); Nathan R. Kuncel & Sarah A. Hezlett, Fact and Fiction in Cognitive Ability Testing for Admissions and Hiring Decisions, 19 CURRENT DIRECTIONS IN PSCYHOL. SCI. 339, 340–44 (2010) (reaffirming the efficacy of standardized testing in predicting future academic performance despite various studies that questioned the validity of tests). 287. See, e.g., KAHLENBERG, supra note 285, at 167–75, 185–90 (describing how a system of adjustment for socioeconomic factors at more extreme ends of disadvantage may be implemented with respect to the SAT and ACT). 288. For example, in the late 1990s, Educational Testing Services attempted to develop an alternative SAT “strivers” score that would flag students who
106 70 WASH. & LEE L. REV. 0000 (2013)
E. Debt-to-Income Ratios and Paternalistic Borrowing Limits
Student debt levels probably primarily reflect external circumstances—parental wealth, socioeconomic status, and extent of parental support—but may also somewhat reflect factors within the student’s control—whether to attend a more expensive college or accept a scholarship at a less prestigious institution, whether to live at home, whether to work during school, or whether to overload on credits to graduate early. Because some debt-reducing choices might adversely affect students’ academic performance and career prospects, risk-adjusting student loans based on debt levels may disproportionately harm high-ability students of limited means—precisely the upwardly mobile clientele that federal student loans are meant to serve.
The focus should not be exclusively on the cost of education—the focus should be on whether education provides value that exceeds its cost. Nonprofit universities with higher tuition prices generally spend more on instruction per student, and, after controlling for student characteristics, their graduates earn more money.289 Attempts to cap tuition, including arbitrary limits on access to student loans,290 could
performed better than expected based on factors such as parental socioeconomic status. The original strivers project was discontinued amid heated controversy. Claire Barliant, Striving to Stay Alive, SALON (Oct. 18, 1999, 12:00 PM), http://www.salon.com/1999/10/18/strivers/ (last visited on Feb. 3, 2013) (on file with the Washington and Lee Law Review). 289. Stacy Berg Gale & Alan B. Kruger, Estimating the Payoff to Attending a More Selective College: An Application of Selection on Observables and Unobservables, 117 Q. J. ECON. 1491, 1524 (2002) (“We do find that students who attend colleges with higher average tuition costs tend to earn higher income years later, after adjusting for student characteristics. . . . [T]uition matters because higher cost schools devote more resources to student instruction.”). 290. William Bennett, former Secretary of Education under President Ronald Reagan, claimed that student loans and other government aid increase the cost of education, and have used these claims to justify budget cuts that target government support for education. William J. Bennett, Op-Ed, Our Greedy Colleges, N.Y. TIMES (Feb. 18, 1987), http://www.nytimes.com/ 1987/02/18/opinion/our-greedy-colleges.html (last visited Feb. 3, 2013) (on file with the Washington and Lee Law Review). Most empirical investigations of the “Bennett Hypothesis” have focused on grant aid rather than student loans, and have found mixed results. None of these studies have established that funding captured by universities does not ultimately benefit students through increased educational quality, student support services, or access for low-income students.
RISK-BASED STUDENT LOANS 107
See, e.g., MICHAEL MCPHERSON & MORTON O. SCHAPIRO, KEEPING COLLEGE AFFORDABLE: GOVERNMENT AND EDUCATIONAL OPPORTUNITY 72–73 (1991) (rejecting the Bennett Hypothesis and finding that colleges tend to provide additional grant aid in response to federal grant aid); LESLEY J. TURNER, COLUMBIA UNIV., THE INCIDENCE OF STUDENT FINANCIAL AID: EVIDENCE FROM THE PELL GRANT PROGRAM 26 (2012), http://www.columbia.edu/~ljt2110/LTurner_JMP.pdf (“Across all sectors, every dollar of Pell Grant aid reduces students’ effective prices by 84 cents, with institutions appropriating the remaining 16 cents through price discrimination.”); Bridget T. Long, How do Financial Aid Policies Affect Colleges? The Institutional Impact of the Georgia HOPE Scholarship, 39 J. HUM. RESOURCES 1045, 1062–63 (2004) (finding that private universities captured at most 30% of new grant aid in Georgia’s HOPE program, which was viewed as not rising to “the level of college exploitation insinuated by Bennett”); Michael S. McPherson et al., Recent Trends in U.S. Higher Education Costs and Prices: The Role of Government Funding, in 79 AM. ECON. REV. 253, 255 (1989) (finding the Bennett Hypothesis implausible because tuition increased the fastest at well-endowed, elite private institutions that were the least dependent on government aid as a source of revenues); Larry D. Singell, Jr. & Joe A. Stone, For Whom the Pell Tolls: The Response of University Tuition to Federal Grants-in-aid, 26 ECON. EDUC. REV. 285, 291–94 (2007) (rejecting the Bennett Hypothesis for in-state tuition at public universities, but finding that private universities adjust tuition to capture most grant aid and pubic universities adjust out-of-state tuition); cf. Michael J. Rizzo & Ronald G. Ehrenberg, Resident and Nonresident Tuition and Enrollment at Flagship State Universities, in COLLEGE CHOICES: THE ECONOMICS OF WHERE TO GO, WHEN TO GO AND HOW TO PAY FOR IT 303, 338–39 (Caroline M. Hoxyby ed., 2004) (finding that flagship public universities increase in-state tuition to absorb grant aid, “[c]onsistent with the Bennett Hypothesis,” but do not increase out-of-state tuition to absorb grant aid).
The empirical evidence for the claim that federal student loans increase education costs is weak. ALISA F. CUNNINGHAM ET AL., NAT’L CTR. FOR EDUC. STATISTICS, 2 STUDY OF COLLEGE COSTS AND PRICES, 1988–89 TO 1997–98, at 80–81, 10 (US Dept. of Educ. 2001), http://nces.ed.gov/pubs2002/2002158.pdf; see also Glater, supra note 35, at 66 (“Empirical studies of changes in tuition do not support the assertion that colleges raise prices in response to greater perceived availability of funds to students.”); Warren, Baum & Sitaraman, supra note 65, at 141 n.71 (“Some observers suggest that the increased availability of student loans fuels increases in college prices. However, most empirical analyses fail to find such an effect.”). One of the few studies that may provide limited support for the Bennett Hypothesis focused exclusively on for-profit educational institutions, and the results therefore cannot be generalized to nonprofit higher education. The results may also be explained by grant aid rather than loans, or by unobserved differences in institutional costs or quality. Stephanie Riegg Cellini & Claudia Goldin, Does Federal Student Aid Raise Tuition? New Evidence on For-Profit Colleges 1, 13–25 (Nat’l Bureau of Econ. Research, Working Paper No. 17827, 2012), http://scholar.harvard.edu/goldin/files/does_federal_student_aid_ raise_tuition_new_evidence_on_for-profit_colleges.pdf.
There are more plausible explanations for rising costs of higher education, such as an economy-wide increase in demand for educated labor and therefore
108 70 WASH. & LEE L. REV. 0000 (2013)
degrade the quality,291 availability,292 and value of education. Borrowing limits are a heavy-handed approach to managing
risk, and impinge on the freedom of students and their access to university education.293 There are less intrusive approaches available, such as risk-adjusting interest rates to account for default risk.294
In some extreme and rare situations, higher interest rates may be inadequate to offset losses because default rates are already very high and there are too few nondefaulting borrowers in the same risk pool.295 In such rare situations, loan limits could
an increase in costs for all service industries that rely on highly educated labor, including medicine, dentistry, and legal services, as well as higher education. Robert B. Archibald & David H. Feldman, Why Do Higher Education Costs Rise More Rapidly than Prices in General, CHANGE, May–June 2008, at 30–31. For a discussion of factors contributing to the costs of higher education, see generally ROBERT B. ARCHIBALD & DAVID H. FELDMAN, WHY DOES COLLEGE COST SO MUCH? (2011).
Another explanation for perceived increase in costs is a shift in costs from taxpayers to students and their families, as per-student real public support for higher education has generally declined since the early 1980s. Evidence suggests that the decline in government support for education is linked to the growth of anti-taxation political movements. See Robert B. Archibald & David H. Feldman, State Higher Education Spending and the Tax Revolt, 77 J. HIGHER EDUC. 618 (2006). Tuition sticker prices also increase as universities charge wealthy students more to fund need-based aid—and lower net cost—for poorer students. See, e.g., ARCHIBALD & FELDMAN, supra at 150–53. 291. Caroline M. Hoxby, How the Changing Market Structure of U.S. Higher Education Explains College Tuition 41–42 (Nat’l Bureau of Econ. Research, Working Paper No. 6323, 1997), http://static-71-166-250-129.washdc.east. verizon.net/eLibrary/ARCHIVES/GENERAL/NBER_US/N971200H.pdf (arguing that increased competition has led to an increase in both the cost and quality of college education, and that price controls are inadvisable). 292. See Michael S. McPherson & Morton O. Schapiro, Does Student Aid Affect College Enrollment? New Evidence on a Persistent Controversy, 81 AM. ECON. REV. 309, 317–18 (1991) (indicating that federal aid appears to correlate with increased enrollment by low-income students). 293. Glater, supra note 35, at 72–73 (arguing for higher federal student loan limits to increase access and reduce the need for high-cost private loans). 294. See Block-Lieb & Janger, supra note 193, at 1513–18 (explaining how the growing use of risk-based pricing by lenders enables them to profitably make more credit available to risky borrowers and mitigates the need for credit rationing). 295. See William Adams, Liran Einav & Jonathan Levin, Liquidity Constraints and Imperfect Information in Subprime Lending, 99 AM. ECON. REV. 49, 65–83 (2009) for a study documenting the use of both risk-based interest
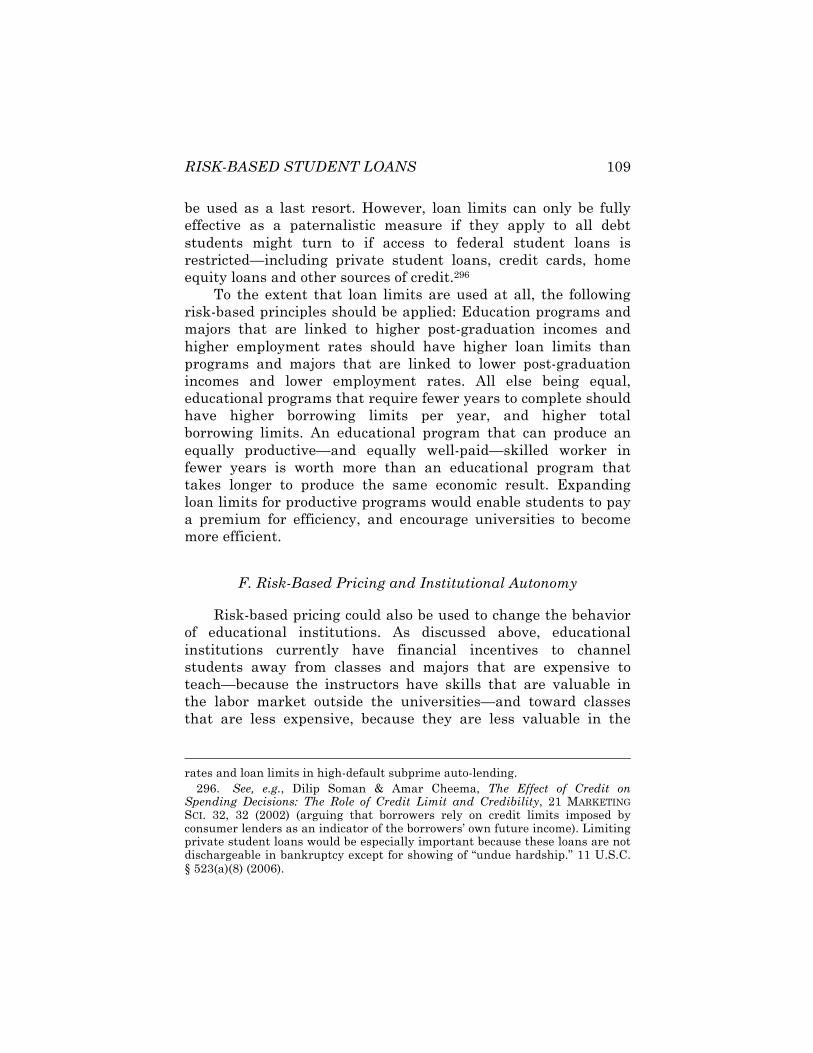
RISK-BASED STUDENT LOANS 109
be used as a last resort. However, loan limits can only be fully effective as a paternalistic measure if they apply to all debt students might turn to if access to federal student loans is restricted—including private student loans, credit cards, home equity loans and other sources of credit.296
To the extent that loan limits are used at all, the following risk-based principles should be applied: Education programs and majors that are linked to higher post-graduation incomes and higher employment rates should have higher loan limits than programs and majors that are linked to lower post-graduation incomes and lower employment rates. All else being equal, educational programs that require fewer years to complete should have higher borrowing limits per year, and higher total borrowing limits. An educational program that can produce an equally productive—and equally well-paid—skilled worker in fewer years is worth more than an educational program that takes longer to produce the same economic result. Expanding loan limits for productive programs would enable students to pay a premium for efficiency, and encourage universities to become more efficient.
F. Risk-Based Pricing and Institutional Autonomy
Risk-based pricing could also be used to change the behavior of educational institutions. As discussed above, educational institutions currently have financial incentives to channel students away from classes and majors that are expensive to teach—because the instructors have skills that are valuable in the labor market outside the universities—and toward classes that are less expensive, because they are less valuable in the
rates and loan limits in high-default subprime auto-lending. 296. See, e.g., Dilip Soman & Amar Cheema, The Effect of Credit on Spending Decisions: The Role of Credit Limit and Credibility, 21 MARKETING SCI. 32, 32 (2002) (arguing that borrowers rely on credit limits imposed by consumer lenders as an indicator of the borrowers’ own future income). Limiting private student loans would be especially important because these loans are not dischargeable in bankruptcy except for showing of “undue hardship.” 11 U.S.C. § 523(a)(8) (2006).
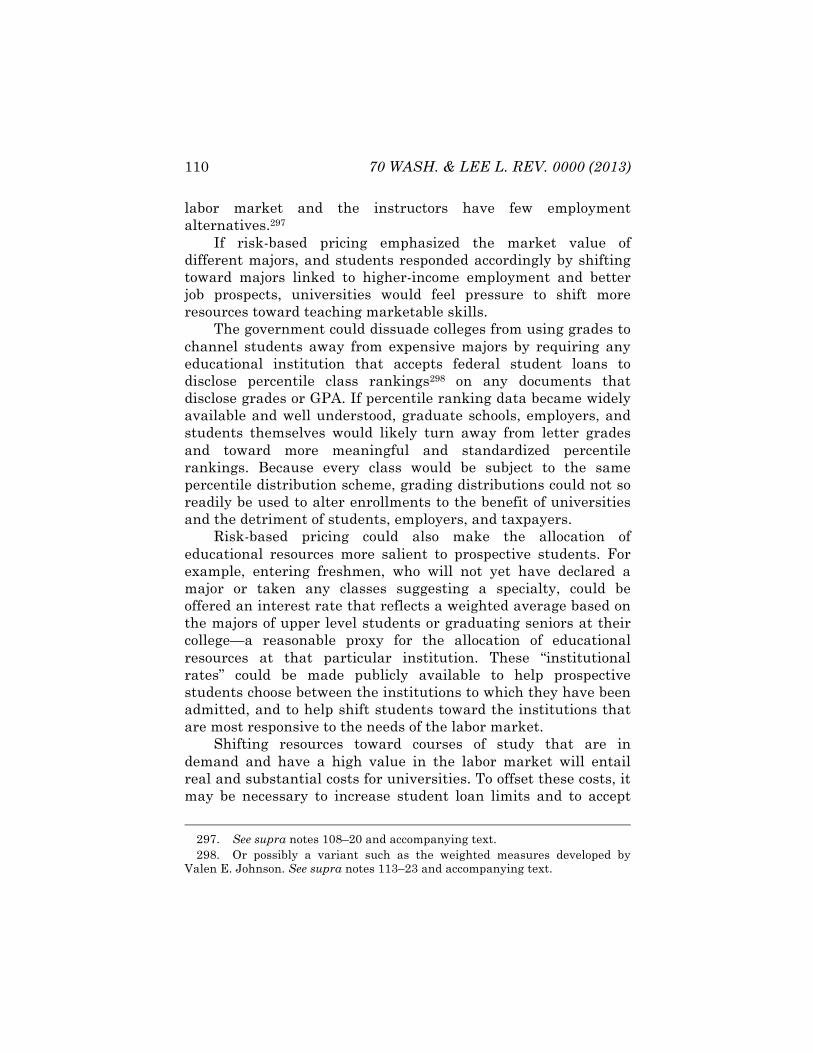
110 70 WASH. & LEE L. REV. 0000 (2013)
labor market and the instructors have few employment alternatives.297
If risk-based pricing emphasized the market value of different majors, and students responded accordingly by shifting toward majors linked to higher-income employment and better job prospects, universities would feel pressure to shift more resources toward teaching marketable skills.
The government could dissuade colleges from using grades to channel students away from expensive majors by requiring any educational institution that accepts federal student loans to disclose percentile class rankings298 on any documents that disclose grades or GPA. If percentile ranking data became widely available and well understood, graduate schools, employers, and students themselves would likely turn away from letter grades and toward more meaningful and standardized percentile rankings. Because every class would be subject to the same percentile distribution scheme, grading distributions could not so readily be used to alter enrollments to the benefit of universities and the detriment of students, employers, and taxpayers.
Risk-based pricing could also make the allocation of educational resources more salient to prospective students. For example, entering freshmen, who will not yet have declared a major or taken any classes suggesting a specialty, could be offered an interest rate that reflects a weighted average based on the majors of upper level students or graduating seniors at their college—a reasonable proxy for the allocation of educational resources at that particular institution. These “institutional rates” could be made publicly available to help prospective students choose between the institutions to which they have been admitted, and to help shift students toward the institutions that are most responsive to the needs of the labor market.
Shifting resources toward courses of study that are in demand and have a high value in the labor market will entail real and substantial costs for universities. To offset these costs, it may be necessary to increase student loan limits and to accept
297. See supra notes 108–20 and accompanying text. 298. Or possibly a variant such as the weighted measures developed by Valen E. Johnson. See supra notes 113–23 and accompanying text.
RISK-BASED STUDENT LOANS 111
tuition increases, with the understanding that although the cost of higher education may increase, the value of higher education will increase by even more.
Some may object to risk-based pricing on the grounds that it is likely to shrink enrollment in, and resources dedicated to, the humanities in order to increase enrollment and resources dedicated to STEM and business fields. We might also be concerned about the use of risk-based pricing as a cover for politically motivated interference with university research. The ability to target particular universities or particular departments within universities might raise such concerns. The more tightly risk-based pricing is tied to objectively verifiable loan loss data or data on occupational wages and employment—as opposed to forecasts or any other subjective criteria—the lower the risk of veiled attacks on academic freedom and impartial research.
Some have argued that the humanities pay off economically in the long run, even if humanities graduates do not do as well in the short run.299 Better data would be needed to evaluate these claims—most studies of income by major rely on a few years of post-graduation data. Risk-based pricing can and should consider not just employment and income at graduation or the first few years thereafter, but longer-term economic outcomes. Such long-term data could be gathered by a cooperative effort between government and universities to match schooling records with student loan performance data and federal income tax and Social Security Administration records.300 It is perfectly plausible that at least some humanities graduates go on to have successful, stable, and lucrative careers, for example, as lawyers or other professionals.301 Risk-based pricing is not inherently in favor or
299. See, e.g., Jim Pollock, Are Liberal Arts Degrees Worth Anything? DEP’T OF POLITICAL SCI., UNIV. OF TEX. AT AUSTIN, http://www.uta.edu/ pols/files/AreLiberalArtsDegreesWorthAnything.pdf. 300. Student and taxpayer privacy concerns could be addressed by releasing only aggregate data, or obscuring information that could be used to identify individuals. 301. See Simkovic & McIntyre, supra note 186 (finding that average lifetime earnings of law degree holders, discounted to present value at the start of law school, are approximately $1,060,000 greater than earnings of similar workers whose highest degree is a Bachelor’s).
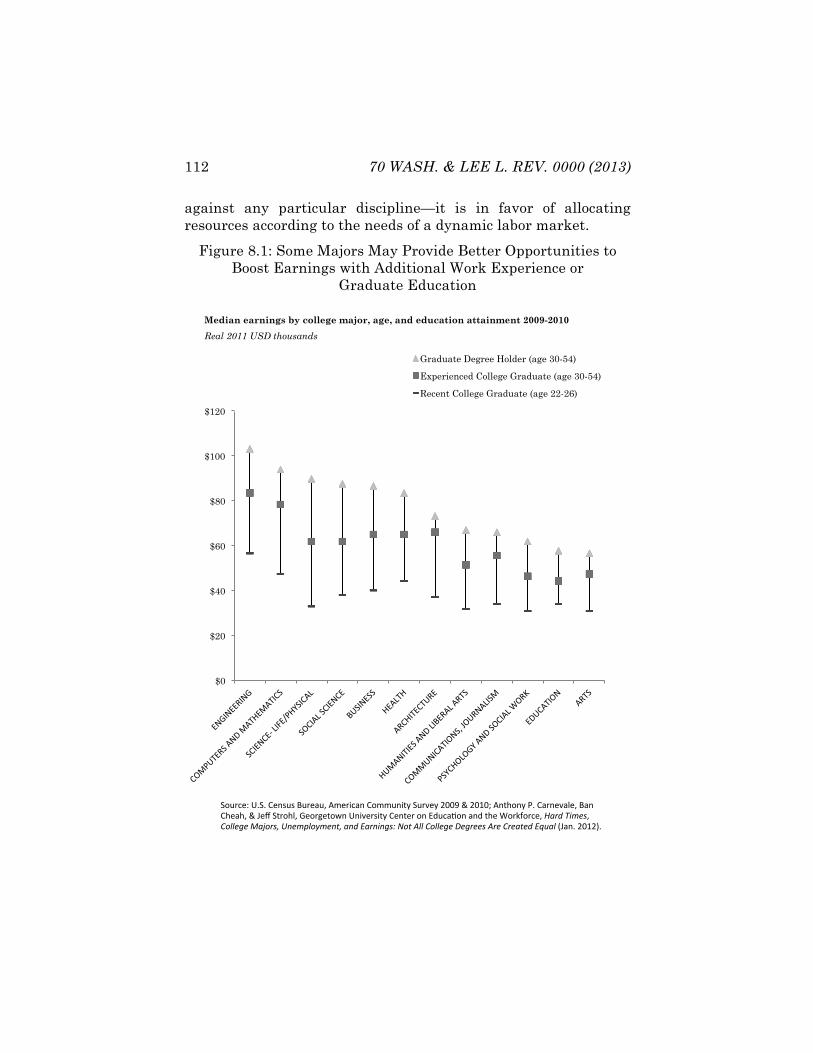
112 70 WASH. & LEE L. REV. 0000 (2013)
against any particular discipline—it is in favor of allocating resources according to the needs of a dynamic labor market.
Figure 8.1: Some Majors May Provide Better Opportunities to Boost Earnings with Additional Work Experience or
Graduate Education
$0
$20
$40
$60
$80
$100
$120
Graduate Degree Holder (age 30-54)
Experienced College Graduate (age 30-54)
Recent College Graduate (age 22-26)
Median earnings by college major, age, and education attainment 2009-2010
Real 2011 USD thousands ! !!
"#$%&'(!9:":!)'*8$8!4$%'/$3!;<'%=&/*!)#<<$*=+2!"$%1'2!>??@!A!>?B?C!;*+D#*2!,:!)/%*'1/.'3!4/*!)D'/D3!A!E'F!"+%#D.3!G'#%H'+#I*!9*=1'%8=+2!)'*+'%!#*!JK$&/0#*!/*K!+D'!L#%M5#%&'3!"#$%!&'()*3!+,--).)!/#0,$*1!23)(4-,5()361!#3%!7#$3'3.*8!9,6!:--!+,--).)!;).$))*!:$)!+$)#6)%!7<=#-!NE/*:!>?B>O:!
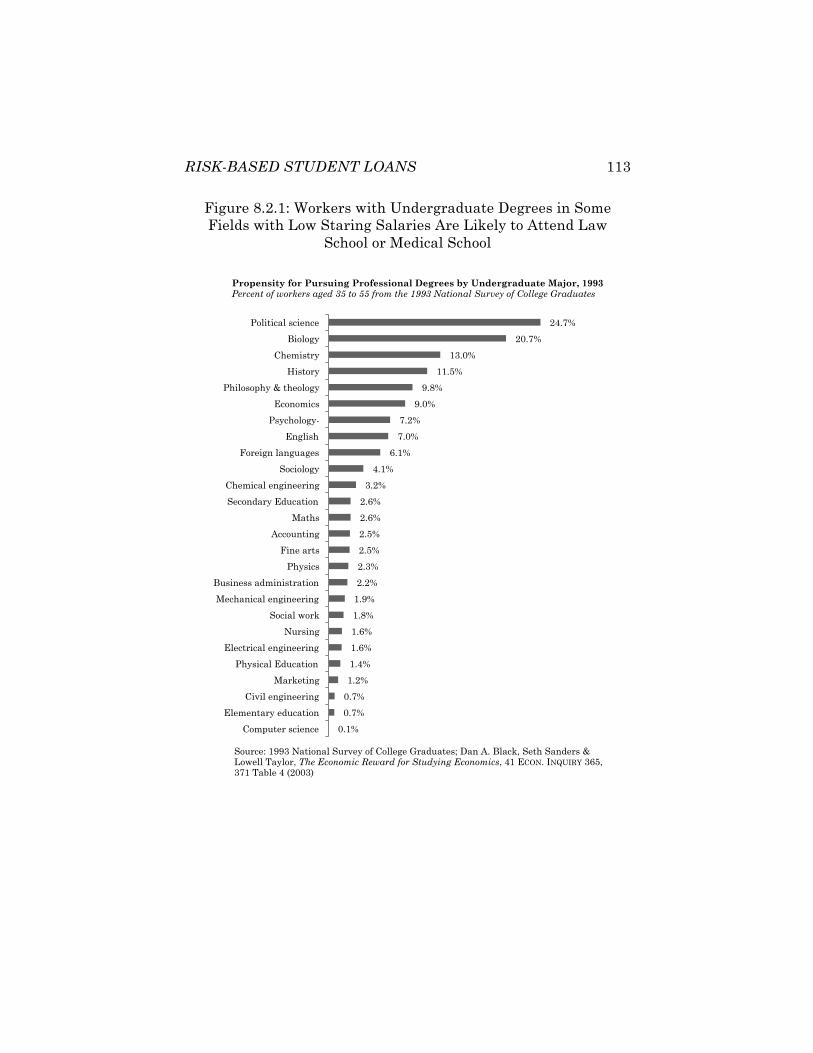
RISK-BASED STUDENT LOANS 113
Figure 8.2.1: Workers with Undergraduate Degrees in Some Fields with Low Staring Salaries Are Likely to Attend Law
School or Medical School
24.7%
20.7%
13.0%
11.5%
9.8%
9.0%
7.2%
7.0%
6.1%
4.1%
3.2%
2.6%
2.6%
2.5%
2.5%
2.3%
2.2%
1.9%
1.8%
1.6%
1.6%
1.4%
1.2%
0.7%
0.7%
0.1%
Political science
Biology
Chemistry
History
Philosophy & theology
Economics
Psychology-
English
Foreign languages
Sociology
Chemical engineering
Secondary Education
Maths
Accounting
Fine arts
Physics
Business administration
Mechanical engineering
Social work
Nursing
Electrical engineering
Physical Education
Marketing
Civil engineering
Elementary education
Computer science
Propensity for Pursuing Professional Degrees by Undergraduate Major, 1993 Percent of workers aged 35 to 55 from the 1993 National Survey of College Graduates
Source: 1993 National Survey of College Graduates; Dan A. Black, Seth Sanders & Lowell Taylor, The Economic Reward for Studying Economics, 41 ECON. INQUIRY 365, 371 Table 4 (2003)
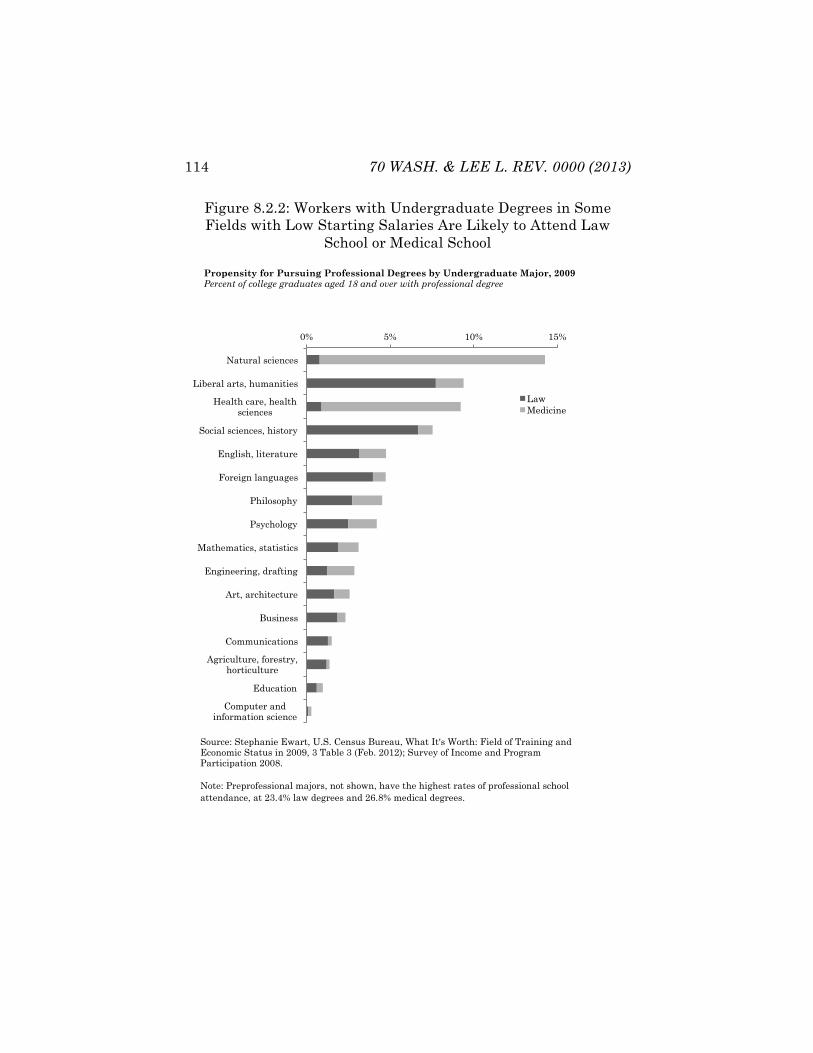
114 70 WASH. & LEE L. REV. 0000 (2013)
Figure 8.2.2: Workers with Undergraduate Degrees in Some Fields with Low Starting Salaries Are Likely to Attend Law
School or Medical School
0% 5% 10% 15%
Natural sciences
Liberal arts, humanities
Health care, health sciences
Social sciences, history
English, literature
Foreign languages
Philosophy
Psychology
Mathematics, statistics
Engineering, drafting
Art, architecture
Business
Communications
Agriculture, forestry, horticulture
Education
Computer and information science
Law Medicine
Propensity for Pursuing Professional Degrees by Undergraduate Major, 2009 Percent of college graduates aged 18 and over with professional degree
Source: Stephanie Ewart, U.S. Census Bureau, What It's Worth: Field of Training and Economic Status in 2009, 3 Table 3 (Feb. 2012); Survey of Income and Program Participation 2008. Note: Preprofessional majors, not shown, have the highest rates of professional school attendance, at 23.4% law degrees and 26.8% medical degrees.
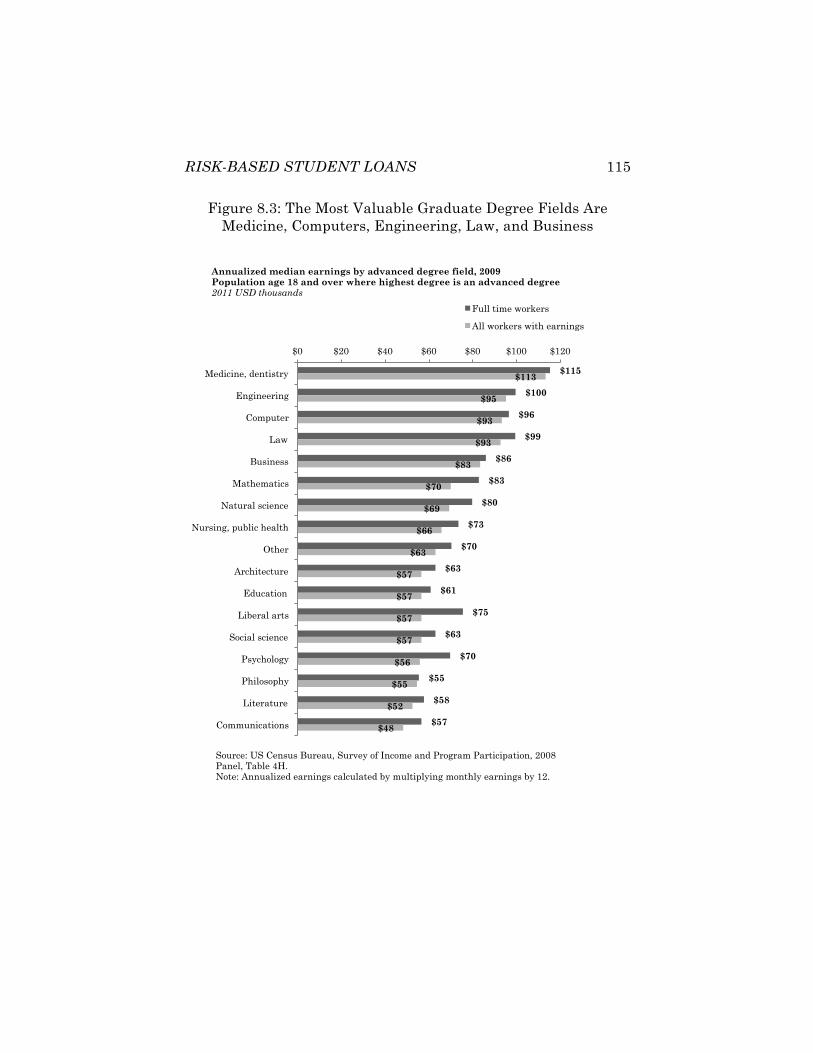
RISK-BASED STUDENT LOANS 115
Figure 8.3: The Most Valuable Graduate Degree Fields Are Medicine, Computers, Engineering, Law, and Business
$115
$100
$96
$99
$86
$83
$80
$73
$70
$63
$61
$75
$63
$70
$55
$58
$57
$113
$95
$93
$93
$83
$70
$69
$66
$63
$57
$57
$57
$57
$56
$55
$52
$48
$0 $20 $40 $60 $80 $100 $120
Medicine, dentistry
Engineering
Computer
Law
Business
Mathematics
Natural science
Nursing, public health
Other
Architecture
Education
Liberal arts
Social science
Psychology
Philosophy
Literature
Communications
Full time workers
All workers with earnings
Annualized median earnings by advanced degree field, 2009 Population age 18 and over where highest degree is an advanced degree 2011 USD thousands
Source: US Census Bureau, Survey of Income and Program Participation, 2008 Panel, Table 4H. Note: Annualized earnings calculated by multiplying monthly earnings by 12.
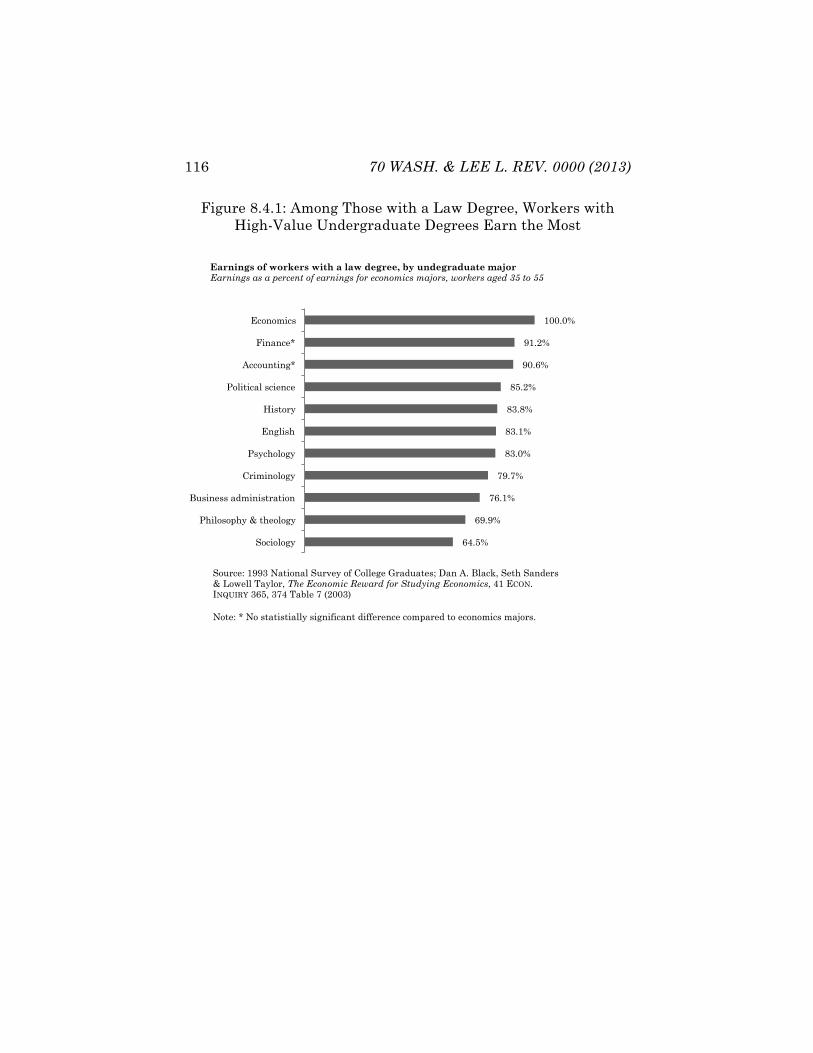
116 70 WASH. & LEE L. REV. 0000 (2013)
Figure 8.4.1: Among Those with a Law Degree, Workers with High-Value Undergraduate Degrees Earn the Most
100.0%
91.2%
90.6%
85.2%
83.8%
83.1%
83.0%
79.7%
76.1%
69.9%
64.5%
Economics
Finance*
Accounting*
Political science
History
English
Psychology
Criminology
Business administration
Philosophy & theology
Sociology
Earnings of workers with a law degree, by undegraduate major Earnings as a percent of earnings for economics majors, workers aged 35 to 55
Source: 1993 National Survey of College Graduates; Dan A. Black, Seth Sanders & Lowell Taylor, The Economic Reward for Studying Economics, 41 ECON. INQUIRY 365, 374 Table 7 (2003) Note: * No statistially significant difference compared to economics majors. Foreign language not statistically significant and not shown.
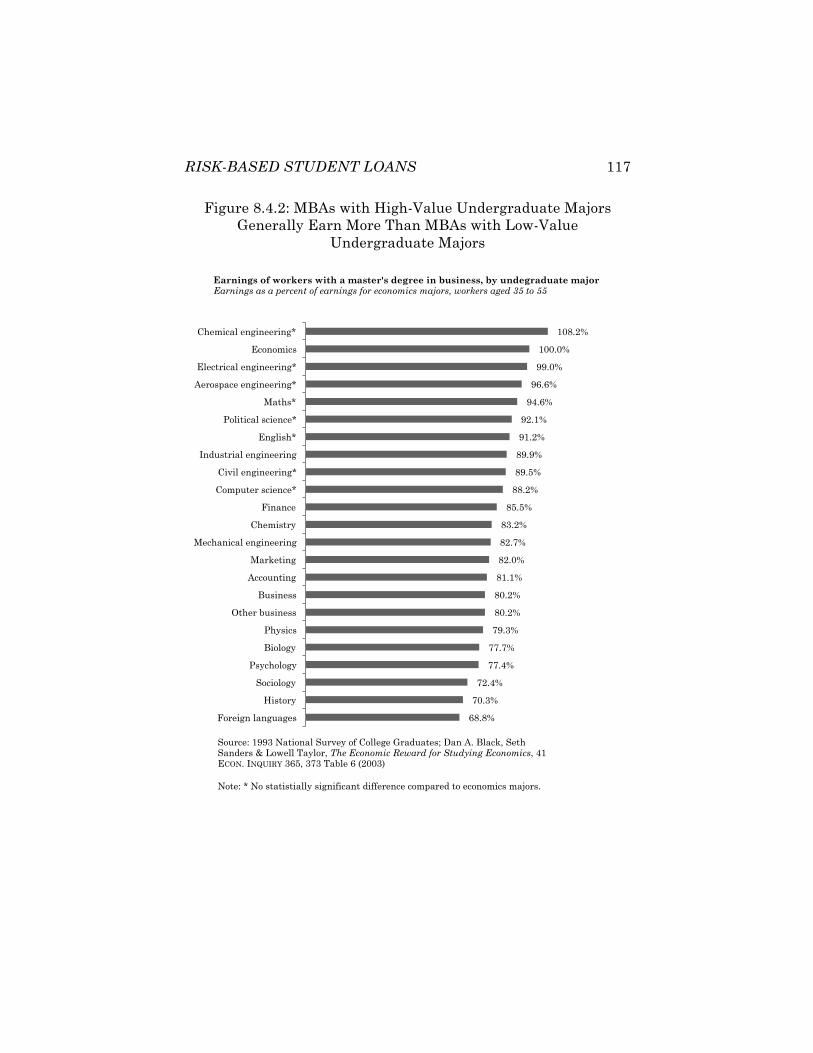
RISK-BASED STUDENT LOANS 117
Figure 8.4.2: MBAs with High-Value Undergraduate Majors Generally Earn More Than MBAs with Low-Value
Undergraduate Majors
108.2%
100.0%
99.0%
96.6%
94.6%
92.1%
91.2%
89.9%
89.5%
88.2%
85.5%
83.2%
82.7%
82.0%
81.1%
80.2%
80.2%
79.3%
77.7%
77.4%
72.4%
70.3%
68.8%
Chemical engineering*
Economics
Electrical engineering*
Aerospace engineering*
Maths*
Political science*
English*
Industrial engineering
Civil engineering*
Computer science*
Finance
Chemistry
Mechanical engineering
Marketing
Accounting
Business
Other business
Physics
Biology
Psychology
Sociology
History
Foreign languages
Earnings of workers with a master's degree in business, by undegraduate major Earnings as a percent of earnings for economics majors, workers aged 35 to 55
Source: 1993 National Survey of College Graduates; Dan A. Black, Seth Sanders & Lowell Taylor, The Economic Reward for Studying Economics, 41 ECON. INQUIRY 365, 373 Table 6 (2003) Note: * No statistially significant difference compared to economics majors.
118 70 WASH. & LEE L. REV. 0000 (2013)
A rather more parochial argument is that, notwithstanding relatively poor job prospects of humanities graduates, the humanities have spiritual or moral value that makes them inherently superior to STEM or business or social science majors and therefore deserving of subsidies at every other field’s expense. There are few empirical studies to support this view—much of the literature on “over-education” suggests that education that does not enhance employment prospects produces cynicism and dissatisfaction among graduates.302 Many of those who subscribe to the view that the humanities should be privileged simply hold it as an article of faith.
Assuming arguendo that the humanities are spiritually sacred but economically marginal, then who should make the economic sacrifice to ensure that the humanities are taught? Should students of limited means be forced to mortgage their futures to pay for a humanities education of limited monetary value? Should poor students in more challenging and less spiritually rewarding disciplines be forced to overpay for their loans so that other students—generally from wealthier families—can enjoy the humanities? This is the way the economic burden is allocated under the current system, and even the most ardent supporter of the humanities would be hard-pressed to defend it.
If four years of postsecondary cultural edification really is a fundamental human right, shouldn’t higher education be funded through taxation and provided free at the point of service to every citizen? Perhaps, but where should such an expenditure rank in voters’ list of priorities? In a world of limited resources, choices must be made and priorities established.
Most European and Asian governments that fund higher education through taxation have not treated the humanities as sacred—they have generally prioritized STEM instruction and labor market needs to a greater extent than have U.S. students
302. See, e.g., Val Burris, The Social and Political Consequences of Overeducation, 48 AM. SOC. REV. 454, 459–61 (1983) (finding that overeducation results in a statistically significant but small reduction in job satisfaction); id. at 463–64 (finding that overeducated workers are less likely to believe that success is the result of hard work rather than luck, have a less positive view of labor unions, and are more likely to be status-conscious).
RISK-BASED STUDENT LOANS 119
and universities.303 More direct government funding of postsecondary education in the United States would probably accelerate a shift away from the humanities, away from education as consumption, and toward education as investment. Risk-based student loan pricing could be understood as a compromise—an attempt to promote educational alignment with labor market needs while respecting U.S. cultural and political preferences for decentralized decision making.
For better or worse, the United States has opted not to make higher education a basic human right paid for at public expense, but rather an economic investment primarily paid for by students and their families. The federal student loan program was established with clear policy goals: to provide skilled labor to meet the needs of a growing economy and to provide upward mobility by enhancing the earnings and employment prospects of young adults. It is inappropriate for the federal student loan program to subsidize programs that cannot meet these goals at the expense of programs that can.
Other options remain for funding the humanities. Colleges can still try to convince students that the spiritual splendor of a humanities degree really is worth the financial sacrifice. With risk-adjusted pricing, students will be more likely to be fully informed of the financial risks of their decisions, and must be willing to internalize them, including the upfront cost of tuition, the foregone future income, and the long-term risk-adjusted student loan interest. With better information and proper incentives, students remain free to make whatever decision they think best.
If colleges are truly dedicated to the proposition that everyone should have access to the humanities regardless of resources, colleges could make difficult budgetary decisions to reduce net tuition charges for humanities students of limited means. Or, colleges could admit more students from wealthy backgrounds who may prefer a leisurely and spiritually
303. See, e.g., CAROLINE KEARNEY, EFFORTS TO INCREASE STUDENT’S INTEREST IN PURSUING SCIENCE, TECHNOLOGY, ENGINEERING, AND MATHEMATICS STUDIES AND CAREERS 7–10 (2011) (discussing national strategies of several European countries that include promotion of STEM learning).
120 70 WASH. & LEE L. REV. 0000 (2013)
rewarding college experience, and can pay for it without borrowing.
The concept of higher education as primarily a spiritual experience comes from a time when higher education was a luxury available only to the wealthy.304 It may not suit a world of democratized access in which loans have become the funding mechanism of choice.
VII. Conclusion
Federal student loan programs were established to provide skilled labor to employers, to facilitate higher wages and economic advancement for students, and to promote human capital development and economic growth within the United States. These programs have successfully increased college degree attainment rates, boosted the incomes of millions of graduates, and benefited employers as well as the federal budget.
Unfortunately, limited labor market transparency and skewed incentives have contributed to a mismatch between the allocation of educational resources and the demands of the labor market. Many students do not know which majors and programs are the best investment until they have nearly completed their studies, and many universities find it more convenient to channel students toward whatever can engage them at the lowest cost rather than whatever is most valuable to students and employers. Perversely, uniform pricing of student loans subsidizes the subject areas that are least economically valuable, while penalizing those that are most valuable.
Risk-based pricing of student loan interest rates would help clarify the links between educational choices and employment opportunities. It would force students to internalize the risks created by their own decisions, and would pressure universities to become more responsive to employers’ needs. Ideally, it would channel educational resources to where they are valued most, reduce structural unemployment, reduce student loan loss rates, and boost wages and tax revenues. In the long run, it may even
304. See supra note 30 and accompanying text.
RISK-BASED STUDENT LOANS 121
reduce wage inequality by channeling more workers toward the highest wage areas, fewer toward the lowest wage areas, and thereby causing wages to compress.
Risk-based student loan pricing preserves a considerable degree of autonomy for students and educational institutions. Students remain free to study whatever they wish—they need only internalize the risk. Educational institutions remain free to allocate resources as they see fit, subject only to the constraints of a better-informed and more market-savvy population of students.
Risk-based pricing does not require an assumption that the existing allocation of wages and employment opportunities is fair or even fully efficient. It simply rests on an assumption that market prices contain useful information about the extant allocation of resources, that is unfair to channel indebted students into lifelong financial sacrifices they may not fully understand (and in so doing, exacerbate those sacrifices by driving down wages in already low wage fields), and that possible inefficiencies in the wage structure are best corrected through the normal workings of a mixed economy—regulation and taxes designed to curb socially harmful activity,305 and wage subsidies and public sector employment designed to provide public goods. Risk-based pricing does not create the allocation of resources in the U.S. economy—it merely reflects political and economic reality.
Within the umbrella framework of risk-based pricing, there remain a variety of possible solutions and tradeoffs. Should risk-based pricing attempt to channel students toward their areas of competitive advantage by incorporating some measure of field-specific ability? If so, what “meritocratic” measures are most predictive and least likely to undermine the goals of equal opportunity? Should risk-based pricing take into account debt levels to reward institutions that are cost efficient and students who are price conscious? Or would focus on debt levels
305. The suggestion is not that the government should directly set wages in the private sector. Rather, if there is a specific industry or activity in which wages are too high because of negative externalities, then the appropriate solution would be to regulate or tax the harmful industry or activity, which would increase noncompensation costs and indirectly reduce wages or employment in fields associated with negative externalities.
122 70 WASH. & LEE L. REV. 0000 (2013)
disproportionately harm the poorest students who have the greatest need to borrow? To what extent should risk-based pricing reflect historic data, and to what extent should it deviate based on forecasts? Which data sources are the most reliable?
This Article introduces the basic concept of risk-based pricing in the student loan context, and outlines some of the key technical and ethical considerations. It is the beginning of a long conversation, and hopefully, a path toward ameliorating some of our nation’s greatest economic and social challenges.
Related Documents