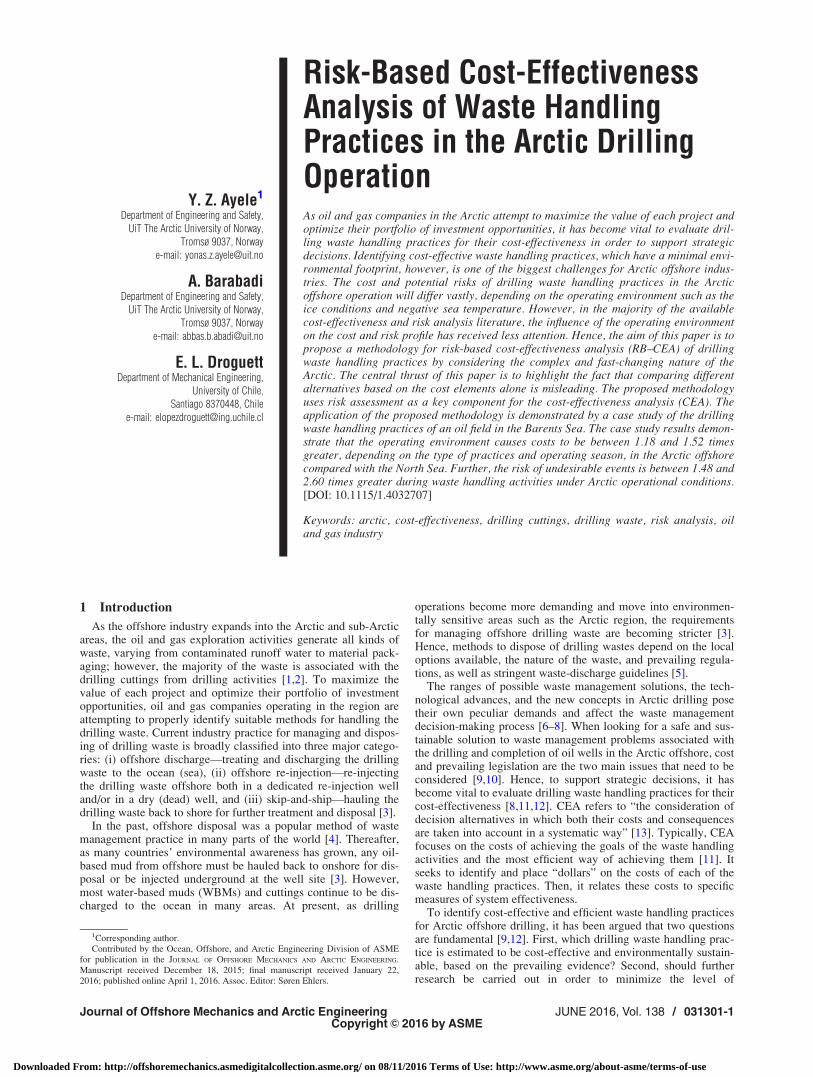
Y. Z. Ayele 1 Department of Engineering and Safety, UiT The Arctic University of Norway, Tromsø 9037, Norway e-mail: [email protected] A. Barabadi Department of Engineering and Safety, UiT The Arctic University of Norway, Tromsø 9037, Norway e-mail: [email protected] E. L. Droguett Department of Mechanical Engineering, University of Chile, Santiago 8370448, Chile e-mail: [email protected] Risk-Based Cost-Effectiveness Analysis of Waste Handling Practices in the Arctic Drilling Operation As oil and gas companies in the Arctic attempt to maximize the value of each project and optimize their portfolio of investment opportunities, it has become vital to evaluate dril- ling waste handling practices for their cost-effectiveness in order to support strategic decisions. Identifying cost-effective waste handling practices, which have a minimal envi- ronmental footprint, however, is one of the biggest challenges for Arctic offshore indus- tries. The cost and potential risks of drilling waste handling practices in the Arctic offshore operation will differ vastly, depending on the operating environment such as the ice conditions and negative sea temperature. However, in the majority of the available cost-effectiveness and risk analysis literature, the influence of the operating environment on the cost and risk profile has received less attention. Hence, the aim of this paper is to propose a methodology for risk-based cost-effectiveness analysis (RB–CEA) of drilling waste handling practices by considering the complex and fast-changing nature of the Arctic. The central thrust of this paper is to highlight the fact that comparing different alternatives based on the cost elements alone is misleading. The proposed methodology uses risk assessment as a key component for the cost-effectiveness analysis (CEA). The application of the proposed methodology is demonstrated by a case study of the drilling waste handling practices of an oil field in the Barents Sea. The case study results demon- strate that the operating environment causes costs to be between 1.18 and 1.52 times greater, depending on the type of practices and operating season, in the Arctic offshore compared with the North Sea. Further, the risk of undesirable events is between 1.48 and 2.60 times greater during waste handling activities under Arctic operational conditions. [DOI: 10.1115/1.4032707] Keywords: arctic, cost-effectiveness, drilling cuttings, drilling waste, risk analysis, oil and gas industry 1 Introduction As the offshore industry expands into the Arctic and sub-Arctic areas, the oil and gas exploration activities generate all kinds of waste, varying from contaminated runoff water to material pack- aging; however, the majority of the waste is associated with the drilling cuttings from drilling activities [1,2]. To maximize the value of each project and optimize their portfolio of investment opportunities, oil and gas companies operating in the region are attempting to properly identify suitable methods for handling the drilling waste. Current industry practice for managing and dispos- ing of drilling waste is broadly classified into three major catego- ries: (i) offshore discharge—treating and discharging the drilling waste to the ocean (sea), (ii) offshore re-injection—re-injecting the drilling waste offshore both in a dedicated re-injection well and/or in a dry (dead) well, and (iii) skip-and-ship—hauling the drilling waste back to shore for further treatment and disposal [3]. In the past, offshore disposal was a popular method of waste management practice in many parts of the world [4]. Thereafter, as many countries’ environmental awareness has grown, any oil- based mud from offshore must be hauled back to onshore for dis- posal or be injected underground at the well site [3]. However, most water-based muds (WBMs) and cuttings continue to be dis- charged to the ocean in many areas. At present, as drilling operations become more demanding and move into environmen- tally sensitive areas such as the Arctic region, the requirements for managing offshore drilling waste are becoming stricter [3]. Hence, methods to dispose of drilling wastes depend on the local options available, the nature of the waste, and prevailing regula- tions, as well as stringent waste-discharge guidelines [5]. The ranges of possible waste management solutions, the tech- nological advances, and the new concepts in Arctic drilling pose their own peculiar demands and affect the waste management decision-making process [6–8]. When looking for a safe and sus- tainable solution to waste management problems associated with the drilling and completion of oil wells in the Arctic offshore, cost and prevailing legislation are the two main issues that need to be considered [9,10]. Hence, to support strategic decisions, it has become vital to evaluate drilling waste handling practices for their cost-effectiveness [8,11,12]. CEA refers to “the consideration of decision alternatives in which both their costs and consequences are taken into account in a systematic way” [13]. Typically, CEA focuses on the costs of achieving the goals of the waste handling activities and the most efficient way of achieving them [11]. It seeks to identify and place “dollars” on the costs of each of the waste handling practices. Then, it relates these costs to specific measures of system effectiveness. To identify cost-effective and efficient waste handling practices for Arctic offshore drilling, it has been argued that two questions are fundamental [9,12]. First, which drilling waste handling prac- tice is estimated to be cost-effective and environmentally sustain- able, based on the prevailing evidence? Second, should further research be carried out in order to minimize the level of 1 Corresponding author. Contributed by the Ocean, Offshore, and Arctic Engineering Division of ASME for publication in the JOURNAL OF OFFSHORE MECHANICS AND ARCTIC ENGINEERING. Manuscript received December 18, 2015; final manuscript received January 22, 2016; published online April 1, 2016. Assoc. Editor: Søren Ehlers. Journal of Offshore Mechanics and Arctic Engineering JUNE 2016, Vol. 138 / 031301-1 Copyright V C 2016 by ASME Downloaded From: http://offshoremechanics.asmedigitalcollection.asme.org/ on 08/11/2016 Terms of Use: http://www.asme.org/about-asme/terms-of-use

Welcome message from author
This document is posted to help you gain knowledge. Please leave a comment to let me know what you think about it! Share it to your friends and learn new things together.
Transcript
Y. Z. Ayele1
Department of Engineering and Safety,
UiT The Arctic University of Norway,
Tromsø 9037, Norway
e-mail: [email protected]
A. BarabadiDepartment of Engineering and Safety,
UiT The Arctic University of Norway,
Tromsø 9037, Norway
e-mail: [email protected]
E. L. DroguettDepartment of Mechanical Engineering,
University of Chile,
Santiago 8370448, Chile
e-mail: [email protected]
Risk-Based Cost-EffectivenessAnalysis of Waste HandlingPractices in the Arctic DrillingOperationAs oil and gas companies in the Arctic attempt to maximize the value of each project andoptimize their portfolio of investment opportunities, it has become vital to evaluate dril-ling waste handling practices for their cost-effectiveness in order to support strategicdecisions. Identifying cost-effective waste handling practices, which have a minimal envi-ronmental footprint, however, is one of the biggest challenges for Arctic offshore indus-tries. The cost and potential risks of drilling waste handling practices in the Arcticoffshore operation will differ vastly, depending on the operating environment such as theice conditions and negative sea temperature. However, in the majority of the availablecost-effectiveness and risk analysis literature, the influence of the operating environmenton the cost and risk profile has received less attention. Hence, the aim of this paper is topropose a methodology for risk-based cost-effectiveness analysis (RB–CEA) of drillingwaste handling practices by considering the complex and fast-changing nature of theArctic. The central thrust of this paper is to highlight the fact that comparing differentalternatives based on the cost elements alone is misleading. The proposed methodologyuses risk assessment as a key component for the cost-effectiveness analysis (CEA). Theapplication of the proposed methodology is demonstrated by a case study of the drillingwaste handling practices of an oil field in the Barents Sea. The case study results demon-strate that the operating environment causes costs to be between 1.18 and 1.52 timesgreater, depending on the type of practices and operating season, in the Arctic offshorecompared with the North Sea. Further, the risk of undesirable events is between 1.48 and2.60 times greater during waste handling activities under Arctic operational conditions.[DOI: 10.1115/1.4032707]
Keywords: arctic, cost-effectiveness, drilling cuttings, drilling waste, risk analysis, oiland gas industry
1 Introduction
As the offshore industry expands into the Arctic and sub-Arcticareas, the oil and gas exploration activities generate all kinds ofwaste, varying from contaminated runoff water to material pack-aging; however, the majority of the waste is associated with thedrilling cuttings from drilling activities [1,2]. To maximize thevalue of each project and optimize their portfolio of investmentopportunities, oil and gas companies operating in the region areattempting to properly identify suitable methods for handling thedrilling waste. Current industry practice for managing and dispos-ing of drilling waste is broadly classified into three major catego-ries: (i) offshore discharge—treating and discharging the drillingwaste to the ocean (sea), (ii) offshore re-injection—re-injectingthe drilling waste offshore both in a dedicated re-injection welland/or in a dry (dead) well, and (iii) skip-and-ship—hauling thedrilling waste back to shore for further treatment and disposal [3].
In the past, offshore disposal was a popular method of wastemanagement practice in many parts of the world [4]. Thereafter,as many countries’ environmental awareness has grown, any oil-based mud from offshore must be hauled back to onshore for dis-posal or be injected underground at the well site [3]. However,most water-based muds (WBMs) and cuttings continue to be dis-charged to the ocean in many areas. At present, as drilling
operations become more demanding and move into environmen-tally sensitive areas such as the Arctic region, the requirementsfor managing offshore drilling waste are becoming stricter [3].Hence, methods to dispose of drilling wastes depend on the localoptions available, the nature of the waste, and prevailing regula-tions, as well as stringent waste-discharge guidelines [5].
The ranges of possible waste management solutions, the tech-nological advances, and the new concepts in Arctic drilling posetheir own peculiar demands and affect the waste managementdecision-making process [6–8]. When looking for a safe and sus-tainable solution to waste management problems associated withthe drilling and completion of oil wells in the Arctic offshore, costand prevailing legislation are the two main issues that need to beconsidered [9,10]. Hence, to support strategic decisions, it hasbecome vital to evaluate drilling waste handling practices for theircost-effectiveness [8,11,12]. CEA refers to “the consideration ofdecision alternatives in which both their costs and consequencesare taken into account in a systematic way” [13]. Typically, CEAfocuses on the costs of achieving the goals of the waste handlingactivities and the most efficient way of achieving them [11]. Itseeks to identify and place “dollars” on the costs of each of thewaste handling practices. Then, it relates these costs to specificmeasures of system effectiveness.
To identify cost-effective and efficient waste handling practicesfor Arctic offshore drilling, it has been argued that two questionsare fundamental [9,12]. First, which drilling waste handling prac-tice is estimated to be cost-effective and environmentally sustain-able, based on the prevailing evidence? Second, should furtherresearch be carried out in order to minimize the level of
1Corresponding author.Contributed by the Ocean, Offshore, and Arctic Engineering Division of ASME
for publication in the JOURNAL OF OFFSHORE MECHANICS AND ARCTIC ENGINEERING.Manuscript received December 18, 2015; final manuscript received January 22,2016; published online April 1, 2016. Assoc. Editor: Søren Ehlers.
Journal of Offshore Mechanics and Arctic Engineering JUNE 2016, Vol. 138 / 031301-1Copyright VC 2016 by ASME
Downloaded From: http://offshoremechanics.asmedigitalcollection.asme.org/ on 08/11/2016 Terms of Use: http://www.asme.org/about-asme/terms-of-use

uncertainty related to the decision? To answer these questions anddetermine the cost-effectiveness of the waste handling practices, anumber of studies have been carried out; see, e.g., Refs. [12–16].For instance, for better understanding of the overall life cyclecost, Gentil et al. [12] proposed a model for assessing the totalcost over the lifetime of the waste handling practices. Further,Kazanowski [14] discussed a standardized approach for carryingout a CEA of various waste handling practices.
Furthermore, to provide a basis for comparing alternative waysof achieving a certain benefit, aid safety design and offer a fair ba-sis for evaluating alternative drilling waste handling practices, anumber of quantitative risk assessment models have been devel-oped; see, e.g., Refs. [17–22]. For instance, Khakzad et al. [20]demonstrated the application of bow-tie and Bayesian networkmethods in conducting quantitative risk analyses of drilling opera-tions. Guo et al. [18] presented a monitoring and diagnostic analy-sis for managing uncertainties and risks related to a drill cuttingsre-injection process for a project offshore of Sakhalin Island.Abimbola et al. [17] proposed a dynamic safety assessmentapproach based on bow-tie analysis and a real-time barriers’ fail-ure probability assessment of offshore drilling operations.
However, in most of the available cost-effectiveness and riskanalysis literature discussed above, either cost or risk factor is theonly factor considered; and there is a lack of consideration of theimpact of the operating environment on the cost and risk profile.This is considered as a significant drawback, especially in a com-plex operational environment such as the Arctic region. This isparticularly important in the Arctic offshore operation because ofits slow, nonlinear, and potentially irreversible ecological andphysical process. The Arctic region has a harsh, sensitive, andchallenging environment, in which it is difficult to operate. Theregion is characterized by varying forms and amounts of icing,very strong winds, and polar lows, all of which can affect thecost- and risk profile of drilling waste handling practices. Forinstance, the offshore industry in the region is experiencing longerlead times due to frozen drilling cuttings being stuck in skipswhile waiting to get emptied onshore for further treatment [6].This means that the longer the lead-time, the higher the cost of thewaste handling practice will become. In addition, due to the envi-ronment, which is sensitive to disruption on one hand, but harshand unforgiving on the other, any mishap during the waste han-dling process can take longer to heal and cost more to remediatein the region [2,18,23].
Based on the above discussion, it is an important requirementto consider the impact of the operating environment when identi-fying those cost-effective drilling waste handling practices with alow level of risk for oil and gas companies operating under Arcticconditions. In this paper, a new RB–CEA methodology is pro-posed, which considers the complex and fast-changing nature ofthe Arctic. This paper seeks to identify the drilling waste handlingpractice that is expected to provide the highest level of benefit fora given level of cost, and which has a minimal impact on health,safety and environment (HSE).
The rest of the paper is organized as follows: Section 2 presentsthe proposed RB–CEA methodology. Section 3 describes an illus-trative case study and sensitivity analysis to demonstrate theapplication of the proposed methodology. Section 4 provides theconclusion.
2 Proposed RB–CEA Methodology
The proposed methodology is an integrated set of risk andCEA, principles, and general procedural guidelines. Figure 1 illus-trates specific steps that help the risk and cost analyst to find themost suitable alternative waste handling practices for Arctic off-shore drilling operations based on the expected risk and the costelement.
2.1 Stage 1: Define the Drilling Waste Handling Practices.As mentioned previously, in the Arctic region, waste handling
methods are generally dependent on the local practices available,the nature of the waste, and the prevailing regulations [5]. Hence,in the first stage, methods to dispose of the drilling waste, by con-sidering the operating environment of the region, should bedefined and analyzed. These include analyzing and assessing bothoffshore and onshore waste handling practices, such as offshoredischarge and offshore re-injection, and onshore practices, such aslandfill and composting. For instance, Fig. 2 illustrates a typicalprocedure prior to offshore discharge.
2.2 Stage 2: Risk Analysis. The key purpose of risk analysisis to support management in rational decision-making. Hence, theaim of this step is to identify and quantify the impact of the pecu-liar Arctic risk influencing factors (RIFs) on the drilling wastehandling practices. RIFs are the factors that potentially affect thebarriers and barrier performance [24]. As discussed previously, inthe Arctic offshore, the predominant RIFs are the climatic andenvironmental conditions, such as snowstorms, atmospheric andsea spray icing conditions. These factors depend on various varia-bles and they also interact with each other. Their interaction isvery complex and has a cumulative negative synergy effect on thedrilling waste handling practices and the personnel working inthat specific environment. In combination, these factors will deter-mine the performance of the drilling waste handling practices orthe suitability of new drilling waste handling technologies in theregion.
This risk analysis step attempts to estimate the frequency ofundesirable events and the magnitude of their consequences bydifferent methods. The risk in the context of this paper is the riskin monetary terms that arises due to the adverse effects of thepeculiar Arctic RIFs, such as solids-control system failures andequipment damage. In general, the classical risk product (RP),which is the expected negative outcome of undesirable event, i,can be expressed as follows:
RPUEiCUEi
;PUEið Þ ¼ E CUEi½ � � PUEi(1)
where
� RPUEiCUEi
;PUEið Þ is the monetized expected cost. The unitof risk is in $(USD) per time unit (e.g., year);
� PUEiis the probability or frequency of occurrence of undesir-
able event, i;� E CUEi½ � is the expected consequences (i.e., the financial
impact) due to the occurrence of undesirable event, i.
Fig. 1 The proposed RB–CEA methodology for the Arctic off-shore drilling waste handling practices
031301-2 / Vol. 138, JUNE 2016 Transactions of the ASME
Downloaded From: http://offshoremechanics.asmedigitalcollection.asme.org/ on 08/11/2016 Terms of Use: http://www.asme.org/about-asme/terms-of-use

In the Arctic offshore waste handling operations, especially inthe Barents Sea—the Norwegian part of the Arctic—there is lessexperience and less valid historical data regarding system failurerate and its associated consequence [25,26]. This is due to the lim-ited industrial activities in the region to date. The lack of sufficientreliable data and information about operating and environmentalconditions of the Arctic could increase the uncertainty associatedwith risk analysis [26]. Moreover, waste handling activities in theArctic region may face unforeseen challenges, which could alsoincrease the uncertainty and the risk involved [27,28]. The short-age of valid data could, for instance, be associated with the lackof a robust weather forecasting infrastructure, weather modeling,and inadequate forecasting techniques for the Arctic [29,30].
Hence, in the case of lack of valid historical data, expert judg-ment plays a crucial role during potential hazard and risk analysis[2,6]. Expert judgment is important for identifying and assessingall influencing factors, which can affect the waste handling systemperformance and safety of the system. In other words, expert judg-ment is practically always needed to complete the quantificationof the risk analysis [25]. Moreover, one brings in experts to pro-vide these judgments because they have developed the mentaltools needed to make sound evaluations [31]. These mental toolsinclude: “knowledge of what evidence can be brought to bear onthe question, the abilities to weigh the validity of various piecesof evidence and to interpret the relative importance of variousfacts or assertions, and to craft a view from an ensemble of infor-mation that may be inherently limited or self-conflicted” [31].However, in risk analysis these judgments can entail uncertainty.Further, the experience of the “qualified” risk analyst can also bea decisive factor in determining the subjective probabilities andconsequences of the undesirable events. Hence, to understandhow the uncertainties are involved in the risk assessment processsuch that they can be taken into consideration as a decision sup-port, elicited probability distributions need to be calibrated. Inaddition, performance-based weighting can help to reduce the biasand uncertainty distributions over the parameters.
Based on the above discussion, in the proposed methodology,the expert judgments are considered as an important source of in-formation to quantify the risk of undesirable events. Probabilitiesor frequencies of undesirable events are thus primarily obtainedfrom the judgments by experienced risk analysts. The financialloss (consequence) of the undesirable events includes severalfactors, such as cost of extended waste handling system (solids-control system) downtime ($), cost of idle work force ($), clean-up cost ($), and HSE cost ($).
2.3 Stage 3: CEA. When identifying and categorizing thecosts and benefits of waste handling practices in the Arctic operat-ing environment, a reasonable effort has to be made to identifythose costs that will have the most significant implications on thestrategic decision [32,33]. Hence, at this stage, the direct or
primary costs and benefits as well as indirect or secondary costsand benefits should be identified and analyzed. In general, theCEA process involves: (i) determining which cost variables affectthe cost-effectiveness of the chosen drilling waste handling solu-tion. This includes determining and analyzing: (a) internal costfactors, which arise because of company decisions and goals; thecompany largely manages these cost factors and, if necessary,they can be changed and (b) external cost factors, which are notcontrolled by the company but will influence the overall cost andthe decisions. (ii) Determining inherent risk factors for the chosendrilling waste handling practices and the company tolerance forthem. (iii) Determining the functional interdependence betweenthe cost and risk variables and the degree to which each of thesevariables can be controlled.
2.4 Stage 4: Risk Ratio (RR) and Cost-Effectiveness Ratio(CER). The next step in the proposed methodology is to estimatethe RR and CER for each of the alternative waste handling prac-tices. This will help to determine which waste handling practicecosts less per unit of treated (disposed of) drilling waste and pos-sesses the minimum negative HSE impact.
2.4.1 RR: Measure of Relative Effect of the Arctic OperatingEnvironment. RR is used to express the measure of relative effectthe operating environment of the Arctic region has compared tothat of a reference-operating region, for example, the North Sea. Itis the ratio of the risk of an undesirable event in both the Arcticand the reference region. This ratio shows how the RP will bechanged (increased or decreased) based on the effect of the oper-ating environment. The initial idea for the RR formulations comesfrom the calculation of RR, which is used in clinical experiments[34] for the estimation of the clinical importance of a giventreatment.
Suppose our data comprise a series of observations, in which anundesirable event has occurred or not, and we wish to comparethe probability of such events with the consequence under Arcticand reference-operating conditions. For the two operating envi-ronments with probabilities, PARi
and PREFi, and consequences,
CARiand CREFi
, the RRW of a particular drilling waste handlingpractice W is given as
RRW ¼
Pni¼1
E CARi½ �PARi
Pni¼1
E CREFi½ �PREFi
(2)
where
� E CARi½ � and E CREFi½ � are the expected consequences of unde-sirable events in the Arctic and reference-operating region,respectively.
Fig. 2 Generic offshore discharge flowline
Journal of Offshore Mechanics and Arctic Engineering JUNE 2016, Vol. 138 / 031301-3
Downloaded From: http://offshoremechanics.asmedigitalcollection.asme.org/ on 08/11/2016 Terms of Use: http://www.asme.org/about-asme/terms-of-use

� PARiand PREFi
are the probabilities of undesirable events inthe Arctic and reference-operating environments,respectively.
� i indicates the undesirable events, i¼ 1,…, n.
The RRs are useful to describe the multiplication of the riskthat occurs due to the operating environment of the Arctic region.For instance, an RR of 2.5 for a specific drilling waste handlingpractice implies that the operating environment of the Arcticincreases the risk of events by 100� (RRW� 1)%¼ 150%. Simi-larly, an RR of 0.5 is interpreted as the probability of a risk eventin the Arctic region being half of that in the reference area. Thenumerical value of the estimated RR must always be between 0and 1=RPREFð Þ.
Further, it is convenient to work with the natural logarithm ofthe RR so that it takes on the values of the whole range between�1 and þ1. Hence, log(RR) can be expressed as:
log RRWð Þ ¼ h ¼ logXn
i
E CARi½ �PARi
!
� logXn
i
E CREFi½ �PREFi
!(3)
To assist the interpretation of log(RRW) and, for small values ofh¼ log(RRW), h can be approximated as follows:
h � log 1þ hð Þ (4)
For instance, log(RRW)¼ 0.2 corresponds roughly toRRW¼ 1.22 or 22% risk increase (the exact figure isRRW¼ 1.2214). Thus, in general, 100� log(RRW) is approxi-mately the percentage change (increased or decreased) in risk.
2.4.2 Stage 4.2: CER. The CER is a ratio in which the denom-inator is the unit of effectiveness and the numerator is the presentvalue of the cost of a particular waste handling practice. Units ofeffectiveness are a measure of any quantifiable outcome central tothe drilling waste management objectives. In drilling waste man-agement, the total volume of drilling waste treated (disposed of)would be the most important outcome and would be an obviousunit of effectiveness. The result can then be interpreted as $perunit ton of drilling waste treated (disposed of). Mathematically,CER for a specific waste handling practice in the Arctic operatingenvironment, based on Cellini and Kee [35], can be described as
CERARW¼ PVCART
UARW
(5)
where
� UARWis the unit of effectiveness of waste handling practice
W.� PVCART
is the present value of cost of waste handling prac-tice W, and is given by
PVCART¼ TCAR1 þ
TCAR2
1þ rð Þ1þ TCAR3
1þ rð Þ2þ ::::þ TCARt
1þ rð Þt�1
¼XT
t�1
TCARt
1þ rð Þt�1(6)
where� TCARt
is the annualized total cost of waste handlingpractice, W.
� t indicates the year from 1 to T (the last year of the analysis).
� r is the discount rate, which is meant to reflect society’simpatience or preference for consumption today over con-sumption in the future.
Cost-effectiveness ratio results are very sensitive to the choice ofthe discount rate, and thus an appropriate choice of the discount rateis critical; there is ongoing and considerable debate as to the appro-priate rate; see, e.g., Stern [36], Lopez [37], and Cellini and Kee[35]. In this paper, the classical discount rate of 3% suggested byCellini and Kee [35] is considered for computational convenience.
2.5 Stage 5: Sensitivity Analysis and Recommendation. Inthe last stage, a sensitivity analysis should be carried out and arecommendation should be drawn: (i) Sensitivity analysis—itspurpose is to identify the key cost variables and their potentialimpact in terms of changes in the annualized total cost and presentvalue cost. Partial and extreme cases are the two common sensi-tivity analyses. The partial approach varies one assumption (orone parameter or number) at a time, holding all else constant [35].On the contrary, extreme case sensitivity analysis varies all of theuncertain parameters simultaneously, picking the values for eachparameter that yields either the best- or worst-case scenario [35].(ii) Recommendation—the recommendation should comply withstringent drilling waste-discharge guidelines, such as zero“hazardous” discharge requirements, and compliance with therequirement of best environmental practice as well as best avail-able techniques (BATs) [5]. For instance, for offshore drillingactivities in the Norwegian part of the Barents Sea, the Norwegianregulators insist that the drilling waste shall not be discharged tothe ocean (sea) if the content of formation oil, other oil, or basefluid in organic drilling fluid exceeds 10 g per kilo of dry mass[38]. Moreover, in cases where BAT is not sufficient, new tech-nologies qualified for cold areas should be developed. That meansthe systems should be specialized or tailor-made for cold areas.One such technology could be the application of a winterizationprocedure in the Arctic offshore facilities. Further, more reliablesystem can be designed incorporating nontraditional arrangementsand unconventional technologies, by considering the Arctic opera-tional condition.
Afterward, the approved recommendation should be monitoredby establishing the risk- and cost-monitoring program. That meansthe monitoring program has to include the follow-up of the per-formance of the chosen practices and the overall waste handlingprocess, emphasizing what does work, what does not work, andwhat continues to work. Further, there should be a feedback loopwhere the recommendations should help to review the risk analy-sis process and the choice of the alternatives. This loop helps todetect any changes in the operating environment and their effecton the risk profile and cost element.
3 An Illustrative Case Study
The proposed RB–CEA methodology will be illustrated via theevaluation of the drilling waste management practices for theJohan Castberg oil field development project. The Johan Castbergfield (formerly Skrugard and Havis) is an oil field developmentproject in the Barents Sea (part of the Norwegian Arctic) locatedabout 200 km from the nearest Ingøya Island, in Finnmark, north-ern Norway [39]. The development scheme for Johan Castberg isunder continuous update by Statoil—the operator of the oil field.The development plan includes installation of a floating produc-tion unit or floating production storage and offloading unit with a280 km long pipeline to shore and an onshore oil terminal atVeidnes, outside Honningsvag, in Finnmark, northern Norway[39]. However, there are significant cost differences between aconcept based on offshore oil offloading and a concept based onbringing the oil to shore in a pipeline. Hence, Statoil and its part-ners are involved in a continuous process to optimize the opportu-nities in the area and the timing of the project activities [39].Figure 3 illustrates the field location and key field data.
031301-4 / Vol. 138, JUNE 2016 Transactions of the ASME
Downloaded From: http://offshoremechanics.asmedigitalcollection.asme.org/ on 08/11/2016 Terms of Use: http://www.asme.org/about-asme/terms-of-use

The bottom line principle in the Barents Sea is that the oil andgas exploration activities shall be at least as safe as they are in theNorth Sea [40]. In this case study, the North Sea is thus consid-ered as a reference region. The case study emphasized the mea-surement of the relative effect of the Arctic operatingenvironment when the decision maker tries to identify the mostcost-effective commercially available waste handling practiceswith minimum level of HSE risks for oil and gas companies oper-ating in the Arctic. Further, the other main focus of the case studyis to evaluate the applicability and suitability of the availablewaste handling systems, without considering winterization, forArctic operations.
3.1 Define the Drilling Waste Handling Practices. For theJohan Castberg development project, the operator plans to drill 38wells in total, including 22 production wells, 12 water injectionwells, and four gas injection wells [39]. As part of the develop-ment solution, and to propose the ideal drilling waste handlingsolutions, this paper evaluates the risk and examines the cost-effectiveness of the commercially available practices in theregion. These include estimating the cost and predicting the riskof: (i) offshore discharge, (ii) offshore re-injection, and (iii) skip-and-ship.
Table 1 presents a summary of the well sections, section length,rate of penetration (ROP), volume of the generated drilling waste(fluids and cuttings), and the washout (an enlarged section of thewellbore caused by removal of formation grains during drillingand/or circulation). The well data is taken from a Statoil [39]report. The water-based drilling fluid system would be applied;and for the top hole sections, the fluid systems consist entirely ofthe pose little or no risk to the environment (PLONOR) list of
green chemicals. The only yellow chemical to be used in the dril-ling fluid system is the glycol-based substance GEM GP, on thetwo bottom sections (sections 121=4” and 81=2”). The assumed den-sities are 2.3 and 1.2 for cuttings and fluid, respectively. Theoreti-cally, the volume of drilling cutting can be estimated by
Theoretical hole volume
m3ð Þ ¼ pD
2
� �2
L (7)
where D is a well diameter (m) and L is a section length (m).It is assumed that all the wells have the same configurations
and that the proposed practices should cope with the expected rateof drilling waste generation, which is generated at an average120 m/day ROP. However, in the case of re-injection, based onpast experience, the rate of drilling waste generation will most of-ten be higher than the rate of injection, during the two top sections(section 36” and 171=2”). Thus, in such cases, other practices willbe utilized in addition to the re-injection.
3.2 Risk Analysis. The basic assumptions in this risk analysisare: a year-round operational window and there is no winterizationor enclosure of the waste handling systems to protect the vulnera-ble areas. As mentioned previously, in the Arctic offshore wastehandling operations, especially in the Barents Sea, there is a lackof historical system failure rate data. Hence, judgments providedby those people with expertise in identifying potential hazards andrisks of undesirable events are utilized at various stages of thisrisk analysis in order to perform effective risk identification andquantification. Their expertise is used to analyze historical
Fig. 3 Johan Castberg oil field Statoil [39]
Table 1 Total volume of the generated drilling waste per well
Drilling waste
Fluid Cutting Total waste
SectionSection length
(m)ROP
(m/day)Drilling time
(day) (m3) (MT) (m3) (MT)Washout
(%) (m3) (MT)
36” 63 150 0.42 227 522.1 41 49.20 10 272.10 576.22
17 1=2” 395 150 2.63 666 1531.8 61 73.20 10 733.10 1612.32
12 1=4” 280 120 2.33 105 241.5 84 100.80 5 193.20 347.34
8 1=2” 575 75 7.67 129 296.7 21 25.20 5 151.05 323.16
Total 13.05 1127 2592.1 207 248.40 1349.45 2859.04
Journal of Offshore Mechanics and Arctic Engineering JUNE 2016, Vol. 138 / 031301-5
Downloaded From: http://offshoremechanics.asmedigitalcollection.asme.org/ on 08/11/2016 Terms of Use: http://www.asme.org/about-asme/terms-of-use

information, define and analyze potential hazards, and evaluatethe consequence of undesirable events.
Selecting the experts: The experts have been selected based onthe criteria suggested by Ortiz et al. [41], which state that expertscollectively should represent a wide variety of background andexperience. The experts are selected based on their publication re-cord, their direct involvement, and consulting as well as managingresearch projects in the related areas. The selected experts are twotypes of experts—academics and professionals with hands-onexperience, having expertise in risk analysis, waste handling andmanagement, drilling and reliability engineering, meteorology,cold-climate technology, and offshore engineering, with 5 to15 years of experience in their respective fields.
Posing questions to the experts: At this stage, the questionnairesare prepared by describing the potential hazards and undesirableevents. The potential hazards are suggested for use as guidance,and consequence (potential loss) categories are also provided. Theconsequence rating categories and the questionnaire used for elic-iting information from experts are presented in the Appendix(Tables 13 and 14). Thereafter, the selected experts are informedabout the operational environment in the reference area, i.e., theNorth Sea and the target area, i.e., the Barents Sea.
Suppose that we have UEN number of undesirable events. Theexperts were asked to provide their degree-of-belief probabilitiesand consequences rating of each undesirable event. Then, theprobabilities of the undesirable events are denoted as Pi0:05
, whichis designated as the lower value; Pi0:50
, which is interpreted as themedian value; and Pi0:95
, which is interpreted as the 95% percen-tile value (the expert conservative judgment about the undesirableevent i). In addition, the experts are also asked to give their bestjudgment about the lower Ci0:05
, median, Ci0:50, and the conserva-
tive, Ci0:95consequences ratings for each of the undesirable events.
Table 2 shows a sample of the experts’ judgments (both themedian and conservative probabilities as well as the consequenceratings) for a system installed in the Arctic, their working experi-ence in years, and normalized and non-normalized performance-based weight for each expert.
The quality of the expert judgments: Since degree-of-beliefprobabilities are personal and vary from expert to expert and fromtime to time, there is no “true” probability that one might use as ameasure of the accuracy of a single elicited probability [31]. Toillustrate the kinds of distortion that are possible in the specifica-tion of weighted distributions for the degree-of-belief probabil-ities, six experts were asked to specify 5% (lower), 50% (median),and 95% (upper) values for the solids-control system failure prob-abilities. These parameters included the probability of failure ofthe shale shakers and screw conveyors; storage containers, bufferand recovery tanks; filtering and slope water treatment unit fail-ure; and cutting drier unit failure. Figure 4 depicts the cumulativefindings of the interexpert variation, expressed for brevity of pre-sentation in terms of a typical solids-control system failure’sparameters.
The results show that expert 1 can be regarded as over-confident and biased; expert 3 is well calibrated but uninforma-tive; the other experts can be regarded as well calibrated andinformative. Hence, the desirability of some form of calibrationfor experts is apparent. In general, calibration refers to the“faithfulness of probabilities in that events that are assigned aprobability p should occur with a relative frequency of p” [31]. Inorder to address the goodness of the probabilities, the followingtwo properties are desirable [31]:
(i) Degree-of-belief probabilities should be informative and(ii) degree-of-belief probabilities should authentically repre-
sent uncertainty.
Further, Chang et al. [42] suggested convergence, as a means ofvalidating judgment results. Convergence, in general, can beachieved by asking the same basic question in several differentways [42]. Hence, to check the fulfilment of the above two proper-ties and assess the quality of experts’ judgments, the elicited
probability distributions have been calibrated. Thereafter, the cali-bration score and information score are used to determine the non-normalized performance-based weight for expert i. In this riskanalysis, experts are scored on the basis of answers to the ques-tions for which the answer is only known to the analyst. Accord-ing to Cooke [43], the non-normalized performance-based weightfor expert i, knnwi
is proportional to calibration score times infor-mation score, and it can be expressed mathematically as follows:
knnwi/ C Eið Þ � I Eið Þ (8)
where knnwiis the non-normalized performance-based weight for
expert i, C Eið Þ represents the calibration score for expert i, andI Eið Þ represents the information score for expert i.
The estimated non-normalized and normalized performance-based weights for each expert i are summarized in Table 2.
Aggregating the expert judgments: In order to aggregate theexperts’ judgments, the following expert aggregation method isused:
PUE UEð Þ ¼Xn
i¼1
knwiPUEi UEið Þ (9)
where PUE UEð Þ is the aggregated expert judgment probability ofundesirable event, knwi
is the normalized performance-basedweight for expert i and is given as
knwi¼ knnwiPn
i¼1
knnwi
(10)
Thereafter, for each drilling waste handling option, the aggre-gated values, by considering the normalized experts’performance-based weight, are estimated and discussed below.
Offshore discharge: After coming to the platform, drilling wastehas to pass through a series of pretreatments, such as chemical,mechanical, thermal, or biological processes before discharge tothe ocean (sea). To evaluate the peculiar operational risks of theoffshore discharge practice, it is then important to map the pre-dominant risks related to the susceptible areas. Thus, these areasare identified, and potential hazards and undesirable events arepostulated and presented in Table 3. Further, the median and 95%percentile aggregated probabilities and the expected consequencevalue, for both Arctic (AR) and North Sea (NS), are depicted inTable 4.
Offshore re-injection: The re-injection technology involvesgrinding or processing the solids (cuttings) into small particles,mixing them with water or some other liquid to make a slurry, andinjecting the slurry into an underground formation at pressureshigh enough to fracture the rock [3]. For the offshore re-injectionrisk analysis, the main assumption is that a dedicated well is usedfor the waste disposal and that the geologic conditions in the dril-ling area are favorable for the slurry re-injection. The potentialhazards and undesirable events for both offshore re-injection andskip-and-ship practices are presented in the Appendix (Table 15).Table 5 presents the median and 95% percentile aggregated prob-abilities and the expected consequence value for both AR and NS.
Skip-and-ship: During skip-and-ship practice, cuttings are col-lected and transferred to a suitable location for loading within thedrilling platform. Then, the drill waste is loaded (transferred) intoskips via a steerable chute. Afterward, full skips have to be hauledback to shore using a dedicated collection vessel or a standardplatform supply vessel (PSV). Hence, the analysis of the riskshould then cover the estimation of the RP of: (i) collecting andprocessing the drilling waste offshore and (ii) transporting or haul-ing the drilling waste to shore. A PSV with ice class ICE-1A andDe-ice notation has been considered for the logistics of the dril-ling waste and year-round operation in the Arctic offshore envi-ronment. Table 6 summarizes the estimated RPs of offshore
031301-6 / Vol. 138, JUNE 2016 Transactions of the ASME
Downloaded From: http://offshoremechanics.asmedigitalcollection.asme.org/ on 08/11/2016 Terms of Use: http://www.asme.org/about-asme/terms-of-use

operation and any failure mode or undesirable events related tothe assumed PSV.
3.3 CEA. Ex-ante CEA is applied to assess the expected costof the given waste handling alternatives and to estimate the rela-tive effect of the Arctic on the total cost compared with the NorthSea. The cost-related data have been collected using differentsources via meetings and discussion with drilling waste treatmentplant operators; owners of waste containers, container trucks, andsuper-sucker trucks; and suppliers of offshore services. The fol-lowing steps were followed to estimate the cost elements for eachwaste handling option. The steps will be discussed by consideringthe skip-and-ship option as an example.
Logistics and shipping: The total volume of drilling waste thatneeds to be processed, treated, and disposed of is estimated to be2859.04 MT per well, which is equal to 1349.45 m3 per well. Ingeneral, wherever possible the drilling waste from the 36’’ and171=2’’ hole sections should be drilled with WBM consistingentirely of the PLONOR list of green chemicals and the waste dis-charged offshore. To manage the cuttings from the two lower holesections, the number of skips required is estimated. The averageskip volume capacity is considered to be 4 m3. Thus, for the
344 m3 of waste (the summation of the total waste for the 121=4’’and 81=2’’ hole sections), the required number of skips is 86. How-ever, due to the potential of uneven packing of the drilling waste,the number of skips will most often increase by 1.5 times the esti-mated total number of skips. Hence, the number of required skipswill be 129 for the two lower hole sections. Typical PSVs havethe capacity for 100 skips, which may not be enough to handle theentire 121=4’’ and 81=2’’ hole sections. In this case, turnaroundtimes must be considered, as well as the possible requirement fora second vessel to cover the changeover period. In some cases,due to statutory legislation, offshore discharge for the two upperhole sections can be hindered. In such cases, in order to proceedwith the drilling operation, the cuttings should be hauled back toshore for disposal. In this case, the number of skips required willbe higher, equal to 507 per well (for a total volume of 1349.45 m3
drilling waste).Weather effects: The loading of mud skips or containers onto
the transport ship by the use of cranes is a slow process, andsevere weather can significantly affect the waste handling process.In general, loading and lifting operations will stop, when windspeed exceeds 40 knots, or possibly 30 knots for floating installa-tions [45]. In addition, for full cuttings skips, a limit of 3.5 m criti-cal wave height is recommended as a guideline. For instance, forNorth Sea skip-and-ship operations, the annual average time thatthe 40 kt and 30 kt wind speeds exceeded is only 2.2% and 12%of the time, respectively, Ref. [45]. However, the 3.5 m waveheight limit is exceeded more often. Table 7 depicts the seasonalvariation of the percentage of the time the significant wave heightexceeds 3.5 m.
Based on these seasonal variations of wind speed and waveheight, an estimation of likely downtime has been carried out. Byconsidering the expected downtime, the estimated average drillingtime is 13 rig days per well in the North Sea (reference-operatingenvironment). Moreover, in addition to the “expected” downtimein the North Sea, for Arctic skip-and-ship operation, it is advisableto consider the downtime periods due to extended delays causedby the harsh operating condition of the region. For instance, asmentioned above, during winters the skip-and-ship operation inthe Arctic experiences long lead times due to drilling cuttingsbeing frozen, stuck in skips while waiting to get emptied onshorefor further treatment [6]. Further, in some areas of the Arcticregion, between 65 and 70% extra costs incurred during drilling
Table 2 A sample of experts’ judgments elicited for shale shaker failure in the arctic
Expert i 1 2 3 4 5 6
Experience (years) 7 5 12 10 15 9Background Acad. Acad. Pro. Pro. Pro. Pro.Performance-based weights Non-normalized 0.467 0.333 0.800 0.667 1.000 0.600
Normalized 0.121 0.086 0.207 0.172 0.259 0.155Pi0.50/Pi0.95 0.953/0.994 0.926/0.966 0.951/0.992 0.901/0.940 0.923/0.963 0.851/0.888Ci0.50/Ci0.95 1/3 2/3 2/4 1/3 2/5 1/3
Acad.—academic and Pro.—professional.
Fig. 4 Interexpert variation in 5%, 50%, and 95% estimates ofundesirable events in the North Sea offshore drilling waste han-dling operation
Table 3 The potential hazards and undesirable events for offshore discharge practice
ID Potential hazards Undesirable events
UE1 Negative air temperature and ice accretion Shale shakers and screw conveyors failure
UE2 Atmospheric icing and negative air temperature Storage containers, buffer, and recovery tanks failure
UE3 Icicles, atmospheric icing, and negative air temperature Vacuum unit failure
UE4 Rime, glaze, snow, and icicles Filtering and slope water treatment unit failure
UE5 Negative air temperature, rime, glaze, and snow Cutting drier unit failure
UE6 Atmospheric icing and negative air temperature Centrifuges failure
UE7 Low temperature, rime, glaze, and snow Cutting blower pump failure
UE8 Freezing temperature and ice accretion Flexible hose failure
UE: undesirable events.
Journal of Offshore Mechanics and Arctic Engineering JUNE 2016, Vol. 138 / 031301-7
Downloaded From: http://offshoremechanics.asmedigitalcollection.asme.org/ on 08/11/2016 Terms of Use: http://www.asme.org/about-asme/terms-of-use

Table 4 The estimated RPs for offshore discharge practice
North sea (NS) Arctic (AR)
ID Pi0.50/Pi0.95 E[Ci0.50]/E[Ci0.95] RPi0.50/RPi0.95 Pi0.50/Pi0.95 E[Ci0.50]/E[Ci0.95] RPi0.50/RPi0.95
UE1 0.537/0.560 300,000/5,000,000 161,100/2,800,000 0.918/0.958 300,000/10,000,000 275,400/9,580,000UE2 0.502/0.524 50,000/2,000,000 25,100/1,048,000 0.890/0.928 50,000/2,000,000 44,500/1,856,000UE3 0.492/0.513 50,000/2,000,000 24,600/1,026,000 0.891/0.930 300,000/5,000,000 267,300/4,650,000UE4 0.545/0.569 50,000/2,000,000 27,250/1,138,000 0.938/0.978 50,000/2,000,000 46,900/1,956,000UE5 0.489/0.511 300,000/5,000,000 146,700/2,555,000 0.901/0.940 300,000/5,000,000 270,300/4,700,000UE6 0.564/0.588 50,000/2,000,000 28,200/1,176,000 0.881/0.919 50,000/5,000,000 44,050/4,595,000UE7 0.548/0.572 300,000/5,000,000 164,400/2,860,000 0.896/0.935 300,000/10,000,000 268,800/9,350,000UE8 0.513/0.535 50,000/2,000,000 25,650/1,070,000 0.911/0.950 300,000/5,000,000 273,300/4,750,000
Summation of RPPn
i E½CNSi�PNSi
603,000/13,673,000Pn
i E½CARi�PARi
1,490,550/41,437,000
log ðPn
i E½CNSi�PNSi
Þ 5.78/7.14 log ðPn
i E½CARi�PARi
Þ 6.17/7.62
Table 5 The estimated RPs for offshore re-injection practice
North sea (NS) Arctic (AR)
ID Pi0.50/Pi0.95 E[Ci0.50]/E[Ci0.95] RPi0.50/RPi0.95 Pi0.50/Pi0.95 E[Ci0.50]/E[Ci0.95] RPi0.50/RPi0.95
UE1 0.537/0.560 300,000/5,000,000 161,100/2,801,349 0.918/0.958 300,000/10,000,000 275,400/9,577,797UE2 0.511/0.533 50,000/2,000,000 25,550/1,066,286 0.874/0.911 300,000/2,000,000 262,066/1,822,813UE3 0.498/0.520 300,000/2,000,000 149,400/1,039,159 0.851/0.888 300,000/2,000,000 255,399/1,776,441UE4 0.513/0.535 50,000/5,000,000 25,650/2,676,149 0.877/0.915 300,000/5,000,000 263,092/4,574,869UE5 0.502/0.524 50,000/2,000,000 25,100/1,047,506 0.858/0.895 300,000/5,000,000 257,450/4,476,773UE6 0.578/0.603 300,000/2,000,000 173,400/1,206,093 0.911/0.950 300,000/5,000,000 273,300/4,752,382UE7 0.148/0.154 2,000,000/5,000,000 296,000/772,066 0.253/0.464 5,000,000/10,000,000 1,265,028/4,640,000UE8 0.130/0.136 300,000/5,000,000 39,000/678,166 0.222/0.442 300,000/10,000,000 66,670/4,420,000UE9 0.150/0.156 300,000/5,000,000 45,000/782,499 0.256/0.498 2,000,000/5,000,000 512,849/2,490,000UE10 0.124/0.129 300,000/10,000,000 37,200/1,293,733 0.212/0.421 2,000,000/10,000,000 423,955/4,210,000
Summation of RPPn
i E½CNSi �PNSi 977,400/13,363,009Pn
i E½CARi �PARi 3,855,209/42,741,075
log ðPn
i E½CNSi�PNSi
Þ 5.99/7.13 log ðPn
i E½CARi�PARi
Þ 6.59/7.63
Table 6 The estimated RPs for skip-and-ship practice
North sea (NS) Arctic (AR)
ID Pi0.50/Pi0.95 E[Ci0.50]/E[C0.95] RPi0.50/RPi0.95 Pi0.50/Pi0.95 E[Ci0.50]/E[C0.95] RPi0.50/RPi0.95
UE1 0.510/0.532 300,000/2,000,000 153,000/1,064,199 0.872/0.910 2,000,000/5,000,000 1,743,687/4,548,116
UE2 0.055/0.057 5,000,000/10,000,000 275,000/573,833 0.094/0.098 5,000,000/10,000,000 470,112/980,966
UE3 0.532/0.555 300,000/2,000,000 159,600/1,110,106 0.909/0.949 300,000/5,000,000 272,836/4,744,309
UE4 0.250/0.261 2,000,000/5,000,000 500,000/1,304,166 0.427/0.446 2,000,000/10,000,000 854,748/4,458,937
UE5 0.532/0.555 2,000,000/5,000,000 1,064,000/2,775,266 0.909/0.949 5,000,000/10,000,000 4,547,263/9,488,618
Summation of RPPn
i E½CNSi�PNSi
2,151,600/6,827,571Pn
i E½CARi�PARi
7,888,646/24,220,946
log ðPn
i E½CNSi�PNSi
Þ 6.33/6.83 log ðPn
i E½CARi�PARi
Þ 6.90/7.38
Additional RP—to consider the risks duringcollection and transferringof the drilling waste offshorelog ð
Pni E½CNSi
�PNSiÞ 5.78/7.14 log ð
Pni E½CARi
�PARiÞ 6.17/7.62
Total RP 12.11/13.97 13.07/15.00
Table 7 Seasonal variations in the percentage of the time the significant wave height exceeds 3.5 m in the North Sea, adaptedfrom Ref. [45]
Month Jan. Feb. Mar. Apr. May Jun. Jul. Aug. Sep. Oct. Nov. Dec.
% of wave height �3.5 m 55 44 44 19 7 3 1 3 20 33 42 53
031301-8 / Vol. 138, JUNE 2016 Transactions of the ASME
Downloaded From: http://offshoremechanics.asmedigitalcollection.asme.org/ on 08/11/2016 Terms of Use: http://www.asme.org/about-asme/terms-of-use

waste handling activities are weather related [46]. Hence, frompast experience and based on expert judgment, the average dril-ling time in the Arctic operating conditions is considered to be 1.7times higher than that of the North Sea. Hence, for the cost esti-mation, the drilling time is considered to be 22 rig days per well
in the Arctic region and 13 rig days per well in the North Sea. Thetotal drilling operation period thus will be 836 days for 38 wellsfor the Arctic operation.
Cost breakdown analysis: The dock charges, installation costs,costs related to nonconformances, operation costs per day, skip
Fig. 5 Cost elements for skip-and-ship operation in the Arctic
Table 8 Cost elements per well drilled ($ as of 2012)
Operatingperiod (days)
Totalcost ($)
Cost elements No. of items NS AR Unit cost ($) NS AR
Offshore discharge Cost of design andengineering: compliance testingcost, cost of discharge modeling,field monitoring programs’ cost, etc.
25,000.00 25,000.00 25,000.00
Solid control equipment costInstallation of shale shaker,mud cleaners or centrifuges
1 35,000.00 35,000.00 35,000.00
Desander and desilters 3 5,000.00 15,000.00 15,000.00
Mud tank 1 65,000.00 65,000.00 65,000.00
Mud agitator 6 7,000.00 42,000.00 42,000.00
Generator 2 60,000.00 120,000.00 120,000.00
Base cost: staffing per day 4 13 22 450.00 23,400.00 39,600.00
Total cost of offshore discharge per well ($) 325,400.00 341,600.00
Offshore re-injection Cost of design andengineering: cost ofdedicated re-injection welland installation costs
1 40,000,000.00 45,000,000.00
Equipment costCost of slurrificationsystem
Operational 1 13 22 1,800.00 23,400.00 39,600.00Stand by 1 13 22 1,250.00 16,250.00 27,500.00
Cost of data monitoring package 1 13 22 900.00 11,700.00 19,800.00
Cost of mud holding tank 1 13 22 500.00 6,500.00 11,000.00
Cost of injection pump skid 1 13 22 3,700.00 48,100.00 81,400.00
Operation cost: cost ofpower consumption
1 13 22 1,450.00 18,850.00 31,900.00
Total cost of offshore re-injection per well ($) 40,124,800.00 45,211,200.00Skip and ship From shaker to the boat
Personnel 4 13 22 420.00 21,840.00 36,960.00
Skip (container) rent 507 13 22 20.00 131,820.00 223,080.00
Equipment cost(conveyor rental)
Operational 1 13 22 250.00 3,250.00 5,500.00Stand by 1 13 22 160.00 2,080.00 3,520.00
Transport: costs ofvessels including supply boat
1 1 2 30,000.00 30,000.00 60,000.00
Treatment costs: wastetreatment on land-based treatment plant
1349.45 100.00 134,945.00 134,945.00
Base cost: staffing, rent of a skipper, etc. 1 13 22 140.00 1,820.00 3,080.00
Total cost of skip-and-ship per well ($) 325,755.00 467,085.00
Journal of Offshore Mechanics and Arctic Engineering JUNE 2016, Vol. 138 / 031301-9
Downloaded From: http://offshoremechanics.asmedigitalcollection.asme.org/ on 08/11/2016 Terms of Use: http://www.asme.org/about-asme/terms-of-use

rental (per skip per day), cost of vessel, and treatment cost for unitton/kilo of drilling waste have been estimated. The cost break-down analysis for the skip-and-ship practice for Arctic operationis illustrated in Fig. 5. Further, Table 8 presents the resulting costelements, as of year 2012, per well drilled—for offshore dis-charge, offshore re-injection, and skip-and-ship.
The result shows that the cost of re-injection in a dedicated wellis higher than that of the two other practices for both regions.Comparing the cost of offshore discharging practice with skip-and-ship, for both the North Sea and the Arctic region, the costappears to be comparable when the volume of waste is low. How-ever, as the volume of the waste increases, the skip-and-ship
practice shows cost increment. Further, the effect of the operatingenvironment of the Arctic region on the cost element becomesmore significant as the volume of the waste increases. Table 9demonstrates that these adverse effects cause between 1.18 and1.52 times higher costs in the Arctic compared with the NorthSea. In addition, a semilogarithmic plot of the total cost of skip-and-ship in North Sea and Arctic versus number of wellspresented in Fig. 6.
3.4 CER and RR. The CERs for offshore discharge, offshorere-injection, and skip-and-ship practices are estimated and the
Table 9 Total cost of waste handling practices ($ as of 2012)
Discharge to ocean Re-injection Skip-and-ship
No. of wells NS AR NS AR NS AR
1 325,400 341,600 40,124,800 45,211,200 325,755 467,0855 442,400 539,600 40,657,800 46,113,200 1,598,775 2,245,42510 559,400 737,600 41,190,800 47,015,200 3,227,550 4,520,85015 676,400 935,600 41,723,800 47,917,200 4,826,325 6,766,27520 793,400 1,133,600 42,256,800 48,819,200 6,425,100 9,011,70025 910,400 1,331,600 42,789,800 49,721,200 8,053,875 11,287,12530 1,027,400 1,529,600 43,322,800 50,623,200 9,652,650 13,532,55035 1,144,400 1,727,600 43,855,800 51,525,200 11,511,425 15,777,97538 1,214,600 1,846,400 44,175,600 52,066,400 12,228,690 17,149,230
Fig. 6 A semilogarithmic plot of the total cost of skip-and-ship in North Sea andArctic versus number of wells. Notice that while the horizontal (No. of drilled wells)axis is linear, with the number of drilled wells evenly spaced, the vertical (total costof skip-and-ship) axis is logarithmic with the evenly spaced division being labeledwith log [cost of skip-and-ship]
Table 10 Estimated CERs
PVC ($) CER ($ per unit ton)
Options Total waste volume (ton) r (%) NS AR NS AR
Offshore discharge 108,453.52 3 1,196,911.65 1,819,510.68 11.04 16.78Offshore re-injection 162,680.28 3 43,532,266.02 51,308,151.46 267.59 315.39Skip-and-ship 108,453.52 3 12,198,417.82 17,490,746.07 112.48 161.27
Table 11 Estimated median and 95% percentile RRs
Options log ðPn
i E½CNS0:50�PNS0:50
Þ log ðPn
i E½CAR0:50�PAR0:50
Þ RR0:50 log ðPn
i E½CNS0:95�PNS0:95
Þ log ðPn
i E½CAR0:95�PAR0:95
Þ RR0:95
Offshore discharge 5.78 6.17 1.48 7.14 7.22 1.08Offshore re-injection 5.99 6.59 1.82 7.13 7.63 1.65Skip-and-ship 12.11 13.07 2.61 13.97 15.00 2.80
031301-10 / Vol. 138, JUNE 2016 Transactions of the ASME
Downloaded From: http://offshoremechanics.asmedigitalcollection.asme.org/ on 08/11/2016 Terms of Use: http://www.asme.org/about-asme/terms-of-use

results are depicted in Table 10. When estimating the presentvalue of cost (PVC), 3% discount rate (r) and T (the last year ofthe analysis) equals 2 years are considered. In addition, the caseof offshore re-injection, the total waste volume has been multi-plied by the factor 1.5 in order to consider the addition of water orsome other liquid to make slurry before re-injection.
The CER result shows that offshore re-injection practice is sig-nificantly more expensive than offshore discharge and skip-and-ship practices. Further, it can be deduced that the cost of discharg-ing the waste offshore is ten times less than the skip-and-shippractice and almost 20 times less than the offshore re-injectionpractice, in the case of Arctic drilling waste handling operations.The CER estimation demonstrates that offshore discharge practiceis the cheapest one for Arctic offshore drilling waste handlingoperations, in comparison to the other two practices, based on theconsidered assumptions.
Moreover, the RRs are estimated for each practice and theresults are presented in Table 11. The results demonstrate that theoperating environment of the Arctic region increases the risk ofundesirable events by 1.48 times during the offshore dischargepractices when compared to the North Sea. This negative impactrises to 1.82 and 2.60 times in the case of offshore re-injectionand skip-and-ship practices, respectively.
3.5 Sensitivity Analysis, Recommendation, and Winteriza-tion Measure. Sensitivity analysis: In this case study, for compu-tational convenience, a partial sensitivity analysis has beenapplied. The sensitivity of the total cost for three different drillingtime scenarios (17, 22, and 27 days/well) has been considered.The result of the partial sensitivity analysis for different wastehandling practices for Arctic offshore operation is depicted inTable 12.
The sensitivity analysis result demonstrates that 5 days fewer/more drilling time per well has a significant cost variation for allconsidered waste disposal practices. In the case of skip-and-ship,the cost variation is higher than for the other two practices. In gen-eral, from the above sensitivity analysis results, it can be deducedthat the CEA is most sensitive to the drilling time.
Make a recommendation: The practice of offshore dischargepossesses the lowest CER and RR, thus it is the recommendedpractice for the Johan Castberg oil field development project. Thisrecommendation is based on the above-discussed assumptions.Further, in the Arctic, it is expected that operating conditions willvary within a short period, thus a well-defined risk- and cost-monitoring process needs to be integrated with the discharge pro-cess to check the frequently changing requirements. Moreover,the operator has to comply with the Norwegian law of protectionagainst pollution and waste (the Pollution Control Act, Chap. 2,Sec. 4 and Chap. 3, Sec. 11) and the requirements for risk man-agement during petroleum exploration (Petroleum Safety Author-ity Management Regulations, Secs. 3–6). Complying with theregulations can reduce future liability costs.
If, for instance, the offshore discharge practice were not viabledue to statutory legislation, in such a case, the traditional CEAwould suggest that the skip-and-ship practice be implemented,since the total cost and the CER are less than those of there-injection practice. However, as the RR results demonstrate, the
increase in the risk of undesirable events in the skip-and-shippractice is almost twice that of re-injection. This shows that com-paring different alternatives based on the cost elements alone ismisleading. The effect of such a suggestion, i.e., without consider-ing the risk of undesirable events, can be significant, especially inthe Arctic offshore operation. Hence, evaluation of the potentialhazards and the risk of undesirable events should always be inte-grated with CEA for better drilling waste management decisions.
Winterization measure: The concept of risk managementincludes proper knowledge and understanding of the pro-activeand re-active risk reduction measures. Winterization or enclosureof the waste handling systems to protect vulnerable areas is con-sidered as the main risk and ice incident impact reduction measurefor onsite risk assessment procedures. Winterization measuresinclude [47]: protecting the solids-control system functions, whichare considered important to safety, and implementing proceduresfor safe operation and personnel welfare. These measures are veryeffective in reducing the likelihood of occurrence of the undesir-able events. However, their effectiveness is insignificant once therisk presents itself [47]. On the other hand, ice management canbe any method that protects the waste handling systems and struc-tures against ice accretion, and it can also be a process of removalof the ice from the structure. The typical ice management meas-ures, such as de-icing, anti-icing, and winterization help to limitthe accretion of the ice on the waste handling systems and removethe ice from the equipment. For instance, the most common anti-icing measures are [48]: coatings, design, heat, electrical, icedetection, and windows.
In this study, however, the influence of winterization measureson the final risk and cost profile is not considered. The reason isthat, as mentioned above, the main focus of the case study is tocheck whether the available waste handling practices, which areemployed in less harsh region, are applicable in Arctic offshoreoperation or not. The result shows that the need to employ risk andice management practices, such as winterization measures duringthe operational phase of an offshore waste handling activity is animportant aspect that must be considered in the Arctic offshore.
4 Conclusion
This work introduced a methodology for RB–CEA of drillingwaste handling practices based on losses from undesirable events,by considering the effect of the extreme cold operational condi-tions. The methodology is particularly important in the Arcticoperating environment since there is less experience and data inthe region. The proposed methodology considered risk assessmentas a key component for the CEA, and it involves the followingsteps: (i) risk analysis (to assess the impact of the peculiar ArcticRIFs); (ii) CEA (to estimate the relative effect of the Arctic oper-ating environment on the total cost compared with the referenceregion); (iii) estimation of RR and CER (to measure how the costprofile and the RP changes (increased or decreased) based on theeffect of the operating environment); and (iv) sensitivity analysis(to identify the key cost variables).
The findings are as follows:
� The proposed methodology is beneficial as it outlines a set ofsteps that assists the risk and cost analyst to find the most
Table 12 Partial case sensitivity analysis result
Drilling time (days)
Per well 17 22 27Waste disposal practice total 646 836 1026 Effect of change of the drilling time ($)
Total cost ($) Offshore discharge 1,495,400 1,846,400 2,197,400 6$351,000Offshore re-injection 50,508,400 52,066,400 53,624,400 6$1,558,000
Skip-and-ship 14,798,930 17,149,230 19,499,530 6$2,350,300
The total costs in the table represent the total cost of the 38 wells.
Journal of Offshore Mechanics and Arctic Engineering JUNE 2016, Vol. 138 / 031301-11
Downloaded From: http://offshoremechanics.asmedigitalcollection.asme.org/ on 08/11/2016 Terms of Use: http://www.asme.org/about-asme/terms-of-use

suitable alternative waste handling practice that is cost-effective with the minimum level of risk, by considering theArctic operating environment.
� The risk analysis results showed that the risk of undesirableevents, due to the negative effect of the adverse operatingcondition of the Arctic, during offshore drilling waste han-dling activities, is between 1.48 and 2.60 times greater thanthat of the North Sea.
� The effect of the operating environment of the Arctic regionon the cost element results is between 1.18 and 1.52 timesgreater costs for the Arctic when compared to the North Sea.
� The sensitivity analysis illustrated that the total cost per unitton of drilling waste disposed is dependent on the keyassumption, which in our case is drilling time per well.Hence, it is particularly effective to clearly identify andexplain the assumptions during the risk and CEA.
Our intent is not to provide generalized advice on whether dril-ling should take place or not, since these prescriptions will be par-ticular to and heterogeneous across the Arctic region. Rather, theintent is to highlight the fact that it is misleading to compare dif-ferent alternatives based on the cost elements alone. Our conclu-sion is that proper risk assessment as a key part of CEA will resultin more efficient waste handling operations and improved envi-ronmental protection. A shortage of historical probability ofoccurrence data, for different risk of events, was an issue duringthe illustrative case study analysis, due to the lack of operationalexperience in the Arctic. Therefore, the results should not be takenat face value; they should be interpreted in light of the currentstate of knowledge about operating experience in the Arctic.
Moreover, the resulting risk values from the illustrative case studyanalysis should be updated as new data/evidence becomes avail-able, preferably in the form of field (hard) data reflecting theactual operational experience in this Arctic region and thereforegradually supplanting the opinions elicited from experts. All theseelements, however, do not invalidate the results from the illustra-tive case study analysis. Furthermore, to document the faithful-ness of the probabilities given by the experts, calibration, which isa measure of the quality of probability distributions given byexperts, is vital. In addition, performance-based weighting canhelp to reduce the bias and uncertainty distributions over theparameters.
Acknowledgment
The work has been funded by The Research Council of Norwayand ENI Norge AS through the EWMA (Environmental WasteManagement) project, facilitated at UiT The Arctic University ofNorway. The financial support was gratefully acknowledged.
The authors would like to thank all anonymous suppliers of off-shore services, operating in Northern Norway, for providing thecost-related data. The authors would also like to thank the Editor,Associate Editor, and both the anonymous reviewers for theirinvaluable comments and suggestions to improve the quality ofthe paper.
APPENDIX
Table 13 The questionnaire used to collect subjective probabilities and consequence ratings
Company profile
Field of expertise
Years of experience
Type of waste handling practice
North sea (NS) Arctic (AR)
Probability Consequence rating Probability Consequence rating
Potential hazards UE Pi0.05 Pi0.50 Pi0.95 Ci0.05 Ci0.50 Ci0.95 Pi0.05 Pi0.50 Pi0.95 Ci0.05 Ci0.50 Ci0.95
Negative air temperature and ice accretion
Atmospheric icing and negative air temperature
Icicles, atmospheric icing, and negative air temperature
Rime, glaze, snow, and icicles
Negative air temperature, rime, glaze, and snow
Atmospheric icing and negative air temperature
Low temperature, rime, glaze, and snow
Freezing temperature and ice accretion
aUE—represents undesirable events.bConsider the following waste handling practices: (i) offshore discharge—treating and discharging the drilling waste to the ocean (sea); (ii) offshore re-injection—re-injecting the drilling waste offshore both in a dedicated re-injection well and/or in a dry (dead) well; and (iii) skip-and-ship—hauling thedrilling waste back to shore for further treatment and disposal.cThe reference area, is North Sea and the target area, is Barents Sea.dConsider Johan Castberg (formerly Skrugard and Havis) field development project as a case. Location of the field is in the Barents Sea—part of the Nor-wegian Arctic, about 200 km from the nearest Ingøya Island, in Finnmark, northern Norway.eThe suggested potential hazards can be used as a guidance; however, you are free to include other potential hazards.fRefer to consequence categories, when you estimate the rate of occurrence and the associated loss (see Table 14). Pi0.05 is interpreted as the lower value;Pi0.50 is interpreted as the median value (the expert best judgment about the undesirable event i); and Pi0.95 is interpreted as 95% percentile value (theexpert conservative judgment).gThank you very much for your participation in this interview.
031301-12 / Vol. 138, JUNE 2016 Transactions of the ASME
Downloaded From: http://offshoremechanics.asmedigitalcollection.asme.org/ on 08/11/2016 Terms of Use: http://www.asme.org/about-asme/terms-of-use

References[1] Geehan, T., Gilmour, A., and Guo, Q., 2007, “The Cutting Edge in Drilling
Waste Management,” http://www.slb.com/�/media/Files/resources/oilfield_review/ors06/win06/p54_67.pdf
[2] Ayele, Y. Z., Barabadi, A., and Barabady, J., 2013, “Drilling Waste Handlingand Management in the High North,” 2013 IEEE International Conference onIndustrial Engineering and Engineering Management (IEEM), Bangkok,Thailand, Dec. 10–13, pp. 673–678.
[3] Veil, J., 2002, “Drilling Waste Management: Past, Present, and Future,” SPEAnnual Technical Conference and Exhibition, San Antonio, TX, Sept. 29–Oct.2, Paper No. SPE-77388-MS.
[4] Getliff, J., Silverstone, M., Shearman, A., Lenn, M., and Hayes, T., 1998,“Waste Management and Disposal of Cuttings and Drilling Fluid Waste Result-ing From the Drilling and Completion of Wells to Produce Orinoco Very HeavyOil in Eastern Venezuela,” SPE International Conference on Health, Safety,and Environment in Oil and Gas Exploration and Production, Caracas,Venezuela, June 7–10, Paper No. SPE-46600-MS.
[5] Paulsen, J., Norman, M., and Getliff, J., 2002, “Creating Near-Zero Dischargein Norway: A Novel Environmental Solution,” World Oil, 223, pp. 37–41.
[6] Svensen, T., and Taugbol, K., 2011, “Drilling Waste Handling in ChallengingOffshore Operations,” SPE Arctic and Extreme Environments Conference andExhibition.
[7] Paulsen, J. E., Hoset, J. E., Rørhuus, T., Larsen, V., Alm, D., Birkeland,O., and Marker, R., 2005, “Exploration Drilling in the Barents Sea;
Prevailing Zero Discharge Regime Challenges and Learning From TwoRecent Exploration Wells,” SPE Asia Pacific Health Safety and Environ-ment Conference and Exhibition, Kuala Lumpur, Malaysia, Sept. 19–21,Paper No. SPE-96507-MS.
[8] Ayele, Y. Z., Barabadi, A., and Barabady, J., 2014, “Effectiveness Assessmentfor Waste Management Decision-Support in the Arctic Drilling,” IEEE Interna-tional Conference on Industrial Engineering and Engineering Management(IEEM), Bandar Sunway, Malaysia, Dec. 9–12, pp. 559–564.
[9] Lindholt, L., and Glomsrød, S., 2012, “The Arctic: No Big Bonanza for theGlobal Petroleum Industry,” Energy Econ., 34(5), pp. 1465–1474.
[10] Ball, A. S., Stewart, R. J., and Schliephake, K., 2012, “A Review of the CurrentOptions for the Treatment and Safe Disposal of Drill Cuttings,” Waste Manage.Res., 30(5), pp. 457–473.
[11] Finnveden, G., Bj€orklund, A., Moberg, A., and Ekvall, T., 2007,“Environmental and Economic Assessment Methods for Waste ManagementDecision-Support: Possibilities and Limitations,” Waste Manage. Res., 25(3),pp. 263–269.
[12] Gentil, E. C., Damgaard, A., Hauschild, M., Finnveden, G., Eriksson, O., Thor-neloe, S., Kaplan, P. O., Barlaz, M., Muller, O., Matsui, Y., Ii, R., and Christen-sen, T. H., 2010, “Models for Waste Life Cycle Assessment: Review ofTechnical Assumptions,” Waste Manage., 30(12), pp. 2636–2648.
[13] Levin, H. M., and McEwan, P. J., 2001, Cost-Effectiveness Analysis: Methodsand Applications, Vol. 4, Sage Publication, Oxford, Pergamon, Thousand Oaks,CA.
Table 15 The potential hazards and undesirable events for offshore re-injection and skip-and-ship
ID Potential hazard UE
Offshore re-injection UE1 Negative air temperature and ice accretion Shale shakers failure
UE2 Atmospheric icing and negative air temperature Auger or conveyor system failure
UE3 Icicles, negative air temperature, and atmosphericicing
Grinding mill (tank) failure
UE4 Rime, glaze, snow, and icicles Conditioned tank failure
UE5 Negative air temperature, rime, glaze, and snow Holding tank failure
UE6 Atmospheric icing and negative air temperature Injection pumps failure
UE7 Wellbore instability Contamination of the sea (if close to the wellhead)or shallow aquifers
UE8 Fracture growth Contamination of shallow fresh water aquifers
UE9 Communication of the induced fracture with exist-ing wells in the field
Environmental contamination of the sea, due toleakage in one of the casings near surface or at thewellhead [44]
UE10 Presence of local faults/fractures close to the injec-tion/disposal zone
Induced local tectonic movements, due to reactiva-tion of the conduits [44]
Skip-and-ship UE1 Fog, blowing snow, darkness Operator error; fatal crane incident; untreated dril-ling waste discharge
UE2 Ice floes contact Propulsion failure; untreated drilling waste spill;HSE damage; loss of vessel; serious marine inci-dent; and significant economic loss
UE3 Rime, glaze, snow, and icicle formation on the rail-ings, decks, gangs, stairs, and superstructure
Equipment damage; increased energy consumption;and difficulty during maintenance operation
UE4 Polar low accompanied by sea spray icing, andsnowstorms
Blackout because of freezing of the ship; loss of sta-bility (in case of heavy load ice accretion in shorttime); personnel injuries; and increased heatrequirement
UE5 Negative air temperature and ice formation on win-dows, searchlights, and navigation lights
No indication of sailing direction, size of the ship,and no sign whether or not the ship is anchored;reduced or no visibility for mariners; and possibilityof collision
Table 14 Consequence categories
Financial impact ($)
Rating Description Minimum Maximum
1 Negligible, insignificant consequences 50,000 300,0002 Slight, minor consequences 300,000 2,000,0003 Moderate, hinders the waste handling process 2,000,000 5,000,0004 Major, causes high or significant impact 5,000,000 10,000,0005 Catastrophic, very high or severe damage 10,000,000 �10,000,000
Journal of Offshore Mechanics and Arctic Engineering JUNE 2016, Vol. 138 / 031301-13
Downloaded From: http://offshoremechanics.asmedigitalcollection.asme.org/ on 08/11/2016 Terms of Use: http://www.asme.org/about-asme/terms-of-use

[14] Kazanowski, A., 1968, “A Standardized Approach to Cost-Effectiveness Eval-uations,” Cost-Effectiveness: The Economic Evaluation of Engineering Systems,J. M. English, ed., Wiley, New York, pp. 113–115.
[15] Kazanowski, A. D., 1968, “Cost Effectiveness Fallacies and MisconceptionsRevisited,” Cost-Effectiveness: The Economic Evaluation of Engineering Sys-tems, J. M. English, ed., Wiley, New York, pp. 151–165.
[16] Minton, R., and McGlaughlin, J., 2003, “Rising Drilling-Waste Costs PromoteNovel Technologies, Approaches,” Oil Gas J., 101(31), pp. 51–55.
[17] Abimbola, M., Khan, F., and Khakzad, N., 2014, “Dynamic Safety Risk Analy-sis of Offshore Drilling,” J. Loss Prev. Process Ind., 30, pp. 74–85.
[18] Guo, Q., Geehan, T., and Pincock, M., 2005, “Managing Risks and Uncertain-ties in Drill Cuttings Re-Injection in Challenging Environments–Field Experi-ence From Sakhalin Island,” SPE/EPA/DOE E&P Environmental Conference,Galveston, TX, Paper No. SPE 93781.
[19] Ayele, Y. Z., Barabady, J., and Droguett, E. L., 2015, “Risk Assessment of Arc-tic Drilling Waste Management Operations Based on Bayesian Networks,”Safety and Reliability of Complex Engineered Systems: ESREL 2015, Zurich,Switzerland, pp. 1907–1915.
[20] Khakzad, N., Khan, F., and Amyotte, P., 2013, “Quantitative Risk Analysis ofOffshore Drilling Operations: A Bayesian Approach,” Saf. Sci., 57, pp. 108–117.
[21] Abimbola, M., Khan, F., Khakzad, N., and Butt, S., 2015, “Safety and RiskAnalysis of Managed Pressure Drilling Operation Using Bayesian Network,”Saf. Sci., 76, pp. 133–144.
[22] Øien, K., 2013, “Remote Operation in Environmentally Sensitive Areas: Devel-opment of Early Warning Indicators,” J. Risk Res., 16(3–4), pp. 323–336.
[23] Boesch, D. F., and Rabalais, N. N., 2003, Long-Term Environmental Effects of Off-shore Oil and Gas Development, Taylor & Francis, Abingdon, Oxfordshire.
[24] Vinnem, J.-E., 2007, Offshore Risk Assessment: Principles, Modelling andApplications of QRA Studies, 3rd ed., Vol. 2, Springer-Verlag, London.
[25] Rosqvist, T., and Tuominen, R., 1999, “Expert Judgment Models in Quantita-tive Risk Assessment,” http://www.iaea.org/inis/collection/NCLCollection-Store/_Public/31/016/31016454.pdf
[26] Barabadi, A., Gudmestad, O. T., and Barabady, J., 2015, “RAMS Data Collec-tion Under Arctic Conditions,” Reliab. Eng. Syst. Saf., 135, pp. 92–99.
[27] Markeset, T., 2008, “Design for High Performance Assurance for Offshore Pro-duction Facilities in Remote Harsh and Sensitive Environments,” Q. J. Oper.Res. Soc. India, OPSEARCH, 45(3), p. 275.
[28] Ayele, Y. Z., Barabadi, A., and Barabady, J., 2015, “Dynamic Spare PartsTransportation Model for Arctic Production Facility,” Int. J. Syst. Assur. Eng.Manage., 7(1), pp. 84–98.
[29] Kayrbekova, D., Barabadi, A., and Markeset, T., 2011, “Maintenance CostEvaluation of a System to be Used in Arctic Conditions: A Case Study,” J.Qual. Maint. Eng., 17(4), pp. 320–336.
[30] Barabadi, A., and Markeset, T., 2011, “Reliability and Maintainability PerformanceUnder Arctic Conditions,” Int. J. Syst. Assur. Eng. Manage., 2(3), pp. 205–217.
[31] Hora, S. C., 2009, “Expert Judgment in Risk Analysis,” Non-PublishedResearch Reports, http://research.create.usc.edu/nonpublished_reports/120
[32] Monier, V., Abbayes, C., G€orlach, B., Jarvis, A., Medhurst, J., Kuik, O., Van-ner, R., Ekins, P., Jantzen, J., van der Woerd, H., Vercaemst, P., Huybrechts,D., and Meynaerts, E., 2006, “Ex-Post Estimates of Costs to Business of EUEnvironmental Legislation,” Final Report, Institute for Environmental Studies,Vrije Universiteit, Report No. ENV.G.1/FRA/2004/0081.
[33] Kiker, G. A., Bridges, T. S., Varghese, A., Seager, T. P., and Linkov, I., 2005,“Application of Multicriteria Decision Analysis in Environmental DecisionMaking,” IEAM, 1(2), pp. 95–108.
[34] Higgins, J. P. T., and Green, S., 2011, “Cochrane Handbook for SystematicReviews of Interventions Version 5.1.0 [updated March 2011],” accessed Apr.15, 2011, www.cochrane-handbook.org
[35] Cellini, S. R., and Kee, J. E., 2010, “Cost-Effectiveness and Cost-Benefit Ana-lysis,” Handbook of Practical Program Evaluation.
[36] Stern, N. H., 2006, Stern Review: The Economics of Climate Change, Vol. 30,HM Treasury, London.
[37] Lopez, H., 2008, “The Social Discount Rate: Estimates for Nine Latin Ameri-can Countries,” World Bank Policy Research Working Paper No. 4639.
[38] PSA, 2013, “Regulations Relating to Conducting Petroleum Activities (theActivities Regulations), Section 68-Discharge of Cuttings, Sand and Solid Parti-cles,” accessed Aug. 27, 2013, http://www.psa.no/activities/category399.html#_Toc407534829
[39] Statoil, 2013, 11/06, “Planning an Oil Terminal at Veidnes,” http://www.statoil.com/en/NewsAndMedia/News/2013/Pages/12feb_Skrugard.aspx
[40] Det Norske Veritas, 2009, Barents 2020: Assessment of International Standardsfor Safe Exploration, Production and Transportation of Oil and Gas in theBarents Sea, Det Norske Veritas (DNV), Oslo, Norway.
[41] Ortiz, N., Wheeler, T., Breeding, R., Hora, S., Meyer, M., and Keeney, R.,1991, “Use of Expert Judgment in NUREG-1150,” Nucl. Eng. Des., 126(3),pp. 313–331.
[42] Chang, S. E., McDaniels, T., Fox, J., Dhariwal, R., and Longstaff, H.,2014, “Toward Disaster-Resilient Cities: Characterizing Resilience ofInfrastructure Systems With Expert Judgments,” Risk Anal., 34(3),pp. 416–434.
[43] Cooke, R. M., 1991, Experts in Uncertainty: Opinion and Subjective Probabil-ity in Science, Oxford University Press, New York.
[44] Nicholson, C., and Wesson, R. L., 1990, “Earthquake Hazard Associated WithDeep Well Injection,” U.S. Environmental Protection Agency, Report No. I19.3:1951.
[45] Wipertrip, 2014, “Waste Management–Transport of Cuttings to Shorefor Disposal,” http://www.wipertrip.com/qhse/waste-management/29-waste-management-transport-of-cuttings-to-shore-for-disposal.html
[46] Martin, A., 2004, “Drilling Waste Handling,” U.S. Patent No. US6796379 B1.[47] DNV, 2013, “Winterization for Cold Climate Operations (Tentative),” https://
rules.dnvgl.com/docs/pdf/DNV/codes/docs/2013-10/OS-A201.pdf[48] Ryerson, C. C., 2009, “Assessment of Superstructure Ice Protection as Applied to
Offshore Oil Operations Safety,” U.S. Army Research, http://digitalcommons.unl.edu/usarmyresearch/49
031301-14 / Vol. 138, JUNE 2016 Transactions of the ASME
Downloaded From: http://offshoremechanics.asmedigitalcollection.asme.org/ on 08/11/2016 Terms of Use: http://www.asme.org/about-asme/terms-of-use
Related Documents