Citation: Zhou, L.; Wang, J.; Li, F.; Xu, Y.; Zhao, J.; Su, J. Risk Aversion of B2C Cross-Border e-Commerce Supply Chain. Sustainability 2022, 14, 8088. https://doi.org/10.3390/ su14138088 Academic Editor: Alessio Ishizaka Received: 2 June 2022 Accepted: 22 June 2022 Published: 1 July 2022 Publisher’s Note: MDPI stays neutral with regard to jurisdictional claims in published maps and institutional affil- iations. Copyright: © 2022 by the authors. Licensee MDPI, Basel, Switzerland. This article is an open access article distributed under the terms and conditions of the Creative Commons Attribution (CC BY) license (https:// creativecommons.org/licenses/by/ 4.0/). sustainability Article Risk Aversion of B2C Cross-Border e-Commerce Supply Chain Li Zhou 1 , Jingjing Wang 1 , Feng Li 1 , Yan Xu 2 , Jie Zhao 1 and Jiafu Su 3,4,5, * 1 School of Information, Beijing Wuzi University, Beijing 101149, China; [email protected] (L.Z.); [email protected] (J.W.); [email protected] (F.L.); [email protected] (J.Z.) 2 School of Economics and Management, Xidian University, Xi’an 710126, China; [email protected] 3 School of Management Science and Engineering, Chongqing Technology and Business University, Chongqing 402160, China 4 International College, Krirk University, Bangkok 10220, Thailand 5 National Research Base of Intelligent Manufacturing Service, Chongqing Technology and Business University, Chongqing 400067, China * Correspondence: [email protected] Abstract: In recent years, with the booming development of the B2C cross-border e-commerce industry, the supply chain of B2C cross-border e-commerce faces many potential risk factors, which must be prevented. To solve this problem, this paper studies the supply chain risk factors of B2C cross-border e-commerce and puts forward avoidance strategies. First, the fitness network model of a dual local world is constructed by combining the fitness model with the local world model. Then, the fitness network model of the dual local world is verified by the risk dynamics simulation model to fit the actual network situation. On this basis, the SIRS virus transmission model is constructed to simulate the risk transmission of the B2C cross-border e-commerce supply chain, and the evaluation index system of the supply chain risk immunity ability and external risk intensity are established according to the supply chain risk immunity ability and external risk intensity. AHP is used to calculate the factors that have the greatest influence on supply chain risk immunity and external risk intensity. The results show that: from the point of view of the enterprise’s own risk immunity, it is more necessary to ensure the stability of the company’s capital and to establish a perfect risk monitoring and coping mechanism to avoid risks. From the perspective of enterprise external risk intensity, the risk should be avoided from two aspects of transaction security and logistics. Keywords: cross-border e-commerce; risk communication; local world model; fitness model; SIRS model 1. Introduction With the acceleration of global economic integration, the traditional way of interna- tional trade has been unable to keep pace with the development and changes of the world economy. The rapid development of the Internet and the wide application of information technology have accelerated the integration of cross-border trade and e-commerce. Com- pared with domestic e-commerce, cross-border e-commerce has a longer supply chain, more links involved, longer logistics process, more complex information flow and slower capital turnover [1]. Enterprises in the supply chain cooperate and influence each other, and any small deviation may have a huge impact on the operation of the whole supply chain through the cascade effect [2,3]. However, at present, the international situation and unstable political environment make the adjustment of relationships between countries and cross-border logistics timeliness hard to control, and the supply chain upstream and downstream of the multi-level goods trade is likely to bring a cross-border B2C electrical supply chain risk; therefore, research on the supply chain risk conduction mechanism and preventive measures against possible risks appear important. At present, a large number of scholars have carried out studies on supply chain, such as Beheshtinia et al. An improved genetic algorithm, GA-Topkor, was proposed to solve the Sustainability 2022, 14, 8088. https://doi.org/10.3390/su14138088 https://www.mdpi.com/journal/sustainability

Welcome message from author
This document is posted to help you gain knowledge. Please leave a comment to let me know what you think about it! Share it to your friends and learn new things together.
Transcript

Citation: Zhou, L.; Wang, J.; Li, F.; Xu,
Y.; Zhao, J.; Su, J. Risk Aversion of
B2C Cross-Border e-Commerce
Supply Chain. Sustainability 2022, 14,
8088. https://doi.org/10.3390/
su14138088
Academic Editor: Alessio Ishizaka
Received: 2 June 2022
Accepted: 22 June 2022
Published: 1 July 2022
Publisher’s Note: MDPI stays neutral
with regard to jurisdictional claims in
published maps and institutional affil-
iations.
Copyright: © 2022 by the authors.
Licensee MDPI, Basel, Switzerland.
This article is an open access article
distributed under the terms and
conditions of the Creative Commons
Attribution (CC BY) license (https://
creativecommons.org/licenses/by/
4.0/).
sustainability
Article
Risk Aversion of B2C Cross-Border e-Commerce Supply ChainLi Zhou 1, Jingjing Wang 1, Feng Li 1, Yan Xu 2, Jie Zhao 1 and Jiafu Su 3,4,5,*
1 School of Information, Beijing Wuzi University, Beijing 101149, China; [email protected] (L.Z.);[email protected] (J.W.); [email protected] (F.L.); [email protected] (J.Z.)
2 School of Economics and Management, Xidian University, Xi’an 710126, China; [email protected] School of Management Science and Engineering, Chongqing Technology and Business University,
Chongqing 402160, China4 International College, Krirk University, Bangkok 10220, Thailand5 National Research Base of Intelligent Manufacturing Service, Chongqing Technology and Business University,
Chongqing 400067, China* Correspondence: [email protected]
Abstract: In recent years, with the booming development of the B2C cross-border e-commerceindustry, the supply chain of B2C cross-border e-commerce faces many potential risk factors, whichmust be prevented. To solve this problem, this paper studies the supply chain risk factors of B2Ccross-border e-commerce and puts forward avoidance strategies. First, the fitness network model of adual local world is constructed by combining the fitness model with the local world model. Then, thefitness network model of the dual local world is verified by the risk dynamics simulation model tofit the actual network situation. On this basis, the SIRS virus transmission model is constructed tosimulate the risk transmission of the B2C cross-border e-commerce supply chain, and the evaluationindex system of the supply chain risk immunity ability and external risk intensity are establishedaccording to the supply chain risk immunity ability and external risk intensity. AHP is used tocalculate the factors that have the greatest influence on supply chain risk immunity and externalrisk intensity. The results show that: from the point of view of the enterprise’s own risk immunity,it is more necessary to ensure the stability of the company’s capital and to establish a perfect riskmonitoring and coping mechanism to avoid risks. From the perspective of enterprise external riskintensity, the risk should be avoided from two aspects of transaction security and logistics.
Keywords: cross-border e-commerce; risk communication; local world model; fitness model;SIRS model
1. Introduction
With the acceleration of global economic integration, the traditional way of interna-tional trade has been unable to keep pace with the development and changes of the worldeconomy. The rapid development of the Internet and the wide application of informationtechnology have accelerated the integration of cross-border trade and e-commerce. Com-pared with domestic e-commerce, cross-border e-commerce has a longer supply chain,more links involved, longer logistics process, more complex information flow and slowercapital turnover [1]. Enterprises in the supply chain cooperate and influence each other,and any small deviation may have a huge impact on the operation of the whole supplychain through the cascade effect [2,3]. However, at present, the international situation andunstable political environment make the adjustment of relationships between countriesand cross-border logistics timeliness hard to control, and the supply chain upstream anddownstream of the multi-level goods trade is likely to bring a cross-border B2C electricalsupply chain risk; therefore, research on the supply chain risk conduction mechanism andpreventive measures against possible risks appear important.
At present, a large number of scholars have carried out studies on supply chain, suchas Beheshtinia et al. An improved genetic algorithm, GA-Topkor, was proposed to solve the
Sustainability 2022, 14, 8088. https://doi.org/10.3390/su14138088 https://www.mdpi.com/journal/sustainability

Sustainability 2022, 14, 8088 2 of 22
supply chain scheduling problem in DMS in consideration of the environment and economyin order to optimize the supply chain [4]. In terms of supply chain performance, Parkfocuses on the new supply chain management based on block chain and its sustainabilityperformance in environmental protection, social equity, governance efficiency and otheraspects. Research shows that block chain technology has the potential to improve thesustainability performance of the supply chain [5]. Lin et al., in order to make the supplychain more coordinated, constructed a model framework to consider the risks caused bythe uncertainty of supply and demand, and the production and procurement decisionsunder centralized and decentralized systems were discussed. Finally, a procurementstrategy was proposed and verified to be effective in improving the coordination of theinfluenza vaccine supply chain [6]. Liu et al enabled optimal operation of a closed-loopsupply chain under dual regulation through strategic management of product recyclingand its environmental impact. A dual regulatory system characterized by deposit–refundpolicy and a minimum acquisition rate of used products was introduced, and a two-level closed-loop supply chain (CLSC) composed of brand owner and original equipmentmanufacturer (OEM) was established under the dual regulations [7]. He et al. considereda two-channel closed-loop supply chain (CLSC) where manufacturers can distribute newproducts through independent retailers and sell remanufactured products through third-party companies or platforms (3P) where government subsidies may exist. On this basis,manufacturers’ channel structure and pricing decisions as well as government subsidypolicies for competitive new products and remanufactured products were explored [8].
Some scholars have also carried out research on green supply chain. For example,Dy et al. believed that a sustainable supply chain should be green and low carbon. Theymaximized the total profit of the system by obtaining the optimal value of productionspeed, volume, shipment and preservation investment, so as to make the supply chainsustainable and reduce waste. The product with low negative cross price elasticity or highpositive cross price elasticity proposed by them was a profitable portfolio, which couldreduce 20% of investment wastage in guaranteed technology [9]. For single-retailer andmulti-retailer closed-loop supply chain models, Ullah et al. studied the remanufacturingstrategy and reusable packaging capacity under random demand and random return rate,showing that remanufacturing is a relatively cheap strategy for supply chains with highsetup and ordering costs [10]. Sepehri et al. believed that reducing carbon emissionsplays an important role in the development of a sustainable inventory system, but fewscholars have conducted research on the impact of carbon emissions on deterioratinginventory systems. Therefore, it is concluded that when carbon cap-and-trade rules fillthe above gap, the price of perishable goods depends on demand [11]. Liu et al. proposeda location–storage–path integration model of perishable products considering carbonemissions and product freshness. This model can significantly improve the efficiency ofperishable supply chain management from the perspective of global optimization, andvehicle speed can significantly affect economic cost and carbon emissions, thus achieving asustainable supply chain [12]. Zhang believed that green improvement and green supplychain coordination of customers’ green preferences should be considered in the supplychain of emissions-intensive industries to achieve high supply chain performance. He alsofound that under the circumstance of high green investment cost, government interventiondoes not necessarily bring higher green improvement, and the government should shiftfrom taxation to subsidies [13]. Liu et al. believed that suitable suppliers should be selectedbased on sustainable standards in the supply chain, proposed a fuzzy three-stage multi-criteria-integrated decision-making (MCDM) method to select the most qualified suppliers,and established sustainable supplier standards from economic, environmental and socialaspects. Taking environmental factors into consideration, this method can make the supplychain achieve better sustainability [14].
In addition, some scholars believe that by using elastic network science and theintersection of supply chain research, such as Li on the presence of a chain reaction orrisk, the research of supply chain network science overall flexibility (SCNR), namely a
Sustainability 2022, 14, 8088 3 of 22
few enterprises in the supply chain network (SCN), can cause interruptions to spread tonearby enterprises, eventually spreading to other enterprises [15] in the SCN. Meng et al.analyzed the elasticity of the supply chain in a crowd network from static and dynamicperspectives. They first defined the elasticity of the supply chain, and then proposed agraphical and game theory framework to evaluate the elasticity, under which the sup-ply chain network would reach a highly elastic equilibrium after experiencing repeatedprisoner’s dilemmas [16].Li et al. proved that the investigation of network characteristicscan better understand supply chain elasticity, showed that the use of a reduced featurelist will produce the same performance as the use of a full feature set, and summarizedthe key points that can support the interpretation of the impact of network characteristicson elasticity [17].
In recent years, some scholars have also carried out studies on the risk transmissionmechanism of the supply chain, such as Pankaj et al. Two sample t tests were conducted tofind the impact of different risks in the cross-border e-commerce supply chain on supplychain performance, as well as the impact of one risk relative to another [18]. Tie et al.used the BBV model to build an enterprise R&D network and used the SIR model tosimulate the diffusion of network risks. The robustness of the network under differentrisks was studied, and several indicators of three types of technical risks were comparedand analyzed [19]. Zhang established a risk propagation model of an enterprise R&Dnetwork and solved the priority of various attacks by studying the parameters of anti-risk capabilities [20]. Syed et al. proposed a grey-based hybrid decision experiment andevaluation laboratory (DEMATEL) model to evaluate the relationship between the majorrisks identified in FSC [21]. Wang combined the complex supply chain network model withthe cascading failure model to observe the dynamic transmission process of supply chainnetwork risks and to conduct robustness analysis [22]. Chhimwal et al. analyzed how risktransmission occurs in the circular supply chain network of automobile organizations byusing the Bayesian network method, and the research showed that the reverse side of thecircular supply chain could be the source of risk transmission in the implementation of thecircular concept [23]. Gouda studied the impact of sustainability practices on supply chainrisk and showed that risk mitigation strategies do not always reduce the actual supplychain risk experienced by companies, while sustainability efforts can help reduce supplychain risk, especially in emerging market environments. In addition, while passive riskmitigation strategies cannot reduce supply chain risks by themselves, they are effectivewhen used in conjunction with sustainable development efforts [24].
In the study of supply chain risk communication model methods, Lei et al. combinedthe complex network model and the optimization method of risk control strategy selectionand proposed an improved SIS model, as well as discussed the dynamic changes andtrends of risk transmission and the relationship and influence of different suppliers andsupply chain structures on risk transmission, including the choice of risk control strategy fortransnational supply chain [25]. Zheng, based on the SIRS infectious risk model, describedthe transmission process of credit risk transfer among enterprises after the stock marketburst process, clearing the diffusion mechanism and effects. The results show that whenthe risk of infection intensity exceeds a certain threshold, the infected enterprise exceedsa certain level, and the proportion in the economy inevitably leads to unsafe [26] acrossthe economy.
Through sorting out the above relevant literature, existing research on the cross-bordere-commerce supply chain mainly focuses on supply chain optimization, performance eval-uation, collaborative development, optimal operation under dual regulation, etc. [27–30].Some scholars also studied the intersection of supply chain elasticity and network sci-ence. There are relatively few studies on the risk of the cross-border e-commerce supplychain. Supply chain risk research generally includes risk identification, risk assessment,risk dissemination and risk control [31–36]. The current research mainly focuses on thecharacteristics of a supply chain network, the bullwhip effect, and uncertain factors innetworks under external attack. In terms of supply chain risk communication model meth-
Sustainability 2022, 14, 8088 4 of 22
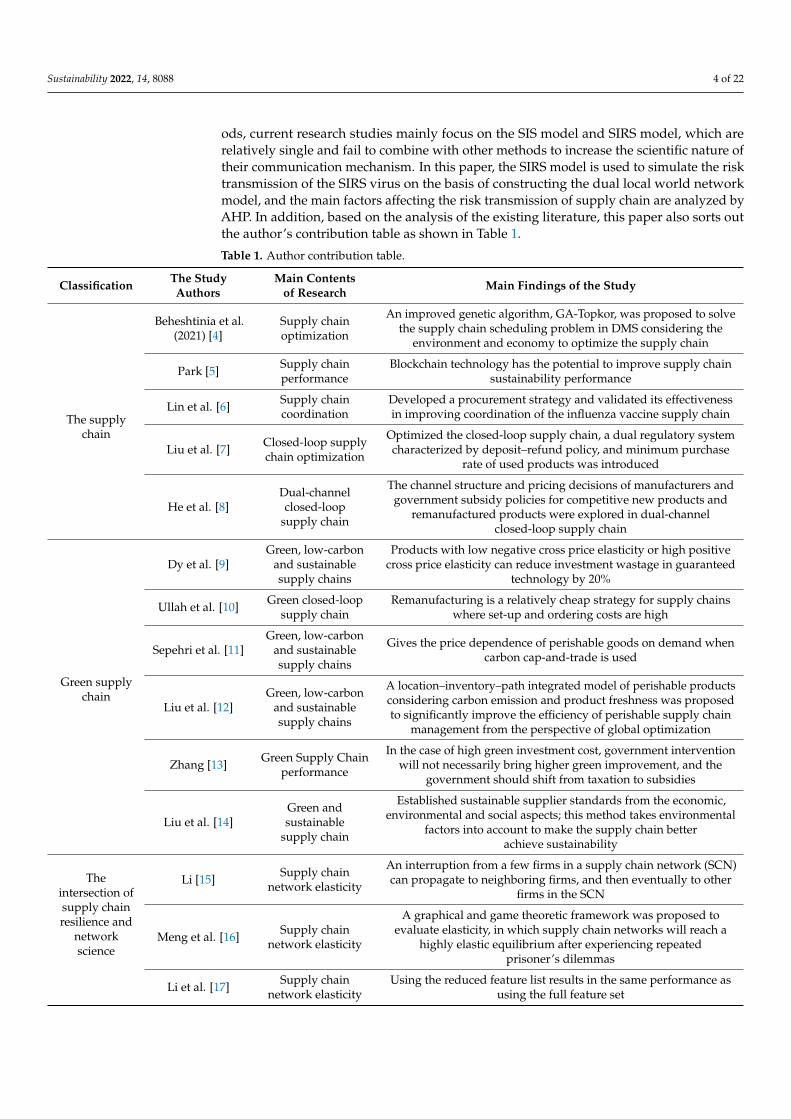
ods, current research studies mainly focus on the SIS model and SIRS model, which arerelatively single and fail to combine with other methods to increase the scientific nature oftheir communication mechanism. In this paper, the SIRS model is used to simulate the risktransmission of the SIRS virus on the basis of constructing the dual local world networkmodel, and the main factors affecting the risk transmission of supply chain are analyzed byAHP. In addition, based on the analysis of the existing literature, this paper also sorts outthe author’s contribution table as shown in Table 1.
Table 1. Author contribution table.
Classification The StudyAuthors
Main Contentsof Research Main Findings of the Study
The supplychain
Beheshtinia et al.(2021) [4]
Supply chainoptimization
An improved genetic algorithm, GA-Topkor, was proposed to solvethe supply chain scheduling problem in DMS considering the
environment and economy to optimize the supply chain
Park [5] Supply chainperformance
Blockchain technology has the potential to improve supply chainsustainability performance
Lin et al. [6] Supply chaincoordination
Developed a procurement strategy and validated its effectivenessin improving coordination of the influenza vaccine supply chain
Liu et al. [7] Closed-loop supplychain optimization
Optimized the closed-loop supply chain, a dual regulatory systemcharacterized by deposit–refund policy, and minimum purchase
rate of used products was introduced
He et al. [8]Dual-channelclosed-loop
supply chain
The channel structure and pricing decisions of manufacturers andgovernment subsidy policies for competitive new products and
remanufactured products were explored in dual-channelclosed-loop supply chain
Green supplychain
Dy et al. [9]Green, low-carbon
and sustainablesupply chains
Products with low negative cross price elasticity or high positivecross price elasticity can reduce investment wastage in guaranteed
technology by 20%
Ullah et al. [10] Green closed-loopsupply chain
Remanufacturing is a relatively cheap strategy for supply chainswhere set-up and ordering costs are high
Sepehri et al. [11]Green, low-carbon
and sustainablesupply chains
Gives the price dependence of perishable goods on demand whencarbon cap-and-trade is used
Liu et al. [12]Green, low-carbon
and sustainablesupply chains
A location–inventory–path integrated model of perishable productsconsidering carbon emission and product freshness was proposedto significantly improve the efficiency of perishable supply chain
management from the perspective of global optimization
Zhang [13] Green Supply Chainperformance
In the case of high green investment cost, government interventionwill not necessarily bring higher green improvement, and the
government should shift from taxation to subsidies
Liu et al. [14]Green andsustainable
supply chain
Established sustainable supplier standards from the economic,environmental and social aspects; this method takes environmental
factors into account to make the supply chain betterachieve sustainability
Theintersection ofsupply chainresilience and
networkscience
Li [15] Supply chainnetwork elasticity
An interruption from a few firms in a supply chain network (SCN)can propagate to neighboring firms, and then eventually to other
firms in the SCN
Meng et al. [16] Supply chainnetwork elasticity
A graphical and game theoretic framework was proposed toevaluate elasticity, in which supply chain networks will reach a
highly elastic equilibrium after experiencing repeatedprisoner’s dilemmas
Li et al. [17] Supply chainnetwork elasticity
Using the reduced feature list results in the same performance asusing the full feature set

Sustainability 2022, 14, 8088 5 of 22
Table 1. Cont.
Classification The StudyAuthors
Main Contentsof Research Main Findings of the Study
Supply chainrisk transmission
mechanism
Pankaj et al. [18] Supply chainperformance Risk
t test of two samples was used to find the influence of differentrisks in cross-border e-commerce supply chain on supply chain
performance, as well as the influence of one risk relative to another
Tie et al. [19] Supply chain riskdissemination
SIR model was used to simulate the diffusion of network risks, andthe robustness of the network under different risks was studied
Zhang [20] Supply chain riskdissemination
The priority of various attacks can be solved by studying theanti-risk capability parameters
Syed et al. [21] Main risks of supplychain
A grey-based hybrid decision experiment and evaluationlaboratory (DEMATEL) model was proposed to evaluate the
relationship between the major risks identified in FSC
Wang [22] Supply chainnetwork risk
The complex supply chain network model and cascading failuremodel were combined to observe the dynamic risk propagation
process of the supply chain network
Chhimwal et al.[23]
Circular supplychain risk
The opposite side of the circular supply chain can be the source ofrisk dissemination during the implementation of the
circular concept
Gouda [24] Sustainable Supplychain risk
While sustainability efforts help to reduce supply chain risks,passive risk mitigation strategies combined with sustainable
development efforts can reduce supply chain risks
Supply chainrisk propagation
modelingmethod
Lei et al. [25] Improved SIS modelCombined with the complex network model and the optimizationmethod of risk control strategy selection, an improved SIS model
was proposed to discuss the supply chain risk propagation
Zheng [26] SIRS riskcontagion model
Based on the SIRS risk contagion model, the transmission processof credit risk between enterprises after the stock market burst was
described by the contagion process
On the basis of establishing the dual local world network model used to simulate theactual situation, this paper explores the risk transmission mechanism in the B2C cross-border e-commerce supply chain network by combining the RISK transmission model ofthe SIRS virus and proposes an avoidance strategy. At first, this paper builds a doublelocal world fitness network model, and the actuality of the model is validated with a riskdynamics simulation model. Then, it builds a SIRS virus spread risk model, establishesinfluence on the spread of the risk evaluation index system, and then uses the analytichierarchy process (AHP) to calculate the spread of B2C cross-border electricity supply chainrisk weights of the affecting factors. The results show that in terms of risk immunity ofthe enterprise itself, whether the company’s capital is stable and whether the companyhas established a perfect risk monitoring and coping mechanism has a great impact onits risk transmission. From the perspective of enterprise external risk intensity, whetherthe transaction is safe or not regarding logistics problems has a greater impact on itsrisk dissemination.
The theoretical contributions of this paper are as follows:
(1) The research of this paper provides a new idea for the establishment of a B2C cross-border e-commerce supply chain model and the exploration of a risk transmissionmechanism. The fitness model and the local world model are combined and improved,and the fitness network model based on the dual local world is established.
(2) The SIRS virus model is applied to the study of a supply chain risk transmissionmechanism, and the factors influencing supply chain risk transmission of B2C cross-border e-commerce are explored.
The practical significance of this paper mainly includes the following points:
Sustainability 2022, 14, 8088 6 of 22
(1) In this paper, a risk dynamics simulation is used to verify the constructed dual localworld fitness network model, and the results show that the model is consistent withthe real supply chain network model, which provides a model reference for theenterprise simulation experiment in the real supply chain.
(2) Based on the RISK transmission model of the SIRS virus, this paper establishesan evaluation index system affecting risk transmission, calculates the main factorsaffecting risk transmission by using analytic hierarchy process, and puts forwardspecific measures and suggestions to control and avoid risks, which have a positiveimpact on the response to supply chain risks in reality.
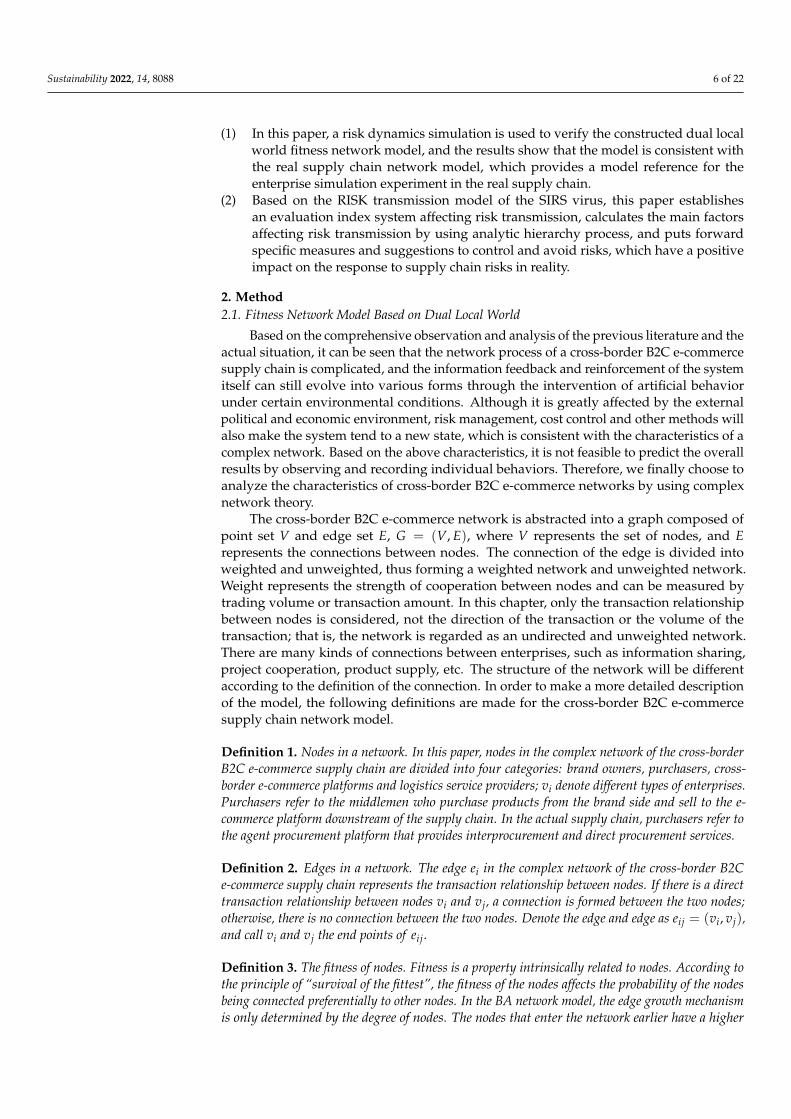
2. Method2.1. Fitness Network Model Based on Dual Local World
Based on the comprehensive observation and analysis of the previous literature and theactual situation, it can be seen that the network process of a cross-border B2C e-commercesupply chain is complicated, and the information feedback and reinforcement of the systemitself can still evolve into various forms through the intervention of artificial behaviorunder certain environmental conditions. Although it is greatly affected by the externalpolitical and economic environment, risk management, cost control and other methods willalso make the system tend to a new state, which is consistent with the characteristics of acomplex network. Based on the above characteristics, it is not feasible to predict the overallresults by observing and recording individual behaviors. Therefore, we finally choose toanalyze the characteristics of cross-border B2C e-commerce networks by using complexnetwork theory.
The cross-border B2C e-commerce network is abstracted into a graph composed ofpoint set V and edge set E, G = (V, E), where V represents the set of nodes, and Erepresents the connections between nodes. The connection of the edge is divided intoweighted and unweighted, thus forming a weighted network and unweighted network.Weight represents the strength of cooperation between nodes and can be measured bytrading volume or transaction amount. In this chapter, only the transaction relationshipbetween nodes is considered, not the direction of the transaction or the volume of thetransaction; that is, the network is regarded as an undirected and unweighted network.There are many kinds of connections between enterprises, such as information sharing,project cooperation, product supply, etc. The structure of the network will be differentaccording to the definition of the connection. In order to make a more detailed descriptionof the model, the following definitions are made for the cross-border B2C e-commercesupply chain network model.
Definition 1. Nodes in a network. In this paper, nodes in the complex network of the cross-borderB2C e-commerce supply chain are divided into four categories: brand owners, purchasers, cross-border e-commerce platforms and logistics service providers; vi denote different types of enterprises.Purchasers refer to the middlemen who purchase products from the brand side and sell to the e-commerce platform downstream of the supply chain. In the actual supply chain, purchasers refer tothe agent procurement platform that provides interprocurement and direct procurement services.
Definition 2. Edges in a network. The edge ei in the complex network of the cross-border B2Ce-commerce supply chain represents the transaction relationship between nodes. If there is a directtransaction relationship between nodes vi and vj, a connection is formed between the two nodes;otherwise, there is no connection between the two nodes. Denote the edge and edge as eij = (vi, vj),and call vi and vj the end points of eij.
Definition 3. The fitness of nodes. Fitness is a property intrinsically related to nodes. According tothe principle of “survival of the fittest”, the fitness of the nodes affects the probability of the nodesbeing connected preferentially to other nodes. In the BA network model, the edge growth mechanismis only determined by the degree of nodes. The nodes that enter the network earlier have a higher
Sustainability 2022, 14, 8088 7 of 22
degree and become hub nodes in the network. However, the actual network connection mechanism isnot only determined by the “age” of the nodes. In the cross-border B2C e-commerce supply chainnetwork, each node has its own fitness attribute.
In this study, the fitness of the nodes in the supply chain network consists of theproduction/operation scale, product quality, product price, logistics capacity, informationcapacity and other fitness factors of the nodes [37]; it is a comprehensive index, expressedby Formula (1):
ηi = αRi + βSi + · · ·+ δQi (1)
where Ri, Si, · · · , Qi respectively represent the production/operation scale, product quality,product price and other fitness of node i, and component α, β, · · · , δ corresponds to theweight of the fitness factor, α + β + · · ·+ δ = 1.
Since fitness components belong to different dimensions, and normalization is carriedout according to Formula (2):
Si′ =
SimaxSi
(2)
where maxSi represents the scale value of the node with the largest production/operationscale among all such nodes. Other fitness factors are normalized in the same way, and theFormula is rewritten as (3):
ηi = αRi′ + βSi
′ + · · ·+ δQi′ (3)
Definition 4. Local world of nodes. A node’s local world refers to the range of nodes that canbe connected when a new node joins the network. In a supply chain network, the local world isdetermined by the type of nodes and the connection mechanism of the network. The local world ofeach type of node is described in more detail later.
In the cross-border B2C e-commerce supply chain, the distribution of market shares isnot uniform, in a state of “one exceeds many strong”, and a few enterprises with strongcomprehensive strength occupy the majority of market shares. Therefore, we can think thatthe node fitness in the network conforms to the power-law distribution. The node fitnessobeys the power-law distribution with parameter F(η) ∝ Ci · η−λ
i + Di, where Ci is thecoefficient, λ is the power index, Di is the constant, and i = 1, 2, 3, 4 represent the brand,purchaser, cross-border e-commerce platform and logistics service provider, respectively.The fitness in this model does not change over time.
The power-law distribution of fitness indicates that the fitness of a few nodes is largewhile that of most nodes is small. In a practical supply chain network, some companieswith strong comprehensive strength can cooperate across levels, such as the stronger brandcan not only reach a cooperation with buyers, but can also reach directly with the electricbusiness platform to build cooperation or to arrange logistics delivery to the customerdirectly; similarly, the other nodes in the network may also be because the fitness is big andhas the ability of across hierarchy connection, as shown in Table 2.
Table 2. A local world.
The Node Type A Local World W1
Brand party Purchaser + cross-border e-commerce platform + logistics service providerPurchaser Brand side + cross-border e-commerce platform + logistics service provider
Cross-border e-commerce platform Brand side + purchaser + logistics service providerLogistics service provider Brand side + purchaser + cross-border e-commerce platform
Sustainability 2022, 14, 8088 8 of 22
The selection of the dual world is determined by the connection capacity of the nodeitself and is affected by the parameters in the model. During simulation, the changes ofnetwork structure are observed by adjusting the parameters.
2.2. Model Formulation
In the cooperation evolution of a cross-border B2C e-commerce supply chain, nodalenterprises select partners according to their comprehensive strength and survival andaccording to adaptability, and the establishment of cooperative relations between nodes isthe result of mutual selection. The fitness model in a complex network is improved andsupplemented on the basis of a BA scale-free network model, and the concept of “fitness”is introduced; that is, the survivability of nodes is also taken into account in the priorityconnection mechanism. In the fitness network model, the priority connection mechanismsbetween new nodes and existing nodes in the network are not only related to the degree ofnodes, but are also related to the fitness of nodes, which is determined by the product ofdegree and fitness. However, in the fitness model, all nodes are regarded as similar nodeswithout distinction, which is inconsistent with the actual cross-border e-commerce supplychain network. In the actual cross-border e-commerce supply chain network, differentselection ranges need to be established according to the different types of brand parties,purchasers, cross-border e-commerce platforms and logistics service providers, which isconsistent with the concept of the local world [38]. The local world of a node is determinedaccording to its position in the supply chain. The local world of a node refers to the nodethat can establish a trading relationship with it. For example, purchasers can establisha trading relationship with brand owners and cross-border e-commerce platforms butcannot establish a trading relationship with similar purchasers. In addition, the local worldselected by the new node in the local world evolution model is randomly selected, whichobviously does not conform to the actual characteristics of a cross-border B2C e-commercesupply chain network.
In the fitness model proposed by Bianconi [39], the fitness of nodes is subject to acertain distribution, but there is no unified conclusion on which distribution should besubjected. It needs to be determined according to the actual characteristics of nodes and thespecific connotation of fitness in the network. According to the study of Servedio et al. [40],no matter what distribution of fitness is adopted, as long as the network is generatedaccording to the fitness model, it will have the characteristics of a scale-free network.
The supply chain network is a fitness network model based on dual LANs. The modeldivides a dual LANs according to the class of nodes and then selects the dual LANs thatcan be connected according to the characteristics of the nodes. In addition, the numberof edges of new nodes in the model is determined by node category and fitness and iscombined with the characteristics of cross-border B2C e-commerce supply chain modeling.The description is supplemented as follows.
Interventionary studies involving animals or humans, and other studies that requireethical approval, must list the authority that provided approval and the correspondingethical approval code.
1. Construction of a supply chain network. The nodes in the cross-border B2C e-commerce supply chain network are divided into four types: brand side, purchaser,cross-border e-commerce platform and logistics service provider, and a four-levelsupply chain network composed of “brand side, purchaser, cross-border e-commerceplatform and logistics service provider” is constructed.
2. Local world selection. First, the new node’s LANs are determined according tothe type of new node, that is, all related nodes (including five nodes) that the newnode can link to. Then, nodes are randomly selected from the new node’s LANsas W1M1M2W2;
3. Determination of connection mechanism. The connection mechanism of new nodesis determined according to their fitness, the scope of one local world is determined

Sustainability 2022, 14, 8088 9 of 22
according to node type, and the connection probability of existing nodes in the twolocal worlds is determined according to degree and fitness.
4. Selection of fitness. In this paper, the fitness of nodes is the attribute of the internalcompetitiveness of the nodes, which reflects the attractiveness of a node to formsupply chain cooperation with other nodes. It is a comprehensive index composedof many factors such as node scale, product quality, price, product type, reputation,business ability and so on.
2.3. Connection Mechanism
When a new node is added to the network, it first needs to determine the type of nodeand local world W1 and then randomly select M2 nodes from W1 as the duel local worldW2, and connect to mi nodes among them.
The probability of a node vi in the dual local world connected to a new node vj isdetermined by the degree and fitness of the node, as shown in Formula (4):
∏(j→ i) =ηiki
∑l∈Wj
ηlkl(4)
where ηi is the fitness of the node vi; ki is the degree of the node vi. The above formulashows that the connection probability of a node to a new node in the local world W2depends on the proportion of the product of degree and fitness of this node to the productof degree and fitness of all nodes in the local world.
2.4. Connection Mechanism
1. Initial network. At the beginning t = 0, the network begins as a small network ofnodes m0. These nodes include brand parties, purchasers, cross-border e-commerceplatforms and logistics service providers. The network is randomly connected intoedges according to the upstream and downstream adjacent levels of the supply chain.The fitness of all types of nodes is selected according to the power-law distribution,assuming that the proportion of nodes in the network is N1 : N2 : N3 : N4.
2. Network growth. Every time t increases by one node, the category of the new node israndomly generated according to the proportion of all types of nodes in the network.First, the category of new nodes is judged, and fitness values are assigned to themaccording to fitness distribution ηi. The edge number mi of the new node is determinedby the node type. The primary and secondary LANs are selected corresponding to thenew node according to the above rules, and mi nodes are connected in the secondaryLANs according to the above formula.
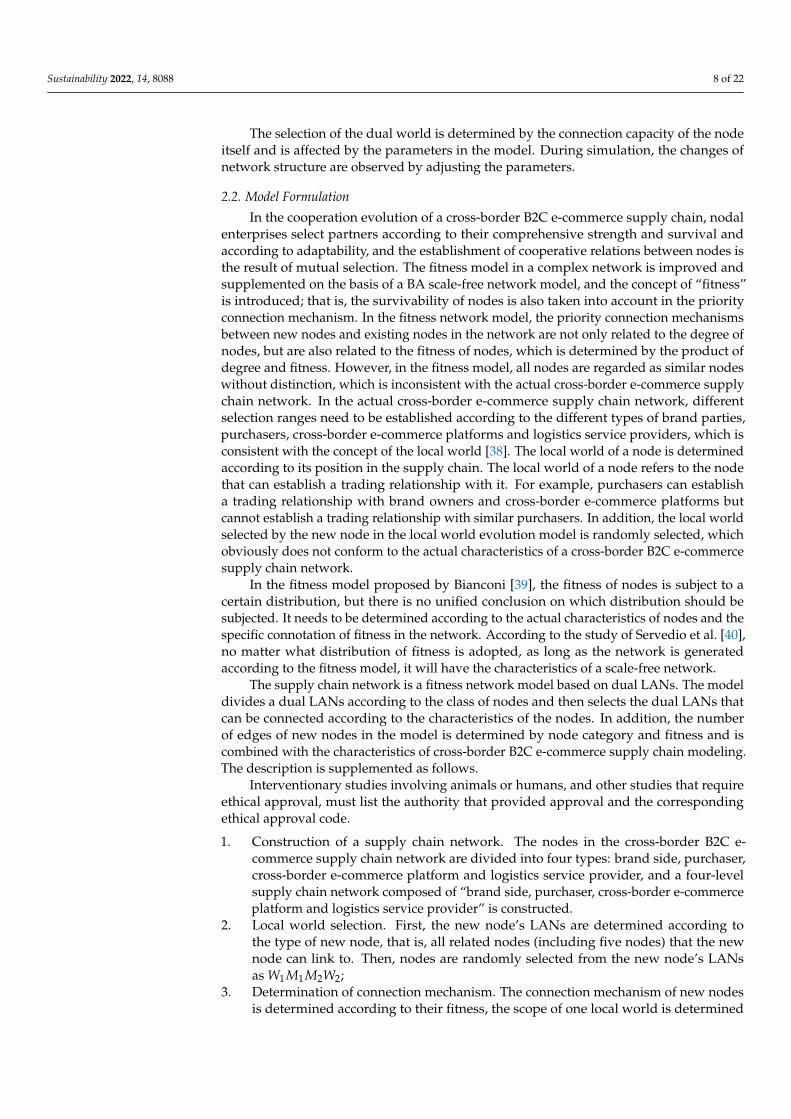
This step is repeated until the set time t, and the network with N = m0 + t nodes isfinally obtained. By controlling the total number of nodes N in the network, networks ofdifferent sizes can be generated according to the above algorithm. The growth process ofthe network is shown in Figure 1.
Sustainability 2022, 14, 8088 10 of 22
Figure 1. Network growth process.
2.5. Simulation Analysis
In this paper, the risk dynamics model is used to establish a simulation analysisof the fitness network model of the dual local world, in order to verify that the fitnessnetwork model of the dual local world is consistent with the actual situation and to lay afoundation for the risk propagation model below. Refer to relevant literature [18] to setvarious parameter values of the model as follows:
1. Initial network. Set the number of various nodes in the initial network as 4 for brandparties N1, 3 for purchasers N2, 2 for cross-border e-commerce platforms N3 and 1 forlogistics service providers N4. Set initial connection according to the full connectionbetween the adjacent layers of “brand party—purchaser—cross-border e-commerceplatform—logistics service provider”. The number of nodes m0 = 10 and the numberof connected edges e0 = 20 in the initial network can be calculated.
2. Network growth. Set the generation ratio of various nodes on the network toN1 : N2 : N3 : N4 = 4 : 3 : 2 : 1. The power index of non-uniform networkis small, and the power index of some large-scale complex networks is generallybetween 2–3. For example, the power index of the Internet is between 2.2 and2.48, and the power index of a metabolic network is about 2.2. Due to the lim-ited scale of the model in this paper, the power index of the above large-scalenetwork is adjusted, and finally the fitness distribution parameters of all nodesare set as η1 ∝ 2000η1
−2.21 + 3, η2 ∝ 3000η2−2.21 + 150, η3 ∝ 5000η3
−2.21 + 300,η4 ∝ 2000η4
−2.21 + 10. See Sections 2.3 and 2.4 for details on the local world of thenew node and the connection mechanism.
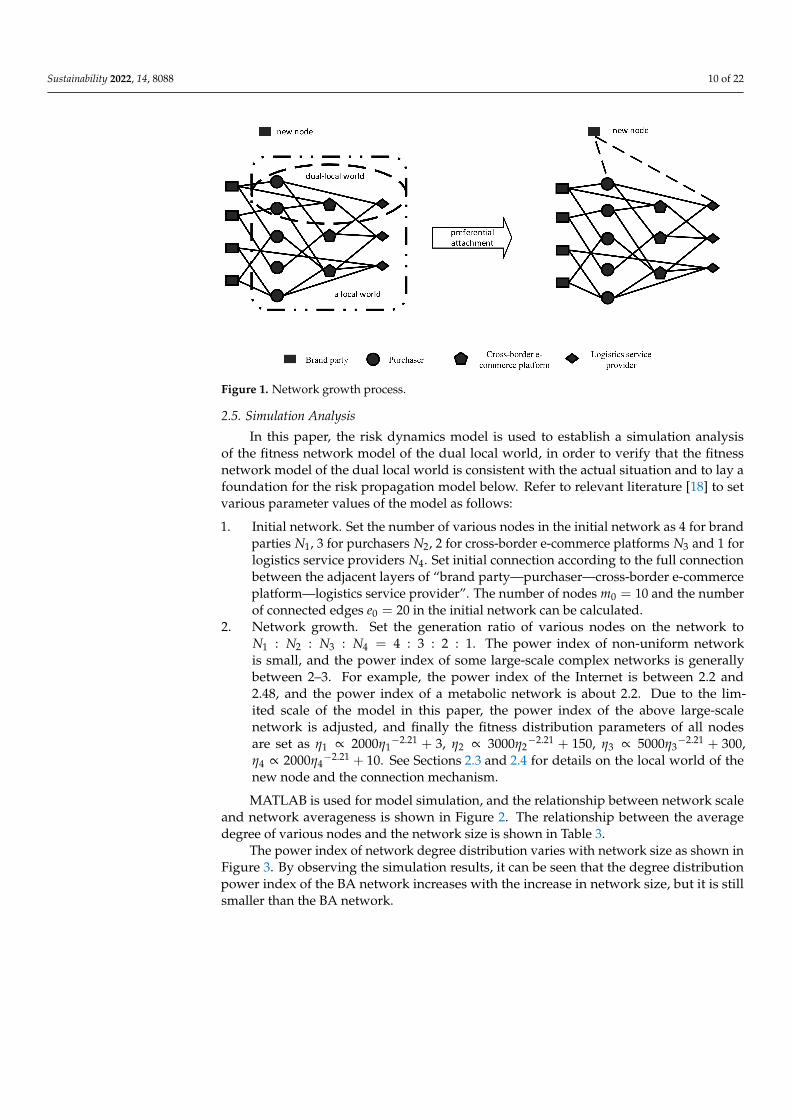
MATLAB is used for model simulation, and the relationship between network scaleand network averageness is shown in Figure 2. The relationship between the averagedegree of various nodes and the network size is shown in Table 3.
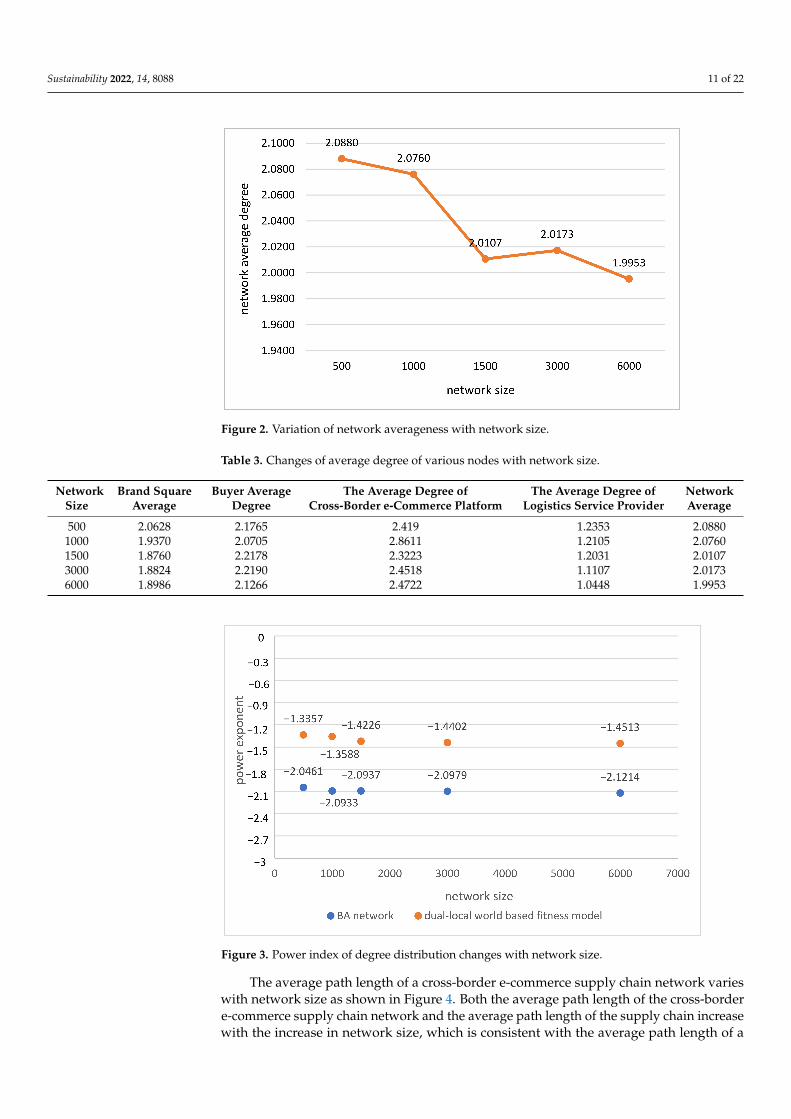
The power index of network degree distribution varies with network size as shown inFigure 3. By observing the simulation results, it can be seen that the degree distributionpower index of the BA network increases with the increase in network size, but it is stillsmaller than the BA network.
Sustainability 2022, 14, 8088 11 of 22
Figure 2. Variation of network averageness with network size.
Table 3. Changes of average degree of various nodes with network size.
NetworkSize
Brand SquareAverage
Buyer AverageDegree
The Average Degree ofCross-Border e-Commerce Platform
The Average Degree ofLogistics Service Provider
NetworkAverage
500 2.0628 2.1765 2.419 1.2353 2.08801000 1.9370 2.0705 2.8611 1.2105 2.07601500 1.8760 2.2178 2.3223 1.2031 2.01073000 1.8824 2.2190 2.4518 1.1107 2.01736000 1.8986 2.1266 2.4722 1.0448 1.9953
Figure 3. Power index of degree distribution changes with network size.
The average path length of a cross-border e-commerce supply chain network varieswith network size as shown in Figure 4. Both the average path length of the cross-bordere-commerce supply chain network and the average path length of the supply chain increasewith the increase in network size, which is consistent with the average path length of a

Sustainability 2022, 14, 8088 12 of 22
BA scale-free network of the same size. With the growth of the nodes, compared with theBA network, the average path length of the dual LANs fitness network is reduced, but theeffect is still not obvious; that is, nodes with high fitness account for a smaller proportionof the total nodes, and there are still a few enterprises that can connect across hierarchies.
Figure 4. Variation of average path length with network size.
3. Risk Transmission Analysis of Supply Chain Network Based on SIRS Model
The dynamic research of network risk communication is an important aspect of riskcommunication research. There are all kinds of risks in the supply chain network. Nodalenterprises not only have to deal with their own risks due to management problems,they also resist the risks caused by the spread of other enterprises’ risks through thenetwork. Research on the modes and characteristics of risk transmission on the networkare helpful for enterprises to reasonably avoid risks and unnecessary losses. The analytichierarchy process (AHP) is a kind of hierarchical weight analysis method proposed byAmerican operational research scientist Saaty when he studied the problems related topower distribution. The method is decomposed into multiple hierarchical structuresaccording to the order of general objective, sub-objective of each level, evaluation criterionand backup scheme. It calculates the eigenvector of judgment matrix to obtain the weightvalue of each layer relative to the upper layer and the weighted recursive merging of thefinal weight, and the final weight determines the optimal scheme. On the basis of the SIRSmodel, this paper uses the analytic hierarchy process (AHP) to explore the factors that havethe greatest influence on supply chain risk immunity and external risk intensity. The modelassumes that each factor is independent and undisturbed from each other.
The basic steps of AHP are as follows:The first step is to establish a hierarchy.The problem can be divided into target layer, criterion layer and scheme layer accord-
ing to needs. The number of layers is related to the complexity of the problem. Generally,there are no more than nine sub-factors under a single factor; otherwise, the subsequentcomparison will be more difficult.
The second step is to determine the scale and construct the judgment matrix.In order to distinguish the importance of different indicators in different levels, a scale
is introduced. Scale is an important measure regarding the relative importance of twoindicators, and the 1–9 scale method is commonly used. Too many scales will affect thedecision makers’ judgment and reduce decision-making efficiency, while too few scalesare not conducive to distinguishing the relative importance of each indicator, as shownin Table 4.

Sustainability 2022, 14, 8088 13 of 22
Table 4. Scale and its meaning.
Scale aij Definition
1 The two elements are of equal importance3 Compared with the two elements, the former is slightly more important or advantageous than the latter5 Compared with the two elements, the former is more important or has advantages than the latter7 Compared with the two elements, the former is very important or has advantages over the latter9 Compared with the two elements, the former is definitely more important or advantageous than the latter
2, 4, 6, 8 Is the intermediate value between the above scalesThe bottom Contrary to the above implication, aij = 1/aji
The third step is to calculate the eigenvectors and weights.The calculation of index weight can usually use the sum product method or the
root method. The root method used in this paper needs to normalize the weight valueafter calculation.
The fourth step is the consistency test.Subjective judgment may cause contradictions in the results of the matrix, the con-
sistency test can precisely detect such contradictions, and the matrix can be modifiedaccording to the detection results. Consistency index CI is used to measure the degree ofdeviation from the complete consistency of the judgment matrix, and the greater the value,the greater the deviation degree. The calculation formula is shown in Formula (5):{
CR = CIRI ≤ 0.1
CI = λmax−nn−1
(5)
CI is the consistency index, CR is the relative consistency index, and RI is the averagerandom consistency index.
The random consistency of different orders is shown in Table 5.
Table 5. Random consistency RI table.
N Order 3 4 5 6 7 8 9 10 11
RI values 0.52 0.89 1.12 1.26 1.36 1.41 1.46 1.49 1.52
3.1. Risk Communication Model Construction
In the SIRS risk transmission model, the population has three states of susceptibility,infection and immunity [40]; the state of the enterprise is risk susceptibility, risk infectionand risk immunity. However, in the actual supply chain network, besides these three states,the enterprise may withdraw from the network because it cannot resist risks [21]. Therefore,the SIRS model is improved, and the elimination coefficient λ is introduced. The improvedpropagation mechanism of the model is shown in Figure 5.
Figure 5. Risk transmission mechanism.

Sustainability 2022, 14, 8088 14 of 22
The definitions of relevant variables and parameters in the model are shown in Table 6.
Table 6. Model-related variables and definitions.
Variable Instructions
s(t) Denotes the node density in a susceptible state in the network at time t
i(t) Denotes the density of nodes in the infected state in the network at time t
r(t) Represents the node density in the immune state in the network at time t
p(t) Denotes the node density in the obsolete state in the network at time t
αRepresents the risk infection probability, that is, the probability of changing from susceptible state to infected
state after contacting the node in the infected state
γIs the probability of risk removal, that is, the probability of the infected node removing the risk and entering
the satisfactory state through a series of measures
σIs the probability of losing immunity, that is, the probability that the node of the immune state neglects to
guard against risks and enters the susceptible state again
λIs the probability of elimination, that is, the probability that the infected node cannot resist the risk and exits
the network
3.2. Influencing Factors of Model Parameters
The risk tolerance of the supply chain itself and the external risk intensity jointlydetermine the risk transmission and enterprise damage among the cross-border B2C e-commerce supply chains. According to the relevant literature, the risk immunity of supplychain is divided into three parts: resistance ability, learning ability and recovery ability. Theinfluence of each factor on parameters is shown in Figure 6.
Figure 6. Influencing factors of model parameters.
3.2.1. Establishment of Evaluation Indicators
By referring to the relevant literature [16–29] and consulting experts and scholars insupply chain and cross-border e-commerce, this paper sets three s-level indicators and13 third-level indicators for enterprise supply chain risk immunity, as shown in Table 7,and three s-level indicators and 10 third-level indicators for the intensity of external risks,as shown in Table 8.
Sustainability 2022, 14, 8088 15 of 22
Table 7. Index of supply chain risk immunity evaluation.
Level Indicators The Secondary Indicators Level 3 Indicators
Supply chainrisk immunity
Risk resilience
Degree of dependence on a particular partnerPerfection of information channels
Financial soundnessRisk alarm mechanism
Risk resilience
Degree of enterprise flexibilityStability of cooperation with key enterprises
Risk taking mechanismRisk response speed
Risk management capability
Risk learning ability
Employee trainingUpper level of attention
Continuous risk monitoring mechanismRisk review mechanism
Table 8. External risk intensity evaluation indicators.
Level Indicators The Secondary Indicators Level 3 Indicators
External risk intensity
Environment
Accuracy and timeliness of requirements acquisitionRelevant policies and regulations
Economic situationIndustry risk
Force majeure such as natural disasters
Trading Risk of cross-border paymentCredit risk
LogisticsDistribution timeoutGoods are damaged
Risk of customs clearance
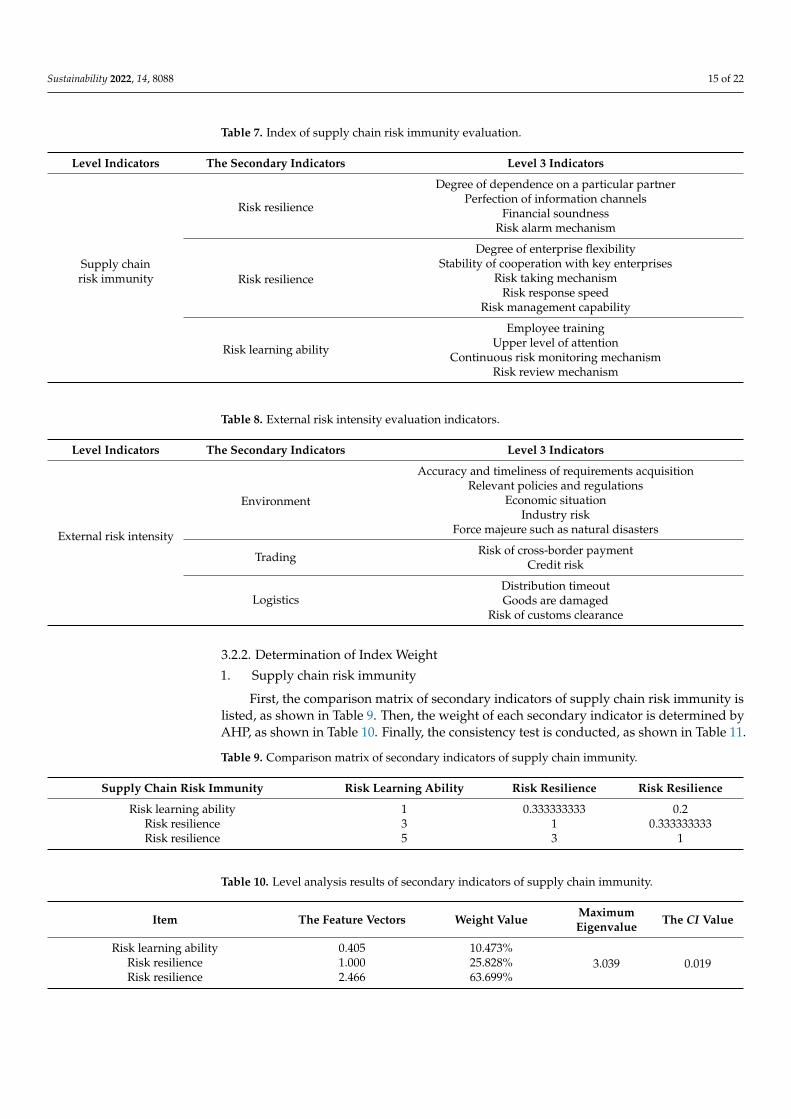
3.2.2. Determination of Index Weight
1. Supply chain risk immunity
First, the comparison matrix of secondary indicators of supply chain risk immunity islisted, as shown in Table 9. Then, the weight of each secondary indicator is determined byAHP, as shown in Table 10. Finally, the consistency test is conducted, as shown in Table 11.
Table 9. Comparison matrix of secondary indicators of supply chain immunity.
Supply Chain Risk Immunity Risk Learning Ability Risk Resilience Risk Resilience
Risk learning ability 1 0.333333333 0.2Risk resilience 3 1 0.333333333Risk resilience 5 3 1
Table 10. Level analysis results of secondary indicators of supply chain immunity.
Item The Feature Vectors Weight Value MaximumEigenvalue The CI Value
Risk learning ability 0.405 10.473%3.039 0.019Risk resilience 1.000 25.828%
Risk resilience 2.466 63.699%

Sustainability 2022, 14, 8088 16 of 22
Table 11. Consistency test results.
Maximum Characteristic Root The CI Value RI Values CR Value Consistency Test Results
3.039 0.019 0.520 0.037 through
The judgment matrix and weight of the three-level indicators of risk resistance areshown in Table 12.
Table 12. Judgment matrix and weight of risk resistance three-level indicators.
Risk Resilience Risk AlarmMechanism
The Perfection ofInformation Channels
FinancialSoundness
The Degree ofDependence on aParticular Partner
Weight Value
Risk alarm mechanism 1 0.333333333 0.333333333 0.5 10.855%
Perfection ofinformation channels 3 1 0.333333333 0.5 18.801%
Financial soundness 3 3 1 1 38.725%
Degree of dependence ona particular partner 2 2 1 1 31.619%
Table 13 shows the judgment matrix and weight of the three-level indicators of riskrecovery capability.
Table 13. Judgment matrix and weight of three-level indicators of risk recovery capability.
Risk ResilienceDegree ofEnterpriseFlexibility
Stability ofCooperation
with KeyEnterprises
Risk TakingMechanism
Risk ResponseSpeed
RiskManagement
CapabilityWeight Value
Degree of enterprise flexibility 1 1 0.5 0.5 0.333333 10.938%
Stability of cooperation withkey enterprises 1 1 0.5 0.5 0.333333 10.938%
Risk taking mechanism 2 2 1 1 0.5 20.653%
Risk response speed 2 2 1 1 0.5 20.653%
Risk management capability 3 3 2 2 1 36.817%
The judgment matrix and weight of the third-level indicators of risk learning abilityare shown in Table 14.
Table 14. Risk learning ability three-level indicator judgment matrix and weight.
Risk Learning Ability EmployeeTraining
Upper Level ofAttention
Continuous RiskMonitoring Mechanism
Risk ReviewMechanism Weight Value
Employee training 1 1 0.333333 0.333333 12.50%
Upper level of attention 1 1 0.333333 0.333333 12.50%
Continuous riskmonitoring mechanism 3 3 1 1 37.50%
Risk review mechanism 3 3 1 1 37.50%
The overall index weight of supply chain risk immunity is shown in Table 15.

Sustainability 2022, 14, 8088 17 of 22
Table 15. Overall index weights of supply chain risk immunity.
The SecondaryIndicators
The Weight of theFirst-Level Indicators Level 3 Indicators To the Secondary
Index WeightThe Weight of the
First-Level Indicators
Risk resilience 63.699%
Risk alarm mechanism 10.855% 0.06914526Perfection of information channels 18.801% 0.11976049
Financial soundness 38.725% 0.24667438Degree of dependence on a particular partner 31.619% 0.20140987
Risk resilience 25.828%
Degree of enterprise flexibility 10.938% 0.02825067Stability of cooperation with key enterprises 10.938% 0.02825067
Risk taking mechanism 20.653% 0.05334257Risk response speed 20.653% 0.05334257
Risk management capability 36.817% 0.09509095
Risk learningability 10.473%
Employee training 12.500% 0.01309125Upper level of attention 12.500% 0.01309125
Continuous risk monitoring mechanism 37.500% 0.03927375Risk review mechanism 37.500% 0.03927375
2. External risk intensity
First, the comparison matrix of secondary indicators of external risk intensity is listed,as shown in Table 16. Then, AHP is used to determine the weight of each secondaryindicator, as shown in Table 17. Finally, the consistency test is conducted, as shownin Table 18.
Table 16. Comparison matrix of secondary indicators of external risk intensity.
External Risk Intensity The Environment Trading Logistics
The environment 1 0.5 0.5trading 2 1 1logistics 2 1 1
Table 17. Hierarchical analysis results of secondary indicators of external risk intensity.
Item The Feature Vectors Weight Value Maximum Eigenvalue The CI Value
The environment 0.630 20.000%3.000 0.000trading 1.260 40.000%
logistics 1.260 40.000%
Table 18. Consistency test results.
Maximum Characteristic Root The CI Value RI Values CR Value Consistency Test Results
3.000 0.000 0.520 0.000 through
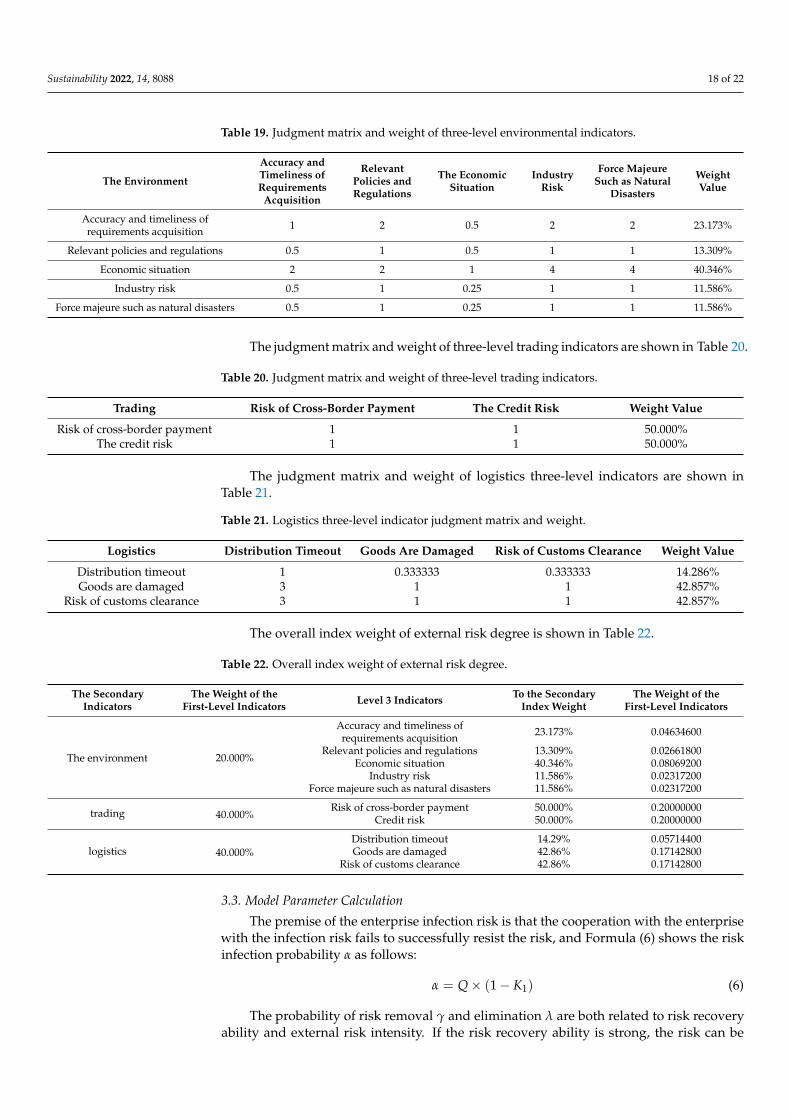
The judgment matrix and weight of the three-level environmental indicators are shownin Table 19.
Sustainability 2022, 14, 8088 18 of 22
Table 19. Judgment matrix and weight of three-level environmental indicators.
The Environment
Accuracy andTimeliness ofRequirements
Acquisition
RelevantPolicies andRegulations
The EconomicSituation
IndustryRisk
Force MajeureSuch as Natural
Disasters
WeightValue
Accuracy and timeliness ofrequirements acquisition 1 2 0.5 2 2 23.173%
Relevant policies and regulations 0.5 1 0.5 1 1 13.309%
Economic situation 2 2 1 4 4 40.346%
Industry risk 0.5 1 0.25 1 1 11.586%
Force majeure such as natural disasters 0.5 1 0.25 1 1 11.586%
The judgment matrix and weight of three-level trading indicators are shown in Table 20.
Table 20. Judgment matrix and weight of three-level trading indicators.
Trading Risk of Cross-Border Payment The Credit Risk Weight Value
Risk of cross-border payment 1 1 50.000%The credit risk 1 1 50.000%
The judgment matrix and weight of logistics three-level indicators are shown inTable 21.
Table 21. Logistics three-level indicator judgment matrix and weight.
Logistics Distribution Timeout Goods Are Damaged Risk of Customs Clearance Weight Value
Distribution timeout 1 0.333333 0.333333 14.286%Goods are damaged 3 1 1 42.857%
Risk of customs clearance 3 1 1 42.857%
The overall index weight of external risk degree is shown in Table 22.
Table 22. Overall index weight of external risk degree.
The SecondaryIndicators
The Weight of theFirst-Level Indicators Level 3 Indicators To the Secondary
Index WeightThe Weight of the
First-Level Indicators
The environment 20.000%
Accuracy and timeliness ofrequirements acquisition 23.173% 0.04634600
Relevant policies and regulations 13.309% 0.02661800Economic situation 40.346% 0.08069200
Industry risk 11.586% 0.02317200Force majeure such as natural disasters 11.586% 0.02317200
trading 40.000%Risk of cross-border payment 50.000% 0.20000000
Credit risk 50.000% 0.20000000
logistics 40.000%Distribution timeout 14.29% 0.05714400Goods are damaged 42.86% 0.17142800
Risk of customs clearance 42.86% 0.17142800
3.3. Model Parameter Calculation
The premise of the enterprise infection risk is that the cooperation with the enterprisewith the infection risk fails to successfully resist the risk, and Formula (6) shows the riskinfection probability α as follows:
α = Q× (1− K1) (6)
The probability of risk removal γ and elimination λ are both related to risk recoveryability and external risk intensity. If the risk recovery ability is strong, the risk can be

Sustainability 2022, 14, 8088 19 of 22
removed and enter the immune state; if the risk recovery ability is weak, the risk removalprobability γ and elimination probability λ are shown in Formulas (7) and (8):
γ = Q× K2 (7)
λ = Q× (1− K2) (8)
After the risk is removed, the enterprise will summarize the learning experience fromthe risk and obtain risk immunity for a certain period of time. If the enterprise fails tocontinuously monitor the risk and relax its vigilance, it may enter the susceptible stateagain, and Formula (9) is the probability for the enterprise to lose immunity, as follows:
σ = 1− K3 (9)
4. Risk Control Strategy
In view of the above results, the following risk prevention and control strategies canbe proposed for enterprises related to the cross-border B2C e-commerce supply chain.
From the perspective of the enterprise’s own risk immunity, the first is to ensure thestability of the company’s funds, and the second is to establish a sound risk detection andresponse mechanism. When choosing a partner, an enterprise should avoid relying toomuch on a specific enterprise and reserve alternative enterprises to prevent the enterprisefrom having risks, such as the company being unable to initiate emergency plans in time,thus causing huge losses. At the same time, the company should set aside a contingencyfund in case the capital chain is hit hard and cannot function properly if a sudden riskoccurs. In addition, a sound risk detection and response mechanism is also an importantfactor to prevent risk spread and to reduce corporate losses. Enterprises should train theiremployees in risk identification and response and respond to risks immediately once theyare discovered to prevent their further spread. After the risk is removed, there should becontinued follow up, summarizing and reviewing the cause, processing and results of therisk, as well as the advantages and disadvantages of the response plan, so as to ensure thatthe enterprise can obtain continuous immunity to such risks.
From the perspective of the external factors of enterprises, risks arising from transac-tion security and logistics problems have a more direct impact on enterprises. Due to thecharacteristics of cross-border B2C e-commerce, payment risk and credit risk are greater inthe transaction process, which requires enterprises to be more cautious in the transactionprocess, and enterprises should have a clear record and assessment of the credit status ofcooperative enterprises. In the process of logistics distribution, due to being cross-borderand far away, there is a certain gap in the regional logistics facilities, which are unable toachieve unified management and scheduling; thus, distribution timeout and cargo damagemay exist. In the process of transport logistics, service enterprises should strengthen themonitoring and management of goods and control the location and status information andfeedback to the customer in real time, so as not to affect customer shopping experience dueto information asymmetry. Different from domestic trade, cross-border e-commerce needsto go through customs. Customs in different regions have different efficiency and relevantrequirements and regulations. Logistics service providers should familiarize themselveswith relevant information in advance and make arrangements to avoid affecting the overalloperation efficiency of the supply chain due to low customs clearance efficiency.
5. Conclusions
Based on the B2C cross-border, the electricity industry boom also faces the potentialrisk of problems. At the same time, the complex network theory, combined with the localworld model fitness model, is constructed to simulate the actual situation of a double localfitness network model of the world, and a risk dynamics simulation of the model is used tovalidate laminating actualities. Combined with the risk transmission model of the SIRSvirus, this paper explores the risk transmission mechanism in the supply chain networkof B2C cross-border e-commerce. Finally, suggestions are put forward from the aspects

Sustainability 2022, 14, 8088 20 of 22
of enterprise immunity and enterprise external risk intensity to help enterprises avoidpotential risk factors in the supply chain as much as possible. The main innovations of thispaper are as follows:
(1) This paper constructed a fitness network model based on a dual local world.(2) Based on the SIRS model, this paper introduced the elimination rate, which is used to
describe the situation that some participants in the supply chain network withdrawfrom the network because they cannot resist risks, such that the model as a whole ismore consistent with the actual situation.
The management views of this paper are as follows:
(1) When choosing partners, enterprises should not rely too much on any one enterpriseand should try their best to set aside alternative enterprises.
(2) Establish a sound risk monitoring and response mechanism.(3) Train employees on risk identification and response.(4) Summarize and review in time after encountering risks.(5) Be cautious when transactions occur, and make clear records and assessments of the
credit status of the venture.(6) Enhance the informatization degree of enterprises and improve the operation effi-
ciency of unified management and scheduling.
Although some achievements have been made in this paper, there are still somelimitations, mainly as follows:
(1) The fitness in the fitness network model based on the dual local world is static; that is,it does not change with time, which is inconsistent with the actual network.
(2) In the process of constructing the supply chain network model, only the growth ofthe network is considered, but the situation of quitting the network due to temporarylack of cooperation and other reasons is considered.
(3) In order to simplify the model, the undirected and powerless network is constructedwithout considering the weight of the network, such as the direction of the edge andthe volume of transactions.
(4) This paper lacks research on a risk transmission model for actual cases.
In the future, the deficiencies of this paper can be improved from the following aspects:
(1) Future research can refer to the competitive network model to explore the supply chainnetwork model with time-varying fitness, so that the model can be more consistentwith the actual situation.
(2) In the process of constructing the supply chain network model, more comprehensiveconsiderations can be taken into account, including withdrawal from the network dueto temporary lack of cooperation and other reasons.
(3) In future research, the direction of the model network connection and the weight oftrading volume can be further taken into account.
(4) Practical cases of a risk communication model can be explored in the future to verifythe effectiveness of this model.
Author Contributions: J.W. contributed to the writing of the first draft of this study, model building, caseanalysis, and analysis of relevant experimental results. L.Z. contributed to the concept, method design,research work, and experimental analysis. F.L. and Y.X. contributed to the background research of thisstudy and put forward constructive suggestions for revision. J.Z. and J.S. helped to analyze and makeimportant suggestions for the framework of this article and to make some modifications to the originaldraft. All authors have read and agreed to the published version of the manuscript.
Funding: This research was funded by the National Social Science Fund of China (20BJY185), BeijingSocial Science Foundation (18GLA009), Project of 2020 “Shipei plan” of Beijing Wuzi University,Beijing Collaborative Innovation Center for Intelligent Logistics System (BILSCI-2019KF-12), and theNatural Science Foundation of Shaanxi Province (2021JM-146).
Conflicts of Interest: The authors declare no conflict of interest.
Sustainability 2022, 14, 8088 21 of 22
References1. Shi, R.; Yang, R. Research on the development of Cross-border e-commerce in China in the context of COVID-19. Bus. Econ. 2021,
7, 92–93, 171.2. Wu, D. Research on Procurement and Inventory Management Based on Supply Chain Management. Trade Show Econ. 2021, 15, 58–60.3. Lu, S. Empirical Study of the Influencing Factors of Supply Chain Risks. Appl. Mech. Mater. 2010, 34, 1175–1179. [CrossRef]4. Beheshtinia, M.A.; Feizollahy, P.; Fathi, M. Supply Chain Optimization Considering Sustainability Aspects. Sustainability 2021, 13,
11873. [CrossRef]5. Park, A.; Li, H. The Effect of Blockchain Technology on Supply Chain Sustainability Performances. Sustainability 2021, 13, 1726. [CrossRef]6. Lin, Q.; Zhao, Q.; Lev, B. Influenza vaccine supply chain coordination under uncertain supply and demand. Eur. J. Oper. Res.
2021, 297, 930–948. [CrossRef]7. Liu, Z.; Li, K.W.; Tang, J.; Gong, B.G.; Huang, J. Optimal operations of a closed-loop supply chain under a dual regulation. Int. J.
Prod. Econ. 2021, 233, 107991. [CrossRef]8. He, P.; He, Y.; Xu, H. Channel structure and pricing in a dual-channel closed-loop supply chain with government subsidy. Int. J.
Prod. Econ. 2019, 213, 108–123. [CrossRef]9. Yadav, D.; Kumari, R.; Kumar, N.; Sarkar, B. Reduction of waste and carbon emission through the selection of items with
cross-price elasticity of demand to form a sustainable supply chain with preservation technology. J. Clean. Prod. 2021,297, 126298. [CrossRef]
10. Ullah, M.; Asghar, I.; Zahid, M.; Omair, M.; Sarkar, B. Ramification of remanufacturing in a sustainable three-echelon closed-loopsupply chain management for returnable products. J. Clean. Prod. 2021, 290, 125609. [CrossRef]
11. Sepehri, A.; Mishra, U.; Tseng, M.L.; Sarkar, B. Joint Pricing and Inventory Model for Deteriorating Items with Maximum Lifetimeand Controllable Carbon Emissions under Permissible Delay in Payments. Mathematics 2021, 9, 470. [CrossRef]
12. Liu, A.; Zhu, Q.; Xu, L.; Lu, Q.; Fan, Y. Sustainable supply chain management for perishable products in emerging markets: Anintegrated location-inventory-routing model. Transp. Res. Part E Logist. Transp. Rev. 2021, 150, 102319. [CrossRef]
13. Zhang, X.; Yousaf, H.M.A.U. Green supply chain coordination considering government intervention, green investment, andcustomer green preferences in the petroleum industry. J. Clean. Prod. 2020, 246, 118984. [CrossRef]
14. Liu, A.; Xiao, Y.; Lu, H.; Tsai, S.B.; Song, W. A fuzzy three-stage multi-attribute decision-making approach based on customerneeds for sustainable supplier selection. J. Clean. Prod. 2019, 239, 118043. [CrossRef]
15. Li, Y.; Zobel, C.W. Exploring supply chain network resilience in the presence of the ripple effect. Int. J. Prod. Econ. 2020, 228,107693. [CrossRef]
16. Meng, S.; Dong, W.; Hu, H.; Li, Y. Analysis of supply chain’s resilience in crowd networks. Int. J. Crowd Sci. 2021, 5, 166–184. [CrossRef]17. Li, Y.; Zobel, C.W.; Seref, O.; Chatfield, D. Network characteristics and supply chain resilience under conditions of risk propagation.
Int. J. Prod. Econ. 2020, 223, 107529. [CrossRef]18. Pankaj, D.; Pravin, S.; Pallav, G.; Arnab, D. Managing risk for e-commerce supply chains: An empirical study. IFAC PapersOnLine
2019, 52, 13.19. Tie, R.X.; Yang, N.D.; Zhang, Y.L.; Hou, W.J. Risk propagation model construction and simulation of R&D network technology.
J. Manag. Eng. 2018, 32, 188–194.20. Zhang, Y.L.; Yang, N.D. Control method model and simulation for R&D network risk propagation. J. Syst. Manag. 2018, 27, 500–511.21. Syed, M.A.; Abdul, M.; Golam, K.; Jewel, C.; Jalal, U.R.; Tawhidul, I. Framework for evaluating risks in food supply chain:
Implications in food wastage reduction. J. Clean. Prod. 2019, 228, 786–800.22. Wang, J.Z.; Chen, H.Z. Risk Propagation Model of Complex Product Supply Chain Based on Complex Network. Stat. Decis. 2021,
37, 176–180.23. Chhimwal, M.; Agrawal, S.; Kumar, G. Measuring Circular Supply Chain Risk: A Bayesian Network Methodology. Sustainability
2021, 13, 8448. [CrossRef]24. Gouda, S.K.; Saranga, H. Sustainable supply chains for supply chain sustainability: Impact of sustainability efforts on supply
chain risk. Int. J. Prod. Res. 2018, 56, 5820–5835. [CrossRef]25. Lei, Z.; Lim, M.K.; Cui, L.; Wang, Y. Modelling of risk transmission and control strategy in the transnational supply chain. Int. J.
Prod. Res. 2019, 59, 148–167. [CrossRef]26. Zheng, C. Complex network propagation effect based on SIRS model and research on the necessity of smart city credit system
construction. Alex. Eng. J. 2021, 61, 403–418. [CrossRef]27. Du, Z.P.; Ou, Y.X. Research Status, Hotspots and Trends of Cross-border Logistics based on CiteSpace. Price Mon. 2021, 4, 77–86.28. Allman, A.; Che, L.; Martín, M. Biomass Waste-to-Energy Supply Chain Optimization with Mobile Production Modules. Comput.
Chem. Eng. 2021, 150, 107326. [CrossRef]29. Gao, X. Research on the performance of cross-border e-commerce B2C import supply chain model. J. Anhui Norm. Univ. (Humanit.
Soc. Sci. Ed.) 2019, 47, 134–141.30. Bendadou, A.; Kalai, R.; Jemai, Z. Impact of merging activities in a supply chain under the Guaranteed Service Model: Centralized
and decentralized cases. Appl. Math. Model. 2021, 93, 509–524. [CrossRef]31. Lu, Y.T.; Sun, X.Y. Research on cross-border e-commerce risk analysis and management model based on SD. Bus. Res. 2017, 12, 162–167.32. Fakhrzad, M.B.; Firozpour, M.R.; Hosseininasab, H. Comparing Supply Chain Risks Ranking in Multi-Attribute Decision-Making
Methods Using the Proposed Three-Dimensional Integration Mean Method. Asia. Pac. J. Oper. Res. 2021, 38, 2150006. [CrossRef]

Sustainability 2022, 14, 8088 22 of 22
33. Zhou, F.; Yan, Y.P.; Su, R.; Qiu, H. Construction and application of imported food quality safety risk assessment model ofcross-border e-commerce. Economist 2021, 5, 21–22, 24.
34. Filho, N.G.; Rego, N.; Claro, J. Supply chain flows and stocks as entry points for cyber-risks. Procedia Comput. Sci. 2021, 181,261–268. [CrossRef]
35. Wang, S.J.; Li, R.H. The theory and practice of cross-border e-commerce to promote the “Belt and Road” value chain. Enterp. Econ.2021, 40, 75–82.
36. Ivanov, D. Exiting the COVID-19 pandemic: After-shock risks and avoidance of disruption tails in supply chains. Ann. Oper. Res.2021, 4, 1–18. [CrossRef]
37. Wang, J.B.; Li, W.T.; Yang, F.Y. Traveling waves in a nonlocal dispersal SIR model with nonlocal delayed transmission. Commun.Nonlinear Sci. Numer. Simul. 2015, 27, 136–152. [CrossRef]
38. Xiang, L.; Chen, G. A local-world evolving network model. Physica A 2003, 328, 274–286.39. Bianconi, G.; Barabási, A. Supramolecular Condensation of Bose Condensation in Complex Networks. Acta Phys. Sin. Chin. Ed.
2001, 86, 5632–5635.40. Servedio, V.; Caldarelli, G.; Butta, P. Vertex Intrinsic Fitness: How to Produce Arbitrary Scale-Free Networks. Phys. Rev. 2004, 70,
056126. [CrossRef]
Related Documents