Risk Assessment of the Brazilian FX Rate Wagner Piazza Gaglianone Jaqueline Terra Moura Marins Banco Central do Brasil – Departamento de Estudos e Pesquisas

Welcome message from author
This document is posted to help you gain knowledge. Please leave a comment to let me know what you think about it! Share it to your friends and learn new things together.
Transcript

Risk Assessment of the Brazilian FX Rate
Wagner Piazza Gaglianone
Jaqueline Terra Moura Marins
Banco Central do Brasil – Departamento de Estudos e Pesquisas

The views expressed in this
presentation are those of the
authors and do not necessarily
represent those of the Banco
Central do Brasil or its members.
Disclaimer
2

“Essentially, all models are wrong, but some are useful.”
(George E. P. Box)
The objective of this paper is to investigate a set of FX-rate models and reveal which are more useful for point (and density) forecasting.
The aim is to increase our understanding of the exchange rate dynamics in Brazil from a risk-analysis perspective.
Motivation: Fundamentals may vary in their predictive content at different horizons (or distinct parts of the distribution of the FX-rate).
Introduction
3

• Meese and Rogoff (1983): The Random Walk (RW) paradigm (economic
fundamentals - such as the money supply, trade balance and national income - are of little use in forecasting out-of-sample exchange rates). • Bacchetta and van Wincoop (2006): describe the RW paradigm as: “…the major weakness of international macroeconomics”. • Mark (1995): greater exchange rate predictability at longer horizons. • Kilian and Taylor (2003): exchange rates can be predicted from economic models at horizons of 2 to 3 years, after taking into account the possibility of nonlinear dynamics. • Engel and West (2005): It is not surprising that a RW outperforms fundamental-based models if one treats FX-rate as an asset price within a rational expectation present-value model (and discount factor near one).
Introduction
4
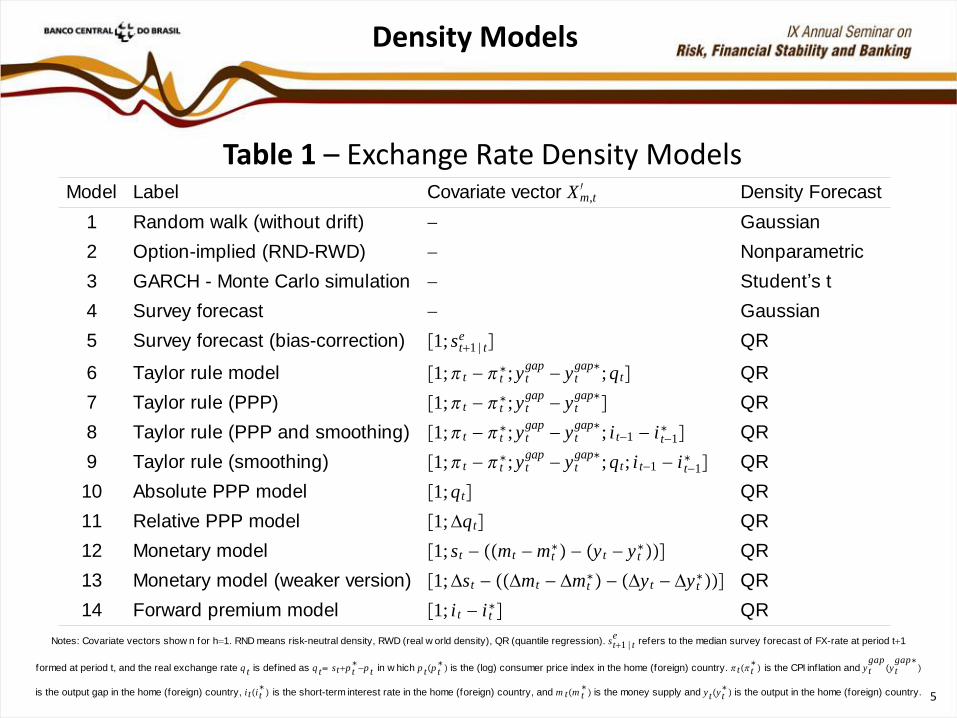
Table 1 – Exchange Rate Density Models
Notes: Covariate vectors show n for h1. RND means risk-neutral density, RWD (real w orld density), QR (quantile regression). st1te
refers to the median survey forecast of FX-rate at period t1
formed at period t, and the real exchange rate q t is defined as q t stp tp t in w hich p tp t
is the (log) consumer price index in the home (foreign) country. tt is the CPI inf lation and yt
gapyt
gap
is the output gap in the home (foreign) country, i ti t is the short-term interest rate in the home (foreign) country, and m tm t
is the money supply and ytyt is the output in the home (foreign) country.
Density Models
Model Label Covariate vector Xm,t Density Forecast
1 Random walk (without drift) Gaussian
2 Option-implied (RND-RWD) Nonparametric
3 GARCH - Monte Carlo simulation Student’s t
4 Survey forecast Gaussian
5 Survey forecast (bias-correction) 1; st1te QR
6 Taylor rule model 1; t t; y t
gap y tgap
;qt QR
7 Taylor rule (PPP) 1; t t; y t
gap y tgap QR
8 Taylor rule (PPP and smoothing) 1; t t; y t
gap y tgap
; i t1 i t1 QR
9 Taylor rule (smoothing) 1; t t; y t
gap y tgap
;qt; i t1 i t1 QR
10 Absolute PPP model 1;qt QR
11 Relative PPP model 1;qt QR
12 Monetary model 1; st mt mt y t y t
QR
13 Monetary model (weaker version) 1;st mt mt y t y t
QR
14 Forward premium model 1; i t i t QR
5

Density Models
Model 1: Random walk (without drift), with Gaussian distribution based on past forecast errors. Model 2: Forward-looking approach based on option prices. Two main steps: (i) obtaining risk-neutral densities (RND); (ii) transforming them into real world densities (RWD). RND represents probabilities that investors would attach to the future asset prices in a world in which they were risk-neutral. If investors are risk-averse, risk premia will drive a wedge between the probabilities inferred from options (RND) and RWD. See Shimko (1993); Vincent-Humphreys and Noss (2012).
6

Density Models
Model 3: AR(1)-GARCH(1,1)-Student’s t, with Monte Carlo simulation. Backward-looking approach with variance reduction techniques. Saliby (1989); Glasserman (2004). Model 4: Survey-based median forecast (Focus), with Gaussian distribution based on past forecast errors. Models 5-14: Economic-driven models based on Molodtsova and Papell (2009), Wang and Wu (2012) and quantile regression. The density forecast of model m takes the form of:
in which (st+h - st) is the h-period change of the (log) exchange rate, and Xm,t contains economic variables used in model m.
7

Forecast Evaluation
Point Forecast Evaluation (location)
- RMSE and Diebold-Mariano (1995) - Pesaran-Timmermann (1992, 2009)
Density Forecast Evaluation (shape)
Global Analysis - Coverage rates (50%, 70%, 90%) - Berkowitz (2001) - LPDS ranking and Amisano-Giacomini (2007)
Local Analysis (backtests) - Kupiec (1995) - Christoffersen (1998) - VQR test (2011)
8

Density Forecasts - Global Analysis
• Coverage Rates: Frequency of FX-rate observations inside a forecast interval (e.g. 70% band formed by conditional quantiles at τ = 0.15 and 0.85).
Objective is to statistically check the equality between the actual and the nominal coverage. Drawback: ignore time dependence and cluster behavior.
• Berkowitz (2001) test: Evaluates the entire density from normalized forecast errors = Φ⁻¹(zt+1), where Φ⁻¹ is the inverse of the standard normal distribution function and zt+1 is the Probability Integral Transform (PIT): where is the density forecast of model m, and st+1 is the observed FX-rate. Null hypothesis:
9

• Log Predictive Density Score (LPDS): LPDS of model m and forecast horizon h is defined by:
where is the (model m) conditional density of FX-rate for period t+h based on the information set available at t.
Such density is evaluated at st+h and (log) averaged along the out-of-sample observations. A higher score implies a better model (Adolfson et al., 2005).
• Amisano-Giacomini (2007) test: Compares the LPDS between two competing models (requiring rolling-window samples). The null hypothesis assumes equal LPDS between model 1 (RW) and m≠1.
Density Forecasts - Global Analysis
10

Density Forecasts - Local Analysis
• Kupiec (1995): Nonparametric test based on the proportion of violations: . The null hypothesis E ( Ht+h ) = (1 – τ) can be tested through a standard LR test.
• Christoffersen (1998): Incorporates time dependence, by assuming that Ht+h follows a first order Markov sequence. The null assumes independence of Ht+h and the “conditional coverage” test is based on unconditional coverage (Kupiec) and independence.
• VQR (2011) test: Previous backtests ignore the magnitude of violations. Gaglianone et al. (2011) propose a Quantile Regression-based test to evaluate Value-at-Risk measures. Under the null that is indeed a conditional quantile of st+h , it follows that α₀(τ) = 0 and α₁(τ) = 1 from
11
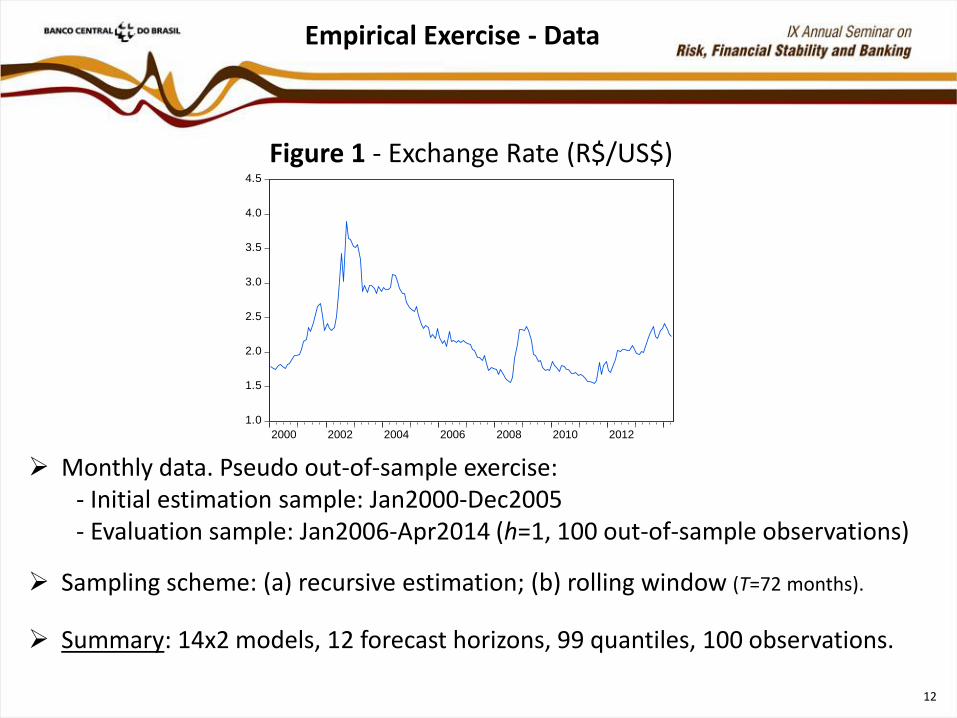
Empirical Exercise - Data
Figure 1 - Exchange Rate (R$/US$) Monthly data. Pseudo out-of-sample exercise: - Initial estimation sample: Jan2000-Dec2005 - Evaluation sample: Jan2006-Apr2014 (h=1, 100 out-of-sample observations)
Sampling scheme: (a) recursive estimation; (b) rolling window (T=72 months).
Summary: 14x2 models, 12 forecast horizons, 99 quantiles, 100 observations.
1.0
1.5
2.0
2.5
3.0
3.5
4.0
4.5
2000 2002 2004 2006 2008 2010 2012
12

Point Forecasts
Figure 2 - Point Forecasts from Models 1-4
1.5
2.0
2.5
3.0
3.5
4.0
00 01 02 03 04 05 06 07 08 09 10 11 12 13 14 15
Point forecasts from Model 1, recursive estimation
1.5
2.0
2.5
3.0
3.5
4.0
00 01 02 03 04 05 06 07 08 09 10 11 12 13 14 15
Point forecasts from Model 2, recursive estimation
1.5
2.0
2.5
3.0
3.5
4.0
00 01 02 03 04 05 06 07 08 09 10 11 12 13 14 15
Point forecasts from Model 4, rolling window estimation
1.0
1.5
2.0
2.5
3.0
3.5
4.0
00 01 02 03 04 05 06 07 08 09 10 11 12 13 14 15
Point forecasts from Model 3, rolling window estimation 13

Point Forecasts
Does any model "beat" the random walk?
Table 2 - Diebold-Mariano (1995) test of equal accuracy
Notes: P-values in parentheses. Positive statistic means that a model has lower RMSE compared to the RW (model 1a).
Model 1a 2a 3a 4a 5a 6a 7a 8a 9a 10a 11a 12a 13a 14a
h=1 2.16 -1.82 -0.96 -0.60 -0.45 -0.42 -0.75 -1.14 -1.54 -0.73 -1.77 -0.82 -1.71
(0.03) (0.07) (0.34) (0.55) (0.65) (0.68) (0.46) (0.26) (0.13) (0.47) (0.08) (0.41) (0.09)
h=2 1.96 -1.35 -1.13 -0.81 -0.76 -0.41 -0.60 -1.02 -2.00 -1.77 -1.71 -1.39 -2.34
(0.05) (0.18) (0.26) (0.42) (0.45) (0.68) (0.55) (0.31) (0.05) (0.08) (0.09) (0.17) (0.02)
h=3 1.99 -1.35 -1.08 -0.86 -1.11 -0.88 -0.82 -1.40 -1.82 -1.22 -1.59 -1.16 -2.39
(0.05) (0.18) (0.28) (0.39) (0.27) (0.38) (0.41) (0.17) (0.07) (0.22) (0.11) (0.25) (0.02)
h=4 2.17 -1.33 -0.87 -0.89 -1.22 -0.90 -1.02 -1.31 -1.92 -1.13 -1.65 -1.49 -2.03
(0.03) (0.19) (0.39) (0.38) (0.23) (0.37) (0.31) (0.19) (0.06) (0.26) (0.1) (0.14) (0.05)
h=5 2.01 -1.26 -0.39 -1.02 -1.34 -1.10 -1.15 -1.44 -2.29 -0.66 -1.98 -0.99 -1.98
(0.05) (0.21) (0.7) (0.31) (0.18) (0.28) (0.25) (0.15) (0.02) (0.51) (0.05) (0.32) (0.05)
h=6 2.01 -1.32 -0.07 -0.94 -1.43 -1.10 -1.16 -1.44 -2.24 -0.77 -2.18 -0.67 -1.67
(0.05) (0.19) (0.94) (0.35) (0.16) (0.27) (0.25) (0.15) (0.03) (0.45) (0.03) (0.5) (0.1)
h=7 2.19 -1.32 0.13 -1.06 -1.52 -1.30 -1.34 -1.60 -2.24 -0.77 -2.15 -1.01 -1.81
(0.03) (0.19) (0.9) (0.29) (0.13) (0.2) (0.18) (0.11) (0.03) (0.44) (0.03) (0.31) (0.07)
h=8 2.48 -1.34 0.22 -1.02 -1.53 -1.41 -1.50 -1.96 -1.79 -1.16 -1.89 -1.00 -1.92
(0.01) (0.18) (0.82) (0.31) (0.13) (0.16) (0.14) (0.05) (0.08) (0.25) (0.06) (0.32) (0.06)
h=9 2.81 -1.31 0.19 -0.98 -1.71 -1.44 -1.60 -2.09 -1.71 -0.78 -1.62 -0.84 -1.77
(0.01) (0.19) (0.85) (0.33) (0.09) (0.15) (0.11) (0.04) (0.09) (0.44) (0.11) (0.4) (0.08)
h=10 3.41 -1.31 0.22 -1.06 -1.95 -1.59 -1.75 -1.96 -1.47 -1.12 -1.48 -1.18 -1.66
(0) (0.19) (0.82) (0.29) (0.05) (0.12) (0.08) (0.05) (0.15) (0.26) (0.14) (0.24) (0.1)
h=11 3.93 -1.32 0.13 -1.08 -1.64 -1.57 -1.90 -1.59 -1.39 -1.14 -1.36 -1.14 -1.61
(0) (0.19) (0.9) (0.28) (0.1) (0.12) (0.06) (0.11) (0.17) (0.26) (0.18) (0.26) (0.11)
h=12 4.45 -1.35 -0.04 -1.11 -1.78 -1.67 -1.87 -1.80 -1.36 -1.22 -1.35 -1.05 -1.73
(0) (0.18) (0.97) (0.27) (0.08) (0.1) (0.06) (0.07) (0.18) (0.23) (0.18) (0.3) (0.09)
14

Point Forecasts
Can the competing models forecast the direction of change?
Table 3 - Prediction of the direction of change of the FX-rate
Note: The null hypothesis assumes that a model has no power in predicting the directional change of the FX-rate.
Pesaran & Timmermann (1992, 2009) direction of change test (p-value)
Model 1a 2a 3a 4a 5a 6a 7a 8a 9a 10a 11a 12a 13a 14a
h=1 0.00 0.02 0.84 0.24 0.21 0.81 0.21 0.31 0.89 0.99 0.89 0.68 0.23
h=2 0.01 0.07 0.94 0.00 0.63 0.50 0.10 0.33 0.05 0.06 0.12 0.06 0.04
h=3 0.04 0.02 0.81 0.00 0.78 0.51 0.20 0.81 0.20 0.10 0.19 0.40 0.04
h=4 0.07 0.59 0.00 0.19 0.46 0.55 0.31 0.08 0.02 0.40 0.72 0.10
h=5 0.00 0.69 0.00 0.24 0.60 0.83 0.29 0.02 0.51 0.13 0.71 0.02
h=6 0.02 0.63 0.00 0.33 0.92 0.89 0.37 0.02 0.81 0.06 0.46 0.01
h=7 0.00 0.58 0.00 0.15 0.59 0.50 0.19 0.01 0.71 0.01 0.70 0.00
h=8 0.00 0.88 0.00 0.39 0.96 0.99 0.46 0.14 0.00 0.00 0.00 0.00
h=9 0.00 0.76 0.00 0.32 0.59 0.47 0.25 0.11 0.00 0.00 0.00 0.00
h=10 0.00 0.97 0.00 0.06 0.02 0.09 0.10 0.00 0.21 0.00 0.01 0.00
h=11 0.00 0.81 0.00 0.04 0.05 0.18 0.04 0.01 0.00 0.00 0.01 0.00
h=12 0.00 0.89 0.00 0.01 0.20 0.08 0.09 0.00 0.00 0.00 0.00 0.00
15

Density Forecasts
Figure 3 - Conditional Densities for April 2014 (h=1)
0
1
2
3
4
5
6
7
8
9
1.7 1.8 1.9 2.0 2.1 2.2 2.3 2.4 2.5 2.6 2.7 2.8 2.9
FX-rate for 2014m4, forecast horizon: h1, recursive estimation
M1M2
M3
M4
M5
M6
M7
De
nsit
y
16

Density Forecasts
Table 4 – Selected models from the Global Analysis Horizon Berkowitz test LPDS ranking AG test (stat0)
1 2, 5ab, 6b, 7ab, 8ab, 10ab, 11ab, 12ab, 13ab, 14ab 3ab, 5a, 14b 3b, 14b
2 2, 5b, 6ab, 7ab, 8ab, 9b, 10ab, 11b, 12ab, 13b, 14ab 1b, 3b, 11a, 13a -
3 2, 8b, 9b, 10ab, 12ab, 14ab 1b, 5a, 11ab -
6 8a 1b, 4b, 11a, 13a -
9 8b, 9b 1b, 4b, 11a, 13a -
12 9a 1b, 4ab, 5a 4b
Horizon Coverage rate
1 2, 5ab, 6b, 7ab, 8ab, 9b, 10ab, 11ab, 12ab, 13ab, 14ab
2 3ab, 5ab, 6b, 7ab, 8b, 10b, 11ab, 13ab, 14ab
3 3ab, 5ab, 7ab, 8b, 10ab, 11ab, 12ab, 13ab
6 1b, 3b, 5ab, 6b, 7ab, 8ab, 9b, 10ab, 11ab, 12ab, 13ab, 14a
9 1b, 4b, 5ab, 6ab, 7a, 8ab, 9ab, 10ab, 11ab, 12ab, 13b, 14ab
12 1b, 5ab, 6ab, 7ab, 8ab, 9ab, 10ab, 11b, 12a, 13b, 14ab
17

Density Forecasts
Table 5 - Selected models from the Local Analysis
Note: NP means the minimum number of p-values (above 0.05) to select a given model,
from a total of 9 p-values (3 backtests x 3 quantile levels ) for each part of the density.
Horizon Criteria NP Low quantiles ( 0.1; 0.2; 0.3) High quantiles ( 0.7; 0.8; 0.9)
1 Kupiec, Christ., VQR 9 7ab, 10b, 11a, 13a 5b, 6ab, 7ab, 8ab, 9ab, 10ab, 12b, 13a, 14ab
2 Kupiec, Christ., VQR 8 7b, 11a -
3 Kupiec, Christ., VQR 7 2, 7b -
6 Kupiec, Christ. 4 7a 6a, 9a
9 Kupiec, Christ. 4 - 6a
12 Kupiec, Christ. 4 14a 1b
18

Risk Assessment Exercise
Main Steps:
• Establish (ad-hoc) thresholds for the FX-rate: low (λL) or high (λH). • In the first case, construct a dummy variable Dt+h = 1st+h < λL
to reveal the periods which (ex-post) exhibited a FX-rate below the threshold λL . • Next, for each model m, horizon h, and period t, search for the conditional quantile (and respective quantile level τ*) which is closest to this threshold. • The τ* level represents the (ex-ante) conditional probability that the FX-rate will breach the established limit in the future (h-periods ahead), that is,
19

Risk Assessment Exercise
Figure 4 - Conditional probabilities (h=1) of FX-rate below R$1.55/US$ R$1.60/US$
Figure 5 - Conditional probabilities (h=1) of FX-rate above
R$2.40/US$ R$2.35/US$
0.0
0.2
0.4
0.6
0.8
1.0
2006 2007 2008 2009 2010 2011 2012 2013 2014
0.0
0.2
0.4
0.6
0.8
1.0
2006 2007 2008 2009 2010 2011 2012 2013 2014
0.0
0.2
0.4
0.6
0.8
1.0
2006 2007 2008 2009 2010 2011 2012 2013 2014
0.0
0.2
0.4
0.6
0.8
1.0
2006 2007 2008 2009 2010 2011 2012 2013 2014 20

Conclusions
We evaluate competing FX-rate density models according to its forecasting performance at: (i) different horizons; (ii) distinct parts of the distribution. Overall, no model accounts for the entire density (and all horizons).
Summary of results
• Point forecasts: (i) option-data useful for h=1-3 months; (ii) several models predict the direction
of change (e.g. fundamentals, over 6 months);
• Density forecasts:
- Global analysis: Coverage rates: exclude Gaussian densities;
Berkowitz: options + others (short-run); Taylor rule (medium to long-run);
LPDS ranking: GARCH (h=1,2); survey; PPP and monetary model;
- Local analysis: Risk of FX-rate increase: QR densities (h=1); Taylor rule (h=6,9);
Risk of FX-rate decrease: PPP and monetary models (h=1);
Options (h=3); Forward Premium model (h=12); 21

Conclusions
Results in line with a vast literature reporting the practical difficulty on beating the naive RW (Mark, 2001).
Option-implied density forecasts provide relatively accurate forecasts in the short-run (see also Christoffersen and Mazzotta, 2005; Ornelas et al., 2012).
Correct “direction prediction” appears to cluster at the longer horizons (Cheung, Chinn and Pascual, 2005).
Fundamental relationships (e.g. parity conditions) hold better in the long-run.
Risk assessment: asymmetric response of fundamentals (due to quantile regression) in respect to the selected part of distribution of the FX-rate.
Possible Extensions: (i) extend the set of models; (ii) increase the forecast horizon; (iii) density forecast combination (Hall and Mitchell, 2007; Jore et al., 2010); (iv) alternative risk measures (e.g. expected shortfall); (v) tests of conditional predictive ability (Giacomini and White, 2006).
22

Thank you
More details about the methodology are available at:
http://www.bcb.gov.br/pec/wps/ingl/wps344.pdf
BCB Working Paper Series n.344
Related Documents


