RISK-LEVEL ASSESSMENT SYSTEM ON BENGAWAN SOLO’S FLOOD PRONE AREAS USING AHP AND WEB GIS ICT-ASIA 2015 25-26 May 2015 SEARCA Los Banos Laguna Philippines HARIS RAHADIANTO ARNA FARIZA JAUARI AKHMAD NUR HASIM DEPARTMENT OF INFORMA TICS AND COM PUTER ENGINEERING ELECTRONICS ENGINEERING POLYTECHNIC INSTITUTE OF SURABAYA [email protected]

Welcome message from author
This document is posted to help you gain knowledge. Please leave a comment to let me know what you think about it! Share it to your friends and learn new things together.
Transcript
8/17/2019 Risk Assessment in Bengawan Solo
http://slidepdf.com/reader/full/risk-assessment-in-bengawan-solo 1/26
RISK-LEVEL ASSESSMENT SYSTEM ONBENGAWAN SOLO’S FLOOD PRONE AREAS
USING AHP AND WEB GIS
ICT-ASIA 2015
25-26 May 2015
SEARCA Los Banos Laguna Philippines
HAR IS R AHAD IANT O
AR NA FAR IZA
JAU AR I AK HMAD NU R HASIM
D EPAR T MENT O F IN FO R MAT ICS AND CO M PU T ER ENG INEER ING
EL ECT R O NICS ENG I NEER ING PO L YT ECHNIC INST IT U T E O F SU R ABAYA

8/17/2019 Risk Assessment in Bengawan Solo
http://slidepdf.com/reader/full/risk-assessment-in-bengawan-solo 2/26
CONTENTSIntroduction
Background
Problem
Idea
Theory
Result
Future Works
8/17/2019 Risk Assessment in Bengawan Solo
http://slidepdf.com/reader/full/risk-assessment-in-bengawan-solo 3/26
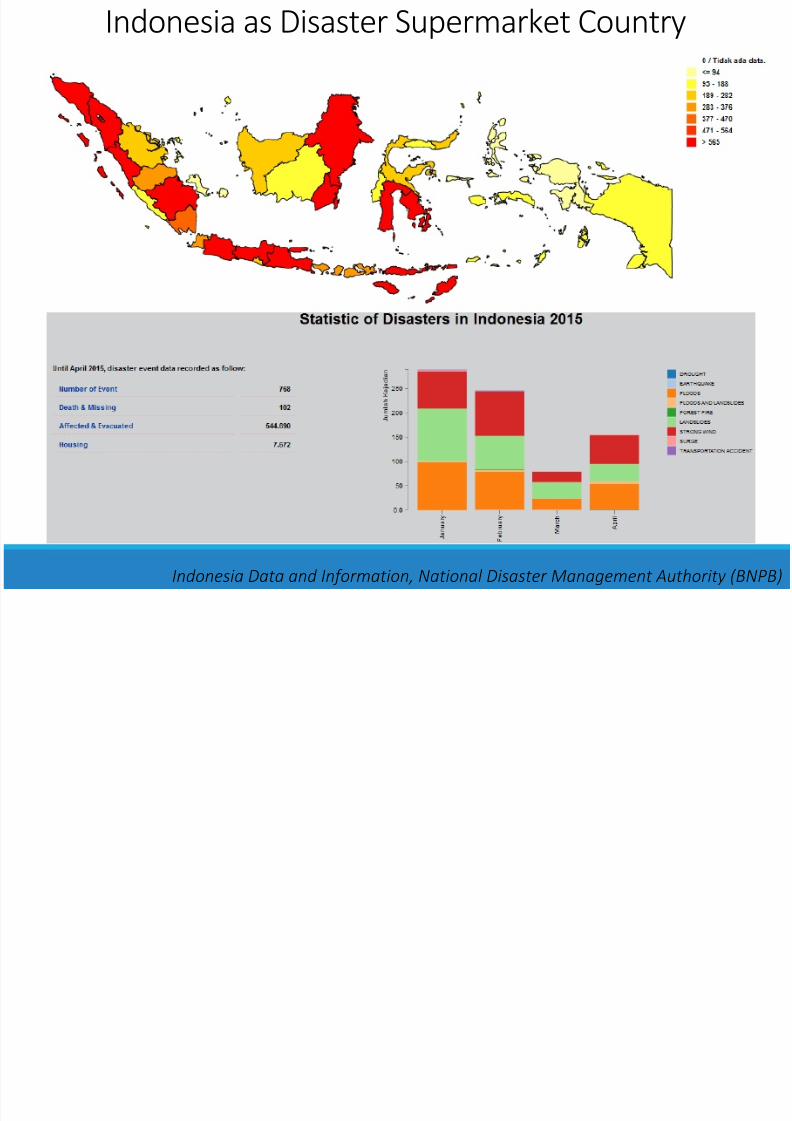
Indonesia as Disaster Supermarket Country
IndonesiaDataandInformation,NationalDisasterManagementAuthority(BNPB)

8/17/2019 Risk Assessment in Bengawan Solo
http://slidepdf.com/reader/full/risk-assessment-in-bengawan-solo 4/26
Frequent Disaster in Indonesia
IndonesiaDataandInformation,NationalDisasterManagementAuthority(BNPB)

8/17/2019 Risk Assessment in Bengawan Solo
http://slidepdf.com/reader/full/risk-assessment-in-bengawan-solo 5/26
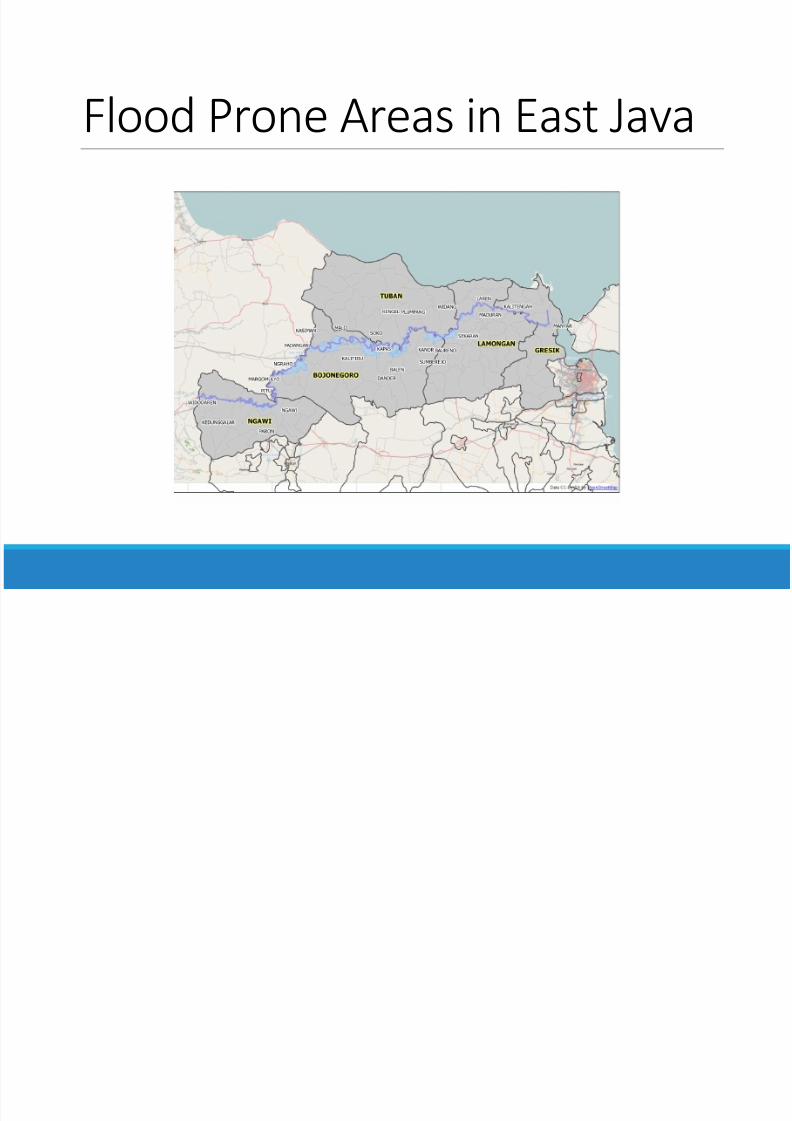
Bengawan Solo River Basin
The longest river in Java, it isapproximately 600 km inlength
Located on East Java andCentral Java Province,Indonesia. It is comprised of 17 Regencies and 3 Cities
In 2007, the Bengawan Solo
river basin flooded Central andEast Java, causing around $170million economic damage.
8/17/2019 Risk Assessment in Bengawan Solo
http://slidepdf.com/reader/full/risk-assessment-in-bengawan-solo 6/26
Flood Prone Areas in East Java

8/17/2019 Risk Assessment in Bengawan Solo
http://slidepdf.com/reader/full/risk-assessment-in-bengawan-solo 7/26
The Impact of FloodFloods are considered to be the most common natural disasterworldwide during the last decades. Their consequences are notonly environmental but economic as well, since they may causedamages to urban areas and agricultural lands and may even
result in loss of lives (Merz et al. 2010).
IndonesiaDataandInformation,NationalDisasterManagementAuthority(BNPB)

8/17/2019 Risk Assessment in Bengawan Solo
http://slidepdf.com/reader/full/risk-assessment-in-bengawan-solo 8/26
ProblemsThe national government has created a de-centralized structure toprepare and respond to disasters and climate change. However, thesestructures are often lacking and funding is frequently diverted frompreparation and mitigation to emergency response, and many lack the
organizational capability necessary to mitigate disasters.The increase in floods and their destructive results worldwide requirean ongoing improvement on identification and mapping of floodhazard. (Kundzewicz and Kaczmare 2000; Ebert et al. 2009).
8/17/2019 Risk Assessment in Bengawan Solo
http://slidepdf.com/reader/full/risk-assessment-in-bengawan-solo 9/26
IdeaBuild web-based risk-level assessment system that comprehendhazards, vulnerabilities, and capacities summarized in risk analysis andintegrated with Geographical Information System so it can map theregion based on its risk level

8/17/2019 Risk Assessment in Bengawan Solo
http://slidepdf.com/reader/full/risk-assessment-in-bengawan-solo 10/26
Disaster Risk Assessment
R : Disaster Risk
H : Hazard Threat
V : Vulnerability
C : Adaptive Capacity
GeneralGuidelinesforDisasterRiskAssessment,NationalDisasterManagementAuthority(BNPB)
8/17/2019 Risk Assessment in Bengawan Solo
http://slidepdf.com/reader/full/risk-assessment-in-bengawan-solo 11/26
Flood Risk AssessmentIndicators used for semi-quantitative risk analysis will be selected basedon the suitability and availability. The formula described above stillapply, but will contain an index value not real value. In analogy HumanDevelopment Index (HDI) of the UNDP, to make the index comparable
at least in the dimensions, the index used in the analysis wereconverted into a value between 0 and 1, where 0 is the minimum valueof the original indicator, and 1 is the maximum value.
In the case of the low numbers are many and varied in amountsometimes high, will be converted logarithmic (Log10) than linear
conversion.
The core of the risk mapping methodology for a tree structure indicator,where risk index forming the root end of the analysis.
GeneralGuidelinesforDisasterRiskAssessment,NationalDisasterManagementAuthority(BNPB)

8/17/2019 Risk Assessment in Bengawan Solo
http://slidepdf.com/reader/full/risk-assessment-in-bengawan-solo 12/26
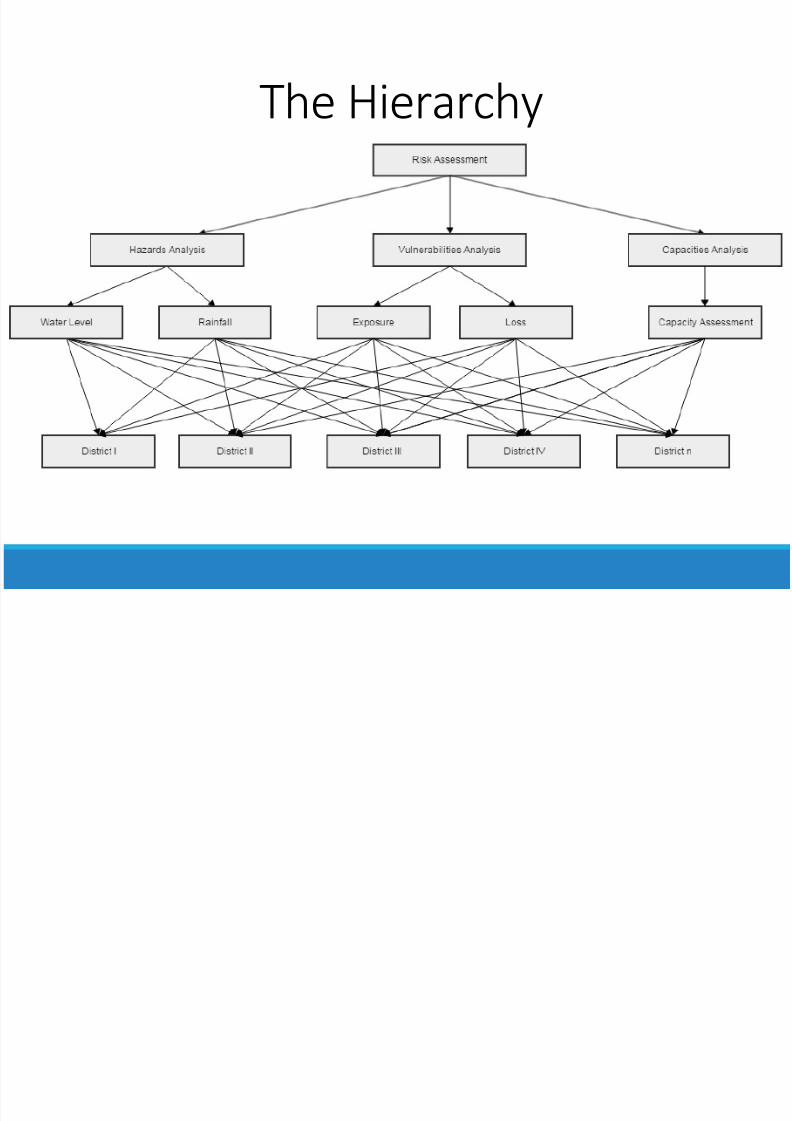
Analytic Hierarchy ProcessIn the semi-quantitative analysis, particularly about the lack of information about factors sensitivity is compensated by aweighting factor. Best weighting factors obtained throughconsensus of expert opinion. A methodology appears to a
consensus such is the Analytic Hierarchy Process (AHP). Thismethodology has been developed by Thomas L. Saaty began in1970, and was originally intended as a tool for decision-making.AHP is a measurement methodology through comparison pair-wise and depend on the judgment of experts to gain scale
priority. This is the scale that measures the relative form.Comparisons are made with using the absolute rating scale,which represents how much the indicator dominating the otherwith respect to a particular disaster.
GeneralGuidelinesforDisasterRiskAssessment,NationalDisasterManagementAuthority(BNPB)
8/17/2019 Risk Assessment in Bengawan Solo
http://slidepdf.com/reader/full/risk-assessment-in-bengawan-solo 13/26
The Hierarchy
8/17/2019 Risk Assessment in Bengawan Solo
http://slidepdf.com/reader/full/risk-assessment-in-bengawan-solo 14/26
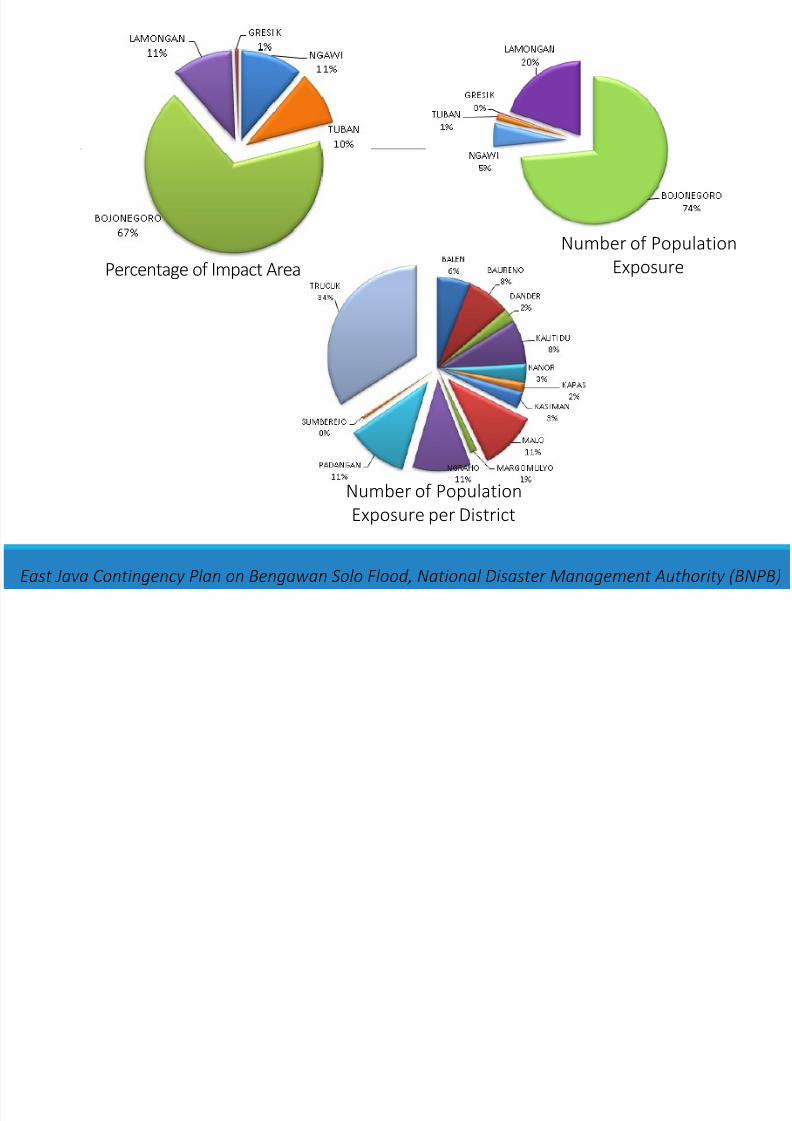
Percentage of Impact Area
Number of Population
Exposure
Number of Population
Exposure per District
EastJavaContingencyPlanonBengawanSoloFlood,NationalDisasterManagementAuthority(BNPB)
8/17/2019 Risk Assessment in Bengawan Solo
http://slidepdf.com/reader/full/risk-assessment-in-bengawan-solo 15/26
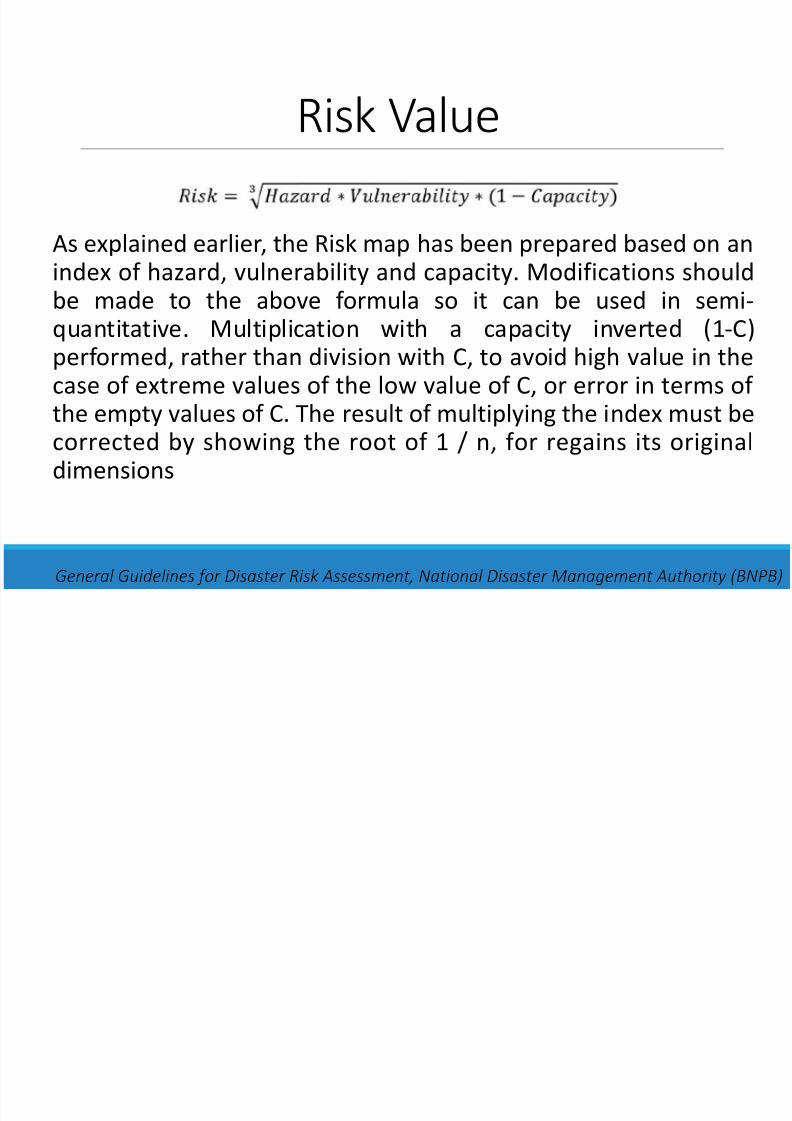
Risk Value
As explained earlier, the Risk map has been prepared based on an
index of hazard, vulnerability and capacity. Modifications shouldbe made to the above formula so it can be used in semi-quantitative. Multiplication with a capacity inverted (1-C)performed, rather than division with C, to avoid high value in thecase of extreme values of the low value of C, or error in terms of
the empty values of C. The result of multiplying the index must becorrected by showing the root of 1 / n, for regains its originaldimensions
GeneralGuidelinesforDisasterRiskAssessment,NationalDisasterManagementAuthority(BNPB)

8/17/2019 Risk Assessment in Bengawan Solo
http://slidepdf.com/reader/full/risk-assessment-in-bengawan-solo 16/26
Risk-Level DivisionFurthermore, the values that were derived from were groupedinto three risk levels. This classification was done by using theoptimization method of classes distribution natural breaks (Jenks1967).
The Jenks optimization method, also called the Jenks naturalbreaks classification method, is a data classification methoddesigned to determine the best arrangement of values intodifferent classes. This is done by seeking to minimize each class’average deviation from the class mean, while maximizing each
class’ deviation from the means of the other groups. In otherwords, the method seeks to reduce the variance within classesand maximize the variance between classes.
8/17/2019 Risk Assessment in Bengawan Solo
http://slidepdf.com/reader/full/risk-assessment-in-bengawan-solo 17/26
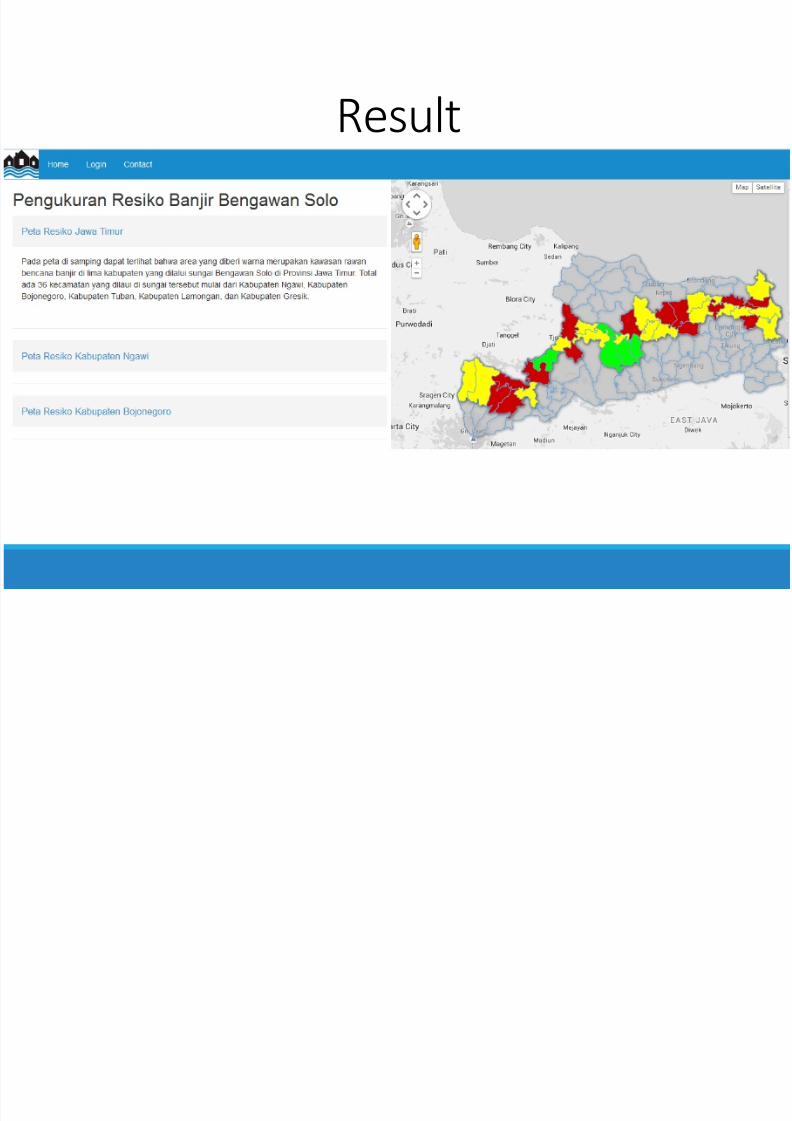
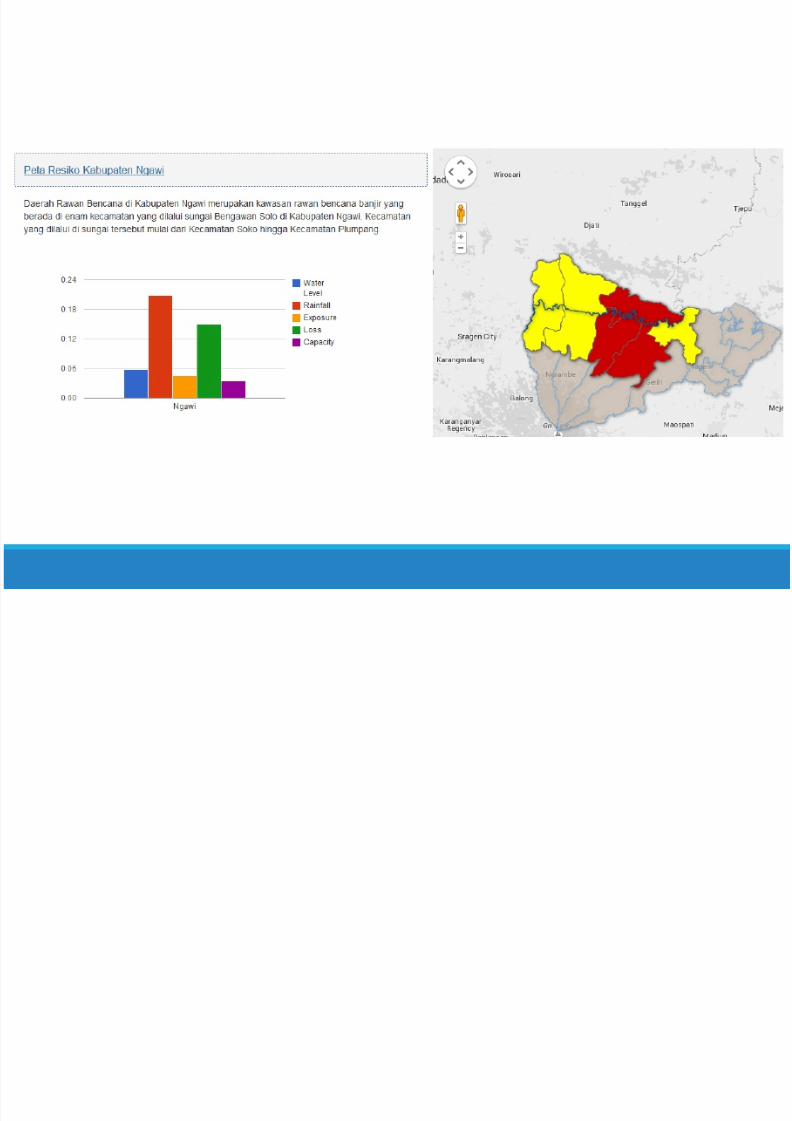
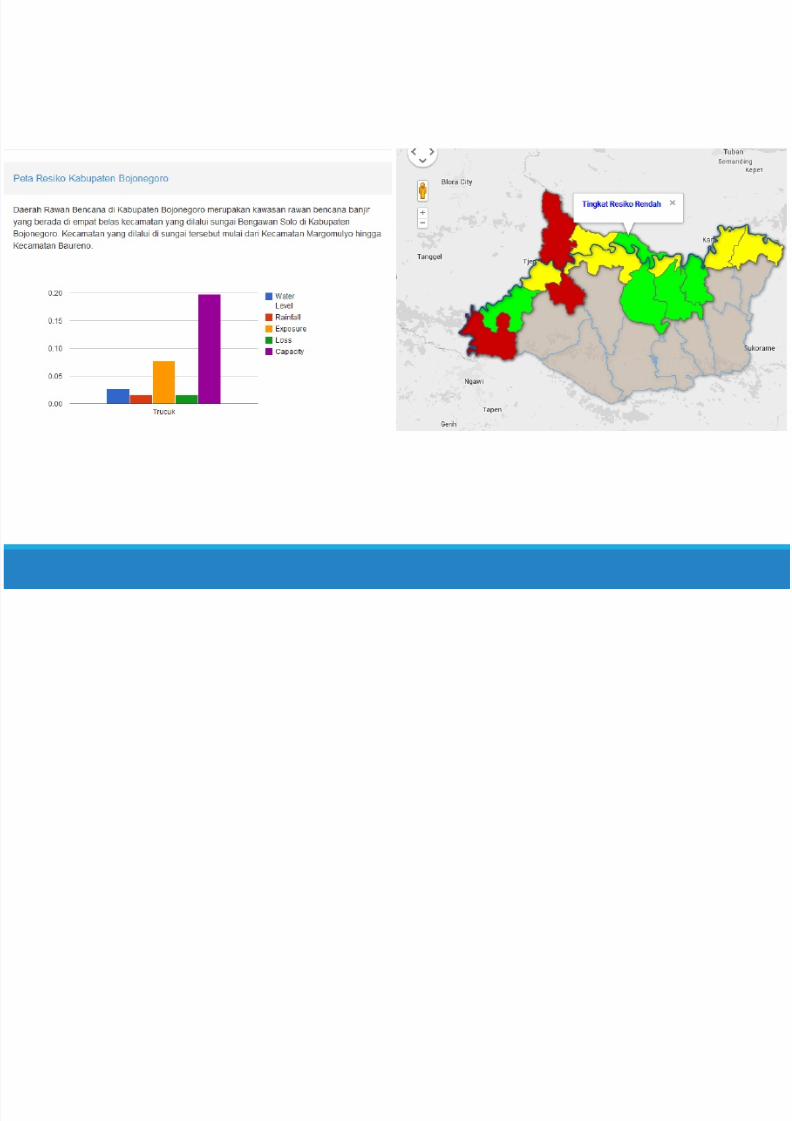
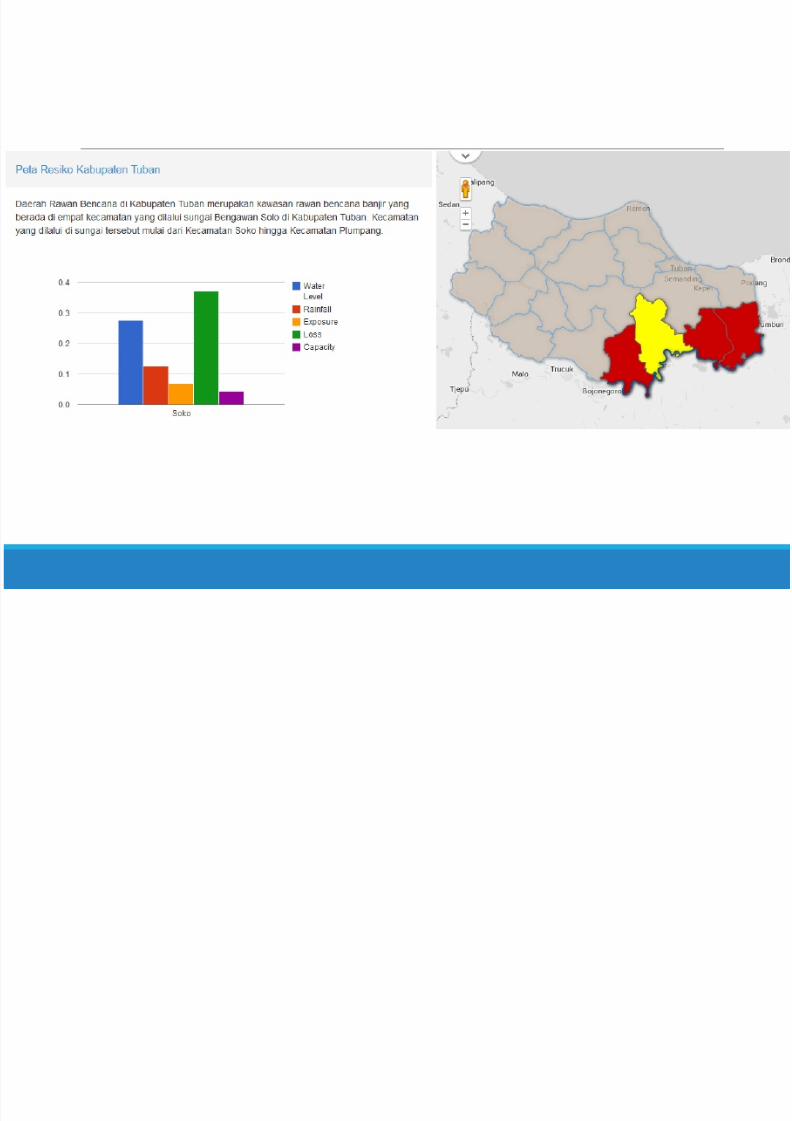
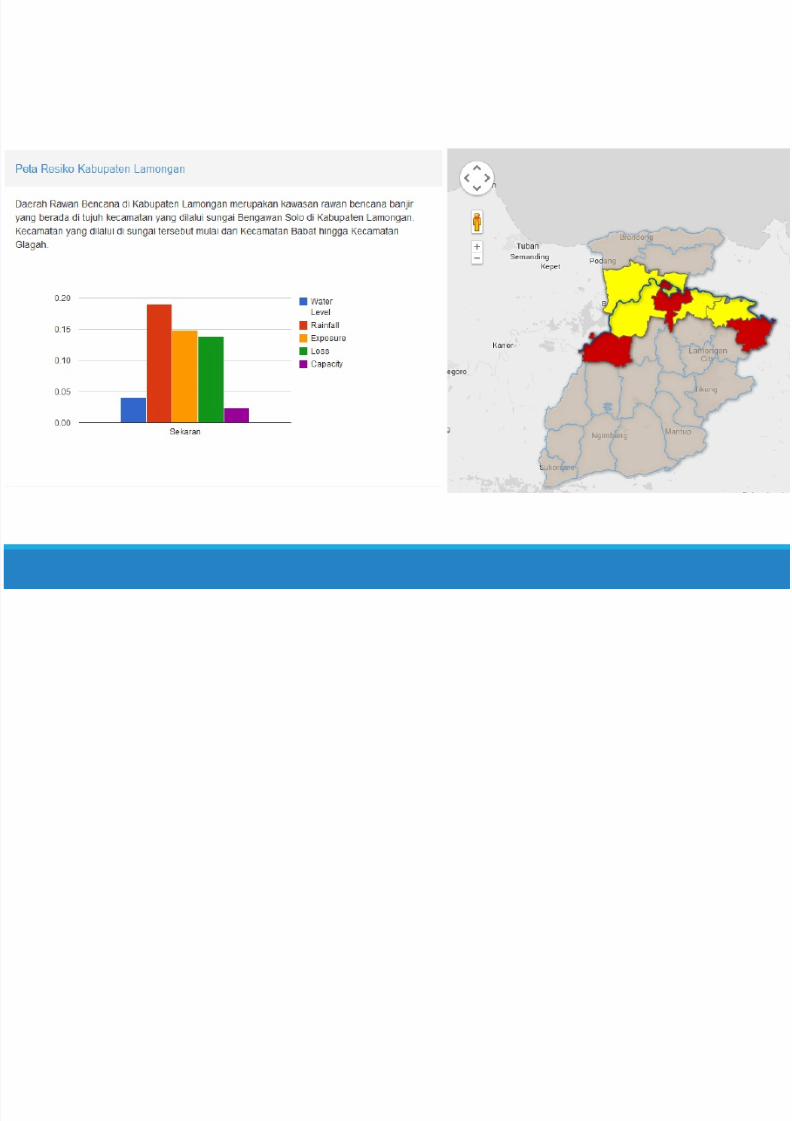
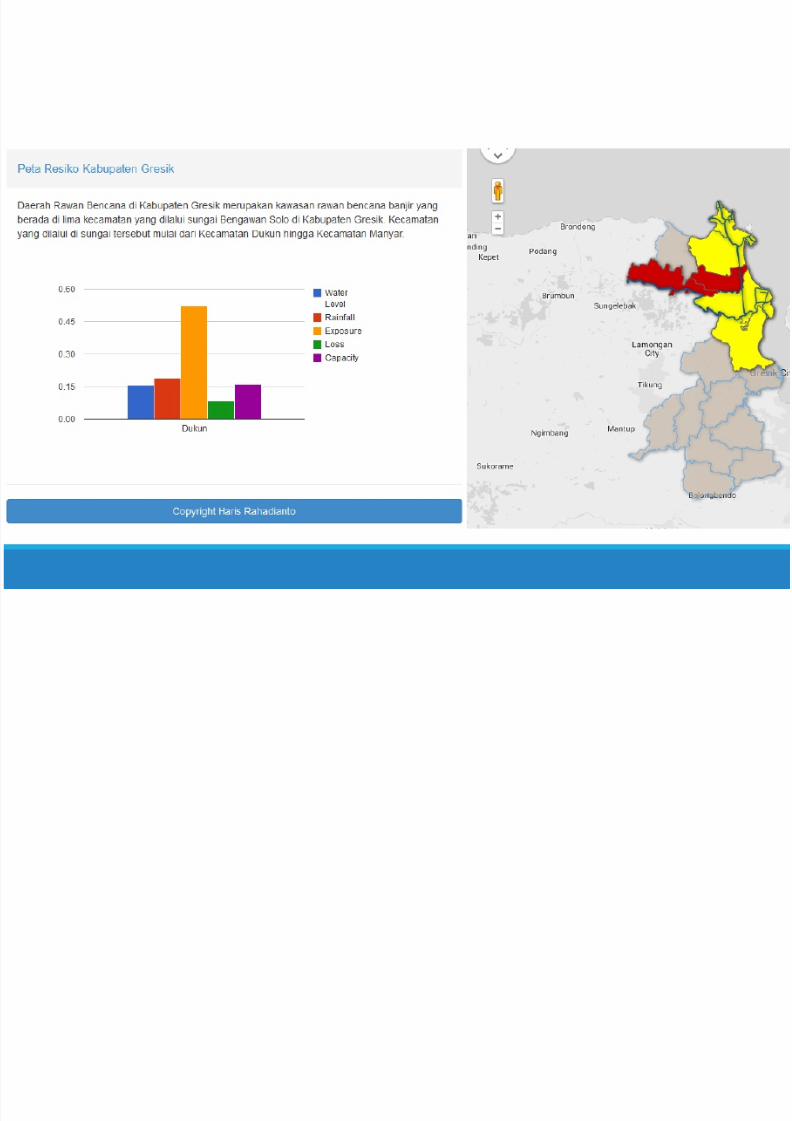
Result
8/17/2019 Risk Assessment in Bengawan Solo
http://slidepdf.com/reader/full/risk-assessment-in-bengawan-solo 18/26
8/17/2019 Risk Assessment in Bengawan Solo
http://slidepdf.com/reader/full/risk-assessment-in-bengawan-solo 19/26
8/17/2019 Risk Assessment in Bengawan Solo
http://slidepdf.com/reader/full/risk-assessment-in-bengawan-solo 20/26
8/17/2019 Risk Assessment in Bengawan Solo
http://slidepdf.com/reader/full/risk-assessment-in-bengawan-solo 21/26
8/17/2019 Risk Assessment in Bengawan Solo
http://slidepdf.com/reader/full/risk-assessment-in-bengawan-solo 22/26
8/17/2019 Risk Assessment in Bengawan Solo
http://slidepdf.com/reader/full/risk-assessment-in-bengawan-solo 23/26
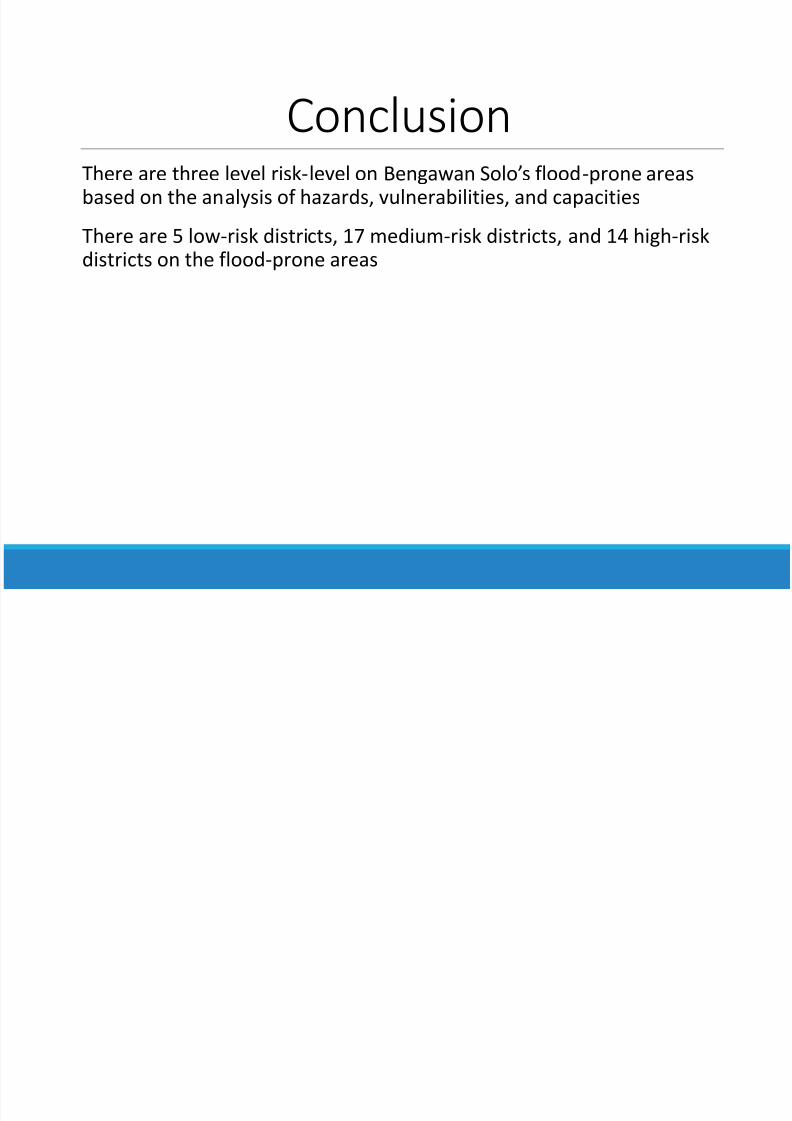
ConclusionThere are three level risk-level on Bengawan Solo’s flood-prone areasbased on the analysis of hazards, vulnerabilities, and capacities
There are 5 low-risk districts, 17 medium-risk districts, and 14 high-riskdistricts on the flood-prone areas
8/17/2019 Risk Assessment in Bengawan Solo
http://slidepdf.com/reader/full/risk-assessment-in-bengawan-solo 24/26
Future WorksFlood prediction and forecating system
Evaluation and upgrading the system
Assessment on the following disaster when the flood occured
8/17/2019 Risk Assessment in Bengawan Solo
http://slidepdf.com/reader/full/risk-assessment-in-bengawan-solo 25/26
ReferencesIndonesia Data and Information, National Disaster Management Authority(BNPB)
Merz B, Kreibich H, Schwarze R, Thieken A (2010) Assessment of economicflood damage. Nat Hazards Earth Syst Sci 10:1679 –1724
Kundzewicz W, Kaczmare Z (2000) Coping with hydrological extremes. WaterInt 25:66 –75
Ebert A, Kerle N, Stein A (2009) Urban social vulnerability assessment withphysical proxies and spatial metrics derived from air- and spaceborneimagery and GIS data. Nat Hazards 48:275 –294
Jenks G (1967) The Data Model Concept in Statistical Mapping. Int Year bCartogr 7:186 –190
General Guidelines for Disaster Risk Assessment, National DisasterManagement Authority (BNPB)

8/17/2019 Risk Assessment in Bengawan Solo
http://slidepdf.com/reader/full/risk-assessment-in-bengawan-solo 26/26
THANK YOU
h d d d
Related Documents