ANL/EAD/TM-28 Risk Assessment for the Transportation of Hazardous Waste and Hazardous Waste Components of Low-Level Mixed Waste and Transuranic Waste for the U.S. Department of Energy Waste Management Programmatic Environmental Impact Statement by M.A. Lazaro, A.J. Policastro, H.M. Hartmann, A.A. Antonopoulos, D.F. Brown, W.E. Dunn, M.A. Cowen, Y.-S. Chang, and B.L. Koebnick Environmental Assessment Division, Argonne National Laboratory, 9700 South Cass Avenue, Argonne, Illinois 60439 December 1996 Work sponsored by United States Department of Energy, Assistant Secretary for Environmental Management ".»--. *w^

Welcome message from author
This document is posted to help you gain knowledge. Please leave a comment to let me know what you think about it! Share it to your friends and learn new things together.
Transcript

ANL/EAD/TM-28
Risk Assessment for the Transportation ofHazardous Waste and Hazardous WasteComponents of Low-Level Mixed Waste andTransuranic Waste for the U.S. Departmentof Energy Waste Management ProgrammaticEnvironmental Impact Statement
by M.A. Lazaro, A.J. Policastro, H.M. Hartmann, A.A. Antonopoulos, D.F. Brown,W.E. Dunn, M.A. Cowen, Y.-S. Chang, and B.L. Koebnick
Environmental Assessment Division,Argonne National Laboratory, 9700 South Cass Avenue, Argonne, Illinois 60439
December 1996
Work sponsored by United States Department of Energy,Assistant Secretary for Environmental Management
" . » - - . * w ^

DISCLAIMER
This report was prepared as an account of work sponsored by an agency of the UnitedStates Government Neither the United States Government nor any agency thereof, norany of their employees, make any warranty, express or implied, or assumes any legal liabili-ty or responsibility for the accuracy, completeness, or usefulness of any information, appa-ratus, product, or process disclosed, or represents that its use would not infringe privatelyowned rights. Reference herein to any specific commercial product, process, or service bytrade name, trademark, manufacturer, or otherwise does not necessarily constitute orimply its endorsement recommendation, or favoring by the United States Government orany agency thereof. The views and opinions of authors expressed herein do not necessar-ily state or reflect those of the United States Government or any agency thereof.
DISCLAIMER
Portions of this document may be illegiblein electronic image products. Images areproduced from the best available originalDocument.

CONTENTS
NOTATION vi
ABSTRACT 1
1 INTRODUCTION 1
2 TRANSPORTATION ACCIDENT AND RELEASE PROBABILITIES 4
2.1 Truck Accident Probabilities 42.2 Hazardous Waste Release Probabilities 5
2.3 Release Quantities 5
3 HEALTH RISK CRITERIA 8
3.1 General Information on Criteria Developmentfor Accidental Releases 93.1.1 Potentially Life-Threatening Concentration Values 103.1.2 Potential Any Adverse Effect Concentration Values 133.1.3 Increased Cancer Risk Concentration Values 21
3.2 Potential Additive Effects of Multichemical Exposures 223.3 Transportation Risk Assessment Methods for Maximally
Exposed Individuals 233.3.1 Potentially Life-Threatening Effects for the MEI 243.3.2 Any Adverse Effects for the MEI 243.3.3 Increased Carcinogenic Risk for the MEI 25
4 SUPPLEMENTAL INFORMATION ON UNCERTAINTY ANALYSIS
AND DETERMINISTIC APPROACH 27
5 ON-SITE RISKS 33
5.1 Representative DOE Site for Risk Assessment 335.2 Routing Analysis 355.3 On-Site Transportation Risk Assessment Method 395.4 Assumptions and In/Out Parameters . 405.5 Cargo-Related Accident Transportation Risks
for the General Public and On-Site Workers 465.6 Cargo-Related Accident Transportation Risks for the MEI 46
6 REFERENCES : 50
ADDENDUM I Transportation Risk Assessment for the HazardousComponent of Low-Level Mixed Waste AD-1
ADDENDUM II Transportation Risk Assessment for the HazardousComponent of Transuranic Waste AD-21
in

TABLES
1 California Accident Involvement Rates per Million Miles of Truck Travelby Truck Configuration and Highway Category, 1979-1983 . . 5
2 Probability of a Release Given an Accident,by Hazardous Cargo Type 6
3 Container Breach Rates and Release Fractions for ContainersSubject to Transport Accidents 6
4 Potentially Life-Threatening Concentration Valuesfor HW Chemicals Transported by DOE 14
5 Potential Any Adverse Effect Concentration Valuesfor HW Chemicals Transported by DOE 18
6 Increased Carcinogenic Risk Concentration Values
for HW Chemicals Transported by DOE 23
7 Population and Area Data for Work Areas at the Hanford Site 36
8 Input Parameters Used for ALOHA™ Dispersion Model 41
9 Population Densities along the Three RepresentativeRoutes at Hanford 45
10 Comparison of Population Health Risks for Each HW Alternative
for a 20-Year Period 47
11 Hazard Zones for Potential Life-Threatening Risks to an MEI 48
12 Potential Any Adverse Health Effect Risks to an MEI 48
13 Lifetime Increased Carcinogenic Risks to an MEI 49
FIGURES
1 Flowchart Illustrating the Operating Procedures of the Monte CarloRisk Assessment Model 29
2 Results of Monte Carlo Modeling for the No-Action Alternative —Probability that the Number of People with Potentially Life-ThreateningEffects Will Be Greater than N 30
IV

FIGURES (Cont.)
3 Results of Monte Carlo Modeling for the No-Action Alternative —Cumulative Probability of People with Potentially Life-ThreateningHealth Effects 31
4 Boundaries, Work Areas, and Principal Highways
and Roads at the Hanford Site 34
5 Hazardous Waste Routes at 100K and 100N Areas — Hanford Site 37
6 Hazardous Waste Routes at 200 Areas — Hanford Site 38
7 One-Mile Segments along Routes of On-SiteTransportation — Hanford Site 44

NOTATION
The following is a list of the acronyms, initialisms, and abbreviations (including unitsof measure) used in this document.
ACRONYMS, INITIALISMS, AND ABBREVIATIONS
AIHA American Industrial Hygiene AssociationALOHA™ Areal Locations of Hazardous AtmospheresANL Argonne National LaboratoryCEEL Community Emergency Exposure LevelCOT Committee on ToxicologyDOE U.S. Department of EnergyDOT U.S. Department of TransportationDW dangerous wasteEHS extremely hazardous substanceEPA U.S. Environmental Protection AgencyEPCRA Emergency Planning and Community Right to Know ActERPG Emergency Response Planning GuidelineHaWRAM Hazardous Waste Risk Assessment ModelingHEAST Health Effects Assessment Summary TablesHMIRS Hazardous Materials Information Reporting SystemHQ hazard quotientHW hazardous wasteHWDAR Hazardous Waste Disposal Approval RecordICRC increased cancer risk concentrationIDLH immediately dangerous to life and healthIRIS Integrated Risk Information SystemLC50 concentration of gas or vapor that causes death in half of the animals tested
when administered by continuous inhalationLCLO lowest concentration of gas or vapor that has caused death in any
exposed speciesLLMW low-level mixed wasteLLNL Lawrence Livennore National LaboratoryLOC level of concernMEI maximally exposed individualMRI Midwest Research InstituteNIOSH National Institute for Occupational Safety and HealthNOAA National Oceanic and Atmospheric AdministrationPAEC potential any adverse effect concentrationPEIS Programmatic Environmental Impact StatementPIH poison inhalation hazardPLC potentially life-threatening concentrationRfC reference concentrationRfD reference doseRTECS Registry of Toxic Effects of Chemical SubstancesSAM Station for Atmospheric MeasurementsSPEGL Short-Term Public Exposure Guidance Level
VI

STEL short-term exposure levelTCLO lowest concentration causing any adverse human effectTRUW transuranic wasteWM Waste ManagementWPPSS Washington Public Power Supply System
UNITS OF MEASURE
cm centimeter(s)cm2 square centimeter(s)cm3 cubic centimeter(s)d day(s)°F degree(s) Fahrenheitft foot (feet)g gram(s)gal gallon(s)h hour(s)kg kilogram(s)km kilometer(s)lb pound(s)m meter(s)m3 cubic meter(s)ug microgram(s)mg milligram(s)mi mile(s)min minute(s)ppm part(s) per millions second(s)wk week(s)yr year(s)
Vll

RISK ASSESSMENT FOR THE TRANSPORTATIONOF HAZARDOUS WASTE AND HAZARDOUS WASTE COMPONENTS
OF LOW-LEVEL MIXED WASTE AND TRANSURANIC WASTEFOR THE U.S. DEPARTMENT OF ENERGY WASTE MANAGEMENT
PROGRAMMATIC ENVIRONMENTAL IMPACT STATEMENT
by
M.A. Lazaro, A.J. Policastro, H.M. Hartmann,A.A. Antonopoulos, D.F. Brown, W.E. Dunn,M.A. Cowen, Y.-S. Chang, and B.L. Koebnick
ABSTRACT
This report, a supplement to Appendix E (Transportation Risk) ofthe U.S. Department of Energy Waste Management ProgrammaticEnvironmental Impact Statement (WM PEIS), provides additionalinformation supporting the accident data for chemical risk assessment andhealth risk methodology described in that appendix (Part II) and presentsthe uncertainty analysis and on-site risk calculations. This report focuseson hazardous material truck accident rates, release probabilities, andrelease quantities; provides the toxicological values derived for eachhazardous chemical assessed in the WM PEIS and further details on thederivation of health criteria; describes the method used in thetransportation risk assessments to address potential additivity of healtheffects from simultaneous exposure to several chemicals and the methodused to address transportation risks for maximally exposed individuals;presents an expanded discussion of the uncertainty associated withtransportation risk calculations; and includes the results of the on-sitetransportation risk analysis. In addition, two addenda are provided todetail the risk assessments conducted for the hazardous components oflow-level mixed waste (Addendum I) and transuranic waste (Addendum II).
1 INTRODUCTION
As a technical support supplement to Appendix E of the U.S. Department of Energy(DOE) Waste Management Programmatic Environmental Impact Statement (WM PEIS)(DOE 1996), this report provides (1) additional information and technical detail to supportthe accident data and health risk methodology described in that appendix and(2) supplemental information supporting the uncertainty analysis and the on-site riskcalculations. This report is not intended to be a comprehensive stand-alone document; rather,

readers who require a more detailed discussion of some of the data and data sources,assumptions, and analysis methods relevant to the hazardous waste (HW) transportation riskcalculations can find that information here. In addition, two addenda are provided to detailthe risk assessment conducted for the hazardous components of low level mixed waste(LLMW) and transuranic waste (TRUW).
Section 2 discusses data on hazardous material truck accident rates, hazardousmaterial release probabilities, and release quantities (supplementing Section E.16.3 ofWM PEIS Appendix E). Section 3, which supplements Section E.16.5 of Appendix E, providesthe toxicological values derived for each hazardous chemical assessed in the WM PEIS (DOE1996) and further details on how health criteria are derived. Section 3 also discusses (1) themethod used in the transportation risk assessment to address potential additivity of healtheffects from simultaneous exposure to several chemicals and (2) the methodology forcalculating risk for maximally exposed individuals. Section 4 provides an expandeddiscussion of the uncertainty associated with transportation risk calculations, supplementingSection E.18 of Appendix E. Finally, the approach, assumptions, model input data, andresults of the on-site transportation risk analysis are presented in Section 5.
Additional information provided in this report documents key parameters of thetransportation risk equation (Equation 1). This equation is used to quantify both radiologicaland HW transportation health risks. Equation 1 can be used to estimate the risk to thegeneral public and to on-site workers (i.e., number of individuals potentially experiencingan adverse health effect) from transporting a specific HW through a given population zone.General population risk estimates are given in Appendix E, Part II (DOE 1996); on-siteworker risk estimates are included in Section 5 of this document. Total risk for a specificshipment is calculated as:
Risk = Y,TARi x p(R/Ah x Ct x Dt x Lt , (1)i
where
Risk = health effects (individuals potentially affected);
TARt = truck accident rate per unit of distance traveled in populationzone i (accidents/km; accidents/mi);
P(RIA)i = conditional probability of an HW release in population zone i,given an accident involving a truck carrying HW;
Ci = health consequence area for population zone i (km /accident;mi2/accident);
Dt = population density in zone i (individuals/km ; individuals/mi2);and
Li = distance traveled in population zone i (i.e., routing data; km; mi).

The notation i in Equation 1 refers to one of three population zones (rural, urban,or suburban) with differing population densities. The risk for each shipment is calculatedby summing the risk for each population zone; risks for all shipments are summed to arriveat the risk for each alternative.

2 TRANSPORTATION ACCIDENT AND RELEASE PROBABILITIES
The probability of a hazardous chemical release given an accident is the product ofthe rate of truck accidents involving hazardous materials and the probability of a release ofa hazardous chemical (by cargo type). The truck accident rate and conditional probability aregiven by the TARi and P(RIA) parameters in Equation 1, which are used with consequenceand population data to compute the HW transportation risk. Data on the fraction ofhazardous chemicals released for those HW containers breached in an accident are used toquantify the source term in the consequence assessment. The risk for each mile is thencomputed by population density zones and summed for each alternative. The followingdiscussion provides more details on the choice of accident rates, release probabilities, andcontainer breach fractions for HW risk assessment modeling, which are summarized inSection E.l.6.3, Part II, of the WM PEIS Appendix E (DOE 1996).
The assessments for TRUW and LLMW included both truck and rail transportationmodes. The container types required for TRUW are Type B, which provide package integrityeven in severe accidents. The assumed release rates, rail accident rates and other data forassessment of TRUW and LLMW are provided in Appendix E of the WM PEIS (DOE 1996)and in the addenda to this document, and in the technical support document for LLMW(Monette et al. 1996).
2.1 TRUCK ACCIDENT PROBABILITIES
A study conducted in California (Graf and Archuleta 1985) is the only known sourceof information that accurately matches accident data and corresponding shipment miles forselected sites statewide to generate accident involvement rates by highway category andtruck configuration. These rates are given in Table 1 and can be found in the MidwestResearch Institute (MRI) report (Harwood and Russell 1990).
Only the single-unit truck configuration rates in the first row of Table 1 have beenused. Truck configuration is not documented on the DOE manifests (Argonne NationalLaboratory [ANL] HW database); however, the DOE HW is shipped predominantly inconsignments of multiple drums with maximum capacities of less than or equal to 55 gal perdrum. These types of shipments are conveyed mostly in single-unit trucks.
Furthermore, routing information is categorized by urban freeway, suburbanfreeway, rural freeway, and rural nonfreeway miles. Suburban freeway accident involvementrates have been estimated by averaging the rural and urban freeway rates to more accuratelymatch the route descriptions.

TABLE 1 California Accident Involvement Rates per Million Miles ofTruck Travel by Truck Configuration and Highway Category, 1979-1983
TruckConfiguration
Single-UnitSingle Comb.Double Comb.All Trucks
RuralFreeway
0.560.941.180.90
RuralOther
0.681.911.631.49
Highway Category
SuburbanFreeway*1
0.791.561.411.19
UrbanFreeway
1.012.181.631.48
UrbanOther
1.042.035.331.64
a The suburban highway-type numbers are not presented in the MRI Report(Harwood and Russell 1990). The numbers presented here are the average ofrural freeway and urban freeway. The suburban freeway accident rates will bematched with corresponding route mileage in the suburban population zone.
2.2 HAZARDOUS WASTE RELEASE PROBABILITIES
A key problem with national data relevant to release probabilities is that proceduresfor reporting hazardous material accident data at the state level for entry in nationallymandated databases are nonuniform. By contrast, some individual states maintain morecomprehensive and better monitored hazardous material accident data for their ownrecording purposes. For example, Missouri Highway Patrol accident reports contain entriesthat identify whether the involved vehicles contained hazardous cargo, specify the type ofhazardous material, and determine whether a release occurred. This information allows foraccurate classification of releasing accidents by cargo type. Furthermore, the Missouri 1985-1986 data are nearest the midpoint of total annual hazardous material movements by roadand have therefore been selected as the basis for estimating release probabilities given anaccident for the risk assessment. These probabilities are given in Table 2 and can be foundin the MRI report (Harwood and Russell 1990).
2.3 RELEASE QUANTITIES
One variable in computing health consequence is the release quantity. In HW riskassessment, it is assumed that in each accident modeled, a fixed percentage of the shipmentcapacity is released depending on the type of container used. These fixed percentages arepresented in Table 3.
The quantity released in an accident is given in Equation 2. The breach fraction forbulk containers is 1 because bulk containers are generally large, single-unit containers liketanker trucks. Although multiple bulk-portable containers can be shipped on one truck, noDOE shipments make use of bulk-portable tanks.

Q = nt x bf x cc x
where
Q = quantity released;
nt = number of containers in transit;
bf = breach fraction;
cc = container capacity; and
fr = fraction released.
All numbers in Table 3, other than the bulk containers breach fraction, werecomputed by averaging the corresponding breach fractions and container capacity release
TABLE 2 Probability of aRelease Given an Accident,by Hazardous Cargo Type
Hazardous CargoType (in Bulk) Probability
Gases 0.072Solids 0.091Liquid 0.187
TABLE 3 Container Breach Rates and ReleaseFractions for Containers Subject to TransportAccidents (Liquid and Gas Shipments)a
Shipment Type
Package freight containers0 to 2 gal2 to 10 gal10 to 50 galGreater than 50 gal
Bulk containers
BreachFraction
0.4380.4510.4070.3591.000
CapacityRelease Fraction
0.6530.3680.2710.1990.162
Based on data from 1989 to 1992 in the HazardousMaterials Information Reporting System (HMIRS)database (U.S. Department of Transportation [DOT]1993a).

fractions in a subset of the accident records found in the HMIRS database (DOT 1993a). Thesubset of the HMIRS accidents used to compute these numbers includes all accidents thatsatisfy the following conditions:
• A release of a nonradioactive hazardous waste occurred;
• The release did not result from a loading, unloading, or temporarystorage incidents;
• The physical state of the hazardous material was liquid or gas; and
• The mode of travel was highway (excludes rail, water, and air travel).

8
3 HEALTH RISK CRITERIA
The on-site and off-site shipment of HW, TRUW, and LLMW from generator facilitiesto treatment facilities imposes a population health risk associated with potential accidentsinvolving the release of toxic chemicals to the atmosphere. These shipments also impose apotential collision health risk to other vehicle drivers and passengers, pedestrians, and thetransport truck crew members. The approach developed to quantify the accident chemicalexposure and collision risks is described in this section.
Health impacts associated with transporting HW, and hazardous components ofTRUW, and LLMW may include impacts under both routine and accident transportconditions. The end point assessed under routine transport conditions is excess latentmortality due to inhalation of vehicle exhaust emissions. Additionally, the probability ofinjury or fatality for the general public due to vehicle collisions but independent of anyrelease of HW is estimated. For predicting inhalation hazards associated with accidentalreleases, the Areal Locations of Hazardous Atmospheres (ALOHA™) model can be used tocalculate the health consequence area {Ci in Equation 1) by predicting the area of the HWplume produced by an accident. To predict the plume area, concentrations corresponding toappropriate health end points are required. Human health risk end points addressed in thisassessment include the potential for life-threatening effects (evaluated by using potentiallylife-threatening concentration [PLC] values), the potential for any adverse effects (evaluatedby using potential any adverse effect concentration [PAEC] values), and the potential forcarcinogenic effects (evaluated by using increased cancer risk concentration [ICRC] values).Calculated risks correspond to the end point being assessed (i.e., PLC values are used toestimate the number of individuals in the general population potentially experiencing life-threatening effects; PAEC values are used to estimate the number of individuals in thegeneral population potentially having any adverse effects; and ICRC values are used toestimate the number of individuals potentially having an increased risk of cancer). PLC,PAEC, and ICRC values were derived from toxicological data and risk evaluation methodsfor emergency planning available from the U.S. Environmental Protection Agency (EPA) andother sources (DOT 1990; Maloney 1990; EPA et al. 1987; EPA 1986; National ResourceCouncil 1993). The development of health criteria used to assess risk with respect to theseend points is described in the following subsections.
The goal of the proposed approach for identifying PLC, PAEC, and ICRC values isto estimate the minimum concentration level that could induce the adverse health effect.This minimum level is used in the ALOHA™ model to estimate the plume area with an airconcentration at that level or higher. The total population exposed is assumed to be at riskfor the health effect. Of the population at risk (i.e., within the plume), those exposed to thehighest concentrations will have the greatest likelihood of experiencing the health effect. Themethod identifies the number of individuals in the general population at risk but does notdifferentiate the risk for individuals within the plume.

3.1 GENERAL INFORMATION ON CRITERIA DEVELOPMENTFOR ACCIDENTAL RELEASES
The health criteria concentrations required to analyze exposures occurring as a resultof accidental chemical releases (e.g., from transportation accidents) must be applicable forsingle, brief exposures of individuals in the general public. Before the 1984 accidental releaseof methyl isocyanate in Bhopal, India, which killed more than 2,400 people, chemical riskassessment focused primarily on methods for evaluating risks from chronic, low-levelexposures due to environmental contamination. In response to the Bhopal catastrophe andaccidental releases in the United States, Title III of the Superfund Amendments andReauthorization Act of 1986 (also known as the Emergency Planning and Community Rightto Know Act or EPCRA) was passed. This act required the EPA to publish a list of extremelyhazardous substances (EHSs) and to develop methods for assessing the lethal hazards ofthese substances (EPA et al. 1987). The EPA complied by identifying more than 500 EHSsand introducing the level of concern (LOC) concept, which is defined as the concentration inair of each EHS above which there may be serious irreversible health effects or death as aresult of a single exposure for a relatively short period of time. The EPA published estimatedmeasures of LOC for each EHS on the basis of occupational guideline levels, fractions oflethal concentrations for animals, or modified occupational standards and emphasized thatthese were preliminary guidelines to be used while more precise measures were beingdeveloped (EPA et al. 1987). Documentation of the LOC derivation for each chemical wasnever published.
A consortium of chemical firms has developed a protocol for developing communityEmergency Response Planning Guidelines (ERPGs), which are reviewed and distributed bythe American Industrial Hygiene Association (AIHA 1988-1992). The procedure fordeveloping the ERPGs relies on thorough review of both published and unpublished chemical-specific data. ERPGs are available for about 50 chemicals. For a number of chemicals, theNRC has developed Short-Term Public Exposure Guidance Levels (SPEGLs) intended forapplication to single, unpredicted short-term exposures of the general public (NationalResearch Council 1986).
At the request of the EPA, the NRC Committee on Toxicology (COT) recentlyprepared a report entitled Guidelines for Developing Community Emergency Exposure Levels(CEELs) for Hazardous Substances (National Research Council 1993). This documentdiscusses data sources and appropriate risk assessment methods for deriving emergencyresponse guidelines for the general public; it advocates a chemical-specific approach todeveloping CEELs like that used in the development of ERPG values. To date, however,CEEL values have not been developed by federal agencies.
The guidance in the NRC CEEL document was implemented whenever possible indeveloping the health criteria concentrations to be used in the transportation risk assessmentfor HW and hazardous components of other wastes for the WM PEIS. The large number ofchemicals transported by DOE waste generators, however, precluded evaluation of theprimary literature for individual chemicals. The proposed approach for deriving criteriaconcentrations relies on primary toxicity data reported in databases or reference books, and,

10
as such, must be considered a screening level approach. However, the health criteria valuesused in this transportation risk assessment constitute an improvement over the EPA LOCvalues, because their data sources are carefully documented, and because refining featureshave been implemented (e.g., exposure duration adjustment and the additional health endpoints of any adverse effects and increased carcinogenic risk).
3.1.1 Potentially Life-Threatening Concentration Values
The potential for life-threatening health effects is assessed for specific HWcomponents designated as "poison inhalation hazards" (PIHs) by the DOT (49 Code of FederalRegulations Parts 173.115 and 173.132-133). These substances are assigned protective actiondistances in the DOT Emergency Response Guidebook commonly used by personnelresponsible for hazardous materials incident response (DOT 1990). Only liquids and gasesare designated as PIH substances. Two criteria must be met for a chemical substance to bedesignated a PIH: (1) high toxicity, on the basis of animal 50% lethal concentrations (LC50),and (2) for liquids, medium to high volatility. PLC values have been derived for PIHsubstances shipped by DOE HW waste generators in FY 1992, which is considered thebaseline case for the no-action alternative. No PIH chemicals were included in either theTRUW or the LLMW inventories.
PLC values are air concentrations of HW above which exposed persons are at risk ofpotentially life-threatening health effects when exposed for the associated exposure duration.PLC values are input to the ALOHA™ code to estimate "PLC areas at risk" (i.e., areas thatequal or exceed the PLC air concentration). In deriving PLC values, three main issues mustbe addressed: (1) selection of toxicity values, (2) selection of appropriate uncertainty factors,and (3) exposure duration adjustment. These issues are summarized below.
Toxicity Value Selection. For this screening level assessment, toxicity data wereobtained from one of two sources: (1) the Registry of Toxic Effects of Chemical Substances(RTECS) database (National Institute for Occupational Safety and Health [NIOSH] 1992) or(2) Dangerous Properties of Industrial Materials (Sax and, Lewis 1992). Uncertainty in thetoxicity values could be reduced by verifying the toxicity data in the primary literature. Also,the toxicity data should be updated periodically to reflect the most recent data available.
Two possible toxicity values for estimating potential human life-threatening healtheffects are the LC50 and the LCL0. The LC50 is defined as that concentration of gas or vaporthat causes death in half of the animals tested when administered by continuous inhalation.The LC50 is obtained only from animal tests; consequently, results must be extrapolated forapplication to humans. The LCLQ is defined as the lowest concentration of gas or vapor thathas caused death in any exposed species. The LCLQ values may be obtained from animaltests or from accidental human exposure occurrences. When obtained from the latter, thelethal concentration measurement may not be accurate.
Because of the limitations of both the human LCL0 values and the LC50 values, aconservative approach was taken in selecting the chemical-specific toxicity values. The lower

11
of either (1) the lowest available human LCLO value divided by an uncertainty factor of 3 or(2) the LC50 value for the most sensitive tested mammalian species divided by an uncertaintyfactor of 10 was selected as the primary toxicity value for deriving PLCs (uncertainty factorselection is discussed below). Currently, LC50 values or human LCL0 values are availablefor 87% of the substances evaluated. For substances for which no LC50 or human LCLO valuewas available, the lowest mammalian LCL0 value was substituted for the LC50 value. Ifnone of the above were available, a short-term exposure level (STEL) for occupationalexposures was multiplied by 15 to derive the PLC value (based on methods used to deriveLOC values [EPA et al. 1987]).
Uncertainty Factor Selection. The EPA uses uncertainty factors is derivingreference doses for hazardous chemical substances (EPA 1989a). This EPA precedent hasbeen used to support reduction of human LCL0 values by an uncertainty factor of 3 (to correctfor variations in susceptibility among individuals in the human population) and LC50 ormammalian LCL0 values by an uncertainty factor of 10 (3 to correct for interspeciesextrapolation and 3 to account for variations in human susceptibility; rounded to 10 forsimplicity). When the EPA derives reference doses, additional uncertainty factors are alsoconsidered to account for extrapolation of subchronic data to chronic exposure conditions anduse of lowest adverse effect data instead of no adverse effect data. However, these twofactors are not considered appropriate for deriving PLC values for acute human exposuresand have not been incorporated in toxicity value development for this end point.
The default uncertainty factor generally used by the EPA for each category ofuncertainty is 10. However, use of an uncertainty factor of 10 for human LCL0 data or 100for LC50 data would in general have reduced the estimated human life-threatening level toa concentration that was not life threatening to humans (compared with other publishedcriteria). The EPA acknowledges that use of modifying factors of less than 10 is appropriatein certain instances. The EPA prefers the use of an intermediate factor on a logarithmicscale in these instances (EPA 1980). Therefore, an uncertainty factor of 3 (approximate logmean of 1 and 10) was selected.
Exposure Duration Adjustment. The ALOHA™ code used to estimate the "PLCareas at risk" for transportation accidents also provides estimated release duration, rangingfrom 1 to 60 min. Releases of longer duration are reported as "greater than 60 min." For theHW transportation risk assessment, it was assumed that control and dispersion of the sourcelimits significant exposures to periods of 1 hour or less.
Because toxic dose is a function of both exposure level (e.g., air concentration ofchemical) and duration of exposure (Klaassen et al. 1986), reported LCL0 and LC50 valuesare associated with experimental exposure times. The release durations estimated by theALOHA™ code are used to scale LCLO or LC50 values in the literature from experimentalexposure times to the estimated exposure durations. For simplicity, human PLC values weregenerated for three exposure durations: 15, 30, and 60 min. The PLC value for the exposureduration closest to but greater than the ALOHA™-estimated release duration is used togenerate the area within which exposed persons are at risk of potentially life-threatening

12
effects (e.g., if the release duration is 20 min, the PLC for a 30-min exposure duration is usedto estimate the area at risk).
Either a linear or exponential function was assumed in scaling literature-reportedtoxicity values to the appropriate exposure durations. The linear scaling procedure is basedon Haber's Law (Klaassen et al. 1986), which in equation form is as follows:
PLC - Toxicity Value x EET ^_ _ _ _ _ _ ,
where
PLC = potentially life-threatening concentration (ppm);
Toxicity Value = literature-reported L C L Q or LC50 value (ppm);
EET = experimental exposure time (min);
ED = exposure duration (15, 30, or 60 min); and
UF = uncertainty factor (3 or 10).
The exponential scaling equation is as follows:
lUn(.Toxicity Valuef x EET
PLC - ED(4)
UF
The parameters for Equation 4 are defined in Equation 3. Wilson (1991) discussesthe use of this scaling equation and gives the appropriate range of values for n as 1.5 to 3.5;a factor of 2 was used in calculations for this assessment. The linear scaling procedureresults in a lower estimate of the PLC when scaling from an experimental exposure timeshorter than the exposure duration (e.g., scaling from a 15-min experimental exposure timeto a 60-min exposure duration). The exponential scaling procedure results in a lowerestimate of the PLC when scaling from an experimental exposure time longer than theexposure duration. In the absence of chemical-specific data, the scaling assumption(i.e., linear versus exponential) resulting in the lower PLC value was used.
In calculating accident risks for the potentially life-threatening end point, it isassumed that the entire population residing within the PLC area at risk would experienceserious health effects from the exposure. This is a conservative assumption because the PLCvalues have incorporated uncertainty factors to account for sensitive human subpopulations.The PLC values derived for the HW risk calculations for 15-, 30-, and 60-min exposure

13
durations are given in Table 4. The literature-reported toxicity value used to derive the PLCfor each chemical is also provided.
Table 4 gives two emergency criteria for comparison with PLC values. The ERPG-3value is defined as "the maximum airborne concentration below which it is believed thatnearly all individuals could be exposed for up to 1 hour without experiencing or developinglife-threatening health effects" (AIHA 1988-1992). In Table 4, ERPG-3 values should becompared with PLC values for 60-min exposure durations. Where available, ERPG-3 valuescorrespond fairly well to the PLC values; in all cases, the difference was less than an orderof magnitude.
Table 4 also provides LOC values developed by the EPA. The LOC values shouldbe compared with 30-min PLC values. Comparison of the values shows no definitecorrelation. Of the substances with LOC values available, 17% were higher than thecorresponding PLC, 45% were within a factor of 10 lower than the PLC, and 38% were morethan 10 times lower than the PLC (the factor ranged from 15 to 180 times lower). LOCvalues were originally derived as one-tenth of immediately dangerous to life and health(IDLH) values (EPA et al. 1987). A lack of correlation of IDLH (and thereby LOC) valueswith primary toxicity values has also been noted in the literature (Alexeeff et al. 1989) andmay be due to the fact that IDLH and LOC values have not been updated to reflect morerecent toxicity data since their initial compilation. An additional problem with the use ofLOC values is that documentation of the primary toxicity values used to generate the LOCshas not been published.
3.1.2 Potential Any Adverse Effect Concentration Values
To estimate the probability of the occurrence of less severe effects, values were alsodeveloped to estimate air concentrations of HW above which exposed persons are potentiallyat risk of any adverse effect (PAEC values). PAEC values were derived for all PIHsubstances shipped by DOE HW waste generators in FY 1992 and for HW, TRUW, andLLMW other shipped substances that had inhalation reference doses or concentrationsavailable from the EPA for use as the toxicity value. As in the derivation of PLC values, thederivation of PAEC values requires selection of toxicity values and uncertainty factors andexposure duration adjustment, which are discussed below.
Toxicity Value Selection. Inhalation reference doses and reference concentrationsdeveloped by the EPA were selected as the most applicable toxicity values for use in derivingPAEC values. An inhalation reference dose is defined as an estimate (with uncertaintyspanning perhaps an order of magnitude) of continuous exposure to the human population(including sensitive subgroups) that is likely to be without appreciable risk of deleteriouseffects (EPA 1989b). The reference dose in mg/kg/d is derived from the reference

TABLE 4 Potentially Life-Threatening Concentration Values for HW Chemicals Transported by DOEa
Substance
Acrolein6
AllylamineAmmoniaArsineBoron trifluorideBromineCarbon monoxideCarbonyl fluorideChlorineChloropicrinCyanogen bromideCyclohexyl isocyanatee
Dimethyl sulfateEthyl chloroformateHydrogen fluoride6
Hydrogen selenideHydrogen sulfideMethylamineMethyl bromideMethyl chloroformateMethyl iodideMethyl vinyl ketoneNickel carbonyle
Nitric acid (fuming)Nitric oxideNitrogen dioxideNitrosyl chloride*1
PhosgenePhosphinePhosphorous oxychloridePhosphorous trichlorideSelenium hexafluoride
Silicon tetrafluorideSulfur dioxideSulfur trioxideSulfuric acid (fuming)
CAS No.
107-02-8107-11-97664-41-77784-42-17637-07-27726-95-6630-08-0353-50-47782-50-576-06-2506-68-33173-53-377-78-1541-41-3
7783-07-57783-06-474-89-574-83-979-22-174-88-478-94-413453-39-37697-37-210102-43-910102-44-02696-92-675-44-57803-51-210025-87-37719-12-27783-79-1
7783-61-17446-09-57446-11-97664-93-9
Mole-cular
Weight
5657177868
160286671
164106125126109
8134319595
14270
171633046659934
153137193
104648098
ToxicityValue(ppm)
131286
5,0007939
7505,000
360137
1011630
914550
6.1800
1,89739748
2243
1067
87230305011325010
16,0003,000
980
Time/Speciesb
30 min/ratf
4 h/rat«5 min/human/LCy]10 min/mouaef
4 h/guinea pig*9 min/mouse5 m/human/LCLolh/ ra t1 h/mouse4 h/mousef
10 min/mouse/LCn/1 h/guinea pig4 h/ratf
lh / ra t30 min/human/LCLO
g
1 h/rat/LCLOf
5 min/human/LCLo2 h/mousef
2 h/mousef
2 h/mousef
4 h/ratf
2 h/mousef
30 min/mousef
4 h/ratf
4 h/ratf
1 h/guinea pig^1 h/guinea pig5 min/human/LCLo4 h/ratf
4 h/ratf
4 h/guinea pig*1 h/rat, mouse,
guinea pig/LC^4h/rat/LCL0
5 min/human/LCLo6 h/guinea pig/LC^/2 h/mouseg
PLC(15 min)
191105605.21645
5607227
3.97.76.03.529241.289
540110
1490
0.791.427
3506.06.05.64.413202.0
6,4003304.523
PLC(30 min)
1381
2802.61123
2805119
2.83.94.22.52117
0.8644
380791063
0.560.96
192504.24.22.83.19.1141.4
4,5001703.216
Concentration (ppm)
PLC(60 min)
6.657
1401.3
811
1403614
2.01.93.01.7158
0.6122
27056
745
0.400.48
131703.03.01.42.26.4101.0
3,200832.211
ERPG-3C
(60 min)
3.0
1,000
5.0
203.0
50
100500
125
1.0
15
30 mg/m3
LOCd
(30 min)
0.441.450
0.60101.0
2.5
10
1.0
2.00.20
30
2000.47
0.0240.050
10255.0
0.2020
0.485.0
100.92
2.0

TABLE 4 (Cont.)
Substance
Sulfuryl fluorideTellurium hexafluorideThionyl chlorideThiophosgene1
Titanium tetrachlorideToluene diisocyanateTrimethylacetyl chloride'Tungsten hexafluoridek
CAS No.
2699-79-87783-80-47719-09-7463-71-87550-45-026471-62-53282-30-27783-82-6
Mole-cular
Weight
102242119115190174121298
ToxicityValue(ppm)
9915
5008013
9.7137
0.82
Time/Speciesb
4h/rat1 h/mouse/LCLj/lh / ra t2 h/mouse2 h/mouse4 h/mouse1 h/mouse15 min/STEL x 15f
PLC(15 min)
4001.0
10023
3.73.92720
Concentration Values by Exposure Time (ppm)
PLC(30 min)
2800.71
7116
2.62.71910
PLC(60 min)
2000.50
5011
1.81.91415
ERPG-3C
(60 min)
100 mg/m3
LOCd
(30 min)
0.10
0.13
a Data preference hierarchy and linear versus exponential extrapolation detailed in text. Values rounded to two significant figures. To convert toxicity valuesto ppm, multiply the concentration (mg/m3) by 24.5 and divide by the molecular weight. Toxicity value scaled linearly or exponentially to result in lowestPLC value. Linear scaled PLC = (Toxicity Value x EET)/(ED x UF); exponential scaled PLC = {[(Toxicity Value)2 x EET1/ED}44 •=- UF; UFs: for human L C ^ ,3; LC50 or mammalian LC L Q, 10.
Toxicity value is LC50 unless otherwise noted.
c ERPG-3: Emergency Response Planning Guideline-3 (AIHA 1988-1992).
d EPA et al. (1987).
e Exponential scaling used for 15-min PLC; linear scaling used for 60-min PLC.
f Data obtained from RTECS database (NIOSH 1992).
g Data obtained from Sax and Lewis (1992).
h Value for nitrogen dioxide used for cyclohexyl isocyanate and nitrosyl chloride; emits toxic fumes of NO^ when heated to decomposition (Sax and Lewis 1992).
1 Value for sulfuric acid used for thiophosgene; emits toxic fumes of SOX when heated to decomposition (Sax and Lewis 1992).
j Value for chlorine used for trimethylacetyl chloride; emits Cl~ when heated to decomposition (Sax and Lewis 1992).
k No LC50 or LCLQ d a t a available for tungsten hexafluoride; used the 15-min STEL value (10 mg W/m3) converted to ppm (i.e., 10/184 [MW of W] x 24.5). Thiswas multiplied by an uncertainty factor of 15, derived as follows: In deriving LOC values, EPA et al. (1987) suggest that the IDLH value divided by 10 (forsensitive human subpopulations) is an appropriate LOC value (to be used as the PLC in this instance). Further, it is suggested that IDLH = 8-h TWA x 500,and STEL/3 = 8-h TWA. Thus, algebraically, the appropriate adjustment for an STEL is: 15-min PLC = STEL x 500/(10 x 3).
Abbreviations: CAS = Chemical Abstracts Service, EET = experimental exposure time; ED = exposure duration (15-, 30-, or 60-min); IDLH = immediatelydangerous to life and health, LOC = level of concern, RTECS = Registry of Toxic Effects of Chemical Substances, STEL = short-term exposure level, TWA = time-weighted average, and UF = uncertainty factor.

16
concentration (RfC) in mg/m3. The EPA Integrated Risk Information System (IRIS) databaseand Health Effects Assessment Summary Tables (HEAST) have been used to obtain currentreference concentration values (EPA 1993a, 1993b).
Many of the PIH substances did not have available RfC values. For thesesubstances, toxicity values were selected in a hierarchical fashion analogous to that used toestimate PLC values. In the absence of an RfC, the lowest human TCLO value (defined asthe lowest concentration causing any adverse effect) was selected as the most appropriatetoxicity value for PAEC derivation. When human TCL0 values were not available, thefollowing toxicity values from the literature were used (in decreasing order of preference):(1) lowest mammalian TCL0 values, (2) lowest human LCLQ values, (3) lowest LC50 values,(4) lowest mammalian LCLO values, and (5) the STEL value.
Uncertainty Factor Selection. For substances with available RfC values, applyinguncertainty factors was not necessary because the appropriate factors are alreadyincorporated into the RfC value (EPA 1993a, 1993b). Where use of other toxicity values wasnecessary, uncertainty factors were selected following the rationale used by the EPA inderiving RfCs (EPA 1989a): (1) human TCL0 divided by 10 (for sensitive subpopulations);(2) mammalian TCL0 divided by 100 (10 for sensitive subpopulations and 10 for extrapolationfrom animal data to humans); (3) human LCL0 divided by 100 (10 for sensitive humansubpopulations and 10 for extrapolation of lethality data to estimate sublethal effects);(4) LC50 or mammalian LCLO divided by 1,000 (10 for sensitive human subpopulations, 10for extrapolation from animal data to humans, and 10 for extrapolation of lethality data toestimate sublethal effects); and (5) the STEL value divided by 3 (for sensitive humansubpopulations).
Exposure Duration Adjustments. As in the assessment of potentially life-threatening effects, PAECs were generated only for assumed exposure durations of 15, 30,and 60 min. The PAEC value for the exposure duration closest to but greater than theALOHA™-estimated release duration was used to generate the area within which exposedpersons are at risk of any adverse effects (e.g., for a 20-min ALOHA™-estimated releaseduration, the 30-min PAEC value is used).
For substances for which RfC values were available, the equation used to estimatePAEC values was based on EPA methods for estimating inhalation exposures and acceptableair concentrations of noncarcinogenic contaminants (EPA 1989a, 1991). To ensure that thederived PAEC values are protective, exposure values for a 6-year-old child at a moderatebreathing rate were modeled rather than standard adult values. Appropriate body weightand inhalation rate values for a child were obtained from the EPA's Exposure FactorsHandbook (EPA 1989a). In addition, because subchronic RfCs were used, the minimum

17
exposure time of 14 days was used as the averaging time. The equation for deriving PAECvalues is as follows-
IT -
values is as follows:
PAEC . THQ x RfD x BW x AT x 24.5 ( 5 )
IR xET x MW
where
PAEC = any adverse effect concentration (ppm);
THQ = target hazard quotient (1), defined as an exposure level over aspecified time period divided by a reference dose derived for asimilar exposure period;
RfD = reference dose (mg/kg/d); equal to (RfC x 20 m3/d)/70 kg;
BW = body weight for a 6-year-old child (21 kg);
AT = averaging time (14 d);
IR = moderate activity inhalation rate for a 6-year-old child (0.033 m3/min);
ET = exposure time (min; 15, 30, or 60 min);
MW = molecular weight of substance; and
24Ji = unit conversion factor (mg/m3 to ppm).MW
For substances for which no RfC values are available, the exposure durationadjustment is identical to that used in generating PLC values: the exposure durationadjustment (i.e., linear or exponential) resulting in the lowest PAEC value was used inmodifying toxicity values for the derivation of PAECs. Toxicity data for these chemicals (e.g.,TCL0 values) were obtained from either the NIOSH (1992) or Sax and Lewis (1992). Theprimary literature can be consulted to verify these values and periodically update the PAECvalues.
In calculating accident risks for the any adverse effect end point, it is assumed thatthe entire population residing within the PAEC area at risk would experience some adverseeffect from the exposure. Again, this is a conservative assumption because the PAEC valueshave incorporated uncertainty factors to account for sensitive human subpopulations. ThePAEC values derived for the HW, LLMW and TRUW risk calculations for 15-, 30-, and60-min exposure durations are given in Table 5. The table also gives the toxicity value usedto derive the PAEC for each chemical.
Table 5 lists Emergency Response Planning Guideline-1 (ERPG-1) values forcomparison with PAEC values. ERPG-1 values are defined as levels "below which exposure

TABLE 5 Potential Any Adverse Effect Concentration Values for HW Chemicals Transported by DOEa
Substance
AcetonitrileAcroleind
Acrylic acidAcrylonitrileAllyl alcoholAllylamineAmmoniad
AnilineArsineBoron triiluorideBromineCarbon disulfldeCarbon monoxideCarbon tetrachlorideCarbonyl fluorideChlorineChloroformChloromethaneChloropicrinCyanogen bromideDichlorodifluoromethaneDichloromethaned
Diethylene glycolmonobutyl ether
Dimethyl sulfateEpichlorohydrinEthyl chlorided
Ethylene glycolmonobutyl ether
Hydrofluoric acidHydrogen chlorideHydrogen fluorideHydrogen selenideMethylamineMethyl bromideh
Methyl cyclohexaned
Methylene chlorided
Methyl ethyl ketoned
Methyl iodideMethyl isobutyl ketoneMethyl vinyl ketoneNickel carbonylNitric acid (fuming)
CAS No.
75-5-8107-02-879-10-7107-13-1107-18-6107-11-97664-41-762-53-37784-42-1 "7637-07-27726-95-675-15-0630-08-053-23-5353-50-47782-50-567-66-374-87-376-06-2506-68-375-71-875-09-2112-34-5
77-78-1106-89-875-00-3111-76-2
7664-39-37647-01-07664-39-37783-07-574-89-574-83-9108-87-275-09-278-93-374-88-4108-10-178-94-413453-39-37697-37-2
Mole-cular
Weight
41567263585717
93.127868
1607628
1556671
11950
16410612185
162
1269365
118
203620813195
1128572
14210070
17163
SubchronicRfC
(mg/m3)
0.50.00002
0.0030.002
0.10.01
0.007
0.01
0.06
0.049
23
0.2
0.0110
0.2
0.007
331
0.8
ToxicityValue(ppm)
3.0E-018.7E-061.0E-039.2E-04
10002.5
1.4E-012.6E-03
252.5E-03
7503.2E-03
5259.5E-03
360500
29892
4.1E-018.7E-013.0E-02
972.6E-033.8E+00
1234.7E-03
1230.3
1897397
6.5E-018.7E-013.4E-01
2242.0E-01
2.88.667
Time/Speciea/Effect
2 wk-7 yr/human/NOAELc
2 wk-7 yr/human/NOAELc
2 wk-7 yr/human/NOAELc
2 wk-7 yr/human/NOAELc
1 h/human/LCu)"5 min/human/TC^Q/eye, resp irritc
2 wk-7 yr/human/NOAELc
2 wk-7 yr/human/NOAELc
30 min/human/LC^)6
2 wk-7 yr/human/NOAELc
9 min/mouse/LC60e
2 wk-7 yr/human/NOAELc
10 min/human/TC^j/headache6
2 wk-7 yr/human/NOAELg
1 h/rat/LC60°5 min/human/LC^0
2 wk-7 yr/human/NOAELg
2 wk-7 yr/human/NOAELg
10 min/human/LCLo"10 min/human/LCrQ6
2 wk-7 yr/human/NOAELc
2 wk-7 yr/human/NOAELc
2 wk-7 yr/human NOAELC
10 min/human/LCLQ6
2 wk-7 yr/human/NOAELc
2 wk-7 yr/human/NOAELc
2 wk-7 yr/human/NOAELc
1 min/humanyTCIj0/cough, irrite
2 wk-7 yr/human/NOAELc
1 min/human/TCj Q/cough, irrite
8 h/guinea pig/LC60e
2 h/mouse/LC60e
2 h/mouse/LC50e
2 wk-7 yr/human/NOAELc
2 wk-7 yr/human/NOAELc
2 wk-7 yr/human/NOAELc
4 h/rat/LC60e
2 wk-7 yr/human/NOAELc
2 h/mouse/LC50e
15 min/rat, hamster/TCLo/reprod*5
4 h/rat/LC60e
Inhalation
RfD(mg/kg/d)
1.4E-015.7E-068.6E-045.7E-04
2.7E-022.7E-03
2.0E-03
2.7E-03
1.7E-02
1.1E-022.6E+00
5.7E-018.6E-015.7E-02
2.9E-032.9E+005.7E-02
2.0E-03
8.6E-018.6E-012.9E-01
2.3E-01
15 min
50.61.5E-03
0.1730.157
200.08
250.450.350.430.450.55
351.61
0.71.71.4
7412.0
0.6169
146.95.1
0.60.45
644.47.0
10.8
0.820.0017
5.41.1
111.1150
580.9033.2
0.0080.0860.27
PAEC (ppm)
30 ruin
25.37.4E-04
0.0870.078
140.04
120.220.250.210.230.27
180.81
0.50.830.703711.0
0.3134
73.42.6
0.30.22
322.23.5
0.40.4
0.410.0012
3.80.8
55.57329
0.6316.6
0.0060.0430.19
60 min
12.73.7E-04
0.0430.039
100.02
6.10.110.130.110.110.14
8.80.40
0.40.420.351850.5
0.1517
36.71.3
0.20.11
161.11.8
0.20.2
0.200.0008
2.70.6
27.83714
0.458.3
0.0040.0210.13
ERPG-lb
(ppm)60 min
0.1
25
0.2
1
5
5
25
oo

TABLES (Cont.)
Substance
Nitric oxideNitrobenzeneNitrogen dioxide
Nitrosyl chloride'
PhosgenePhosphinePhosphorous oxychloridePhosphorous trichloridePropylene oxide''Selenium hexafluorideSilicon tetrafluorideStyrene 'Sulfur dioxideSulfuric acid (fuming)'Sulfur trioxideSulfuryl fluorideTellurium hexafluorideThionyl chlorideThiophosgeneTitanium tetrachlorideToluene1,2,4-Trichlorobenzenel,l,l-Trichloroethaned
Trichlorofluoromethane1,1,2-Trichloro-
1,2,2-trifluoroethaneTriethylamineTrimethylacetyl chlorideTungsten hexafluoride1"Vinyl acetated
CAS No.
10102-43-998-95-310102-44-0
2696-92-6
503-38-87803-51-210025-87-37719-12-275-56-97783-79-17783-61-1100-42-57446-09-57664-93-97446-11-92699-79-87783-80-47719-09-7463-71-87550-45-0108-88-3120-82-171-55-675-69-476-13-1
121-44-83282-30-27783-82-6108-05-4
Mole-
cularWeight
3012346
65
19834
15313758
193104104649880
102242119115190
92181
133.42137187
101121298
• 86
Subchronic
RfC(mg/m3)
0.02
0.0003
0.03
3
0.07
0.07
0.40.09
17
30
0.007
0.2
Toxicity
Value(ppm)
872
4.0E-036.2
6.2
4452.2E-04
3250
1.3E-0210
160007.1E-01
12NA9.2
2255
500NA13
1.1E-011.2E-021.8E-011.2E+003.9E+00
1.7E-035000.82
5.7E-02
Time/Species/Effect
4 h/rat/LC60°2 wk-7 yr/human/NOAELc
10 min/human/TCyypulmonarychanges6
10 min/human/TCLo/pulmonarychanges"
10 min/mouse/LC50e
2 wk-7 yr/human/NOAELc
4 h/rat/LC50e
4 h/guinea pig/LC60e
2 wk-7 yr/human/NOAELc
1 h/rat, mouse, guinea pig/LCLOe
4 h/rat/LCy/2 wk-7 yr/human/NOAELc
1 h/human/TCLQ/resp changese
All durations - units are mg/m3 e
6 h/guinea pig/LC^Q8
6 h/rat, rabbi</TCLO/reprode
1 h/mouse/LCLOe
1 h/rat/LC50e
All durations0
2 h/mouse/LCsoe
2 wk-7 yr/human/NOAELc
2 wk-7 yr/human/NOAELc
2 wk-7 yr/human/NOAELg
2 wk-7 yr/human/NOAELc
2 wk-7 yr/human/NOAELc
2 wk-7 yr/human/NOAELc
5 min/human/LCLOe
15 min/human/TLV-STEL"2 wk-7 yr/human/NOAELc
Inhalation
RfD(mg/kg/d)
5.7E-03
8.6E-05
8.6E-03
8.6E-01
NA
NA
1.1E-012.6E-022.9E-012.0E+008.6E+00
2.0E-03
5.7E-02
15 min
3.50.680.41
0.41
0.303.7E-02
0.130.20
2^20.020
641202.4
0.0700.045
11.00.010
1.00.07
0.03718
2.131
210665.6
0.291.670.27
9.7
PAEC (ppm)
30 min
2.50.340.21
0.21
0.151.8E-02
0.090.14
1.10.014
45601.7
0.0700.032
7.80.007
0.70.07
0.0269.01.016
106332.8
0.140.830.144.8
60 min
1.7
0.170.10
0.10
0.079.2E-03
0.060.100.54
0.01032301.2
0.0700.022
5.50.005
0.50.07
0.0184.5
0.527.853
166.4
0.0720.42
0.0702.4
ERPG-lb
(ppm)60 min
0.32 mg/m3
2 mg/m3
5 mg/m3
See footnotes on next page.

TABLE 5 (Cont.)
a The data preference hierarchy and linear versus exponential scaling are detailed in text. For chemicals with RfC values available, inhalation RfD calculated as RfC x 20 m3/d•=• 70 kg. PAEC concentrations in ppm calculated as (RflD x BW x AT x 24.5)/(IR x MW x ED), where: RfD = inhalation RfD calculated from RfC (mg/kg/d); BW = body weightfor 6-year-old child, 21 kg (EPA 1989a); AT = averaging time - 14 days for subchronic exposures; 24.5 = factor for converting to ppm; IR = inhalation rate for 6-yr-old child,0.033 m3/min (EPA 1989a); MW = molecular weight; ED = exposure duration - 15, 30, or 60 min. For chemicals with no RfC value available, linear scaled PAEC = (ToxicityValue x EETVED x UF ; exponential scaled PAEC = {[(Toxicity Value)2 x EETJ/EDl'^AJF. The toxicity value was scaled linearly or exponentially to result in lowest PAECvalue. UFs: for human TCL0, 10; mammalian TCL0 , 100; human LCL0 , 100; LC60 or mammalian LCL0, 1,000. Values rounded to two significant figures. To convert toxicityvalues to ppm, multiply the concentration (mg/m3) by 24.5 and divide by the molecular weight.
b ERPG-1: Emergency Response Planning Guideline-1 (IAHA 1988-1992).
c Data obtained from the EPA (1993a or 1993b).
'' Indicates that chronic RfC was adopted as subchronic RfC; value may be conservative.
e Data obtained from NIOSH (1992).
f Power function used to scale 15 min estimated NAE dose; linear function used for 1 h NAE dose.
g Data obtained from Dollarhide (1992).
h Human LCL 0 data for methyl bromide from RTECS and Sax did not match (1 g/m3 vs 1 mg/m3) — reference not obtainable; therefore, LC50 data used.
' Value for nitrogen dioxide used for cyclohexyl isocyanate and nitrosyl chloride; emit toxic fumes of NOX when heated to decomposition (Sax and Lewis 1992).
' HEAST states that portal-of-entry effects for sulfuric acid make it inappropriate to convert to mg/d; Carson et al. (1981) as cited in HEAST (EPA 1993a) give 0.07 mg/m3 as an"acceptable" concentration for sulfuric acid.
k Value for sulfuric acid used for thiophosgene; emits toxic fumes of SOX when heated to decomposition (Sax and Lewis 1992).
Value for chlorine used for trimethylacetyl chloride; emits Cl~ when heated to decomposition.
m No TCL0 , LC50, or LCL 0 data available for tungsten hexafluoride; used 15-min STEL value (10 mg W/m3) divided by 3, converted to ppm.
n Data obtained from Sax and Lewis (1992).
Abbreviations: CAS = Chemical Abstracts Service, EET = experimental exposure time, ED = exposure duration, HEAST = Health Effects Assessment Summary Tables, IRIS =Integrated Risk Information System, NOAEL = no observed adverse effect level, RfC = reference concentration, RfD = reference dose, RTECS = Registry of Toxicity Effects ofChemical Substances, UF = uncertainty factor.

21
for up to 1 hr would not result in any but mild, transient adverse health effects" (AIHA1988-1992). These values are available for only about 10 of the substances for which PAECvalues were derived; they are best compared with the 60-min PAEC values. Generally,ERPG-1 values are higher than the PAEC values, which suggests that the PAECs will notunderestimate risks.
3.1.3 Increased Cancer Risk Concentration Values
Hazardous chemical waste transported from DOE facilities may also be evaluatedfor possible increased cancer risk in exposed individuals. Values were developed to estimatethe air concentrations of carcinogenic HW components above which exposed persons have anincreased carcinogenic risk of one in one million (10 ) or higher (increased cancer riskconcentration [ICRC]). The 10"6 risk level was selected to represent the level below whichincreased risk is considered negligible. However, regulatory programs generally specify 10to 10"6 as an acceptable risk range (EPA 1990a, 1990b). For chemicals showing greater than10 risks, it would be informative to supplement results with risks (e.g., number of peopleaffected) at the 10"4 level.
For this assessment, an ICRC value was derived for each gaseous or liquid substancetransported by DOE HW, TRUW and LLMW generators in FY 1992 that meets the followingcriteria: (1) the substance is classified as a known, probable, or possible human carcinogen(EPA 1993a, 1993b); (2) the substance has an inhalation unit-risk value available from theEPA; and (3) the substance is volatile enough that there is a significant potential for exposureof the general public. Several inorganic and organic substances were not evaluated becausethey are solids under ambient conditions or because the potential to volatilize is minimal(e.g., polychlorinated biphenyls, lindane, arsenic, beryllium, cadmium). Only four transportedsubstances classified as carcinogenic did not have inhalation unit-risk values available fromIRIS or HEAST. Should inhalation unit-risk values become available for these substances,ICRC values will be derived.
The method used to generate ICRC values is that recommended by the NationalResearch Council (1986,1993). Because estimating increased cancer risk for exposure periodsof less than 1 hour is uncertain, ICRC values were generated only for assumed exposureduration of 1 hour. Exposures were averaged over a 70-year lifetime. In calculating risksfor individual accidents, it was assumed that the entire population residing within the ICRCarea at risk would experience an increased cancer risk of 10 or greater. The followingequation was used to estimate the ICRC value:
ICRC - R*ATx 24.5UR xETx MW

22
where
ICRC = increased carcinogenic risk concentration (ppm);
R = assumed risk level (10~6);
AT = averaging time (70 yr x 365 d/yr x 24 h/d);
UR = chemical-specific unit risk [(mg/m3)"1];
ET = exposure time (1 h);
MW = molecular weight of substance; and
2£A = unit conversion factor (mg/m3 to ppm).WMW
ICRC values derived for the HW and LLMW risk calculations are given in Table 6.
3.2 POTENTIAL ADDITIVE EFFECTS OF MULTICHEMICAL EXPOSURES
In many of the shipment accidents assessed, several chemicals are being transportedin the same shipment. Therefore, it is possible for a number of chemicals to be released tothe atmosphere simultaneously, either if several chemicals are contained in a single breachedcontainer or if several containers are breached. The possibility for inhalation of multiplechemicals by an individual downwind of the release must therefore be addressed. Toaccomplish this, the ALOHA™ code was first run separately for each chemical in a shipmentto determine the individual plume footprints at the PLC, PAEC, or ICRC values. By usingan iteration method, the "composite" plume footprint for all chemicals evaluated in a singleshipment was determined such that the following relationship was reached:
where
Ct = concentration at "composite" plume footprint for the ith chemical ofconcern; and
Tt = toxicity value (i.e., PLC, PAEC, or ICRC value)
Use of this method leads to a larger area of influence of the mixture than any one of itschemical components.

23
TABLE 6 Increased Carcinogenic Risk Concentration Values for HW ChemicalsTransported by DOEa
Chemical Name
1,1-Dichloroethylene1,1,2-Trichloroethane1,1,2,2-Tetrachloroethane1,2-Dibromoethane1,2-Dichloroethane1,3-ButadieneAcrylamideAcrylonitrileAldrinBenzeneBerylliumBromoformCarbon tetrachlorideChloroformChloromethanef
DichloromethaneEpichlorohydrinEthylene oxideFormaldehydeHeptachlorHexachloroethaneHydrazine/Hydrazine sulfateiV-NitrosodimethylaminePropylene oxideTetrachloroetheneg
Trichloroethene8
Vinyl chloridef
CAS No.
75-35-479-00-579-34-5106-93-4107-06-2106-99-079-06-1107-13-1309-00-271-43-27440-41-775-25-256-23-567-66-374-87-375-09-2106-89-875-21-850-00-076-44-867-72-1302-01-262-75-975-56-9127-18-479-01-675-01-4
Mole-
cularWeight
9713316818899547153
36578
92531541195085934430
373237
327458
16613163
CarcinogenClass5
CCC
B2B2B2B2BlB2AB2B2B2B2C
B2B2BlBlB2C
B2B2B2
C-B2C-B2
A
Inhalation
Unit Risk(ug/m3)"1
5.0E-051.6E-055.8E-052.2E-042.6E-052.8E-041.3E-036.8E-054.9E-038.3E-062.4E-031.1E-061.5E-052.3E-051.8E-064.7E-071.2E-061.0E-041.3E-051.3E-034.0E-064.9E-031.4E-023.7E-065.8E-071.7E-068.4E-05
VSDC
(mg/m3)
2.0E-056.3E-051.7E-054.5E-063.8E-053.6E-067.7E-071.5E-052.0E-071.2E-044.2E-079.1E-046.7E-054.3E-055.6E-042.1E-038.3E-04l.OE-057.7E-057.7E-072.5E-042.0E-077.1E-082.7E-041.7E-035.9E-041.2E-05
ICRC (60 min)
mg/m 3 d
1.2E+013.8E+011.1E+012.8E+002.4E+012.2E+004.7E-019.0E+001.3E-017.4E+012.6E-015.6E+024.1E+012.7E+013.4E+021.3E+035.1E+026.1E+004.7E+014.7E-011.5E+021.3E-014.4E-021.7E+021.1E+033.6E+027.3E+00
ppme
3.17.01.5
0.365.8
0.990.16
4.20.0084
230.70
546.55.51603801303.438
0.03116
0.0960.015
70160672.9
a ICRC values correspond to concentrations above which exposed persons have an increased carcinogenic risk of 1 in onemillion (10'6) or higher. Methods for deriving ICRC values detailed in text. Unit-risk values obtained from the EPA(1993b) unless otherwise noted. Values rounded to two significant figures.
b Carcinogens are grouped as follows: Group A-human carcinogen; Group Bl-probable human carcinogen, limited evidencein humans; Group B2-probable human carcinogen, sufficient evidence in animals and inadequate evidence in humans; andGroup C-possible human carcinogen.
c VSD = virtually safe dose = 10'6/(inhalation unit risk x 1,000 ug/mg).
d ICRC = VSD x 24 h/d x 365 d/yr x 70 yr (NRC 1986, 1993).
e ICRC (ppm) = ICRC (mg/m3) x 24.5/molecular weight.
f Data from the EPA (1993a).
s Data from the Superfund Health Risk Technical Support Center (Dollarhide 1992).
3.3 TRANSPORTATION RISK ASSESSMENT METHODSFOR MAXIMALLY EXPOSED INDIVTOUALS
In the WM PEIS (DOE 1996), Section E.17.3 of Appendix E describes the cargo-related accident transportation risks for the maximally exposed individual (MEI) in thegeneral public. The cargo-related risk is the risk associated with inhalation of accidentallyreleased chemicals. This subsection provides supporting information on methods used todescribe risk for the MEI for the potentially life-threatening, any adverse effects, andincreased carcinogenic risk end points.

24
The evaluation of MEIs is intended to address the question of what maximumexposure levels could be and whether health effects would be associated with those levels.To evaluate the MEI for each health end point, the primary factors considered were acombination of chemical potency, quantity released, and dispersion, as reflected by theexposed areas output from the ALOHA™ model. Although many shipments of each chemicalmay be included in the database for each end point, only the HW, TRUW, and LLMWshipments resulting in the largest exposed areas for each chemical were evaluated for theMEI. For each health end point, the MEI was assumed to be located 30 m (98 ft) from therelease point (i.e., the assumed closest distance of a residence from the middle of theroadway).
3.3.1 Potentially Life-Threatening Effects for the MEI
For potentially life-threatening effects, the health end point is so severe(i.e., lethality) that the traditional estimation of exposure to the MEI is not useful. Therefore,for this end point, hazard zones were calculated to indicate the distance from the releasepoint to which a potentially life-threatening chemical plume might extend. For each poisoninhalation hazard (PIH) chemical in the database, the shipment resulting in the largestexposed area was identified by modeling with ALOHA™. The hazard zones for these worst-case shipments are reported in Appendix E to the WM PEIS (DOE 1996). The PIH chemicalsthat were shipped in small quantities and for which spills would not result in a potentiallylethal plume were not evaluated.
3.3.2 Any Adverse Effects for the MEI
The ALOHA™ code was used to estimate the chemical concentration and durationof exposure for the MEI with respect to the any adverse effects end point. The PIHchemicals were not included in the exposure assessment for the MEI because the appropriateend point for PIH chemicals is potential lethality (Section 3.3.1).
The exposure duration and chemical concentration in air during the exposureduration, as given by the ALOHA™ code, were used to estimate a chemical-specific intakevalue for the MEI receptor. To emulate a reasonable upperbound exposure scenario for anyadverse effects, the MEI receptor was assumed to be a child engaged in moderately strenuousoutdoor activity. Calculated intake values were compared with EPA reference dose values,by generating a hazard quotient (HQ) (i.e., intake/reference dose) for each chemical. An HQgreater than 1 indicates that an adverse effect for the MEI is likely.
Intakes were calculated with the following standard risk equation (EPA 1989b):
CA x IR x ET x EF x ED (8)/ =
BW xAT

25
where
/ = chemical-specific average daily intake (mg/kg/day);
CA = chemical concentration in air (mg/m ), as obtained from ALOHA™modeling;
IR = inhalation rate for a 6-year-old child, moderate activity (0.033 m3/min [EPA 1989a]);
ET = exposure time (min/day), as obtained from ALOHA™ modeling;
EF = exposure frequency (1 day/year);
ED = exposure duration (1 year);
BW = body weight for a 6-year-old child (21 kg [EPA 1989a]); and
AT = averaging time, 14 days/year x 1 year.
The use of a 14-day averaging time was a departure from the standard 365-dayaveraging time recommended in EPA guidance (EPA 1989b). A 14-day averaging time is aconservative assumption because it results in a calculated intake approximately 25 timesgreater than that obtained when 365 days is assumed. However, the 365-day averaging timeis generally used in evaluating longer-term, low-level exposures, and was not considered validfor assessing the risks of one-time, higher-level exposures. A 14-day averaging time wasselected because that is the lowest exposure duration to which subchronic RfD values areapplicable (EPA 1989b).
The hazard quotients were then derived by dividing intakes by the chemical-specificsubchronic reference doses obtained from the EPA (1993a). For chemicals with no subchronicreference doses available, chronic reference doses were used (EPA 1993b), which would likelyoverestimate the hazard quotients by about a factor of 10. The level of concern associatedwith exposure does not increase linearly as HQ values exceed 1. In other words, HQ valuesdo not represent a probability or a percentage. One may conclude that as the HQ valueabove 1 increases, there is greater concern about potential adverse effects. However, it isincorrect to assume that an HQ value of 10 indicates that adverse health effects are 10 timesmore likely to occur than for an HQ value of 1.
3.3.3 Increased Carcinogenic Risk for the MEI
Risks to the MEI were calculated for the carcinogens of greatest concern, on the basisof potency, quantity released, and dispersivity, as reflected by exposed areas output from theALOHA™ model. All carcinogens ranked as class A (known human carcinogens) wereincluded in the MEI evaluation.

26
Similar to the MEI evaluation for the any adverse effects end point, carcinogenic riskwas estimated by calculating the average daily intake and multiplying that intake by thechemical-specific EPA-derived slope factor value. For carcinogens, it is appropriate toestimate daily intake averaged over a lifetime (EPA 1989b), so the MEI receptor evaluatedwas an adult. The following equation was used to calculate average daily intake:
j _ CA x IR x ET x EF x ED ^BW xAT
where
I = chemical-specific average daily intake (mg/kg/d);
CA = chemical concentration in air (mg/m3), as obtained from ALOHA™modeling;
IR = inhalation rate for an adult, moderate activity (0.014 m3/min[EPA 1989a]);
ET = exposure time (min/day), as obtained from ALOHA™ modeling;
EF = exposure frequency, 1 d/yr;
ED = exposure duration, 1 yr;
BW = body weight for an adult (70 kg [EPA 1989a]); and
AT = averaging time (365 d/yr x 70 yr).
Increased lifetime carcinogenic risks were then derived by multiplying the averagedaily intake by the chemical-specific slope factor value. Risks can be compared with a riskrange of 10'4 to 10"6 generally considered acceptable for increased carcinogenic risk associatedwith hazardous waste sites. Increased lifetime carcinogenic risks of 10"4 are often used asthe departure point for levels of concern when evaluating risks from short-term, accidentalexposures (National Research Council 1993).

27
4 SUPPLEMENTAL INFORMATION ON UNCERTAINTY ANALYSISAND DETERMINISTIC APPROACH
The purpose of including the results presented in this section is to place into betterperspective the risk numbers obtained in the HW transportation risk appendix, which are thesame risk numbers repeated in the WM PEIS main text. The deterministic modeling resultsreferred to are presented in Appendix E for the HW transportation risk calculations. Thosecalculations analyzed the risk from the HW shipments assuming unchanging (butrepresentative) meteorological conditions during all shipments, assuming a fixed accidentscenario (all accidents are of the same severity and occur the same way), and withoutrecognizing any time of day or seasonal bias.
The modeling work presented here, which uses Monte Carlo techniques, focuses onthe baseline case for HW in which 63 shipments (i.e., those leading to nonzero risk in theAppendix E deterministic modeling) were studied in detail. It is recognized that there areuncertainties, that is, probability distributions for key input variables, such as the following:
• Meteorological conditions during the time of the postulated accident,
• Release rates for small drums, large drums, and cylinders — withdifferent probability distributions of release amounts for eachtransportation container,
• Time of day of the accident (affecting meteorological conditions), and
• Month of year affecting the relative accident probabilities.
Although these four variables involve key parameters in the risk assessment, they are notthe only ones. Other items of uncertainty include the health criteria values used, theuncertainty due to accuracy of the consequence model used, and uncertainty in that thedatabase used for identifying accidents represents all the chemicals. An attempt will bemade to include those latter uncertainties into a broader uncertainty analysis in the futureby using Monte Carlo techniques. At this time, however, we restrict our uncertainty studyto the variables (a) through (d) listed above and seek to determine the probability distributionof risk due to those four items. This evaluation has led to very interesting supplementaryresults (to the deterministic findings), even though the Monte Carlo analysis is not allencompassing.
The Monte Carlo analysis has included not only probability distributions for anumber of the key variables but also a few proposed improvements to the methodology thatis under consideration for the deterministic treatment. Notable among those changes inapproach is the recognition that accidents with a truck would likely involve spills of differentchemicals within the same or other DOE drums on the truck. The health effects of inhalinga mixture of vapors from different chemicals were included in the Monte Carlo analysis. Inaddition, a truck with three DOE chemicals was assumed in the Monte Carlo analysis to lead

28
to a proportionate amount of release of each of the chemicals, with the total release amountobtained from a probability distribution based on data from DOT's HMIRS database.
The details of the Monte Carlo method are beyond the scope of this discussion. Thefour variables listed above have been set up with probability distributions based on availabledata. Previous hazardous material accidents were used to develop probability distributionsfor (a), (c), and (d) variables listed above. For the meteorological data variation, data from61 cities in the continental United States were used in a database so that an accident on aparticular road segment could use the meteorological data from the nearest of the 61 NationalWeather Service sites.
Figure 1 depicts the components of the Monte Carlo uncertainty analysis. Theresults of the Monte Carlo modeling of the risk from this no-action scenario that use thehealth end point of "potentially life-threatening health effects" are presented in Figures 1 and2. The key findings from that work are briefly summarized as follows.
Figures 2 and 3 show that the cumulative probability distribution of risk (Figure 2)is extremely skewed because there is only slightly greater than a 1% probability of anypotentially life-threatening effects occurring in the 20-year period. The large percentage ofzero-effect cases results from the about 93% probability of no releases in the 20-year periodcoupled with the fact that most releases (especially liquids) lead to zero impacts outside ofthe 30.5-m (100-ft) range. The curve in Figure 3 would dip down to about 93% (for anabscissa value of 0) if impacts within 30.5 m (100 ft) of the road were included in thecalculations. Within the remaining 1% probability (99-100% on the cumulative probability;Figure 2), there is a tremendous range of possible effects covering many orders of magnitudein the number of people affected. For example, in considering Figure 2 we see the effectsfrom accidents in which more than 0.01, 1, 100, and 1,000 people who are affected areconfined to above the 99.57, 99.93, 99.999, and 99.99995 percentiles, respectively. Thesecumulative probabilities indicate that for the actual probabilities that at most 0.01, 1, 100,and 1,000 people are affected in 20 years are about 1 in 250; 1 in 1,500; 1 in 100,000; and 1in 2,000,000, respectively. High numbers of people with life-threatening effects were possiblein very few shipments. For example, only three shipments were capable of affecting 1,000or more people in a single accident. Likewise, only 14 shipments were capable of affecting100 or more people in a single accident. Eliminating shipments within these groups woulddramatically reduce the mean number of affected people and, of course, eliminate theprobabilities of catastrophic accidents occurring.
An additional observation concerning the highly skewed nature of the cumulativeprobability distribution (especially the large percentage of zero-effect cases) is that the meanof 0.0078 people with potentially life-threatening effects lies above the 99.5 percentile. Thetrue skewness of the distribution is apparent here because for a nonskewed distribution(e.g., a Gaussian), the mean is on the 50th percentile. Obviously, the 50th percentile of our

External Parameters
Shipment contents —
Route
Preprocessedmeteorological
database
Chemicalpropertydatabase
Tpxicologicallimits
random random
Begin routeIncrementlocation
Yes
Pavementtemperature
profile
Local meteorology •
LiquidHasn evaporation
amount >ate
No
1random- P(Time) P(spill %)
random
Meteorologicaldata processor
Poolsize
random
Day of year, AmountHour released
P(Coverage area)m2/gallon
Populationdensity
Dispersionmodel
Affectedarea
Number ofaffectedpersons
Record andinitiate newshipment
FIGURE 1 Flowchart Illustrating the Operating Procedures of the Monte Carlo Risk Assessment Model(Decision processes and model components that are stochastically treated are marked as having random inputs.For a typical shipment, this process is continued until approximately 100,000 chemical releases are recorded.)

0.988
0.986
1.0E-04 I.0E-03 1.0E-02 1.0E-01 1.0E+00 1.0E+01
Number of people with potentially life-threatening health effects
1.0E+02 1.0E+03
FIGURE 2 Results of Monte Carlo Modeling for the No-Action Alternative — Probability that the Numberof People with Potentially Life-Threatening Effects Will Be Greater than N

1.40E-02o>
I1 1.20E-02
o . 1.00E-02
8.0OE-03 -
6.00E-03 -
4.00E-03 -
I " 2.00E-03
O.OOE+00
0.0001 0.001 0.01 0.1 1 10 100
Number of people with potentially life-threatening health effects (N).
1000
FIGURE 3 Results of Monte Carlo Modeling for the No-Action Alternative — Cumulative Probability of Peoplewith Potentially Life-Threatening Health Effects

32
distribution is 0, as are all percentiles lower than 98.8. This leads to difficulties whencomparing the cumulative probability distribution to the result of the deterministic analysis.The deterministic method provided a mean of 0.15 people with potentially life-threateningeffects, which lies on the 99.5 percentile. This seems extremely conservative; however, themean of the distribution itself lies on the 99.5 percentile. From this, all we can say about thedifference between the probabilistic method and the deterministic method is that the meanvalues are a factor of 19 apart.

33
5 ON-SITE RISKS
This section evaluates on-site HW transportation risk at DOE sites for the variousalternatives. It has been shown that HW transportation risk is directly related to thenumber of miles traveled by the waste to the final destination. Because the number of milestraveled for on-site HW shipments is much less than for off-site movement of waste, it isexpected that the on-site transportation risk would be less than the off-site risk. However,this assumption is not always correct because some DOE sites are large and the transportdistances within their boundaries are very long; moreover, some of the on-site routes are nearto worker populations, which increases the overall uncertainty of associated risks. On-siteanalyses were not conducted for TRUW and LLMW, because the low risks estimated for off-site transportation indicated that risks from on-site transportation would be negligible.
This section presents the on-site risk assessment for a representative DOE site andcompares the results of this analysis to those of off-site transportation risks for the same site.A representative site, rather than all 10 of the major sites, was chosen for the on-siteanalysis, because the total on-site risks are significantly smaller than the total off-site risks(transportation risk is directly proportional to distance traveled).
5.1 REPRESENTATIVE DOE SITE FOR RISK ASSESSMENT
The Hanford Site (Hanford) was chosen for the on-site HW transportation riskassessment because it was considered typical of large DOE sites. Although Hanford may notbe representative of all large DOE HW generators, particularly the Kansas City Plant (whichis small in area), it can serve as a surrogate for most large DOE sites that generate and shipHW. Like other large DOE sites, Hanford is expansive and is not located near largepopulation centers. It has a well-developed system of roads and is easily accessed by aregional transportation network. Figure 4 shows the major work areas, principal highwaysand roads, and the Washington Public Power Supply System (WPPSS) station of Hanford.The HW storage facility, designated as Building 616, is located between the 200 West and
200 East Areas. The on-site analysis is necessary to assess the risk from HW shipments topeople who work at Hanford and commute between its work areas. Westinghouse Hanfordalso operates work areas located outside the site. These include the 700 Area, located in thecity of Richland south of the 1100 Area, and the 3000 Area, located on Stevens Driveimmediately east of the 1100 Area (Figure 4). Because of their off-site location, small size,and contribution to risk, these sites are not included in this study.
Although the WM PEIS will consider four alternatives, only current conditions (noaction and decentralized alternatives) and the regionalized-1 alternative will be examinedin this study. Under the regionalized-1 alternative, the construction of an incinerator atHanford would take place to thermally treat HW from Hanford and Lawrence LivermoreNational Laboratory (LLNL). Consequently, the volume of HW transported on-site would

34
100 B&C Area / 200 North
Area
WashingtonPublic Power
Supply System
t0 t 2 3
Miles
FIGURE 4 Boundaries, Work Areas, and Principal Highways and Roadsat the Hanford Site

35
increase under this alternative. Under the regionalized-2 alternative and current program,volumes of HW transported on-site at Hanford would be the same because the difference inthe alternatives occurs off-site.
According to DOT regulations specified in 49 CFR Parts 173, 178, and 179,EPA-designated HW and state-designated dangerous waste (DW) must be packaged beforeshipment. Furthermore, the EPA and the Washington Department of Ecology regulationsmust be met. A Hazardous Waste Disposal Approval Record (HWDAR) is a compliancedocument that is filed for each waste shipment. The HWDAR contains specific instructionsfor packaging and labeling Hanford's HW (Westinghouse Hanford Company 1993).
The on-site population of Hanford is limited to work areas, facilities(i.e., Building 616 — the HW storage facility), barricades, and the WPPSS station. Membersof the public who use those portions of public highways located within Hanford boundarieswere not included in this assessment because of relatively low use rates and the assumptionthat many were workers who use the highways to get to work, where they would already beunder consideration for exposure. Table 7 contains population, population density, and landarea for all on-site work areas and major facilities.
Generally, all packages, liners, and HW must be compatible. Liquid wastes mustbe shipped in bung-type drums that are inspected before and after filling. Small amountsof compatible HW and DW are shipped as labpacks. Labpacks must contain wastes of thesame DOT hazard class and must be transported by highway only (Westinghouse HanfordCompany 1993). Except for certain sublethal liquid wastes (solvents, kerosene, methylisobutyl ketone) that are transported in bulk via tanker trucks, most of Hanford's HW isshipped in 55-gal steel drums. A small portion of HW is transported in plastic and fibercylinders.
5.2 ROUTING ANALYSIS
The Hanford Site is served by a rail line owned and operated by DOE and a networkof highways that connect it to regional transportation nodes and population centers.Currently, HW is shipped by truck transport only. HW may be shipped by rail in the future,but no decision concerning rail transport has been made or is expected before early 1995.Consequently, this study will assess the risks associated with truck transport of HW only.
Approximately 290 mi of paved highways and roads are located within the confinesof Hanford. Of this total, nearly 65 mi are open to the public (Daling et al. 1991). Figure 4depicts Hanford's principal highways, roads, and work areas. State Highway 24 intersectswith State Route 43 north of the Columbia River and runs east to west through the northernportion of Hanford. State Highway 240 runs from State Highway 24 in the western portionof Hanford and continues in a southeasterly direction before terminating in Richland westof the 1100 Area. These two routes form the major perimeter highways at Hanford, andneither runs through any of the site's work areas. Both routes are public access roads. Other

36
TABLE 7 Population and Area Data for Work Areasat the Hanford Site
Work Area
100 B & C100 D & DR100 H100 F100 K100 N200 West200 East300400600c
1100WPPSS
AreaPopulation8
4443
143397
2,0083,0963,253
728547827
1,744
Land Area(mi2)
0.660.580.27
NAb
0.350.393.673.470.580.81
NANA
1.7
PopulationDensity
(people/mi2)
6.06.8
14.8NA408.5
1,018.0547.1892.2
5,608.6898.7NANA
1,025.8
Blowers (1994); Data for Washington Public Power SupplySystem (WPPSS) provided by Sommer (1994).
NA = not applicable.
The 600 Area represents Building 616 and all facilitieson-site that are not included in the above areas.
public access routes include Route 10, from the Wye barricade to State Highway 240, and asegment of Route 4 South, from the Wye barricade through the 1100 Area (where itsdesignation becomes Stevens Drive) and into Richland city. Hanford's highways arecategorized as rural monitor arterial (Daling et al. 1991). All incoming and outgoingmaterials are processed through the 1100 Area.
The on-site transport of HW at Hanford is limited to the main arteries, particularlyRoutes 1, 3, and 4, that access the points of HW generation and the HW storage facility(Building 616). HW is generated and shipped from the 100 N, 100 KW & KE, 200 East andWest, 300, and 400 Areas. Occasionally, HW from the 100 Areas is generated and shippedto Building 616 or directly off-site. Such HW is usually associated with remedial activitiesand consists of small quantities. The 200 Areas account for approximately 90% of all HWgenerated by Westinghouse Hanford. Almost all of the HW generated in the 300 Area(managed by Pacific National Laboratory) is shipped directly off-site via the lower reachesof Route 4. Therefore, Route 3, which runs between the 200 Areas and past the HW storagefacility, and both the north and south segments of Route 4 carry almost 100% of all HWtransported on-site. All HW is processed through the 1100 area before it leaves Hanford.Figures 5 and 6 illustrate on-site transport routes for HW generated in the 100 and200 Areas.

37
N
= HW shipped directly (bulk) off-site from 100 N Area< » • " " ' • » = HW shipped from 100 N Area to HW Storage Facility (BIdg 616)» i« n •> = HW shipped directly (bulk) off-site from 100 K Area« - , — . . — = HW shipped from 100 K Area to HW Storage Faciiity
= HW shipped off-site from HW Storage Facility
FIGURE 5 Hazardous Waste Routes at 100K and 100N Areas — Hanford Site

38
= HW shipped off-site from HW Storage Facility (Bldg 616)= HW generated in 200 East Area and shipped to HW Storage Facility= HW generated in 200 East Area and shipped directly off-site= HW generated in 200 West Area and shipped to HW Storage Facility= HW generated in 200 West Area and shipped directly off-site
FIGURE 6 Hazardous Waste Routes at 200 Areas — Hanford Site

39
Under the regionalized-1 alternative described in the WM PEIS, the HW transportroutes would be virtually the same as those described under existing conditions. Theincinerator would be located on Route 3, between the 200 West Area and the HW storagefacility. HW from LLNL would be shipped to the incinerator from the 1100 Area via Routes4 and 3. After incineration, any residual HW would be shipped off-site along the same routesdescribed for current conditions.
5.3 ON-SITE TRANSPORTATION RISK ASSESSMENT METHOD
General assumptions on health risk assessments for on-site transportation are closelyrelated to those for off-site transportation, so the same methodology was used wheneverpossible. In general, the assessment for HW includes vehicle-related (independent of thechemical nature of a cargo) and cargo-related impacts, under both routine and accidenttransport conditions.
Vehicle-related impacts under routine condition are the result of exposure to vehicleexhaust emissions; risks are primarily associated with exposure in an urban environment.Because the routes used for HW transport at Hanford are located in a rural environment,vehicle-related impacts under routine condition are minimal. Compared with mileagetraveled off-site, on-site transportation is limited to much shorter distances within theinstallation itself (i.e., among facilities, work areas, and/or site boundaries). Vehicle-relatedimpacts under accident transport conditions, such as injuries or fatalities due to vehiclecollisions, are expected to be insignificant.
Containers used for shipment of HW are approved under the Resource Conservationand Recovery Act and have been assumed to preclude any significant exposure to workersor the general public resulting from potential seepage during routine HW transport. Nocargo-related impacts exist associated with transport of HW under routine conditions.Accordingly, health risk assessment for HW is limited to the cargo-related impacts occurringonly under accident transport conditions. The primary pathway of concern is inhalationassociated with a chemical release of a toxic vapor or gas of HW into the atmosphere. Directexposure to HW other than through the inhalation pathway, such as ingestion or dermalcontact, is possible. However, these pathways are expected to result in much lower exposurethan the inhalation pathway.
Both population risks and risks to the maximally exposed individual (MEI) have beenevaluated for on-site transportation. Potential receptors identified for population risks areworkers adjacent to the transport route and the general public in the vicinity of a gate. Thegeneral public is included in the impact assessment because of potential accidents on publicaccess roads within the Hanford site or along on-site routes near the 1100 Area that couldaffect nearby residents. Potential MEIs are on-site workers at individual facilities or guardsat checkpoints along the route. Human health risk end points addressed in this assessmentinclude the potential for life-threatening effects, carcinogenic effects, and nonlethal effects.

40
5.4 ASSUMPTIONS AND IN/OUT PARAMETERS
Total risk for all chemicals being shipped along all on-site transportation routes wascalculated employing Equation 1. The probabilities of a chemical release in an accident aregiven by cargo type and chemical state (i.e., gas, liquid, solid) in Section 2.
Under accident conditions with a chemical release, exposure to HW results from therelease and dispersion of HW into the atmosphere. The ALOHA™ computer software(version 5.1; Reynolds 1992) developed by the EPA and the National Oceanic andAtmospheric Administration (NOAA) is used to estimate the release and dispersion of HWin this assessment. The health impacts of the exposure concentrations were developed byvarious agencies for emergency planning and health risk assessment (National ResearchCouncil 1993; DOT 1993b; Maloney 1990; EPA et al. 1987; EPA 1986).
The ALOHA™ model is able to handle frequently encountered accidental sourcereleases from direct sources (with known release information), tanks, pipes, and puddles.The model has a built-in source-term algorithm that is used to compute the rate, quantity,and type of atmospheric release of a hazardous air pollutant. To aid in computing releaserates and trajectories, the model has a chemical database library containing physical andchemical properties for approximately 700 pure chemical substances. Its dispersion algorithmsimulates continuous and intermittent releases of passive nonbuoyant vapors and heavygases. The atmospheric parameters of interest to ALOHA™ are stability class, inversionheight, wind speed, wind direction, ambient temperature, ground roughness, cloudiness, andhumidity. Atmospheric data can be entered into the ALOHA™ model by user input or byreal-time weather data fed directly to the model from a Station for AtmosphericMeasurements (SAM). Also, the model simulates dispersion in both rural and urbanatmospheres and calculates time-dependent concentration and hazard distances for specifiedchemical concentrations in air. The ALOHA™ model calculates maximum distance and afootprint (a plan view of the area) in which the concentration exceeds a specified LOC. Thefootprint is used to estimate the consequences of population exposure along the on-site route.Input parameters used for the ALOHA™ model runs for this analysis are listed in Table 8.
In general, the shapes of footprints from the ALOHA™ model vary according tochemical substance, container size, released quantity, etc. The ALOHA™ model does notcalculate the maximum width of a footprint. To estimate the affected area from the footprint,the following assumptions were made:
1. All footprints are assumed to be ellipses. The area can be calculated by
S = nAB/4 ,
where
A = length of major axis (maximum downwind distance of thefootprint over the concentration level of concern); and
B = length of minor axis.

41
TABLE 8 Input Parameters Used for ALOHA™ Dispersion Model
Site DataLocationBuilding typeDate and time
Hanford, Washington^Sheltered, single storiedAugust 31, 1994, 1200 hours (noon)
Chemical Data: Case dependent
MeteorologyStability classInversion layerWind speedWind directionAir temperatureGround roughnessCloud coverRelative humidity
Source: Tank
Class DNo4 misSW95°FOpen Country (z0 = 3 cm)Complete Cover50%
Tank Size and Orientation: Shipment dependent (Based on givencontainer type and chemical quantity, select one among containers listedbelow)
ContainerType
Cylinder (small)Cylinder (large)1-ton cylinder1-gal jug55-gal drum470-gal drum800-gal drum1,400-gal drumTanker truck
Diameter(ft)
0.830.832.330.71.854.04.04.05.5
Height(ft)
3.77.16.00.352.735.08.5
14.936.6
Capacity(gal)
1529
1901
55470800
1,4006,500
Orientation
VerticalVertical
HorizontalVerticalVerticalVerticalVerticalVertical
Horizontal
Holediameter
(in.)
0.50.50.870.252.02.02.02.03.0
Chemical State: Chemical and Shipment dependent (Choose "Liquid" ifthe boiling temperature of a chemical is above the ambient temperatureof 95°F, and choose "Unknown" if not - this option lets ALOHA™ decide)
Chemical Storage Temperature: 95°^
Chemical; mass or volume: Shipment dependent (currently, 100% ofchemical mass in a container is assumed to be released).

42
TABLE 8 (Cont.)
Area and Type of LeakCircular OpeningOpening diameter was listed in the previous pageLeak occurs through a HoleTop and Bottom leaking if stored in gaseous and aqueous states in acontainer, respectively
Puddle ParametersDefault ground typeUse Air Temperature for ground temperatureUnknown maximum puddle diameter
Computational Preferences: Let model decide (Gaussian or Heavy Gas)
DisplayUser-specified concentration: chemical dependentFootprint output option: Plot on grid and auto scale to fit windowOutput unit: English
Data input to the model are in italics.
2. The affected area from the point of spill to 30 m (100 ft) downwind, where noresidential areas usually exist, was subtracted by using the integration formulafor the arc of an ellipse in the mathematical table (Beyer 1991).
3. The regression equations for the ratio of the length of minor axis to that of majoraxis were derived from more than 20 ALOHA™ test runs each for Gaussian andHeavy Gas Dispersion.
• Gaussian Dispersion: Ratio B/A = 0.14• Heavy Gas Dispersion: RatioB/A = 7.556/(log10[A in yard])5033 + 0.09
For calculating on-site transportation risk at Hanford, the demographic region isassumed to be rural nonfreeway, which sets Pr(A)* in Equation 1 at 6.8 x 10"7. Populationdensities were estimated along every mile of the routes. For the analysis, population densityestimates were based on 1-mi areas because more than 90% of the plume lengths estimatedfrom the ALOHA™ software are less than 1 mi. Sensitivity analysis indicated that totalrisks based on 1-mi2 areas were more conservative (by 35%) than those based on 2-mi areas.
Under the no-action alternative, most HW generated at Hanford would be shippedto off-site treatment facilities. The same would be true under the decentralized andregionalized-2 alternatives. Detailed on-site transportation routes for each shipment are notavailable, so three routes are identified as being representative of on-site transportation.
On the basis of California accident involvement rates per mile from 1979 to 1983; the probabilitiesof accident per mile are estimated to be 5.6 x 10~7, 6.8 x 10"7, 7.9 x 10~7, and 1.01 x 10~6 for ruralfreeway, rural nonfreeway, suburban freeway, and urban freeway, respectively (Harwood and Russell1990).

43
Center points and the sequential numbers of each 1-mi2 area are also shown in Figure 7.Three routes are assumed to run from the 200 E, 200 W, and 100 N Areas to the gate in the1100 Area via the HW storage facility (Building 616). Population densities along the threeroutes are estimated in Table 9. As shown in Figure 7, each route is dissected into 1-misegments and population densities representative of each mile are estimated based on a 1-mi2
area.
Assuming an accident could take place at any point within a 1-mi segment, 1-miareas are constructed to result in the largest population densities possible. On the basis of1992 hazardous chemical transportation data at Hanford, percentages of route usageassociated with the 200 E, 200 W, and 100 N Areas are assumed to be 45, 45, and 10%,respectively. Total health risks were weighted by multiplying risks estimated along the threeroutes by percentages of route usage. Combining these assumptions, the above equation canbe rewritten to calculate on-site transportation risk at Hanford:
Risk = Y, (2.4 x lQ-14)Pr(R/A)(EA)(WP) , ( n )Chemical
where
(2.4 x 10"14) = the probability of accident per mile (for rural nonhighway)times the conversion factor (ft2 to mi2),
EA = exposed hazard area (mi2), and
WP = weighted population per mile along the on-site routes (i.e.,population density times miles traveled).
For the no-action alternative, the WP value of 9,472 was estimated.
Under the regionalized-1 alternative, two-thirds of the HW generated at Hanfordwould be treated at the on-site incinerator, which would be located near Building 616, andthe rest would be shipped to off-site treatment facilities; also, about two-thirds of the HWgenerated at LLNL would be transported to the incinerator at Hanford for treatment. Inaddition to three routes identified for the no-action alternative, three routes (from mile 28and up in Figure 7 and Table 9) from the 200 E, 200 W, and 100 N Areas to the on-siteincinerator for HW generated at Hanford and one route (from mile 1 to mile 27) from the gateto the incinerator for HW generated at LLNL are included. For health risk calculations dueto HW generated at Hanford and LLNL, the WP values in Equation 11 are estimated to be3,881 and 8,387, respectively. No detailed information (e.g., number of employees, location,site area) on the proposed incinerator facility under the regionalized-1 alternative is currentlyavailable. Thus, population related to the incinerator facility is not included for the analysis.

44
S5gir.-1 POPUJtTES AREAS
0 1 2 3 4 3MLCS
FIGURE 7 One-Mile Segments along Routes of On-Site Transportation —Hanford Site

45
TABLE 9 Population Densities along theThree Representative Routes at Hanford
Milea
1234567891011121314151617181920212223242526272829303132333435363738Total
Route A b
9361,364825
1,0333,253
00000000000000000
360360256000
39385200000000
9,632
Population/mi2
Route B c
9361,364825
1,0333,253
00000000000000000
36036025600
416554000000000
9,357
Route Cd
9361,364825
1,0333,253
00000000000000000
360360256000
3261640000000
3979,274
a See Figure 7 for center point of each 1-misegment.
b 200 East Area - Building 616 - South Gate.c 200 West Area - Building 616 - South Gate.d 100 North Area - Building 616 - South Gate.

46
5.5 CARGO-RELATED ACCIDENT TRANSPORTATION RISKS FOR THEGENERAL PUBLIC AND ON-SITE WORKERS
The potential risks associated with inhalation exposures to chemical releases undercargo-related transportation accidents were quantified. Human health risks to on-siteworkers and the general public for the HW four alternatives and the three health end points(potential life-threatening effects, increased carcinogenic risk, and any adverse effects) areevaluated and presented in Table 10. Also, relative risks compared with the no-actionalternative and with the same alternative for off-site transportation were listed forcomparison. The risks are expressed in terms of number of individuals potentially affectedfor the total shipment duration (20 years).
Volumes of HW transported on-site at Hanford would not increase under the no-action (baseline), decentralized (current program), or regionalized-2 alternatives, so healthrisks under these alternatives would be the same. Under the regionalized-1 alternative,about two-thirds of HW generated at Hanford and two-thirds of HW generated at LLNLwould be transported to the incinerator at Hanford. Total quantities of HW generated atLLNL are larger than those at Hanford, so more shipments would pass the populated regionnear the 1100 Area at Hanford. As a result, health risks for the regionalized-1 alternativewould be relatively higher than those for the no-action alternative, with respect to the endpoints of potential life-threatening effects, increased cancer risk, and any adverse healtheffects. When employees at the proposed incinerator facility area are included, health risksfor the regionalized-1 alternative would be even higher.
Health risks from on-site transportation are generally much smaller (by 1 to 3 ordersof magnitude) compared to those from off-site transportation, because fewer miles areinvolved and a rather sparse population is often near many of the on-site routes. HW from10 DOE installations accounts for approximately 90% of the HW generation in the DOEComplex. In this analysis, Hanford, which was selected as representative of impacts foron-site transportation risks, is one of the largest DOE installations (i.e., longest on-site traveldistances from the gate or boundary to the facility on-site). From Table 10, the ratios ofoff-site risks (all sites) to on-site risks (Hanford only) range from 87 to 2,900. If the on-siterisk at Hanford is indeed representative of the other nine large DOE sites, then the ratio ofoff-site risks (all sites) to on-site risks (all sites) would probably range from about 9 to 290.Clearly, then on-site risks would be much smaller than off-site risks. In summary, potentialhealth risks resulting from on-site transportation would be insignificant compared with thosefrom off-site transportation.
5.6 CARGO-RELATED ACCIDENT TRANSPORTATION RISKS FOR THE MEI
The ALOHA™ model was used to estimate the hazard zones for PIH chemicals. Ahazard zone is the maximum distance from the accident point within which life-threateninghealth effects might take place. Lethality is directly related to exposure to PIH chemicals.

47
TABLE 10 Comparison of Population Health Risks (Number of IndividualsPotentially Affected) for Each HW Alternative for a 20-Year Perioda
Potential Life-Health Effect Threatening Health Concerns for Potential Potential AdverseAlternative Effects Cancer Incidents Health Effects
No-action 1.1E-04 (1.0; l,400)b 7.3E-03 (1.0; 300) 2.7E-02 (1.0; 2,900)Decentralized 1.1E-04 (1.0; 540) 7.3E-03 (1.0; 160) 2.7E-02 (1.0; 1,800)Regionalized-1 1.6E-04 (1.5; 350) 2.7E-02 (3.9; 87) 2.0E-01 (7.5; 430)Regionalized-2 1.1E-04 (1.0; 710) 7.3E-03 (1.0; 290) 2.7E-02 (1.0; 2,200)
a Risks are for the total shipment duration (20 years). To obtain the annual values, dividerisks by 20.
The first value in parentheses is the relative risk compared with the no-action alternativefor on-site transportation. The second value is the relative risk compared with the samealternative for off-site transportation (i.e., off-site risk divided by on-site risk at Hanfordonly).
Lethal PIH chemicals and their hazard zones are presented in Table 11. If an accidentalrelease were to occur, most PIH chemicals could be lethal to on-site workers at facilities orguards at checkpoints who are located in close proximity to the release point. However, onlynickel carbonyl and hydrogen fluoride could be lethal to the general public residing near theroute running through the 1100 Area (Table 11). More than half of the PIH chemicalshipments are made in and out of Hanford in small quantities, so the hazard zones arerestricted to relatively small plumes locates near the release points.
In this analysis, the MEI (on-site worker at facilities or guard at checkpoints) isassumed to be located 15 m (50 ft) away from the release point. An MEI among the generalpublic off-site is not considered because of the longer travel distance of a plume than that foron-site receptors. An MEI was assumed to be an adult with body weight of 70 kg (155 lb) andinhalation rate of 0.014 m3/min (EPA 1989a). The analysis included all shipments to andfrom Hanford.
The potential for adverse health effects was evaluated by using the noncancer HQ,which is defined as an exposure level over a specified time period divided by a reference dose(RfD) derived for a similar exposure period (EPA 1989b). If an HQ exceeds unity, there maybe concern for potential adverse effects. The HQ values do not represent statisticalprobabilities; a ratio of 0.001 does not mean that adverse effects would occur once in onethousand chances. Potential any adverse effect risks are shown in Table 12. Chemicals withHQ values less than or equal to unity are acetonitrile, aniline, dichlorodifluoromethane,ethylene glycol monobutyl ether, mercury, nitrobenzene, and trichlorofluoromethane. TheHQs that have a potential to result in adverse effects for an MEI receptor range from 1.8(methyl ethyl ketone) to 790 (chloroform). In general, uncertainties and conservatism existin using EPA RfD values to evaluate single, short-term exposures. In addition, the ALOHA™

48
TABLE 11 Hazard Zones for Potential Life-Threatening Risks to an MEI
Chemical Name
BromineChlorineDimethyl sulfateHydrogen fluorideNickel carbonylNitric acid, fuming
HazardZonea(m)
34235
10410594
40
Chemical Name
Phenyl isocyanatePhosphorous trichlorideSulfur dioxideSulfuric acid, fumingTitanium tetrachloride
HazardZone (m)
1045121038
a Defined as a maximum distance from the accident point within which life-threatening health effects might take place.
TABLE 12 Potential Any Adverse Health Effect Risks to an MEI
Chemical Name
AcetonitrileAmmoniaAnilineCarbon disulfideCarbon tetrachlorideChloroformDichlorodifluoromethaneEpichlorohydrinEthylene glycol monobutyl
etherHydrogen chlorideMercuryMethyl ethyl ketoneMethyl isobutyl ketoneMethylene chlorideNitrobenzeneToluene1,1,1-TrichloroethaneTrichlorofluoromethaneTriethylamineVinyl acetate
Concen-tration(ppm)
25422,300
0.9522141
12,9002,270
362.4
5,8500.009
7851,3509,550
1.01,020
16,4001,090
81424
ExposureTime(min)
221
607
1414
16060
1602160
6605216
11415
Intake(mg/kg/d)
1.1E-012.3E-012.8E-031.1E-011.5E-019.0E+001.6E-011.1E-019.2E-03
1.3E-016.0E-055.3E-014.4E+001.9E+004.2E-032.5E+001.7E+018.8E-025.7E-022.5E-01
RfD(mg/kg/d)
1.4E-012.9E-022.9E-032.9E-031.7E-021.1E-025.7E-012.9E-035.7E-02
2.0E-038.6E-052.9E-012.3E-018.6E-015.7E-031.1E-012.9E-012.0E+002.0E-035.7E-02
HazardQuotient
0.78.01.038
8.57900.337
0.2
640.71.819
2.20.72260
0.0429
4.4

49
model does not accurately represent variations associated with near-field (close to the spillsource) patchiness, which makes plume presentation unreliable and can potentially resultin overestimation of short-distance effects. Considering these facts, the assumption canbe made that the risk of adverse effects is minimal for substances with HQ values lessthan 10. Accordingly, the greatest potential for adverse effects to an MEI is associatedwith accidental release of the following substances: chloroform, hydrogen chloride, 1,1,1-trichloroethane, carbon disulfide, epichlorohydrin, triethylamine, toluene, and methylisobutyl ketone. Once an accidental release is reported, evacuation would be made in ashort time period for the area that is anticipated to be affected. Assuming evacuationwould occur within 10 min of accidental release, chemicals with potentially adverse effectsfor an MEI are chloroform, hydrogen chloride, 1,1,1-trichloroethane, carbon disulfide, andtriethylamine. In general, for the same shipment, risks for on-site transportation arehigher than those for off-site transportation due to the shorter distances to a receptor.
Increased carcinogenic risk can be derived by using estimated daily intakesaveraged over a lifetime of exposure and slope factor. A standard risk equation for inhalationof airborne chemicals was used (EPA 1989b). For the analysis, daily intakes were adjustedto short-term exposures. Lifetime cancer incidence risks for an MEI are given in Table 13.
Lifetime cancer risks range from 2.5 x 10"7to4.0 x 10~4. Except for chloroform, risksfor all carcinogens are considered to be insignificant and acceptable for HW sites. However,several of these carcinogens are severe irritants and would be expected to result in irritationto the MEI at high concentration levels. Lifetime cancer risk for chloroform was estimatedto be 4.0 x 10"4. Shipments by tankers for this chemical would originate from LLNL underthe regionalized-1 alternative. Assuming evacuation would occur within 10 min of accidentalrelease, shipment for chloroform still could result in some significant increased cancer risksunder the accident conditions modeled.
TABLE 13 Lifetime Increased Carcinogenic Risks to an MEI
Chemical Name
BenzeneCarbon tetrachlorideChloroform1,2-DichloroethaneDichloroethyleneEpichlorohydrinFormaldehydeMethylene chlorideTetrachloroethaneTetrachloroethyleneTrichloroethaneTrichloroethyleneVinyl chloride
Concen-tration(ppm)
511141
12,900120599
369,970
52,30079
107666248
2,730
ExposureTime(min)
18141425
160
17
60606024
1
Intake(mg/kg/d)
1.9E-048.0E-054.9E-037.9E-051.9E-055.9E-059.8E-057.1E-042.5E-043.2E-041.6E-032.1E-045.6E-05
Slope Factor(mg/kg/d)"1
2.9E-025.3E-028.1E-029.1E-021.8E-014.2E-034.6E-021.7E-032.0E-012.0E-035.6E-026.0E-032.9E-01
CancerIncidence
Risk
5.5E-064.2E-064.0E-047.2E-063.3E-062.5E-074.5E-061.2E-065.1E-056.5E-078.7E-051.3E-061.6E-05

50
6 REFERENCES
AIHA — See American Industrial Hygiene Association.
Alexeeff, G.V., et al., 1989, "Problems Associated with the Use of Immediately Dangerous toLife and Health (IDLH) Values for Estimating the Hazard of Accidental Chemical Releases,"American Industrial Hygiene Association Journal 50(ll):598-605.
American Industrial Hygiene Association, 1988-1992, Emergency Response PlanningGuidelines, Sets 1-7, Akron, Ohio.
Beyer, W.H., 1991, CRC Standard Mathematical Tables and Formulae, 29th ed., CRC Press,Boca Raton, Fla.
Blowers, P., 1994, personal communication from Blowers (Westinghouse Hanford Company,Richland, Wash.,) to J. Pfingston (Argonne National Laboratory, Argonne, 111.), March 23.
Carson, B.L., et al., 1981, Sulfuric Acid Health Effects, EPA 460/3-81-025, prepared byMidwest Research Institute, Kansas City, Mo., for U.S. Environmental Protection Agency,Office of Mobile Source Air Pollution.
Daling, P.M., et al., 1991, Transportation Plan: New Production Reactor at the Hanford Site,WHC-EP-0340, Westinghouse Hanford Co., Richland, Wash.
DOE — See U.S. Department of Energy.
Dollarhide, J., 1992, personal communication from Dollarhide (Superfund Health RiskTechnical Support Center, Cincinnati, Ohio) to H.M. Hartmann (Argonne NationalLaboratory, Argonne, 111.), Oct. 27.
DOT — See U.S. Department of Transportation.
EPA — See U.S. Environmental Protection Agency.
Graf, V.D., and K Archuleta, 1985, Truck Accidents by Classification, FHWA/CA/TE-85,California Department of Transportation, Jan.
Harwood, D.W., and E.R. Russell, 1990, Present Practices of HIGHWAY Transportation ofHazardous Materials, FHWA/RD-89/013, prepared by Midwest Research Institute, McLean,Va., for Federal Highway Administration, Office of Safety and Traffic Operations, May.
Klaassen, CD., et al. (editors), 1986, Casarett and Doull's Toxicology: The Basic Science ofPoisons, 3rd ed., MacMillan Publishing Company, New York, N.Y.
Maloney, D.M., 1990, personal communication from Maloney (Argonne National Laboratory,Argonne, 111.) to J.C. Hess (U.S. Department of Transportation, Research and SpecialPrograms Administration, Washington, D.C.).

51
Monette, F.A., et al., 1996, Supplemental Information Related to Risk Assessment for the Off-site Transportation of Low-Level Mixed Waste for the U.S. Department of Energy WasteManagement Programmatic Environmental Impact Statement, ANL/EAD/TM-35, ArgonneNational Laboratory, Argonne, 111., Dec.
National Institute of Occupational Safety and Health, 1992, Registry of Toxic Effects ofChemical Substances (RTECS), Database, Cincinnati, Ohio.
National Resource Council, 1986, Criteria and Methods for Preparing Emergency ExposureGuideline Level (EEGL), Short-Term Public Emergency Guidance Level (SPEGL), andContinuous Exposure Guidance Level (CEGL) Documents, National Academy Press,Committee on Toxicology, Washington, D.C.
National Resource Council, 1993, Guidelines for Developing Community Emergency ExposureLevels for Hazardous Substances, National Academy Press, Committee on Toxicology,Washington, D.C.
Reynolds, R.M., 1992, ALOHA™ (Areal Locations of Hazardous Atmospheres) 5.0: TheoreticalDescription, NOAA-TM NOS ORCA-65, National Oceanic and Atmospheric Administration,Seattle, Wash., Aug.
Sax, N.I., and R.J. Lewis, 1992, Dangerous Properties of Industrial Materials, 8th ed., VanNostrand Reinhold, New York, N.Y.
Sommer, M., 1994, personal communication from Sommer (Washington Public Power SupplySystem, Richland, Wash.) to J. Pfingston (Argonne National Laboratory, Argonne, 111.),March 31.
U.S. Department of Energy, 1986, Environmental Assessment, Deaf Smith County Site, Texas,DOE/RW-0069, Office of Civilian Radioactive Waste Management, Washington, D.C., May.
U.S. Department of Energy, 1987, Final Environmental Impact Statement, Disposal ofHanford Defense High-Level, Transuranic and Tank Wastes, DOE/EIS-0013, Washington,D.C., Dec.
U.S. Department of Energy, 1990, Environmental Impact Statement, Waste Isolation PilotPlant, Final Supplement, DOE/EIS-0026-FS, Office of Environmental Restoration and WasteManagement, Washington, D.C., Jan.
U.S. Department of Energy, 1996, Waste Management Programmatic Environmental ImpactStatement for Managing Treatment, Storage, and Disposal of Radioactive and HazardousWastes, DOE/EIS-0200-PF, Office of Environmental Management, Washington, D.C.
U.S. Department of Transportation, 1990, The 1990 Emergency Response Guidebook, DOTP 5800.5, Research and Special Programs Administration, Office of Hazardous MaterialsTransportation, Washington, D.C.

52
U.S. Department of Transportation, 1993a, Hazardous Materials Information ReportingSystem Database, Research and Special Programs Administration — Hazardous MaterialsSafety, Washington, D.C.
U.S. Department of Transportation, 1993b, The 1993 Emergency Response Guidebook, DOTP 5800.5, Research and Special Programs Administration, Office of Hazardous MaterialsTransportation, Washington, D.C.
U.S. Environmental Protection Agency, 1980, "Water Quality Criteria Document;Availability," Federal Register 45:79353, Nov. 28.
U.S. Environmental Protection Agency, 1986, "Guidelines for Carcinogenic Risk Assessment,"Federal Register 51:33992-34003, Sept.
U.S. Environmental Protection Agency, 1989a, Exposure Factors Handbook,EPA/600/8-89/043, Office of Health and Environmental Assessment, Washington, D.C., May.
U.S. Environmental Protection Agency, 1989b, Risk Assessment Guidance for Superfund,Volume I: Human Health Evaluation Manual, Part A, (Interim Final), EPA/540/1-89/002,Office of Emergency and Remedial Response, Washington, D.C., Dec.
U.S. Environmental Protection Agency, 1991, Risk Assessment Guidance for Superfund,Volume I: Human Health Evaluation Manual, Part B: Development of Risk BasedPreliminary Remediation Goals, Interim, EPA/540/R-92/003, Office of Emergency andRemedial Response, Washington, D.C., Dec.
U.S. Environmental Protection Agency, 1993a, Health Effects Assessment Summary Tables(HEAST), Annual FY 1993, OERR 9200.6-303 (92-1), Office of Emergency and RemedialResponse, Washington, D.C., March.
U.S. Environmental Protection Agency, 1993b, Integrated Risk Information System (IRIS),Database, Office of Emergency and Remedial Response, Washington, D.C., accessed Oct.
U.S. Environmental Protection Agency, et al., 1987, Technical Guidance for HazardousAnalysis — Emergency Planning for Extremely Hazardous Substances, Appendix D, Office ofEmergency and Remedial Response, Washington, D.C.
Westinghouse Hanford Co., 1993, Hazardous Material Packaging and Shipping Manual,WHC-CM-2-14, Westinghouse Hanford Co., Richland, Wash.
Wilson, D.J., 1991, "Accounting for Peak Concentrations in Atmospheric Dispersion for WorstCase Hazard Assessments," in the proceedings of'the International Conference and Workshopon Modeling and Mitigating the Consequences of Accidental Releases of Hazardous Materials,May 20-24, 1991, New Orleans, La., American Institute of Chemical Engineers, New York,N.Y.

AD-1
ADDENDUM I:
TRANSPORTATION RISK ASSESSMENT FOR THEHAZARDOUS COMPONENT OF LOW-LEVEL MIXED WASTE

AD-2

AD-3
ADDENDUM I CONTENTS
1 INTRODUCTION AD-5
2 RISK ASSESSMENT METHODOLOGY AD-6
3 MODELS AND ASSUMPTIONS AD-9
3.1 Mode and Quantity of Atmospheric Release AD-93.2 Hypothetical Meteorological Conditions AD-113.3 Health Risk of Releases of Mixtures of Chemicals AD-113.4 Maximally Exposed Individual Risk Evaluation AD-11
4 SUMMARY OF RESULTS AD-13
5 REFERENCES AD-19
TABLES
1 Chemical-Specific Values of ICRC and PAEC for LLMW Carcinogenicand Any Adverse Affect Constituents AD-7
2 Container Breach Rates and Atmospheric Releases Derivedfrom HMIRS Statistical Data for Truck and Railcar Accidents AD-8
3 Fractional Occurrences by Population Density Zone and EstimatedRelease Fractions for LLMW Shipments under VariousAccident Severity Categories AD-9
4 Summary of Cargo-Related Population Risks for LLMWShipments by Highway for a 10-Year Period AD-15
5 Summary of Cargo-Related Population Risks for LLMW
Shipments by Railway for a 10-Year Period AD-16
6 Lifetime MEI Carcinogenic Risks for LLMW Transportation AD-17
7 MEI Hazard Quotients for Adverse Effect End Points forLLMW Shipments AD-18

AD-4

AD-5
ADDENDUM I:
TRANSPORTATION RISK ASSESSMENT FOR THEHAZARDOUS COMPONENT OF LOW-LEVEL MIXED WASTE
1 INTRODUCTION
This addendum summarizes the results of the hazardous waste (HW) transportationrisk assessment for the Waste Management (WM) component of U.S. Department of Energy(DOE) Waste Management Environmental Impact Statement (WM PEIS) low-level mixedwaste (LLMW). It includes a short summary of the risk assessment methodology,assumptions, models, and results. The results from this analysis compliment the similaranalysis for the radiological risk (Argonne National Laboratory [ANL] 1994). A descriptionof the LLMW characteristics and packaging can be found in ANL (1994).
The transportation risk analysis for LLMW is intended to provide input for decisionsregarding alternatives for the treatment and disposal of the LLMW generated at installationswithin the DOE complex. The risks incurred during waste loading, unloading, and handlingprior to and after shipment are not included because they are part of the facility accidentanalysis prepared in a separate document. The analysis in this data deliverable applies onlyto LLMW once it has left the DOE facilities and is on public roads.
The LLMW transportation risk assessment is based on HW shipments via trucks orrailcars from generators to treatment, storage, and disposal (TSD) facilities. Cargo-relatedpopulation risks are evaluated; the vehicle-related population risks are presented in ANL(1994). Potential cargo-related population risks associated with hypothetical transportationaccidents are estimated for the following six cases, which are defined in Chapter 2 of theWM PEIS (DOE 1996).
• Decentralized — 49 sites treat contact-handled LLMW; 16 sites dispose• Regionalized 1 — 11 sites treat contact-handled LLMW; 12 sites dispose• Regionalized 2 — 7 sites treat contact-handled LLMW; 6 sites dispose• Regionalized 3 — 7 sites treat contact-handled LLMW; 1 site disposes
(Nevada Test Site)• Regionalized 4 — 4 sites treat contact-handled LLMW; 6 sites dispose• Centralized — 1 site treat contact-handled LLMW (Hanford); 1 site
disposes (Hanford)
For each case, the population risks are evaluated under eight accident severity categories (Ithrough VIII) established by the U.S. Nuclear Regulatory Commission (NRC 1977).
Because liquid and solid wastes are likely to be shipped in different containers andin separate shipments, the cargo-related population risks for these two types of wastes arealso evaluated separately. Following a transportation accident, liquid wastes in thecontainers are assumed to be spilled onto the ground to form a vapor plume. Hazardous

AD-6
chemicals in the plume are carried by the wind downward and dispersed in both horizontaland vertical directions, thereby affecting the nearby population. For solid wastes, twodifferent approaches are used to assess the impact of transportation accident on populationrisks: (1) the evaporative gaseous emission approach and (2) the fugitive particulate emissionapproach. In the first approach, the entire content in a waste container is assumed to bedumped to form a waste pile on the ground. The amount of gaseous emissions of hazardouschemicals depends not only on the physical properties and volatilization rate of a specificchemical compound, but also on the size of the pile. The second approach treats atmosphericreleases of hazardous chemicals as fugitive particulates and attempts to quantify theirinhalation-related population risks under different accident severity categories.
2 RISK ASSESSMENT METHODOLOGY
The cargo-related risks from exposure to the HW component of LLMW resulting froma transportation accident can be either acute (result in immediate injury or fatality) or latent(result in cancer that would present itself after a latency period of several years). Theprimary exposure route of concern with respect to atmospheric HW releases is inhalation.Population risks are evaluated for (1) increased risk of cancer and (2) potential for anyadverse effects. Increased carcinogenic risk is expressed as the number of individuals in thegeneral population with an increased lifetime cancer risk of 10~6 (1 in 1 million) or greater.The risk from exposure to specific chemical carcinogens is calculated using increasedcarcinogenic risk concentration (ICRC) values. The potential for any adverse effects risk isexpressed as the number of individuals in the general population exposed to specificchemicals at levels above the potential adverse effect concentration (PAEC) for that chemical.ICRC and PAEC values are benchmark levels derived specifically for the WM PEIS. Use ofthese types of population risk descriptors (that is, estimates of the number of persons exposedabove specified benchmark levels) is recommended under U.S. Environmental ProtectionAgency (EPA) guidance.
Characterization of the LLMW hazardous chemical inventory is provided in Wilkinset al. (1996). Liquid and solid hazardous waste components with significant volatilizationpotential and inhalation toxicity values (i.e., slope factors or reference concentrations)available from the EPA were evaluated. Table 1 lists the identified carcinogenic andnoncarcinogenic substances in the LLMW inventory and their respective ICRC and PAECvalues. No substances are identified as an acute "poison inhalation hazard" by theU.S. Department of Transportation (DOT 1990). Thus, an evaluation of potential life-threatening acute effects is not necessary. In addition, no published data are presentlyavailable to determine the PAEC or ICRC values for insoluble hydrocarbons and someinorganic substances (e.g., lead, cyanide, silver, and selenium compounds). Although some

AD-7
TABLE 1 Chemical-Specific Values of ICRC and PAEC for LLMWCarcinogenic and Any Adverse Affect Constituents
LLMW Health End PointCodes Substance Concentration Value
75-09-2Cl-2-xCl-4-xHC-soluble
75-09-2Cl-3-xCl-F-xHC-soluble
Carcinogenic Chemical Substances
Dichloromethane (methylene chloride)Dichloroe thaneTetrachloroetheneHydrocarbons-soluble (benzene,a xylene, toluene, etc.)
Anv Adverse Affect Chemical Substances
Dichloromethane (methylene chloride)1,1,1-Trichloroe thanel,l,2-Trichloro-l,2,2-trifluoroethane (Freon 113)Hydrocarbons-soluble (benzene, xylene, toluene,b etc.)
ICRC
PAEC
15 min
147.031.0
670.018.0
Values (ppm)
380.05.8
160.023.0
Values (ppm)
30 min 60 min
73.0 37.016.0 7.8
330.0 170.09.0 4.5
a The carcinogenic potential of soluble hydrocarbons was calculated using the ICRC value for benzene.
b The potential adverse effects end point for soluble hydrocarbons was calculated using the PAEC value fortoluene.
particulates are carcinogens (e.g., cadmium salts), low exposure dose and duration make riskslow compared with risks from vapors and gases. Inorganic substances such as arsenic,barium, cadmium, chromium, lead, mercury, selenium, and silver compounds are consideredto have either very low volatilization potentials or to be too heavy to remain suspended in airas respirable particulates. Based on these considerations, only those organic substances withidentified PACE or ICRC values were selected in the risk assessment for HW transportationaccidents.
The risk assessment considers historical hazardous-material traffic data for trucksand railcars, including accident probabilities, cargo release likelihood given an accident, andconsequences of a range of possible transportation accidents. In the risk assessment, liquidLLMW is assumed to be shipped in Type A containers (55-gal drums) separately from solidLLMW, which may be shipped in various forms and sizes of containers. The probabilities oftruck accidents, based on statistics compiled for the California Department of Transportationfor the period 1979-1983, are presented in Section 2.1 of the main text. On the basis of datacompiled by Saricks and Kvitek (1994) (see Section E.6.4 in WM PEIS, Appendix E), thenational average railcar accident rate is 5.6 x 10"3 accidents/km (9.0 x 10"3 accidents/mi). Toestimate the amount of atmospheric releases during a typical transportation accident,statistical data were compiled from the Hazardous Materials Incident Reporting System(HMIRS) database (DOT 1993) to arrive at the container breach rates and atmosphericrelease rates by truck and railcar shipments for different container sizes, as shown inTable 2. The statistical data on accidents presented in this table are used only for liquidLLMW shipments.

AD-8
For cargo-related population risk assessment, the eight accident severity categories(I through VIII) defined in NUREG-0170 (NRC 1977) are designed to take into account allcredible transportation-related accidents, including those with low probability but highconsequences and vice versa. Category I accidents are the least severe but the most frequent,whereas Category VIII accidents are very severe but very infrequent. Each severity categoryrepresents a set of accident scenarios defined by a combination of mechanical (impact) andthermal (fire) forces and is assigned a conditional probability of occurrence. To determine theexpected frequency of an accident of a given severity category, the conditional probability inthe category is multiplied by the baseline accident rate. Each population density zone has adistinct baseline accident rate and distribution of accident severities related to differences inaverage vehicular velocity, traffic density, and other factors, including location (rural,suburban, or urban). Table 3 presents the fractional occurrences by population density zone,as well as release fractions, under the eight accident severity categories for both truck andrailcar LLMW shipments. It should be noted that the value of the accident release fractionin this table is for the total mass release. For accidents involving shipments of liquid wastes,100% of the total mass release is assumed to become aerosolized and respirable. For solidwastes, 10% of the total mass release is assumed to become aerosolized, of which only 5% willbe respirable. A chemical spill dispersion model uses the respirable portion of aerosol releasesinto the atmosphere following a transportation accident to predict the plume footprint andestimate the chemical exposure area, as discussed in the next section. The assumed mass,aerosol, and respirable release fractions for LLMW shipment accidents are consistent withthose used for radiological transportation risk assessment (refer to WM PEIS, Appendix E).
TABLE 2 Container Breach Rates and Atmospheric Releases Derivedfrom HMIRS Statistical Data for Truck and Railcar Accidents
TransportationMode
Truck
Railcar
ContainerContents
Liquid/gas
Solids
Liquids/gas
Solids
Container Size
Package freight containers0-2 gal capacity2-10 gal capacity10-50 gal capacity>50 gal capacity
Bulk containers
Package freight containersBulk containers
Package freight containersBulk containers
Package freight containersBulk containers
BreachRate (%)
43.8045.1040.7035.90a
30.60
25.00a
40.90
QuantityRelease (%)
65.3036.8027.1019.90a
16.20
23.5032.60
38.00a
6.60
44.151.26
a Statistical data used in the HW transportation risk assessment.

AD-9
TABLE 3 Fractional Occurrences by Population Density Zoneand Estimated Release Fractions for LLMW Shipmentsunder Various Accident Severity Categories8
SeverityCategory
TruckIIIIIIIVVVIVIIVIII
RailIIIIIIIVVVIVIIVIII
FractionalOccurrence
5.50E-013.60E-017.00E-021.60E-022.80E-031.10E-038.50E-051.50E-05
5.00E-013.00E-011.80E-011.80E-021.80E-031.30E-046.00E-051.00E-05
Fractional Occurrenceby Population Density Zone
Rural
1.00E-011.00E-013.00E-013.00E-015.00E-017.00E-018.00E-019.00E-01
1.00E-011.00E-013.00E-013.00E-015.00E-017.00E-018.00E-019.00E-01
Suburban
1.00E-011.00E-014.00E-014.00E-013.00E-012.00E-011.00E-015.00E-02
1.00E-011.00E-014.00E-014.00E-013.00E-012.00E-011.00E-015.00E-02
Urban
8.00E-018.00E-013.00E-013.00E-012.00E-011.00E-011.00E-015.00E-02
8.00E-018.00E-013.00E-013.00E-012.00E-011.00E-011.00E-015.00E-02
W. o+i rr\ Q ffxA
ReleaseFractionb
0.00E+001.00E-021.00E-011.00E+001.00E+001.00E+001.00E+001.00E+00
0.00E+001.00E-021.00E-011.00E+001.00E+001.00E+001.00E+001.00E+00
a Refer to Tables E-6 and E-7 in WM PEIS, Appendix E.Values are for total material release fraction for Type A shipping containers.
3 MODELS AND ASSUMPTIONS
The Areal Locations of Hazardous Atmospheres (ALOHA™) model, jointly developedby the EPA and the National Oceanic and Atmospheric Administration (NOAA) (Reynolds1992), was used to predict the plume footprints and their area coverage at or above the PAECor ICRC values for hazardous chemicals released into the atmosphere following a hypotheticaltransportation accident. The various assumptions used in the modeling are summarizedbelow.
3.1 MODE AND QUANTITY OF ATMOSPHERIC RELEASE
Container releases of volatile chemical vapors in LLMW accidents can enter theatmosphere in one or a combination of three modes: as a direct respirable aerosol (liquid

AD-10
spill, no pool), as an evaporative gas from contaminated spoils pile (solid waste spill onground), and as a respirable aerosol fraction (solid spill, direct to atmosphere).
Hazardous organic chemicals in LLMW are assumed to be released directly into theatmosphere following a transportation accident. The release duration is assumed to be onehour. For liquid wastes, the amount of liquid spilled is based on statistical data regardingcontainer breach rates and atmospheric release rates for truck and railcar accidentspresented in Table 2 and is computed from known shipping quantities for the eight accidentseverity categories given in Table 3. The spilled liquids are assumed to form a vapor plumeimmediately.
For transportation accidents involving solid wastes, the evaporative gaseous emissionapproach assumes that the entire cargo-load of the solid wastes would be dumped ontoground to form a cone-shape pile of no greater than 4 ft in height. Based on the averagedensity of LLMW solid wastes of 1,250 kg/m and known shipping quantity per truck orrailcar, the following equation was used to estimate the rate of gaseous organic chemicalemissions for each alternative route (EPA 1988):
E - D xCsxAx (p^1-333333) x (M/dsc) , (D
where
E = emission rate of a specific chemical compound (g/s),
D = chemical diffusivity (cm2/s),
Cs = saturation vapor concentration (g/cm ),
M = chemical fraction in the waste,
Pt = total soil porosity (use default = 0.35),
A = exposure area (cm ), and
dsc = effective depth of solid LLMW pile (cm).
The fugitive particulate emission approach utilizes the same mass, aerosol, andrespirable release fractions in the following eight accident severity categories, consistent withthose used for radiological transportation risk assessment (see ANL 1994):
Severity Release FractionsCategory Mass Aerosol Respirable
IIIIIIIV-VIII
0.000.010.101.00
0.00.10.10.1
0.000.050.050.05

AD-11
For example, if a truck load of LLMW solid wastes contains 1,000 kg of benzene, therespirable particulate release of benzene under Severity Category III would be 0.5 kg[1,000 kg x 0.1 x 0.1 x 0.05]. The mass, aerosol, and respirable release fractions are assumedto be zero in Severity Category I, indicating no atmospheric HW releases for a minortransportation accident. Thus the population risks to Severity Category I will always be zero.
3.2 HYPOTHETICAL METEOROLOGICAL CONDITIONS
The following hypothetical meteorological conditions were used to predict plumefootprints and their areal extents in the ALOHA™ modeling:
Wind speed 4 m/sAtmospheric stability neutral (Pasquill Class D)Ambient temperature 95°FRelative humidity 50%
3.3 HEALTH RISK OF RELEASES OF MIXTURES OF CHEMICALS
In many of these shipment accidents, a number of chemicals are released to theenvironment. The issue is how to account for the inhalation of multiple chemicals for anindividual downwind of the release. This additivity of human health impacts is addressedseparately for increased cancer risk and the any-adverse-effects end points.
ALOHA™ was run first for each of the chemicals to determine its individual plumefootprint at the specified ICRC or PAEC value (see Table 1). Using an iteration method, the"composite" plume footprint for all chemicals of concern is determined such that the followingrelationship can be reached:
I^CJT^l , (2)
where
Cn = concentration at "composite" plume footprint for the nth chemicalof concern, and
Tn = threshold limit value (level of concern) for rath chemical.
This method would yield a larger plume area of influence of the chemical mixturethan any one of its components.
3.4 MAXIMALLY EXPOSED INDIVIDUAL RISK EVALUATION
The maximally exposed individual (MEI) was considered to be located at the pointof highest chemical concentration accessible to the general public. This location is assumedto be 30 m (100 ft) from an accident resulting in the highest chemical concentration. To
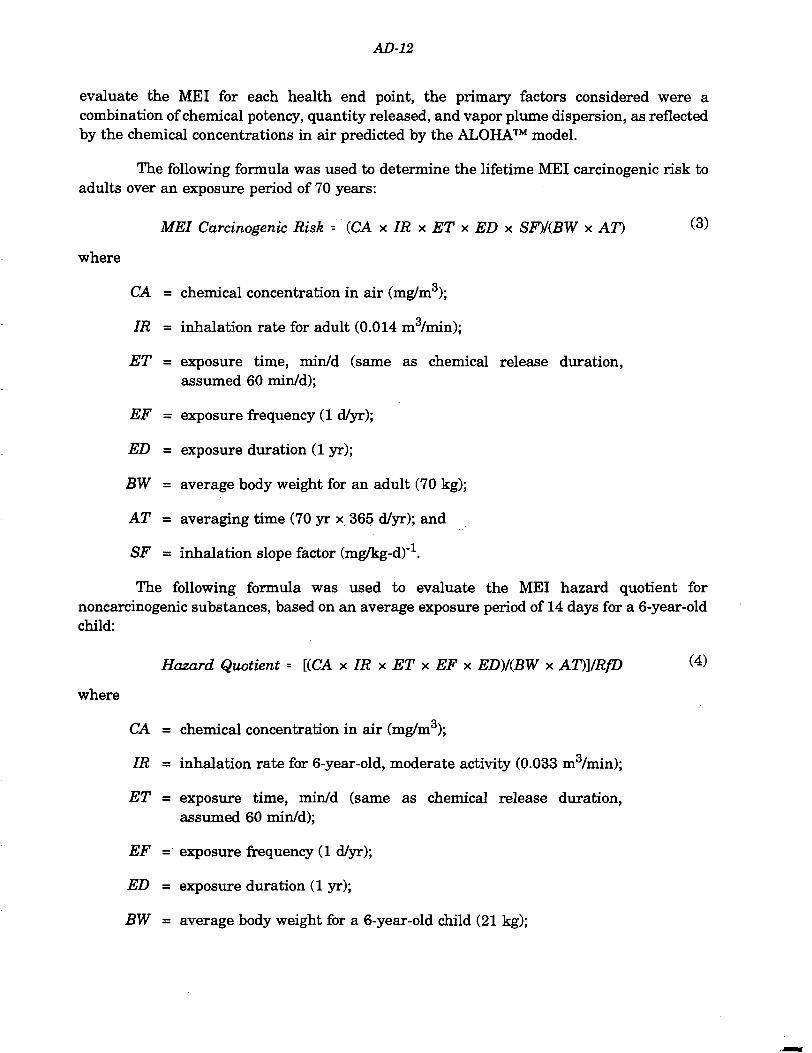
AD-12
evaluate the MEI for each health end point, the primary factors considered were acombination of chemical potency, quantity released, and vapor plume dispersion, as reflectedby the chemical concentrations in air predicted by the ALOHA™ model.
The following formula was used to determine the lifetime MEI carcinogenic risk toadults over an exposure period of 70 years:
MEI Carcinogenic Risk -- (CA x IR x ET x ED x SF)/(BW x AT) &)
where
CA = chemical concentration in air (mg/m3);
IR = inhalation rate for adult (0.014 m3/min);
ET = exposure time, min/d (same as chemical release duration,assumed 60 min/d);
EF = exposure frequency (1 d/yr);
ED = exposure duration (1 yr);
BW = average body weight for an adult (70 kg);
AT = averaging time (70 yr x 365 d/yr); and
SF = inhalation slope factor (mg/kg-d)"1.
The following formula was used to evaluate the MEI hazard quotient fornoncarcinogenic substances, based on an average exposure period of 14 days for a 6-year-oldchild:
Hazard Quotient -- [{.CA x IR x ET x EF x ED)I{BW x AT)]/RfD <4>
where
CA = chemical concentration in air (mg/m3);
IR - inhalation rate for 6-year-old, moderate activity (0.033 m3/min);
ET = exposure time, min/d (same as chemical release duration,assumed 60 min/d);
EF = exposure frequency (1 d/yr);
ED - exposure duration (1 yr);
BW = average body weight for a 6-year-old child (21 kg);

AD-13
AT = averaging time (14 d/yr x 1 yr); and
Rfd = reference dose (mg/kg/d).
A hazard quotient (HQ) greater than 1 indicates that an adverse effect for the MEIis likely. The level of concern associated with exposure to these compounds does not increaselinearly at HQ values exceed 1. In other words, HQ values do not represent a probability ora percentage. One may conclude that, as the HQ value above 1 increases, greater concernexists about potential adverse effects; however, assuming that an HQ value of 10 indicatesthat adverse health effects are 10 times more likely to occur than for an HQ value of 1 isincorrect. Because of uncertainties and conservatism associated with the use of EPA RfDvalues to evaluate single, brief exposures, the assumption may be made that the risk ofadverse effects is minimal for substances with HQ values between 1 and 10.
4 SUMMARY OF RESULTS
The collective cargo-related population risks to the general public for off-site LLMWtransportation for a 10-year period, under the above six cases of treatment options, aresummarized in Table 4 for highway shipments and in Table 5 for railway shipments.
With regard to concerns for potential cancer incidents, zero population risks werefound involving solid waste shipments. For liquid waste shipments, the highest risk wasfound to occur under the Centralized Alternative: Severity Category IV for both highway andrailway shipments.
Concerning potential health risk effects, zero population risks were found involvingsolid wastes shipped by truck. For liquid waste shipments, the highest risk was found tooccur under the Centralized Alternative: Severity Category III for both highway and railwayshipments.
The population risks involving solid waste shipments by trucks and railcars, basedon the evaporative gaseous emission approach, were found to be zero. Using the fugitiveparticulate emission approach, the population risks were also found to be zero.
The HW component risks of the LLMW shipments are expected to be much lowerthan the transportation risk of the purely hazardous waste shipments (i.e., those with noradiological component).
With regard to MEI risk evaluation, the lifetime carcinogenic risks, the lifetimecarcinogenic risks for potential cancer incident end points, and the HQs for adverse effectsend points are summarized in Tables 6 and 7. The tables summarize the MEI risk resultsof both liquid and solid LLMW transportation accidents by trucks and railcars found by usingthe various atmospheric release approaches described in Section 2.1. The risk calculationswere based on the maximum ambient concentrations at 100 ft from the release point for allshipments for a single truck or railcar accident predicted by the ALOHA™ model on a

AD-14
chemical-specific basis. As indicated in Table 6, the carcinogenic risks for all chemicals arebetween 6.7 x 10~12 and 1.4 x 10"4. For all cases except two (one liquid waste shipment bytruck and railcar each), the estimated carcinogenic MEI risks are lower than the generallyconsidered acceptable risk range of one in one million (10~6). The carcinogenic risks of5.6 x 10"5 for truck shipment and 1.4 x 10"4 for railcar shipment are for LLMW classified assoluble hydrocarbons. To yield a conservative assumption and facilitate calculations, solublehydrocarbons were assumed to be the carcinogenic substance benzene. The risks presentedfor this waste category are probably overestimated, because it is highly unlikely that solublehydrocarbons are actually composed of pure benzene. However, more data on the compositionof the substance would be required to refine the risk estimates.
Adverse effects are considered possible for substances with associated hazardquotient (HQ) values greater than one. As shown in Table 7, HQs are greater than one forliquid waste shipments containing toluene and 1,1,1-trichloroethane and for solid wasteshipments of toluene under Severity Categories IV-VIII. Thus, an accidental release involvingany of these shipments would have the potential to result in adverse effects for receptors atthe MEI locations.

AD-15
TABLE 4 Summary of Cargo-Related Population Risks3 for LLMWShipments by Highway for a 10-Year Periodb
Population Risk
Shipment summaryNumber of shipmentsDistance (km)
Liquid wastes per severitycategory0
Potential for increased cancerincidence
IIIIIIIVVVIVIIVIII
Potential adverse healtheffects
IIIIIIIVVVIVIIVIII
Solid wastes (volatile-organic-contaminated soil/debrisevaporative releases)
Potential for increased cancerincidencePotential adverse healtheffects
Solid wastes (respirablecontaminated aerosol releases)
Potential for increased cancerincidencePotential adverse healtheffects
Decen-tralized
5.00E+014.73E+04
000
2.49E-073.42E-089.76E-094.99E-106.30E-11
000
1.S3E-062.10E-076.01E-083.07E-093.88E-10
0
0
0
0
Region-alized 1
6.30E+023.23E+05
00
5.98E-073.90E-064.89E-071.16E-077.08E-097.30E-10
01.39E-068.28E-061.98E-052.51E-066.07E-073.65E-083.86E-09
0
0
0
0
LLMW Treatment Option
Region-alized 2
1.23E+035.00E+05
00
2.54E-043.42E-044.39E-051.10E-056.44E-077.09E-08
08.01E-049.21E-041.33E-031.70E-044.26E-052.50E-062.75E-07
0
0
0
0
Region-alized 3
1.18E+034.44E+05
00
2.54E-043.42E-044.39E-051.10E-056.44E-077.09E-08
08.01E-049.21E-041.32E-031.70E-044.25E-052.49E-062.75E-07
0
0
0
0
Region-alized 4
2.49E+038.27E+05
00
2.61E-043.53E-044.54E-051.14E-056.67E-077.38E-08
08.09E-049.50E-041.37E-031.76E-044.42E-052.59E-062.87E-07
0
0
0
0
Central-ized
5.13E+032.33E+06
00
3.08E-044.30E-045.55E-051.41E-058.21E-079.20E-08
09.28E-041.22E-031.67E-032.15E-045.45E-053.18E-063.57E-07
0
0
0
0
a Cargo-related risks refer to the number of people affected and were computed from the product of the probability ofaccident release multiplied by the number of people exposed to the health criteria concentration.
Risks and travel distances are for the total shipment duration (10 yr). To obtain the annual values, the risks anddistances must be divided by 10.
c Value in bold italics represents the highest risk for a specific risk category.

AD-16
TABLE 5 Summary of Cargo-Related Population Risksa for LLMWShipments by Railway for a 10-Year Periodb
Population Risk
Shipment summaryNumber of shipmentsDistance (km)
Liquid wastes per severitycategory0
Potential for increased cancerincidence
IIIIII
rvVVIVIIVIII
Potential adverse healtheffects
IIIIIIIVVVIVIIVIII
Decen-tralized
5.00E+013.88E+04
000
9.84E-087.56E-093.82E-108.53E-111.57E-11
000
4.41E-073.39E-081.71E-093.82E-107.04E-11
Region-alized 1
5.30E+023.65E+05
00
1.84E-071.03E-067.51E-083.41E-098.66E-101.26E-10
01.41E-073.13E-064.71E-063.44E-071.57E-083.95E-095.88E-10
LLMW Treatment Option
Region-alized 2
8.10E+025.76E+05
02.42E-059.05E-057.42E-055.36E-062.38E-077.22E-089.62E-09
01.38E-044.08E-042.92E-042.11E-059.38E-072.84E-073.79E-08
Region-alized 3
7.60E+025.17E+05
02.42E-059.05E-057.41E-055.35E-062.38E-077.21E-089.60E-09
01.38E-044.08E-042.91E-042.11E-059.37E-072.84E-073.78E-08
Region-alized 4
1.32E+039.15E+05
02.42E-059.24E-057.60E-055.50E-062.46E-077.42E-089.98E-09
01.38E-044.17E-042.99E-042.17E-059.69E-072.92E-073.93E-08
Central-ized
2.34E+032.46E+06
02.42E-051.12E-049.19E-056.70E-063.04E-078.90E-081.24E-08
01.55E-044.92E-043.64E-042.65E-051.20E-063.52E-074.91E-08
Solid wastes (volatile-organic-contaminated soil/debrisevaporative releases)
Potential for increased cancerincidencePotential adverse healtheffects
Solid wastes (respirablecontaminated aerosol releases)
Potential for increased cancerincidencePotential adverse healtheffects
0
0
0
0
0
0
0
0
0
0
0
0
0
0
0
0
0
0
0
0
0
0
0
0
a Cargo-related risks refer to the number of people affected and were computed from the product of the probability ofaccident release multiplied by the number of people exposed to the health criteria concentration.
b Risks and travel distances are for the total shipping duration (10 yr). To obtain the annual values, the risks anddistances must be divided by 10.
c Value in bold italics represents the highest risk for a specific risk category.

AD-17
TABLE 6 Lifetime MEI Carcinogenic Risk for LLMW Transportation
Trans-portation
Mode
Highway
Railroad
ReleaseMode
Liquidaerosol(direct)
Vaporspoils pile(Superfund)
Particulate(SeverityCategoryII)
Particulate(SeverityCategoryIII)
Particulate(SeverityCategoriesIV-VIII)
Liquidaerosol(direct)
Vaporspoils pile(Superfund)
Particulate(SeverityCategoryH)
Particulate(SeverityCategoryIII)
Particulate(SeverityCategoriesIV-VIII)
Chemical Name
DichloromethaneDichloroethaneTetrachloroetheneBenzene
DichloromethaneDichloroethaneTetrachloroetheneBenzene
DichloromethaneDichloroethaneTetrachloroetheneBenzene
DichloromethaneDichloroethaneTetrachloroetheneBenzene
DichloromethaneDichloroethaneTetrachloroetheneBenzene
DichloromethaneDichloroethaneTetrachloroetheneBenzene
DichloromethaneDichloroethaneTetrachloroetheneBenzene
DichloromethaneDichloroethaneTetrachloroetheneBenzene
DichloromethaneDichloroethaneTetrachloroetheneBenzene
DichloromethaneDichloroethaneTetrachloroetheneBenzene
Concentrationat MEI
Location(ppm)
1.22E+007.21E-011.15E+011.28E+03
2.51E-031.69E-036.59E-048.05E-03
5.28E-032.31E-032.47E-028.09E-02
5.28E-022.31E-022.47E-018.09E-01
5.28E-012.31E-012.47E+008.09E+00
1.57E+017.27E+002.33E+013.22E+03
2.51E-031.69E-036.59E-048.05E-03
5.28E-032.31E-032.47E-028.09E-02
5.28E-022.31E-022.47E-018.09E-01
5.28E-012.31E-01
2.47E+008.09E+00
ExposureTime
(min/d)
60606060
60606060
60606060
60606060
60606060
60606060
60606060
60606060
60606060
60606060
InhalationAir Intake(mg/kg/d)a
1.99E-061.37E-063.66E-051.92E-03
4.09E-093.21E-092.10E-091.21E-08
8.60E-094.38E-097.86E-081.21E-07
8.60E-084.38E-087.86E-071.21E-06
8.60E-074.38E-077.86E-061.21E-05
2.56E-051.38E-057.41E-054.82E-03
4.09E-093.21E-092.10E-091.21E-08
8.60E-094.38E-097.86E-081.21E-07
8.60E-084.38E-087.86E-071.21E-06
8.60E-074.38E-077.86E-061.21E-05
SlopeFactor
(mg/kg/d)"1
1.65E-039.10E-025.95E-032.91E-02
1.65E-039.10E-025.95E-032.91E-02
1.65E-039.10E-025.95E-032.91E-02
1.65E-039.10E-025.95E-032.91E-02
1.65E-039.10E-025.95E-032.91E-02
1.65E-039.10E-025.95E-032.91E-02
1.65E-039.10E-025.95E-032.91E-02
1.65E-039.10E-025.95E-032.91E-02
1.65E-039.10E-025.95E-032.91E-02
1.65E-039.10E-025.95E-032.91E-02
CarcinogenicMEI Risk
3.3E-091.2E-072.2E-075.6E-05
6.7E-122.9E-101.2E-113.5E-10
1.4E-114.0E-104.7E-103.5E-09
1.4E-104.0E-094.7E-093.5E-08
1.4E-094.0E-084.7E-083.5E-07
4.2E-081.3E-064.4E-071.4E-04
6.7E-122.9E-101.2E-113.5E-10
1.4E-114.0E-104.7E-103.5E-09
1.4E-104.0E-094.7E-093.5E-08
1.4E-094.0E-084.7E-083.5E-07
Adjusted to short-term exposures.

AD-18
TABLE 7 MEI Hazard Quotients for Adverse Effect End Points for LLMW Shipments
Trans-portation
Mode
Highway
Railroad
ReleaseMode
Liquidaerosol(direct)
Vaporspoils pile(Superfund)
Particulate(SeverityCategoryID
Particulate(SeverityCatefforvVUVVgU) J
III)
Particulate(SeverityCategoriesIV-VIII)
Liquidaerosol(direct)
Vaporspoils pile(Superfund)
Particulate(SeverityCategoryII)
Particulate(SeverityCategoryHI)
Particulate(SeverityCategoriesIV-VIII)
Chemical Name
Dichloromethane1,1,1-TrichloroethaneFreon 113Toluene
Dichloromethane1,1,1-TrichloroethaneFreon 113Toluene
Dichloromethane1,1,1-TrichloroethaneFreon 113Toluene
Dichloromethane1,1,1-TrichloroethaneFreon 113Toluene
Dichloromethane1,1,1-TrichloroethaneFreon 113Toluene
Dichloromethane1,1,1-TrichloroethaneFreon 113Toluene
Dichloromethane1,1,1-TrichloroethaneFreon 113Toluene
Dichloromethane1,1,1-TrichloroethaneFreon 113Toluene
Dichloromethane1,1,1-TrichloroethaneFreon 113Toluene
Dichloromethane1,1,1-TrichloroethaneFreon 113Toluene
Concentrationat MEI
Location(ppm)
1.22E+007.21E-011.15E+011.28E+03
2.51E-031.69E-036.59E-048.05E-03
5.28E-032.31E-032.47E-028.09E-02
5.28E-022.31E-022.47E-018.09E-01
5.28E-012.31E-01
2.47E+008.09E+00
1.57E+011.29E+027.65E-02
2.68E+03
2.51E-032.87E-032.98E-052.04E-03
5.28E-033.85E-029.64E-047.34E-02
5.28E-023.85E-019.64E-037.34E-01
5.28E-013.85E+009.64E-027.34E+00
ExposureTime
(min/d)
60606060
60606060
60606060
60606060
60606060
60606060
60606060
60606060
60606060
60606060
InhalationAir Intake(mg/kg/d)a
2.9E-022.6E-025.9E-013.2E+01
5.9E-056.2E-053.4E-052.0E-04
1.2E-048.5E-051.3E-032.0E-03
1.2E-038.5E-041.3E-022.0E-02
1.2E-028.5E-031.3E-012.0E-01
3.7E-014.7E+003.9E-036.8E+01
5.9E-051.1E-041.5E-065.2E-05
1.2E-041.4E-035.0E-051.9E-03
1.2E-031.4E-025.0E-041.9E-02
1.2E-021.4E-015.0E-031.9E-01
RfD
(mg/kg/d)b
8.6E-012.9E-01
8.6E+001.1E-01
8.6E-012.9E-01
8.6E+001.1E-01
8.6E-012.9E-01
8.6E+001.1E-01
8.6E-012.9E-018.6E+001.1E-01
8.6E-012.9E-01
8.6E+001.1E-01
8.6E-012.9E-018.6E+001.1E-01
8.6E-012.9E-018.6E+001.1E-01
8.6E-012.9E-018.6E+001.1E-01
8.6E-012.9E-018.6E+001.1E-01
8.6E-012.9E-018.6E+001.1E-01
HazardQuotient
3.33E-029.25E-026.90E-022.84E+02
6.84E-052.17E-043.95E-061.78E-03
1.44E-042.96E-041.48E-041.79E-02
1.44E-032.96E-031.48E-031.79E-01
1.44E-022.96E-021.48E-021.79E+00
4.28E-011.66E+014.59E-045.94E+02
6.84E-053.68E-041.79E-074.52E-04
1.44E-044.94E-035.78E-061.63E-02
1.44E-034.94E-025.78E-051.63E-01
1.44E-024.94E-015.78E-041.63E+00
Adjusted to short-term exposures.RfD = inhalation reference dose.

AD-19
5 REFERENCES
ANL — See Argonne National Laboratory.
Argonne National Laboratory, 1994, Data Deliverable — LLMWRadiological TransportationAssessment, Summary of Collective Population Risks, Argonne National Laboratory, Argonne,111., Sept. 6.
DOE — See U.S. Department of Energy.
DOT — See U.S. Department of Transportation.
NRC — U.S. Nuclear Regulatory Commission.
Reynolds, R.M., 1992, ALOHA™ (Areal Locations of Hazardous Atmospheres) 5.0: TheoreticalDescription, NOAA-TM NOS ORCA-65, National Oceanic and Atmospheric Administration,Seattle, Wash., Aug.
Saricks, C, and T. Kvitek, 1994, Longitudinal Review of State-Level Accident Statistics forCarriers of Interstate Freight, ANL/ESD/TM-68, Argonne National Laboratory, Argonne, 111.,July.
U.S. Department of Energy, 1996, Waste Management Programmatic Environmental ImpactStatement for Managing Treatment, Storage, and Disposal of Radioactive and HazardousWaste, DOE/EIS-0200-PF, U.S. Department of Energy, Office of Environmental Management,Washington, D.C.
U.S. Department of Transportation, 1990, The 1990 Emergency Response Guidebook,DOT P 5800.5, Research and Special Programs Administration, Office of Hazardous MaterialsTransportation, U.S. Department of Transportation, Washington, D.C.
U.S. Department of Transportation, 1993, Hazardous Materials Information Reporting SystemDatabase, Research and Special Programs Administration — Hazardous Materials Safety,U.S. Department of Transportation, Washington, D.C.
U.S. Environmental Protection Agency, 1988, Superfund Exposure Assessment Manual,EPA/540/1-68/1001, Washington, D.C.
U.S. Nuclear Regulatory Commission, 1977, Final Environmental Statement on theTransportation of Radioactive Material by Air and Other Modes, NUREG-0170, U.S. NuclearRegulatory Commission, Washington, D.C.
Wilkins, B.D., et al., 1996, Low-Level Mixed Waste Inventory, Characteristics, Generation, andFacility Assessment for Treatment, Storage, and Disposal Alternatives Considered in theU.S. Department of Energy Waste Management Programmatic Environmental ImpactStatement, ANL/EAD/TM-32, Argonne National Laboratory, Argonne, 111.

1AD-20

AD-21
ADDENDUM II:
TRANSPORTATION RISK ASSESSMENT FOR THEHAZARDOUS COMPONENT OF TRANSURANIC WASTE

AD-22

AD-23
ADDENDUM II CONTENTS
1 INTRODUCTION AD-25
2 POPULATION RISKS OF ALTERNATIVES — TRUCK MODE AD-25
3 MAXIMALLY EXPOSED INDIVIDUAL — TRUCK MODE AD-29
4 POPULATION RISKS OF ALTERNATIVES — RAIL MODE AD-29
5 MAXIMALLY EXPOSED INDIVIDUAL — RAIL MODE AD-30
6 SUMMARY AND CONCLUSIONS AD-32
7 REFERENCES AD-32
TABLES
1 Descriptions of Waste Streams within the TRUW Category AD-26
2 Estimated Concentration of Hazardous Constituents in Mixed TRUWby Waste Stream Category AD-28
3 Comparison of ALOHA™ Predictions at 100 ft from the Highwayto Health Criteria Limits — Truck Mode AD-29
4 MEI Lifetime Increased Carcinogenic Risks for MixedTRUW — Truck Mode AD-30
5 MEI Hazard Quotients for Adverse Effect End Pointfor Mixed TRUW — Truck Mode AD-30
6 Comparison of ALOHA™ Predictions at 100 ft from the Highwayto Health Criteria Limits — Rail Mode AD-31
7 MEI Lifetime Increased Carcinogenic Risks for MixedTRUW — Rail Mode AD-31
8 MEI Hazard Quotients for Adverse Effect End Pointsfor Mixed TRUW — Rail Mode AD-31

AD-24

AD-25
ADDENDUM II:
TRANSPORTATION RISK ASSESSMENT FOR THEHAZARDOUS COMPONENT OF TRANSURANIC WASTE
1 INTRODUCTION
This addendum evaluates the transportation risk due to the hazardous componentof transuranic waste (TRUW) shipments among the various TRUW alternatives for theU.S. Department of Energy (DOE) Waste Management Programmatic Environmental ImpactStatement (WM PEIS). In addition to the computed population risk discussion, impacts tothe maximally exposed individual (MEI) are presented. All TRUW is assumed to beradioactive material mixed with other chemical substances and is divided into a number ofwaste stream categories (Table 1). The estimated concentrations of hazardous chemicalconstituents for the various categories of TRUW are given according to waste streamcategories (aqueous liquids, organic liquids, organic sludge, cemented solids, inorganic sludge,solids, and debris — organic, heterogenous, inorganic, and inorganic nonmetal debris) inTable 2.
In the case of an accident during TRUW transportation, the impacts would be verylow because of the use of TRUPACT-II containers, which lead to extremely low release ratescompared to the rates from the usual 55-gal drums in which these wastes are stored at DOEfacilities. The TRUPACT-IIs are external containers in which 55-gal drums are placed fortransportation.
2 POPULATION RISKS OF ALTERNATIVES — TRUCK MODE
As can be seen from Table 2, organic liquids would present the greatest risk to thepublic in terms of hazardous waste impacts if a transportation accident occurred. This casewas studied in detail, and the results revealed that the chemical plumes would be within100 ft of the roadway where nonresidents are assumed to live. This was true for both the"carcinogenic" risk and "any adverse effects" health end points. No chemicals classified as"poison inhalation hazard" chemicals by the U.S. Department of Transportation (DOT 1990)were included in the TRUW inventory, so the potential for life-threatening effects end pointswas not evaluated. Assumptions for the worst case accident were as follows:
• Forty-two 55-gal drums are within a total of three TRUPACT-IIs that fillone truck;
• Each drum contains 0.21 m3 of waste with a density of about1,500 kg/m3;

AD-26
• The release fraction due to an accident encompasses all 42 drums andis at the rate of 0.0002 times the container contents; this release isconsistent with the highest release fraction used for radiological riskcomputations;
• The release fraction for radioactive particulates (radiological impact) andchemical vapors (hazardous waste impact) is the same; volatile liquidsare assumed to be 100% aerosolized and respirable, which is consistentwith the radiological assumptions; and
• The concentrations of chemicals in the released waste are the same asin the drums (for this worst case truck shipment):
1,1,1-trichloroethane 15% by weightcarbon tetrachloride 5% by weightFreon 113 (l,l,2-trichloro-l,2,2-trifluoroethane) 5% by weight
TABLE 1 Descriptions of Waste Streams within the TRUW Category
(1000) Aqueous WastesANL-1 Waste Water ( I 1100s = 11XX)
Concentration of organic material - 1 % in ANL-1.ANL-2 Aqueous Slurry (I 1200s = 12XX)
Dissolved and particulate material in ANL-2 is -10%.
(2000) Organic LiquidsANL-3 Aqueous Halogenated Organic Liquids (Z 2100s = 21IX)
These liquids are approximately 50% water and contain a wide variety ofchlorinated organics.
ANL-4 Aqueous Non-Halogenated Organic Liquids (Z 2120s = 212X)These liquids are approximately 50% water and contain a wide variety of watersoluble organic solvents (e.g., acetone, methanol, etc.)
ANL-5 Pure Halogenated Organic Liquids (Z 2210s = 221X)These liquids typically have -5% water and are dominated by a wide variety ofchlorinated organic solvents.
ANL-6 Pure Non-Halogenated Organic Liquids (X 2220s = 222X)These liquids typically have less than 5% water and are dominated by organicsolvents such as toluene, benzene, etc.
(3000) Process WastesANL-7 Inorganic Particulates (S 3110s+ 3130s = 311X)
Examples include fly ash, ion-exchange resins, inorganic absorbants, aluminumoxides, paint wastes, iron fines, etc.
ANL-8 Inorganic Sludges (I 3120s = 312X)Examples include pond sludge, uncemented inorganic sludges, plating sludges,filter sludge, laundry sludge, etc.
ANL-9 Salt Waste ( I 3140s = 314X)Examples include evaporation bottoms, solid oxidizers, reactive salts, etc.

AD-27
TABLE 1 (Cont.)
(3000) Process Wastes (cont)ANL-10 Solidified Inorganic Process Wastes (I 3150s = 315X)
Examples include cemented pond sludge, cemented fly ashANL-11 Halogenated Organic Particulates and Sludges (X 3210s + 3220s (nonhalogenated)]
Examples include Freon sludge, grease cleaner sludges, solids with absorbedsolvents, etc.
ANL-12 Non-Halogenated Organic Particulates and Sludges [X 3210s+ 3220s(nonhalogenated)]Examples include activated carbon, floor sweepings, oily sludges, etc.
ANL-13 Solid Organic Materials ( I 3230s)&14 Examples include plastic wastes, epoxy wastes, etc.
(4000) Contaminated SoilsANL-15 Contaminated Soil without Debris ( I 4100s)
(5000 Debris)ANL-17 Metal Debris ( I 5100s)
Scrap metals, cadmium-coated high-efficiency particulate air (HEPA) filters,piping, contaminated machine tools, etc.
ANL-18 Inorganic Non-Metal Debris (X 5200s)Glass debris, concrete and brick debris, insulation, asbestos, etc.
ANL-19 Combustible Debris ( I 5300s)Wood, rubber gloves, rags, plastic bags, Teflon, paper, etc.
ANL-20 Heterogeneous Debris (X 5400s)Mercury-contaminated debris, laboratory equipment, paper-metal mixtures,miscellaneous filters, etc.
(6000) Special WastesANL-21 Organic Lab-packs (I 6110s = 611X).ANL-22 Aqueous Lab-packs (I 6120s = 612X).ANL-23 Solid Lab-packs (2 6130s = 613X).
Note: Certain other wastes in the 7000 series are defined as hazardous and are radioactivelycontaminated. These wastes are generally homogeneous. Examples include activatedlead shielding, beryllium initiators, contaminated liquid mercury, discarded activatedbatteries, etc. The waste stream concentrations used in this table can be found inWilkins et al. (1996) and the Mixed Waste Inventory Report (MWIR) (DOE 1994).
Table 3 presents the results of the Areal Locations of Hazardous Atmospheres (ALOHA™)(Reynolds 1992) dispersion model runs for this truck accident scenario. Note that only carbontetrachloride is considered carcinogenic, whereas all 3 chemicals are considered for the "anyadverse effects" end point. A comparison of columns 4 and 5 in the table show that theALOHA™-predicted concentrations are less than the health criteria for both the increasedcarcinogenic risk and the any adverse effects end points. Because this is the worst caseshipment, all other shipments will be zero population risks as well. Consequently, thehazardous components for population risk under all alternatives are all zero, primarily dueto very low release rates because of waste transportation in TRUPACT-IIs.

TABLE 2 Estimated Concentration of Hazardous Constituents in Mixed TRUW by Waste Stream Category
HazardousConstituent
1,1,1-TrichloroethaneCarbon tetrachlorideFreon 113a
Methylene chlorideMethyl alcoholButyl alcoholXyleneTolueneEthyl benzeneCadmiumLeadMercury
HazardousConstituent
1,1,1-TrichloroethaneCarbon tetrachlorideFreon 113a
Methylene chlorideMethyl alcoholButyl alcoholXyleneTolueneEthyl benzeneCadmiumLead
Mercury
Aqueous Liquids (1000)
Cone.
201520
5-7005-255-10
101010
5-10100
(mg/kg)
Mean
201520591171010107100
Soils (4000)
Cone.
20-20015-25
20-2005-7005-255-1010-50
1010
5-100-400
0
(mg/kg)
Mean
63196359117
2210107
63
0
Organic Liquids (2000)(mg/kg)
Cone.
150,00050,00050,000
000000000
Mean
150,00050,00050,000
000000000
Organic Debris(mg/kg)
Cone.
150-2,000150-750
100-2,50050-1,000
000000
5-60,000
0
Mean
548335500224
000000
548
0
Organic Sludge(mg/kg)
Cone.
150,00050,00050,000
000000000
Mean
150,00050,00050,000
000000000
Debris
Heterogenous Debris(mg/kg)
Cone.
1-2,0001-900
1-8,00050-1,000
00000
5-250,00010->10
0
Mean
453089
22400000
1,11810
0
Solid Process Residues (3000)
Cemented Solids(mg/kg)
Cone. Mean
20-20015-25
20-2005-7005-255-1010-50
1010
5-100-400
0
(5000)
InorganicDebris(mg/kg)
Cone. I
151075
200000000
63196359117
2210107
630
Mean
151075
200000000
49,000- 110,68250,000
.000
Inorganic Sludge(mg/kg)
Cone.
20-20015-25
20-2005-7005-255-1010-50
1010
5-1010-400
0
Mean
63196359117
2210107
630
Inorganic NonmetalDebris(mg/kg)
Cone.
1-9001-100
1-8,000200
000000
49,000- :250,00010->10
Mean
301089
200000000
110,680
0
tooo
a Freon 113 = l,l,2-trichloro-l,2,2-trifluoroethane.

AD-29
TABLE 3 Comparison of ALOHA™ Predictions at 100 ft from the Highwayto Health Criteria Limits (ICRC for carcinogenic effectsand PAEC for any effects impacts) — Truck Mode
Molecular Emission ICRC/PAEC ALOHA™ Cone.Chemical Name Weight Rate (kg/h) 1-Hours (ppm) at 100 ft (ppm)
Carcinogenic substancesCarbon tetrachloride
Noncarcinogenic substances1,1,1-TrichloroethaneCarbon tetrachlorideFreon 113a
153.82
133.42153.82187.38
0.13482
0.338940.134820.11298
6.51
7.791.61
166.41
2.15E-01
5.86E-012.15E-011.85E-01
a Freon 113 = l,l,2-trichloro-l,2,2-trifluoroethane.
3 MAXIMALLY EXPOSED INDIVIDUAL — TRUCK MODE
The impacts to the MEI are the same for all alternatives since (1) each alternativehas organic liquids (the most risky shipment in relative terms) being transported on a roador highway in some direction, and (2) the MEI is always 100 ft from the highway roadbecause residents are assumed not to live any closer to highways than that approximatedistance.
The MEI risk calculations were performed using the assumptions and methodsconsistent with those presented in Section 3.3 of the Main Report. The results aresummarized in Tables 4 and 5. The risks to the MEI listed in the tables are very small butare nonzero. The risks shown are consistent with the result of zero population risks becauseonly carcinogenic risks of 10"6 or greater or hazard quotients of 1 or greater would result ina population risk that is reported in this assessment.
Vehicle-related risks are presented in Appendix E of WM PEIS along with theradiological impacts discussion.
4 POPULATION RISKS OF ALTERNATIVES — RAIL MODE
In the truck mode, there are 3 TRUPACT-IIs per truck (14 x 3 = 42 55-gal drumsin all); in the rail mode, there are 6 TRUPACT-IIs per railcar (84 55-gal drums). The truckcapacity is 8.4 m , and the rail payload capacity is double (16.8 m ).
The release rates of volatile chemicals from the railcar accident are computed thesame way as for the truck accident (i.e., same release fraction = 2 x 10~4 for the greatestrelease accidents — severity categories VT-VIII; aerosolized fraction = 100%, and respirablefraction = 100%), and they become exactly twice the release rate for the truck accident.

AD-30
TABLE 4 MEI Lifetime Increased Carcinogenic Risks for MixedTRUW — Truck Mode
Concentration Exposure Inhalationat MEI location time Air intake Slope Factor Carcinogenic
(min/d) rmo/WH) (ms/ks/d)'1 MEI RiskChemical Name (ppm) (mg/kg/d) (mg/kg/dy
Carbon tetrachloride 2.15E-01 60 6.34E-07 5.25E-02 3.3E-08
TABLE 5 MEI Hazard Quotients for Adverse Effect End Point for MixedTRUW — Truck Mode
Chemical Name
1,1,1-TrichloroethaneCarbon tetrachlorideFreon 113
MolecularWeight
133.42153.82187.38
Concentrationat MEI
Location
5.86E-012.15E-011.85E-01
Exposuretime
(min/d)
606060
InhalationAir intake(mg/kg/d)
2.1E-029.1E-039.5E-03
Inhalation R/(mg/kg/d)"1
2.9E-011.7E-028.6E+00
HazardQuotient
7.52E-025.30E-011.11E-03
Table 6 presents the results of the railcar accident. The ALOHA™ predicted thathazardous-chemical concentrations would be less than the health criteria, and, therefore, thepopulation impacts would be zero for all alternatives.
5 MAXIMALLY EXPOSED INDIVIDUAL — RAIL MODE
The railcar accident release rates are twice the truck accident rates, because the rail-cars have a TRUPACT-II capacity of 6 (versus a truck capacity of three). Therefore, the car-cinogenic risks and risks for any adverse effects presented in Tables E.17, E.18, and E.19 ofAppendix E are twice the risks presented for truck mode. The hazard quotient (HQ) to theMEI from carbon tetrachloride is 1.06. This HQ indicates a very borderline potential for anyadverse effects (potential for effects is considered unlikely for HQs less than 1). As a generalguideline, the assumption can be made that the risk of adverse effects is minimal forsubstances with HQ values between 1 and 10 because of the uncertainties and conservatismassociated with the use of EPA reference dose values to evaluate single, brief exposures.Therefore, adverse effects due to carbon tetrachloride exposure would be unlikely unless theMEI receptor was extremely sensitive with respect to chemical exposures. Tables 7 and 8present the results of the railcar accident for carcinogenic and adverse effects to the MEI.
Accident and routine vehicle-related risks from transportation of TRUW arepresented in Part I of Appendix E.

AD-31
TABLE 6 Comparison of ALOHA™ Predictions at 100 ft from the Highwayto Health Criteria Limits (ICRC for carcinogenic effectsand PAEC for any effects impacts) — Rail Mode
Chemical NameMolecular
WeightEmission
Rate (kg/h)ICRC/PAEC
l-Hours(ppm)ALOHA™ Cone,at 100 ft (ppm)
Carcinogenic substancesCarbon tetrachloride 153.82
Noncarcinogenic substances1,1,1-Trichloroethane 133.42Carbon tetrachloride 153.82Freon 113a 187.38
0.26964
0.677880.269640.22596
6.51
7.791.61
166.41
4.30E-01
1.17E+004.30E-013.70E-01
a Freon 113 = l,l,2-trichloro-l,2,2-trifluoroethane.
TABLE 7 MEI Lifetime Increased Carcinogenic Risks for MixedTRUW — Rail Mode
Chemical Name
Carbon tetrachloride
Concentrationat MEI
Location
4.30E-01
ExposureTime
(min/d)
60
InhalationAir Intake(mg/kg/d)
6.34E-07
Slope Factor(mg/kg/d)-1
5.25E-02
CarcinogenicMEI Risk
6.6E-08
TABLE 8 MEI Hazard Quotients for Adverse Effect End Points for MixedTRUW — Rail Mode
Chemical Name
1,1,1-TrichloroethaneCarbon tetrachlorideFreon 113a
Concentration atMEI Location
1.17E+004.30E-013.70E-01
ExposureTime
(min/d)
606060
InhalationAir Intake(mg/kg/d)
2.1E-029.1E-039.5E-03
Inhalation Rf(mg/kg/d)"1
2.9E-011.7E-028.6E+00
HazardQuotient
1.50E-011.06E+002.22E-03
Freon 113 = l,l,2-tricholoro-l,2,2-trifluoroethane.

AD-32
6 SUMMARY AND CONCLUSIONS
The population risks from the hazardous components of TRUW during transportationare zero for all end points — potentially life-threatening health effects, additional cancersabove 1 and 10 , and the any adverse effects end points. This conclusion holds true for bothtruck and rail options and is largely the result of the well-built TRUPACT-II containerstransporting that waste.
Predictions of cancer and any adverse effects risk to the MEI (located 100 ft from theroad) are very small. The increased carcinogenic risks and the HQs are twice as large for theworst case rail accident as for the worst case truck accident since release rates are twice asmuch for the railcar accident case.
7 REFERENCES
DOE, 1994, Mixed Waste Inventory Report: Final Phase II Mixed Inventory Report Data,EM-352, U.S. Department of Energy, Washington, D.C., May.
DOT, 1990, The 1990 Emergency Response Guidebook, DOT P 5800.5, Research and SpecialPrograms Administration, Office of Hazardous Materials Transportation, U.S. Departmentof Transportation, Washington, D.C.
DOT, 1993, Hazardous Materials Information Reporting System Database, Research andSpecial Programs Administration — Hazardous Materials Safety, U.S. Department ofTransportation, Washington, D.C.
Reynolds, R.M., 1992, ALOHA™ (Areal Locations of Hazardous Atmospheres) 5.0: TheoreticalDescription, NOAA-TM NOS ORCA-65, National Oceanic and Atmospheric Administration,Seattle, Wash., Aug.
Wilkins, B.D., et al., 1996, Low-Level Mixed Waste Inventory, Characteristics, Generation, andFacility Assessment for Treatment, Storage, and Disposal Alternatives Considered in theU.S. Department of Energy Waste Management Programmatic Environmental ImpactStatement, ANL/EAD/TM-32, Argonne National Laboratory, Argonne, 111.
Related Documents