Principles of Managerial Finance Solution Lawrence J. Gitman Find out more at www.kawsarbd1.weebly.com Last saved and edited by Md.Kawsar Siddiqui 263 CHAPTER 10 Risk and Refinements In Capital Budgeting INSTRUCTOR’S RESOURCES Overview Chapters 8 and 9 developed the major decision-making aspects of capital budgeting. Cash flows and budgeting models have been integrated and discussed in providing the principles of capital budgeting. However, there are more complex issues beyond those presented. Chapter 10 expands capital budgeting to consider risk with such methods as sensitivity analysis, scenario analysis, and simulation. Capital budgeting techniques used to evaluate international projects, as well as the special risks multinational companies face, are also presented. Additionally, two basic risk-adjustment techniques are examined: certainty equivalents and risk-adjusted discount rates. PMF DISK PMF Tutor A topic covered for this is risk-adjusted discount rates (RADRs). PMF Problem-Solver: Capital Budgeting Techniques This module allows the student to compare the annualized net present value of projects with unequal lives. PMF Templates No spreadsheet templates are provided for this chapter. Study Guide There are no particular Study Guide examples suggested for classroom presentation.

Welcome message from author
This document is posted to help you gain knowledge. Please leave a comment to let me know what you think about it! Share it to your friends and learn new things together.
Transcript

Principles of Managerial Finance Solution Lawrence J. Gitman
Find out more at www.kawsarbd1.weebly.com Last saved and edited by Md.Kawsar Siddiqui 263
CHAPTER 10
Risk and Refinements In Capital Budgeting
INSTRUCTOR’S RESOURCES Overview Chapters 8 and 9 developed the major decision-making aspects of capital budgeting. Cash flows and budgeting models have been integrated and discussed in providing the principles of capital budgeting. However, there are more complex issues beyond those presented. Chapter 10 expands capital budgeting to consider risk with such methods as sensitivity analysis, scenario analysis, and simulation. Capital budgeting techniques used to evaluate international projects, as well as the special risks multinational companies face, are also presented. Additionally, two basic risk-adjustment techniques are examined: certainty equivalents and risk-adjusted discount rates. PMF DISK PMF Tutor A topic covered for this is risk-adjusted discount rates (RADRs). PMF Problem-Solver: Capital Budgeting Techniques This module allows the student to compare the annualized net present value of projects with unequal lives. PMF Templates No spreadsheet templates are provided for this chapter. Study Guide There are no particular Study Guide examples suggested for classroom presentation.

Part 3 Long-Term Investment Decisions
Find out more at www.kawsarbd1.weebly.com Last saved and edited by Md.Kawsar Siddiqui 264
ANSWERS TO REVIEW QUESTIONS 10-1 There is usually a significant degree of uncertainty associated with capital budgeting projects. There is the
usual business risk along with the fact that future cash flows are an estimate and do not represent exact values. This uncertainty exists for both independent and mutually exclusive projects. The risk associated with any single project has the capability to change the entire risk of the firm. The firm's assets are like a portfolio of assets. If an accepted capital budgeting project has a risk different from the average risk of the assets in the firm, it will cause a shift in the overall risk of the firm.
10-2 Risk, in terms of cash inflows from a project, is the variability of expected cash flows, hence the expected
returns, of the given project. The breakeven cash inflow⎯the level of cash inflow necessary in order for the project to be acceptable⎯may be compared with the probability of that inflow occurring. When comparing two projects with the same breakeven cash inflows, the project with the higher probability of occurrence is less risky.
10-3 a. Sensitivity analysis uses a number of possible inputs (cash inflows) to assess their impact on the firm's
return (NPV). In capital budgeting, the NPVs are estimated for the pessimistic, most likely, and optimistic cash flow estimates. By subtracting the pessimistic outcome NPV from the optimistic outcome NPV, a range of NPVs can be determined.
b. Scenario analysis is used to evaluate the impact on return of simultaneous changes in a number of
variables, such as cash inflows, cash outflows, and the cost of capital, resulting from differing assumptions relative to economic and competitive conditions. These return estimates can be used to roughly assess the risk involved with respect to the level of inflation.
c. Simulation is a statistically based approach using random numbers to simulate various cash flows
associated with the project, calculating the NPV or IRR on the basis of these cash flows, and then developing a probability distribution of each project's rate of returns based on NPV or IRR criterion.
10-4 a. Multinational companies (MNCs) must consider the effect of exchange rate risk, the risk that the
exchange rate between the dollar and the currency in which the project's cash flows are denominated will reduce the project's future cash flows. If the value of the dollar depreciates relative to that currency, the market value of the project's cash flows will decrease as a result. Firms can use hedging to protect themselves against this risk in the short term; for the long term, financing the project using local currency can minimize this risk.
b. Political risk, the risk that a foreign government's actions will adversely affect the project, makes international projects particularly risky, because it cannot be predicted in advance. To take this risk into account, managers should either adjust expected cash flows or use risk-adjusted discount rates when performing the capital budgeting analysis. Adjustment of cash flows is the preferred method.
c. Tax laws differ from country to country. Because only after-tax cash flows are relevant for capital
budgeting decisions, managers must account for all taxes paid to foreign governments and consider the effect of any foreign tax payments on the firm's U.S. tax liability.
d. Transfer pricing refers to the prices charged by a corporation's subsidiaries for goods and services
traded between them; the prices are not set by the open market. In terms of capital budgeting
Chapter 10 Risk and Refinements in Capital Budgeting
Find out more at www.kawsarbd1.weebly.com Last saved and edited by Md.Kawsar Siddiqui 265
decisions, managers should be sure that transfer prices accurately reflect actual costs and incremental cash flows.
e. MNCs cannot evaluate international capital projects from only a financial perspective. The strategic
viewpoint often is the determining factor in deciding whether or not to undertake a project. In fact, a project that is less acceptable on a purely financial basis than another may be chosen for strategic reasons. Some reasons for MNC foreign investment include continued market access, the ability to compete with local companies, political and/or social reasons (for example, gaining favorable tax treatment in exchange for creating new jobs in a country), and achievement of a particular corporate objective such as obtaining a reliable source of raw materials.
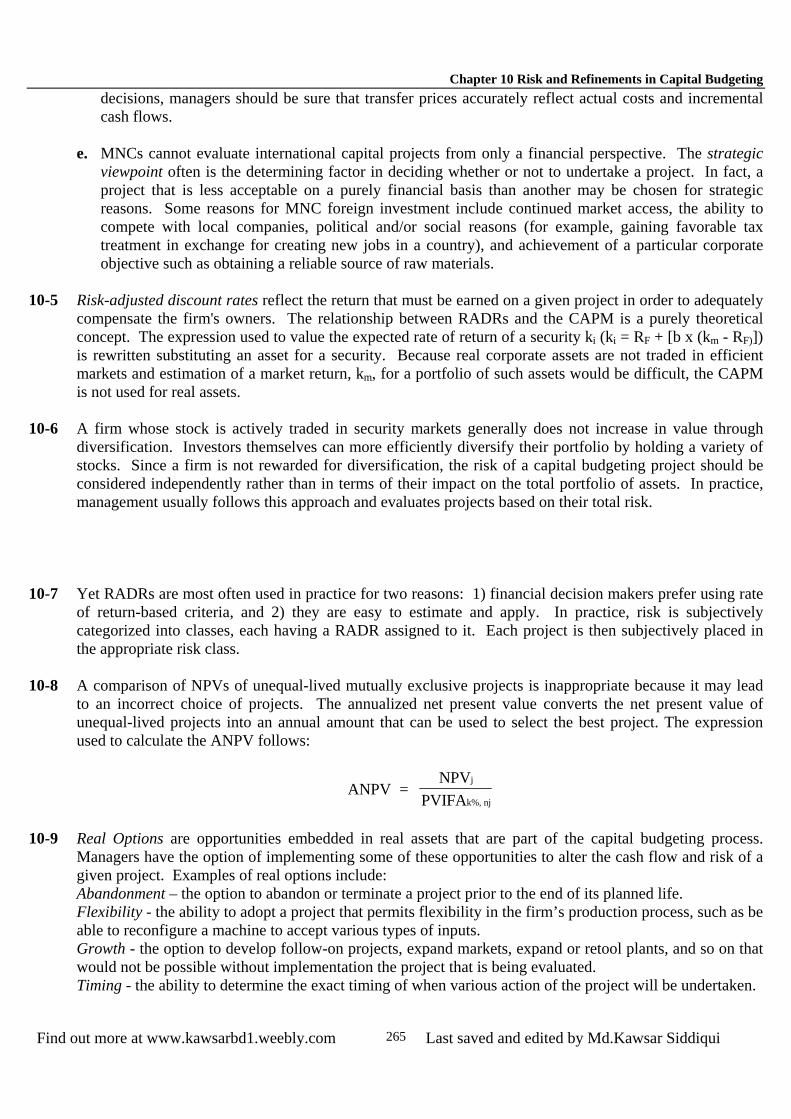
10-5 Risk-adjusted discount rates reflect the return that must be earned on a given project in order to adequately
compensate the firm's owners. The relationship between RADRs and the CAPM is a purely theoretical concept. The expression used to value the expected rate of return of a security ki (ki = RF + [b x (km - RF)]) is rewritten substituting an asset for a security. Because real corporate assets are not traded in efficient markets and estimation of a market return, km, for a portfolio of such assets would be difficult, the CAPM is not used for real assets.
10-6 A firm whose stock is actively traded in security markets generally does not increase in value through
diversification. Investors themselves can more efficiently diversify their portfolio by holding a variety of stocks. Since a firm is not rewarded for diversification, the risk of a capital budgeting project should be considered independently rather than in terms of their impact on the total portfolio of assets. In practice, management usually follows this approach and evaluates projects based on their total risk.
10-7 Yet RADRs are most often used in practice for two reasons: 1) financial decision makers prefer using rate
of return-based criteria, and 2) they are easy to estimate and apply. In practice, risk is subjectively categorized into classes, each having a RADR assigned to it. Each project is then subjectively placed in the appropriate risk class.
10-8 A comparison of NPVs of unequal-lived mutually exclusive projects is inappropriate because it may lead
to an incorrect choice of projects. The annualized net present value converts the net present value of unequal-lived projects into an annual amount that can be used to select the best project. The expression used to calculate the ANPV follows:
ANPV = NPV
PVIFAj
k%, nj
10-9 Real Options are opportunities embedded in real assets that are part of the capital budgeting process.
Managers have the option of implementing some of these opportunities to alter the cash flow and risk of a given project. Examples of real options include: Abandonment – the option to abandon or terminate a project prior to the end of its planned life. Flexibility - the ability to adopt a project that permits flexibility in the firm’s production process, such as be able to reconfigure a machine to accept various types of inputs. Growth - the option to develop follow-on projects, expand markets, expand or retool plants, and so on that would not be possible without implementation the project that is being evaluated. Timing - the ability to determine the exact timing of when various action of the project will be undertaken.

Part 3 Long-Term Investment Decisions
Find out more at www.kawsarbd1.weebly.com Last saved and edited by Md.Kawsar Siddiqui 266
10-10 Strategic NPV incorporates the value of the real options associated with the project while traditional NPV includes only the identifiable relevant cash flows. Using strategic NPV could alter the final accept/reject decision. It is likely to lead to more accept decisions since the value of the options is added to the traditional NPV as shown in the following equation.
NPVstrategic = NPVtraditional = Value of real options
10-11 Capital rationing is a situation where a firm has only a limited amount of funds available for capital
investments. In most cases, implementation of the acceptable projects would require more capital than is available. Capital rationing is common for a firm, since unfortunately most firms do not have sufficient capital available to invest in all acceptable projects. In theory, capital rationing should not exist because firms should accept all projects with positive NPVs or IRRs greater than the cost of capital. However, most firms operate with finite capital expenditure budgets and must select the best from all acceptable projects, taking into account the amount of new financing required to fund these projects.
10-12 The internal rate of return approach and the net present value approach to capital rationing both involve
ranking projects on the basis of IRRs. Using the IRR approach, a cut-off rate and a budget constraint are imposed. The NPV first ranks projects by IRR and then takes into account the present value of the benefits from each project in order to determine the combination with the highest overall net present value. The benefit of the NPV approach is that it guarantees a maximum dollar return to the firm, whereas the IRR approach does not.

Chapter 10 Risk and Refinements in Capital Budgeting
Find out more at www.kawsarbd1.weebly.com Last saved and edited by Md.Kawsar Siddiqui 267
SOLUTIONS TO PROBLEMS 10-1 LG 1: Recognizing Risk a. & b.
Project Risk ReasonA Low the cash flows from the project can be easily determined since this
expenditure consists strictly of outflows. The amount is also relatively small.
B Medium the competitive nature of the industry makes it so that Caradine will need to make this expenditure to remain competitive. The risk is only moderate since the firm already has clients in place to use the new technology.
C Medium Since the firm is only preparing a proposal; their commitment at this time is low. However, the $450,000 is a large sum of money for the company and it will immediately become a sunk cost.
D High although this purchase is in the industry in which Caradine normally operates; they are encountering a large amount of risk. The large expenditure, the competitiveness of the industry, and the political and exchange risk of operating in a foreign country adds to the uncertainty.
NOTE: Other answers are possible depending on the assumptions a student may make. There is too little information given about the firm and industry to establish a definitive risk analysis.
10-2 LG 2: Breakeven Cash Flows a. $35,000 = CF(PVIFA14%,12)
$35,000 = CF (5.66) CF = $6,183.75 Calculator solution: $6,183.43
b. $35,000 = CF(PVIFA10%,12)
$35,000 = CF (6.814) CF = $5,136.48 Calculator solution: $5,136.72
The required cash flow per year would decrease by $1,047.27.
10-3 LG 2: Breakeven Cash Inflows and Risk a. Project X Project Y
PVn = PMT x (PVIFA15%,5 yrs.) PVn = PMT x (PVIFA15%,5 yrs.) PVn = $10,000 x (3.352) PVn = $15,000 x (3.352) PVn = $33,520 PVn = $50,280
NPV = PVn - Initial investment NPV = PVn - Initial investment NPV = $33,520 - $30,000 NPV = $50,280 - $40,000 NPV = $3,520 NPV = $10,280 Calculator solution: $3,521.55 Calculator solution: $10,282.33

Part 3 Long-Term Investment Decisions
Find out more at www.kawsarbd1.weebly.com Last saved and edited by Md.Kawsar Siddiqui 268
b. Project X Project Y
$CF x 3.352 = $30,000 $CF x 3.352 = $40,000 $CF = $30,000 ÷ 3.352 $CF = $40,000 ÷ 3.352 $CF = $8,949.88 $CF = $11,933.17
c. Project X Project Y
Probability = 60% Probability = 25% d. Project Y is more risky and has a higher potential NPV. Project X has less risk and less return while
Project Y has more risk and more return, thus the risk-return trade-off. e. Choose Project X to minimize losses; to achieve higher NPV, choose Project Y. 10-4 LG 2: Basic Sensitivity Analysis a. Range A = $1,800 - $200 = $1,600 Range B = $1,100 - $900 = $200 b. NPV
Outcome Project A Project B Calculator Calculator
Table Value Solution Table Value Solution Pessimistic - $ 6,297 - $ 6,297.29 - $ 337 - $ 337.79 Most likely 514 513.56 514 513.56 Optimistic 7,325 7,324.41 1,365 1,364.92 Range $13,622 $13,621.70 $1,702 $1,702.71
c. Since the initial investment of projects A and B are equal, the range of cash flows and the range of NPVs
are consistent. d. Project selection would depend upon the risk disposition of the management. (A is more risky than B but
also has the possibility of a greater return.) 10-5 LG 4: Sensitivity Analysis a. Range P = $1,000 - $500 = $500
Range Q = $1,200 - $400 = $800 b. NPV
Outcome Project A Project B Calculator Calculator Table Value Solution Table Value Solution
Pessimistic $73 $ 72.28 -$ 542 -$ 542.17 Most likely 1,609 1,608.43 1,609 1,608.43 Optimistic 3,145 3,144.57 4,374 4,373.48
c. Range P = $3,145 - $73 = $3,072 (Calculator solution: $3,072.29)
Range Q = $4,374 - (-$542) = $4,916 (Calculator solution: $4,915.65)

Chapter 10 Risk and Refinements in Capital Budgeting
Find out more at www.kawsarbd1.weebly.com Last saved and edited by Md.Kawsar Siddiqui 269
Each computer has the same most likely result. Computer Q has both a greater potential loss and a greater potential return. Therefore, the decision will depend on the risk disposition of management.
10-6 LG 2: Simulation a. Ogden Corporation could use a computer simulation to generate the respective profitability distributions
through the generation of random numbers. By tying various cash flow assumptions together into a mathematical model and repeating the process numerous times, a probability distribution of project returns can be developed. The process of generating random numbers and using the probability distributions for cash inflows and outflows allows values for each of the variables to be determined. The use of the computer also allows for more sophisticated simulation using components of cash inflows and outflows. Substitution of these values into the mathematical model yields the NPV. The key lies in formulating a mathematical model that truly reflects existing relationships.
b. The advantages to computer simulations include the decision maker's ability to view a continuum of risk-
return trade-offs instead of a single-point estimate. The computer simulation, however, is not feasible for risk analysis.
10-7 LG 4: Risk–Adjusted Discount Rates-Basic a. Project E:
PVn = $6,000 x (PVIFA15%,4) PVn = $6,000 x 2.855 PVn = $17,130
NPV = $17,130 - $15,000 NPV = $2,130 Calculator solution: $2,129.87
Project F: Year CF PVIF15%,n PV
1 $6,000 .870 $5,220 2 4,000 .756 3,024 3 5,000 .658 3,290 4 2,000 .572 1,144
$12,678
NPV = $12,678 - $11,000 NPV = $1,678 Calculator solution: $1,673.05
Project G: Year CF PVIF15%,n PV
Part 3 Long-Term Investment Decisions
Find out more at www.kawsarbd1.weebly.com Last saved and edited by Md.Kawsar Siddiqui 270
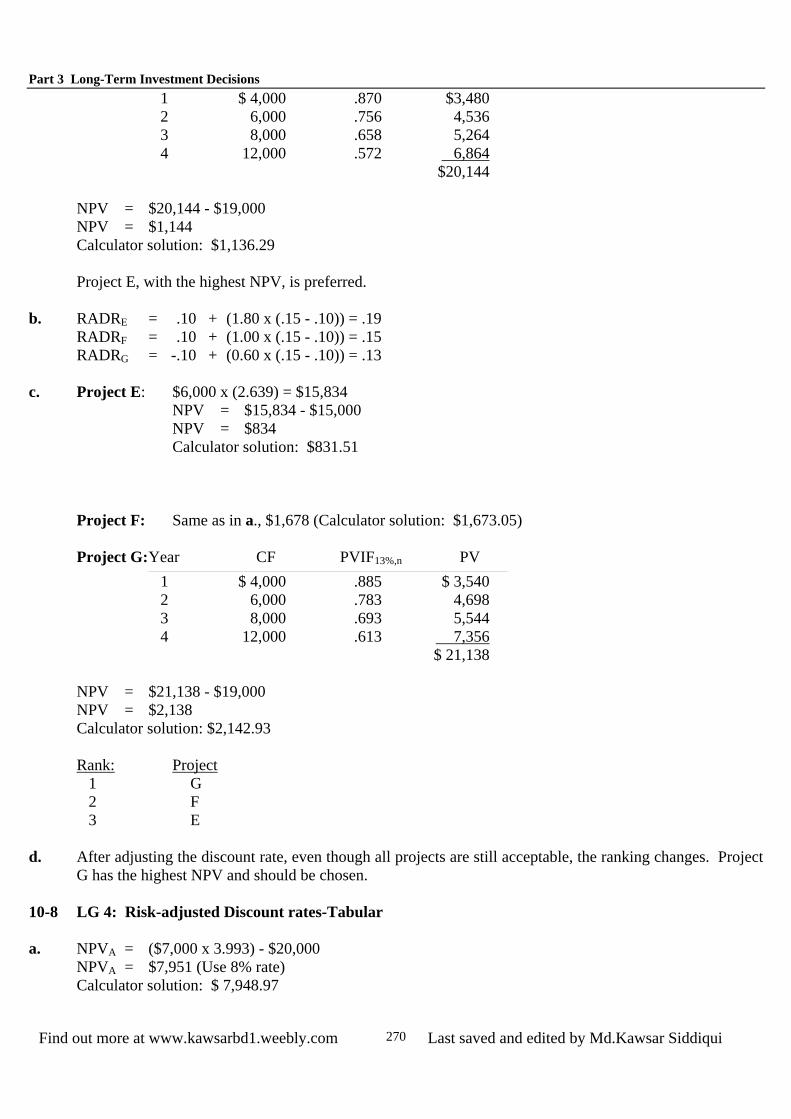
1 $ 4,000 .870 $3,480 2 6,000 .756 4,536 3 8,000 .658 5,264 4 12,000 .572 6,864
$20,144
NPV = $20,144 - $19,000 NPV = $1,144 Calculator solution: $1,136.29
Project E, with the highest NPV, is preferred.
b. RADRE = .10 + (1.80 x (.15 - .10)) = .19
RADRF = .10 + (1.00 x (.15 - .10)) = .15 RADRG = -.10 + (0.60 x (.15 - .10)) = .13
c. Project E: $6,000 x (2.639) = $15,834
NPV = $15,834 - $15,000 NPV = $834 Calculator solution: $831.51
Project F: Same as in a., $1,678 (Calculator solution: $1,673.05)
Project G: Year CF PVIF13%,n PV
1 $ 4,000 .885 $ 3,540 2 6,000 .783 4,698 3 8,000 .693 5,544 4 12,000 .613 7,356
$ 21,138
NPV = $21,138 - $19,000 NPV = $2,138 Calculator solution: $2,142.93
Rank: Project
1 G 2 F 3 E
d. After adjusting the discount rate, even though all projects are still acceptable, the ranking changes. Project
G has the highest NPV and should be chosen. 10-8 LG 4: Risk-adjusted Discount rates-Tabular a. NPVA = ($7,000 x 3.993) - $20,000
NPVA = $7,951 (Use 8% rate) Calculator solution: $ 7,948.97

Chapter 10 Risk and Refinements in Capital Budgeting
Find out more at www.kawsarbd1.weebly.com Last saved and edited by Md.Kawsar Siddiqui 271
NPVB = ($10,000 x 3.443) - $30,000 NPVB = $4,330 (Use 14% rate) Calculator solution: $ 4,330.81 Project A, with the higher NPV, should be chosen.
b. Project A is preferable to Project B, since the net present value of A is greater than the net present value of
B. 10-9 LG 4: Risk-adjusted Rates of Return using CAPM a. kX = 7% + 1.2(12% - 7%) = 7% + 6% = 13%
kY = 7% + 1.4(12% - 7%) = 7% + 7% = 14%
NPVX = $30,000(PVIFA13%,4) - $70,000 NPVX = $30,000(2.974) - $70,000 NPVX = $89,220 - $70,000 = $19,220
NPVY = $22,000(PVIF14%,1) + $32,000(PVIF14%,2) + $38,000(PVIF14%3) + $46,000(PVIF14%,4) - $70,000 NPVY = $22,000(.877) + $32,000(.769) + $38,000(.675) + $46,000(.592) - $70,000 NPVY = $19,294 + $24,608 + $25,650 + $27,232 - 70,000 = $26,784
b. The RADR approach prefers Y over X. The RADR approach combines the risk adjustment and the time
adjustment in a single value. The RADR approach is most often used in business. 10-10 LG 4: Risk Classes and RADR a. Project X: Year CF PVIF22%,n PV
1 $80,000 .820 $65,600 2 70,000 .672 47,040 3 60,000 .551 33,060 4 60,000 .451 27,060 5 60,000 .370 22,200
$194,960 NPV = $194,960 - $180,000 NPV = $14,960 Calculator solution: $14,930.45
Project Y: Year CF PVIF13%,n PV
1 $50,000 .885 $ 44,250 2 60,000 .783 46,980 3 70,000 .693 48,510 4 80,000 .613 49,040 5 90,000 .543 48,870
$237,650
NPV = $237,650 - $235,000 NPV = $2,650 Calculator solution: $2,663.99

Part 3 Long-Term Investment Decisions
Find out more at www.kawsarbd1.weebly.com Last saved and edited by Md.Kawsar Siddiqui 272
Project Z: Year CF PVIFA15%,5 PV
1 $90,000 2 $90,000 3 $90,000 3.352 $ 301,680 4 $90,000 5 $90,000
NPV = $ 301,680 - $ 310,000 NPV = - $ 8,320 Calculator solution: -$8,306.04
b. Projects X and Y are acceptable with positive NPV's, while Project Z with a negative NPV is not. Project X with the highest NPV should be undertaken.
10-11 LG 5: Unequal Lives–ANPV Approach a. Machine A
PVn = PMT x (PVIFA12%,6 yrs.) PVn = $12,000 x (4.111) PVn = $49,332
NPV = PVn - Initial investment NPV = $ 49,332 - $ 92,000 NPV = - $ 42,668 Calculator solution: - $ 42,663.11
Machine B Year CF PVIFA12%,n PV
1 $10,000 .893 $ 8,930 2 20,000 .797 15,940 3 30,000 .712 21,360 4 40,000 .636 25,440
$ 71,670 NPV = $71,670 - $65,000 NPV = $6,670 Calculator solution: $6,646.58
Machine C PVn = PMT x (PVIFA12%,5 yrs.) PVn = $ 30,000 x 3.605 PVn = $ 108,150
NPV = PVn - Initial investment NPV = $ 108,150 - $ 100,500 NPV = $ 7,650 Calculator solution: $ 7,643.29
Rank Project
1 C 2 B 3 A
Chapter 10 Risk and Refinements in Capital Budgeting
Find out more at www.kawsarbd1.weebly.com Last saved and edited by Md.Kawsar Siddiqui 273
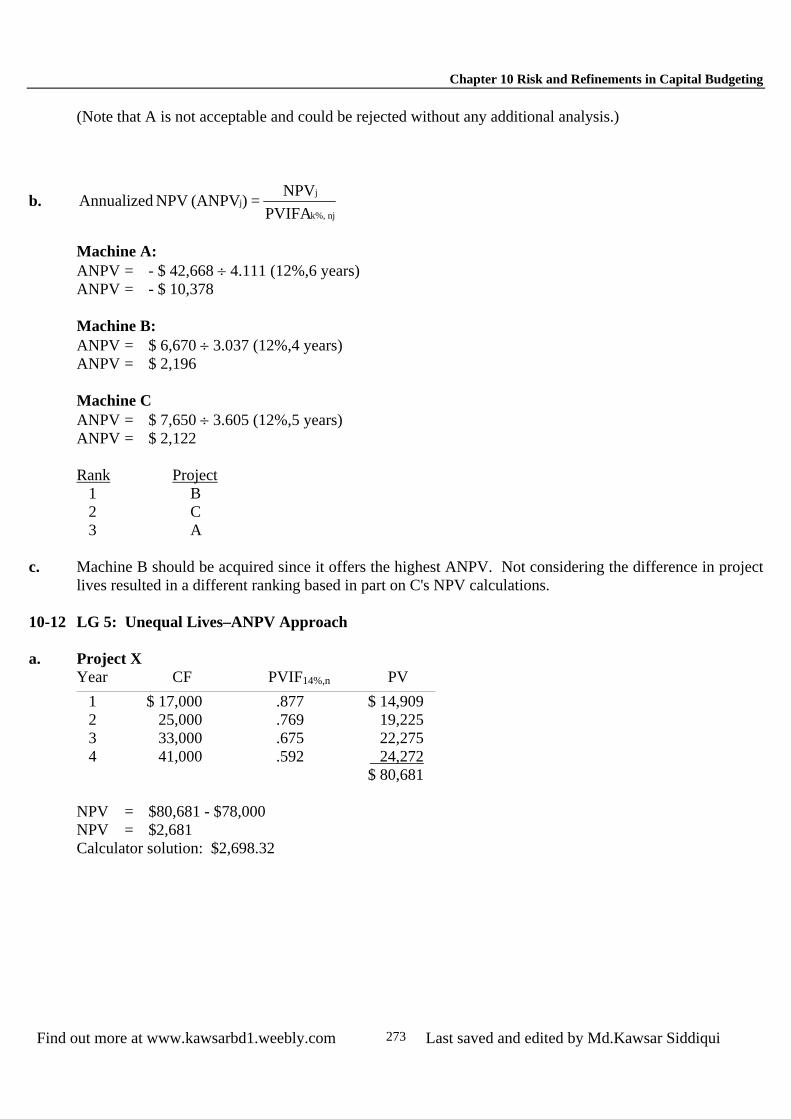
(Note that A is not acceptable and could be rejected without any additional analysis.)
b. njk%,
jj
PVIFANPV=)(ANPV NPV Annualized
Machine A: ANPV = - $ 42,668 ÷ 4.111 (12%,6 years) ANPV = - $ 10,378
Machine B: ANPV = $ 6,670 ÷ 3.037 (12%,4 years) ANPV = $ 2,196
Machine C ANPV = $ 7,650 ÷ 3.605 (12%,5 years) ANPV = $ 2,122
Rank Project
1 B 2 C 3 A
c. Machine B should be acquired since it offers the highest ANPV. Not considering the difference in project
lives resulted in a different ranking based in part on C's NPV calculations. 10-12 LG 5: Unequal Lives–ANPV Approach a. Project X
Year CF PVIF14%,n PV
1 $ 17,000 .877 $ 14,909 2 25,000 .769 19,225 3 33,000 .675 22,275 4 41,000 .592 24,272
$ 80,681
NPV = $80,681 - $78,000 NPV = $2,681 Calculator solution: $2,698.32

Part 3 Long-Term Investment Decisions
Find out more at www.kawsarbd1.weebly.com Last saved and edited by Md.Kawsar Siddiqui 274
Project Y Year CF PVIF14%,n PV
1 $ 28,000 .877 $ 24,556 2 38,000 .769 29,222
$ 53,778
NPV = $53,778 - $52,000 NPV = $1,778 Calculator solution: $1,801.17
Project Z PVn = PMT x (PVIFA14%,8 yrs.) PVn = $15,000 x 4.639 PVn = $69,585
NPV = PVn - Initial investment NPV = $69,585 - $66,000 NPV = $3,585 Calculator solution: $3,582.96
Rank Project
1 Z 2 X 3 Y
b. njk%,
jj
PVIFANPV=)(ANPV NPV Annualized
Project X ANPV = $2,681 ÷ 2.914 (14%,4 yrs.) ANPV = $920.04
Project Y ANPV = $1,778 ÷ 1.647 (14%,2 yrs.) ANPV = $1,079.54
Project Z ANPV = $3,585 ÷ 4.639 (14%, 8 yrs.) ANPV = $772.80
Rank Project
1 Y 2 X 3 Z
c. Project Y should be accepted. The results in a and b show the difference in NPV when differing lives are
considered. 10-13 LG 5: Unequal Lives–ANPV Approach a. Sell
Chapter 10 Risk and Refinements in Capital Budgeting
Find out more at www.kawsarbd1.weebly.com Last saved and edited by Md.Kawsar Siddiqui 275
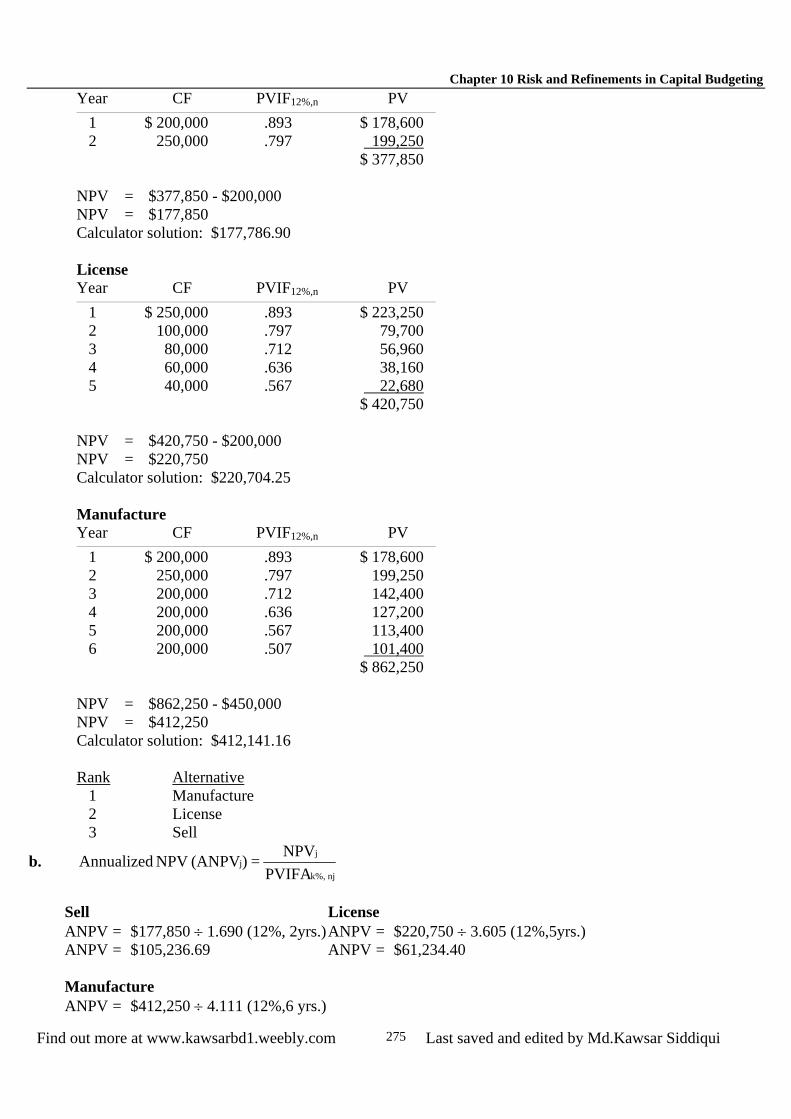
Year CF PVIF12%,n PV
1 $ 200,000 .893 $ 178,600 2 250,000 .797 199,250
$ 377,850
NPV = $377,850 - $200,000 NPV = $177,850 Calculator solution: $177,786.90
License Year CF PVIF12%,n PV
1 $ 250,000 .893 $ 223,250 2 100,000 .797 79,700 3 80,000 .712 56,960 4 60,000 .636 38,160 5 40,000 .567 22,680
$ 420,750
NPV = $420,750 - $200,000 NPV = $220,750 Calculator solution: $220,704.25
Manufacture Year CF PVIF12%,n PV
1 $ 200,000 .893 $ 178,600 2 250,000 .797 199,250 3 200,000 .712 142,400 4 200,000 .636 127,200 5 200,000 .567 113,400 6 200,000 .507 101,400
$ 862,250
NPV = $862,250 - $450,000 NPV = $412,250 Calculator solution: $412,141.16
Rank Alternative
1 Manufacture 2 License 3 Sell
b. njk%,
jj
PVIFANPV=)(ANPV NPV Annualized
Sell License ANPV = $177,850 ÷ 1.690 (12%, 2yrs.) ANPV = $220,750 ÷ 3.605 (12%,5yrs.) ANPV = $105,236.69 ANPV = $61,234.40
Manufacture ANPV = $412,250 ÷ 4.111 (12%,6 yrs.)
Part 3 Long-Term Investment Decisions
Find out more at www.kawsarbd1.weebly.com Last saved and edited by Md.Kawsar Siddiqui 276
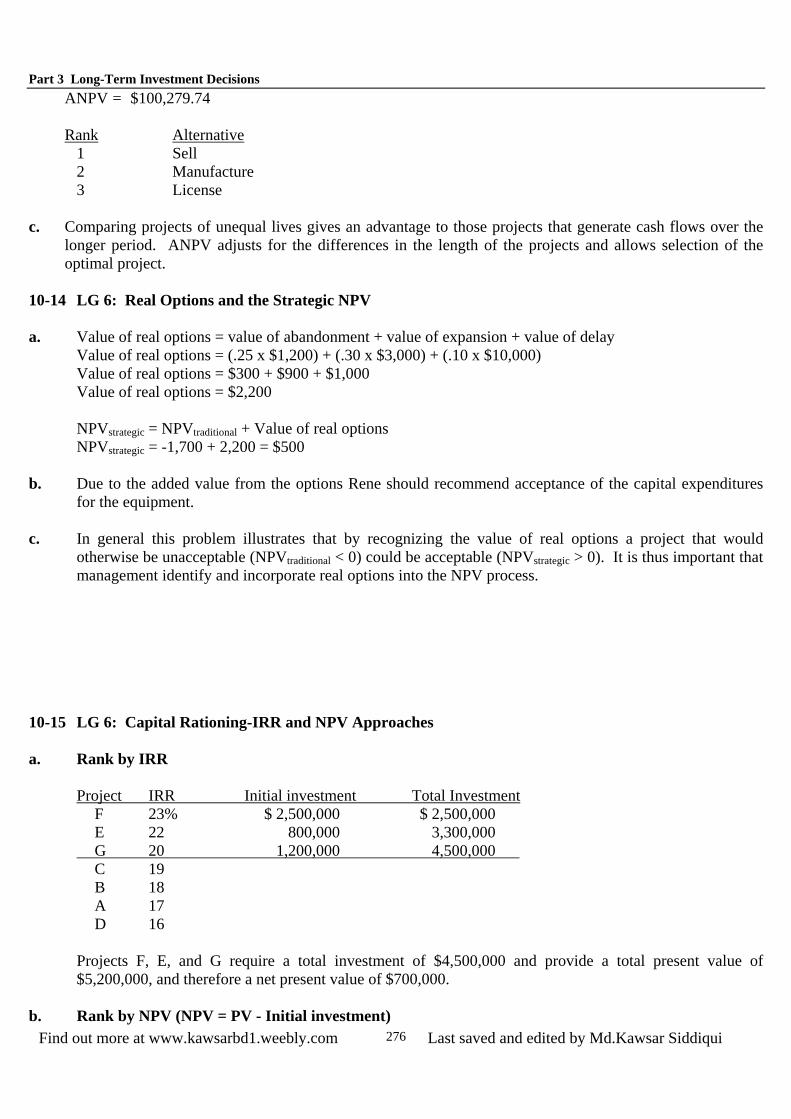
ANPV = $100,279.74
Rank Alternative 1 Sell 2 Manufacture 3 License
c. Comparing projects of unequal lives gives an advantage to those projects that generate cash flows over the
longer period. ANPV adjusts for the differences in the length of the projects and allows selection of the optimal project.
10-14 LG 6: Real Options and the Strategic NPV a. Value of real options = value of abandonment + value of expansion + value of delay
Value of real options = (.25 x $1,200) + (.30 x $3,000) + (.10 x $10,000) Value of real options = $300 + $900 + $1,000 Value of real options = $2,200
NPVstrategic = NPVtraditional + Value of real options NPVstrategic = -1,700 + 2,200 = $500
b. Due to the added value from the options Rene should recommend acceptance of the capital expenditures
for the equipment. c. In general this problem illustrates that by recognizing the value of real options a project that would
otherwise be unacceptable (NPVtraditional < 0) could be acceptable (NPVstrategic > 0). It is thus important that management identify and incorporate real options into the NPV process.
10-15 LG 6: Capital Rationing-IRR and NPV Approaches a. Rank by IRR
Project IRR Initial investment Total Investment F 23% $ 2,500,000 $ 2,500,000 E 22 800,000 3,300,000
G 20 1,200,000 4,500,000 C 19 B 18 A 17 D 16
Projects F, E, and G require a total investment of $4,500,000 and provide a total present value of $5,200,000, and therefore a net present value of $700,000.
b. Rank by NPV (NPV = PV - Initial investment)
Chapter 10 Risk and Refinements in Capital Budgeting
Find out more at www.kawsarbd1.weebly.com Last saved and edited by Md.Kawsar Siddiqui 277
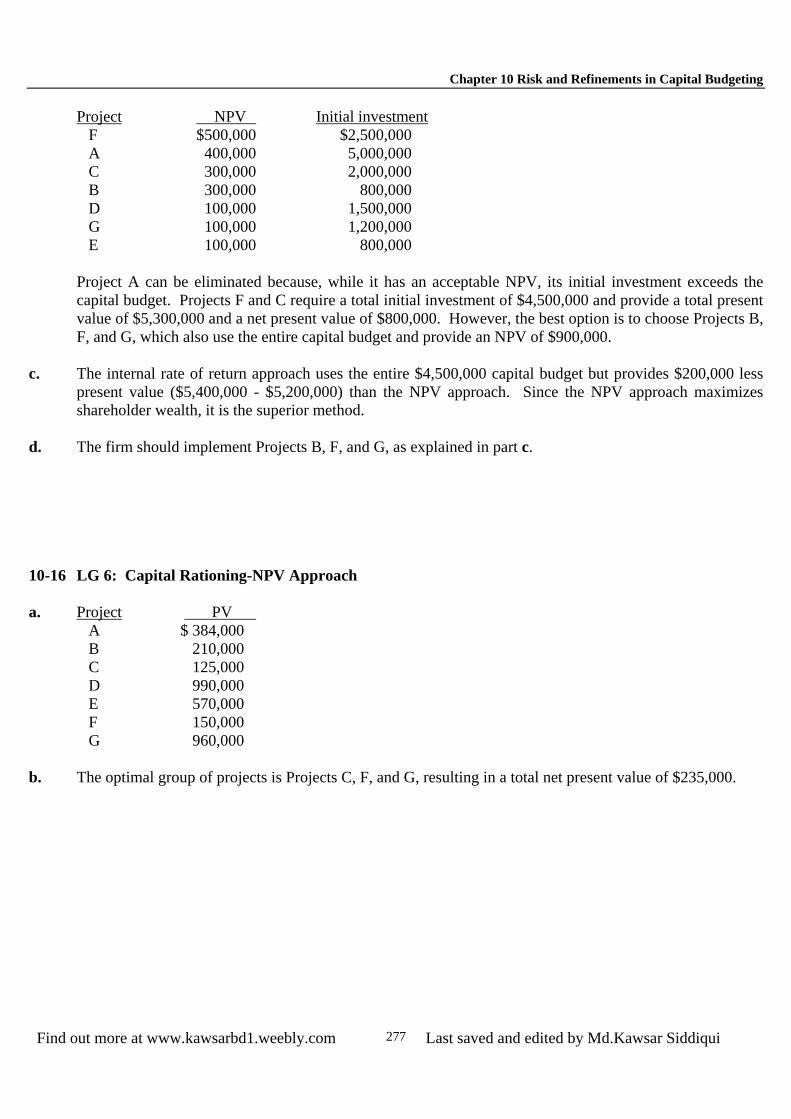
Project NPV Initial investment
F $500,000 $2,500,000 A 400,000 5,000,000 C 300,000 2,000,000 B 300,000 800,000 D 100,000 1,500,000 G 100,000 1,200,000 E 100,000 800,000
Project A can be eliminated because, while it has an acceptable NPV, its initial investment exceeds the capital budget. Projects F and C require a total initial investment of $4,500,000 and provide a total present value of $5,300,000 and a net present value of $800,000. However, the best option is to choose Projects B, F, and G, which also use the entire capital budget and provide an NPV of $900,000.
c. The internal rate of return approach uses the entire $4,500,000 capital budget but provides $200,000 less
present value ($5,400,000 - $5,200,000) than the NPV approach. Since the NPV approach maximizes shareholder wealth, it is the superior method.
d. The firm should implement Projects B, F, and G, as explained in part c. 10-16 LG 6: Capital Rationing-NPV Approach a. Project PV
A $ 384,000 B 210,000 C 125,000 D 990,000 E 570,000 F 150,000 G 960,000
b. The optimal group of projects is Projects C, F, and G, resulting in a total net present value of $235,000.
Part 3 Long-Term Investment Decisions
Find out more at www.kawsarbd1.weebly.com Last saved and edited by Md.Kawsar Siddiqui 278
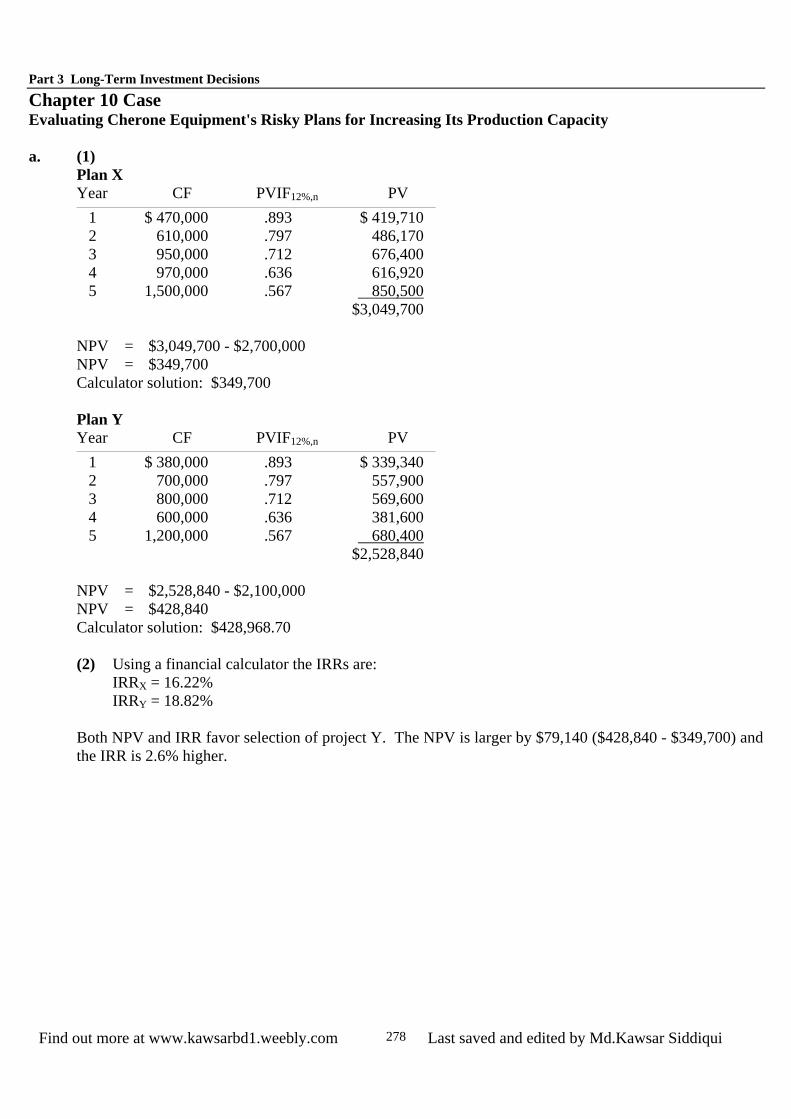
Chapter 10 Case Evaluating Cherone Equipment's Risky Plans for Increasing Its Production Capacity a. (1)
Plan X Year CF PVIF12%,n PV
1 $ 470,000 .893 $ 419,710 2 610,000 .797 486,170 3 950,000 .712 676,400 4 970,000 .636 616,920 5 1,500,000 .567 850,500
$3,049,700
NPV = $3,049,700 - $2,700,000 NPV = $349,700 Calculator solution: $349,700
Plan Y Year CF PVIF12%,n PV
1 $ 380,000 .893 $ 339,340 2 700,000 .797 557,900 3 800,000 .712 569,600 4 600,000 .636 381,600 5 1,200,000 .567 680,400
$2,528,840
NPV = $2,528,840 - $2,100,000 NPV = $428,840 Calculator solution: $428,968.70
(2) Using a financial calculator the IRRs are:
IRRX = 16.22% IRRY = 18.82%
Both NPV and IRR favor selection of project Y. The NPV is larger by $79,140 ($428,840 - $349,700) and the IRR is 2.6% higher.

Chapter 10 Risk and Refinements in Capital Budgeting
Find out more at www.kawsarbd1.weebly.com Last saved and edited by Md.Kawsar Siddiqui 279
b. Plan X Year CF PVIF13%,n PV
1 $ 470,000 .885 $ 415,950 2 610,000 .783 477,630 3 950,000 .693 658,350 4 970,000 .613 594,610 5 1,500,000 .543 814,500
$2,961,040
NPV = $2,961,040 - $2,700,000 NPV = $261,040 Calculator solution: $261,040
Plan Y Year CF PVIF15%,n PV
1 $ 380,000 .870 $ 330,600 2 700,000 .756 529,200 3 800,000 .658 526,400 4 600,000 .572 343,200 5 1,200,000 .497 596,400
$2,325,800
NPV = $2,325,800 - $2,100,000 NPV = $225,800 Calculator solution: $225,412.37
The RADR NPV favors selection of project X.
Ranking
Plan
NPV
IRR
RADRs X 2 2 1 Y 1 1 2
c. Both NPV and IRR achieved the same relative rankings. However, making risk adjustments through the
RADRs caused the ranking to reverse from the non-risk adjusted results. The final choice would be to select Plan X since it ranks first using the risk-adjusted method.
d. Plan X
Value of real options = .25 x $100,000 = $25,000
NPVstrategic = NPVtraditional + Value of real options NPVstrategic = $261,040 + $25,000 = $286,040 Plan Y Value of real options = .20 x $500,000 = $100,000
NPVstrategic = NPVtraditional + Value of real options NPVstrategic = $225,412 + $100,000 = $328,412

Part 3 Long-Term Investment Decisions
Find out more at www.kawsarbd1.weebly.com Last saved and edited by Md.Kawsar Siddiqui 280
e. The addition of the value added by the existence of real options the ordering of the projects is reversed.
Project Y is now favored over project X using the RADR NPV for the traditional NPV. f. Capital rationing could change the selection of the plan. Since Plan Y requires only $2,100,000 and Plan X
requires $2,700,000, if the firm's capital budget was less than the amount needed to invest in project X, the firm would be forced to take Y to maximize shareholders' wealth subject to the budget constraint.

Chapter 10 Risk and Refinements in Capital Budgeting
Find out more at www.kawsarbd1.weebly.com Last saved and edited by Md.Kawsar Siddiqui 281
INTEGRATIVE CASE 3 LASTING IMPRESSIONS COMPANY Integrative Case III involves a complete long-term investment decision. The Lasting Impressions Company is a commercial printer faced with a replacement decision in which two mutually exclusive projects have been proposed. The data for each press have been designed to result in conflicting rankings when considering the NPV and IRR decision techniques. The case tests the students' understanding of the techniques as well as the qualitative aspects of risk and return decision-making. a. (1) Calculation of initial investment for Lasting Impressions Company: Press A Press B
Installed cost of new press = Cost of new press $830,000 $640,000
+ Installation costs 40,000 20,000 Total cost-new press $870,000 $660,000
- After-tax proceeds-sale of old asset = Proceeds from sale of old press 420,000 420,000
+ Tax on sale of old press* 121,600 121,600 Total proceeds-sale of old press (298,400) (298,400)
+ Change in net working capital" 90,400 0 Initial investment $662,000 $361,600
* Sale price $420,000
- Book value 116,000 Gain $304,000 x Tax rate (40%) 121,600
Book value = $ 400,000 = [(.20 +.32 +.19) x $400,000] = $116,000
**Cash $ 25,400 Accounts receivable 120,000 Inventory (20,000) Increase in current assets $125,400 Increase in current liabilities ( 35,000) Increase in net working capital $ 90,400

Part 3 Long-Term Investment Decisions
Find out more at www.kawsarbd1.weebly.com Last saved and edited by Md.Kawsar Siddiqui 282
(2) Depreciation Press A Cost Rate Depreciation
1 $870,000 .20 $ 174,000 2 870,000 .32 278,400 3 870,000 .19 165,300 4 870,000 .12 104,400 5 870,000 .12 104,400 6 870,000 .05 43,500
$ 870,000
Press B Cost Rate Depreciation 1 $660,000 .20 $132,000 2 660,000 .32 211,200 3 660,000 .19 125,400 4 660,000 .12 79,200 5 660,000 .12 79,200 6 660,000 .05 33,000
$ 660,000
Existing Press Cost Rate Depreciation
1 $400,000 .12 (Yr. 4) $ 48,000 2 400,000 .12 (Yr. 5) 48,000 3 400,000 .05 (Yr. 6) 20,000 4 0 0 0 5 0 0 0 6., 0 0 0
$116,000

Year and Taxes Depreciation before Taxes after Taxes Cash Flow1 $ 120,000 $ 48,000 $ 72,000 $ 43,200 $ 91,200 2 120,000 48,000 72,000 43,200 91,200 3 120,000 20,000 100,000 60,000 80,000 4 120,000 0 120,000 72,000 72,000 5 120,000 0 120,000 72,000 72,000 6 0 0 0 0 0
Press A Earnings Before
Depreciation Earnings Earnings Old Incremental Year and Taxes Depreciation Before Taxes After Taxes Cash Flow Cash Flow Cash Flow
1 $ 250,000 $ 174,000 $ 76,000 $ 45,600 $ 219,000 $ 91,200 $ 128,400 2 270,000 278,400 - 8,400 - 5,040 273,360 91,200 182,160 3 300,000 165,300 134,700 80,820 246,120 80,000 166,120 4 330,000 104,400 225,600 135,360 239,760 72,000 167,760 5 370,000 104,400 265,600 159,360 263,760 72,000 191,760 6 0 43,500 - 43,500 - 26,100 17,400 0 17,400
Press B Earnings Before Depreciation Earnings Earnings Old Incremental Year and Taxes Depreciation Before Taxes After Taxes Cash Flow Cash Flow Cash Flow
1 $ 210,000 $ 132,000 $ 78,000 $ 46,800 $ 178,800 $ 91,200 $ 87,600 2 210,000 211,200 - 1,200 - 720 210,480 91,200 119,280 3 210,000 125,400 84,600 50,760 176,160 80,000 96,160 4 210,000 79,200 130,800 78,480 157,680 72,000 85,680 5 210,000 79,200 130,800 78,480 157,680 72,000 85,680 6 0 33,000 - 33,000 - 19,800 13,200 0 13,200


Chapter 10 Risk and Refinements in Capital Budgeting
Find out more at www.kawsarbd1.weebly.com Last saved and edited by Md.Kawsar Siddiqui 285
(3) Terminal cash flow: Press A Press B
After-tax proceeds-sale of new press = Proceeds on sale of new press $ 400,000 $ 330,000 Tax on sale of new press* (142,600) (118,800)
Total proceeds-new press $257,400 $211,200 - After-tax proceeds-sale of old press =
Proceeds on sale of old press (150,000) (150,000) + Tax on sale of old press** 60,000 60,000
Total proceeds-old press (90,000) (90,000) + Change in net working capital 90,400 0 Terminal cash flow $257,800 $121,200
* Press A Press B
Sale price $400,000 Sale price $330,000 Less: Book value (Yr. 6) 43,500 Less: Book value (Yr. 6) 33,000 Gain $356,500 Gain $297,000 Tax rate x.40 Tax rate x .40 Tax $142,600 Tax $118,800
** Sale price $150,000
Less: Book value (Yr. 6) 0 Gain $150,000 Tax rate x.40 Tax $ 60,000
Press A Press B Initial Investment $662,000 $361,600
Year Cash Inflows 1 $128,400 $ 87,600 2 182,160 119,280 3 166,120 96,160 4 167,760 85,680 5* 449,560 206,880
* Year 5 Press A Press B Operating cash flow $191,760 $ 85,680 Terminal cash inflow 257,800 121,200 Total $449,560 $206,880
b.
Press A Cash Flows
$128,400 $182,160 $166,120 $167,760 $449,560 | | | | | | |

Part 3 Long-Term Investment Decisions
Find out more at www.kawsarbd1.weebly.com Last saved and edited by Md.Kawsar Siddiqui 286
0 1 2 3 4 5 6 End of Year
Press B Cash Flows
$87,600 $119,280 $96,160 $85,680 $206,880 | | | | | | | 0 1 2 3 4 5 6
End of Year c Relevant cash flow Cumulative Cash Flows
Year Press A Press B 1 $ 128,400 $ 87,600 2 310,560 206,880 3 476,680 303,040 4 644,440 388,720 5 1,094,000 595,600
(1) Press A: 4 years + [(662,000 - 644,440) ÷ 191,760]
Payback = 4 + (17,560 ÷ 191,760) Payback = 4.09 years
Press B: 3 years + [(361,600 - 303,040) ÷ 85,680] Payback = 3 + (58,560 ÷ 85,680) Payback = 3.68 years
(2) Press A: Year Cash Flow PVlF14%,t PV
1 $ 128,400 .877 $ 112,607 2 182,160 .769 140,081 3 166,120 .675 112,131 4 167,760 .592 99,314 5 449,560 .519 233,322
$ 697,455
Net present value = $697,455 - $662,000 Net present value = $35,455 Calculator solution: $35,738.83
Press B: Year Cash Flow PVlF14%,t PV
1 $ 87,600 .877 $ 76,825 2 119,280 .769 91,726 3 96,160 .675 64,908 4 85,680 .592 50,723 5 206,880 .519 107,371
$391,553

Chapter 10 Risk and Refinements in Capital Budgeting
Find out more at www.kawsarbd1.weebly.com Last saved and edited by Md.Kawsar Siddiqui 287
Net present value = $391,553 - $361,600 Net present value = $29,953 Calculator solution: $30,105.89
(3) Internal rate of return:
Press A:15.8% Press B:17.1%
d.
Net Present Value Profile Data for Net Present Value
Profile Discount rate Net Present Value
0
50000
100000
150000
200000
250000
300000
350000
400000
00
500000
0 2 4 6 8 10 12 14 16 18
4500
Net Present Value ($)
NPV - ANPV - B
Discount Rate (%)
Press A 0% $ 432,000 $ 234,000 14% 35,455 29,953 15.8% 0 - 17.1% - 0
When the cost of capital is below approximately 15 percent, Press A is preferred over Press B, while at costs greater than 15 percent, Press B is preferred. Since the firm's cost of capital is 14 percent, conflicting rankings exist. Press A has a higher value and is therefore preferred over Press B using NPV, whereas Press B's IRR of 17.1 percent causes it to be preferred over Press A, whose IRR is 15.8 percent using this measure.
e. (1) If the firm has unlimited funds, Press A is preferred.
(2) If the firm is subject to capital rationing, Press B may be preferred. f. The risk would need to be measured by a quantitative technique such as certainty equivalents or risk-
adjusted discount rates. The resultant net present value could then be compared to Press B and a decision made.
Related Documents