Risk analysis of a patient monitoring system using Bayesian Network modeling I. Maglogiannis * , E. Zafiropoulos, A. Platis, C. Lambrinoudakis Department of Information and Communication Systems Engineering, University of the Aegean, GR 83200 Karlovasi, Samos, Greece Received 6 July 2005 Available online 15 November 2005 Abstract In a modern technological environment where information systems are characterized by complexity, situations of non-effective oper- ation should be anticipated. Often system failures are a result of insufficient planning or equipment malfunction, indicating that it is essential to develop techniques for predicting and addressing a system failure. Particularly for safety–critical applications such as the healthcare information systems, which are dealing with human health, risk analysis should be considered a necessity. This paper presents a new method for performing a risk analysis study of health information systems. Specifically, the CCTA Risk Analysis and Management Methodology (CRAMM) has been utilized for identifying and valuating the assets, threats, and vulnerabilities of the information system, followed by a graphical modeling of their interrelationships using Bayesian Networks. The proposed method exploits the results of the CRAMM-based risk analysis for developing a Bayesian Network model, which presents concisely all the interactions of the undesirable events for the system. Based on ‘‘what–if’’ studies of system operation, the Bayesian Network model identifies and prioritizes the most critical events. The proposed risk analysis framework has been applied to a vital signs monitoring information system for homecare tele- medicine, namely the VITAL-Home System, developed and maintained for a private medical center (Medical Diagnosis and Treatment S.A.). Ó 2005 Elsevier Inc. All rights reserved. Keywords: Telemedicine; Patient monitoring; Homecare; Risk analysis; Bayesian Networks; CRAMM 1. Introduction Nowadays, health delivery practices for specific popula- tions, such as patients suffering from chronic diseases or elderly people, are shifting towards the constant health monitoring; 24 h/day, 7 days per week. Health monitoring may be delivered not only in a hospital environment but at home as well, through the establishment of modern patient telemonitoring systems [1–4]. The reasons are better possi- bilities for managing chronic care, controlling health deliv- ery costs, increasing quality of life, and quality of health services and distinct possibility of predicting and thus avoiding serious complications [5]. Homecare equipment for people with chronic diseases requiring a constant monitoring includes appliances that can work 24 h/day. These computer-based systems are performing safety–critical applications and therefore concentrate the ongoing concern that they might fail and cause harm [6]. In the past, there are examples of computer-based systems providing health care that have failed producing catastrophic results for patientÕs health. The most famous incident is the one regarding Therac- 25, a therapeutic computer system intended to heal, but inadvertently killed and harmed patients before being removed of the market [7]. Furthermore, medical data maintained in health infor- mation systems are directly related to the patientÕs health and safety. According to the Recommendation No. R (97) 5 on the Protection of Medical Data issued by the Council of Europe, appropriate technical and organiza- tional measures must be taken to protect personal data against any accidental or illegal destruction, accidental loss, as well as against unauthorized access [8]. These pos- 1532-0464/$ - see front matter Ó 2005 Elsevier Inc. All rights reserved. doi:10.1016/j.jbi.2005.10.003 * Corresponding author. Fax: +30 210 2112521. E-mail address: [email protected] (I. Maglogiannis). www.elsevier.com/locate/yjbin Journal of Biomedical Informatics 39 (2006) 637–647

Welcome message from author
This document is posted to help you gain knowledge. Please leave a comment to let me know what you think about it! Share it to your friends and learn new things together.
Transcript
www.elsevier.com/locate/yjbin
Journal of Biomedical Informatics 39 (2006) 637–647
Risk analysis of a patient monitoring system using BayesianNetwork modeling
I. Maglogiannis *, E. Zafiropoulos, A. Platis, C. Lambrinoudakis
Department of Information and Communication Systems Engineering, University of the Aegean, GR 83200 Karlovasi, Samos, Greece
Received 6 July 2005Available online 15 November 2005
Abstract
In a modern technological environment where information systems are characterized by complexity, situations of non-effective oper-ation should be anticipated. Often system failures are a result of insufficient planning or equipment malfunction, indicating that it isessential to develop techniques for predicting and addressing a system failure. Particularly for safety–critical applications such as thehealthcare information systems, which are dealing with human health, risk analysis should be considered a necessity. This paper presentsa new method for performing a risk analysis study of health information systems. Specifically, the CCTA Risk Analysis and Management
Methodology (CRAMM) has been utilized for identifying and valuating the assets, threats, and vulnerabilities of the information system,followed by a graphical modeling of their interrelationships using Bayesian Networks. The proposed method exploits the results of theCRAMM-based risk analysis for developing a Bayesian Network model, which presents concisely all the interactions of the undesirableevents for the system. Based on ‘‘what–if’’ studies of system operation, the Bayesian Network model identifies and prioritizes the mostcritical events. The proposed risk analysis framework has been applied to a vital signs monitoring information system for homecare tele-medicine, namely the VITAL-Home System, developed and maintained for a private medical center (Medical Diagnosis and TreatmentS.A.).� 2005 Elsevier Inc. All rights reserved.
Keywords: Telemedicine; Patient monitoring; Homecare; Risk analysis; Bayesian Networks; CRAMM
1. Introduction
Nowadays, health delivery practices for specific popula-tions, such as patients suffering from chronic diseases orelderly people, are shifting towards the constant healthmonitoring; 24 h/day, 7 days per week. Health monitoringmay be delivered not only in a hospital environment but athome as well, through the establishment of modern patienttelemonitoring systems [1–4]. The reasons are better possi-bilities for managing chronic care, controlling health deliv-ery costs, increasing quality of life, and quality of healthservices and distinct possibility of predicting and thusavoiding serious complications [5].
Homecare equipment for people with chronic diseasesrequiring a constant monitoring includes appliances that
1532-0464/$ - see front matter � 2005 Elsevier Inc. All rights reserved.
doi:10.1016/j.jbi.2005.10.003
* Corresponding author. Fax: +30 210 2112521.E-mail address: [email protected] (I. Maglogiannis).
can work 24 h/day. These computer-based systems areperforming safety–critical applications and thereforeconcentrate the ongoing concern that they might failand cause harm [6]. In the past, there are examples ofcomputer-based systems providing health care that havefailed producing catastrophic results for patient�s health.The most famous incident is the one regarding Therac-25, a therapeutic computer system intended to heal, butinadvertently killed and harmed patients before beingremoved of the market [7].
Furthermore, medical data maintained in health infor-mation systems are directly related to the patient�s healthand safety. According to the Recommendation No. R(97) 5 on the Protection of Medical Data issued by theCouncil of Europe, appropriate technical and organiza-tional measures must be taken to protect personal dataagainst any accidental or illegal destruction, accidentalloss, as well as against unauthorized access [8]. These pos-
638 I. Maglogiannis et al. / Journal of Biomedical Informatics 39 (2006) 637–647
sible threats can damage severely health information sys-tem reliability and discourage professionals of future use.
Therefore, the execution of a risk analysis is a necessityto assure a health information system�s safety and Qualityof Service (QoS). This analysis should clearly specify all thepossible risks that may lead to system unavailability orsecurity violation and identify appropriate countermea-sures to combat these risks. Several risk analysis methodol-ogies have been proposed in literature, which are currentlyavailable in the form of guidelines to be applied manuallyor through interactive software packages. Furthermore,in most cases these guidelines are combined with modelingtechniques that are widely applied in reliability and safetyengineering, such as Fault Trees, Event Trees, MarkovChains, and FMEA (Failure Mode Effects Analysis) [9–11]. These techniques provide representation of systemoperation and undesirable events and validation of systemsafety level [12–16].
This paper presents a new method for performing a riskanalysis study of a healthcare telemonitoring system. TheUK Central Computer and Telecommunications Agency(CCTA) Risk Analysis and Management Methodology(CRAMM) has been applied for identifying the informa-tion system�s asset values, threats, vulnerabilities, and thecorresponding risks [17]. Initially, the user services, offeredby the health information system and identified by theCRAMM methodology, are used for the construction ofa Fault Tree representing the logical interrelationships offailure events that may lead to a hazardous condition.Finally, these relationships are represented using anadvanced Bayesian Network model that provides greaterflexibility in modeling failure event scenarios and highlight-ing system critical areas. The proposed risk analysis frame-work has been applied to a vital signs monitoringinformation system for homecare telemedicine, namelythe VITAL-Home System, developed and maintained fora private medical center (Medical Diagnosis and TreatmentS.A.).
2. Risk analysis of healthcare information systems
In recent years, the escalating advances in informationand communication technologies created many new oppor-tunities, but also an environment with more risks than everbefore. Managers, engineers, and information security pro-fessionals should evaluate the specific risks in informationsystems in a concise and systematic way. As far as health-care information systems are concerned, quality of healthservices and security of medical data play an important rolein the wide acceptance of new technologies by patients andpractitioners. Therefore, novel health information systemsmust be accompanied by a risk analysis, identifying thethreats and vulnerabilities of the system and, in some cases,providing a system model of all interrelationships amongthe various events that influence system safety [15].
Risk analysis involves the identification and assessmentof the levels of risks calculated from the known values of
assets and the levels of threats to, and vulnerabilities of,those assets [12,17]. Furthermore, risk managementinvolves the identification, selection, and adoption of coun-termeasures justified by the identified risks to assets and thereduction of those risks to acceptable levels. Several meth-ods have been developed and applied to information sys-tems. In the proposed risk analysis method, the mainsteps of the CRAMM methodology have been adopted[17]. CRAMM is owned, administered, and maintainedby the Security Service on behalf of the UK Government.In line with nearly all risk analysis methods, CRAMMasserts that risk is dependent on the asset values, thethreats, and the vulnerabilities. Moreover, it enables thepractitioner to build a system model encapsulating theasset interdependencies; it provides useful insights into sys-tem operational characteristics as well as a comprehensiveidentification of which assets are at greatest risk, due towhat threats, and with what impacts should those threatssucceed.
Specifically, the CRAMM methodology is organized inthree main stages. First, system assets are identified andcategorized as data, application software, and physicalassets (equipment, buildings, and staff). Data assets are val-ued in terms of their impacts on breaches of confidentiality,integrity, availability, and non-repudiation, which are thewidely accepted principles of information security. Appli-cation and physical assets are valued in terms of theirunavailability, replacement or reconstruction cost. Thelikely threats and known vulnerabilities are quantifiedagainst selected asset groups, while their likelihood ofoccurrence is estimated using predefined levels of threatand vulnerability (e.g., ‘‘Very Low,’’ ‘‘Low,’’ ‘‘Medium,’’‘‘High,’’ and ‘‘Very High’’). Finally to manage the identi-fied risks, a set of countermeasures applicable to the infor-mation system is produced.
3. Modeling system safety: Fault Trees vs Bayesian
Networks
3.1. Basic principles of the Fault Trees
Fault Tree analysis was originally introduced to facili-tate the safety analysis of system designs by providinginsight into system operation and illuminating potentialweaknesses, with respect to reliability or safety [10,12]. AFault Tree system model is a graphical representation oflogical interrelationships between undesirable events, lead-ing to a hazardous system state [18]. It depicts the combi-nations of undesirable events that lead to the hazardoussystem state (top event) by means of their logical-gate inter-relationships. The quantitative analysis of a Fault Tree isused to determine the probability of occurrence of thetop event, given the respective probabilities for the undesir-able events. From a system design perspective, the FaultTree analysis provides a logical framework for understand-ing the ways in which a system can fail, which is often asimportant as understanding how a system can succeed.
A
A' B'
B C
D
A a1 a2 B b1 b2 b1 b2 C c1 c2 c1 c2 c1 c2 c1 c2
d1 P1 P2 P3 P4 P5 P6 P7 P8D
d2 P9 P10 P11 P12 P13 P14 P15 P1
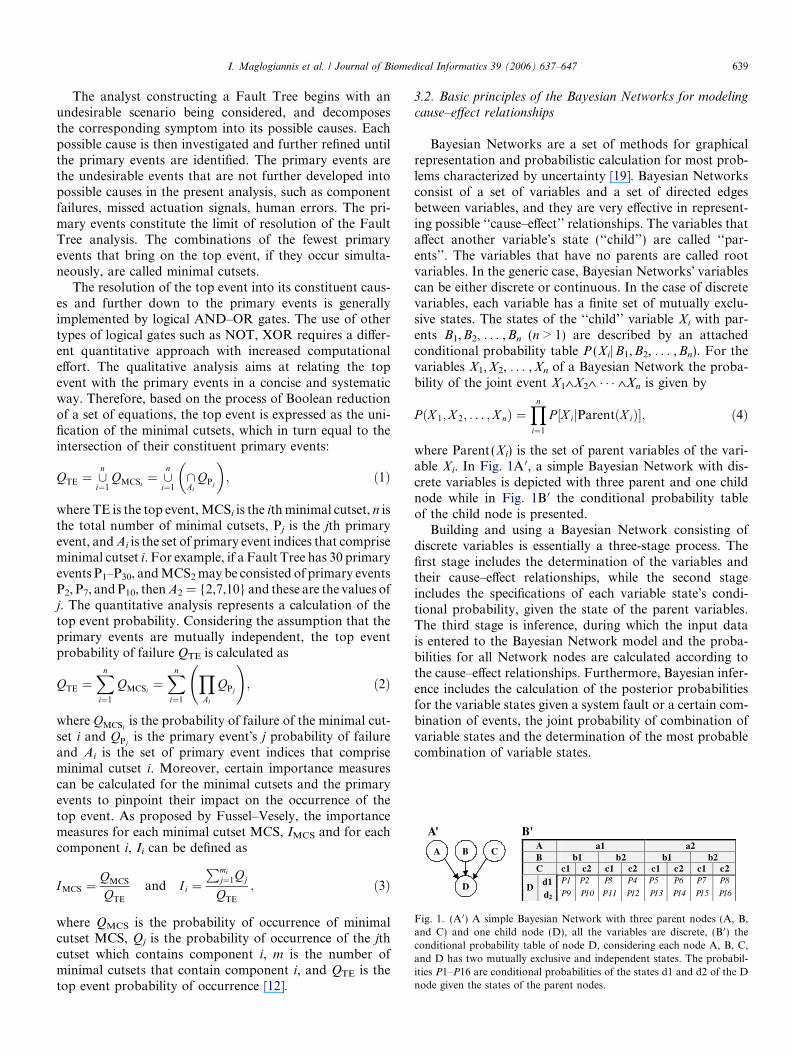
Fig. 1. (A 0) A simple Bayesian Network with three parent nodes (A, B,and C) and one child node (D), all the variables are discrete, (B 0) theconditional probability table of node D, considering each node A, B, C,and D has two mutually exclusive and independent states. The probabil-ities P1–P16 are conditional probabilities of the states d1 and d2 of the Dnode given the states of the parent nodes.
I. Maglogiannis et al. / Journal of Biomedical Informatics 39 (2006) 637–647 639
The analyst constructing a Fault Tree begins with anundesirable scenario being considered, and decomposesthe corresponding symptom into its possible causes. Eachpossible cause is then investigated and further refined untilthe primary events are identified. The primary events arethe undesirable events that are not further developed intopossible causes in the present analysis, such as componentfailures, missed actuation signals, human errors. The pri-mary events constitute the limit of resolution of the FaultTree analysis. The combinations of the fewest primaryevents that bring on the top event, if they occur simulta-neously, are called minimal cutsets.
The resolution of the top event into its constituent caus-es and further down to the primary events is generallyimplemented by logical AND–OR gates. The use of othertypes of logical gates such as NOT, XOR requires a differ-ent quantitative approach with increased computationaleffort. The qualitative analysis aims at relating the topevent with the primary events in a concise and systematicway. Therefore, based on the process of Boolean reductionof a set of equations, the top event is expressed as the uni-fication of the minimal cutsets, which in turn equal to theintersection of their constituent primary events:
QTE ¼ [n
i¼1QMCSi
¼ [n
i¼1\Ai
QPj
� �; ð1Þ
where TE is the top event, MCSi is the ith minimal cutset, n isthe total number of minimal cutsets, Pj is the jth primaryevent, and Ai is the set of primary event indices that compriseminimal cutset i. For example, if a Fault Tree has 30 primaryevents P1–P30, and MCS2 may be consisted of primary eventsP2, P7, and P10, then A2 = {2,7,10} and these are the values ofj. The quantitative analysis represents a calculation of thetop event probability. Considering the assumption that theprimary events are mutually independent, the top eventprobability of failure QTE is calculated as
QTE ¼Xn
i¼1
QMCSi¼Xn
i¼1
YAi
QPj
!; ð2Þ
where QMCSiis the probability of failure of the minimal cut-
set i and QPjis the primary event�s j probability of failure
and Ai is the set of primary event indices that compriseminimal cutset i. Moreover, certain importance measurescan be calculated for the minimal cutsets and the primaryevents to pinpoint their impact on the occurrence of thetop event. As proposed by Fussel–Vesely, the importancemeasures for each minimal cutset MCS, IMCS and for eachcomponent i, Ii can be defined as
IMCS ¼QMCS
QTE
and I i ¼Pmi
j¼1Qj
QTE
; ð3Þ
where QMCS is the probability of occurrence of minimalcutset MCS, Qj is the probability of occurrence of the jthcutset which contains component i, m is the number ofminimal cutsets that contain component i, and QTE is thetop event probability of occurrence [12].
3.2. Basic principles of the Bayesian Networks for modeling
cause–effect relationships
Bayesian Networks are a set of methods for graphicalrepresentation and probabilistic calculation for most prob-lems characterized by uncertainty [19]. Bayesian Networksconsist of a set of variables and a set of directed edgesbetween variables, and they are very effective in represent-ing possible ‘‘cause–effect’’ relationships. The variables thataffect another variable�s state (‘‘child’’) are called ‘‘par-ents’’. The variables that have no parents are called rootvariables. In the generic case, Bayesian Networks� variablescan be either discrete or continuous. In the case of discretevariables, each variable has a finite set of mutually exclu-sive states. The states of the ‘‘child’’ variable Xi with par-ents B1,B2, . . . ,Bn (n > 1) are described by an attachedconditional probability table P (XijB1,B2, . . . ,Bn). For thevariables X1,X2, . . . ,Xn of a Bayesian Network the proba-bility of the joint event X1�X2� � � � �Xn is given by
P ðX 1;X 2; . . . ;X nÞ ¼Yn
i¼1
P ½X ijParentðX iÞ�; ð4Þ
where Parent (Xi) is the set of parent variables of the vari-able Xi. In Fig. 1A 0, a simple Bayesian Network with dis-crete variables is depicted with three parent and one childnode while in Fig. 1B 0 the conditional probability tableof the child node is presented.
Building and using a Bayesian Network consisting ofdiscrete variables is essentially a three-stage process. Thefirst stage includes the determination of the variables andtheir cause–effect relationships, while the second stageincludes the specifications of each variable state�s condi-tional probability, given the state of the parent variables.The third stage is inference, during which the input datais entered to the Bayesian Network model and the proba-bilities for all Network nodes are calculated according tothe cause–effect relationships. Furthermore, Bayesian infer-ence includes the calculation of the posterior probabilitiesfor the variable states given a system fault or a certain com-bination of events, the joint probability of combination ofvariable states and the determination of the most probablecombination of variable states.
640 I. Maglogiannis et al. / Journal of Biomedical Informatics 39 (2006) 637–647
3.3. Modeling issues of Fault Trees and Bayesian Networks
Fault Trees are very popular in dependability modeling,system reliability analysis, evaluation of large safety–criti-cal systems, and graphical representation of cause–effectrelationships in risk analysis [10,12,18]. They are construct-ed using a top–down approach, from the events to theircauses, until no further decomposition is possible orrequired, and the primary events are identified. The meth-odology is based on several assumptions. The events areconsidered binary (two possible states) and statisticallyindependent, while relationships between events and causesare represented by means of logical AND–OR gates. Cur-rently, several new Fault Tree tools relax the last assump-tion, while introducing considerable computational effortin the quantitative analysis of the Fault Tree models[18,20]. The Fault Tree model provides a framework forthe estimation of occurrence probability regarding theundesirable top event and the minimal cutsets and theimportance measures provide indications for the events ofthe highest risk for system safety. However, Bayesian Net-works provide greater flexibility in representing uncertaindata and investigating different system operational scenar-ios [21,22].
The Bayesian Networks is a widely used modeling tech-nique for representing uncertain knowledge in probabilisticsystems. The exciting feature of this technique is that it ispossible to include local conditional dependencies intothe model, by directly specifying the causes that influencea given effect, and therefore contribute significantly in faultdiagnosis and risk prioritization. Furthermore, BayesianNetworks provide the flexibility of modeling events withmore than two possible states, while other operationaldependencies in system modeling such as common causefailures, sequentially dependent failures can be modeledmore easily than using the Fault Tree formalism. In thecontext of the present risk analysis framework, the use ofBayesian Networks provides a concise graphical represen-tation of the cause–effect interrelationships among threats,vulnerabilities, and assets in the risk analysis of informa-tion systems, while the conditional dependencies amongthe events and the probabilistic inference of the BayesianNetwork aim significantly in a more realistic risk prioritiza-tion of the undesirable events for system safety. The impor-tance measures of the Fault Tree method are calculatedarbitrarily of the existence or not of the top event or anyother possible evidence for the tree events. However, theconditional probabilities given the existence or not of cer-tain events incorporate this evidence in their calculationand result in a more realistic ranking of primary events[21].
4. The VITAL-Home patient monitoring system
Home offers a considerably different environment com-pared to a hospital or to a health care unit. Facilities formedical practice at home are limited by the availability of
portable patient monitors for such applications. Thesenew systems provide automated connection with remoteaccess and seamless transmission of biological and otherdata. The patient or elder will mainly require monitoringof his vital signals (i.e., ECG, blood pressure, heart rate,breath rate, oxygen saturation, and perspiration) [3,24–27]. Patients recently discharged from hospital after someform of intervention, for instance, after a cardiac episode,cardiac surgery or a diabetic comma are less secure andrequire enhanced care. The most common forms of specialhome monitoring are ECG arrhythmia monitoring, postsurgical monitoring, respiratory, and blood oxygen levelsmonitoring and sleep apnoea monitoring.
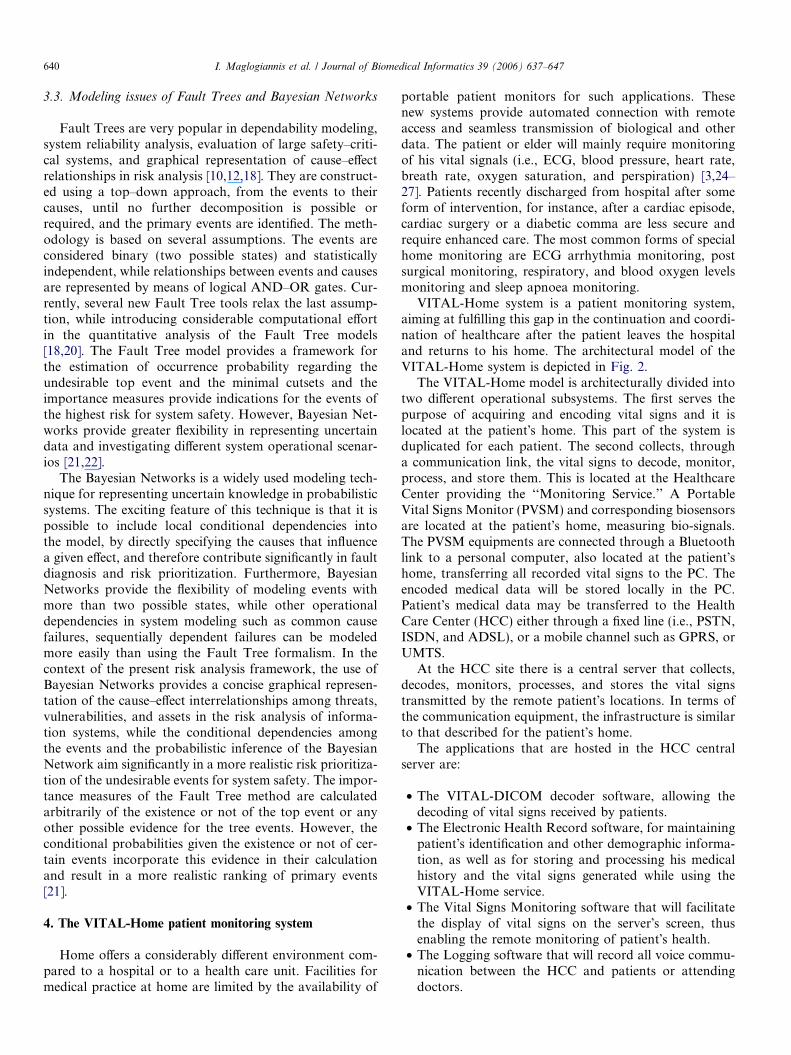
VITAL-Home system is a patient monitoring system,aiming at fulfilling this gap in the continuation and coordi-nation of healthcare after the patient leaves the hospitaland returns to his home. The architectural model of theVITAL-Home system is depicted in Fig. 2.
The VITAL-Home model is architecturally divided intotwo different operational subsystems. The first serves thepurpose of acquiring and encoding vital signs and it islocated at the patient�s home. This part of the system isduplicated for each patient. The second collects, througha communication link, the vital signs to decode, monitor,process, and store them. This is located at the HealthcareCenter providing the ‘‘Monitoring Service.’’ A PortableVital Signs Monitor (PVSM) and corresponding biosensorsare located at the patient�s home, measuring bio-signals.The PVSM equipments are connected through a Bluetoothlink to a personal computer, also located at the patient�shome, transferring all recorded vital signs to the PC. Theencoded medical data will be stored locally in the PC.Patient�s medical data may be transferred to the HealthCare Center (HCC) either through a fixed line (i.e., PSTN,ISDN, and ADSL), or a mobile channel such as GPRS, orUMTS.
At the HCC site there is a central server that collects,decodes, monitors, processes, and stores the vital signstransmitted by the remote patient�s locations. In terms ofthe communication equipment, the infrastructure is similarto that described for the patient�s home.
The applications that are hosted in the HCC centralserver are:
• The VITAL-DICOM decoder software, allowing thedecoding of vital signs received by patients.
• The Electronic Health Record software, for maintainingpatient�s identification and other demographic informa-tion, as well as for storing and processing his medicalhistory and the vital signs generated while using theVITAL-Home service.
• The Vital Signs Monitoring software that will facilitatethe display of vital signs on the server�s screen, thusenabling the remote monitoring of patient�s health.
• The Logging software that will record all voice commu-nication between the HCC and patients or attendingdoctors.
HEALTH CARE CENTER VITAL-Home DECODER
MONITORING AND STORAGE SERVER
PC VITAL-Home ENCODER
FIXED NETWORK PSTN, DSL, CABLE
MOBILE NETWORK GPRS, UMTS, SATELITE
Modem Modem
Mobile Modem or Set of Box
Modem
Portable Vital Signs Monitor Device
RS-232
PATIENT'S HOME
HEALTH CARE CENTER
Storage
INTERNET PSTN
Attending Doctors Hospitals
HCC Printer
Fig. 2. Architectural model of the VITAL-Home system.
I. Maglogiannis et al. / Journal of Biomedical Informatics 39 (2006) 637–647 641
In the following two sections, all the reliability aspects ofthe previously described VITAL-Home system areexplored and analyzed based on the proposed risk analysisframework.
5. Risk analysis of the VITAL-Home system
The risk analysis of the VITAL-Home system, in accor-dance to the guidelines of the CRAMM methodology, hasbeen performed by experienced CRAMM-certified riskanalysts. However, several key persons of the service pro-vider (Medical Diagnosis and Treatment S.A.) have active-ly participated in the study by providing, throughinterviews or questionnaires, the information required bythe analysts. It should be stressed at this point, that the riskanalysts have presented the results of each stage to themanagement of the medical center, to get their agreementand also obtain their permission to proceed with the study.
The first stage of the VITAL-Home system risk analysiscomprises of the identification and the valuation of theinformation system�s assets. Valuation concerns the datamaintained by the HCC and the patient, as well as thehardware and software applications used for the provisionof the VITAL-Home service. The risk analyst decides thelevel of granularity for the identification of the informationsystem�s assets, in accordance to the CRAMM guidelines.However, the main approach is to identify, as distinctassets, all data categories that may disrupt the user serviceif their availability, confidentiality or integrity is compro-
mised. The hardware and software assets are those associ-ated with the aforementioned data categories and thus withthe offered user service. The valuation was performed onthe basis of the possible impacts that a threat may causeto the HCC and the patient.
5.1. Data assets
It should be noted that since the VITAL-Home systemdeals with medical data (confidential information) and itis directly related with the safety of the patient, the security,trust, and reliability are the key �services� of the HCC to thepatients. Therefore, a security incident is not just an inter-nal problem of the HCC (replacement cost) but has animmediate effect on the trust of patients to the systemand thus to the capability of the HCC to offer reliableHealthcare Services. Therefore, the data valuation wasdone by estimating the impact that could be caused bythe loss of data availability and/or data confidentialityand/or data integrity, always considering the worst casescenario. The identified data assets of the VITAL-Homesystem were categorized into the following classes: PatientMedical Records, Encoded Vital Signs, Reporting Data,and Voice-Log Data.
5.2. Hardware assets
The hardware assets required at both the HCC site andat patient�s home are:
642 I. Maglogiannis et al. / Journal of Biomedical Informatics 39 (2006) 637–647
1. HCC Server. This is the main network host stationthat stores the patient medical records, receives vitalsigns from patients, and facilitates their decodingand monitoring through specialized monitoring soft-ware. In addition, it supports logging of all communi-cations between the HCC and the attending doctors,hospitals, or patients.
2. HCC Printers. These are a color inkjet printer forprinting vital signs, and a laser printer for printingnormal reports and letters.
3. Backup Media. These are magnetic tapes for back-upof the data stored on the HCC Server.
4. Patient�s Home PC. This is the PC that will be installedat the patient�s location for facilitating the encoding ofthe vital signs and their transmission to the HCC.
5. Patient�s PVSM. These are the medical devices andsensors recording vital signs.
6. PTT Telephone Line. This is a normal line (Fixed,Cable or DSL) through which the patient can trans-mit the vital signs to the HCC or communicate withthe doctors.
7. GPRS or UMTS or Satellite device. This device isused as a back-up in the case that the conventionaltelephone line is unavailable.
8. Internet Line. This is the line used to connect the HCCto the Internet through an Internet Service Provider.
9. Communication Protocol. This will be the TCP/IPprotocol that will be used for any type ofcommunication.
10. HCC Modem. This is the Modem that will be installedat the HCC for supporting data collection from theremote patient locations through the fixed line.
11. Patient�s Home Modem. This is the Modem (Fixed,Cable or DSL) that will be installed at the patient�shome for supporting data transmission to the HCCthrough the fixed line.
The total value of the hardware assets has been estimat-ed on a replacement cost basis and it is not expected toexceed the amount of 22,000 Euro.
5.3. Software assets
The software assets required for the provision of theVITAL-Home service are the following:
1. Medical Record Software. It is utilized for maintainingand processing the electronic medical records of thepatients.
2. Vital Signs Monitoring Support Software. It constitutesan application supporting the display of vital signs onthe HCC monitor.
3. Logging Support Software. It facilitates the maintenanceof a log file of most communication between the HCCand attending doctors, hospitals or patients. It also sup-ports recording of voice communication and filing ofelectronic documents and emails that may be exchanged.
4. VITAL-DICOM Encoder Software. It encodes the vitalsigns from the PVSM to the VITAL-DICOM format.It will be executed on the patient�s PC.
5. VITAL-DICOM Decoder Software. It decodes the vitalsigns received from the patient locations. It will be exe-cuted on the HCC Server.
The total value of the software assets has been estimatedon a replacement cost basis and it is not expected to exceedthe amount of 38,000 Euro.
5.4. Evaluation of the threats
The next step is the evaluation of the threats that thesystem is facing, as well as the identification of the vulner-abilities that may allow some threats to occur. These, inturn, will provide us with the security-related needs of theusers. The evaluation of threats and vulnerabilities in con-junction with the system�s asset valuation are used to calcu-late the risk level of each system asset. The following tablepresents the important threats that the VITAL-Home sys-tem is facing, together with the corresponding user needsthey lead to.
The threats presented in Table 1 can be analyzed furtherdown to more detailed causes. For example, ‘‘masquerad-ing user identity’’ may be directed by insiders or outsidersof the VITAL-Home system, therefore the threat can bemodeled as a result of these two causes. Apart from thetabular form representation, the cause–effect interrelation-ships of threats, vulnerabilities and assets of the VITAL-Home system can be represented in detail using depend-ability modeling techniques, such as the Fault Trees[16,10]. The basic services that constitute the successful sys-tem operation are identified and their unavailability is ana-lyzed to its causes in a top–down approach, using logicalAND–OR gates to model the causality. In the present casestudy, the basic services of the VITAL-Home system can besummarized in the following four operations:
(a) Home Monitoring Service,(b) Vital Signs Collection Service,(c) Reporting Service,(d) HCC-Patient Communication Service,
where the specific details about each one of them have beengiven previously. The unavailability of any of these serviceswill lead to the VITAL-Home system failure to satisfy thespecifications, which is a fact depicted by the logical-ORgate of Fig. 3.
The four basic services can be further decomposed downto the events leading to their unavailability, using the find-ings of the CRAMM analysis. The primary events of theFault Trees are the threats identified in the CRAMM anal-ysis that can be no further decomposed, or their furtherinvestigation is far beyond the scope of the analysis. InFig. 4, the Fault Tree of Home Monitoring Service is pre-sented, where all the cause–effect interactions leading to the
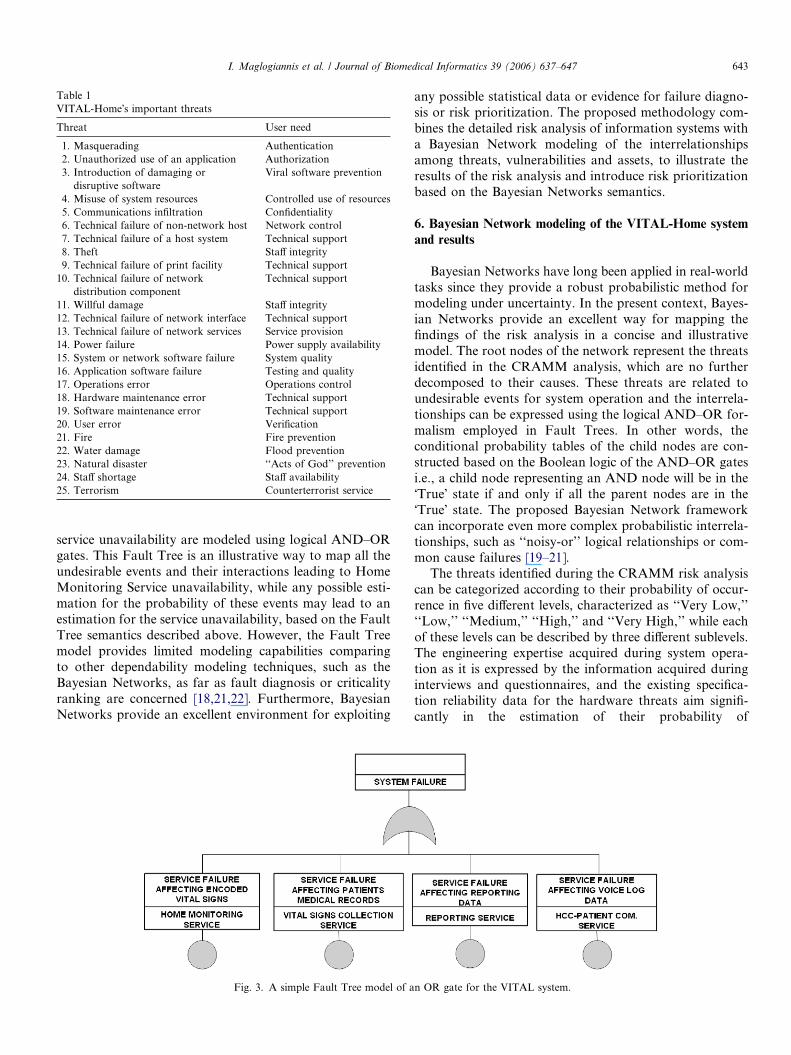
Table 1VITAL-Home�s important threats
Threat User need
1. Masquerading Authentication2. Unauthorized use of an application Authorization3. Introduction of damaging or
disruptive softwareViral software prevention
4. Misuse of system resources Controlled use of resources5. Communications infiltration Confidentiality6. Technical failure of non-network host Network control7. Technical failure of a host system Technical support8. Theft Staff integrity9. Technical failure of print facility Technical support
10. Technical failure of networkdistribution component
Technical support
11. Willful damage Staff integrity12. Technical failure of network interface Technical support13. Technical failure of network services Service provision14. Power failure Power supply availability15. System or network software failure System quality16. Application software failure Testing and quality17. Operations error Operations control18. Hardware maintenance error Technical support19. Software maintenance error Technical support20. User error Verification21. Fire Fire prevention22. Water damage Flood prevention23. Natural disaster ‘‘Acts of God’’ prevention24. Staff shortage Staff availability25. Terrorism Counterterrorist service
I. Maglogiannis et al. / Journal of Biomedical Informatics 39 (2006) 637–647 643
service unavailability are modeled using logical AND–ORgates. This Fault Tree is an illustrative way to map all theundesirable events and their interactions leading to HomeMonitoring Service unavailability, while any possible esti-mation for the probability of these events may lead to anestimation for the service unavailability, based on the FaultTree semantics described above. However, the Fault Treemodel provides limited modeling capabilities comparingto other dependability modeling techniques, such as theBayesian Networks, as far as fault diagnosis or criticalityranking are concerned [18,21,22]. Furthermore, BayesianNetworks provide an excellent environment for exploiting
Fig. 3. A simple Fault Tree model of a
any possible statistical data or evidence for failure diagno-sis or risk prioritization. The proposed methodology com-bines the detailed risk analysis of information systems witha Bayesian Network modeling of the interrelationshipsamong threats, vulnerabilities and assets, to illustrate theresults of the risk analysis and introduce risk prioritizationbased on the Bayesian Networks semantics.
6. Bayesian Network modeling of the VITAL-Home system
and results
Bayesian Networks have long been applied in real-worldtasks since they provide a robust probabilistic method formodeling under uncertainty. In the present context, Bayes-ian Networks provide an excellent way for mapping thefindings of the risk analysis in a concise and illustrativemodel. The root nodes of the network represent the threatsidentified in the CRAMM analysis, which are no furtherdecomposed to their causes. These threats are related toundesirable events for system operation and the interrela-tionships can be expressed using the logical AND–OR for-malism employed in Fault Trees. In other words, theconditional probability tables of the child nodes are con-structed based on the Boolean logic of the AND–OR gatesi.e., a child node representing an AND node will be in the�True� state if and only if all the parent nodes are in the�True� state. The proposed Bayesian Network frameworkcan incorporate even more complex probabilistic interrela-tionships, such as ‘‘noisy-or’’ logical relationships or com-mon cause failures [19–21].
The threats identified during the CRAMM risk analysiscan be categorized according to their probability of occur-rence in five different levels, characterized as ‘‘Very Low,’’‘‘Low,’’ ‘‘Medium,’’ ‘‘High,’’ and ‘‘Very High,’’ while eachof these levels can be described by three different sublevels.The engineering expertise acquired during system opera-tion as it is expressed by the information acquired duringinterviews and questionnaires, and the existing specifica-tion reliability data for the hardware threats aim signifi-cantly in the estimation of their probability of
n OR gate for the VITAL system.
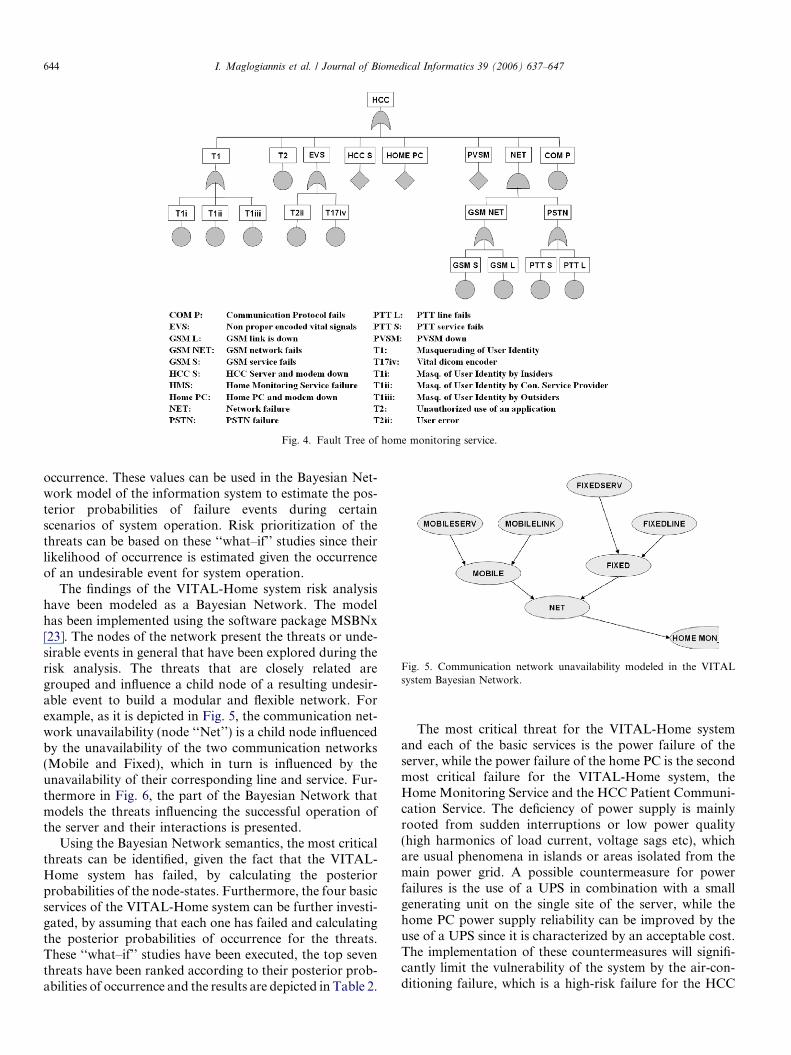
Fig. 4. Fault Tree of home monitoring service.
Fig. 5. Communication network unavailability modeled in the VITALsystem Bayesian Network.
644 I. Maglogiannis et al. / Journal of Biomedical Informatics 39 (2006) 637–647
occurrence. These values can be used in the Bayesian Net-work model of the information system to estimate the pos-terior probabilities of failure events during certainscenarios of system operation. Risk prioritization of thethreats can be based on these ‘‘what–if’’ studies since theirlikelihood of occurrence is estimated given the occurrenceof an undesirable event for system operation.
The findings of the VITAL-Home system risk analysishave been modeled as a Bayesian Network. The modelhas been implemented using the software package MSBNx[23]. The nodes of the network present the threats or unde-sirable events in general that have been explored during therisk analysis. The threats that are closely related aregrouped and influence a child node of a resulting undesir-able event to build a modular and flexible network. Forexample, as it is depicted in Fig. 5, the communication net-work unavailability (node ‘‘Net’’) is a child node influencedby the unavailability of the two communication networks(Mobile and Fixed), which in turn is influenced by theunavailability of their corresponding line and service. Fur-thermore in Fig. 6, the part of the Bayesian Network thatmodels the threats influencing the successful operation ofthe server and their interactions is presented.
Using the Bayesian Network semantics, the most criticalthreats can be identified, given the fact that the VITAL-Home system has failed, by calculating the posteriorprobabilities of the node-states. Furthermore, the four basicservices of the VITAL-Home system can be further investi-gated, by assuming that each one has failed and calculatingthe posterior probabilities of occurrence for the threats.These ‘‘what–if’’ studies have been executed, the top seventhreats have been ranked according to their posterior prob-abilities of occurrence and the results are depicted in Table 2.
The most critical threat for the VITAL-Home systemand each of the basic services is the power failure of theserver, while the power failure of the home PC is the secondmost critical failure for the VITAL-Home system, theHome Monitoring Service and the HCC Patient Communi-cation Service. The deficiency of power supply is mainlyrooted from sudden interruptions or low power quality(high harmonics of load current, voltage sags etc), whichare usual phenomena in islands or areas isolated from themain power grid. A possible countermeasure for powerfailures is the use of a UPS in combination with a smallgenerating unit on the single site of the server, while thehome PC power supply reliability can be improved by theuse of a UPS since it is characterized by an acceptable cost.The implementation of these countermeasures will signifi-cantly limit the vulnerability of the system by the air-con-ditioning failure, which is a high-risk failure for the HCC
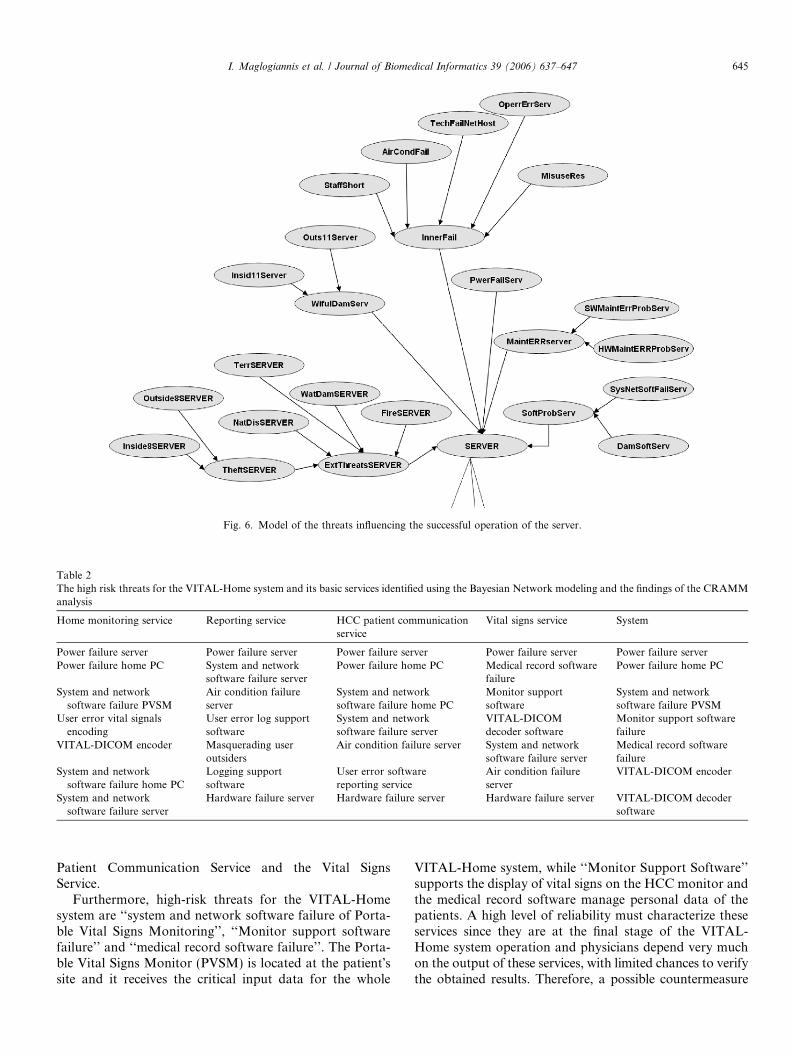
Fig. 6. Model of the threats influencing the successful operation of the server.
Table 2The high risk threats for the VITAL-Home system and its basic services identified using the Bayesian Network modeling and the findings of the CRAMManalysis
Home monitoring service Reporting service HCC patient communicationservice
Vital signs service System
Power failure server Power failure server Power failure server Power failure server Power failure serverPower failure home PC System and network
software failure serverPower failure home PC Medical record software
failurePower failure home PC
System and networksoftware failure PVSM
Air condition failureserver
System and networksoftware failure home PC
Monitor supportsoftware
System and networksoftware failure PVSM
User error vital signalsencoding
User error log supportsoftware
System and networksoftware failure server
VITAL-DICOMdecoder software
Monitor support softwarefailure
VITAL-DICOM encoder Masquerading useroutsiders
Air condition failure server System and networksoftware failure server
Medical record softwarefailure
System and networksoftware failure home PC
Logging supportsoftware
User error softwarereporting service
Air condition failureserver
VITAL-DICOM encoder
System and networksoftware failure server
Hardware failure server Hardware failure server Hardware failure server VITAL-DICOM decodersoftware
I. Maglogiannis et al. / Journal of Biomedical Informatics 39 (2006) 637–647 645
Patient Communication Service and the Vital SignsService.
Furthermore, high-risk threats for the VITAL-Homesystem are ‘‘system and network software failure of Porta-ble Vital Signs Monitoring’’, ‘‘Monitor support softwarefailure’’ and ‘‘medical record software failure’’. The Porta-ble Vital Signs Monitor (PVSM) is located at the patient�ssite and it receives the critical input data for the whole
VITAL-Home system, while ‘‘Monitor Support Software’’supports the display of vital signs on the HCC monitor andthe medical record software manage personal data of thepatients. A high level of reliability must characterize theseservices since they are at the final stage of the VITAL-Home system operation and physicians depend very muchon the output of these services, with limited chances to verifythe obtained results. Therefore, a possible countermeasure
646 I. Maglogiannis et al. / Journal of Biomedical Informatics 39 (2006) 637–647
to combat these threats is the extensive implementation ofverification and validation procedures during the develop-ment and maintenance of these software units, whichshould be also applied periodically during the field opera-tion of the VITAL-Home system, to detect any deviationstimely and calibrate the system accordingly. This counter-measure may be implemented also to the VITAL-DICOMEncoder and Decoder software, whose failures appear tobe two other high-risk threats. Furthermore, another pos-sible countermeasure is the periodic backup of the medicaldata and patient�s records managed by the system for aquick and reliable restoration in case of a possible softwarefailure and loss of data.
In Table 2, there are a number of high-risk threatsrelated to the human factor, such as user errors in usingthe software assets of the VITAL-Home system and
Table 3Ranking of the VITAL-Home system threats based on the BayesianNetwork conditional probabilities
Power failure serverPower failure home PCSystem and network software failure PVSMUser error vital signals encodingVITAL-DICOM encoder/decoder failureSystem and network sw failure of home PC/ServerHW maintenance error of PVSM/home PC/ServerAir conditioning failure of the serverUser error in application SW of reporting serviceFire or water damage at home PCMASQ. user identity at home monitoring service by outsidersUser error in application SW of vital signs collection serviceLogging support SW of reporting serviceNetwork failure of PTT serviceSW maintenance error at home PC/ServerTechnical failure of network host at the serverUnauthorized use of applicationWilful damage by insider at home PCTechnical failure of non-network host at home PCTheft by outsiders at the serverIntroduction of damaging or disruptive SW at the server/home PCInternet service failsMisuse of system resources at home PC/ServerWilful damage by outsiders at the server/home PCCommunication infiltration by outsidersTheft at the home PC/ServerCommunication infiltration by contracted services providersFire at the serverInternet line failure at the reporting serviceMASQ. user identity at home monitoring service etc by contracted service
providerServer modem failureOperation error at the PVSM/home PC/ServerHome pc modem failureNetwork failure of PTT lineCommunication protocol failure at the home monitoring serviceWilful damage by insider at server communication infiltration by insidersMasquerading user identity by insidersNatural disaster at the home PCNatural disaster at the serverStaff shortage at the serverTerrorism at the home PC/ServerWater damage at the server
‘‘Masquerading the User Identity’’ during system opera-tion. These threats may result in erratic input to the sys-tem and deterioration of system confidentiality, whichmay discourage physicians and patients of further use.There are a number of possible countermeasures to limitthe vulnerability of the VITAL-Home system to thesethreats, such as proper training of the VITAL-Home sys-tem users and enhanced security options for systemoperation.
Finally, in Table 3 a more detailed of list of threats asthey are ranked by the Bayesian Network model giventhe VITAL-Home system has failed. A corresponding listis constructed for each of the five basic system services,which the results of Table 2 stem from.
7. Conclusions
Healthcare information and patient monitoring sys-tems are safety–critical applications managing and pro-cessing valuable personal information of patients. Riskanalysis and management of such systems is a necessity,to improve the quality of the provided services andencourage the implementation of technology in new areasof application. An improved methodology has been pre-sented that combines basic features of the CRAMM riskanalysis method with the Bayesian Network modelingtechnique to identify assets, threats and vulnerabilitiesof patient telemonitoring systems and present these inter-relationships in a concise and flexible model. The Bayes-ian Network semantics support the representation ofcomplex interactions among and has been compared toclassical dependability modeling techniques, such as theFault Trees.
A patient monitoring system (VITAL-Home) was pre-sented and the system�s assets, threats and vulnerabilitieshave been thoroughly analyzed using the basic features ofthe CRAMM risk analysis framework. The findings ofthe analysis have been used to develop a Bayesian Networkmodel to rank the threats with the highest risk, based ontheir posterior probability of occurrence in the case ofthe basic services and system failure. The proposed modelprovides the ability to perform complicated inferences byexploiting any possible evidence of system operation, whileit is characterized by a flexibility of modeling more compli-cated dependencies in any future system modifications. Thepower supply failure of VITAL-Home system�s server andpatient�s home PCs were detected as the highest riskthreats. Moreover, threats concerning failures in certainsoftware modules, user errors or data security exhibit alsohigh risk. Several countermeasures were suggested to limitthe vulnerability of the VITAL-Home system operation tothese threats, such as the adoption of UPS devices or smallpower generating units, extensive monitoring of the soft-ware�s impeccable operation by testing, verification, andvalidation procedures, backup of medical data, trainingfor the users of the VITAL-Home system and adoptionof strict security options.
I. Maglogiannis et al. / Journal of Biomedical Informatics 39 (2006) 637–647 647
References
[1] Park S et al. Real-time monitoring of patient on remote sites. In:Proceedings of the 20th annual international conference on IEEEEMBS, vol. 20, No. 3; 1998. p. 1321–25.
[2] Yang B, Rhee S, Asada HH. A twenty-four hour tele-nursing systemusing a ring sensor. In: Proceedings of the 1998 IEEE internationalconference robotics automation; 1998. p. 387–92.
[3] Pavlopoulos S, Kyriakou E, Berler A, Dembeyiotis S, Koutsouris D.A novel emergency telemedicine system based on wireless communi-cation technology—AMBULANCE. IEEE Trans Inform TechnolBiomed 1998;2:261–7.
[4] Andreasson J et al. Remote system for patient monitoring usingBluetooth/spl trade. Sensors, 2002. Proc IEEE 2002;1:304–7.
[5] Maglaveras N et al. Home care delivery through the mobiletelecommunications platform: the Citizen Health System (CHS)perspective. Int J Med Inform 2002;68:99–111.
[6] Dunn WR. Practical design of safety–critical computer sys-tems. Solvang CA: Reliability Press; 2002.
[7] Leveson N, Turner CS. An investigation of the Therac-25 accidents.Computer 1993:18–41.
[8] Council of Europe, Recommendation No. R (97) 5 of the Committeeof Ministers to Member States on the Protection of Medical Data,<http://www.cm.coe.int/ta/rec/1997/word/97r5.doc/>; 1997.
[9] Birolini A. Reliability engineering: theory and practice. Ber-lin: Springer; 2000.
[10] Vesely WE, Goldberg FF, Roberts NH, Haasl DF. Fault Treehandbook. Technical Report NUREG-0492, U.S. Nuclear Regula-tory Commission, <http://www.nrc.gov//>; 1981.
[11] Stamatis DH. Failure mode and effect analysis: FMEA fromtheory to execution. Milwaykee, Wisconsin: ASQ Quality press;2003.
[12] Modarres M, Kaminskiy M, Krivtsov V. Reliability engineering andrisk analysis. New York: Marcel Dekker; 1999.
[13] Craft R, Wyss G, Vandewart R, Funkhouser D. An open frameworkfor risk management. In: 21st National Information Systems SecurityConference proceedings, October 1998.
[14] Bowles JB, Wan C. Software failure modes and effects analysisfor small embedded control system. In: Annual reliability andmaintainability symposium, Philadelphia, Pennsylvania USA; 2001.p. 1–6.
[15] Stathiakis N, Chronaki C, Skipenes E, Henriksen E, CharalambousE, Sykianakis A, et al. Risk assessment of a cardiology eHealthservice in HYGEIAnet. Proc Computers in Cardiology (CIC�2003)2003:201–4.
[16] Cervesato I, Meadows C. Fault-Tree Representation of NPATRLSecurity Requirements. Workshop on Issues in the Theory of Security(WITS�03), Poland; 2003.
[17] UK Security Service. CRAMM: The UK Government�s RiskAnalysis and Management Method.
[18] Limnios N. Arbres de Defaillances [in French]. Editions Hermes;2005.
[19] Finn JV. An Introduction to Bayesian Networks. Londan: UCLPress; 1996.
[20] Tang ZH, Dugan JB. Minimal cut set/sequence generation fordynamic Fault Trees. In: Annual reliability and maintainabilitysymposium, 2004 proceedings; 2004. p. 207–13.
[21] Bobbio A et al. Improving the analysis of dependable systems bymapping fault trees into Bayesian networks. Reliability Engineeringand System Safety 2001;71:249–60.
[22] Sigurdsson JH, Walls LA, Quigley JL. Bayesian belief nets formanaging expert judgment and modeling reliability. Quality andReliability Engineering International 2001;17:181–90.
[23] Kadie CM, Hovel D, Horvitz E. MSBNx: a component-centrictoolkit for modeling and inference with Bayesian Networks. Micro-soft Research Technical Report MSR-TR-2001-67; July 2001.
[24] Weston C, Penny W, Julian D. Guidelines for the early managementof patient with myocardial infarction. BMJ 1994;308:767–71.
[25] Evans T. Cardiac arrests outside hospital. BMJ 1998;316:1031–132.[26] Barro S, Presedo J, Castro D, Fernandez-Delgado M, Fraga S, Lama
M, et al. Intelligent telemonitoring of critical care patients. IEEEEMB Mag 1999;18(4):80–8.
[27] Strode S, Gustke S, Allen A. Technical and clinical progress intelemedicine. J Am Med Assoc 1999;281:1066–8.
Related Documents