This Provisional PDF corresponds to the article as it appeared upon acceptance. Copyedited and fully formatted PDF and full text (HTML) versions will be made available soon. Rise of oceanographic barriers in continuous populations of a cetacean: the genetic structure of harbour porpoises in Old World waters BMC Biology 2007, 5:30 doi:10.1186/1741-7007-5-30 Michael C Fontaine ([email protected]) Stuart JE Baird ([email protected]) Sylvain Piry ([email protected]) Nicolas Ray ([email protected]) Krystal A Tolley ([email protected]) Sarah Duke ([email protected]) Alexei Birkun Jr ([email protected]) Marisa Ferreira ([email protected]) Thierry Jauniaux ([email protected]) Angela Llavona ([email protected]) Bayram Ozturk ([email protected]) Ayaka A Ozturk ([email protected]) Vincent Ridoux ([email protected]) Emer Rogan ([email protected]) Marina Sequeira ([email protected]) Ursula Siebert ([email protected]) Gisli A Vikingsson ([email protected]) Jean-Marie Bouquegneau ([email protected]) Johan R Michaux ([email protected]) ISSN 1741-7007 Article type Research article Submission date 29 December 2006 Acceptance date 25 July 2007 Publication date 25 July 2007 Article URL http://www.biomedcentral.com/1741-7007/5/30 Like all articles in BMC journals, this peer-reviewed article was published immediately upon acceptance. It can be downloaded, printed and distributed freely for any purposes (see copyright notice below). BMC Biology © 2007 Fontaine et al., licensee BioMed Central Ltd. This is an open access article distributed under the terms of the Creative Commons Attribution License ( http://creativecommons.org/licenses/by/2.0), which permits unrestricted use, distribution, and reproduction in any medium, provided the original work is properly cited.

Welcome message from author
This document is posted to help you gain knowledge. Please leave a comment to let me know what you think about it! Share it to your friends and learn new things together.
Transcript
This Provisional PDF corresponds to the article as it appeared upon acceptance. Copyedited andfully formatted PDF and full text (HTML) versions will be made available soon.
Rise of oceanographic barriers in continuous populations of a cetacean: thegenetic structure of harbour porpoises in Old World waters
BMC Biology 2007, 5:30 doi:10.1186/1741-7007-5-30
Michael C Fontaine ([email protected])Stuart JE Baird ([email protected])
Sylvain Piry ([email protected])Nicolas Ray ([email protected])
Krystal A Tolley ([email protected])Sarah Duke ([email protected])
Alexei Birkun Jr ([email protected])Marisa Ferreira ([email protected])Thierry Jauniaux ([email protected])
Angela Llavona ([email protected])Bayram Ozturk ([email protected])
Ayaka A Ozturk ([email protected])Vincent Ridoux ([email protected])
Emer Rogan ([email protected])Marina Sequeira ([email protected])
Ursula Siebert ([email protected])Gisli A Vikingsson ([email protected])
Jean-Marie Bouquegneau ([email protected])Johan R Michaux ([email protected])
ISSN 1741-7007
Article type Research article
Submission date 29 December 2006
Acceptance date 25 July 2007
Publication date 25 July 2007
Article URL http://www.biomedcentral.com/1741-7007/5/30
Like all articles in BMC journals, this peer-reviewed article was published immediately uponacceptance. It can be downloaded, printed and distributed freely for any purposes (see copyright
notice below).
BMC Biology
© 2007 Fontaine et al., licensee BioMed Central Ltd.This is an open access article distributed under the terms of the Creative Commons Attribution License (http://creativecommons.org/licenses/by/2.0),
which permits unrestricted use, distribution, and reproduction in any medium, provided the original work is properly cited.

Articles in BMC journals are listed in PubMed and archived at PubMed Central.
For information about publishing your research in BMC journals or any BioMed Central journal, go to
http://www.biomedcentral.com/info/authors/
BMC Biology
© 2007 Fontaine et al., licensee BioMed Central Ltd.This is an open access article distributed under the terms of the Creative Commons Attribution License (http://creativecommons.org/licenses/by/2.0),
which permits unrestricted use, distribution, and reproduction in any medium, provided the original work is properly cited.
- 1 -
Rise of oceanographic barriers in continuous
populations of a cetacean: the genetic structure of
harbour porpoises in Old World waters
Michaël C Fontaine1,2*, Stuart JE Baird2, Sylvain Piry2, Nicolas Ray3, Krystal A
Tolley4,5, Sarah Duke6, Alexei Jr Birkun7, Marisa Ferreira8, Thierry Jauniaux9, Ángela
Llavona10, Bayram Öztürk11, Ayaka A Öztürk11, Vincent Ridoux12, Emer Rogan13,
Marina Sequeira14, Ursula Siebert15, Gísli A Vikingsson16, Jean-Marie Bouquegneau1
and Johan R Michaux2,17
1MARE – Laboratory for Oceanology, University of Liège, Bat B6c, Liège (Sart
Tilman) 4000, Belgium 2INRA, UMR CBGP (INRA / IRD / Cirad / Montpellier SupAgro), Campus
international de Baillarguet, CS 30016, F-34988 Montferrier-sur-Lez cedex, France 3Computational and Molecular Population Genetics Laboratory, Zoological Institute,
University of Bern, Switzerland 4Marine Mammal Division, Institute of Marine Research, Bergen, Norway 5Molecular Systematics Laboratory, South African National Biodiversity Institute,
Private Bag X7, Claremont 7735, Cape Town, South Africa 6Department of Zoology, University College, Dublin, Ireland 7Laboratory of Biotechnological Research in Ecology, Medicine and Aquaculture
(BREMA), Simferopol, Ukraine 8Portuguese Wildlife Society Estação de Campo de Quiaios. Apt 16 EC Quiaios.
3081-101 Figueira da Foz, Portugal 9Department of Pathology, Veterinary College, Sart Tilman B43, University of Liège,
4000 Liège, Belgium 10Coordinadora para o Estudio dos Mamiferos MAriños, CEMMA, Gondomar, Spain 11Faculty of Fisheries, Istanbul University, Ordu Cad. 200, Laleli-Istanbul, Turkey 12Centre de Recherche sur les Mammifères Marins, Institut de la Mer et du Littoral,
Avenue du Lazaret, Port des Minimes, 17000 La Rochelle, France
- 2 -
13Department of Zoology, Ecology and Plant Science, University College, Cork,
Ireland 14Instituto da Conservação da Natureza, Rua de Santa Marta, 55, 1150-999 Lisboa,
Portugal 15Forschungs- und Technologie Zentrum, Westküste, Universität Kiel, Hafentörn 1,
25761 Büsum, Germany 16Marine Research Institute, Skúlagata 4, P.O. Box 1390, 121 Reykjavík, Iceland 17Génétique des Microorganismes, Département des Sciences de la Vie, Institut de
Botanique B22, Université de Liège, 4000 Liège, Belgium
*Corresponding author
Email addresses:
MCF: [email protected]
SJEB: [email protected]
KAT: [email protected]
AJB: [email protected]
AAO: [email protected]
GAV: [email protected]
JMB: [email protected]
JRM: [email protected]
- 3 -
Abstract
Background
Understanding the role of seascape in shaping genetic and demographic population
structure is highly challenging for marine pelagic species such as cetaceans, for which
there is generally little evidence of what could effectively restrict their dispersal. In
the present work, we applied a combination of recent individual-based landscape
genetic approaches to investigate the population genetic structure of a highly mobile
extensive range cetacean, the harbour porpoise in the eastern North Atlantic, with
regards to oceanographic characteristics that could constrain its dispersal.
Results
Analyses of 10 microsatellite loci for 752 individuals revealed that most of the
sampled range in the eastern North Atlantic behaves as a ‘continuous’ population that
widely extends over thousands of kilometres with significant isolation by distance
(IBD). However, strong barriers to gene flow were detected in the south-eastern part
of the range. These barriers coincided with profound changes in environmental
characteristics and isolated, on a relatively small scale, porpoises from Iberian waters
and on a larger scale porpoises from the Black Sea.
Conclusions
The presence of these barriers to gene flow that coincide with profound changes in
oceanographic features, together with the spatial variation in IBD strength, provide
for the first time strong evidence that physical processes have a major impact on the
demographic and genetic structure of a cetacean. This genetic pattern further suggests
habitat-related fragmentation of the porpoise range that is likely to intensify with
predicted surface ocean warming.
- 4 -
Background
In the marine realm, pelagic species that have large geographic range and high
dispersal capabilities represent a serious challenge to the idea of allopatric divergence
(i.e., a large continuous population broken up into smaller units by extrinsic barriers)
and to speciation processes in a seemingly continuous environment [1]. The high
mobility of these species and the dearth of barriers to gene flow in oceans might be
expected to limit the division of species’ ranges and, as a result, even distant regions
might be connected genetically [1,2]. Although examples of genetic homogeneity
over large distances are common in marine systems, there are also many examples of
surprising population structure in marine species with high dispersal potential [1,3-7].
Cetaceans are good examples of this kind of species. Despite their broad range and
their high dispersal capabilities, many cetaceans often show substantial genetic
structure at regional or even fine scale, although the extent varies among species [8].
It is generally argued that these patterns, not always correlated with geographic
features, are related to a combination of complex behaviours, such as philopatry,
specialisations for local resources, or social organisation into kinship groups [8,9]. On
the other hand, while the dispersal and segregation of populations of terrestrial
mammals are frequently influenced by geographic features or climatic characteristics,
few such obvious barriers are expected to restrict cetacean dispersal and gene flow in
the world’s oceans [10,11]. Variation in oceanographic properties of the water
column, such as depth, temperature, currents and winds, are known as important
factors in the life of these animals, most obviously in conditioning the availability of
their food (for example, see [12]), but their effect on cetacean dispersal and on
population structure remains enigmatic.
- 5 -
Small coastal cetaceans such as those of the porpoise family are a model of choice to
investigate this issue because they have to face a suite of intrinsic problems not
encountered by larger dolphins and whales. Their small size, their demanding
reproductive schedule, and their limited ability to store energy force a strong
dependency on their food [13,14]. Therefore, we expect that variation in
oceanographic features that determine food availability and abundance (i.e.,
bathymetry, temperature and primary productivity) should markedly affect local
density and dispersal of porpoises. If true, their population genetic structure should
correlate, at least partly, with oceanographic characteristics. To test this hypothesis,
we examined the genetic structure of one the most widely distributed porpoises, the
harbour porpoise Phocoena phocoena (L. 1758), with regards to seascape
characteristics. Harbour porpoises occur fairly continuously throughout cold coastal
waters of the North Pacific and the North Atlantic, with a relict population in the
Black Sea separated from the Atlantic range by the Mediterranean Sea where
porpoises are nowadays absent [15-17]. We analysed genetic polymorphism at 10
microsatellite loci for an extensive sampling (n = 752) covering the main distribution
of harbour porpoises in the central and eastern North Atlantic (Figure 1) using a
combination of recent individual-based landscape genetic approaches [18-21].
Here, we provide strong and clear evidence that seascape imposes major constraints
on the demographic and genetic structure of a cetacean, and thus on its dispersal. This
finding is of general interest in the context of climate change and habitat
fragmentation for marine species, as ecosystems in the eastern North Atlantic are
- 6 -
shifting toward a warmer dynamic equilibrium with significant changes already
detected in plankton and fish assemblages.
Results
We applied two complementary Bayesian clustering algorithms, namely Structure
v.2.1 [18, 19] and Geneland v.1.0.7 [20], to infer population structure (i.e., a number
of clusters, K) and to assign individuals (probabilistically) to populations (or clusters)
based on individual multilocus genotypes and, for the second algorithm, also on
individual spatial origins. Both of these approaches assume that populations are
panmictic units with distinct allele frequencies. To test whether individual dispersal is
restricted in space, we analysed the pattern of isolation by distance (IBD) using the
individual-based approach developed by Rousset [21]. This involves regression of an
index of genetic differentiation on marine geographic distance among pairs of
individuals (see Methods). Finally, recent migration among populations (within the
last few generations) was assessed using a Bayesian model implemented in BayesAss
v.1.3 [22]. This algorithm requires few assumptions for assigning individual
genotypes to population of origin and, in particular, relaxes the key assumption of
Hardy-Weinberg (HW) equilibrium within populations.
Clustering analyses
Structure analysis
Structure provided consistent results over 10 replicated runs tested for each K and
over the different models tested (see Methods). Generally, in highly structured data
sets, as K is increased the most divergent groups separate into distinct clusters first
[18,23]. The probability of the data (Ln Pr(X|K)) greatly increased from K = 1 to
K = 2, and then reached a maximum value at K = 3, after which the values decreased
- 7 -
gradually (Figure 2a). The increase of likelihood (∆(Ln Pr(X|K)); Figure 2b), i.e. the
gain of explanatory power of the model when adding a new cluster to the analysis, is
high at K changing from 1 to 2. At K = 2, the two clusters are anchored by the Black
Sea (BS) and the North Atlantic porpoises (Figure 3). The addition of a third cluster
(K = 3) further increases the probability of the data, the gain of power becoming null
or negative for higher values of K (Figure 2b). At K = 3, the North Atlantic cluster
splits in two distinct parts that persist and become more clearly distinct for higher
values of K (Figure 3). The first is a genetically homogeneous cluster that
encompasses porpoises from Spain and Portugal with high membership coefficients
(Iberian cluster, IB). The second group is composed of the remaining individuals
sampled further north (North Atlantic cluster, NAt). Most of these display
membership coefficients that tend to distribute evenly across clusters others than the
Black Sea and Iberian clusters as K is increased. The same pattern was observed
whatever the model considered in the analysis. This pattern might result from (a) lack
of sufficient signal in the data set to confidently assign these individuals, and/or (b)
low underlying genetic structure of porpoises in that area, or (c) departure from the
basic assumptions of the model. Instead of discrete genetic units at HW and linkage
equilibrium, the population structure in northern waters might be much more
continuous than discrete, with continuous gradations in allele frequency over the
range (see below).
Geneland analysis
While Structure uses only the individual multilocus genotype data to infer the
population structure, Geneland also exploits the spatial positions of the individual
samples as a supplemental parameter in the analysis [20]. Interesting features of the
Geneland model that further distinguish it from that of the Structure model are its
- 8 -
ability (a) to deal with an unknown number of populations simultaneously with other
parameters, (b) to locate population boundaries across space, and (c) to account for
uncertainty in the positioning of sampled individuals (see Methods and [20] for
further details). This last feature is particularly useful in the present context as the
locations of sampled harbour porpoises, composed of by-caught and stranded animals,
might be poorly representative of the normal range of individuals.
The Geneland model provided results consistent with those of the Structure one.
Posterior distributions of the estimated number of populations (K) across 10 replicates
displayed a clear mode at K = 3 in 7 out of the 10 replicates (Figure 2c) and at K = 4
in the remaining trials (Figure 2d). Similar to the Structure results, Geneland
identified three spatially coherent clusters (Figures 4 and 5): the first gathers all
porpoises from the Black Sea and Marmara Sea (the BS cluster) isolated from those in
the Atlantic by the Mediterranean (Figure 5a); the second gathers the porpoises from
the Iberian peninsula (the IB cluster) isolated from samples further north by a barrier
to gene flow located in the southern Bay of Biscay (Figure 5b); and the third is
unequivocally composed of the samples further north in the Atlantic (the NAt cluster),
widely distributed from the French coast of the Bay of Biscay to the Arctic waters of
Iceland and Norway (Figure 5c). This last result contrasts slightly with that of the
Structure analysis (compare Figures 3 and 4). While the Structure model did not
confidently assign these individuals, Geneland assigned almost all them to the NAt
cluster with high membership coefficients that remain consistent even for higher
values of K (Figure 4; K = 4). This suggests that taking into account the spatial
context of individuals might improve the efficiency of the analysis. No individuals
were assigned to the fourth cluster detected in 3 out of the 10 Geneland replicates
(Figure 4, K = 4, green colour). This is not surprising as this cluster is centred on
- 9 -
landmass (not shown). Such occurrences of “ghost” populations, with no individuals
assigned, is reported by Geneland’s authors as a poorly understood problem [20]. It
could be related to the process of tiling a heterogeneous sampling distribution, with
“landmass” tiles being reported as a “ghost” population. As there are no individuals
assigned to this cluster, as it only occurs in a minor proportion of the trials and as it
does not affect biological interpretation in the present context, this “ghost” population
can be ignored (as suggested by the Geneland authors [20]).
Genetic diversity and differentiation among inferred populations
The three identified clusters differed greatly with respect to their genetic diversity
assessed using heterozygosity and allelic richness, corrected for difference in sample
size (Table 1). Harbour porpoises from Iberian waters and the Black Sea displayed
comparable genetic diversity that was much lower than that observed in the NAt
cluster. For example, the allelic richness over all loci was twice as low in the Black
Sea and in Iberia as it was in the NAt cluster (Wilcoxon paired-sample test: BS–IB:
p = 0.878; IB–NAt: p < 0.005; BS–NAt: p < 0.005).
The amount of genetic differentiation among clusters, estimated using FST [24],
illustrated the high divergence of Black Sea harbour porpoises from those in the North
Atlantic (FST: BS–IB = 0.314, 95% Confidence Interval (CI): 0.240–0.381; BS–
NAt = 0.147, 95% CI: 0.116–0.179). The FST values between Iberian porpoises and
those sampled further north in the Atlantic were lower, but remained substantial (FST:
IB–NAt = 0.090, 95% CI: 0.054–0.131). In contrast, FST values between parts of the
NAt cluster (Figure 1: 3A–C) were much lower (FST ≤ 0.001; see Additional file 1).
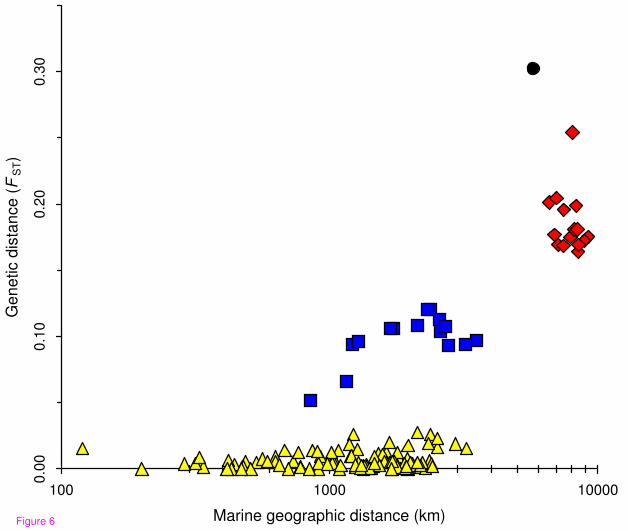
Figure 6 provides a global view of the system. It shows that for pairs of sampled
localities from different clusters, genetic differentiation is much larger than that
- 10 -
between intracluster pairs that have the same geographic distance. In other words,
genetic differentiation between clusters is not only induced by geographic distance
between them but also by barriers to gene flow.
Tests of departure from HW equilibrium (Table 1) show no significant deviation for
porpoises from Iberia and the Black Sea, but a significant deficiency in heterozygosity
at 9 of the 10 loci analysed in the NAt cluster. This slight heterozygote deficiency
recorded at almost all loci in porpoises of northern Atlantic waters and the failure of
the Structure model to assign these individuals in comparison to the Geneland model
suggest that a subtle spatial structure (i.e., Wahlund effect) with a continuous
gradation in allele frequencies across regions and/or isolation by distance could occur
[23,25].
Isolation by distance analyses
When IBD occurs in ‘continuous’ populations distributed in a two-dimensional
habitat, genetic differentiation among individuals is expected to increase linearly with
the logarithm of geographic distance [21,26]. This linear relationship was
demonstrated to hold best at local geographical scale because heterogeneity of
demographic parameters (i.e., dispersal and/or density) and the effect of mutation rate
are reduced and hence their confounding influence on genetic differentiation is also
reduced [27,28]. However, the scale of population ranges in the marine realm is often
unknown and can be quite large (of the order of hundreds or thousands of kilometres
squared), especially for cetacean species [29]. As we cannot know the appropriate
scale a priori for the NAt cluster, we conducted the IBD analyses considering the
range at three different spatial scales (Figure 1 and Table 2). We first analysed IBD in
the global range of the NAt cluster that latitudinally extends over 3 237 km from the
- 11 -
French coast of the Bay of Biscay northwards to the arctic waters of Norway and
Iceland (global scale). Then, we subdivided the global range into two parts of equal
latitudinal range (Medium scale: NAt-2A and B), then into three parts (Small scale:
NAt-3A–C) and repeated the analysis on each part.
We found a significant positive relationship between the index of genetic
differentiation (ar) and the marine geographic distance among porpoises in the NAt
cluster at all scales considered (Table 2) except one: the region NAt-3B. This latter
corresponds to the area where the sample size is the lowest (n = 141), where the
sampling is the most spatially heterogeneous (Figure 1), and also where the marine
distances among porpoises are the shortest (Table 2). Therefore, the absence of
significant evidence in this region likely results from the low power of the analysis to
detect IBD (see, for example, [30]).
Rousset [21, 26] demonstrated that the regression slope is proportional to 1/4πDσ2,
where D is the effective density of individuals and σ2 the second moment of axial
dispersal distance, best described as the mean squared parent-offspring axial dispersal
distance. σ2 can be understood as a measure of the speed at which two gene lineages
issuing from an ancestor move away from each other, as it is the rate at which the
mean squared axial distance between these two lineage increases per time unit [30].
The comparison among subset areas at the medium and at small scale showed
significant north-south variation in the parameters of the regression for the 10
microsatellite loci (Table 2). The slope (or 1/4πDσ2) in the south part of the NAt
cluster was significantly higher than that in northern parts at medium scale (Wilcoxon
paired-sample test, 2A–2B: p = 0.037) and at small scale (Wilcoxon paired-sample
- 12 -
test, 3A–3B: p = 0.005; 3A–3C: p = 0.046; 3B–3C: p = 0.399), suggesting that either
density (D), dispersal (σ2), or both are reduced in the south part compared to the
north.
Recent migration rates among populations
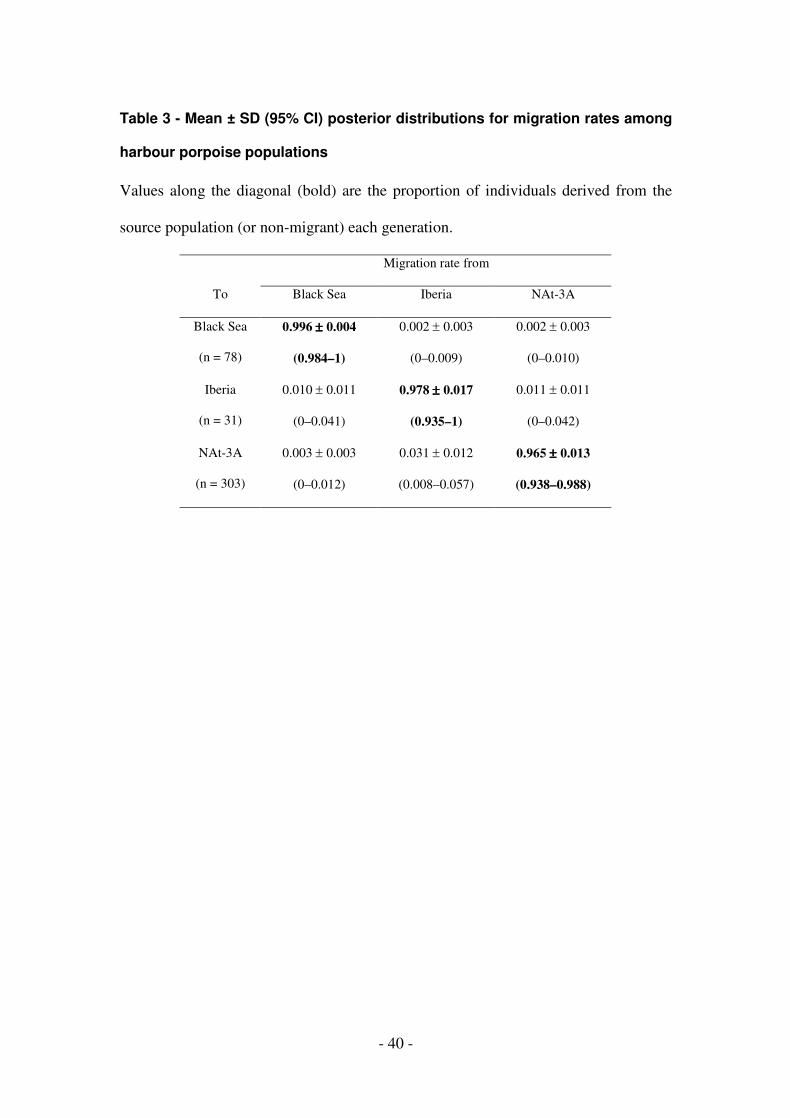
Recent migration rates (i.e., within the last few generations) were estimated between
porpoises from the Black Sea, Iberia and the southern part of the NAt cluster (NAt-
3A) adjacent to the detected barrier to gene flow (Table 3) using the BayesAss v.1.3
algorithm [22]. When simulating the effect of having no information in the data from
which to estimate migration rates, we obtained a 95% CI of 0.675–0.992 for the
proportions of individuals derived from the source populations each generation (or
non-migrant rates) and a CI of 0.001–0.261 for migration rates. Confidence intervals
recovered from the data set were considerably smaller than those obtained from the
null hypothesis (Table 3), suggesting that the data set contained an appreciable
amount of information to support the results.
Virtually all porpoises from the Black Sea were identified as non-migrant (Table 3).
Although this result is not surprising, as the Black Sea population is now
geographically isolated from the Atlantic populations by the Mediterranean Sea, this
result can be useful as reference to assess the status of the Iberian population. Almost
all porpoises from Iberian waters were also identified as non-migrant (98% of the
individuals and the 95% CI upper limit including 1), while the NAt cluster showed a
slightly lower non-migrant proportion (96%; Table 3). The migration rates between
Iberia and the NAt cluster were low (m ≤ 0.03) with the lower 95% CI bounds not
different from 0, except in one case: the migration rate from Iberia to the NAt cluster
- 13 -
appeared slightly higher than the reverse, but the large overlap of 95% CIs did not
allow us to conclude there was asymmetry in migration rates.
Discussion
The individual-based approaches we used here revealed that most of the harbour
porpoise range in the central and eastern North Atlantic behaves as a ‘continuous’
population that widely extends over thousands of kilometres from the French coasts of
the Bay of Biscay northwards to the arctic waters of Norway and Iceland, with
significant isolation by distance. This striking result is concordant with the low but
sometimes significant level of genetic differentiation previously reported at
microsatellite loci between arbitrarily defined groups in the North Sea and adjacent
waters [31,32]. However, strong barriers to gene flow in the south-eastern North
Atlantic range isolate, on a relatively small scale, porpoises from Iberian waters and
on a larger scale porpoises from the Black Sea.
The total isolation of harbour porpoises from the Black Sea has long been suggested
on the basis of the lack of field observation of porpoises in the Mediterranean Sea
[17], of private mtDNA alleles reported in that population [33], and of morphological
differences [34]. Our results lend further support to this hypothesis. The pronounced
genetic footprint of this isolation left at nuclear and mtDNA loci suggest this is an
ancient isolation that might date back to the last Ice Age ([35] and Fontaine,
unpublished results). The genetic differentiation detected at microsatellite loci
between the Iberian porpoises and those further north was not apparent at the mtDNA
control region previously analysed [35]. The lack of mitochondrial lineage sorting and
of private microsatellite alleles suggests that the differentiation we observed with
- 14 -
microsatellite analyses is caused by a more recent isolation process than that of the
Black Sea.
The corollary of these results is the inference of strong barriers to gene flow in the
southern Bay of Biscay and in the Mediterranean Sea that isolate almost completely
the Iberian and Black Sea populations. These barriers coincide with strong
oceanographic changes of similar nature (compare Figure 5 with Figures 1 and 7). To
take them in turn, the conditions in the southern Bay of Biscay differ sharply from
those at its margins [36,37]. The continental shelf, widely extended in the northern
part, narrows considerably to the south and is cleaved asunder by the Cap Breton
canyon, which drops to the abyssal plain in the south-east, only 10 km from the shore.
Warm and oligotrophic surface water spreads from the Cap Breton canyon to cover
half of the southern Bay in summer [36,37]. In contrast, off the Iberian Atlantic coast
upwelling becomes evident from late spring to early autumn [38], bringing to the
surface cold nutrient-enriched waters that support a rich food-web [39]. On the north
side of the barrier, shallow, cold, and nutrient rich waters prevail most of the year
from the French waters of the Bay of Biscay northward to the northern North Sea.
From a biogeographical point of view, the southern Bay of Biscay is not only a barrier
for porpoises but it is also a transition zone between the boreal and subtropical
provinces, with many species reaching their southern or northern limit of distribution
in that area [40].
Still further north, depth increases towards Nordic Seas (Figure 1), but waters remain
cold and highly productive [41]. However, the bathymetric change does not seem to
restrict gene flow in Nordic Seas, consistent with sightings of some porpoises
- 15 -
reported far offshore in deep water [42]. While this suggest there are few, if any,
potential barriers to dispersal of porpoises from the northern Bay of Biscay up to
Arctic waters, the heterozygosity deficit related to the detected IBD shows
nevertheless that porpoises do not mate randomly over that extended area and that
gene flow is spatially restricted. We observed a north-south variation in the IBD
pattern with higher IBD slope at the southern end of this range compared to northern
parts (Table 2). One could argue that this north-south variation in IBD pattern might
reflect drift disequilibrium [43] in northern areas associated with the postglacial
porpoise recolonisation of Nordic waters in contrast to the southern habitats, which
likely remained more stable in time. However, simulation-based sensitivity analysis of
current Dσ2 estimation to demographic instability in time and space conducted by
Leblois et al [44] showed that spatial expansion with constant density does not
significantly affect present-time Dσ2 estimation, especially when the spatial
expansion occurred 20 or more generations ago, as it is the case for postglacial
recolonisation. Consequently, the higher IBD slope detected in the southern area
(NAt-3A) compared to that in waters further north (NAt-3B and NAt-3C) most likely
represents a lower current-time Dσ2. Although we cannot exclude variation in σ2, a
lower porpoise density in southern waters is supported by field estimates based on
aerial and ship surveys conducted in the North Sea and adjacent waters [45,46]. These
variations in density (and maybe in dispersal patterns) likely reflect variation in
habitat. The southern part of the ‘continuous’ population (i.e., the northern part of the
Bay of Biscay, the English Channel and the southernmost part of the North Sea)
borders the barrier to gene flow detected in the southern Bay of Biscay and should
thus display sub-optimal conditions for porpoises while the middle (i.e., the central
- 16 -
and northern North Sea) and northern areas (i.e., the Nordic Seas) would be more
optimal for a cold water species such as the harbour porpoise.
The Mediterranean Sea displays similar characteristics to those encountered in the
southern Bay of Biscay but at a larger scale. The Mediterranean is composed mostly
of deep basins and narrow continental shelves with warm oligotrophic surface waters
prevailing most of the year [47]. These characteristics are likely quite unfavourable
for cold water species and might explain why the harbour porpoise is absent from this
area. The oceanographic conditions in the Black Sea are, by contrast, more suitable
for harbour porpoises with low salinity, colder and more nutrient rich surface waters
than in the Mediterranean Sea [48]. There are however reports of porpoise strandings
in the northern Aegean Sea [17]. This can be understood with regard to oceanographic
features in that area. The subdivision of the Aegean into two basins has long been
recognised. The northern basin is under the influence of cold, low salinity waters that
pour out of the Black Sea. This water is entrained into a cyclonic circulation affecting
the northern and western parts of the Aegean, causing an ecological isolation of the
northern basin from the southern basin [49]. In the southern basin the continental shelf
is very limited and the waters become quickly characteristic of Mediterranean waters
[50], unfavourable for harbour porpoises.
To summarise, surface water temperature and primary production seem to be the
factors that best characterise the nature of barriers to gene flow encountered across the
harbour porpoise range, their population structure, and their geographic distribution. It
is worth noting however that in oceanography, these two parameters are often linked
[51]. Indeed, the sea surface temperature acts as a useful proxy for other physical
- 17 -
processes, such as vertical stratification and nutrient contents, regulating the size
structure, taxonomic composition, and abundance of the phytoplankton community,
and thus the food availability for top predators [52, 53]. These results reinforce
previous ecological studies on harbour porpoises that reported significant
relationships between abundances and movements with sea surface temperature and
food availability [54, 55]. Although bathymetry can be important in harbour porpoise
ecology [56, 57], we showed that this factor alone seems not to restrict gene flow in
northern waters of the sampling range.
While the proximal causes of porpoise dependence on these habitat characteristics are
beyond the scope of this paper, the ultimate underlying mechanism is likely related to
the high energetic constraints this small cetacean has to face in order to survive. As
one of the smallest endothermic marine predators, and furthermore with limited
energy storage capacity, it is currently assumed that harbour porpoises must feed
frequently without prolonged periods of fasting [16,58]. Their distribution, their
movements, and in sum their overall biology should therefore be closely related to
those of their prey and thus to nutrient rich waters.
Conclusions
In the marine realm, community structure is shaped heavily by physical processes
(see, for example, [47,59]). In this study we provide for the first time strong evidence
that physical processes determining food availability have major impacts on the
demographic and genetic structure of a cetacean. The small body size of harbour
porpoises undoubtedly has profound consequences at all levels of their biology and
makes this species particularly sensitive to habitat variation. We can however
- 18 -
reasonably expect that this will be also applicable to other cetaceans of similar body
size, habitat and thermoregulation constraints. However, these constraints could be
reduced for larger cetaceans, leading to more complex patterns of population structure
not necessarily correlated to seascape features (see, for example, [11]). Ecosystems in
the eastern North Atlantic are shifting toward a warmer dynamic equilibrium with
significant changes detected in plankton and fish assemblages [51,60-62], but the
consequences for marine mammals remain to date unclear [63]. Although further
analyses would be require to address the demographic trends of these populations, the
genetic pattern highlighted here (i.e., the ancient isolation of harbour porpoises in the
Black Sea), the more recent isolation of those in Iberian waters, and the higher IBD in
the southern end of the northern Atlantic continuum, suggests that habitat-related
fragmentation of harbour porpoise range is under way and that it is likely to continue
with the predicted changes in climate.
Methods
Sample collection
Tissue samples were taken from by-caught and stranded harbour porpoises. A total of
752 animals distributed along the eastern North Atlantic range of the harbour porpoise
and in the Black Sea were analysed (Figure 1). Out of these, 515 samples were
analysed in this study and 237 samples from Iceland and Ireland were analysed by
Duke [64].
Most of the individuals were geo-referenced using GPS coordinates recorded at the
time or deduced from the reported location where the animal was found. These
coordinates are naturally rough approximations to the normal locations of animals,
- 19 -
especially for stranded animals, but this error can be considered negligible at the scale
of the study range. This source of error can also be taken into account in some of the
spatial analyses (see below).
DNA extraction and microsatellite analysis
Total genomic DNA was extracted from tissues using the DNeasyTM Tissue Kit
(Qiagen) following the manufacturer’s recommendations. Samples were genotyped at
10 microsatellite loci using the multiplex sets defined in [65]. Polymerase chain
reaction conditions were as reported in [65]. Amplified DNA was analysed for length
variations on an automated 96 capillary MegaBace-1000 DNA Analyser (Amersham
Biosciences) using Genetic Profiler v.1.5 (Amersham Biosciences).
Habitat characteristics
Data on habitat characteristics across the study range with respect to salinity and sea
surface temperature were taken from the National Oceanographic Data Centre
(NODC) [66]. Bathymetric data were extracted from the ETOPO2 dataset available
on the US National Geophysical Data Centre (NGDC) [67] and the data on
chlorophyll concentration were taken from the NASA Sea-viewing Wide Field-of-
view Sensor database (SeaWIFS) [68].
Clustering analyses
We applied two Bayesian model-based clustering algorithms to infer population
structure and to assign individuals (probabilistically) to clusters without a priori
knowledge of population units and limits.
Structure procedure
The first approach, implemented in Structure v.2.1, uses individual multilocus
genotype data to cluster individuals into K groups while minimising Hardy-Weinberg
- 20 -
disequilibrium and gametic phase disequilibrium between loci within groups [18,19].
The estimation procedure consists of running trial values of the number of populations
K and then comparing the estimated log probability of data under each K,
Ln [Pr(X|K)]. We conducted a series of independent runs with different proposals for
K, testing all values from 1 to 10. Each runs used 106 iterations after a burn-in of
length 4 x 10⁴, testing different models: (a) with or without admixture, and (b)
correlated or uncorrelated allele frequencies. To check for convergence of the Markov
chain Monte Carlo (MCMC), we performed 10 replicates for each value of K and then
checked the consistency of results. The estimated number of clusters (K) was taken to
be the value of K with the highest Pr(X|K) [18].
Geneland procedure
The second algorithm, implemented in Geneland v.1.0.7, differs from that of
Pritchard et al [18] mainly by taking into account explicitly the spatial dependence of
individuals expected for species whose range is much larger than the average
intergeneration movement of individuals. This model aims at inferring and locating
genetic discontinuities between populations in space from individual geo-referenced
multilocus genotypes, while taking into account uncertainty in the location of sampled
individuals [20,69]. All the parameters (including K) are co-estimated simultaneously
by the MCMC algorithm. However, for technical reasons discussed in [20], it is better
to proceed in two steps: a first run to infer K, and a second run with K fixed at the
modal value to estimate the other parameters (mainly the assignment of individuals to
the inferred populations). The first step was replicated 10 times to check for
convergence, allowing K to vary from 1 to 10 clusters and using the following run
parameters: 106 MCMC iterations, maximum rate of Poisson process fixed at 700,
maximum number of nuclei in the Poisson–Voronoi tessellation fixed to 500, and an
- 21 -
uncertainty associated with the spatial coordinates of 50 km. We used the Dirichlet
model of allelic frequencies as it has been demonstrated to perform better than the
alternative model [20]. We inferred the number of clusters (K) from the modal value
of K for these 10 runs, and then ran the MCMC again 100 times with K fixed for this
value, 5 x 10⁵ MCMC iterations, and the other parameters unchanged. We calculated
the mean logarithm of posterior probability of the data (PPD) for each of the 100 runs
and selected the 10 with the highest PPD. These 10 runs were then post-processed
(with a burn-in of 5 x 10⁴ iterations) in order to obtain posterior probabilities of
population membership for each individual and each pixel of the spatial domain (174
pixels along the X axis and 143 along the Y axis corresponding to a pixel size of 25
km side). We finally checked visually for the consistency of results across these 10
runs.
Descriptive statistics among clusters
The allelic richness, corrected for difference in sample size, the observed (Ho) and
expected (He) heterozygosity (or genetic diversity), and FIS values were calculated
within each cluster using Fstat v.2.9.3 [70]. To test whether genetic diversity was
significantly different between clusters, we applied a Wilcoxon paired-sample test
[71] on the 10 single locus values of the statistics of interest.
Level of genetic differentiation at microsatellite loci among clusters was estimated as
FST after Weir and Cockerham [24] using Fstat v.2.9.3 [70]. The 95% confidence
interval was calculated using 15 000 bootstrap resamplings [70]. We conducted exact
tests to assess deviations from Hardy-Weinberg equilibrium and test for population
differentiation using Genepop v.3.4 [72].
- 22 -
Isolation by distance analysis
In continuous populations, an isolation by distance pattern occurs when genetic
differentiation among individuals increases with their geographic distance [73]. Here
we consider the statistic ar, a multilocus estimator of an FST/(1-FST) analogue between
pairs of individuals [21]. When a continuous population is represented by a two
dimensional lattice (i.e., fixed individual positions and no spatial density
heterogeneity), ar is approximately linearly related to the logarithm of the geographic
distance between individuals (r), ar ≈ (Ln(r)/4πDσ2) + C, where D is the effective
density of individuals, σ2 is the second moment of the dispersal distance distribution,
and C is the value of the linear approximation at r = 1 length unit. Values of ar were
regressed against the log of the marine geographical distance (see below) between
paired individuals, as described in Rousset et al [21]. Significance of the regression
slope was tested by 105 random permutations of individual locations (similar to a
Mantel test) using the computer program SPAGeDi v.1.2 [74]. Assuming low
mutation rate, the inverse of the regression slope provides an estimate of the product
4πDσ2 [21,26]. To test whether the regression slopes significantly differed between
the different parts of a same scale, we used a Wilcoxon paired-sample test [71]
applied on the 10 single locus values of the regression slope.
In the marine realm, the Euclidean distance between individuals might not be
representative of the effective geographic distance separating them. Therefore, we
computed an effective marine geographic distance between individuals using the
least-cost path (LCP) algorithm implemented in the Pathmatrix extension [75] of the
geographical information system software ArcView v.3.X (ESRI, Redlands, CA,
USA). This algorithm computes a deterministic LCP between a source point and a
- 23 -
target point by using a friction (or resistance) layer. The friction layer is a raster map
where each cell (landscape unit) expresses the relative difficulty (or cost) of moving
through that cell. A LCP minimises the sum of costs of all cells along the path (for
detailed description and discussion of the algorithm, see [76]). In the present study, a
uniform cost was attributed to all sea cells, while land cells harboured an “infinite”
cost. This allowed us to compute effective distances avoiding landmasses. The
sea/land map was obtained by rasterising (at 2 km resolution) a polygon version [77]
of the GSHHS shoreline dataset v.1.3 [78]. The computations were performed using a
gnomonic projection around the centroid of the sampled localities, which minimises
the map deformation in planar distances induced by the curvature of the earth (Baird
personal communication). Finally, the length of pairwise LCP (in meters) was
introduced as the geographic distance matrix separating pairs of individuals in the
regression analyses described above.
Migration rates among clusters
Evidence of recent migration events across clusters was assessed using the Bayesian
multilocus genotyping procedure implemented with MCMC methods in BayesAss
v.1.3 [22]. This approach does not require populations to be in either migration-drift
or Hardy–Weinberg equilibrium. To examine the strength of the information in the
porpoise microsatellite data set, 95% confidence intervals were determined for
migration rates and compared to a scenario where all proposed changes throughout
the Markov chain are accepted (thereby simulating the situation where any
information that could exist in the data is insufficient to affect the posterior
distribution of migration rates, as suggested by the authors). The MCMC was run for
a total of 3 x 10⁶ iterations, with the first 106 discarded as a burn-in to allow the chain
- 24 -
to reach stationarity. Samples were collected every 2 000 iterations to infer posterior
probability distributions of parameters of interest.
Authors’ contributions
MCF conceived and designed the experiments with help from SJEB. MCF performed
the laboratory experiments except the analysis of samples from Iceland and Ireland
analysed by SD. MCF analysed the data and interpreted the results with help from
SJEB, JRM, SP, and NR. NR conceived the algorithm to calculate the marine
geographic distance used in the Isolation by distance analysis. SP provided cluster
computation assistance for the data analyses. JMB and JRM provided logistical
support for this study. KAT, AJB, MF, TJ, ÁL, BÖ, AAÖ, VR, ER, MS, US, GAV
provided the biological materials for the study. MCF wrote the manuscript with help
from SJEB. All authors read and approved the final manuscript.
Acknowledgements
We are grateful to all the fishermen, stranding networks, and volunteers that
contributed in the collection of samples used in the present study. Specifically, we
thank D. Bloch (Museum of Natural History, Faroe Islands), MJ Addink and C
Smeenk (National Museum of Natural History, Leiden, the Netherlands), N Øien
(Institute of Marine Research, Bergen, Norway), and W Dabin (Centre de Recherche
sur les Mammifères Marins, La Rochelle, France). We thank also M Galan and A
Loiseau for their help in laboratory work, and S Gobert and K Das for administrative
support. R Streiff, A Estoup and R Leblois provided helpful assistance and critical
comments on the data analyses, the interpretation of results, and on the manuscript.
We also thank P Beaubrun, F Bonhomme, PJ Palsbøll, and C Moritz for their critical
comments on the manuscript.
- 25 -
This work was funded by the Belgian Office for Scientific, Technical and Cultural
Affairs (Contract EV/12/46A). MCF and JRM were supported by research
fellowships from the Belgian National Fund for Scientific Research (F.R.S.FNRS,
mandate ‘Aspirant’ and ‘Chercheur Qualifié’), NR by a Swiss National Science
Foundation grant (No 3100A0-112072), and KAT by the Norwegian Research
Council. This is a MARE publication, no. 113.
References
1. Palumbi SR: Genetic divergence, reproductive isolation and marine
speciation. Annu Rev Ecol Syst 1994, 25:547-572.
2. Thorrold SR: Ocean ecology: don't fence me in. Curr Biol 2006, 16:R638-
R640.
3. Barber PH, Palumbi SR, Erdman MV, Moosa MK: A marine Wallace's line?
Nature 2000, 406:692-693.
4. Taylor MS, Hellberg ME: Genetic evidence for local retention of pelagic
larvae in Caribbean reef fish. Science 2003, 299:107-109.
5. Bekkevold D, Andre C, Dahlgren TG, Clausen LA, Torstensen E, Mosegaard
H, Carvalho GR, Christensen TB, Norlinder E, Ruzzante DE: Environmental
correlates of population differentiation in Atlantic herring. Evolution
2005, 59:2656-2668.
6. Jorgensen HBH, Hansen MM, Bekkevold D, Ruzzante DE, Loeschcke V:
Marine landscapes and population genetic structure of herring (Clupea
harengus L.) in the Baltic Sea. Mol Ecol 2005, 14:3219-3234.
- 26 -
7. Kenchington EL, Patwary MU, Zouros E, Bird CJ: Genetic differentiation in
relation to marine landscape in a broadcast-spawning bivalve mollusc
(Placopecten magellanicus). Mol Ecol 2006, 15:1781-1796.
8. Hoelzel AR, Goldsworthy SD, Fleischer RC: Population genetics. In Marine
Mammal Biology: An Evolutionary Approach. Edited by Hoelzel AR. Oxford:
Blackwell Science; 2002:325-352.
9. Hoelzel AR: Genetic structure of cetacean populations in sympatry,
parapatry, and mixed assemblages: implication for conservation policy. J
Hered 1998, 89:451-458.
10. Palsbøll PJ, Clapham PJ, Mattila DK, Larsen F, Sears R, Siegismund HR,
Sigurùnsson J, Vasquez O, Arctander P: Distribution of mtDNA haplotypes
in North Atlantic humpback whales: the influence of behaviour on
population structure. Mar Ecol Prog Ser 1995, 116:1-10.
11. Natoli A, Birkun A, Aguilar A, Lopez A, Hoelzel AR: Habitat structure and
dispersal of male and female bottlenose dolphins (Tursiops truncatus).
Proc R Soc B 2005, 272:1217-1226.
12. Berta A, Sumich JL: Marine Mammals: Evolutionary Biology. London:
Academic Press; 1999.
13. Read AJ: Porpoises, overview. In Encyclopedia of Marine Mammals. Edited
by Perrin WF, Würsig B, Thewissen JGM. London: Academic Press; 2002:
982 -985.
14. Koopman HN, Pabst DA, McLellan WA, Dillaman RM, Read AJ: Changes in
blubber distribution and morphology associated with starvation in
harbour porpoise (Phocoena phocoena): evidence for regional variation in
blubber structure and function. Physiol Biochem Zool 2002, 75:498-512.
- 27 -
15. Gaskin DE: The harbour porpoise Phocoena phocoena (L.): regional
populations, status, and information on direct and indirect catches. Rep
Int Whal Commn 1984, 34:569-584.
16. Read AJ: Harbour porpoise (Phocoena phocoena). In Handbook of Marine
Mammals. Edited by Ridgway SH, Harrison R. London: Academic Press;
1999: 323-350.
17. Frantzis A, Gordon J, Hassidis G, Komenou A: The enigma of harbour
porpoise presence in the Mediterranean Sea. Mar Mamm Sci 2001, 17:937-
943.
18. Pritchard JK, Stephens M, Donnelly P: Inference of population structure
using multilocus genotype data. Genetics 2000, 155:945-959.
19. Falush D, Stephens M, Pritchard JK: Inference of population structure
using multilocus genotype data: linked loci and correlated allele
frequencies. Genetics 2003, 164:1567-1587.
20. Guillot G, Estoup A, Mortier F, Cosson J-F: A spatial model for landscape
genetics. Genetics 2005, 170:1261-1280.
21. Rousset F: Genetic differentiation between individuals. J Evol Biol 2000,
13:58-62.
22. Wilson GA, Rannala B: Bayesian inference of recent migration rates using
multilocus genotypes. Genetics 2003, 163:1177-1191.
23. Rosenberg NA, Pritchard JK, Weber JL, Cann HM, Kidd KK, Zhivotovsky
LA, Feldman MW: Genetic structure of human populations. Science 2002,
298:2381-2385.
24. Weir BS, Cockerham CC: Estimating F-statistics for the analysis of
population structure. Evolution 1984, 38:1358-1370.
- 28 -
25. Rosenberg NA, Mahajan S, Ramachandran S, Zhao C, Pritchard JK, Feldman
MW: Clines, clusters, and the effect of study design on the inference of
human population structure. PLoS Genet 2005, 1:e70.
26. Rousset F: Genetic differentiation and estimation of gene flow from F-
statistics under isolation by distance. Genetics 1997, 145:1219-1228.
27. Slatkin M: Isolation by distance in equilibrium and non-equilibrium
populations. Evolution 1993, 47:264-279.
28. Leblois R, Estoup A, Rousset F: Influence of mutational and sampling
factors on the estimation of demographic parameters in a "Continuous"
population under isolation by distance. Mol Biol Evol 2003, 20:491-502.
29. Palumbi SR: Marine reserves and ocean neighborhoods: the spatial scale
of marine populations and their management. Annu Rev Environ Resourc
2004, 29:31-68.
30. Rousset F: Genetic Structure and Selection in Subdivided Populations
(Monographs in population biology edn). Princeton: Princeton University
Press; 2004.
31. Andersen LW, Ruzzante DE, Walton M, Berggren P, Bjørge A, Lockyer C:
Conservation genetics of harbour porpoises, Phocoena phocoena, in
eastern and central North Atlantic. Conserv Genet 2001, 2:309-324.
32. Andersen LW: Harbour porpoises (Phocoena phocoena) in the North
Atlantic: distribution and genetic population structure. In Harbour
Porpoises in the North Atlantic. Edited by Haug T, Desportes G, Vikingsson
GA, Witting L. Tromsø: NAMMCO Scientific Publications; 2003:11-30.
- 29 -
33. Rosel P, Dizon AE, Haygood MG: Variability of the mitochondrial control
region in populations of the harbour porpoise, Phocoena phocoena, on
interoceanic and regional scales. Can J Fish Aquat Sci 1995, 52:1210-1219.
34. Gol'din PE: Growth and body size of the harbour porpoise, Phocoena
phocoena (Cetacea, Phocoenidae), in the Sea of Azov and the Black Sea.
Vestnik Zoologii 2004, 38:59-73.
35. Tolley KA, Rosel PE: Population structure and historical demography of
eastern North Atlantic harbour porpoises inferred through mtDNA
sequences. Mar Ecol Prog Ser 2006:297-308.
36. Koutsikopoulos C, Beillois P, Leroy C, Taillefer F: Temporal trends and
spatial structure of the sea surface temperature in the Bay of Biscay.
Oceanol Acta 1998, 21:335-344.
37. Koutsikopoulos C, Le Cann B: Physical processes and hydrological
structures related to the Bay of Biscay anchovy. Sci Mar 1996, 60:9-19.
38. Fiùza AFG: Upwelling patterns off Portugal. In Coastal Upwelling: Its
Sediment Records (part A). Edited by Suess E, Thiede J. New York: Plenum
Press; 1983: 85-98.
39. Tenore KR, Alonso-Noval M, Alvarez-Ossorio M, Atkinson LP, Cabanas JM,
Cal RM, Campos HJ, Castillejo F, Chesney EJ, Gonzalez N et al: Fisheries
and oceanography off Galicia, NW Spain: mesoscale spatial and temporal
changes in physical processes and resultant patterns of biological
productivity. J Geophys Res 1995, 100:10943-10966.
40. Southward AJ, Hawkins SJ, Burrows MT: Seventy years' observations of
changes in distribution and abundance of zooplankton and intertidal
- 30 -
organisms in the western English Channel in relation to rising sea
temperature. J Therm Biol 1995, 20:127-155.
41. OSPAR Commission: Quality Status Report 2000: Region I – Arctic Water.
London: OSPAR Commission; 2000.
42. Donovan GP, Bjørge A: Harbour porpoises in the North Atlantic: edited
extract from the report of the IWC scientific committee, Dublin 1995.
Report of the International Whaling Commission 1995, Special Issue 16:3-25.
43. Hutchison DW, Templeton AR: Correlation of pairwise genetics and
geographic distance measures: inferring the relative influences of gene
flow and drift on the distribution of genetic variability. Evolution 1999,
53:1898-1914.
44. Leblois R, Rousset F, Estoup A: Influence of spatial and temporal
heterogeneities on the estimation of demographic parameters in a
continuous population using individual microsatellite data. Genetics 2004,
166:1081-1092.
45. Hammond PS, Berggren P, Benke H, Borchers DL, Collet A, Heide-Jorgensen
MP, Heimlich S, Hiby AR, Leopold MF, Øien N: Abundance of harbour
porpoises and other cetaceans in the North Sea and adjacent waters. J
Applied Ecol 2002, 39:361-376.
46. SCANS-II: Quarterly newsletter for the small cetaceans in the European
Atlantic and North Sea project. Special Issue 9: Survey of the SCANS-II
project. [http://biology.st-
andrews.ac.uk/scans2/documents/issue9_Dec06.pdf]
47. Longhurst AR: Ecological Geography of the Sea. London: Academic Press;
1998.
- 31 -
48. Özsoy E, Ünlüata Ü: Oceanography of the Black Sea: a review of some
recent results. Earth Sci Rev 1997, 42:231-272.
49. Theocharis A, Georgopoulos D, Lascaratos A, Nittis K: Water masses
circulation in the central region of the Eastern Mediterranean: Eastern
Ionian, South Aegean, and Northwest Levantin 1986–1987. Deep-Sea Res
II 1993, 40:1121-1142.
50. Moraitou-Apostolopoulou M: The zooplankton communities of the Eastern
Mediterranean (Levantine basin, Aegean Sea); influence of man-made
factors. In Mediterranean Marine Ecosystems. Edited by Moraitou-
Apostolopoulou M, Kiortsis V. New York: Plenum Press; 1985:303-331.
51. Richardson AJ, Schoeman DS: Climate impact on plankton ecosystems in
the Northeast Atlantic. Science 2004, 305:1609-1612.
52. Sathyendranath S, Cota G, Stuart V, Maass H, Platt T: Remote sensing of
phytoplankton pigments: a comparison of empirical and theoretical
approaches. Int J Remote Sens 2001, 22:249-273.
53. Behrenfeld MJ, O'Malley RT, Siegel DA, McClain CR, Sarmiento JL,
Feldman GC, Millingan AJ, Falkowski PG, Letelier RM, Boss ES: Climate-
driven trends in contemporary ocean productivity. Nature 2006, 444:752-
755.
54. Forney KA: Trends in harbour porpoise abundance off central California,
1986–95: evidence for interannual changes in distribution? J Cetacean Res
Manage 1999, 1:73-80.
55. Johnston DW, Westgate AJ, Read AJ: Effects of fine-scale oceanographic
features on the distribution and movements of harbour porpoises
- 32 -
Phocoena phocoena in Bay of Fundy. Mar Ecol Prog Ser 2005, 295:279-
293.
56. Carretta JV, Taylor BL, Chivers S: Abundance and depth distribution of
harbor porpoise (Phocoena phocoena) in northern California determined
from a 1995 ship survey. Fish Bull 2001, 99:29-39.
57. Fontaine MC, Tolley KA, Siebert U, Gobert S, Lepoint G, Bouquegneau JM,
Das K: Long-term feeding ecology and habitat use in harbour porpoises
Phocoena phocoena from Scandinavian waters inferred from trace
elements and stable isotopes. BMC Ecol 2007, 7:1.
58. MacLeod CD, Santos MB, Reid RJ, Scott BE, Pierce GJ: Linking sandeel
consumption and the likelihood of starvation in harbour porpoises in the
Scottish North Sea: could climate change mean more starving porpoises?
Biol Lett 2007, 3:185-188.
59. Li WKW: Macroecological patterns of phytoplankton in the northwestern
North Atlantic. Nature 2002, 419:154-157.
60. Beaugrand G, Reid PC, Ibanez F, Lindley JA, Edwards M: Reorganization of
North Atlantic marine copepod biodiversity and climate. Science 2002,
296:1692-1694.
61. Perry AL, Low PL, Ellis JR, Reynolds JD: Climate change and distribution
shifts in marine fishes. Science 2005, 308:1912-1915.
62. Attrill MJ, Power M: Climatic influence on marine fish assemblage. Nature
2002, 417:275-278.
63. Learmonth JA, MacLeod CD, Santos MB, Pierce GJ, Crick HQP, Robinson
RA: Potential effects of climate change on marine mammals. Oceanogr
Mar Biol 2006, 44:431-464.
- 33 -
64. Duke S: The Population and the Social Structure of Harbour Porpoise
(Phocoena phocoena) from Around the Coasts of Iceland and Ireland. Dublin:
PhD thesis, Department of Zoology, University College Dublin; 2003.
65. Fontaine MC, Galan M, Bouquegneau JM, Michaux JR: Efficiency of
fluorescent multiplex polymerase chain reactions (PCRs) for rapid
genotyping of harbour porpoises Phocoena phocoena with 11
microsatellite loci. Aquat Mamm 2006, 32:301-304.
66. National Oceanographic Data Centre. [http://www.nodc.noaa.gov/]
67. National Geophysical Data Centre.
[http://www.ngdc.noaa.gov/products/ngdc_products.html]
68. NASA Sea-viewing Wide Field-of-view Sensor database.
[http://oceancolor.gsfc.nasa.gov/]
69. Guillot G, Mortier F, Estoup A: GENELAND: a computer package for
landscape genetics. Mol Ecol Notes 2005, 5:712-715.
70. Goudet J: FSTAT, a program to estimate and test gene diversities and
fixation indices (version 2.9.3).
[http://www2.unil.ch/popgen/softwares/fstat.htm]
71. Zar JH: Biostatistical analysis, 4th edn. Upper Saddle River, NJ: Prentice-
Hall; 1999.
72. Raymond M, Rousset F: GENEPOP (Version 1.2): population genetics
software for exact tests and eucumenism. J Hered 1995, 86:248-249.
73. Wright S: Isolation by distance. Genetics 1943, 28:114-138.
74. Hardy OJ, Vekemans X: SPAGeDi: a versatile computer program to
analyse spatial genetic structure at the individual of population levels. Mol
Ecol Notes 2002, 2:618-620.
- 34 -
75. Ray N: PATHMATRIX: a geographical information system tool to
compute effective distances among samples. Mol Ecol Notes 2005, 5:177-
180.
76. Adriaensen F, Chardon JP, De Blust G, Swinnen E, Villalba S, Gulinck H,
Matthysen E: The application of 'least-cost' modelling as a functional
landscape model. Land Urb Plan 2003, 64:233-257.
77. Nelson A, Turner A: Processing global self-consistent hierarchical high
resolution shoreline data version 1.2 Into ESRI ArcGIS vector and raster
data. Leeds: CCG, School of Geography Working Paper, University of Leeds;
2004.
78. Wessel P, Smith WHF: A global self-consistent, hierarchical, high-
resolution shoreline database. J Geophys Res 1996, 101:8741-8743.
79. Rosenberg NA: DISTRUCT: a program for graphical display for
population structure. Mol Ecol Notes 2004, 4:137-138.
80. Feldman GC, McClain CR: Seasonal, monthly, and weekly climatologies. In
Ocean Color Web. Edited by Kuring N, Bailey SW, Thomas D, Franz BF,
Meister G, Werdell PJ, Eplee RE, MacDonald M, Rubens M. Greenbelt, MD:
NASA Goddard Space Flight Center; 2006.
[http://oceancolor.gsfc.nasa.gov/cgi/climatologies.pl]
- 35 -
Figures
Figure 1 – Bathymetric map of the eastern North Atlantic showing the
approximate geographic sampled locations and sample sizes per location
Geographic locations are based on GPS coordinates or reported discovery location.
The bar scales delimit the latitudinal range of the three spatial scales considered for
the analyses of the North Atlantic (NAt) cluster: the global scale (1); the middle scale,
south (2A), and north (2B) parts; and the small scale, the south (3A), middle (3B), and
north (3C) parts. The map is projected using a gnomonic projection centred on the
sampling centroid (scale units in km).
Figure 2 - Estimated number of populations from Structure (a and b) and
Geneland (c and d) analyses
Structure analyses: (a) mean (± SD) probabilities of the data [Ln Pr(X|K)] over 10
Structure replicated runs plotted as a function of the putative number of clusters (K).
(b) Mean variations of probabilities of the data (∆(Ln Pr(X|K)) between successive K
considered in Structure analyses. For K clusters, this variation is calculated as
∆(Ln Pr(X|K)) = Ln Pr(X|K)k+1 – Ln Pr(X|K)k. Geneland analyses: posterior density
distribution of the number of clusters estimated from Geneland analysis in 7 out of 10
replicates (c) and in the 3 remaining trials (d).
Figure 3 - Estimated population structure from Structure analyses for K = 2 to
K = 5
Each individual is represented by a thin horizontal line divided into K coloured
segments that represent the individual’s estimated membership fractions in K clusters.
Black lines separate individuals from different geographic areas labelled on the right.
- 36 -
Each plot, produced with Distruct [79], is based on the highest-probability run (of ten)
at that value of K. Individuals are arranged based on their origins and sorted with
increasing latitude.
Figure 4 - Estimated population structure from Geneland analyses for the two
modal solutions K = 3 and K = 4
Each individual is represented by a thin horizontal line divided into K coloured
segments that represent the individual’s estimated membership fractions in K clusters.
Black lines separate individuals from different geographic areas labelled on the right.
Each plot, produced with Distruct [79], is based on the highest-probability run at that
value of K. Individuals are arranged based on their origins and sorted with increasing
latitude.
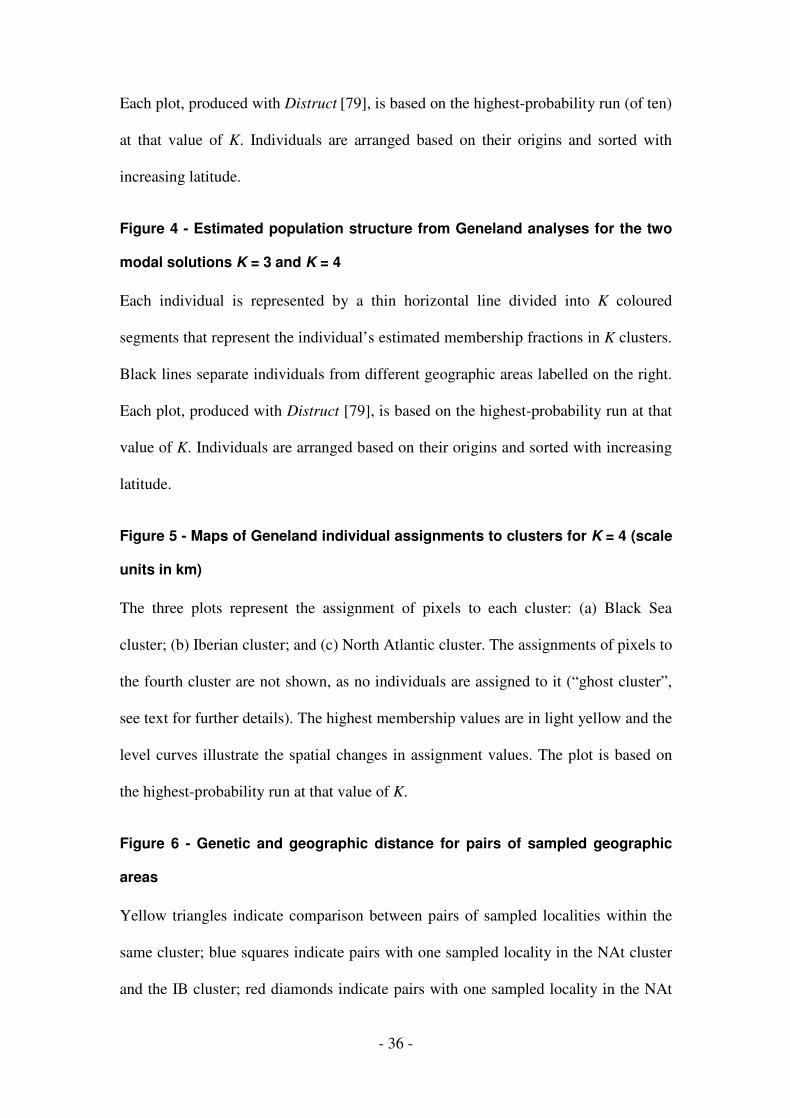
Figure 5 - Maps of Geneland individual assignments to clusters for K = 4 (scale
units in km)
The three plots represent the assignment of pixels to each cluster: (a) Black Sea
cluster; (b) Iberian cluster; and (c) North Atlantic cluster. The assignments of pixels to
the fourth cluster are not shown, as no individuals are assigned to it (“ghost cluster”,
see text for further details). The highest membership values are in light yellow and the
level curves illustrate the spatial changes in assignment values. The plot is based on
the highest-probability run at that value of K.
Figure 6 - Genetic and geographic distance for pairs of sampled geographic
areas
Yellow triangles indicate comparison between pairs of sampled localities within the
same cluster; blue squares indicate pairs with one sampled locality in the NAt cluster
and the IB cluster; red diamonds indicate pairs with one sampled locality in the NAt
- 37 -
cluster and the BS cluster; and black circle indicate the comparison between the IB
and the BS cluster.
Figure 7 - Climatological (1997–2006) annual sea surface chlorophyll
concentrations
Data obtained with Sea-viewing Wide Field-of-view Sensor (SeaWIFS, modified
from [80]).
- 38 -
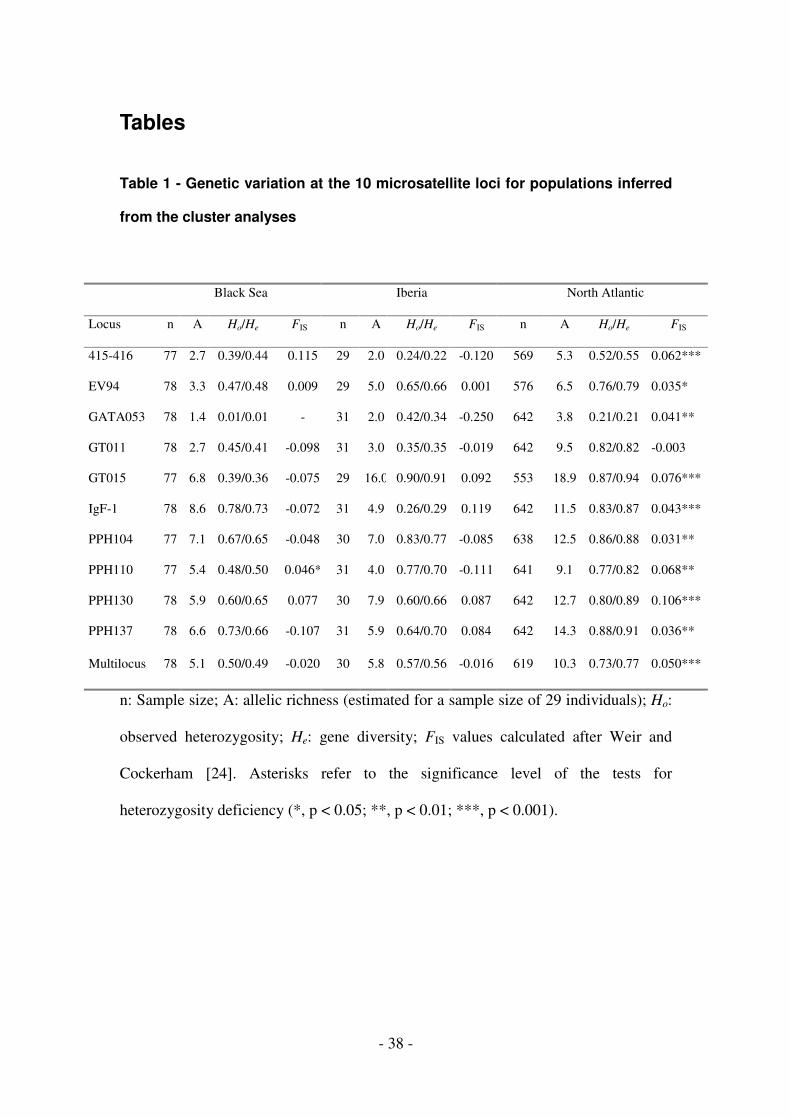
Tables
Table 1 - Genetic variation at the 10 microsatellite loci for populations inferred
from the cluster analyses
Black Sea Iberia North Atlantic
Locus n A Ho/He FIS n A Ho/He FIS n A Ho/He FIS
415-416 77 2.7 0.39/0.44 0.115 29 2.0 0.24/0.22 -0.120 569 5.3 0.52/0.55 0.062***
EV94 78 3.3 0.47/0.48 0.009 29 5.0 0.65/0.66 0.001 576 6.5 0.76/0.79 0.035*
GATA053 78 1.4 0.01/0.01 - 31 2.0 0.42/0.34 -0.250 642 3.8 0.21/0.21 0.041**
GT011 78 2.7 0.45/0.41 -0.098 31 3.0 0.35/0.35 -0.019 642 9.5 0.82/0.82 -0.003
GT015 77 6.8 0.39/0.36 -0.075 29 16.0 0.90/0.91 0.092 553 18.9 0.87/0.94 0.076***
IgF-1 78 8.6 0.78/0.73 -0.072 31 4.9 0.26/0.29 0.119 642 11.5 0.83/0.87 0.043***
PPH104 77 7.1 0.67/0.65 -0.048 30 7.0 0.83/0.77 -0.085 638 12.5 0.86/0.88 0.031**
PPH110 77 5.4 0.48/0.50 0.046* 31 4.0 0.77/0.70 -0.111 641 9.1 0.77/0.82 0.068**
PPH130 78 5.9 0.60/0.65 0.077 30 7.9 0.60/0.66 0.087 642 12.7 0.80/0.89 0.106***
PPH137 78 6.6 0.73/0.66 -0.107 31 5.9 0.64/0.70 0.084 642 14.3 0.88/0.91 0.036**
Multilocus 78 5.1 0.50/0.49 -0.020 30 5.8 0.57/0.56 -0.016 619 10.3 0.73/0.77 0.050***
n: Sample size; A: allelic richness (estimated for a sample size of 29 individuals); Ho:
observed heterozygosity; He: gene diversity; FIS values calculated after Weir and
Cockerham [24]. Asterisks refer to the significance level of the tests for
heterozygosity deficiency (*, p < 0.05; **, p < 0.01; ***, p < 0.001).
- 39 -
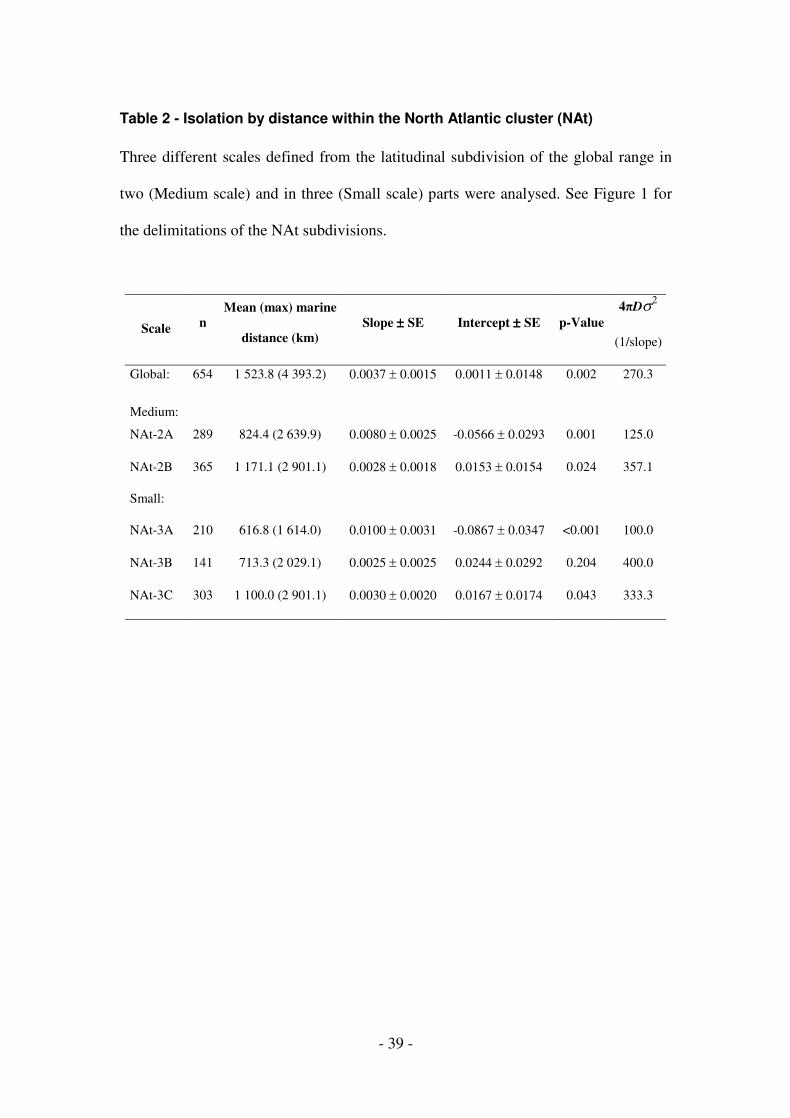
Table 2 - Isolation by distance within the North Atlantic cluster (NAt)
Three different scales defined from the latitudinal subdivision of the global range in
two (Medium scale) and in three (Small scale) parts were analysed. See Figure 1 for
the delimitations of the NAt subdivisions.
Scale n
Mean (max) marine
distance (km)
Slope ±±±± SE Intercept ±±±± SE p-Value
4πDσ2
(1/slope)
Global: 654 1 523.8 (4 393.2) 0.0037 ± 0.0015 0.0011 ± 0.0148 0.002 270.3
Medium:
NAt-2A 289 824.4 (2 639.9) 0.0080 ± 0.0025 -0.0566 ± 0.0293 0.001 125.0
NAt-2B 365 1 171.1 (2 901.1) 0.0028 ± 0.0018 0.0153 ± 0.0154 0.024 357.1
Small:
NAt-3A 210 616.8 (1 614.0) 0.0100 ± 0.0031 -0.0867 ± 0.0347 <0.001 100.0
NAt-3B 141 713.3 (2 029.1) 0.0025 ± 0.0025 0.0244 ± 0.0292 0.204 400.0
NAt-3C 303 1 100.0 (2 901.1) 0.0030 ± 0.0020 0.0167 ± 0.0174 0.043 333.3
- 40 -
Table 3 - Mean ± SD (95% CI) posterior distributions for migration rates among
harbour porpoise populations
Values along the diagonal (bold) are the proportion of individuals derived from the
source population (or non-migrant) each generation.
Migration rate from
To Black Sea Iberia NAt-3A
Black Sea
(n = 78)
0.996 ±±±± 0.004
(0.984–1)
0.002 ± 0.003
(0–0.009)
0.002 ± 0.003
(0–0.010)
Iberia
(n = 31)
0.010 ± 0.011
(0–0.041)
0.978 ±±±± 0.017
(0.935–1)
0.011 ± 0.011
(0–0.042)
NAt-3A
(n = 303)
0.003 ± 0.003
(0–0.012)
0.031 ± 0.012
(0.008–0.057)
0.965 ±±±± 0.013
(0.938–0.988)
- 41 -
Additional files
Additional file 1 - Levels of genetic differentiation at microsatellite loci
estimated as FST among the populations inferred from the cluster analyses
The North Atlantic cluster (NAt) was subdivided latitudinally in three parts (see
Figure 1). The FST values [95% CI] are below the diagonal and the significance level
of the exact tests for population differentiation [72] are above.
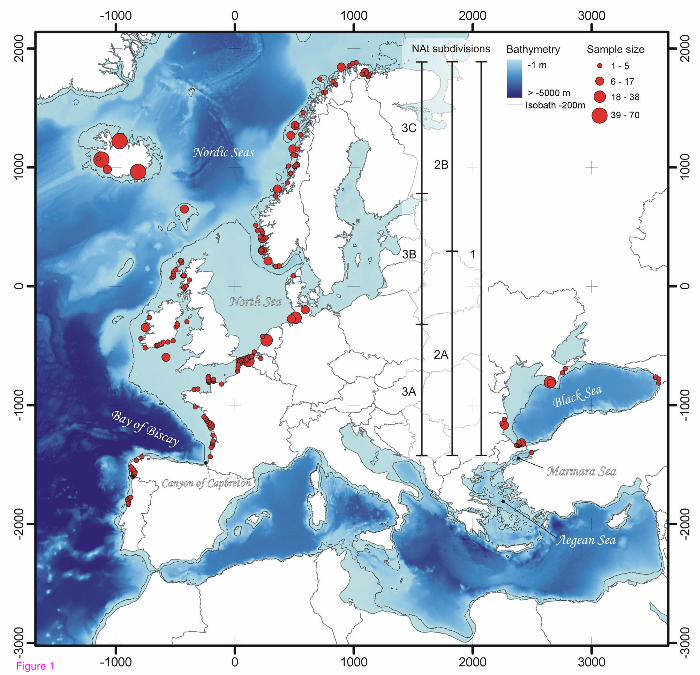
Figure 1
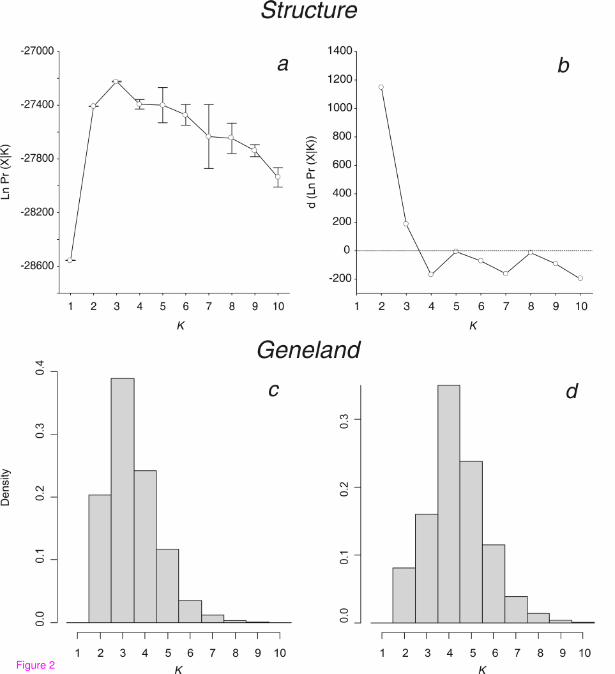
Figure 2
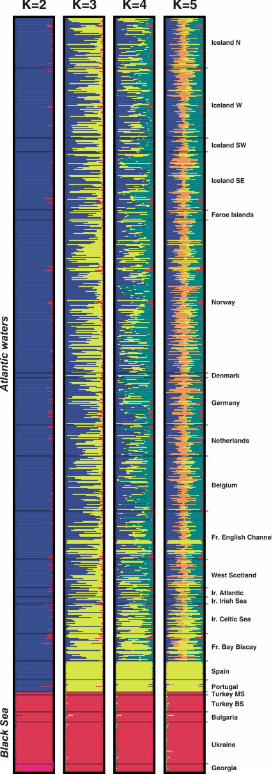
Figure 3
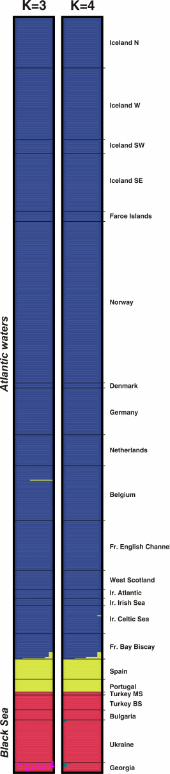
Figure 4
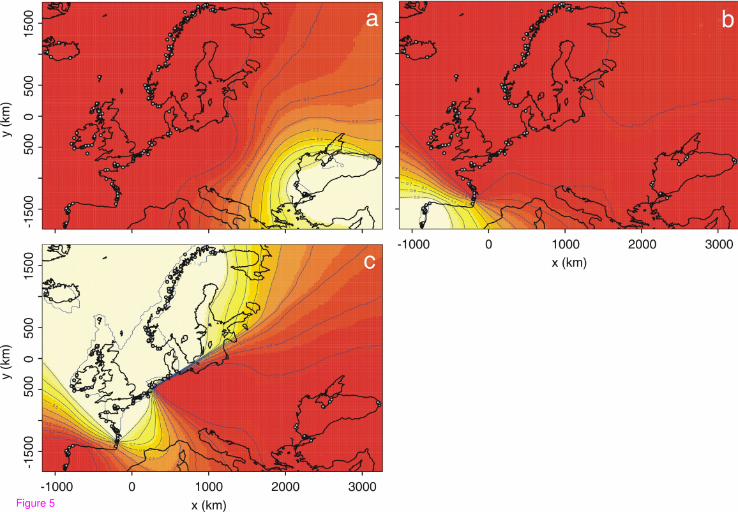
Figure 5
0.0
00.1
00.2
00.3
0
100 1000 10000
Marine geographic distance (km)
Ge
ne
tic d
ista
nce
(F
ST)
Figure 6
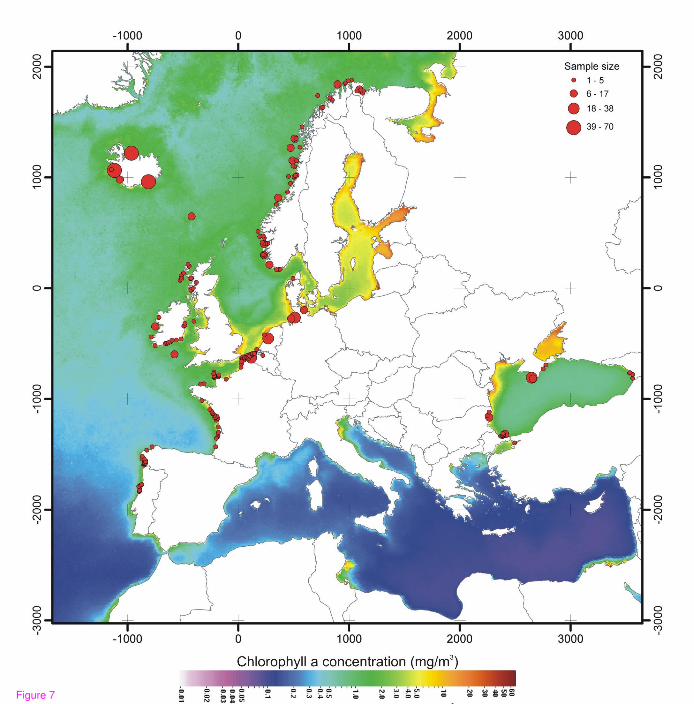
Figure 7

Additional files provided with this submission:
Additional file 1: additionalfile1.pdf, 61Khttp://www.biomedcentral.com/imedia/7428629221502902/supp1.pdf
Related Documents