Ripening Silt to Clay A Design for the Eems-Dollard Testing Ground Bachelor Thesis Jesse van den Broek 30 June 2017 Supervised by: Bc, ing. H. Timmer - Witteveen+Bos Ir. J.M. Damen - University of Twente

Welcome message from author
This document is posted to help you gain knowledge. Please leave a comment to let me know what you think about it! Share it to your friends and learn new things together.
Transcript

Ripening Silt to Clay A Design for the Eems-Dollard Testing Ground
Bachelor Thesis
Jesse van den Broek
30 June 2017
Supervised by:
Bc, ing. H. Timmer - Witteveen+Bos
Ir. J.M. Damen - University of Twente

1
Preface The final assignment in the Bachelor’s programme in Civil Engineering at the University of Twente is
the writing of a thesis at a company. The assigned time for this thesis was 12 weeks, starting in April.
I have learned a lot during my internship at Witteveen+Bos. Not only did I learn about drainage
systems and the ripening process, but I have also experienced the work environment of an
engineering firm. This experience has been very positive and for that I would like to thank my
colleagues at Witteveen+Bos.
I also wish to thank my supervisors, John Damen and Hilko Timmer, for their time and efforts in
guiding me. As well as Koen de Jong, Davíd Brakenhoff and Hendrik Meuwese who helped me with
obtaining new knowledge and with who I was able to discuss difficult aspects of the thesis. Without
all of you I would not have been able to complete this Bachelor thesis.

2
Abstract High amounts of suspended silt present in the Eems-Dollard estuary damage the ecology of the estuary by blocking sunlight and elevate the harbour fairways. With multiple nature areas nearby this could have a detrimental effect on the biodiversity in the Netherlands. While there is currently a high demand in the area for clay, silt has barely any function. In order to convert the one in the other, and in a sustainable way, a clay ripening facility was devised. In this study a first design based on currently available data will be created. The study strives to make a clear basis for future projects. First, a basis of design was made numbering all requirements and assumptions in the design. Second, the dikes were checked for potential macro-instability by using a safety factor of 1.35, which was met. Lastly, the drainage of the testing ground was calculated for a horizontal sand layer and drainage pipes. The standard values of dredged silt were used for the hydraulic conductivity, 5 m/d at the start and 0.001 m/d at the end. Using these values the drainage can be completed in 300 days. However, when using other possible values of the hydraulic conductivity of the silt, the ripening does not finish within the maximum of three years. Therefore, the outcome is unknown until these values have been determined via empirical research. This study shows results that are generalizable and is a useful step in order to make clay ripening a realistic method. However, more knowledge with regard to the ripening process is needed in order to prove that clay ripening is profitable.

3
Index Preface ..................................................................................................................................................... 1
Abstract ................................................................................................................................................... 2
1. Introduction ......................................................................................................................................... 5
1.1. Problem Context ........................................................................................................................... 5
1.1.1. Context .................................................................................................................................. 5
1.1.2. Literature review ................................................................................................................... 5
1.1.3. Problem definition ................................................................................................................. 9
1.2 Research objective and questions ............................................................................................... 10
1.2.1. Research questions.............................................................................................................. 11
2. Theoretical framework ...................................................................................................................... 11
2.1. Terminology ................................................................................................................................ 11
2.2. Geotechnical formulas ............................................................................................................... 11
2.2.1. Shear strength of a drained soil: Mohr-circle ...................................................................... 11
2.2.2. Shear strength of an undrained soil .................................................................................... 12
2.3. Drainage formulas ...................................................................................................................... 12
2.3.1. Evapotranspiration bare soil and precipitation ................................................................... 13
2.3.2. Saturated Zone .................................................................................................................... 13
2.3.3. Ernst’s equation ................................................................................................................... 15
2.3.4. Head loss drainage pipe ...................................................................................................... 15
2.3.5. Maximum drain surface tube .............................................................................................. 16
3. Basis of Design ................................................................................................................................... 16
3.1. Characteristics of the end product ............................................................................................. 16
3.1.1. Purpose and Objective ........................................................................................................ 17
3.1.2. Goals .................................................................................................................................... 17
3.1.3. Clay quality requirements ................................................................................................... 17
3.2. Geotechnical requirements ........................................................................................................ 17
3.3. Water requirements ................................................................................................................... 18
3.3.1. Drainage testing ground ...................................................................................................... 18
3.3.2. Hydraulic conductivity soils ................................................................................................. 18
3.3.3. Evapotranspiration and precipitation ................................................................................. 19
3.4. Functional requirements ............................................................................................................ 19
3.4.1. Additional objects ................................................................................................................ 19
3.4.2. Acceptable damage ............................................................................................................. 20
4. Design testing ground........................................................................................................................ 20
4.1. Functional design testing ground ............................................................................................... 20

4
4.2. Geotechnical design ringdike ..................................................................................................... 24
4.3. Geotechnical design broad inner dike ........................................................................................ 25
4.3.1. Stress driving material ......................................................................................................... 25
4.3.2. Drained soil .......................................................................................................................... 25
4.3.3. Undrained soil ..................................................................................................................... 26
4.3.4. Stability water pressure ....................................................................................................... 26
4.3.5. Stability calculation water pressure and bulldozer combined ............................................ 27
5. Calculation drainage system.............................................................................................................. 28
5.1. Soil content calculation .............................................................................................................. 28
5.2. Evapotranspiration bare soil and precipitation .......................................................................... 29
5.3. Saturated Zone ........................................................................................................................... 29
5.3.1. Vertical flow ......................................................................................................................... 29
5.3.2. Horizontal flow .................................................................................................................... 30
5.3.3. Minimal conductivity values ................................................................................................ 30
5.4. Ernst’s equation .......................................................................................................................... 31
5.5. Maximum drain surface tube ..................................................................................................... 31
5.6. Cost comparison ......................................................................................................................... 32
6.1. Discussion ....................................................................................................................................... 32
6.2. Conclusion .................................................................................................................................. 33
References ............................................................................................................................................. 35
Appendix A: Terminology ...................................................................................................................... 39
Appendix B: Basis of Design .................................................................................................................. 42
Appendix C: Additional design pictures................................................................................................. 63
Appendix D: Calculations geotechnical stability.................................................................................... 65
Appendix E: Calculations drainage system ............................................................................................ 70

5
1. Introduction This thesis focuses on the Ecoshape pilot project ‘Living Lab for Mud’ for Witteveen+Bos Consulting
Engineers. Within this pilot the process of clay ripening is studied. The concept of clay ripening has
been researched before, but has received renewed interest due to the rise of sustainability as a
subject in civil engineering. Therefore, the clay ripening became a topic in Ecoshape’s programme
‘Building with Nature’. Additionally, there is also local interest. The silt, which will be used for the clay
ripening, is damaging the ecology of the Eems-Dollard estuary and elevates the harbour fairways. In
this thesis, the basis of design of the testing ground at Delfzijl will be completed. A design is set up
that meets the macro-stability requirements. Finally, a first calculation is made of the drainage
system with at first a horizontal sand layer and later on with drainage pipes.
1.1. Problem Context
1.1.1. Context Silt is a mixture of “fine sand, clay or other materials carried by running water and deposited as a
sediment, especially in a channel or harbour” (Oxford Dictionaries, n.d. b). It can be found in rivers
where it is transported downstream. Silt is comprised of light materials and therefore only settles in
the deltas and estuaries of rivers. This is the prime location of harbours. These harbours need to
maintain the depth of their water routes against sedimentation. When these routes are dredged, the
residue contains a lot of silt. While silt can be fertile for agriculture, as the Nile delta is a famous
example of, it cannot be used for the fear of damaging the environment. The silt found in these
locations is often heavily polluted, due to the disposal of sewage water and the dumping of
chemicals and industrial waste during the previous centuries. Furthermore, there is the threat of
hyperturbidity. As stated by Sadar (2004) turbidity is: “The measurement of scattered light that
results from the interaction of incident light with particulate material in a liquid sample. It is an
expression of the optical properties of a sample that causes light rays to be scattered and absorbed
rather than transmitted in straight lines through the sample. Turbidity of water is often caused by the
presence of suspended and dissolved matter such as clay, silt, finely divided organic matter,
plankton, other microscopic organisms, organic acids, and dyes.” These materials are often
undesirable in water from a health perspective. Turbidity is used as a key water quality monitoring
parameter for environmental water sources (Sadar, 2004). Hyperturbidity can be a threat to the
ecology of lakes, rivers and also some estuaries, since it can block the sunlight necessary for
photosynthesis. Lastly, silt is also not strong enough to be used as a building material. Therefore, it
can currently only be stored as a waste material. Research projects regarding the usage of silt as a
building material have been done before in the 20th century. The recent new interest in sustainability
has renewed that interest and new projects have been started to try to use silt in civil engineering.
One of the groups that is dedicated to this is the Central Dredging Agency, or Ceda. Witteveen+Bos is
part of this group and the project I will help with is a dredging project.
1.1.2. Literature review It is not the first time dredged materials will be used as a building material. In Germany ripened clay
has already been used for multiple ‘test’ dikes (Dredgdikes, 2017). At Rostock, ripened category 1
clay is currently being used for a dike (Figure 1). The project researches overall stability, cracking,
erosion stability and Turf development of ripened clay.

6
Figure 1: Test dike setup Rostock (German). Obtained from: (Dredgedikes, n.d.).
In Belgium, dredged material was mixed with additives and immediately used for a dike construction.
The additives increased the geotechnical characteristics and greatly reduced the time needed for
ripening the soil. Grass was seeded on top of the dike to strengthen against surface erosion. The dike
was finished after six weeks (Van Nederkassel, Van Zele, Van Renterghem, Vermeersch, &
Quaeyhaegens, 2014).
In the Netherlands a project was done with ripened category 1 clay in the 1980’s (Rijkswaterstaat,
2004). At three test sites, parts of the dike were built with the ripened clay. The research concluded
that the clay was physically the same as the normal clay. However, an important note of the research
was that, for the grass on the dike, the ripened clay needs to be sufficiently desalinated and not too
fat.
Furthermore, a lot of heightening of roads and land has been done with ripened type 2-3 clay
(Rijkswaterstaat, 2004). Because of this experience with ripening, techniques have been developed
for filtering the dredged material of sand and for the usage of polluted material. The sand can be
separated from the fine materials by using a basin for natural sedimentation, by performing
mechanical separation or by using a combination of both. For a successful filtering of the sand, the
dredged soil needs to be ‘moderately sandy’ to ‘heavily sandy’. This sand can then be used as a
building material. Polluted dredged soil can be used as a building material by draining it and then
mixing it with binding substances, mostly concrete. In this case the dredged soil can be used as a
foundation.
The speed of the ripening is dependent on three factors. The thickness of the dredging material;
thinner layers have a faster ripening process. The weather, since less precipitation means a faster
process. Furthermore, clay ripening takes a halt during the winter because of the excessive
precipitation and the low temperature which halts the biodegradation. Lastly, the physical
composition of the dredged material has a big influence. Coarse soil takes less time to ripen than fine
soil.

7
This can be described by the hydraulic conductivity of a soil. “Hydraulic conductivity is a measure of a
material’s capacity to transmit water. It is defined as a constant of proportionality relating the
specific discharge of a porous medium under a unit hydraulic gradient in Darcy’s law” (Duffield, n.d.).
In other words Darcy’s law, using this hydraulic conductivity, describes the flow of water through a
porous medium (Equation (6). There have been numerous studies on the relationship between the
hydraulic conductivity and the water content of a soil. Logically speaking it is likely that the higher
the water content the higher the conductivity. However, in practise the relation is difficult to
determine. Multiple methods to determine these relations have been developed, most of which are
fairly similar and purely empirical. Two promising alternative techniques will be described here.
Scheuermann & Bieberstein (2007) state how they used the particle size distribution of a sand to
estimate its pore constriction distribution (Figure 2). This pcd was used as input data for a
relationship between the volumetric water content θ (%) and the matric potential Ψm (hPa), which is
also called a water retention curve (Figure
3). According to Oxford University (2004)
the matric potential is “the adhesion of
water molecules to nondissolved
structures of the system, i.e. the matrix,
such as plasma membranes or soil
particles.” The predicted curve was
compared to experimental values. Finally,
another curve for a relation between the
unsaturated conductivity k (m/s) and the
matric potential was created (Figure 4).
The direct measurement of the pore size
distribution is a challenging undertaking.
For this reason early first approaches
have been developed in order to estimate
pore size distributions from more easily
measurable parameters like the particle
size distribution. The method is therefore still inaccurate. This can be seen in Figure 3 & Figure 4,
where the difference between other methods and experiments is significant. Furthermore, it seems
that the method has only been used on coarse soils up until now.
Figure 3: Dependency of the matric potential on the volumetric water content for weak gravelly sand. Obtained from: (Scheuermann & Bieberstein, 2007, p. 428).
Figure 2: Particle size distribution for a weak gravelly sand as well as pore constriction distributions for mean pore constrictions for a relative density of D=0.8. Obtained from: (Scheuermann & Bieberstein, 2007, p. 426).

8
Figure 4: Dependency between unsaturated conductivity and matric potential of the weak gravelly sand. Obtained from: (Scheuermann & Bieberstein, 2007, p. 431).
The second technique, was described by Youngs (2001) “to measure the hydraulic conductivity in
saturated soil columns with piezometers that are usually used to measure the soil water pressure
head down the column, acting as interceptor drains”, as illustrated in Figure 5. “With only one of the
piezometers at a height Z (m) above the base acting as a drain and removing water at a rate QZ (m/d),
and with no flow through the base, the hydraulic conductance CLZ (d) between the top of the column
at height L and the height Z is given by:”
(1)
This hydraulic conductance could directly be linked with the water content to
possibly create another empirical relationship. This would be much easier than
most other methods which require going through multiple empirical relationships.
Unlike assumed in most of these methods, soil is not uniform but will in reality
have heterogeneities. Youngs (2001, p. 6) states that: “Because of the complex
geometry of the pore system of soils, there is an inherent heterogeneity at pore
size dimensions that is not observed when measurements are made on volumes
containing a large number of pores. Soil heterogeneity usually implies variations
of soil properties between soil volumes containing such a large number of pores.”
Furthermore, unlike the laboratory experiments, in practise soil will contain
multiple kinds of materials. The dredged silt in this thesis consists of clay, sand,
silt, organic materials etc., which makes determining a mean hydraulic
conductivity much harder. Research on the empirical relations for dredged silt for
ripening would be useful to fill in the current gaps of clay ripening. In this thesis,
Youngs’ (2001) formula will be used for a linear dependency between the soil
content and hydraulic conductance.
Under normal circumstances the ripening of a 1 metre thick layer of dredged
material would take one to two years (Rijkswaterstaat, 2004).
Figure 5: Measurement of hydraulic conductivity profiles down soil monoliths using interceptor drains. Obtained from: (Youngs, 2001, p. 12).

9
Right now the process of ripening can be characterized as having a:
Relatively long processing time with regards to other techniques
Large amount of needed space
Low energy usage
1.1.3. Problem definition At the Eems-Dollard estuary, the turbidity rises a few percent’s every year. This forms a threat for the
ecology of the local nature reserves as well as the biodiversity, which is already worse than the
average in Europe (Rijksoverheid, 2016), in the Netherlands as a whole. The main cause is that there
is not enough room for the silt, coming from the river, to settle (Sweco, 2016). When it does, it is
often in harbours or other undesirable spots. Therefore, dredging operations carefully store the
abundant silt at a high cost. This is not only because of the required room. Silt is stored close to
where it was dredged, since moving it can become costly. This means that when the silt is stored
inappropriately, i.e. when the silt can get back into the canal/river, it could flow back to the spot it
was dredged. Since silt is dredged near harbours for the maintenance of shipping lanes, a flow back
of silt means the process would have to be repeated. Clay on the other hand is used for dike
constructions in the Netherlands. With upcoming projects to reinforce and heighten the dikes at the
Dollard and Wadden, as well as local demand in order to raise farmlands due to subsidence, a
significant volume of category 1 and 2 clay will be needed (Sweco, 2016).
As mentioned before in the literature review,
clay ripening has already been tested before in
the 20th century in the Netherlands and
recently in Germany and Belgium. However, the
process has not yet been sufficiently developed
in some regards. With long processing times
and large amounts of required space
(Rijkswaterstaat, 2004), the process is still
inefficient. Furthermore, according to
Ministerie van Volkshuisvesting, Ruimtelijke
Ordening en Milieubeheer et al. (2017): “Right
now dredged soil, which based on
environmental criteria is applicable (for
constructive additions), is still primarily used for
non-constructive additions and embankments.
Based on experience with these applications
and (future) policy developments, application
of ripened soil for constructive additions and
embankments in the future belongs to the
possibilities as well.” Therefore, a project was
started by ‘Rijkswaterstaat’ and several others
(Sweco, 2016) to further experiment with the
transformation of silt into clay.
The core issue here is the on one hand abundance of sediment and the on the other hand high
demand for category 1 and 2 clay. In order to convert the one in the other, in a sustainable way,
the clay ripening facility was devised.
Figure 6a+b: Area of clay ripening facilities. Obtained from: (Google, n.d.) and (Sweco, 2016, p. 14) respectively.
10
The plan is to check with which innovative methods silt can be profitably ripened into clay, while also
being tested according to requirements for construction clay. If the clay is suitable for dike
construction it will be used for dike improvements and would be beneficial to sustainable
development. For the project silt will be dredged and brought to land on testing grounds near
‘Eemshaven’, location can be found in Figure 6 (Sweco, 2016), in the north of the Netherlands.
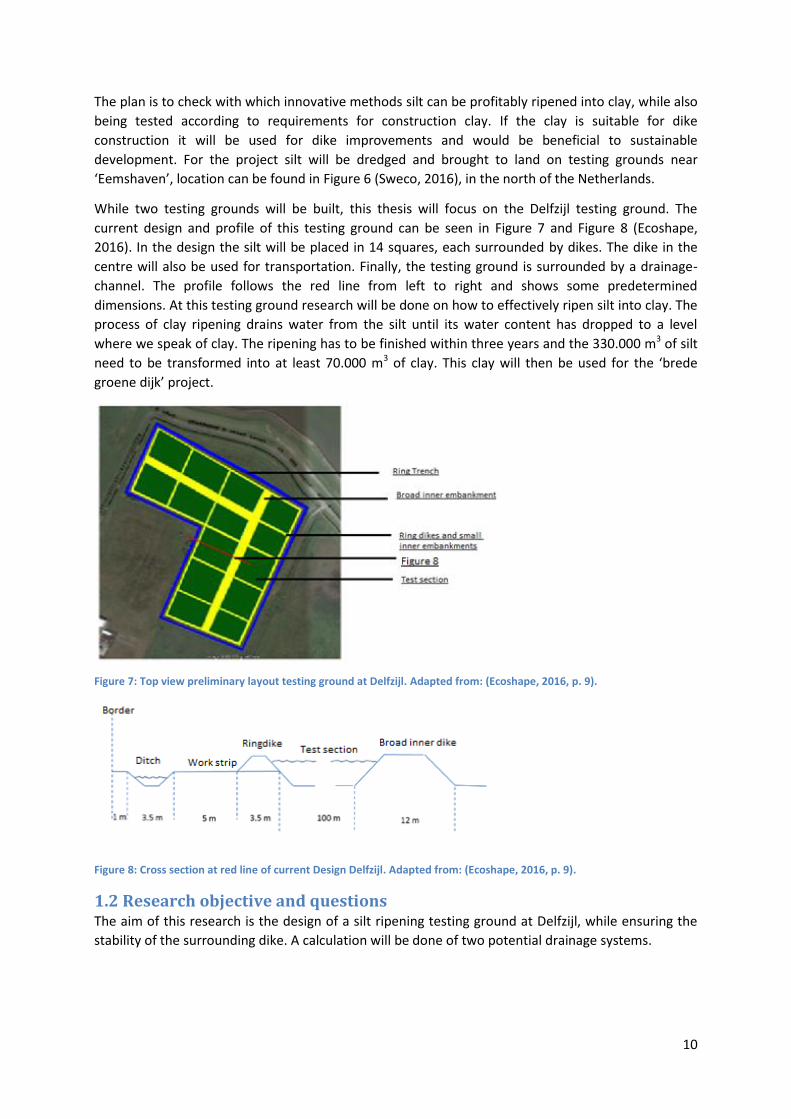
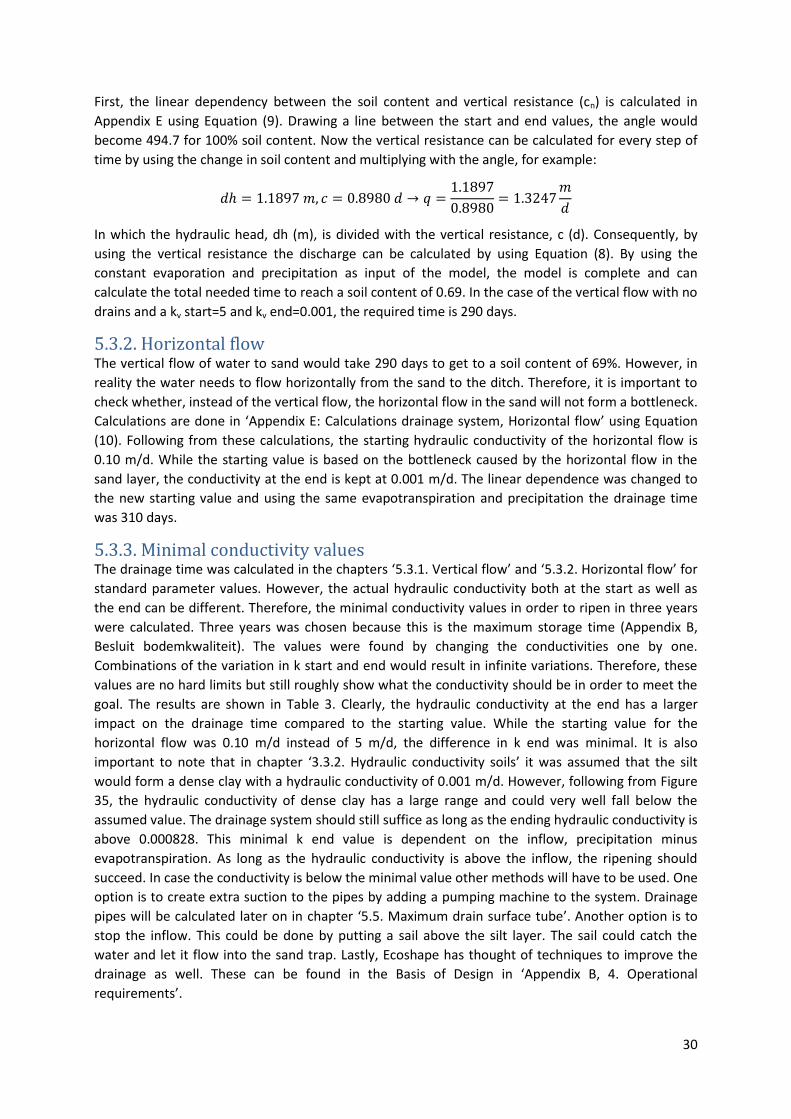
While two testing grounds will be built, this thesis will focus on the Delfzijl testing ground. The
current design and profile of this testing ground can be seen in Figure 7 and Figure 8 (Ecoshape,
2016). In the design the silt will be placed in 14 squares, each surrounded by dikes. The dike in the
centre will also be used for transportation. Finally, the testing ground is surrounded by a drainage-
channel. The profile follows the red line from left to right and shows some predetermined
dimensions. At this testing ground research will be done on how to effectively ripen silt into clay. The
process of clay ripening drains water from the silt until its water content has dropped to a level
where we speak of clay. The ripening has to be finished within three years and the 330.000 m3 of silt
need to be transformed into at least 70.000 m3 of clay. This clay will then be used for the ‘brede
groene dijk’ project.
Figure 7: Top view preliminary layout testing ground at Delfzijl. Adapted from: (Ecoshape, 2016, p. 9).
Figure 8: Cross section at red line of current Design Delfzijl. Adapted from: (Ecoshape, 2016, p. 9).
1.2 Research objective and questions The aim of this research is the design of a silt ripening testing ground at Delfzijl, while ensuring the
stability of the surrounding dike. A calculation will be done of two potential drainage systems.

11
1.2.1. Research questions To fulfil the research aim, the following research questions need to be answered:
1. What is the Basis of Design of the project? 1.1. What are the characteristics of the end product, namely category 1 and 2 clay? 1.2. What are the geotechnical requirements of the testing grounds? 1.3. What are the requirements regarding the water balance that should be taken into account? 1.4. What are the functional requirements of the testing ground?
2. What would be a possible design of the testing ground and the surrounding dikes that meets these requirements? 2.1. A possible design of the testing ground? 2.2. A possible geotechnical design of the dikes?
3. What would be the flow, required properties and costs of the drainage systems? 3.1. Of the standard drainage design? 3.2. With pipelines instead of drainage sand?
2. Theoretical framework
2.1. Terminology The terminology contains the specific terms used by the subjects which will be regarded in this thesis. These are about, fluid mechanics, types of soil and their properties and the geotechnics of dikes. By defining these terms and variables beforehand, it is not only clear for others what is meant but also for the creator of the thesis in order to stay consistent. The terminology table can be found in Appendix A (Table 8).
2.2. Geotechnical formulas The following formulas are used for calculating the shear strength of drained as well as undrained
soils. The shear strength can consequently be used to determine the required soil and shear strength
in order to be stable.
2.2.1. Shear strength of a drained soil: Mohr-circle The “Mohr-circle is a geometric representation of the 2-D transformation of stresses and is very
useful to perform quick and efficient estimations” (MIT, 2008) (Figure 9). The Mohr-circle is used to
calculate shear strengths of drained or permeable soils such as sand. In Figure 9, the geometric
relation of the formulas in the Mohr-Circle can be seen.
Figure 9: The Mohr-circle. Obtained from: (Vescovi, 2016).
The formulas of the Mohr-circle that will be used to determine the necessary shear strength are:

12
(2)
In which:
2.2.2. Shear strength of an undrained soil Unlike sand, the shear strength of clay is calculated as an undrained soil (Deltares, 2014). Because
the soil is undrained, the water absorbs any extra loads. This means that unlike with drained soils,
extra loads besides the soil’s own weight do not change the shear strength of the soil. The undrained
shear strength can be calculated using the following formulas (Deltares, 2014, p. 11):
(3)
(4)
In which:
2.3. Drainage formulas The drainage formulas are used to calculate the specific discharge of the test section and with that
the required time for the physical clay ripening process. The discharges will be determined for
vertical flow and horizontal flow in a sand layer as well as for drainage pipes. The recharge in the
model is the precipitation minus the evapotranspiration.

13
This will be used as a constant inflow in the model. After this Darcy’s law for vertical and horizontal
flow will be discussed. At the end there are a few formulas regarding drainage pipes.
2.3.1. Evapotranspiration bare soil and precipitation In the standard design of the drainage facility, the top soil will not contain any vegetation and is
therefore bare. As stated from Cultuurtechnische vereniging (2011, pp. 352-353) determining the
evaporation of a bare soil is difficult since: “An important characteristic of bare soil is, that, if the top
layer dries out, the capillary conductivity of it decreases strongly. This impedes the water supply from
below, reducing the evaporation”. This means that the evaporation is very dependent on other
variables such as the weather. For the bare soil evaporation a rule of thumb is used from
Cultuurtechnische vereniging (2011), which assumes a fully saturated soil and is based on a model by
Menenti (1984). This rule is defined as:
(5)
Eo= Open water evaporation (mm).
Es= Evaporation bare wet soil (mm).
The Cultuurtechnische vereniging (2011, p. 353) says the following about the open water
evaporation: “The term ‘evaporation of a free water surface’ and ‘open water evaporation’ have
raised a lot of confusion since they suggest one can use them to calculate the evaporation values of
open water such as lakes and rivers. However, this is not the case. Eo is in the first place a quantity
used for estimating the potential evaporation of vegetation.” The term is therefore misleading. For
the location of the testing facility, the following values for open water evaporation and yearly
average precipitation (Pyearly, Delfzijl) were found.
= 640 mm (Cultuurtechnische vereniging, 2011, p. 360)
(Cultuurtechnische vereniging, 2011, p. 330)
With the open water evaporation known the bare wet soil evaporation can be calculated using
Equation (5):
The yearly bare soil evaporation used in this thesis will be 448 mm while the yearly precipitation used
will be 750 mm.
2.3.2. Saturated Zone The saturated zone is the “area below the water table in which the soil is completely saturated with
groundwater” (Water Education Foundation, n.d.). The following formulas describe the flow of water
in this saturated zone.
Darcy’s law “Hydraulic conductivity is a measure of a material’s capacity to transmit water. It is defined as a
constant of proportionality relating the specific discharge of a porous medium under a unit hydraulic
gradient in Darcy’s law” (Duffield, n.d.). The formula of Darcy’s law as obtained from
Cultuurtechnische vereniging (2011, p. 430) is:
(6)

14
Where q is specific discharge (m/d), ksat is the saturated hydraulic conductivity (m/d), ΔHh is the
difference in hydraulic head (m) and s is the distance or length the water has to travel (m). The
specific discharge of Equation (6) can be multiplied by the cross-sectional area D (m2) to obtain the
total discharge Q (m3/d):
(7)
For a vertical flow the law of Darcy (6) can be rewritten as (Cultuurtechnische vereniging, 2011, p.
432):
(8)
In this qz,n is the vertical specific discharge for layer n (m/d), Hn is the hydraulic head of layer n (m)
and cn is the vertical resistance of layer n (d). cn can be calculated by:
(9)
In which d is the thickness of the layer (m) and ksat is the saturated hydraulic conductivity (m/d).
For a horizontal flow, the water table forms a parabola as can be seen in Figure 10. The formula to
calculate the hydraulic head of the figure is the formula of Hooghoudt which can be found in
Cultuurtechnische vereniging (2011, p. 513):
Figure 10: Parabolic shape of a horizontal discharge flow. Obtained from: (Brakenhoff, 2017).
(10)
In which:
N: Precipitation or in our case the inflow from the silt layer (m/d).
k: Hydraulic conductivity (m/d).
D: Surface of soil layer. In this 2D view it is the depth of the soil layer (m).
L: Width of the parabola. In our case it is the width of one test section (m).
x: Distance from middle (m).
ϕ: Hydraulic head (m).

15
2.3.3. Ernst’s equation When using drainage pipes, one of the main formulas used is the Ernst equation. “The general
principle underlying Ernst’s basic equation (1962) is that the flow of groundwater to parallel drains,
and consequently the corresponding available total hydraulic head (h), can be divided into three
components: a vertical (v), a horizontal (h), and a radial (r) component (International Institute for
Land Reclamation and Improvement, 1976)”:
(11)
h= total hydraulic head or bulging (m).
= hydraulic head necessary for respectively vertical, horizontal and radial flow (m).
q= drain discharge rate (m/d)
= thickness of the layer over which vertical and radial flow are considered (m).
= The sum of the product of the permeability (K) and thickness (D) of the various layers for
the horizontal flow component according to the hydraulic situation (m2/d).
= Hydraulic conductivity for vertical and radial flow (m/d).
= wetted section of the drain (m); for pipe drains .
= geometry factor for radial flow depending on the hydraulic situation (-).
2.3.4. Head loss drainage pipe When determining the discharge through drainage tubes, the drainage principle is often assumed.
This principle uses a constant inflow per unit length tube for filled up tubes (Wesseling, 1965). The
required drainage capacity of the tubes for the drainage design can be calculated according to the
following formula (Ven & Dekker, 1982):
(12)
In which (also see Figure 11):
hx = Head loss over a distance x from the end (m).
Q = Drainage at the outlet of the drain (m3/s).
d = Inner diameter of the drainage tube (m).
l = length of the drainage series (m).
x = Distance from the end of the tube (not to be confused with the outlet, Figure 11) (m).
a = Characteristic of the drainage tube (m).
Figure 11: Decline of hydraulic head in a drainage series. Obtained from: (Cultuurtechnische vereniging, 2011, p. 532).
The value of a is dependent on the type of tube and the maintenance condition of the tube. For
carefully led out, clean tubes, the following minimal a-values apply (Cultuurtechnische vereniging,
2011, pp. 532-533):

16
In order to keep in mind less favourable field circumstances and because in practise there always is
some pollution, the capacity calculation needs to use a reduction. For diameters of tubes between 40
mm and 150 mm, this can be expressed in an effective diameter (de):
(13)
Using Equation (13) to rewrite Equation (12) results in the formula:
(14)
2.3.5. Maximum drain surface tube Using the effective diameter as a reduction factor, the maximum drain surface can be calculated for
p.v.c. ribbed tubes according to the following formula (Cultuurtechnische vereniging, 2011, p. 533):
(15)
A= maximum drain surface (m2).
q= designed drainage (m/d).
de=effective diameter (1.04d - 0.008) (m).
d= internal diameter (m).
hl= hydraulic head loss over the drainage length l (m).
L= drain spacing (m).
l= drainage length (m).
The formula is based on Equation (12), the formula for the head loss of the drainage pipe, and can be
used to determine the required diameter for the designed drainage or vice versa.
3. Basis of Design The Basis of Design as defined by Briones & McFarlane (2013) is “a document that records the major
thought processes and assumptions behind design decisions made to meet the owner’s project
requirements.” It is an effective tool to clearly present decisions, assumptions and specifications that
are being used to develop the construction documents for a project. In this case the Basis of Design
will focus on requirements for the design of a clay ripening facility at Delfzijl. Based on the research
questions, parts of the basis of design will be discussed. First of all, the main objective and goals of
Ecoshape (2016) along with clay quality requirements will be defined in the characteristics of the end
product. Thereafter, the water balance requirements, geotechnical requirements and the functional
requirements will be discussed shortly. The rest of the Basis of Design can be found in ‘Appendix B:
Basis of Design’.
3.1. Characteristics of the end product These characteristics are what Ecoshape and the project partners want to achieve in this project and
what the requirements of the final product are.

17
3.1.1. Purpose and Objective The purpose of the clay ripening facility is to check with which innovative methods silt on land is
useful and profitable to ripen into clay. This would create an economic basis for the necessary silt
extraction of the Eems-Dollard.
3.1.2. Goals By extracting silt from the Eems-Dollard and ripening this dredged silt on land, the project partners of
the clay ripening facility (Provincie Groningen, Waterschap Hunze en Aa’s, Groningen Seaports NV,
Rijkswaterstaat Noord-Nederland, Stichting Het Groninger Landschap en Stichting Ecoshape) want to
achieve the following:
1. Creating a clear business case for making clay out of silt that can be used for more projects.
2. Filling in of existing knowledge gaps. In particular, the area of clay quality and ripening methods.
3. Gaining insight in the range of applications, the consuming market and ecosystem services that
clay ripening can deliver.
4. Showing a solution for the turbidity problem of the Eems estuary.
5. Clay production (Sweco, 2016):
a. One of the goals is to transform the 330,000 m3 of silt into at least 70,000 m3 of suitable dike
clay. Per section in Delfzijl, which has 14 silt squares, 12,329 m3 will have to be drained.
b. If the clay is suitable for dike construction it is transported to the ‘Brede Groene Dijk’, if it is
not it may either be used to raise the local farmlands or as clay for the coarse ceramic
industry.
3.1.3. Clay quality requirements These are the requirements the ripened clay needs to have at the end of the process in order to be
used for dikes. As discussed before, if it does not meet these requirements the clay will instead be
used to either raise the local farmlands or as clay for the coarse ceramic industry. The requirements
of these additional usages can be found in Appendix B. When using the clay for dikes (Sweco, 2016):
1. The ripened clay must be either erosion class 1 or 2. 2. Ripened clay needs to have a consistency-index (measure of processability) of at least 0.6.
3. Must originate from a naturally deposited material.
4. Sand content (> 63 μm) not more than 40%.
5. Less than 5% organic matter according to the hydrogen peroxide treatment method.
6. Less than 25% weight loss during the HCL-treatment (lime content).
7. Salinity (NaCL g/l soil moisture) is less than 4%.
8. No significant admixture of debris, gravel and such.
9. Limited bright (red, brown and yellow, sometimes blue) discolouration.
3.2. Geotechnical requirements The geotechnical requirements regard the two dike types that will be designed. This section reports
the used parameter values for the soils as well as the forces working on the dikes. The dimensions of
the dikes will be discussed in the functional requirements. The ringdike is relatively simple since it
only needs to withstand the pressure of the silt layer and its water. However, it is important to note
that this pressure is heavier than regular water because of the suspended silt. For the ringdike, water
at a height of 1.5 metres with a density of 1175 kg/m3 will be pressing against the dike.
The broad inner dike needs to have sufficient supporting capacity for driving equipment and be able
to withstand the same pressure of the silt layer and its water at the same time.

18
The pressure caused by the driving equipment will be calculated in chapter ‘4.3. Geotechnical design
broad inner dike’. Finally, the used parameter values of the soils are:
1. Clay:
a. Saturated unit weight = 14 KN/m3 (Deltares, 2014, p. 43).
b. Cohesion = 10 KPa (Geotechdata, 2014).
c. Friction angle = 18° (Geotechdata, 2013a).
2. Sand:
a. Dry unit weight = 20.5 KN/m3 (Geotechdata, 2013b) .
b. Friction angle = 33° (Geotechdata, 2013a).
3.3. Water requirements The water requirements are divided into three sections. The first section is the drainage testing
ground which shows the water that needs to be drained per section as well as in total. The second
part of the water requirements is the hydraulic conductivity of the soils. The last part is the
evapotranspiration and precipitation in the area.
3.3.1. Drainage testing ground In order to be pumped into the test sections, the dredged silt will have to be a suspension. This
means that after the dredged silt is pumped into the test sections, it will first have to deposit before
the ripening can start. The sedimenting will take around one to two weeks (Timmer, 2017).
Afterwards there will be a shell of water above the sedimented silt of 0.3 m. This will be transported
out of the test section by opening pre-installed sand traps. The Danish group Climate Change
Adaptation (2014) describes sand traps as “a relatively simple, subsurface construction consisting of
an input and an output, the sand trap itself in which the sand settles at the bottom, as well as a
storage for the deposited sand. The sand trap serves to remove sand and coarse particles from the
rainwater.” However, in this case the water is not expected to have any sedimented sand after the
two weeks. The main usage will be to drain water at altering heights. As previously stated there will
be 14 test sections in the facility. Taken from the chapter ‘5.1. Soil content calculation’, with a
starting water content of the silt of 90%, the total amount of water that needs to be drained is:
1. To be drained water is 12,329 m3 per section.
2. 172,606 m3 in total.
3.3.2. Hydraulic conductivity soils As explained before the hydraulic conductivity is the speed at which water flows through the soil
often measured in metres per day. Since there is no local soil data, in this thesis standard values will
be used:
1. Sand layer: 5 m/d (Figure 35 & Brakenhoff (2017)).
2. Dredged silt at the start of the ripening, based on sand layer: 5 m/d (Brakenhoff, 2017).
3. Clay layer: 0.001 m/d (Figure 35 & Brakenhoff (2017)).
At the start of the ripening, with a water content of 90%, the silt is practically water. It is safe to
assume that the sand layer will form a bottleneck at the start of the ripening. Therefore, the
hydraulic conductivity of the sand layer is used as the hydraulic conductivity of the dredged silt at the
start. For the hydraulic conductivity at the end it is assumed that the silt will form a dense clay
(Figure 35) with a value of 0.001 m/d. This seemed likely since the volumetric soil content at the end
will be 69%. Furthermore, a value of 0.002 resulted in ripening times around 90 days.

19
Since the Ministeries van Volkshuisvesting, Ruimtelijk Ordening en Milieubeheer et. al (2017) stated
that the ripening of 1 metre of dredged silt would take around one to two years, this seemed
unlikely. The effect of the parameters is checked in chapter ‘5.3.3. Minimal conductivity values’.
3.3.3. Evapotranspiration and precipitation This has already been determined in chapter ‘2.3.1. Evapotranspiration bare soil and precipitation’.
The evaporation and precipitation are respectively:
1. Evaporation bare soil: 448 mm/year.
2. Precipitation at testing ground: 750 mm/year (Cultuurtechnische vereniging, 2011, p. 330).
3.4. Functional requirements In the functional requirements the requirements of
objects on the testing ground are documented. The
most important functional requirements are discussed
here. Starting with the ringdikes and the similar small
inner embankments, these dikes have the following
functions; Storage of silt in the sections, separating the
test sections and form a path for inspection on foot.
The dimensions of the dikes are (Figure 12):
1. Total length is 2900 m.
2. Slope of 1 on 1.5.
3. 29 strokes in total (Figure 19).
4. Crest height is 2 m.
5. Crest width is 0.5 m.
6. Base width is 6.5 m.
The broad inner dike has the same functions except it needs to have a path for both construction
vehicles as well as the pipeline with the dredged silt. Both need to be able to reach each test section.
The dimensions of the broad inner dike are (also see Figure 13):
1. Total length is 900 m.
2. Nine strokes in total.
3. Slope of 1 on 1.5.
4. Crest height is 2 m.
5. Crest width is 13 m.
6. Bottom is 19 m broad.
3.4.1. Additional objects Some important additional objects are the ringditch and the work strip (Figure 8). This ringditch is
used to collect the drainage water from the test sections. From there on the water will be pumped
towards the harbour of Delfzijl. It also forms a natural border of the testing ground. The work strip is
an extra stroke of land around the testing ground. It lies between the ringdike and the ditch and can
be used to access the testing ground from the outside.
Figure 12: Dimensions ringdike & small inner embankment.

20
3.4.2. Acceptable damage The following risks are taken into account:
1. Damage to facility by weather, like storm/ice (Ecoshape, 2016, pp. 33-34):
a. Damage to test sections, dikes or surrounding terrain.
b. 10% chance.
c. €150.000,- of damage.
d. 10-20 weeks of delay/extra work.
2. Saline water in adjacent terrain (Ecoshape, 2016, pp. 33-34):
a. Damage to vegetation.
b. 25% chance.
c. €40.000,- of damage.
d. Up to 4 weeks of delay/extra work.
4. Design testing ground The design of the testing ground is divided into two sections. The first is the functional design of the
testing ground. The second is the geotechnical design.
4.1. Functional design testing ground The original design in Figure 7 & Figure 8 was used as a basis and changed to fit demands gathered in
the Basis of Design. First the ringdike and inner dikes were changed. Instead of the original dike
height of 1.5 metres, the design uses a height of 2 metres. Along with the different height this results
in a wider base because of its longer slope. The extra width consequently means a larger required
building terrain. This increase however is partly covered by the test sections. These sections are 100
by 100 metres at a height of 1.5 metres. In other words the length and width at the bottom are
smaller. A wider dike reduces the volume of the section. Along with the 2 metres in height, the
ringdike was changed to a crest width of 0.5 metres and a slope of 1 on 1.5.
The broad inner dike is used by both vehicles as well as the pipeline for the filling of the test sections.
These objects cross directions multiple times. Therefore, multiple designs were made with different
solutions to this problem. The first design (Figure 13) uses two roads and the pipeline in between.
The second design (Figure 14) uses only one road and the pipeline on one of the sides.
The pipeline can be crossed at least once per test section. The third design (Figure 15) also uses one
road and the pipeline on the side, but does not allow vehicles to cross. Another option would be to
put the pipeline in the dike. The main disadvantage however is that the pipe could be difficult to
reach and the effects on the stability are difficult to take into account. So if the pipe would get
damaged, it could be repaired much easier in the three designs and does not require to dig in the
dike, which might endanger the stability of the dike. In the end the design with two roads was chosen
(Figure 13). The first design has two main advantages. Firstly, the vehicles can reach each test section
during the pumping of the silt, which is a requirement of the construction process (Basis of Design,
Appendix B.). Secondly, the pipeline does not have to be removed and can be used multiple times to
fill compartments. In other words, the sections could be filled multiple times in the three years if the
drainage was fast enough. The design also allows vehicles to cross the pipeline without having to
turn. In the second design one road is used but the vehicle would have to turn while crossing the
pipeline. This requires a lot of space and resulted in a dike as broad as the first design even when
using a very steep slope (Figure 14).

21
The third design is smaller than the first two but the vehicles will not be able to reach every
compartment during the filling of the sections (Figure 15). The first design of the broad inner dike
was used to design the rest of the testing facility.
Figure 13: Profile of design one, broad inner dike.
Figure 14: Profile of design two, very steep slope.
Figure 15: Profile of design three, no vehicles can cross the pipe during the compartment filling.
Besides the dike models, three detailed models were build for specific parts of the facility. The first is
the slope over the crossing pipeline (Figure 16). The angle of the slope is roughly 9°, the length the
pipe sticks out over the slope of the dike is 1.87 metres.

22
However, the position of the end of the pipe will be based on expert knowledge. It is unknown
whether the water can damage the slope during the filling if it does not stick out enough. On the
other hand, the pipe will be harder to support the more it sticks out. If the water indeed damages the
slope, this can easily be tackled by for example adding a wooden drainage box on the ground. The
water would fall from the pipe into the box and would flow into the test section. The second model is
the sloped entrance for the vehicles (Figure 17), which is used to get on top of the broad inner dike.
There will be two entrances for the vehicles, which they will take depending on the compartment
they want to reach. Both entrances are the same except for the pipeline and its crossing with the
road. The angle of the slope is roughly 11°. The third model is of the crossroad (Figure 18) between
the two broad inner dikes. This crossroad uses the same 9° angle as the pipeline crossing. The
crossroad is designed so vehicles are able to turn in case necessary. However, it is desired to avoid
this by taking one of the entrances depending on the destination.
Figure 16: Slope over crossing pipeline on broad inner dike.
Figure 17: Slope at North-side entrance. North is in the bottom right.

23
Figure 18: Crossroad of broad inner dike. Top left is North-side.
The complete design can be seen in (Figure 19), which also shows the position of the pipelines.
Following from these dimension the surface of the design is 18.2 hectares. More dimensions of one
of the sections and the ringdike can be found in (Figure 20). Some remaining impressions can be
found in ‘Appendix C: Additional design pictures’.
Figure 19: Dimensions of testing ground. The pipeline has been accentuated by the red line.

24
Figure 20: Dimensions near one test section.
4.2. Geotechnical design ringdike Using the dimensions of the design of the test facility, the stability of the dike designs will be
checked. In this thesis only the macro-stability will be researched. The two types of dikes that will be
looked at are the ringdikes around the test sections and the broad inner dikes. The other small dikes
between each section will be dimensioned the same as the ringdikes. It is assumed that the
difference in circumstances is negligible.
The ringdikes are the outer dikes around the test sections. All dikes are 100 m per stroke in length,
have a slope of 1 on 1.5 and a crest height of 2 metres. The crest width of the ringdikes is 0.5 metres
and the bottom is therefore 6.5 metres broad. These dikes will be made from the materials gained
from digging the drainage ditch (Ecoshape, 2016). According to soil data (TNO, n.d.) (Also see
‘Appendix B. 2.7.1. Geotechnical survey data for ringdikes and inner dikes design’), this should all be
clay. For these calculations the clay was given a saturated unit weight of 14 KN/m2 (Deltares, 2014, p.
43), a cohesion of 10 KPa (Geotechdata, 2014) and a friction angle of 18° (Geotechdata, 2013a).
These are standard values since the actual properties are unknown. The profile of the testing ground
was copied in Geostudio (Geo-slope, 2016). Geostudio was used to calculate the safety factor of the
ringdike according to the Bishop slope stability analysis method. In Figure 21 the safety factor was
calculated for the starting situation, in which 1.5 metres of water is placed in the test section. The
second picture, Figure 22, is the result of calculating an unplanned scenario in which the silt has
settled and the water is 2 metres high instead of 1.5 metres. Both factors are well above the
minimum of 1. Therefore, it is safe to say that the current design of the ringdike meets the
requirements.

25
Figure 21: Result of the starting situation with 1.5 m of water and suspended particles.
Figure 22: Result of a scenario where the silt has settled and the water has reached a height of 2 m instead of 1.5 m.
4.3. Geotechnical design broad inner dike Unlike the ringdikes, the broad inner dikes will have to deal with two forces. The water pressure
caused by the water in the test sections. And the stress caused by driving material on the dike itself.
First the stress caused by the driving material will have to be determined. Thereafter, the required
strength and consequently the possible building materials of the dike will be calculated. Finally, the
extra stress caused by the vehicles will be added to the water pressure stability calculations.
4.3.1. Stress driving material The effective vertical stress will be influenced by the weight of the soil and, for a drained soil, the
vehicles on the dike. In an undrained soil the incidental load of the vehicles is carried by the water.
The vertical stress on the soil does not increase. More on this in the chapter ‘
4.3.5. Stability calculation water pressure and bulldozer combined’. Of the vehicles that will drive
over the dike, the bulldozer is the heaviest per square meter. It is assumed that this is the heaviest
stress on the slope. Not only because the amount of vehicles crossing the dike will be low, but also
because the stability calculations use concentrations of loads. The total weight on the dike is
therefore not important as long as it is well spread over its body. The dimensions of the bulldozer are
based on the Caterpillar D9R Crawler Tractor (CAT, 2017a). The shear stress caused by one bulldozer
is calculated in ‘Appendix D: Calculations geotechnical stability’. The resulting stress caused by the
bulldozer ( ) is 30.3 KN/m2.
4.3.2. Drained soil The two main materials that can be used for the dike are clay and sand. For drained and permeable
soils, like sand, we use the drained shear strength, which can be calculated using the Mohr-Circle.
This drained shear strength indicates the stress the soil can take. Clay uses a different calculation
which will be performed in the next chapter. The Mohr-Circle is a geometric representation of the 2-
D transformation of stresses and is useful to perform quick and efficient estimations (Figure 23).

26
The formulas of the Mohr-Circle that will be used to determine the necessary shear strength were
discussed before in the theoretical framework (Equation (2).
Figure 23: The Mohr-Circle. Obtained from: (Vescovi, 2016).
The shear strength will be calculated for a dike consisting of only well graded sand with the following
typical parameter values (Geotechdata (2013a) & (2013b)):
Using the bulldozer’s shear stress, the required average shear strength of the soil was calculated in
‘Appendix D: Calculations geotechnical stability’. The average shear strength ( ) is 15.51 KN/m2.
Using the safety factor (Equation (16), the minimal shear failure strength can be calculated. The
consequence class of CC1 was chosen (SAB-profiel, 2017). This class is used for minor consequences
regarding human lives and small economic and environmental consequences. The safety factor for
the variable load of consequence class CC1 is 1.35. By multiplying the average shear strength of the
soil gained from the previous calculations with the safety factor, the final required shear strength of
the dike soil can be determined.
(16)
The soil must have of 20.94 KN/m2.
4.3.3. Undrained soil As discussed before the shear strength of clay is calculated as an undrained soil (Deltares, 2014). The
extra load of the bulldozer will be carried by the water. Therefore the vehicles’ load does not
increase the undrained shear strength. Again the calculations can be found in ‘Appendix D:
Calculations geotechnical stability’. It uses the Equations (3) & (4), which were discussed before in
chapter ‘2.2.2. Shear strength of an undrained soil’. Resulting from the calculations, the undrained
shear strength of the clay is 2.12 KN/m2. This is too small since the stress caused by the bulldozer is
around 15 KN/m2. A clay dike is therefore not suitable. Sand will have to be used as the carrying soil.
4.3.4. Stability water pressure Now that it has been determined that a clay dike is not able to carry the vehicular loads, a sand dike
will be tested for water pressures. As can be seen in Figure 24, the sand dike has a safety factor of
0.989 for a water level of 2 metres. The dike has a crest height of 2 metres and a slope of 1 on 1.5.

27
The crest width is 13 metres and therefore the bottom is 19 metres. As was determined before, a
safety factor of 1.35 is desired. The sand dike does not meet the requirements.
Figure 24: Stability inner sand dike.
Therefore, the sand will be covered with a clay layer. In Figure 25, this layer is 0.3 metres, which
satisfies the safety factor requirement. Now that both variables have been determined separately,
they will be combined in a final calculation.
Figure 25: Stability inner sand dike covered by a 0.3m clay layer.
4.3.5. Stability calculation water pressure and bulldozer combined As a final test the combination of a load on the dike and the maximal water pressure was calculated.
This is not only interesting as just a combination of two forces. As mentioned before, in an undrained
soil the incidental load of the vehicles is carried by the water. Because the load is only momentarily
and carried by the water, the vertical stress in the soil does not increase. This can cause instabilities
at the slopes of the dikes. Slopes of a dike are prone to slide off on a sliding plane. Forces such as the
weight of the soil or incidental forces such as a vehicle create a momentum around sliding arcs.
These sliding planes are stopped from falling by a counteracting momentum created by the vertical
stress and its radius from the sliding point in the sliding plane (‘Appendix D: Calculations geotechnical
stability’, Figure 42). Therefore, if water is carrying a part of the load at a slope, it stops the
counteracting momentum from responding to an increase in load momentum. If the load
momentum becomes more than the counteracting momentum, the slope will slide down the sliding
plane. This is often shown as the factor of safety (FS), which is the counteracting momentum divided
by the load momentum. In order not to fall, the FS needs to be larger than 1. Often extra safety
margins are added because of uncertainties. In our case the safety factor needs to be above 1.35
(SAB-profiel, 2017).
Since Geostudio’s software did not support this combination, D-Geo Stability (Deltares, n.d.) was
used for this calculation instead. The 30.3 KN/m2 load of the bulldozer was added to the model, since
it was assumed that this would be the heaviest load possible. The angle of divergence of the load is
around 45° (Cofie, Rijneker, Mensink, & Jonker, 2011) and the road on the dike stops at 1 metre
before the slope. With this information the load could be added, of which the result can be seen in
Figure 26. All dimensions were kept the same.

28
As can be seen the resulting safety factor is 1.35, which equals the required safety factor. Therefore
this dike design does meet the requirements and will be used for this thesis. However, it should be
noted that there still needs to be done research regarding the failure mechanisms of piping, overflow
and micro-instability. This is outside the scope of this study.
Figure 26: Stability dike with combination of vertical load and water pressure.
5. Calculation drainage system
5.1. Soil content calculation As discussed before in the theoretical framework, the ripened clay has to meet certain criteria’s in
order to be grouped as category 1 or 2. Based on the category requirements, the required soil
contents were calculated (Table 1).
Table 1: Requirements category 1 & 2 clay in percentages. Adapted from: (Technische Adviescomissie voor de Waterkeringen, 1996, p. 36).
Liquid limit
wl
Plasticity
index Ip
Consistency-
index IC
Sand
content
Water
content
Wmax
Required
soil content
Sc1
Category 1
clay
> 45 > 18 0.75 < 40 < 31 > 69
Category 2
clay
< 45 > 18 0.60 < 40 <34 > 66

29
The test facility will aim to make all silt into category 1 clay. Therefore, the soil content of 69% will be
used as a goal for the ripening process. However, the starting soil content is unknown and needs to
be determined. Following the calculations from ‘Appendix E: Calculations drainage system’. The
starting soil content is 10%. With the soil content known, the volume of soil can be determined. Since
this amount will not change during the process, it can also be used to calculate the resulting volume
and consequently the volume of water that will have to be drained. Calculations can again be found
in ‘Appendix E: Calculations drainage system’. An overview of the variables that will be used in the
drainage model can be seen in (Table 2). The model will calculate one test section. Since there are 14
test sections in the facility, the total volume of drained water including and excluding sand trap water
is respectively:
Table 2: Calculated variables that will be used for the drainage model.
Start end Difference
Soil content (-) 0.1529 0.69 0.5371
Volume water (m3) 10165 836 9329
Height silt layer (m) 1.2 0.27 0.93
5.2. Evapotranspiration bare soil and precipitation The assumed evaporation of bare wet soil around Delfzijl is around 448 mm per year. This can be any
type of soil as long as the top layer is wet. In reality, the top often dries out quickly.
It is unknown whether this would also be the case with ripening clay, since the clay also decreases in
size during the ripening. It is assumed that the clay’s top layer will always be wet. Consequently, in
comparison to a regular soil, the evaporation is high. However, it is expected that the clay will in
reality have a higher evaporation at the start and probably a lower evaporation at the end. Since at
the start the silt acts more like water and at the end the top layer will probably dry. The precipitation
around Delfzijl was determined to be 750 mm per year (Cultuurtechnische vereniging, 2011, p. 330).
The evaporation and precipitation that will be used in the model are yearly averages. However, it is
known that these values differ a lot between winter and summer. The influence of this fluctuation on
the total drainage time was not studied because of a lack of time for the thesis. Therefore, it was
assumed that the difference is not crucial for the results of the model.
5.3. Saturated Zone The saturated zone is the “area below the water table in which the soil is completely saturated with
groundwater” (Water Education Foundation, n.d.). The formulas from chapter ‘2.3.2. Saturated Zone’
were used for vertical & horizontal flow as well as determining minimal conductivity values for clay
ripening in three years.
5.3.1. Vertical flow The standard calculation of the model only looks at the vertical flow through the silt layer. The
starting vertical hydraulic conductivity (kv), was assumed to be 5 m/d while the end value was
assumed to be 0.001 m/d as derived from the Basis of Design (Appendix B). As discussed before, the
starting value is based on the hydraulic conductivity of sand. This is because the sand is assumed to
form the bottleneck at the start of the ripening, since the silt at the start will be close to water.
30
First, the linear dependency between the soil content and vertical resistance (cn) is calculated in
Appendix E using Equation (9). Drawing a line between the start and end values, the angle would
become 494.7 for 100% soil content. Now the vertical resistance can be calculated for every step of
time by using the change in soil content and multiplying with the angle, for example:
In which the hydraulic head, dh (m), is divided with the vertical resistance, c (d). Consequently, by
using the vertical resistance the discharge can be calculated by using Equation (8). By using the
constant evaporation and precipitation as input of the model, the model is complete and can
calculate the total needed time to reach a soil content of 0.69. In the case of the vertical flow with no
drains and a kv start=5 and kv end=0.001, the required time is 290 days.
5.3.2. Horizontal flow The vertical flow of water to sand would take 290 days to get to a soil content of 69%. However, in
reality the water needs to flow horizontally from the sand to the ditch. Therefore, it is important to
check whether, instead of the vertical flow, the horizontal flow in the sand will not form a bottleneck.
Calculations are done in ‘Appendix E: Calculations drainage system, Horizontal flow’ using Equation
(10). Following from these calculations, the starting hydraulic conductivity of the horizontal flow is
0.10 m/d. While the starting value is based on the bottleneck caused by the horizontal flow in the
sand layer, the conductivity at the end is kept at 0.001 m/d. The linear dependence was changed to
the new starting value and using the same evapotranspiration and precipitation the drainage time
was 310 days.
5.3.3. Minimal conductivity values The drainage time was calculated in the chapters ‘5.3.1. Vertical flow’ and ‘5.3.2. Horizontal flow’ for
standard parameter values. However, the actual hydraulic conductivity both at the start as well as
the end can be different. Therefore, the minimal conductivity values in order to ripen in three years
were calculated. Three years was chosen because this is the maximum storage time (Appendix B,
Besluit bodemkwaliteit). The values were found by changing the conductivities one by one.
Combinations of the variation in k start and end would result in infinite variations. Therefore, these
values are no hard limits but still roughly show what the conductivity should be in order to meet the
goal. The results are shown in Table 3. Clearly, the hydraulic conductivity at the end has a larger
impact on the drainage time compared to the starting value. While the starting value for the
horizontal flow was 0.10 m/d instead of 5 m/d, the difference in k end was minimal. It is also
important to note that in chapter ‘3.3.2. Hydraulic conductivity soils’ it was assumed that the silt
would form a dense clay with a hydraulic conductivity of 0.001 m/d. However, following from Figure
35, the hydraulic conductivity of dense clay has a large range and could very well fall below the
assumed value. The drainage system should still suffice as long as the ending hydraulic conductivity is
above 0.000828. This minimal k end value is dependent on the inflow, precipitation minus
evapotranspiration. As long as the hydraulic conductivity is above the inflow, the ripening should
succeed. In case the conductivity is below the minimal value other methods will have to be used. One
option is to create extra suction to the pipes by adding a pumping machine to the system. Drainage
pipes will be calculated later on in chapter ‘5.5. Maximum drain surface tube’. Another option is to
stop the inflow. This could be done by putting a sail above the silt layer. The sail could catch the
water and let it flow into the sand trap. Lastly, Ecoshape has thought of techniques to improve the
drainage as well. These can be found in the Basis of Design in ‘Appendix B, 4. Operational
requirements’.

31
An example could be intensive mechanical processing; ploughing the silt layer a few times a year. In
this thesis, we will assume the k end value is 0.001 m/d and therefore does meet the minimal
conductivity requirements.
Table 3: Minimal conductivity values, marked with underscores, for clay ripening in 3 years.
Precipitation -
evapotranspiration
k start k end Days
mm/d m/d m/d d
Vertical flow
minimal k end
8274 5.0 0.000828 1090
0 5.0 0.000139 1090
Vertical flow
minimal k start
8274 0.0034 0.001 1090
0 0.00121 0.001 1090
Horizontal flow 8274 0.10 0.000828 1090
0 0.10 0.000140 1090
5.4. Ernst’s equation Resulting from the calculations in ‘Appendix E, Ernst’s equation’ the following could be concluded.
The lower the drain spacing, the higher the required discharge and consequently diameter. However,
this is not useful for designing a drainage system, since the diameter should be kept constant.
Therefore, we will calculate the drainage system with the formulas from the chapter below.
5.5. Maximum drain surface tube The formula from ‘2.3.5. Maximum drain surface tube’ in the theoretical framework is based on the
formula for the head loss of the drainage pipe and can be used to determine the required diameter
for the designed drainage or vice versa. In this case we will design the drainage from the pipes to be
0.10 m/d at the start of the ripening process. In other words, it has the same drainage as the
horizontal water flow through the sand. Since in the drainage tubes design the pipes replace the
horizontal sand layer, by designing for this discharge the design is likely to meet the requirements for
the ripening process as well as being able to be compared with the sand layer in terms of costs. The
surface of each section is around 10,000 m2. Based on Ernst’s equation (Table 11) five pipes for each
section would seem to be the best solution. However, the resulting diameter is 81 mm, which is
rarely made commercially. Instead, three pipes per section will be chosen. These pipes will have a
center to center distance of 33 metres. The advantage of taking three pipes instead of two is that
there is better backup for a failure of one of the pipes. See ‘Appendix E, Maximum drain surface
tube’ for the calculations with Equation (15).
Using three drainage pipes with a centre to centre distance of 33 metres and designing for a 0.10
m/d specific discharge, the required diameter of the each pipe is 0.098 metres. Using this diameter
with the hydraulic head at the end of the draining, the discharge of the drainage pipes at the end can
be calculated. This is required to be at least larger than the discharge of the ripened clay in order not
to slow down the drainage process. The discharge was calculated to be 0.052 m/d. In conclusion the
three drainage pipes meet the requirements. Since, 98 mm as a diameter is too specific, the drainage
pipes will be designed to have a diameter of 100 mm.

32
5.6. Cost comparison Both the horizontal sand drainage and the drainage pipes use an assumed 0.5 metre thick sand layer.
The difference is the surface area of these options. The drainage pipes will use a 100 metres times
100 metres sand layer, while the horizontal sand drainage uses 100 metres times 115.5 metres. This
extra length is caused by the distance between the drainage ditch and the test sections. The required
materials as well as the total costs of both designs can be seen in Table 4. Calculations can be found
in ‘Appendix E, Costs drainage designs’. It seems that the materials for the drainage pipes design
would be the cheaper option and is therefore chosen. However, the construction times and costs are
unknown. Furthermore, the drainage pipes carry more risk because of their possibility to break or to
become blocked by material in the pipe. These will not be determined in this report due to a lack of
time.
Table 4: Cost materials of two drainage designs: Horizontal sand layer and drainage pipes.
Drainage
design
Total amount
of sand (m3)
Cost of sand
(€)
Total length of
drainage pipes
(m)
Cost of
drainage pipes
(€)
Total costs (€)
Horizontal
sand drainage
78,050 1,717,100.- 0 0 1,717,100.-
Drainage
pipes
70,000 1,540,000.- 4683 36,902 1,576,902.-
6.1. Discussion During the study multiple assumptions were made, most of which were caused by a lack of data. The
assumptions which can potentially have a crucial impact on the design are discussed below. One of
these assumptions is the linear dependency of the C-value in the drainage calculation on the soil
content. It is known that a linear dependency is not inaccurate. However, the relationship can
currently only be determined via empirical research. Because no empirical research for the dredged
silt in the project has been performed yet and no specific reports regarding dredged silt have been
found, the relation could not be determined empirically. Furthermore, unlike the laboratory
experiments, in practise soil will contain multiple kinds of materials. The dredged silt in this thesis
consists of clay, sand, silt, organic materials etc., which makes determining a mean hydraulic
conductivity much harder. The linear dependency was picked as a first calculations because of its
simplicity while on the other hand still useful. The relationship of water content and hydraulic
conductivity or conductance for ripening dredged silt into clay, would be an interesting study to
perform.
Of the vehicles that will drive over the dike, the bulldozer is the heaviest per square meter. It is
assumed that this is also the heaviest stress on the slope. Not only because the amount of vehicles
crossing the dike will be low, but also because the stability calculations use concentrations of loads
and therefore the total weight on the dike is not important as long as it is well spread over its body.
The weight of the pipeline on the dike and other possible objects were not taken into account. A
serious deviation in the stress on the slope could result in a dike failure. Furthermore, the start value
of kv was assumed to be 5 m/d while the end value was assumed to be 0.001 m/d as derived from
the Basis of Design (Appendix B). Especially the end value has a large impact on the result. It could be
possible that the clay layer gets below the minimal value, since it is in the possible range of the clay
type (Figure 35). Therefore, it is crucial to research the hydraulic conductivity of the clay in time.

33
If necessary, extra measures could be taken to meet the minimal conductivity. Another assumption is
that the clay’s top layer will always be wet, while this is most likely not the case. Bare soil does
evaporate fast when wet, but in reality this causes the top layer to dry out. This practically stops
further evaporation until the top soil becomes wet again, by for example precipitation. On the other
hand, at the start of the ripening the silt will act more closely to water than bare soil because of its
high water content. Therefore, the clay will in reality have a higher evaporation at the start and
probably a lower evaporation at the end. The evaporation and precipitation that will be used in the
model are also yearly averages. However, it is known that these values differ a lot between winter
and summer. It is unknown whether these fluctuations would have an impactful influence on the
total drainage time. Further research could be done on winter and summer weather fluctuations and
their impact on the total drainage time. In this study it was assumed that the difference is not crucial
for the results of the model.
It was also assumed that the phreatic line was linear. Most scientific sources assume it to be a
parabolic line in the dike. However, the assumption was made in order to make the modelling easier,
since the geoslope program did not offer a parabolic phreatic line. Furthermore, the manual
calculation did not use water pressure since the phreatic line was assumed to be below this specific
sliding plane, while in fact it did slightly cross the plane. It should also be noted that since the silt
layer was above the phreatic line, no water seepage calculations were done. In case the phreatic line
is incorrect, this could have an impact on the water seepage and therefore the drainage systems.
Two types of dikes were designed even though there are in fact three: ringdikes, broad inner dikes
and small inner dikes. The other small dikes between each section were dimensioned the same as
the ringdikes. It was assumed that regarding macro-instability the difference in circumstances is
negligible, because the maximum possible water pressure should be the same between both types.
Finally, the drainage pipes design was chosen because of its lower costs compared to the horizontal
sand drainage design. However, the construction times and costs are unknown. Furthermore, the
drainage pipes carry more risk because of their possibility to break or to become blocked by material
in the pipe. These have not been determined in this report due to a lack of time.
6.2. Conclusion In this section the main results of the design and drainage are repeated in short. The main parts of
the Basis of Design have been discussed before in chapter ‘3. Basis of Design’. The complete
document can be found in Appendix B. Using the dimensions of the entire testing ground found in
Figure 19, the total surface of the testing ground is 18.2 ha. The facility contains 14 test sections.
These sections can be reached by both the pipeline as well as vehicles and personnel via the broad
inner dike. By only letting the road and pipeline cross in the length of this dike, the dimensions of the
dike were made smaller than most other designs. This not only saves room but also a lot of building
materials and costs. In Table 5 the dimensions of the two researched dike types are recorded along
with the resulting safety factor when calculating the geotechnical stability. Note that the broad inner
dike has the additional vehicular load on top of the dike. The profile of the dikes along with the loads
can be seen in Figure 22 & Figure 26.
Table 5: Dimensions dike types and the resulting safety factor.
Crest width
(m)
Slope (-) Height (m) Base width Safety factor
Ringdike 0.5 1 on 1.5 2 6.5 2.692
Broad inner dike 13 1 on 1.5 2 19 1.35

34
The drainage system according to the horizontal calculations was shown to be able to physically ripen
the clay in 310 days. The horizontal calculations use the horizontal conductivity of the draining sand
layer as the starting value instead of the starting value of the silt, which is the same as the vertical
conductivity of the sand. The vertical and horizontal starting values of the sand layer are respectively:
5.0 m/d and 0.10 m/d. Therefore, the horizontal flow in the sand layer will form the bottleneck at the
start of the ripening. Another variation was made that uses drainage pipes instead of the sand layer.
It was decided that the drainage pipes should be designed for the same starting conductivity as the
sand layer. This makes it possible to compare the two variations in terms of costs. With two drainage
pipes, a hydraulic conductivity of 0.10 m/d and a drainage length of roughly 100 metres, the
diameter of the pipe becomes 0.098 metres, which is changed to 100 mm since that is actually
available commercially. At the end of the process the pipes have a drainage of 0.052 m/d. Since the
silt layer reaches a hydraulic conductivity of 0.001 m/d at the end, the pipes will not form a
bottleneck at the end of the physical ripening process. Purely looking at the costs of the material in
Table 6, the drainage pipes design is cheaper with €1,576,902.- instead of €1,717,100.- of the
horizontal sand drainage and is therefore chosen as the design. Finally, in Table 7 the minimal start
and end conductivity values are shown for clay ripening within three years. Cleary, the hydraulic
conductivity at the end has a large impact on the drainage time compared to the starting value. As
long as the hydraulic conductivity is above the inflow, the ripening should succeed. In case the
conductivity is below the minimal value other methods will have to be used.
Table 6: Cost materials of two drainage designs: Horizontal sand layer and drainage pipes.
Drainage
design
Total amount
of sand (m3)
Cost of sand
(€)
Total length of
drainage pipes
(m)
Cost of
drainage pipes
(€)
Total costs (€)
Horizontal
sand drainage
78,050 1,717,100.- 0 0 1,717,100.-
Drainage
pipes
70,000 1,540,000.- 4683 36,902 1,576,902.-
Table 7: Minimal conductivity values, marked by underscores, for clay ripening in three years.
Precipitation -
evapotranspiration
k start k end Days
mm/d m/d m/d d
Vertical flow
minimal k end
8274 5.0 0.000828 1090
0 5.0 0.000139 1090
Vertical flow
minimal k start
8274 0.0034 0.001 1090
0 0.00121 0.001 1090
Horizontal flow 8274 0.10 0.000828 1090
0 0.10 0.000140 1090

35
References Arcgis. (2011, July). Dutch Topographic Base map. Retrieved from arcgis.com:
https://www.arcgis.com/home/item.html?id=f0846552762b4ecc8fc1a01d72179f4c
Assallay, A., Rogers, C., Smalley, I., & Jefferson, I. (1998). Silt: 2-62um,9-4phi. Earth Science Reviews
45 , 61-88.
Bodem+. (2016). Besluit Bodemkwailiteit . Den Haag.
Brakenhoff, D. (2017, May 19). Horizontale stroming.
Briones, V., & McFarlane, D. (2013). Technical vs. Process Commissioning Basis of Design. ASHRAE
Journal , pp. 76-81.
CAT. (2017a). D9R Dozer. Retrieved from cat.com:
http://www.cat.com/en_ZA/products/new/equipment/dozers/large-dozers/17806345.html
CAT. (2012). Hydraulische graafmachine 312E. Retrieved from cat.com:
https://cpc.cat.com/ws/assets/C829616.pdf
CAT. (2017b). Off Highway Truck. Retrieved from cat.com:
http://www.cat.com/en_US/products/new/equipment/off-highway-trucks/off-highway-
trucks/18560286.html
Climate Change Adaptation. (2014). Sand traps. Retrieved from klimatilpasning.dk:
http://en.klimatilpasning.dk/technologies/normal-rainfall-and-cloudbursts/sand-traps.aspx
Cofie, P., Rijneker, B., Mensink, R., & Jonker, J. (2011). Legger regionale waterkeringen
uitgangspunten. Leiden: Hoogheemraadschap van Rijnland.
Cultuurtechnische vereniging. (2011). Cultuurtechnisch vademecum Deel III. Water.
Deltares. (n.d.). D-Geo Stability. Retrieved from deltares.nl: https://www.deltares.nl/en/software/d-
geo-stability-2/#7
Deltares. (2014). Handreiking voor het bepalen van schuifsterkte parameters.
Dirksen, C. (2001). Unsaturated Hydraulic Conductivity. Wageningen: CRC Press.
Domenica, P., & Schwartz, F. (1990). Physical and Chemical Hydrogeology. New York: John Wiley &
Sons.
Dredgdikes. (2017). Dredged Materials in Dike Construction. Retrieved from dredgdikes.eu:
http://www.dredgdikes.eu/en/baggergut-im-deichbau-16
Dredgedikes. (n.d.). Test dike setup. Rostock, Germany.
Duffield, G. (n.d.). Representative Values of Hydraulic Properties. Retrieved from aqtesolv.com:
http://www.aqtesolv.com/aquifer-tests/aquifer_properties.htm
Ecoshape. (2016). PvA Kleirijperij.
Gasbevingen portaal GBB. (2017). Gasbevingen. Retrieved from opengis.eu:
http://opengis.eu/gasbevingen/
Geo-slope. (2016). Retrieved from Geo-slope.com: https://www.geo-slope.com/

36
Geotechdata. (2014). Soil cohesion. Retrieved from geotechdata.info:
http://www.geotechdata.info/parameter/cohesion.html
Geotechdata. (2013b). Soil dry unit weight. Retrieved from geotechdata.info:
http://www.geotechdata.info/parameter/soil-dry-unit-weight.html
Geotechdata. (2013a). Soil friction angle. Retrieved from geotechdata.info:
http://www.geotechdata.info/parameter/angle-of-friction.html
Geotechdata. (2013a). Soil friction angle. Retrieved from geotechdata.info:
http://www.geotechdata.info/parameter/angle-of-friction.html
Google. (n.d.). Google maps. Retrieved 06 26, 2017, from www.google.nl/maps:
https://www.google.nl/maps/place/Delfzijl/@53.2925048,6.8191338,43618m/data=!3m1!1e3!4m5!
3m4!1s0x47b628ef590e0645:0xaed9d5b263aee564!8m2!3d53.3310272!4d6.9244598?hl=en
HaskoningDHV. (2013). Bijlage 3 Toelichting faalmechanismen. Retrieved from wshd.nl:
http://www.wshd.nl/binaries/content/assets/wshd---
website/nieuws/2013/11/bijlage_3_toelichting_faalmechanismen.pdf
International Institute for Land Reclamation and Improvement. (1976). Principles of the Ernst
equation. Retrieved from alterra.wur.nl: http://www2.alterra.wur.nl/Internet/webdocs/ilri-
publicaties/bulletins/Bul15/bul15-h3.pdf
Kadaster. (n.d.). KLIC (WION). Retrieved April 2017, from kadaster.nl: https://www.kadaster.nl/klic-
wion
KNMI. (2010a). Gemiddelde relatieve luchtvochtigheid. Retrieved from klimaatatlas.nl:
http://www.klimaatatlas.nl/klimaatatlas.php
KNMI. (2010b). Gemiddelde windsnelheid. Retrieved from klimaatatlas.nl:
http://www.klimaatatlas.nl/klimaatatlas.php?wel=wind&ws=kaart&wom=Gemiddelde%20windsnelh
eid
KNMI. (n.d.). Windschaal van beaufort. Retrieved from knmi.nl: https://www.knmi.nl/kennis-en-
datacentrum/uitleg/windschaal-van-beaufort
McCartney, J., Villar, L., & Zornberg, J. (2007). Estimation of the Hydraulic Conductivity Function of
Unsaturated Clays Using Infiltration Column Tests. Sixth Brazilian Symposium on Unsaturated Soils,
(pp. 321-328). Salvador.
Menenti, M. (1984). Physical aspects and determination of evaporation in deserts applying remote
sensing techniques. Wageningen: Instit. voor Cultuurtechniek en Waterhuishouding, Wageningen.
Ministerie van Binnenlandse Zaken en Koninkrijksrelaties. (2017, March). Wet natuurbescherming.
Retrieved April 2017, from wetten.overheid.nl: http://wetten.overheid.nl/BWBR0037552/2017-03-
01
Ministerie van Sociale Zaken en Werkgelegenheid. (n.d.). Wat is een V&G-plan? Retrieved April 2017,
from arboportaal.nl: https://www.arboportaal.nl/onderwerpen/verantwoordelijkheden/vraag-en-
antwoord/wat-is-een-vg-plan
Ministeries van Volkshuisvesting, Ruimtelijke Ordening en Milieubeheer, Verkeer & Waterstaat,
Bodem+, IPO, VNG, UvW & SKB. (2017). Factsheet het rijpen van baggerspecie. Retrieved from
bodemrichtlijn.nl: https://www.bodemrichtlijn.nl/Bibliotheek/bodemsaneringstechnieken/h-

37
behandelen-en-bestemmen-va9446/h5-natuurlijke-technieken/factsheet-het-rijpen-van-
baggerspecie
MIT. (2008). Unified Handout - Materials and Structures - #M-6. Retrieved from web.mit.edu:
http://web.mit.edu/16.unified/www/FALL/materials/documents/HO-M-6(Mohrs)(08).pdf
Onze Minister van Volkshuisvesting, Ruimtelijke Ordening en Milieubeheer. (2009a). Besluit
kwaliteitseisen en monitoring water 2009. Retrieved May 2017, from wetten.overheid.nl:
http://wetten.overheid.nl/BWBR0027061/2017-01-01#BijlageII
Onze Minister van Volkshuisvesting, Ruimtelijke Ordening en Milieubeheer. (2009b). Europese
milieukwaliteitseisen voor water voor prioritaire stoffen en bepaalde andere verontreinigende
stoffen. Retrieved May 2017, from wetten.overheid.nl:
http://wetten.overheid.nl/BWBR0027061/2017-01-01#BijlageI
Oxford Dictionaries. (n.d. a). Clay. Retrieved April 12, 2017, from en.oxforddictionaries.com:
https://en.oxforddictionaries.com/definition/clay
Oxford Dictionaries. (n.d. b). Silt. Retrieved April 12, 2017, from en.oxforddictionaries.com:
https://en.oxforddictionaries.com/definition/silt
Oxford University. (2004). Dictionary of Biology. Oxford: Oxford University Press.
P. de Jong B.V. (n.d.). Drainzand. Retrieved June 26, 2017, from www.pdejongbv.nl:
http://www.pdejongbv.nl/zand-bestellen/drainzand
Provincie Groningen. (n.d.). Ontgrondingen (vergunning). Retrieved April 2017, from
provinciegroningen.nl:
https://www.provinciegroningen.nl/loket/vergunningenontheffingen/ontgrondingen/
Regelink. (n.d.). Ecologische quickscan flora en fauna. Retrieved April 2017, from regelink.net:
https://www.regelink.net/onderzoek-advies/natuurwetgeving/ecologische-quickscan-flora-en-
faunawet/
Rijksoverheid. (2015). Chemische waterkwaliteit KRW, 2015. Retrieved from clo.nl:
http://www.clo.nl/indicatoren/nl1566-chemische-kwaliteit-oppervlaktewater-krw
Rijksoverheid. (2016). Verlies natuurlijkheid in Nederland, Europa en de wereld. Retrieved June 2017,
from clo.nl: http://www.clo.nl/indicatoren/nl1440-ontwikkeling-biodiversiteit-msa
Rijkswaterstaat. (n.d. a). Aanvraag en voorbereidingsprocedure watervergunning. Retrieved April
2017, from infomil.nl: https://www.infomil.nl/onderwerpen/klimaat-lucht/handboek-
water/wetgeving/waterwet/handelingen/aanvraag/
Rijkswaterstaat. (2017). Bedreigingen en Faalmechanismen. Retrieved from enwinfo.nl:
https://www.enwinfo.nl/index.php/waterveiligheid/bedreigingen-en-faalmechanismen#falen
Rijkswaterstaat. (2004). Bouwen met baggerspecie dagelijkse praktijk NL.
Rijkswaterstaat. (n.d. b). Vergunningplichtige handelingen. Retrieved April 2017, from infomil.nl:
https://www.infomil.nl/onderwerpen/klimaat-lucht/handboek-
water/wetgeving/waterwet/handelingen/vergunningplichtig/
RWE Eemshaven. (2014). Beoordeling kwikemissies uit de RWE-centrale in het Eemshavengebied.

38
SAB-profiel. (2017). Bouwbesluit 2012 - Eurocodes en windbelasting. Retrieved from sabprofiel.nl:
https://www.sabprofiel.nl/bedrijf/sab-nieuws/sab-nieuws-2012/bouwbesluit-2012-eurocodes-en-
windbelasting.html
Sadar, M. (2004). Making Sense of Turbidity Measurements - Advantages In Establishing Traceability
Between Measurements and Technology. National Monitoring Conference. Chattanooga.
Scheuermann, A., & Bieberstein, A. (2007). Determination of the Soil Water Retention Curve and the
Unsaturated Hydraulic Conductivity from the Particle Size Distribution. Berlin: Springer.
Smedema, L., & Rycroft, D. (1983). Land drainage: planning and design of Agricultural Drainage
Systems. London: Batsford.
Sweco. (2016). Projectplan Kleirijperij.
TAW. (1985). Leidraad voor het ontwerpen van rivierdijken, deel I - bovenrivierengebied. 's-
Gravenhage: Staatsuitgeverij.
Technische Adviescomissie voor de Waterkeringen. (1996). Technisch rapport klei voor dijken.
Timmer, H. (2017, May). Sediment time of the silt.
TNO. (1998). Grondwater in Nederland. Rotterdam: Van de Rhee.
TNO. (n.d.). Subsurface data. Retrieved 2017, from dinoloket.nl:
https://www.dinoloket.nl/en/subsurface-data
Van Nederkassel, J., Van Zele, S., Van Renterghem, B., Vermeersch, T., & Quaeyhaegens, H. (2014).
The Use of Engineered Sediments For the Construction of a Compartment Dike in the Controlled
Flooding Area of Vlassenbroek (Belgium). South Baltic Conference. Rostock: University of Rostock.
van Walraven. (n.d.). 180514 PVC drainagebuis, geperforeerd, 100mm. Retrieved June 26, 2017, from
www.vanwalraven.com/nl: https://www.vanwalraven.com/nl/catalog/leidingsystemen-
afvoer/drainage-en-hulpstukken/buis-drainage/pvc-drainagebuis-kaal-
geperforeerd/180514/g+c+p+a+nr
Ven, G., & Dekker, K. (1982). De afvoercapaciteit van drainbuizen en de invloed op het drainage-
ontwerp. Cultuurtechnisch tijdschrift , 38-47.
Vescovi, D. (2016). Grond Mechanica, Tutorial 4. Enschede, Overijssel, Nederland.
VU. (n.d.). Schaal van Richter. Retrieved from falw.vu.nl: http://www.falw.vu.nl/nl/voor-het-
vwo/wetenschap-in-gewone-woorden/Aardwetenschappen/aardbeving/schaal-van-richter.aspx
Water Education Foundation. (n.d.). Saturated zone. Retrieved from watereducation.org:
http://www.watereducation.org/aquapedia-background/saturated-zone
Waterkwaliteitsportaal . (2015). Factsheet: NLGW0008 Zout Eems.
Wesseling, J. (1965). Stromingsweerstanden in plastiek drainbuizen. Nota 293. Wageningen:
Cultuurtechniek en Waterhuishouding.
Witteveen+Bos. (2017). ZZDKR6500-16-112 Kleijrijperij - ontwerpmodellering.
Youngs, E. G. (2001). Hydraulic Conductivity of Saturated Soils. Bedfordshire: CRC Press.

39
Appendix A: Terminology Table 8: Terminology in the thesis.
Terminology Description
Clay Clay in Civil Engineering can have two different definitions. Firstly, it is used for particles with a grain size of <2 µm. However, clay as a soil is a stiff, sticky fine-grained earth that can be moulded when wet (Oxford Dictionaries, n.d. a). When using the categories 1, 2 and 3 of clay, clay is <63 µm. In other words, we include silt into the definition of clay. In this thesis, when talking about clay, we use the second definition.
Category 1 clay Non-erodible clay used for construction. Category 1 clay is used a lot for the outer parts of a dike because of its resistance against erosion and high loads. It is an expensive material due to its strict requirements. The clay is deemed non-erodible if it corresponds to the following variables (Technische Adviescomissie voor de Waterkeringen, 1996, p. 36): wl > 45, in which wl= Liquid limit and Ip > 0.73*(wl-20), in which Ip= Plasticity Index and sand content < 40 All numbers are mass percentages of the dry mass.
Category 2 clay Moderate erosion resistant. Category 2 clay can be used for the inside of the dike for high loads and even the outer parts when dealing with low loads. The clay is deemed moderate erosion resistant if it corresponds to the following variables (Technische Adviescomissie voor de Waterkeringen, 1996, p. 36): wl < 45 and Ip > 18 and sand content < 40
Category 3 clay Weak erosion resistant. Category 3 clay can be used for the inside of the dike for low loads and the berm. The clay is deemed weak erosion resistant if it corresponds to the following variables (Technische Adviescomissie voor de Waterkeringen, 1996, p. 36): wl < 0.73*(wl-20) and/or Ip < 18 and/or sand content > 40
Silt Silt in Civil Engineering has two different

40
definitions in English. Technically, silt is a granular material of a size between sand and clay, whose mineral origin is quartz (Assallay, Rogers, Smalley, & Jefferson, 1998). The grain size of silt is categorised as between 2-63 µm. However, silt is also used to describe “fine sand, clay or other materials carried by running water and deposited as a sediment, especially in a channel or harbour” (Oxford Dictionaries, n.d. b). This definition therefore includes clay, silt and fine sands. In this thesis, when talking about silt, we use the second definition.
Clay ripening Clay ripening is the process of drying and oxidising silt in order to obtain clay. Silt is not chemically the same as clay. Therefore, it not only has to be drained but also chemically altered. There are 3 types of ripening (Ministeries van Volkshuisvesting, Ruimtelijke Ordening en Milieubeheer, Verkeer & Waterstaat, Bodem+, IPO, VNG, UvW & SKB, 2017):
Physical ripening, reducing the water content which results in subsidence.
Chemical ripening, change in the chemical composition due to oxidative reactions.
(micro)biological ripening, increase and change of the biological life and its influence on the chemical composition due to microbial decay.
However, this thesis will focus on the water content of the silt and clay. Furthermore, the location for dredging have already been determined based on the quality of the silt (Sweco, 2016). While clay ripening has been researched before, a lot of different methods and their efficiency have not yet been looked at.
Drainage Lowering the water content of a soil. This can be done in multiple ways; evapotranspiration, pumping or underground flows.
Failure mechanism A way in which a dike can collapse due to erosion or instability.
Dike failure When water can flow over or past the dike. Although often the case, a dike failure does not have to result in a collapse of the dike (Rijkswaterstaat, 2017).
Overtopping When water flows over the top of the dike. Is only a failure mechanism if the resulting erosion causes the dike to collapse.
Piping Failure mechanism of a dike where the water
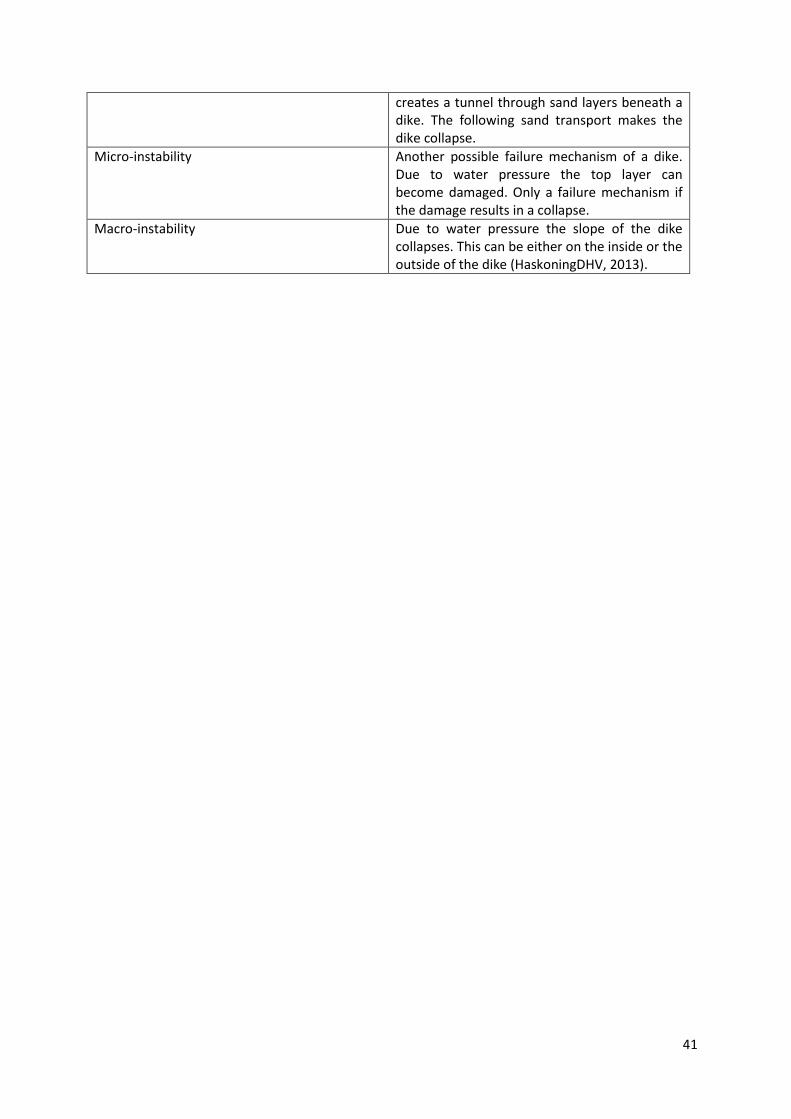
41
creates a tunnel through sand layers beneath a dike. The following sand transport makes the dike collapse.
Micro-instability Another possible failure mechanism of a dike. Due to water pressure the top layer can become damaged. Only a failure mechanism if the damage results in a collapse.
Macro-instability Due to water pressure the slope of the dike collapses. This can be either on the inside or the outside of the dike (HaskoningDHV, 2013).

42
Appendix B: Basis of Design
1. Introduction The Basis of Design as defined by Briones & McFarlane (2013) is “a document that records the major
thought processes and assumptions behind design decisions made to meet the owner’s project
requirements.” It is an effective tool to clearly present decisions, assumptions and specifications that
are being used to develop the construction documents for a project. In this case the Basis of Design
will focus on requirements for the design of a clay ripening facility at Delfzijl. The client is Ecoshape,
whom works together with the local principalities for this new project. This Basis of Design has been
split into six sections. The site description is about the current state of the terrain and its soil, the
climate, the current design and its technical requirements. Functional requirements are the
dimensional requirements and the function of the clay ripening facility. Operational requirements are
the requirements for processes that happen during its operating time. Client requirements are
specific and related to the client’s objective. This objective is defined in 1.1. The chapter of rules and
regulations describes the relevant laws and the necessary permits in order to legally perform this
project. Codes and standards are unlike the rules, focused on parameter values. The main objective
and goals of Ecoshape will now be defined (Ecoshape, 2016).
1.1. Purpose and Objective The purpose of the clay ripening facility is to check with which innovative methods silt on land is
useful and profitable to ripen into clay. This would create an economic basis for the necessary silt
extraction of the Eems-Dollard.
1.2. Goals By extracting silt from the Eems-Dollard and ripening this dredged silt on land, the project partners of
the clay ripening facility (Provincie Groningen, Waterschap Hunze en Aa’s, Groningen Seaports NV,
Rijkswaterstaat Noord-Nederland, Stichting Het Groninger Landschap en Stichting Ecoshape) want to
achieve the following:
6. Creating a clear business case for making clay out of silt that can be used for more projects.
7. Filling in of existing knowledge gaps. In particular, the area of clay quality and ripening methods.
8. Gaining insight in the range of applications, the consuming market and ecosystem services that
clay ripening can deliver.
9. Showing a solution for the turbidity problem of the Eems estuary.
10. Clay production (Sweco, 2016):
a. One of the goals is to transform the 330,000 m3 of silt into at least 70,000 m3 of suitable dike
clay. Per section in Delfzijl, which has 14 silt squares, 12,329 m3 will have to be drained.
b. If the clay is suitable for dike construction it is transported to the ‘Brede Groene Dijk’, if it is
not it may either be used to raise the local farmlands or as clay for the coarse ceramic
industry.
2. Site description
2.1. Lay-out and location Both testing grounds are located near Delfzijl in the province of Groningen. The locations can be seen
in Figure 27.

43
Figure 27: Location of testing grounds. Obtained from: (Google, n.d.) & (Sweco, 2016, p. 14).
2.1.1. Delfzijl 1. Lay-out testing ground Delfzijl:
a. Testing ground Delfzijl will be split into 14 sections according to Figure 28 (Ecoshape,
2016).
b. As can be seen in the figure, the testing ground has an L-shape. This L-shape has roughly
the following dimensions:
i. Length bottom to top= 550 m.
ii. Length left to right= 450 m.
iii. Width both directions= 250 m.
2. Each test sections has the following dimensions:
a. Length = 100 m.
b. Width = 100 m.
c. Height = 1.5 m.
d. Volume ≈ 15.000 m3.

44
3. Boundary test section:
a. The sections are separated through dikes. Dimensioning is dependent on its function
(Figure 28 & Figure 29).
Figure 28: Current design of testing ground Delfzijl. Obtained from: (Ecoshape, 2016, p. 9).
Figure 29: Profile red line of current design Delfzijl. Obtained from: (Ecoshape, 2016, p. 9).
2.1.2. Breebaart 1. Lay-out testing ground Breebaart:
a. Testing ground Breebaart will be split into a minimum of 10 sections according to Figure
30 (Ecoshape, 2016).
b. The total dimensions of the testing ground will be roughly 1000 m x 100 m (Ecoshape,
2016).
2. The sediment basin is split into test sections with the following dimensions:
a. Length = 100 m.
b. Width = 100 m.
c. Height = 1.5 m.
d. Volume ≈ 15.000 m3.

45
Figure 30: Current design of testing ground Breebaart. Obtained from: (Sweco, 2016, p. 16).
2.2. Construction 1. Construction order (Ecoshape, 2016):
a. Start with digging the ditch around the testing ground. With this material the outer dikes
can be made.
b. Construction of the broad inner dikes.
c. Construction of the small inner dikes. Shaping the area will be done with a bulldozer and
a hydraulic excavator.
d. Every compartment (±100 x 100 m) is provided with a box weir.
e. Every compartment is provided with two ‘zakbakens’ each with two plates so the settling
and thickness of the silt layer can be measured.
f. Installing pipelines with valves in such a way that at any moment during the filling they
can switch compartments.
g. Installing a pump that pumps surplus water back into the harbour.
h. Filling the compartments, using the box weirs to drain the water into the ditch. During
the filling of the compartments a ‘stortbaas’, overseer of the filling, helped by a hydraulic
excavator will oversee the terrain and intervene when necessary (valves and box weirs).
2. The construction time of the entire facility is estimated at eight weeks.
3. The filling of all test sections with silt is estimated to take six to eight weeks.
2.3. Accessibility 1. Accessibility:
a. A section must be accessible by driving equipment from at least one side.
b. A section must be accessible with a pipeline for the supply of dredged silt.
c. The entire section must be accessible for sampling and influencing of the ripening
process. Development of bearing capacity of the disposed silt is unknown.
d. Ripened clay will be excavated using an excavator on wheels or tracks. Disposal can be
done with trucks.
e. Settlement plates must be reachable.

46
2.4. Facilities and utilities
2.4.1. Fresh water 1. Salt water will be used for pumping the dredged silt and sand mixture into the test sections.
2. Fresh water has to be put in the ditch in order to prevent the salt water to get into the
groundwater and damage the environment.
a. The transport of the fresh water has not yet been determined. But could for instance be
done using trucks or underground flows.
2.4.2. Sewage The sewage water of the test section will be drained towards a ringditch. This ditch will have a pump
for depositing the sewage back into the harbour.
2.4.3. Electricity Electricity will be needed for the pump at the testing facility. The pump will be placed at the North-
side of the facility. Therefore cables will have to be laid towards this northern side.
2.4.4. Communications 1. Communication on site will be done using walkie-talkies.
2. Communication between locations can be done by phone, mail or via the group meetings.
2.5. Topographic survey data A topographic map of the area can be seen in Figure 31: Topographic map of area around facility.
Obtained from: .Figure 31. This was collected from (Arcgis, 2011). The facility is located in a business
park.
Figure 31: Topographic map of area around facility. Obtained from: (Arcgis, 2011).

47
2.6. Meteorology
2.6.1. Wind conditions 1. Annual conditions:
In Figure 32 annual wind velocities are shown for the Netherlands. The area at Delfzijl has around
5.5-6.0 m/s (KNMI, 2010b).
Figure 32: Annual mean wind speed 1981-2010. Obtained from: (KNMI, 2010b).
2. Storm conditions:
A storm is a nine on the Beaufort scale. This scale has wind velocities between 20.8-24.4 m/s
(KNMI, n.d.).
2.6.2. Evaporation & precipitation 1. Evapotranspiration:
a. Bare soil: 448 mm (Cultuurtechnische vereniging, 2011).
b. Vegetation: will not be used for the standard design but can be calculated according to
the ‘Cultuurtechnisch Vademecum Deel III H2’.
2. Precipitation:
a. At Delfzijl around 750 mm a year (Cultuurtechnische vereniging, 2011).
2.6.3. Temperature and humidity 1. Temperature:
a. Mean annual temperature:
Between 9.3-9.6 °C (KNMI, 2010a).
b. Mean annual max. temperature:
22-22.5 °C (KNMI, 2010a).
c. Mean min. temperature:
0-0.5 °C (KNMI, 2010a).
2. Relative humidity: Around 80-90 % around Delfzijl annually (KNMI, 2010a).

48
2.7. Geotechnical and geophysical data
2.7.1. Geotechnical survey data for ringdikes and inner dikes design 1. Soil quality:
To be determined based on geotechnical calculations availability of ground. A soil profile of the
GeoTOP model can be seen in Figure 33 (TNO, n.d.). Grey is an unknown soil caused by human
interaction. Green is clay, brown is peat and yellow-dark yellow is light-heavy sand.
Figure 33: Most likely soils at the Delfzijl testing ground based on the GeoTOP model. Obtained from: (TNO, n.d.).
2. Mass-haul diagram:
a. Also to be determined based on geotechnical research (Ecoshape, 2016).
b. It is planned to use the soil gained from digging the ditch to make the outer dikes
(Ecoshape, 2016).
3. Broad inner dike has sufficient supporting capacity for driving equipment and can withstand
pressure of the silt layer and its water.
a. Soil types
i. Clay.
ii. Sand.
b. Dimensions broad inner dike
i. Crest width of small dike: 0.5 m.
ii. Crest width of Broad dike: 13 m.
iii. Slope of 1:1.5 for all dikes.

49
iv. Height for dikes: 2 m.
c. Data soil:
i. Clay:
1. Saturated unit weight = 14 KN/m3 (Deltares, 2014).
2. Cohesion = 10 KPa (Geotechdata, 2014).
3. Friction angle = 18° (Geotechdata, 2013a).
ii. Sand:
1. Dry unit weight = 20.5 KN/m3 (Geotechdata, 2013b).
2. Friction angle = 33° (Geotechdata, 2013a).
d. Calculating stability:
i. Calculate maximum shear stress caused by driving material. If the stress is less
than the strength, the dike is stable. Shear stress can be calculated using:
The shear strength can be determined using the required safety factor:
1. Safety factor CC1: 1.35 (SAB-profiel, 2017).
2. Required drained shear strength:
3. Undrained shear strength:
ii. What is the weight of the vehicles:
1. Excavator between 13.2-15.7 tons (CAT, 2012).
2. Bulldozer maximally around 50 tons (CAT, 2017a).
3. Truck around 70 tons when full (CAT, 2017b).
iii. Combine the shear stress with the water pressure. Determine safety factor by
calculating manually and by using D-Geo Stability (Deltares, n.d.).
4. Ringdike can withstand pressure of the silt layer and its water.
a. Dike material: yet to be determined, likely clay.
b. Water at a height of maximum 1.5 m with a density of 1175 kg/m3 is pressing against the
dike.
c. Determine safety factor using Geostudio.
2.7.2. Earthquake conditions Only minor earthquakes of scale 1-2 have been measured at the location of the Delfzijl testing facility
(Figure 34). Earthquakes of this scale are barely noticeable and do not cause damage (VU, n.d.). It is
therefore assumed that earthquakes will not impact the stability of the dikes nor cause damage to
the testing facility.

50
Figure 34: Map of measured earthquakes around the testing facility. Blue is scale 1-2, red is scale 2-3. Obtained from: (Gasbevingen portaal GBB, 2017).
2.7.3. Hydrology and seepage 1. Drainage capacity:
a. Drainage water shell: After 1-2 weeks (Timmer, 2017) silt will have sedimented. Above
the silt layer there will still be a water shell. This will be the size of per section (l x b x h)
100 m * 100 m * 0.3 m = 3,000 m3
b. Disposal/drainage drainagewater for: 14 sections.
c. Difference in water content between silt and ripened clay:
i. Water content of silt is 90%.
ii. Max. Water content for dike coating is 31%.
iii. Max. water content for dike core is 34%.
d. Total amount of water that needs to be drained:
i. To be drained water is 12,329 m3 per section.
ii. 172,606 m3 in total.
2. Hydraulic conductivity, K-value:
a. Hydraulic conductivity is a measure of a material’s capacity to transmit water. It is
defined as a constant of proportionality relating the specific discharge of a porous
medium under a unit hydraulic gradient in Darcy’s law” (Duffield, n.d.). The formula of
Darcy’s law as obtained from Cultuurtechnische vereniging (2011, p. 430) is:

51
Where q is specific discharge (m/s), ksat is the saturated hydraulic conductivity (m/s), ΔHh
is the difference in hydraulic head (m) and s is the distance or length the water has to
travel (m). The specific discharge can be multiplied by the cross-sectional area D (m2) to
obtain the total discharge Q (m3/s):
The hydraulic conductivity is used in the drainage calculations to determine the speed at
which water will drain naturally from the silt soil. The following table (Figure 35) shows
the representative values of hydraulic conductivity for various unconsolidated
sedimentary materials (Domenica & Schwartz, 1990).
Figure 35: Range of K-values by soil texture. Obtained from: (Smedema & Rycroft, 1983, p. 376).
i. Sand layer: 5 m/d (Figure 35 & Brakenhoff (2017)).
ii. Dredged silt at the start of the ripening, based on sand layer: 5 m/d (Brakenhoff,
2017).
iii. Clay layer: 0.001 m/d (Figure 35 & Brakenhoff (2017)).
b. For a vertical flow the law of Darcy can be rewritten as (Cultuurtechnische vereniging,
2011, p. 432):
In this qz,n is the vertical specific discharge for layer n (m/s), Hn is the hydraulic head of
layer n and cn is the vertical resistance of layer n. cn can be calculated by:
In which d is the thickness of the layer in m.

52
c. For the horizontal flow, the formula to calculate the hydraulic head (Figure 36) is used:
Figure 36: Horizontal discharge of the test section. Obtained from: (Brakenhoff, 2017).
In which:
N: Precipitation or in our case the inflow from the silt layer (m/d).
k: Hydraulic conductivity (m/s).
D: Surface of soil layer. In this 2D view it is the depth of the soil layer (m).
L: Width of the parabola. In our case it is the width of one test section (m).
x: Distance from middle (m).
ϕ: Hydraulic head (m).
3. Mean hydraulic conductivity for multiple layers (Cultuurtechnische vereniging, 2011, p. 512):
Horizontal flow:
Vertical flow:
Where k is the hydraulic conductivity (m/s) and D is the thickness of the layer (m).
4. The general principle behind Ernst’s equation is that the flow of groundwater to parallel drains,
and consequently the corresponding available total hydraulic head (h), can be divided into three
components: a vertical (v), a horizontal (h), and a radial (r) component (International Institute for
Land Reclamation and Improvement, 1976):
h= total hydraulic head or bulging (m).
= hydraulic head necessary for respectively vertical, horizontal and radial flow (m).
q= drain discharge rate (m/d)
= thickness of the layer over which vertical and radial flow are considered (m).
= The sum of the product of the permeability (K) and thickness (D) of the various layers

53
for the horizontal flow component according to the hydraulic situation (m2/d):
one pervious layer below drain depth: KD = K1 D1 + K2 D2.
= Hydraulic conductivity for vertical and radial flow (m/d).
= wetted section of the drain (m); for pipe drains .
= geometry factor for radial flow depending on the hydraulic situation (-). In this case:
KD = K1 D1 + K2 D2, = 1 and (Cultuurtechnische vereniging, 2011, p. 519)
L= drain spacing (m).
5. Design drainage tubes
a. Maximum drain surface tube:
A= maximum drain surface (m2).
q= designed drainage (m/d).
de=effective diameter (1.04d - 0.008) (m).
d= internal diameter (m).
hl= hydraulic head loss over the drainage length l (m).
L= drain spacing (m).
l= drainage length (m).
6. Water seepage
Where Q1 is seepage (m3/d), c1 is the vertical resistance of the poorly permeable soil between
the two permeable soils (d), is the hydraulic head of the bordering permeable soil (m) and A
is the area (m2).
2.8. Environmental conditions
2.8.1. Deposit characteristics 1. Dredged silt:
a. Density: 1175 kg/m3 (Timmer, 2017).
b. Soil content: 10 %.
2. Clay:
a. Specific density clay: 2650 kg/m3.
b. Density after ripening: 2138 kg/m3 (Timmer, 2017).
3. Water:
a. Density water: 1000 kg/m3.
b. Density brackish water: 1015 kg/m3.
4. Mixing sand:
a. Density: 1950 kg/m3.
b. To be added: equal to 20% of silt -> 2% (Timmer, 2017).
5. Density in test section:

54
a. Before using sand trap: 1191 kg/m3.
b. After using sand trap: 1265 kg/m3.
2.8.2. Water quality
2.8.2.1. Groundwater 1. Groundwater meets the European standards. See 7. codes and standards for more information.
2. Border between brackish and fresh water at Delfzijl is <10 m under NAP (Figure 37). This means
that the fresh groundwater reaches till <10 meters before it is considered brackish. Water is
considered brackish if the amount of chloride is larger than 150 mg/l-1 (TNO, 1998). Border
between brackish and saltwater at Delfzijl is around 90m under NAP (Figure 37). Water is
considered saline if the amount of chloride is larger than 1500 mg/l-1.
3. Phosphate between 0.2-1.6 g/m3 (TNO, 1998).
4. Nitrate between 0-2.8 g/m3 (TNO, 1998).
Figure 37: Border groundwater between fresh-brackish and brackish-saline groundwater. Adapted from: (Waterkwaliteitsportaal , 2015, p. 4).
2.8.2.2. Process water 1. Brackish water from the harbour of Delfzijl will be used, this has:
a. A density of around 1015 kg/m3.
b. A mercury concentration of 0.025 μg/l (RWE Eemshaven, 2014).
c. In Figure 38 can be seen that the water from the Eems does not meet the chemical
requirements. Five substances exceed the boundaries (Rijksoverheid, 2015).

55
Figure 38: Rating chemical quality water in the Netherlands. Eems-Dollard does not meet the requirements. Adapted from: (Rijksoverheid, 2015).
2.8.3. Foreseen potential environmental impacts 1. Brackish/polluted water is able to flow to the fresh groundwater:
a. The groundwater, which currently meets European standards, gets polluted. This can
have negative effects on the ecology. The groundwater at Delfzijl is not used as
drinking water.
2. Polluted silt could get dredged and pollute the testing ground or get back into the harbour.
2.9. Discharge
2.9.1. Volume process water 1. Discharge of process water:
a. Around 12,329 m3 per section.
b. 14 sections at facility.
c. 172,606 m3 in total.
2.9.2. Locations 1. Water will flow from the test sections to a ditch surrounding the facility.
2. Water of the ditch will be discharged through a pipe from the north-side of the testing ground to
the harbour of Delfzijl to the north.
3. Functional requirements
3.1. Ring dike 1. Function:
a. Storage silt in test sections.
b. Separation of test sections.

56
c. Path for inspection on foot.
2. Dimensions:
a. Total length is 2900 m.
b. Slope of 1 on 1.5.
c. Crest height is 2 m.
d. Crest width is 0.5 m.
e. Base width is 6.5 m.
3.2. Broad inner dike 1. Function:
a. Storage silt in test sections.
b. Separation of test sections.
c. Path for construction vehicles to reach each test section.
d. Path for the pipeline with the dredged silt to reach each test section.
2. Dimensions broad inner dike:
a. Total length is 900 m.
b. 9 strokes in total.
c. Slope of 1 on 1.5.
d. Crest height is 2 m.
e. Crest width is 13 m.
f. Bottom is 19 m broad.
3.3. Additional objects 1. Additional objects:
a. Work strip:
i. Stroke of land for the accessibility of the testing ground from the outside.
b. Ringditch:
i. Collection and transportation of drainage water from the test sections.
ii. Natural border of the testing ground.
c. Pump:
i. For pumping of drained water back into the harbour.
ii. Setup site necessary.
1. The pump will be placed next to the ringditch at the north-side of the
facility.
iii. Dimensions:
1. Unknown. Type has yet to be determined and pump calculations are
outside of the scope of this research.
iv. Power unit:
1. Type has yet to be determined.
3.4. Considerations on removal of ring dikes and inner dikes Since the soil used for the construction of the facility is gathered in the building area, the same soil
can be used to fill up the trenches. Soil from the inner dike will be spread around the terrain equally.
Possible drains, settlement plates and box weirs will be removed to deliver the terrain in its original
state (Ecoshape, 2016).
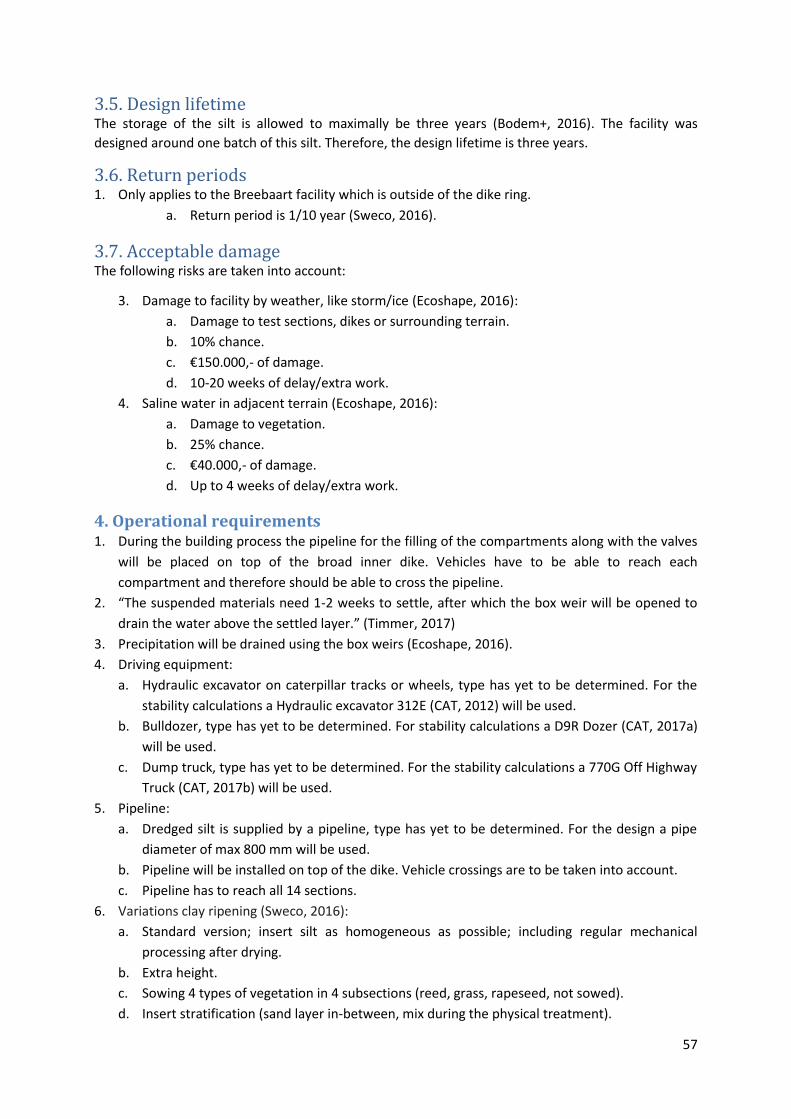
57
3.5. Design lifetime The storage of the silt is allowed to maximally be three years (Bodem+, 2016). The facility was
designed around one batch of this silt. Therefore, the design lifetime is three years.
3.6. Return periods 1. Only applies to the Breebaart facility which is outside of the dike ring.
a. Return period is 1/10 year (Sweco, 2016).
3.7. Acceptable damage The following risks are taken into account:
3. Damage to facility by weather, like storm/ice (Ecoshape, 2016):
a. Damage to test sections, dikes or surrounding terrain.
b. 10% chance.
c. €150.000,- of damage.
d. 10-20 weeks of delay/extra work.
4. Saline water in adjacent terrain (Ecoshape, 2016):
a. Damage to vegetation.
b. 25% chance.
c. €40.000,- of damage.
d. Up to 4 weeks of delay/extra work.
4. Operational requirements 1. During the building process the pipeline for the filling of the compartments along with the valves
will be placed on top of the broad inner dike. Vehicles have to be able to reach each
compartment and therefore should be able to cross the pipeline.
2. “The suspended materials need 1-2 weeks to settle, after which the box weir will be opened to
drain the water above the settled layer.” (Timmer, 2017)
3. Precipitation will be drained using the box weirs (Ecoshape, 2016).
4. Driving equipment:
a. Hydraulic excavator on caterpillar tracks or wheels, type has yet to be determined. For the
stability calculations a Hydraulic excavator 312E (CAT, 2012) will be used.
b. Bulldozer, type has yet to be determined. For stability calculations a D9R Dozer (CAT, 2017a)
will be used.
c. Dump truck, type has yet to be determined. For the stability calculations a 770G Off Highway
Truck (CAT, 2017b) will be used.
5. Pipeline:
a. Dredged silt is supplied by a pipeline, type has yet to be determined. For the design a pipe
diameter of max 800 mm will be used.
b. Pipeline will be installed on top of the dike. Vehicle crossings are to be taken into account.
c. Pipeline has to reach all 14 sections.
6. Variations clay ripening (Sweco, 2016):
a. Standard version; insert silt as homogeneous as possible; including regular mechanical
processing after drying.
b. Extra height.
c. Sowing 4 types of vegetation in 4 subsections (reed, grass, rapeseed, not sowed).
d. Insert stratification (sand layer in-between, mix during the physical treatment).

58
e. Rinse with surface water, focus is that this should be local brackish water).
f. Saline cultivation in 3 subsections (sea aster, glasswort, and not saline cultivation (yet to be
determined)).
g. Higher clay content (different dredging method/location).
h. Intensive mechanical processing (homogeneous, e.g. ploughing).
i. Intensive mechanical processing (heterogeneous, e.g. amphirol) using drainage channels.
j. Adding local materials/churning organisms in 4 subsections (gravel, digging animals).
5. Client requirements
5.1. Clay quality 2. Clay quality requirements:
a. When using the clay for the dike (Technische Adviescomissie voor de Waterkeringen, 1996):
i. The ripened clay must be either erosion class 1 or 2.
ii. Ripened clay needs to have a consistency-index (measure of processability)
of at least 0.6.
iii. Must originate from a naturally deposited material.
iv. Sand content (> 63 μm) not more than 40%.
v. Less than 5% organic matter according to the hydrogen peroxide treatment
method.
vi. Less than 25% weight loss during the HCL-treatment (lime content).
vii. Salinity (NaCL g/l soil moisture) is less than 4%.
viii. No significant admixture of debris, gravel and such.
ix. Limited bright (red, brown and yellow, sometimes blue) discolouration.
b. When using clay ‘on the land’ multiple factors play a role (Sweco, 2016):
i. Suitability for grass (to what extent can grass easily grow on the clay?).
ii. Environmental quality (amount of pollution; but also: the perception of the
out of silt made clay as polluted).
iii. Strength and stiffness (=deformation behaviour).
iv. The clay needs to be sufficiently desalinated and have maximally 3% of
organic matter.
c. When using clay for the coarse ceramic industry, it has to meet the following
requirements (Sweco, 2016):
i. Maximum of 0.7% organic matter.
ii. 15-40% lutum.
iii. Maximum of 22% water.
iv. 25-35% sand.
6. Rules and regulations
Besluit bodemkwaliteit ‘Besluit bodemkwaliteit’ is a law regarding soil quality and the usage of dredged materials (Bodem+,
2016). The quality of the ground and dredge spoil must be demonstrated with an environmental
statement. The following statements are accepted for soil and dredge spoil:
1. ‘Partijkeuring’
2. ‘Erkende kwaliteitsverklaring’

59
3. ‘Fabrikant-eigenverklaring’
4. Waterbottom study
5. ‘(water)bottom quality map’
In a ‘partijkeuring’, samples will be taken from every group of materials. The sampling has to be
done by a recognized person or institution conform Kwalibo. With the samples the quality of the
material can be tested.
An ‘erkende kwaliteitsverklaring’ is an environmental statement based on a certified building
material. The first part is a product certificate given by a recognized certification institution. This
product certificate concerns the characteristics of the material about composition and leaching, and
indicates that (and how) the material is applicable. The second part is the acknowledgement of the
ministers.
The ‘fabrikant-eigenverklaring’ creates an opportunity for the company to do the testing themselves.
This can only be done for building materials that do not require to be sealed. The manufacturer
needs to perform an admission test for the material before he is able to declare the ‘fabrikant-
eigenverklaring’.
The Waterbed/soil studies that meet research strategies of the NEN-5740 can also be used as the
environmental statement. A difference is made between quality of soil on a location and the quality
of to be used soil. Generally, the research strategy should be for testing whether the soil is clean.
In some cases a (water)bottom quality map can be used instead. These maps predict the quality of
the soil and are therefore less accurate, but cheaper, than a ‘partijkeuring’. It is up to the local
bottom- and waterquality administrators to decide whether a bottom quality map suffices. This can
be case specific.
The company must be acknowledged for carrying out bottom operations in the context of Kwalibo.
The usage of soil and dredge spoil needs to reported to the minister of infrastructure and milieu at
least 5 days prior to the operation. The storage along with the expected duration and destination
need to be reported to the minister of infrastructure and milieu at least 5 days prior. The storage can
be 3 years maximum.
The stored dredge spoil must be applied in a useful application. In this project the dredge spoil will be
used for the following useful applications:
1. Used for elevating industrial parks, housing and agricultural and nature areas, with the goal
of improving the soil condition.
2. Used for elevation in hydraulic structures and for shoaling and filling up surface water in view
of flood protection, the goals of the ‘Kaderrichtlijn water’, improving the natural value and
smooth and safe handling of shipping.
Lastly, according to ‘besluit bodemkwaliteit’ the project is seen as a large scale application. This
means that the quality of the receiving soil does not need to be tested. Instead, emission values are
used to prevent impermissible leaching to the bottom and groundwater.
Excavation permit Requirements for the excavation permit are (Provincie Groningen, n.d.):
1. The excavation is in accordance with the provincial policy.

60
2. The excavation is in accordance with the development plan. Development plan of
Oosterhoorn, the location of the testing ground, is currently being remade.
3. The owner of the ground has given permission for the excavation. The landowner of the area
at Delfzijl is Groningen Seaports (GSP). They are one of the groups directly involved in this
project, meaning that there is indeed permission.
The excavation permit needs to be requested at the province of Groningen and requires the
following information:
Type of activities planned and location.
Amount and depth of excavation.
Type of material that will be excavated.
Date on which will be started with the excavation and the expected duration.
Address and permission of the landowner.
Wet Informatieve-uitwisseling Ondergrondse Netten This law, also called WION, states that it is required to do a stocktaking to the location of possible
present cables and pipes when performing mechanical excavation. This is done by delivering a WION-
notification at the ‘Kadaster’. The Kadaster is the governmental organisation that collects the data
and supplies the reporter with the required data (Kadaster, n.d.).
Crossing dike Permit for crossing the current dike with a delivery pipe at Delfzijl. GSP will request the permit at water board Hunze & Aa’s (Ecoshape, 2016).
V&G-plan The V&G-plan is a safety and health plan (Ministerie van Sociale Zaken en Werkgelegenheid, n.d.).
When multiple employers are active on the building site at the same time, a V&G-plan often has to
be set up. In this an employer describes how the contractor and subcontractors will work together
and what safety measures are set up to ensure the safety of their employees. A V&G-plan improves
the coordination between performers on the building site and must guarantee the attention to
safety and working conditions during the building process. A V&G-plan must be available if:
Construction takes longer than 30 working days and at some point there are more than 20
employees working at the same time.
The regulations of the V&G-plan are:
The client needs to set up a V&G-plan before the preparatory phase.
In the execution phase, the V&G-plan is carried out by one of the performing parties, i.e. the
contractor.
This performing party appoints a coordinator who oversees the compliance with the V&G-
plan on the construction site.
No specific clauses for subcontractors are included in the ‘arbowetgeving’. Here the general
conditions over the building process are applicable.
A contractor is allowed to take a short safety test before the subcontractor can work on the
job.
Every employer on the construction site is responsible for complying to his legal
requirements regarding safety and health of his own employees.

61
Water balance permit During the project, permits for changing the water balance will also be required. The following water
aspects require a permit (Rijkswaterstaat, n.d. b):
1. To prevent infiltration in the groundwater, a ditch will be made around the terrain
(Ecoshape, 2016).
2. The dredged silt is won in saltwater areas. The drainagewater in the drainage ditch is salt
and, according to the permit, has to be deposited in a saltwater area.
3. Testing ground Delfzijl: release of drainagewater in the harbor of Delfzijl.
4. Testing ground Breebaart: direct release of drainagewater in the Dollard.
In these cases everyone can present their opinions on the design permit. The procedure takes circa 6
months (Rijkswaterstaat, n.d. a).
Building permit and Wet Natuurbescherming For the building of the testing ground an ‘omgevingsvergunning’, building permit, will be needed.
This is a permit which gives approval of the construction by the principality. In order to get approval,
the construction needs to correspond with the development plan of the area. Furthermore, when
applying for the building permit, the Wet Natuurbescherming is tested (Ministerie van Binnenlandse
Zaken en Koninkrijksrelaties, 2017). This new law combines the protection of nature areas, animal
and plant species and forests. Using this law Natura 2000-areas are also appointed. These areas are
considered to have important flora and fauna and enjoy extra protection. Both testing grounds are
not in a Natura 2000-area. However, it is still important that species are not unnecessarily being
disturbed and damaged and that the population and the existence of the concerning specie are
preserved. For this law, research will have to be done to the flora and fauna in the area in question:
Flora and fauna research
1. The breeding season of birds is from March 15th until July 15th. During breeding
season it is not allowed to intentionally disturb bird nests. Area needs to be
examined for possible breeding locations.
2. Flora and fauna quick scan (Regelink, n.d.). This is performed in the following steps:
Literature study: Which animals and plants live in the area.
Field visit by a ecologist: What could live in the project area specifically.
Interference: What, when and where will it be performed.
Assessing effects.
Testing using the Wet Natuurbescherming.
Conclusion and recommendations.
With this research and the Wet Natuurbescherming, changes to the project plan could be made
when necessary.
7. Codes and standards 1. The groundwater suffices to the European environmental water quality requirements (Onze
Minister van Volkshuisvesting, Ruimtelijke Ordening en Milieubeheer, 2009b). In the Netherlands
boundaries for specific groundwater areas were made based on the European requirements
(Onze Minister van Volkshuisvesting, Ruimtelijke Ordening en Milieubeheer, 2009a). The testing
ground lies in groundwater area NLGW0008, a brackish/salt water area. This has the following
boundaries for pollutants:

62
a. Nickel: 20 μg/l.
b. Arsenic: 18.7 μg/l.
c. Cadmium: 0.35 μg/l.
d. Lead: 7.4 μg/l.
e. Phosphor total: 6.9 μg/l.
2. For the intake of the dredged silt, it has to meet the following acceptance criteria:
Table 9: Summary acceptance criteria for intake of dredged material. Adapted from: (Ministeries van Volkshuisvesting, Ruimtelijke Ordening en Milieubeheer, Verkeer & Waterstaat, Bodem+, IPO, VNG, UvW & SKB, 2017).
Parameter safe intake Risk intake
Heavy metals Maximum values ≤ class industry / B a maximum of 10% above intervention value
Mineral
oil
<500/1250 mg / kg dry matter (d.m.)
(Maximum value class Industries / A)
<700 mg / kg d.m. ripened at 1 year
<1000 mg / kg dry matter with maturing for 3
years
PAHs
(total)
≤ 40 mg / kg d.m. (intervention value) up to a maximum of 50 mg / kg dry matter
PCBs ≤ 0.5 mg / kg d.m. up to 0,6 mg / kg dry matter
DDT ≤ 1 / 0.3 mg / kg dry matter
(Maximum value class Industries / A)
up to max. 10% overrun of composition
standards Bsb
Cyanide ≤ 5.5 mg / kg d.m. (Background value) ≤ 20 mg / kg dry matter
Sulphate sulphate content + 3 times sulphide
<1100 mg / kg d.m.
sulphate content + 3 times sulphide
<3300 mg / kg d.m.
salt / brackish no salt / brackish water species Cl ≤ 2000 mg / kg dry matter,
Br ≤ 40 mg / kg dry matter,
F ≤ 300 mg / kg dry matter
pH 6.5 to 8.5 5.5 to 9.5

63
Appendix C: Additional design pictures
Figure 39: Impression of the crossroad
Figure 40: Impression of testing ground.

64
Figure 41: Impression of slope at north-side entrance.

65
Appendix D: Calculations geotechnical stability
Stress driving material Of the vehicles that will drive over the dike, the bulldozer is the heaviest per square meter. It is
assumed that this is the heaviest stress on the slope. The dimensions of the bulldozer are based on
the Caterpillar D9R Crawler Tractor (CAT, 2017a). The shear stress caused by one bulldozer is
calculated by:
The resulting stress caused by the bulldozer ( ) is 30.3 KN/m2.
Calculation drained soil The shear strength will be calculated for a dike consisting of only well graded sand with the following
typical parameter values (Geotechdata (2013a) & (2013b)):
Using the bulldozer’s shear stress and the formulas of equation (2), we can now calculate the average
shear strength of the soil:
Using the safety factor (Equation (16), the minimal shear failure strength can be calculated. The
consequence class of CC1 was chosen (SAB-profiel, 2017).The safety factor for the variable load of
consequence class CC1 is 1.35. By multiplying the average shear strength of the soil gained from the
previous calculations with the safety factor, the minimal shear failure strength of the dike soil can be
determined:

66
The soil must have of 20.94 KN/m2.
Calculation undrained soil Since we will only perform a first calculation the standard values of clay will be used for S, m and
(Deltares, 2014):
Using a standard weight for soft clay and Equations (3) & (4), the calculation becomes:
The undrained shear strength of the clay is 2.12 KN/m2.
Calculation of the stability water pressure and bulldozer combined This last combination was also calculated manually by using formulas from (TAW, 1985). To keep it
relatively simple only seven sections in the sliding plane were made. Furthermore, the sliding plane is
different from the Geoslope model. Only the calculations for the second section are documented.
The other sections are shown in Table 10. The angles and radius of the sliding plane can be seen in
Figure 42.

67
Figure 42: Dimensions used for the manual slip surface computation using Bishop.

68
Table 10: Calculation of a 7 section slip surface using Bishop.
qsand qclay Q Asand Aclay AQsand AQclay Atotal Gsand Gclay Gtotal ϕ
KN/m^2 KN/m^2 KN/m^2 m^2 m^2 m^2 m^2 m^2 KN KN KN °
Section
1
20.5 14 30.3 0 0.0285 0 0.0162 0.0285 0 0.88986 0.88986 18
Section
2
20.5 14 30.3 0.332 0.24 0.15355 0.00605 0.572 11.45857 3.543315 15.0019 33
Section
3
20.5 14 30.3 0.74425 0.27075 0.036 0 1.015 16.34793 3.7905 20.13843 33
Section
4
20.5 14 30.3 0.524 0.24225 0 0 0.76625 10.742 3.3915 14.1335 33
Section
5
20.5 14 30.3 0.207 0.1656 0 0 0.3726 4.2435 2.3184 6.5619 33
Section
6
20.5 14 30.3 0.0243 0.0688 0 0 0.0931 0.49815 0.9632 1.46135 33
Section
7
20.5 14 30.3 0 0.0405 0 0 0.0405 0 0.567 0.567 18
Mean: 0.412564
tan ϕ σ Lslope S r α Mr ad Ma γd*γn Mad FS
- KN/m^2 m KN m ° KNm m KNm - KNm -
0.32492 2.119238 0.36 0.762926 3.66 59 2.792308 3.137232 2.791698 1.1 3.070867 2.8246
0.649408 20.94 1.16 24.2887 3.66 46 88.8965 2.632784 39.4967 1.1 43.44638
0.649408 20.94 0.93 19.4728 3.66 30 71.2705 1.83 36.85332 1.1 40.53865
0.649408 20.94 0.83 17.3790 3.66 16 63.6070 1.008833 14.25834 1.1 15.68417
0.649408 20.94 0.6 12.5631 3.66 5 45.9810 0.31899 2.093181 1.1 2.302499
0.649408 20.94 0.27 5.6534 3.66 -2 20.6914 -0.12773 -0.18666 1.1 -0.20533
0.32492 2.119238 0.27 0.572194 3.66 -7 2.094231 -0.44604 -0.25291 1.1 -0.2782

69
Sum: 295.3328 Sum: 104.559
The manual calculation shows a safety factor of 2.825. The model was changed to the same radius
and coordination’s of the slip surface which gave a safety factor of 2.72 (Figure 43). The manual
calculation did not use water pressure since the phreatic line was assumed to be below this specific
sliding plane, while in fact it did cross the plane. This phreatic line marks the border between
unsaturated soil (above) and saturated soil (below). Below the phreatic line is also where seepage
takes place. The software does use the water pressure and uses 30 sections and is therefore more
accurate.
Figure 43: Model's calculation of the same manual slip surface.

70
Appendix E: Calculations drainage system
Soil content calculation The starting soil content is unknown and needs to be determined. This is done by the formula:
Obtained from Basis of Design, Appendix B:
The starting soil content is 10 %. Using the now determined soil content, the volume of soil at
the start will be calculated. Since the soil volume at the start is the same as at the end, this
volume and consequently the volume of to be drained water can be determined. This will now be
done for one test section:
Saturated Zone
Vertical flow For calculating the linear dependency between the soil content and vertical resistance, the formulas
for vertical flow derived from chapter ‘2.3.2. Saturated Zone’ in the theoretical framework were used

71
(Equations (9). The start and end vertical resistance cn was calculated and made linearly dependant
on the soil content of the silt layer:
In which Sc is the soil content (-). This was made linearly dependant on the soil content by dividing
the difference in vertical resistance by the difference in soil content from start to end:
In other words at the start the soil content was 0.15 with a vertical resistance of 0.24 days. At the
end the soil content is 0.69 with a vertical resistance of 265.9 days. Drawing a line between them, the
angle would become 494.7 days for 100% soil content.
Horizontal flow In actuality the water needs to flow horizontally from the sand to the ditch. Therefore, it is important
to check whether the horizontal flow in the sand will not form a bottleneck. As can be seen in Figure
44 the water forms a parabola conform to the formula below. In this case, the maximum hydraulic
head is 1.2 m. In order to obtain the start value of the hydraulic conductivity, the mean hydraulic
head of this parabola at the start of the drainage will be calculated. The formula to calculate the
hydraulic head of the figure can be found in the chapter ‘2.3.2. Saturated Zone’ of the theoretical
framework (Equation (10).
Figure 44: Horizontal discharge of the test section. Obtained from: (Brakenhoff, 2017).
We know that the maximum ϕ at the start is 1.2 metres since this is the starting height of the silt
layer. The kD values are for the sand layer underneath the silt.
.
We also know that the width of one strip (Figure 20) will be roughly the size of one test section:

72
Since we want to calculate the mean horizontal flow, we need to determine the mean ϕ of this
parabola. To prove that
we will integrate the formula, calculate the surface and
divide this by the length:
In the current design the ditch is 0.75 m deep (Figure 8). For this calculation we will assume that the
water height in the ditch will be kept around half of this; 0.375 m. Therefore hx becomes:
Therefore, the starting hydraulic conductivity is 0.10 m/d.
To check whether the sand layer also forms the bottleneck at the end of the ripening process, the
calculation was repeated for the final height of 0.2671. This gave a hydraulic conductivity of 0.05
m/d. Therefore, for the end value the conductivity of the silt will be used. The model will use the
same linear dependency but for the new hydraulic conductivity at the start and the same
conductivity at the end.
Ernst’s equation Using Equation (11), the drainage will be calculated for using drainage pipes instead of the horizontal
sand layer of the previous chapters. Because the drainage pipes will be placed in the top of a sand
layer under the silt, the following formulas can be used:
KD = K1 D1 + K2 D2, = 1 and (Cultuurtechnische vereniging, 2011, p. 519)
L= drain spacing (m).
We will now calculate the drain discharge for different drain spacings if the drainage pipes are
installed at the top of the sand layer. The silt layer and sand layer are respectively 1.2 m and 0.5 m.

73
We will start with a drain spacing of 100 m. This means that the distance between two drainage
pipes is 100 metres. The drainage will be calculated for the start. Therefore, we assume that the
vertical hydraulic conductivity of the silt and sand will be 5 m/d. These are standard values but the
actual could differ slightly.
Different drain spacings and their resulting drain discharge were calculated. These can be found in
Table 11:
Table 11: Drain spacings and the resulting discharge and required diameter for the start of the ripening.
L 1.2/q q Drain/section A/drain l (hl/l)^2/3 de d A/drain
check
A total
check
m d m/d - m^2 m - m m m^2 m^2
100 224,2607 0,005351 1 10000 100 0,02658 0,044595 0,050572 10000 10000
95 202,2642 0,005933 1,052632 9500 100 0,02658 0,045374 0,051321 9500 10000
90 181,4041 0,006615 1,111111 9000 100 0,02658 0,04621 0,052125 9000 10000
85 161,6803 0,007422 1,176471 8500 100 0,02658 0,047111 0,052991 8500 10000
80 143,0929 0,008386 1,25 8000 100 0,02658 0,048087 0,05393 8000 10000
75 125,6419 0,009551 1,333333 7500 100 0,02658 0,049149 0,054951 7500 10000
70 109,3272 0,010976 1,428571 7000 100 0,02658 0,050311 0,056068 7000 10000
65 94,14892 0,012746 1,538462 6500 100 0,02658 0,05159 0,057298 6500 10000

74
60 80,10697 0,01498 1,666667 6000 100 0,02658 0,053011 0,058664 6000 10000
55 67,20139 0,017857 1,818182 5500 100 0,02658 0,054601 0,060193 5500 10000
50 55,43217 0,021648 2 5000 100 0,02658 0,056399 0,061922 5000 10000
45 44,79932 0,026786 2,222222 4500 100 0,02658 0,058459 0,063903 4500 10000
40 35,30283 0,033992 2,5 4000 100 0,02658 0,060854 0,066205 4000 10000
35 26,9427 0,044539 2,857143 3500 100 0,02658 0,063691 0,068934 3500 10000
33 24,40852 0,049163 3 3333 101 0,026404 0,064905 0,070101 3333 10000
30 19,71894 0,060855 3,333333 3000 100 0,02658 0,067135 0,072245 3000 10000
25 13,63154 0,088031 4 2500 100 0,02658 0,07145 0,076394 2500 10000
20 8,680506 0,138241 5 2000 100 0,02658 0,077096 0,081823 2000 10000
15 4,865834 0,246618 6,666667 1500 100 0,02658 0,084953 0,089378 1500 10000
10 2,187526 0,548565 10 1000 100 0,02658 0,096876 0,100843 1000 10000
5 0,645581 1,858791 20 500 100 0,02658 0,115489 0,11874 500 10000
The lower the drain spacing, the higher the required discharge and consequently diameter. This is
not useful however for designing a drainage system, since the diameter should be kept the same.
Therefore, we will calculate the drainage system with the formulas below.
Maximum drain surface tube Equation (15) from chapter ‘2.3.5. Maximum drain surface tube’ in the theoretical framework is
based on the formula for the head loss of the drainage pipe (Equation (12) and can be used to
determine the required diameter for the designed drainage or vice versa. In this case we will design
the drainage from the pipes to be 0.10 m/d at the start of the ripening process. In other words, it has
the same drainage as the horizontal water flow through the sand. Since in the drainage tubes design
the pipes replace the horizontal sand layer, by designing for this discharge the design is likely to meet
the requirements for the ripening process. The surface of each section is around 10,000 m2. Based on
Ernst’s equation (Table 11) 5 pipes for each section would seem to be the best solution. However,
the resulting diameters is 81 mm, which is too small. Instead, two pipes per section will be chosen.
Therefore the calculation becomes:

75
Using two drainage pipes and designing for a 0.10 m/d specific discharge, the required diameter of
the each pipe is 0.098 metres. Using this diameter with the hydraulic head at the end of the draining,
the discharge of the drainage pipes at the end can be calculated. This is required to be at least larger
than the discharge of the ripened clay in order not too slow down the drainage process.
In conclusion the two drainage pipes meet the requirements. Since, 98 mm as a diameter is too
specific, the drainage pipes will be designed to have a diameter of 100 mm. Instead of two pipes, the
design will use three pipes of 100 mm diameter. This in order to have better backup for failure of a
pipe.
Costs drainage designs In order to calculate the total costs of the materials. First, the dimensions have to be determined. For
both designs a width of 0.5 metres will be used for the sand layer. For the horizontal sand drainage,
the sand will not only have to fill the surface of the test sections but also the distance between the
section and the drainage ditch. This distance is 11.5 metres (Figure 20). The dimensions per section
will be: 0.5 m * 100 m * 115.5 m. For the drainage pipes the sand layer has to cover the entire test
section. The dimensions are: 0.5 m * 100 m * 100 m. In total 14 test sections will be made. With this
the amount of drainage sand can be calculated. The total length of the drainage pipes also uses the
extra distance between the ringditch and test section. For every test section three drainage pipes will
be used. With this the total length can be calculated:

76
Costs for drainage sand per m3 and a pipe of 100mm per m were respectively €22,- (P. de Jong B.V.,
n.d.) and €7.88 (van Walraven, n.d.). This means that the total material costs of the horizontal sand
drainage are:
And the drainage pipes:
Related Documents