Riparian vegetation, Colorado River, and climate: Five decades of spatiotemporal dynamics in the Grand Canyon with river regulation Joel B. Sankey 1 , Barbara E. Ralston 1 , Paul E. Grams 1 , John C. Schmidt 1,2 , and Laura E. Cagney 1 1 Southwest Biological Science Center, Grand Canyon Monitoring and Research Center, U.S. Geological Survey, Flagstaff, Arizona, USA, 2 Now at Department of Watershed Sciences, Utah State University, Logan, Utah, USA Abstract Documentation of the interacting effects of river regulation and climate on riparian vegetation has typically been limited to small segments of rivers or focused on individual plant species. We examine spatiotemporal variability in riparian vegetation for the Colorado River in Grand Canyon relative to river regulation and climate, over the five decades since completion of the upstream Glen Canyon Dam in 1963. Long-term changes along this highly modified, large segment of the river provide insights for management of similar riparian ecosystems around the world. We analyze vegetation extent based on maps and imagery from eight dates between 1965 and 2009, coupled with the instantaneous hydrograph for the entire period. Analysis confirms a net increase in vegetated area since completion of the dam. Magnitude and timing of such vegetation changes are river stage-dependent. Vegetation expansion is coincident with inundation frequency changes and is unlikely to occur for time periods when inundation frequency exceeds approximately 5%. Vegetation expansion at lower zones of the riparian area is greater during the periods with lower peak and higher base flows, while vegetation at higher zones couples with precipitation patterns and decreases during drought. Short pulses of high flow, such as the controlled floods of the Colorado River in 1996, 2004, and 2008, do not keep vegetation from expanding onto bare sand habitat. Management intended to promote resilience of riparian vegetation must contend with communities that are sensitive to the interacting effects of altered flood regimes and water availability from river and precipitation. 1. Introduction River regulation affects the diversity and function of riparian ecosystems throughout the world [Nilsson and Berggren, 2000; Nilsson et al., 2005]. Most of the downstream effects of large dams on riparian ecosystems are directly or indirectly related to changes in flow regime and sediment transport capacity caused by operational schedules for water storage or hydropower production and to decreased sediment supply caused by trapping of sediment in the upstream reservoir [Schmidt and Wilcock, 2008]. If flood control and hydroelectricity are the primary objectives of a reservoir, then the magnitude of floods is typically reduced, the level of base flows is typically increased, and daily fluctuations in discharge (hydro-peaking) can be large [Jones, 2013]. A common effect of river regulation is channel narrowing [Williams and Wolman, 1984; Grams and Schmidt, 2002], which is caused by flood control [Schmidt and Wilcock, 2008]. Narrowing is often associated with riverward expansion of riparian vegetation into the predam active channel [Auble et al., 2005; Grams et al., 2007; Stromberg et al., 2007]. Narrowing has been observed in systems where the postdam sediment mass balance is perturbed into surplus, perturbed into deficit, or is relatively unaltered [Schmidt and Wilcock, 2008]. In conditions of sediment surplus, channel narrowing is typically associated with the deposition of postdam floodplains that are inset within the predam channel [Allred and Schmidt, 1999; Grams and Schmidt, 2002], and these new deposits can be colonized by riparian vegetation. In conditions of sediment deficit and bed incision, riparian vegetation may encroach downward into the new postdam channel [Grams et al., 2007]. Manners et al. [2014] demonstrated that narrowing also occurs where the channel is invaded by nonnative species, even though the flood regime and sediment supply are little perturbed. The primary driver of channel narrowing is reduction of flood magnitude, which alters disturbance regimes that control the establishment and succession of riparian vegetation and potentially reduces the availability of water to vegetation due to decreased alluvial groundwater recharge [Webb and Leake, 2006]. If the predam SANKEY ET AL. VEGETATION, COLORADO RIVER, AND CLIMATE 1532 PUBLICATION S Journal of Geophysical Research: Biogeosciences RESEARCH ARTICLE 10.1002/2015JG002991 Key Points: • Riparian vegetation is still responding to flow regulation after five decades • Vegetation response varies with inundation frequency, base flow, and precipitation • Inundation frequency >5% may limit expansion on bare surfaces and sandbars Correspondence to: J. B. Sankey, [email protected] Citation: Sankey, J. B., B. E. Ralston, P. E. Grams, J. C. Schmidt, and L. E. Cagney (2015), Riparian vegetation, Colorado River, and climate: Five decades of spatiotemporal dynamics in the Grand Canyon with river regulation, J. Geophys. Res. Biogeosci., 120, 1532–1547, doi:10.1002/2015JG002991. Received 12 MAR 2015 Accepted 2 JUL 2015 Accepted article online 14 JUL 2015 Published online 13 AUG 2015 ©2015. American Geophysical Union. All Rights Reserved.

Welcome message from author
This document is posted to help you gain knowledge. Please leave a comment to let me know what you think about it! Share it to your friends and learn new things together.
Transcript
Riparian vegetation, Colorado River, and climate:Five decades of spatiotemporal dynamicsin the Grand Canyon with river regulationJoel B. Sankey1, Barbara E. Ralston1, Paul E. Grams1, John C. Schmidt1,2, and Laura E. Cagney1
1Southwest Biological Science Center, Grand Canyon Monitoring and Research Center, U.S. Geological Survey, Flagstaff,Arizona, USA, 2Now at Department of Watershed Sciences, Utah State University, Logan, Utah, USA
Abstract Documentation of the interacting effects of river regulation and climate on riparian vegetationhas typically been limited to small segments of rivers or focused on individual plant species. We examinespatiotemporal variability in riparian vegetation for the Colorado River in Grand Canyon relative to riverregulation and climate, over the five decades since completion of the upstream Glen Canyon Dam in 1963.Long-term changes along this highly modified, large segment of the river provide insights for managementof similar riparian ecosystems around the world. We analyze vegetation extent based on maps and imageryfrom eight dates between 1965 and 2009, coupled with the instantaneous hydrograph for the entire period.Analysis confirms a net increase in vegetated area since completion of the dam. Magnitude and timing ofsuch vegetation changes are river stage-dependent. Vegetation expansion is coincident with inundationfrequency changes and is unlikely to occur for time periods when inundation frequency exceeds approximately5%. Vegetation expansion at lower zones of the riparian area is greater during the periods with lower peakand higher base flows, while vegetation at higher zones couples with precipitation patterns and decreasesduring drought. Short pulses of high flow, such as the controlled floods of the Colorado River in 1996, 2004, and2008, do not keep vegetation from expanding onto bare sand habitat. Management intended to promoteresilience of riparian vegetation must contend with communities that are sensitive to the interacting effects ofaltered flood regimes and water availability from river and precipitation.
1. Introduction
River regulation affects the diversity and function of riparian ecosystems throughout the world [Nilsson andBerggren, 2000; Nilsson et al., 2005]. Most of the downstream effects of large dams on riparian ecosystems aredirectly or indirectly related to changes in flow regime and sediment transport capacity caused byoperational schedules for water storage or hydropower production and to decreased sediment supplycaused by trapping of sediment in the upstream reservoir [Schmidt and Wilcock, 2008]. If flood control andhydroelectricity are the primary objectives of a reservoir, then the magnitude of floods is typically reduced,the level of base flows is typically increased, and daily fluctuations in discharge (hydro-peaking) can be large[Jones, 2013].
A common effect of river regulation is channel narrowing [Williams and Wolman, 1984; Grams and Schmidt,2002], which is caused by flood control [Schmidt and Wilcock, 2008]. Narrowing is often associated withriverward expansion of riparian vegetation into the predam active channel [Auble et al., 2005; Grams et al.,2007; Stromberg et al., 2007]. Narrowing has been observed in systems where the postdam sediment massbalance is perturbed into surplus, perturbed into deficit, or is relatively unaltered [Schmidt and Wilcock,2008]. In conditions of sediment surplus, channel narrowing is typically associated with the deposition ofpostdam floodplains that are inset within the predam channel [Allred and Schmidt, 1999; Grams andSchmidt, 2002], and these new deposits can be colonized by riparian vegetation. In conditions of sedimentdeficit and bed incision, riparian vegetation may encroach downward into the new postdam channel[Grams et al., 2007]. Manners et al. [2014] demonstrated that narrowing also occurs where the channel isinvaded by nonnative species, even though the flood regime and sediment supply are little perturbed.
The primary driver of channel narrowing is reduction of flood magnitude, which alters disturbance regimesthat control the establishment and succession of riparian vegetation and potentially reduces the availabilityof water to vegetation due to decreased alluvial groundwater recharge [Webb and Leake, 2006]. If the predam
SANKEY ET AL. VEGETATION, COLORADO RIVER, AND CLIMATE 1532
PUBLICATIONSJournal of Geophysical Research: Biogeosciences
RESEARCH ARTICLE10.1002/2015JG002991
Key Points:• Riparian vegetation is still respondingto flow regulation after five decades
• Vegetation response varies withinundation frequency, base flow,and precipitation
• Inundation frequency >5% maylimit expansion on bare surfacesand sandbars
Correspondence to:J. B. Sankey,[email protected]
Citation:Sankey, J. B., B. E. Ralston, P. E. Grams,J. C. Schmidt, and L. E. Cagney (2015),Riparian vegetation, Colorado River, andclimate: Five decades of spatiotemporaldynamics in the Grand Canyon with riverregulation, J. Geophys. Res. Biogeosci., 120,1532–1547, doi:10.1002/2015JG002991.
Received 12 MAR 2015Accepted 2 JUL 2015Accepted article online 14 JUL 2015Published online 13 AUG 2015
©2015. American Geophysical Union.All Rights Reserved.
floodplain is no longer inundated, drought tolerant species typically replace riparian species. However,changes in base flow also affect the availability of groundwater to riparian vegetation, and hydro-peakingcan create a daily disturbance regime.
Reduction in runoff volume caused by climate change may exacerbate the effects of flood control for riparianvegetation, because water managers may need to further alter flow regimes in order to meet water supplyneeds [Perry et al., 2012, 2013]. Anticipated effects of these climate and management factors includecontraction of riparian zones and reduction in the likelihood of plant recruitment in upslope areas fartherfrom the channel [Perry et al., 2012, 2013]. Detailed assessments of the response of vegetation to changesin dam operations during long time periods are therefore essential to understand and predict thelong-term effects of altered flow regimes on riparian ecosystems [Johnson, 1994; Christensen et al., 2004;Grantz et al., 2007; Dixon et al., 2012].
Riparian vegetation typically responds to streamflow along a continuum from low-elevation zones that areinundated frequently to zones higher in elevation that are inundated less frequently (we use “elevation” todescribe the position of a riparian zone relative to the base flow water surface). In all zones, floods createdisturbance and inundate surfaces, but floods can also increase water availability to vegetation even inthe absence of direct inundation by temporarily increasing the level of the alluvial groundwater table[Stromberg et al., 2007]. In low-elevation zones, base flows control water availability and the area of habitablespace for vegetation, while in high-elevation zones, base flows can control the availability of groundwater tophreatophytic vegetation [Stromberg et al., 2007].
In this study, we use high-resolution imagery to assess riparian vegetation response over nearly five decadesfor a 362 km segment of the Colorado River downstream from Glen Canyon Dam. Our first objective is todescribe the long-term (1965–2009) temporal stability and changes in total vegetation along a continuumof low- to high-elevation zones. Due to flood control and sediment deficit conditions in this segment ofthe river, we predict that observed changes will indicate a long-term lowering of the riparian area in whichriparian vegetation expands downward to fill in lower zones. Our second objective is to evaluate whether,and how, total vegetation varies as a function of streamflow variables of floods (magnitude of peak flows),base flow (magnitude of low flows), and flow duration (duration of inundation or elevated base flow), as wellas precipitation (drought), from 1965 to 2009 along the continuum of zones.
2. Study Area
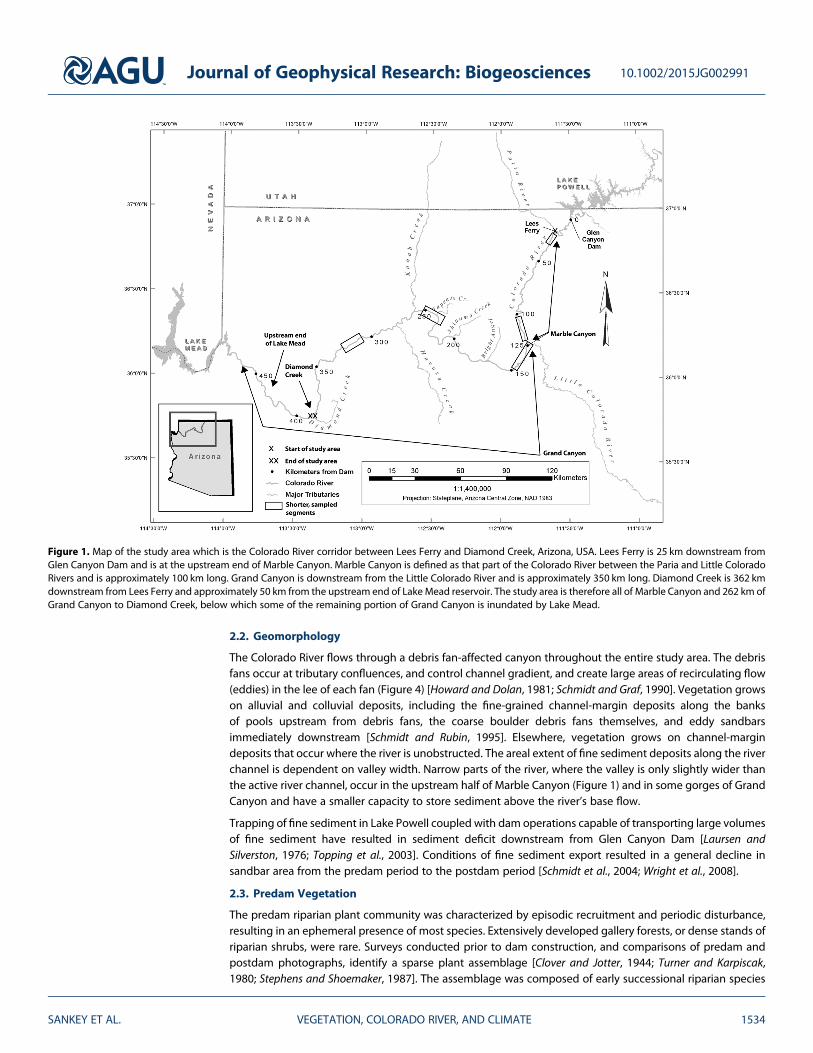
Our study area is the Colorado River between Lees Ferry, AZ, and Diamond Creek, AZ, 362 km downstream(Figure 1). The study area includes all of Marble Canyon and 262 km of Grand Canyon (Figure 1). The studyarea is one of the most studied segments of the Colorado River for riparian vegetation, geomorphology,native and sport fisheries, and aquatic food webs, as well as other resources as cited in compendium volumes[Webb et al., 1999; Gloss et al., 2005; Melis, 2011].
2.1. Hydrology
Glen Canyon Dam was completed in March 1963, and Lake Powell reservoir filled for the first time in 1980.The most notable effect of flow regulation was the dramatic change in disturbance regimes: from seasonaldisturbance of spring floods due to snowmelt in the large-scale Colorado River basin to daily disturbanceof hydro-peaking [Topping et al., 2000; White et al., 2005]. The postdam period may be divided intotwo distinct periods of different reservoir release patterns (Figure 2): (1) the period between 1963 and1992 when power-plant operations involved unrestricted hydro-peaking and when long-duration floodsoccurred between 1983 and 1986 and (2) the period after 1992 when the range of daily hydro-peakingwas restricted and when short-duration controlled floods occurred in 1996, 2004, and 2008 [U.S. Departmentof the Interior, 1996; Schmidt and Grams, 2011b].
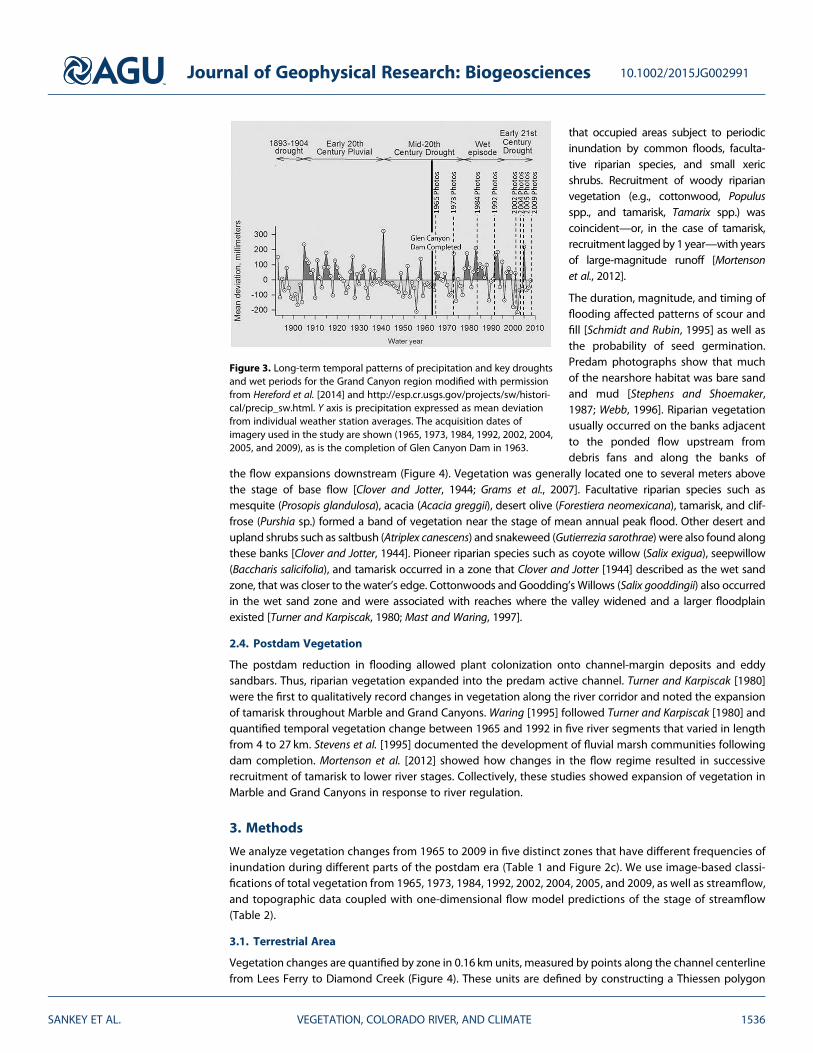
Local rainfall mostly occurs in winter and during the summer/fall period of the North American monsoon; thisrainfall supplements the amount of water available to riparian vegetation from streamflow. Two droughtswhen there was little rainfall occurred during this five-decade period (Figure 3) [Woodhouse et al., 2010;Cook et al., 2009; Hereford et al., 2014]. The mid-20th century drought started in the early 1940s and endedin the late 1970s. The early 21st century drought started in the late 1990s and is currently ongoing. A wet epi-sode intervened between the late 1970s and mid-1990s.
Journal of Geophysical Research: Biogeosciences 10.1002/2015JG002991
SANKEY ET AL. VEGETATION, COLORADO RIVER, AND CLIMATE 1533
2.2. Geomorphology
The Colorado River flows through a debris fan-affected canyon throughout the entire study area. The debrisfans occur at tributary confluences, and control channel gradient, and create large areas of recirculating flow(eddies) in the lee of each fan (Figure 4) [Howard and Dolan, 1981; Schmidt and Graf, 1990]. Vegetation growson alluvial and colluvial deposits, including the fine-grained channel-margin deposits along the banksof pools upstream from debris fans, the coarse boulder debris fans themselves, and eddy sandbarsimmediately downstream [Schmidt and Rubin, 1995]. Elsewhere, vegetation grows on channel-margindeposits that occur where the river is unobstructed. The areal extent of fine sediment deposits along the riverchannel is dependent on valley width. Narrow parts of the river, where the valley is only slightly wider thanthe active river channel, occur in the upstream half of Marble Canyon (Figure 1) and in some gorges of GrandCanyon and have a smaller capacity to store sediment above the river’s base flow.
Trapping of fine sediment in Lake Powell coupled with dam operations capable of transporting large volumesof fine sediment have resulted in sediment deficit downstream from Glen Canyon Dam [Laursen andSilverston, 1976; Topping et al., 2003]. Conditions of fine sediment export resulted in a general decline insandbar area from the predam period to the postdam period [Schmidt et al., 2004; Wright et al., 2008].
2.3. Predam Vegetation
The predam riparian plant community was characterized by episodic recruitment and periodic disturbance,resulting in an ephemeral presence of most species. Extensively developed gallery forests, or dense stands ofriparian shrubs, were rare. Surveys conducted prior to dam construction, and comparisons of predam andpostdam photographs, identify a sparse plant assemblage [Clover and Jotter, 1944; Turner and Karpiscak,1980; Stephens and Shoemaker, 1987]. The assemblage was composed of early successional riparian species
Figure 1. Map of the study area which is the Colorado River corridor between Lees Ferry and Diamond Creek, Arizona, USA. Lees Ferry is 25 km downstream fromGlen Canyon Dam and is at the upstream end of Marble Canyon. Marble Canyon is defined as that part of the Colorado River between the Paria and Little ColoradoRivers and is approximately 100 km long. Grand Canyon is downstream from the Little Colorado River and is approximately 350 km long. Diamond Creek is 362 kmdownstream from Lees Ferry and approximately 50 km from the upstream end of Lake Mead reservoir. The study area is therefore all of Marble Canyon and 262 km ofGrand Canyon to Diamond Creek, below which some of the remaining portion of Grand Canyon is inundated by Lake Mead.
Journal of Geophysical Research: Biogeosciences 10.1002/2015JG002991
SANKEY ET AL. VEGETATION, COLORADO RIVER, AND CLIMATE 1534
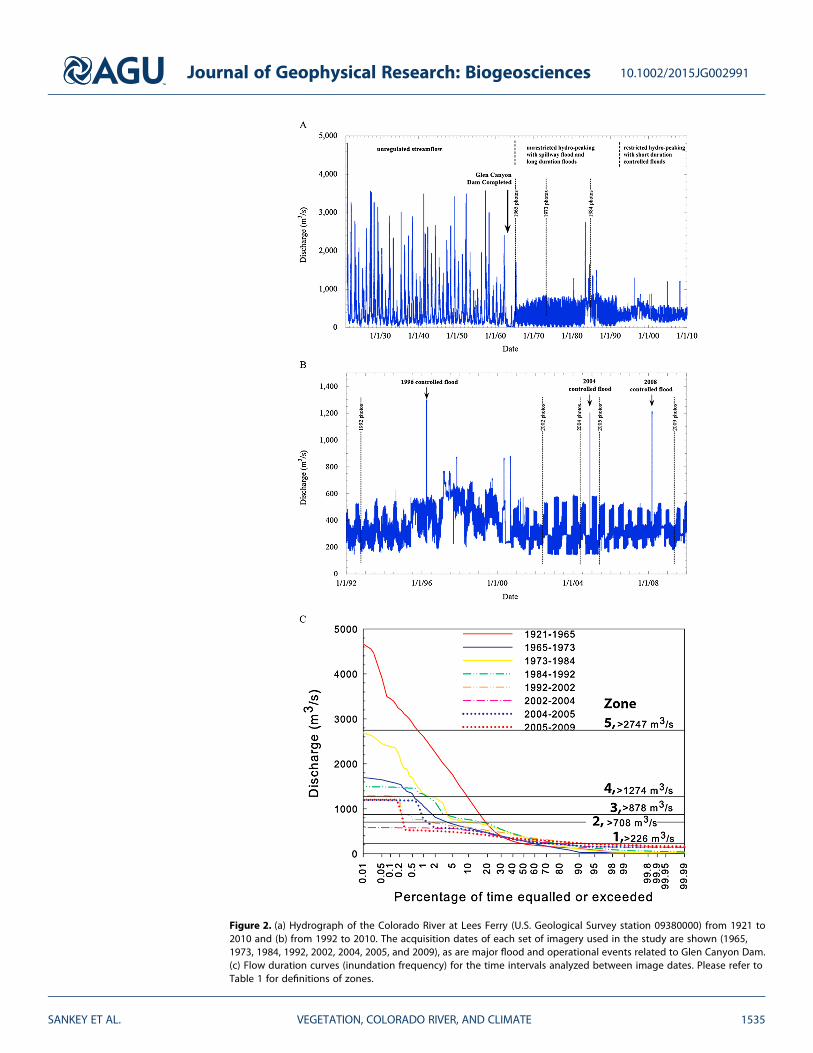
Figure 2. (a) Hydrograph of the Colorado River at Lees Ferry (U.S. Geological Survey station 09380000) from 1921 to2010 and (b) from 1992 to 2010. The acquisition dates of each set of imagery used in the study are shown (1965,1973, 1984, 1992, 2002, 2004, 2005, and 2009), as are major flood and operational events related to Glen Canyon Dam.(c) Flow duration curves (inundation frequency) for the time intervals analyzed between image dates. Please refer toTable 1 for definitions of zones.
Journal of Geophysical Research: Biogeosciences 10.1002/2015JG002991
SANKEY ET AL. VEGETATION, COLORADO RIVER, AND CLIMATE 1535
that occupied areas subject to periodicinundation by common floods, faculta-tive riparian species, and small xericshrubs. Recruitment of woody riparianvegetation (e.g., cottonwood, Populusspp., and tamarisk, Tamarix spp.) wascoincident—or, in the case of tamarisk,recruitment lagged by 1 year—with yearsof large-magnitude runoff [Mortensonet al., 2012].
The duration, magnitude, and timing offlooding affected patterns of scour andfill [Schmidt and Rubin, 1995] as well asthe probability of seed germination.Predam photographs show that muchof the nearshore habitat was bare sandand mud [Stephens and Shoemaker,1987; Webb, 1996]. Riparian vegetationusually occurred on the banks adjacentto the ponded flow upstream fromdebris fans and along the banks of
the flow expansions downstream (Figure 4). Vegetation was generally located one to several meters abovethe stage of base flow [Clover and Jotter, 1944; Grams et al., 2007]. Facultative riparian species such asmesquite (Prosopis glandulosa), acacia (Acacia greggii), desert olive (Forestiera neomexicana), tamarisk, and clif-frose (Purshia sp.) formed a band of vegetation near the stage of mean annual peak flood. Other desert andupland shrubs such as saltbush (Atriplex canescens) and snakeweed (Gutierrezia sarothrae) were also found alongthese banks [Clover and Jotter, 1944]. Pioneer riparian species such as coyote willow (Salix exigua), seepwillow(Baccharis salicifolia), and tamarisk occurred in a zone that Clover and Jotter [1944] described as the wet sandzone, that was closer to the water’s edge. Cottonwoods and Goodding’s Willows (Salix gooddingii) also occurredin the wet sand zone and were associated with reaches where the valley widened and a larger floodplainexisted [Turner and Karpiscak, 1980; Mast and Waring, 1997].
2.4. Postdam Vegetation
The postdam reduction in flooding allowed plant colonization onto channel-margin deposits and eddysandbars. Thus, riparian vegetation expanded into the predam active channel. Turner and Karpiscak [1980]were the first to qualitatively record changes in vegetation along the river corridor and noted the expansionof tamarisk throughout Marble and Grand Canyons. Waring [1995] followed Turner and Karpiscak [1980] andquantified temporal vegetation change between 1965 and 1992 in five river segments that varied in lengthfrom 4 to 27 km. Stevens et al. [1995] documented the development of fluvial marsh communities followingdam completion. Mortenson et al. [2012] showed how changes in the flow regime resulted in successiverecruitment of tamarisk to lower river stages. Collectively, these studies showed expansion of vegetation inMarble and Grand Canyons in response to river regulation.
3. Methods
We analyze vegetation changes from 1965 to 2009 in five distinct zones that have different frequencies ofinundation during different parts of the postdam era (Table 1 and Figure 2c). We use image-based classi-fications of total vegetation from 1965, 1973, 1984, 1992, 2002, 2004, 2005, and 2009, as well as streamflow,and topographic data coupled with one-dimensional flow model predictions of the stage of streamflow(Table 2).
3.1. Terrestrial Area
Vegetation changes are quantified by zone in 0.16 km units, measured by points along the channel centerlinefrom Lees Ferry to Diamond Creek (Figure 4). These units are defined by constructing a Thiessen polygon
Figure 3. Long-term temporal patterns of precipitation and key droughtsand wet periods for the Grand Canyon region modified with permissionfrom Hereford et al. [2014] and http://esp.cr.usgs.gov/projects/sw/histori-cal/precip_sw.html. Y axis is precipitation expressed as mean deviationfrom individual weather station averages. The acquisition dates ofimagery used in the study are shown (1965, 1973, 1984, 1992, 2002, 2004,2005, and 2009), as is the completion of Glen Canyon Dam in 1963.
Journal of Geophysical Research: Biogeosciences 10.1002/2015JG002991
SANKEY ET AL. VEGETATION, COLORADO RIVER, AND CLIMATE 1536
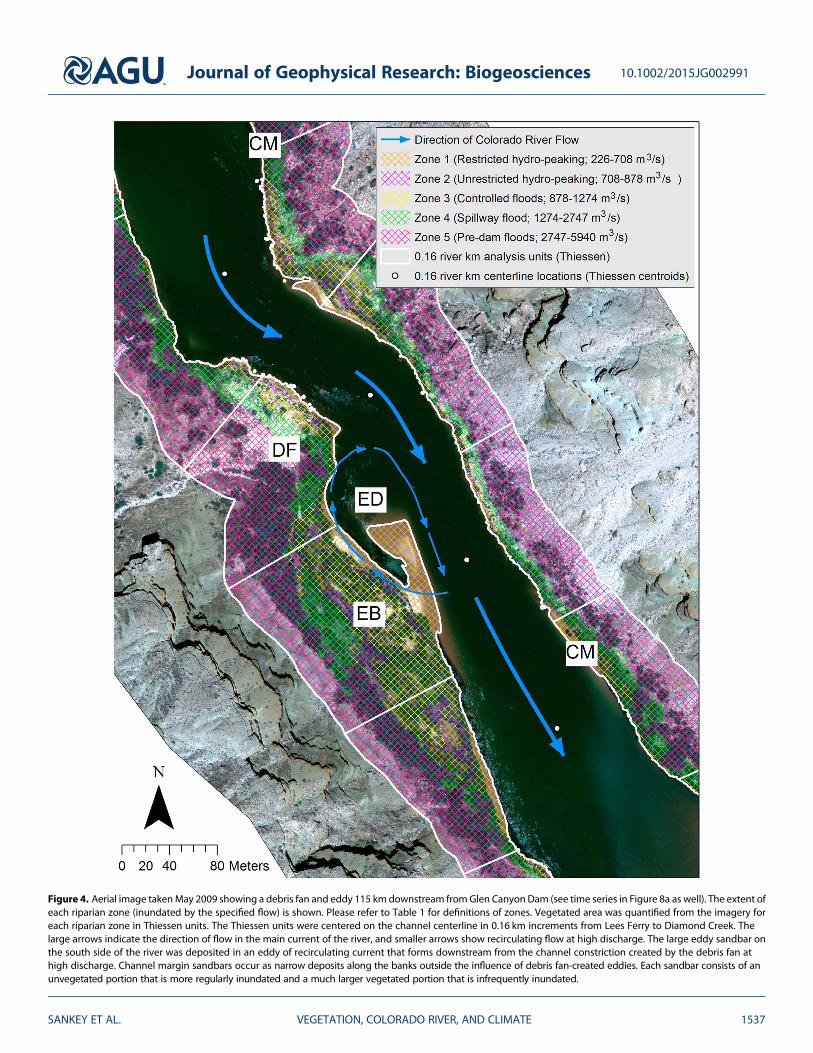
Figure 4. Aerial image takenMay 2009 showing a debris fan and eddy 115 km downstream fromGlen Canyon Dam (see time series in Figure 8a as well). The extent ofeach riparian zone (inundated by the specified flow) is shown. Please refer to Table 1 for definitions of zones. Vegetated area was quantified from the imagery foreach riparian zone in Thiessen units. The Thiessen units were centered on the channel centerline in 0.16 km increments from Lees Ferry to Diamond Creek. Thelarge arrows indicate the direction of flow in the main current of the river, and smaller arrows show recirculating flow at high discharge. The large eddy sandbar onthe south side of the river was deposited in an eddy of recirculating current that forms downstream from the channel constriction created by the debris fan athigh discharge. Channel margin sandbars occur as narrow deposits along the banks outside the influence of debris fan-created eddies. Each sandbar consists of anunvegetated portion that is more regularly inundated and a much larger vegetated portion that is infrequently inundated.
Journal of Geophysical Research: Biogeosciences 10.1002/2015JG002991
SANKEY ET AL. VEGETATION, COLORADO RIVER, AND CLIMATE 1537
around each point along the centerline. For each Thiessen polygon, we define the terrestrial area available forvegetation establishment as the entire area between the elevation of common postdam base flows(~226m3/s) and the elevation reached by the maximum recorded flood in the predam period (5940m3/sin 1884) [Topping et al., 2003]. The channel below the lower bound is nearly always inundated and bare ofvegetation. The upper bound has not been inundated in more than 100 years and therefore is used to definethe maximum extent of predam riparian vegetation. We then further subdivide the terrestrial area withineach Thiessen polygon into five zones based on elevation above base flow stage (Table 1).
Becausewe define the zones and the terrestrial area therein based on discharge required for inundation (Table 1),the boundaries are sensitive to changes in topography. However, accurate maps of shoreline topography arenot available for the images acquired prior to 2002. We therefore define the upper extent of the riparian area
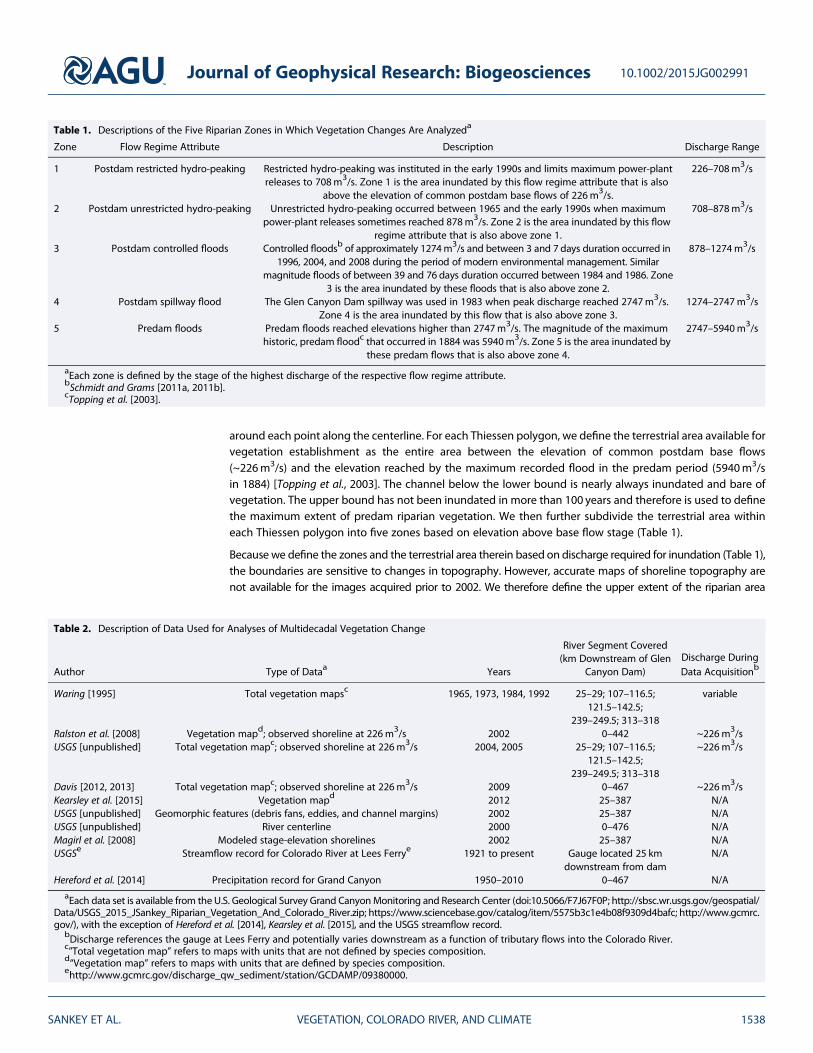
Table 1. Descriptions of the Five Riparian Zones in Which Vegetation Changes Are Analyzeda
Zone Flow Regime Attribute Description Discharge Range
1 Postdam restricted hydro-peaking Restricted hydro-peaking was instituted in the early 1990s and limits maximum power-plantreleases to 708m3/s. Zone 1 is the area inundated by this flow regime attribute that is also
above the elevation of common postdam base flows of 226m3/s.
226–708m3/s
2 Postdam unrestricted hydro-peaking Unrestricted hydro-peaking occurred between 1965 and the early 1990s when maximumpower-plant releases sometimes reached 878m3/s. Zone 2 is the area inundated by this flow
regime attribute that is also above zone 1.
708–878m3/s
3 Postdam controlled floods Controlled floodsb of approximately 1274m3/s and between 3 and 7 days duration occurred in1996, 2004, and 2008 during the period of modern environmental management. Similar
magnitude floods of between 39 and 76 days duration occurred between 1984 and 1986. Zone3 is the area inundated by these floods that is also above zone 2.
878–1274m3/s
4 Postdam spillway flood The Glen Canyon Dam spillway was used in 1983 when peak discharge reached 2747m3/s.Zone 4 is the area inundated by this flow that is also above zone 3.
1274–2747m3/s
5 Predam floods Predam floods reached elevations higher than 2747m3/s. The magnitude of the maximumhistoric, predam floodc that occurred in 1884 was 5940m3/s. Zone 5 is the area inundated by
these predam flows that is also above zone 4.
2747–5940m3/s
aEach zone is defined by the stage of the highest discharge of the respective flow regime attribute.bSchmidt and Grams [2011a, 2011b].cTopping et al. [2003].
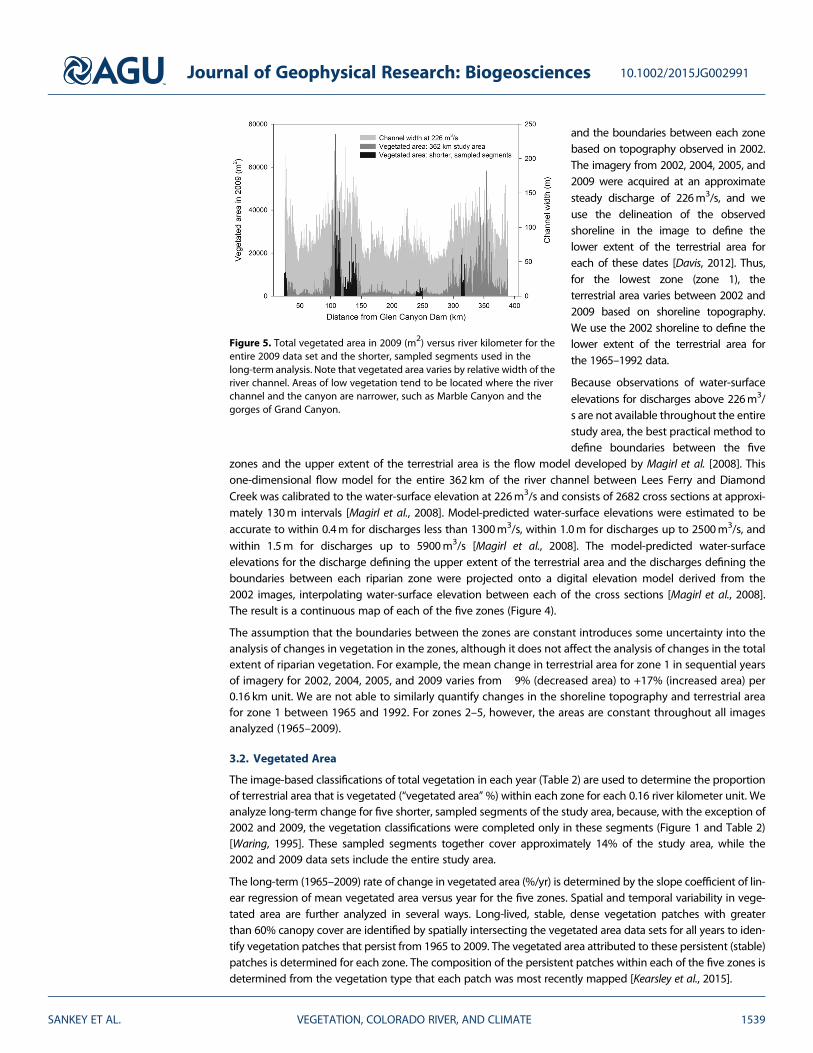
Table 2. Description of Data Used for Analyses of Multidecadal Vegetation Change
Author Type of Dataa Years
River Segment Covered(km Downstream of Glen
Canyon Dam)Discharge DuringData Acquisitionb
Waring [1995] Total vegetation mapsc 1965, 1973, 1984, 1992 25–29; 107–116.5;121.5–142.5;
239–249.5; 313–318
variable
Ralston et al. [2008] Vegetation mapd; observed shoreline at 226m3/s 2002 0–442 ~226m3/sUSGS [unpublished] Total vegetation mapc; observed shoreline at 226m3/s 2004, 2005 25–29; 107–116.5;
121.5–142.5;239–249.5; 313–318
~226m3/s
Davis [2012, 2013] Total vegetation mapc; observed shoreline at 226m3/s 2009 0–467 ~226m3/sKearsley et al. [2015] Vegetation mapd 2012 25–387 N/AUSGS [unpublished] Geomorphic features (debris fans, eddies, and channel margins) 2002 25–387 N/AUSGS [unpublished] River centerline 2000 0–476 N/AMagirl et al. [2008] Modeled stage-elevation shorelines 2002 25–387 N/AUSGSe Streamflow record for Colorado River at Lees Ferrye 1921 to present Gauge located 25 km
downstream from damN/A
Hereford et al. [2014] Precipitation record for Grand Canyon 1950–2010 0–467 N/A
aEach data set is available from the U.S. Geological Survey Grand CanyonMonitoring and Research Center (doi:10.5066/F7J67F0P; http://sbsc.wr.usgs.gov/geospatial/Data/USGS_2015_JSankey_Riparian_Vegetation_And_Colorado_River.zip; https://www.sciencebase.gov/catalog/item/5575b3c1e4b08f9309d4bafc; http://www.gcmrc.gov/), with the exception of Hereford et al. [2014], Kearsley et al. [2015], and the USGS streamflow record.
bDischarge references the gauge at Lees Ferry and potentially varies downstream as a function of tributary flows into the Colorado River.c”Total vegetation map” refers to maps with units that are not defined by species composition.d“Vegetation map” refers to maps with units that are defined by species composition.ehttp://www.gcmrc.gov/discharge_qw_sediment/station/GCDAMP/09380000.
Journal of Geophysical Research: Biogeosciences 10.1002/2015JG002991
SANKEY ET AL. VEGETATION, COLORADO RIVER, AND CLIMATE 1538
http://sbsc.wr.usgs.gov/geospatial/Data/USGS_2015_JSankey_Riparian_Vegetation_And_Colorado_River.zip
and the boundaries between each zonebased on topography observed in 2002.The imagery from 2002, 2004, 2005, and2009 were acquired at an approximatesteady discharge of 226m3/s, and weuse the delineation of the observedshoreline in the image to define thelower extent of the terrestrial area foreach of these dates [Davis, 2012]. Thus,for the lowest zone (zone 1), theterrestrial area varies between 2002 and2009 based on shoreline topography.We use the 2002 shoreline to define thelower extent of the terrestrial area forthe 1965–1992 data.
Because observations of water-surfaceelevations for discharges above 226m3/s are not available throughout the entirestudy area, the best practical method todefine boundaries between the five
zones and the upper extent of the terrestrial area is the flow model developed by Magirl et al. [2008]. Thisone-dimensional flow model for the entire 362 km of the river channel between Lees Ferry and DiamondCreek was calibrated to the water-surface elevation at 226m3/s and consists of 2682 cross sections at approxi-mately 130m intervals [Magirl et al., 2008]. Model-predicted water-surface elevations were estimated to beaccurate to within 0.4m for discharges less than 1300m3/s, within 1.0m for discharges up to 2500m3/s, andwithin 1.5m for discharges up to 5900m3/s [Magirl et al., 2008]. The model-predicted water-surfaceelevations for the discharge defining the upper extent of the terrestrial area and the discharges defining theboundaries between each riparian zone were projected onto a digital elevation model derived from the2002 images, interpolating water-surface elevation between each of the cross sections [Magirl et al., 2008].The result is a continuous map of each of the five zones (Figure 4).
The assumption that the boundaries between the zones are constant introduces some uncertainty into theanalysis of changes in vegetation in the zones, although it does not affect the analysis of changes in the totalextent of riparian vegetation. For example, the mean change in terrestrial area for zone 1 in sequential yearsof imagery for 2002, 2004, 2005, and 2009 varies from �9% (decreased area) to +17% (increased area) per0.16 km unit. We are not able to similarly quantify changes in the shoreline topography and terrestrial areafor zone 1 between 1965 and 1992. For zones 2–5, however, the areas are constant throughout all imagesanalyzed (1965–2009).
3.2. Vegetated Area
The image-based classifications of total vegetation in each year (Table 2) are used to determine the proportionof terrestrial area that is vegetated (“vegetated area”%) within each zone for each 0.16 river kilometer unit. Weanalyze long-term change for five shorter, sampled segments of the study area, because, with the exception of2002 and 2009, the vegetation classifications were completed only in these segments (Figure 1 and Table 2)[Waring, 1995]. These sampled segments together cover approximately 14% of the study area, while the2002 and 2009 data sets include the entire study area.
The long-term (1965–2009) rate of change in vegetated area (%/yr) is determined by the slope coefficient of lin-ear regression of mean vegetated area versus year for the five zones. Spatial and temporal variability in vege-tated area are further analyzed in several ways. Long-lived, stable, dense vegetation patches with greaterthan 60% canopy cover are identified by spatially intersecting the vegetated area data sets for all years to iden-tify vegetation patches that persist from 1965 to 2009. The vegetated area attributed to these persistent (stable)patches is determined for each zone. The composition of the persistent patches within each of the five zones isdetermined from the vegetation type that each patch was most recently mapped [Kearsley et al., 2015].
Figure 5. Total vegetated area in 2009 (m2) versus river kilometer for theentire 2009 data set and the shorter, sampled segments used in thelong-term analysis. Note that vegetated area varies by relative width of theriver channel. Areas of low vegetation tend to be located where the riverchannel and the canyon are narrower, such as Marble Canyon and thegorges of Grand Canyon.
Journal of Geophysical Research: Biogeosciences 10.1002/2015JG002991
SANKEY ET AL. VEGETATION, COLORADO RIVER, AND CLIMATE 1539
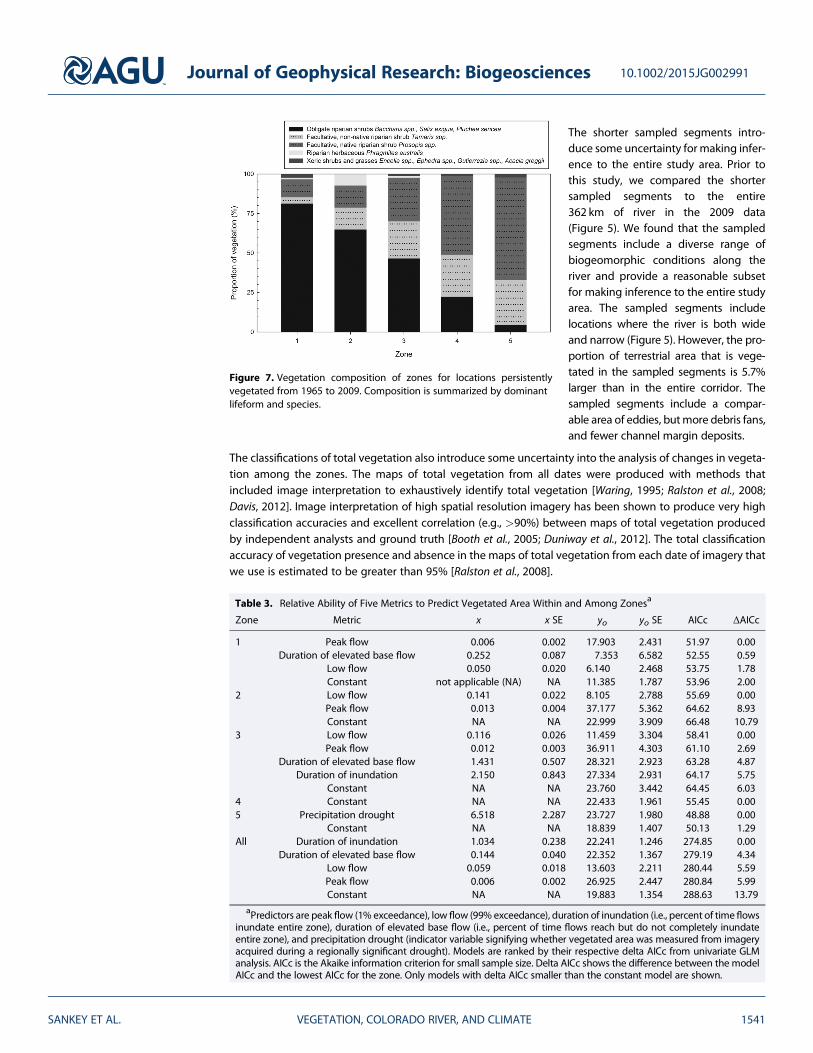
Figure 6. Mean (standard error)-vegetated area measured from aerial imagery in eight, postdam acquisition dates in eachof the five riparian zones. Different patterns in the long-term trends of vegetated area are evident for the zones. Thedifferent patterns can be in part explained by effects and interactions of river hydrology and precipitation (drought).
Journal of Geophysical Research: Biogeosciences 10.1002/2015JG002991
SANKEY ET AL. VEGETATION, COLORADO RIVER, AND CLIMATE 1540
The shorter sampled segments intro-duce some uncertainty for making infer-ence to the entire study area. Prior tothis study, we compared the shortersampled segments to the entire362 km of river in the 2009 data(Figure 5). We found that the sampledsegments include a diverse range ofbiogeomorphic conditions along theriver and provide a reasonable subsetfor making inference to the entire studyarea. The sampled segments includelocations where the river is both wideand narrow (Figure 5). However, the pro-portion of terrestrial area that is vege-tated in the sampled segments is 5.7%larger than in the entire corridor. Thesampled segments include a compar-able area of eddies, butmore debris fans,and fewer channel margin deposits.
The classifications of total vegetation also introduce some uncertainty into the analysis of changes in vegeta-tion among the zones. The maps of total vegetation from all dates were produced with methods thatincluded image interpretation to exhaustively identify total vegetation [Waring, 1995; Ralston et al., 2008;Davis, 2012]. Image interpretation of high spatial resolution imagery has been shown to produce very highclassification accuracies and excellent correlation (e.g., >90%) between maps of total vegetation producedby independent analysts and ground truth [Booth et al., 2005; Duniway et al., 2012]. The total classificationaccuracy of vegetation presence and absence in the maps of total vegetation from each date of imagery thatwe use is estimated to be greater than 95% [Ralston et al., 2008].
Figure 7. Vegetation composition of zones for locations persistentlyvegetated from 1965 to 2009. Composition is summarized by dominantlifeform and species.
Table 3. Relative Ability of Five Metrics to Predict Vegetated Area Within and Among Zonesa
Zone Metric x x SE yo yo SE AICc ΔAICc
1 Peak flow �0.006 0.002 17.903 2.431 51.97 0.00Duration of elevated base flow 0.252 0.087 �7.353 6.582 52.55 0.59
Low flow 0.050 0.020 6.140 2.468 53.75 1.78Constant not applicable (NA) NA 11.385 1.787 53.96 2.00
2 Low flow 0.141 0.022 8.105 2.788 55.69 0.00Peak flow �0.013 0.004 37.177 5.362 64.62 8.93Constant NA NA 22.999 3.909 66.48 10.79
3 Low flow 0.116 0.026 11.459 3.304 58.41 0.00Peak flow �0.012 0.003 36.911 4.303 61.10 2.69
Duration of elevated base flow �1.431 0.507 28.321 2.923 63.28 4.87Duration of inundation �2.150 0.843 27.334 2.931 64.17 5.75
Constant NA NA 23.760 3.442 64.45 6.034 Constant NA NA 22.433 1.961 55.45 0.005 Precipitation drought �6.518 2.287 23.727 1.980 48.88 0.00
Constant NA NA 18.839 1.407 50.13 1.29All Duration of inundation �1.034 0.238 22.241 1.246 274.85 0.00
Duration of elevated base flow �0.144 0.040 22.352 1.367 279.19 4.34Low flow 0.059 0.018 13.603 2.211 280.44 5.59Peak flow �0.006 0.002 26.925 2.447 280.84 5.99Constant NA NA 19.883 1.354 288.63 13.79
aPredictors are peak flow (1% exceedance), low flow (99% exceedance), duration of inundation (i.e., percent of time flowsinundate entire zone), duration of elevated base flow (i.e., percent of time flows reach but do not completely inundateentire zone), and precipitation drought (indicator variable signifying whether vegetated area was measured from imageryacquired during a regionally significant drought). Models are ranked by their respective delta AICc from univariate GLManalysis. AICc is the Akaike information criterion for small sample size. Delta AICc shows the difference between the modelAICc and the lowest AICc for the zone. Only models with delta AICc smaller than the constant model are shown.
Journal of Geophysical Research: Biogeosciences 10.1002/2015JG002991
SANKEY ET AL. VEGETATION, COLORADO RIVER, AND CLIMATE 1541
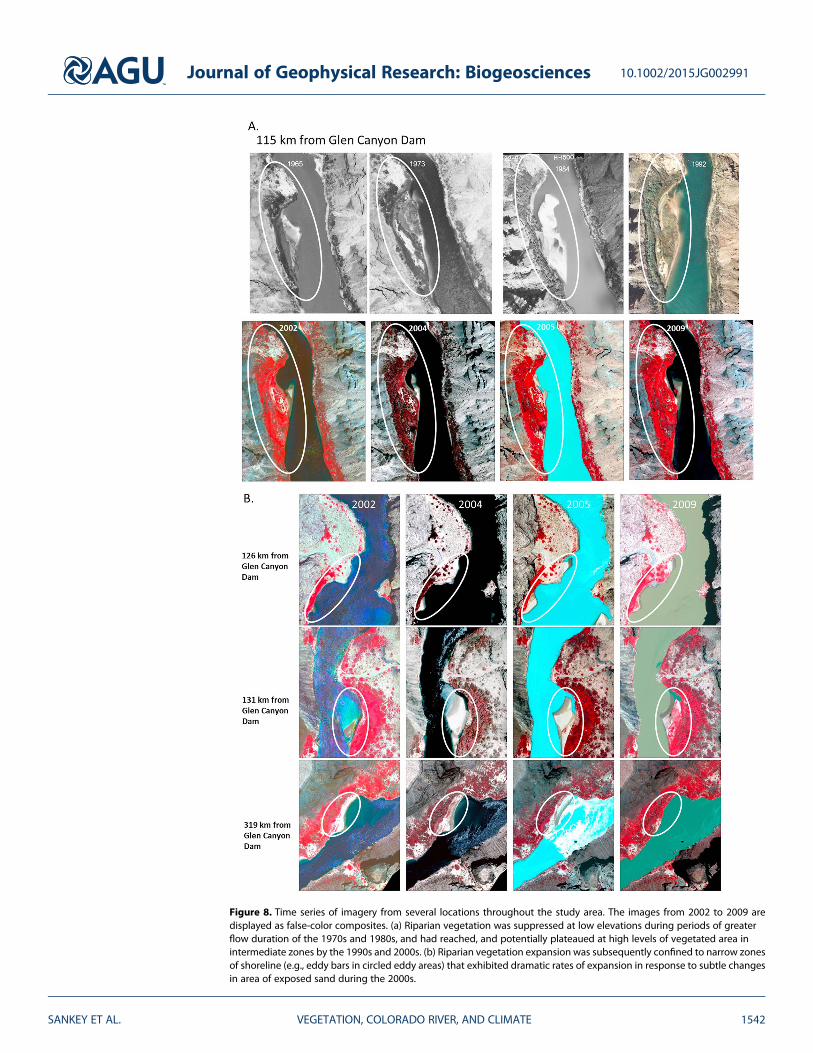
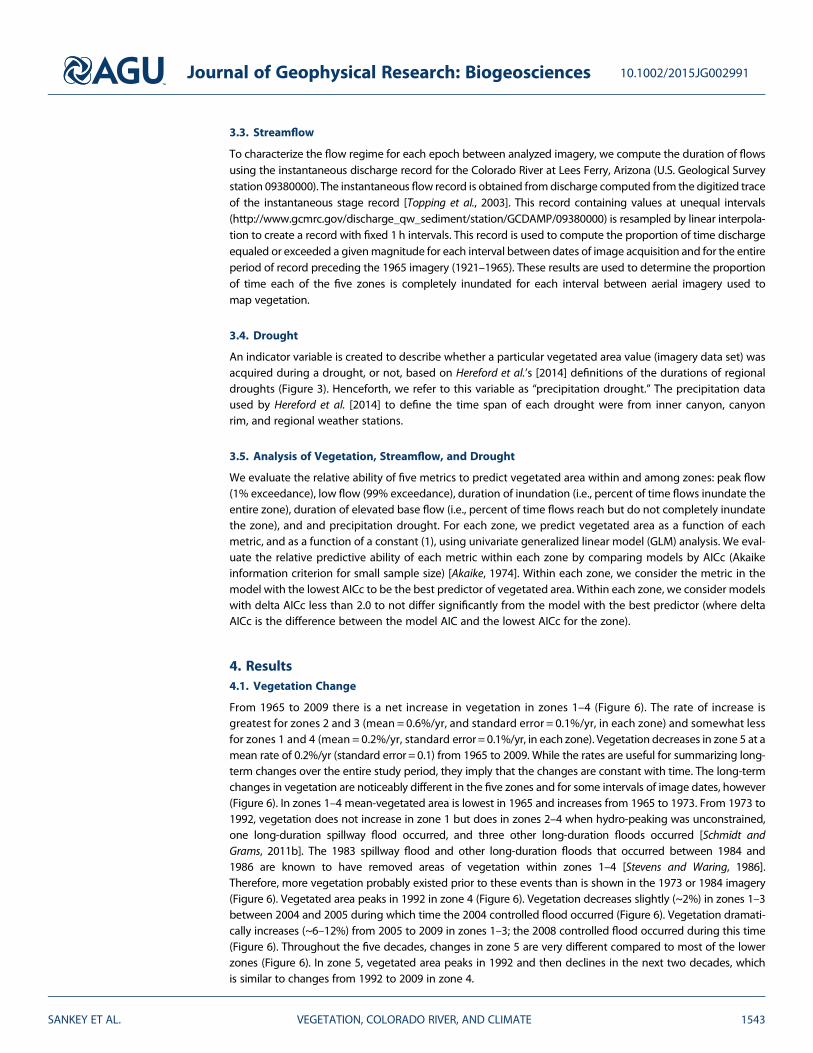
Figure 8. Time series of imagery from several locations throughout the study area. The images from 2002 to 2009 aredisplayed as false-color composites. (a) Riparian vegetation was suppressed at low elevations during periods of greaterflow duration of the 1970s and 1980s, and had reached, and potentially plateaued at high levels of vegetated area inintermediate zones by the 1990s and 2000s. (b) Riparian vegetation expansion was subsequently confined to narrow zonesof shoreline (e.g., eddy bars in circled eddy areas) that exhibited dramatic rates of expansion in response to subtle changesin area of exposed sand during the 2000s.
Journal of Geophysical Research: Biogeosciences 10.1002/2015JG002991
SANKEY ET AL. VEGETATION, COLORADO RIVER, AND CLIMATE 1542
3.3. Streamflow
To characterize the flow regime for each epoch between analyzed imagery, we compute the duration of flowsusing the instantaneous discharge record for the Colorado River at Lees Ferry, Arizona (U.S. Geological Surveystation 09380000). The instantaneous flow record is obtained fromdischarge computed from the digitized traceof the instantaneous stage record [Topping et al., 2003]. This record containing values at unequal intervals(http://www.gcmrc.gov/discharge_qw_sediment/station/GCDAMP/09380000) is resampled by linear interpola-tion to create a record with fixed 1h intervals. This record is used to compute the proportion of time dischargeequaled or exceeded a givenmagnitude for each interval between dates of image acquisition and for the entireperiod of record preceding the 1965 imagery (1921–1965). These results are used to determine the proportionof time each of the five zones is completely inundated for each interval between aerial imagery used tomap vegetation.
3.4. Drought
An indicator variable is created to describe whether a particular vegetated area value (imagery data set) wasacquired during a drought, or not, based on Hereford et al.’s [2014] definitions of the durations of regionaldroughts (Figure 3). Henceforth, we refer to this variable as “precipitation drought.” The precipitation dataused by Hereford et al. [2014] to define the time span of each drought were from inner canyon, canyonrim, and regional weather stations.
3.5. Analysis of Vegetation, Streamflow, and Drought
We evaluate the relative ability of five metrics to predict vegetated area within and among zones: peak flow(1% exceedance), low flow (99% exceedance), duration of inundation (i.e., percent of time flows inundate theentire zone), duration of elevated base flow (i.e., percent of time flows reach but do not completely inundatethe zone), and and precipitation drought. For each zone, we predict vegetated area as a function of eachmetric, and as a function of a constant (1), using univariate generalized linear model (GLM) analysis. We eval-uate the relative predictive ability of each metric within each zone by comparing models by AICc (Akaikeinformation criterion for small sample size) [Akaike, 1974]. Within each zone, we consider the metric in themodel with the lowest AICc to be the best predictor of vegetated area. Within each zone, we consider modelswith delta AICc less than 2.0 to not differ significantly from the model with the best predictor (where deltaAICc is the difference between the model AIC and the lowest AICc for the zone).
4. Results4.1. Vegetation Change
From 1965 to 2009 there is a net increase in vegetation in zones 1–4 (Figure 6). The rate of increase isgreatest for zones 2 and 3 (mean = 0.6%/yr, and standard error = 0.1%/yr, in each zone) and somewhat lessfor zones 1 and 4 (mean = 0.2%/yr, standard error= 0.1%/yr, in each zone). Vegetation decreases in zone 5 at amean rate of 0.2%/yr (standard error = 0.1) from 1965 to 2009. While the rates are useful for summarizing long-term changes over the entire study period, they imply that the changes are constant with time. The long-termchanges in vegetation are noticeably different in the five zones and for some intervals of image dates, however(Figure 6). In zones 1–4 mean-vegetated area is lowest in 1965 and increases from 1965 to 1973. From 1973 to1992, vegetation does not increase in zone 1 but does in zones 2–4 when hydro-peaking was unconstrained,one long-duration spillway flood occurred, and three other long-duration floods occurred [Schmidt andGrams, 2011b]. The 1983 spillway flood and other long-duration floods that occurred between 1984 and1986 are known to have removed areas of vegetation within zones 1–4 [Stevens and Waring, 1986].Therefore, more vegetation probably existed prior to these events than is shown in the 1973 or 1984 imagery(Figure 6). Vegetated area peaks in 1992 in zone 4 (Figure 6). Vegetation decreases slightly (~2%) in zones 1–3between 2004 and 2005 during which time the 2004 controlled flood occurred (Figure 6). Vegetation dramati-cally increases (~6–12%) from 2005 to 2009 in zones 1–3; the 2008 controlled flood occurred during this time(Figure 6). Throughout the five decades, changes in zone 5 are very different compared to most of the lowerzones (Figure 6). In zone 5, vegetated area peaks in 1992 and then declines in the next two decades, whichis similar to changes from 1992 to 2009 in zone 4.
Journal of Geophysical Research: Biogeosciences 10.1002/2015JG002991
SANKEY ET AL. VEGETATION, COLORADO RIVER, AND CLIMATE 1543
4.2. Vegetation Composition and Persistence
There is a larger proportion of persistently vegetated area during the five decades in the higher zones. Theproportion of the zone that is persistently vegetated in zone 5 (mean=7.4%, standard error = 0.6%) is 2 timesgreater than zone 4 (mean=3.2%, standard error=0.44%) and an order of magnitude greater than zones 1–3(mean=0.3%, 0.9%, and 1.7%, standard error = 0.1%, 0.4%, and 0.7%, respectively). These persistent vegetationpatches are overwhelmingly composed of woody plants in all zones (Figure 7). The proportion of obligate ripar-ian shrubs Baccharis spp., Salix exigua, Pluchea sericea, and the fluvial marsh species Phragmites australisdecreases from low to high zones. The proportion of the facultative, native riparian shrub Prosopis spp. withdeep-root system increases along the same elevation gradient. The facultative, nonnative riparian shrubTamarix spp. increases along the gradient as well, though to a lesser extent at higher zones.
4.3. Relationships of Vegetation to Streamflow and Drought
The best predictors of vegetated area differ among zones (Table 3). In zone 1, the best predictor of vegetatedarea is peak flow, although duration of elevated base flow and low flow are also significant. Relationshipsindicate that vegetation decreases with larger peak flows and that vegetation increases with larger low flowsand longer duration of elevated base flow. The peak flow relationship suggests that disturbance by largefloods controls the amount of vegetated area in this zone. The relationship for elevated base flow suggeststhat flows that do not inundate the entire zone for long duration may provide water for pulses of vegetationexpansion (for example, the increases in vegetation in zone 1 from 2002 to 2004 and 2005 to 2009 that aredepicted in Figure 6 are periods of elevated base flow).
In zones 2 and 3, low flow is the best predictor of vegetated area. Relationships indicate that in these zonesvegetation increases with larger low flows. This suggests that shallow groundwater might make more wateravailable to deep-rooted plants when low flows are larger. In zone 4, none of the metrics is a significantpredictor of vegetated area. In zone 5, precipitation drought is the best predictor of vegetated area, thoughdoes not differ significantly from the constant model; the relationship indicates that vegetation decreasesduring drought.
In the entire riparian area (i.e., when data are analyzed among all zones), the duration of inundation is the bestpredictor of vegetated area. Vegetated area decreases with longer duration of inundation. We use the modelcoefficients for duration of inundation for all zones (Table 3) to estimate inundation duration that can keepriparian vegetation from expanding. At the beginning of our study in 1965, vegetated area is less than 12%in zones 1–4 (Figure 6). The model indicates that vegetated area does not exceed 12% when a zone is inun-dated for more than 10% of time. Conversely, in our data, vegetated area does not exceed 12% (Figure 6) forany zones inundated ≥5% of time (Figure 2c). Therefore, a useful estimate of inundation that can control theexpansion of riparian vegetation is at least 10% duration and possibly as low as 5%. The flow duration curvesfor each of the time steps (Figure 2c) suggest that 5% duration of inundation is never exceeded in zone 5, isexceeded only prior to 1965 for zones 2–4, and is exceeded prior to 1965 and from 1973 to 1992 in zone 1.
The statistical relationships between vegetation and hydrology are consistent with changes depicted in theaerial images. For example, there is more unvegetated, bare sand visible in the images from 1965 to 1992,which is the period of unrestricted hydro-peaking that is characterized by greater duration of inundationand larger peak flows (Figure 8a). Many areas of bare sand in the 1965 image are more vegetated in the1973 image but then less vegetated in the 1984 image due to scour of vegetation caused by high peak flowsduring the spillway flood of 1983 [Rubin et al., 1990]. In the images after 1992, bare sand is mostly confined tonarrow areas of shorelines (e.g., eddy bars in circled eddy areas in Figures 8a and 8b) that exhibit dramaticvegetation expansion during the 2000s. From 2002 to 2009 the bare eddy bars were inundated infrequently,but elevated base flows at specific time intervals might have promoted pulses of riparian vegetation expan-sion. Further upslope, vegetation appears to reach and plateau at high cover during the 2000s.
5. Discussion
Analyses of classified remotely sensed imagery for locations along 362 km of the Colorado River in Marbleand Grand Canyons confirm that there has been a progressive increase in riparian vegetation during the fivedecades since the completion of Glen Canyon Dam. The magnitude and timing of vegetation changes differalong five zones of the riparian area that are defined by stage above common postdam base flows. Much of
Journal of Geophysical Research: Biogeosciences 10.1002/2015JG002991
SANKEY ET AL. VEGETATION, COLORADO RIVER, AND CLIMATE 1544
the long-term increases in vegetation occurred in the lowest zones that are inundated by hydro-peaking andwere once part of the predam active channel. This finding indicates a downward expansion of vegetationthat filled in parts of the predam active channel, resulting in a long-term lowering of the riparian area[Auble et al., 2005; Stromberg et al., 2007].
Vegetation in lower zones is substantially shorter-lived than vegetation in higher zones. This is attributable toa greater susceptibility of vegetation at lower elevations to flooding, scouring, and burial [Stevens et al., 1995].This is also attributable to the composition of long-lived, facultative riparian and phreatophytic vegetationthat can access deeper water at higher elevations [Clover and Jotter, 1944; Turner and Karpiscak, 1980]. Inall zones, the long-term composition of vegetation is overwhelmingly woody. Thus, results indicate a long-term expansion of woody vegetation over the five decades; spatiotemporal trends exhibited in regulatedrivers throughout the western U.S. and elsewhere [Friedman et al., 2005; Webb and Leake, 2006; Mortensonand Weisberg, 2010]. The nonnative woody species tamarisk is ubiquitous across zones but is a codominantspecies with other riparian shrubs. This contrasts with the upper basin of the Colorado River in Utah andColorado where tamarisk often dominates the landscape [Merritt and Cooper, 2000; Cooper et al., 2003] andsuggests that tamarisk and other riparian shrubs may respond similarly to altered flow regimes and climatein our study area.
The hydrology of the past five decades on the regulated Colorado River is characterized by net decreases inflood magnitude, increases in the magnitude of base flows, and recent drought [Topping et al., 2003;Mortenson et al., 2012; Hereford et al., 2014]. Our results suggest that for riparian vegetation in zone 1 thesechanges in hydrology increase habitable space, decrease disturbance, and potentially increase wateravailability. Collectively, these changes promote colonization of low-elevation bare surfaces and sandbars.In contrast, the long-term expansion of riparian vegetation in zones 2 and 3 is most influenced by elevatedbase flows that make groundwater more available to plants. In zone 4, effects of streamflow and precipitationon vegetated area are not resolved. In zone 5, vegetation varies as a function of precipitation. The effectsobserved in the lower zones are supported by previous research specific to shorter time intervals and/or spe-cies [Cooper et al., 2003; Stevens et al., 1995; Turner and Karpiscak, 1980;Waring, 1995; Mortenson et al., 2012].The effects in the highest zone indicate a decoupling of climate and hydrology that can be characteristic ofregulated rivers [Johnson, 2002;Mortenson et al., 2012; Perry et al., 2012, 2013]. It is particularly interesting thatin zone 4, vegetation increases during the first three decades of the study in similar fashion to zones 1–3 inwhich vegetation responds to streamflow but then decreases from 1992 to 2009 which is consistent withdrought-related changes in zone 5. It is possible that the relative influence of streamflow versus precipitationshifted for zone 4 during the past five decades and might explain why neither type of environmental variablepredicts vegetation changes in this zone.
In the future, river managers might consider changing dam operations in order to optimize a regulated floodregime that can rehabilitate or increase the resilience of riparian ecosystems. However, under anticipatedfuture aridity [U.S. Department of the Interior, 2012], managers will contend with the compound effects ofriparian vegetation communities that continue to expand at lower zones of the riparian area, yet that aresubjected to drought and have become increasingly disconnected from river hydrology at higher zones.
6. Summary and Conclusions
Large dams decouple predam riparian vegetation from the streamflow regime for those zones of the riparianarea that are never again inundated. At those zones, vegetated area varies with precipitation and drought.For zones that are rarely inundated by the postdam flow regime, there may be a decadal period of expansionof riparian vegetation into parts of the active channel that are abandoned due to flood control, buteventually, that response wanes. At even lower zones, however, riparian vegetation proliferates. Five decadessince completion of the Glen Canyon Dam, riparian vegetation communities of the downstream ColoradoRiver are subjected to drought and disconnected from river hydrology at higher zones, yet continue toexpand at lower zones. Flow regimes downstream from Glen Canyon Dam that decrease the magnitudeand frequency of peak floods but that also increase base flows result in riparian vegetation expansion andlowering of the riparian area. Short pulses of high flow, such as the controlled floods of the Colorado Riverin 1996, 2004, and 2008, do not keep vegetation from expanding onto bare sand habitat. Vegetationexpansion is coincident with inundation frequency; vegetated area apparently does not expand, in our study,
Journal of Geophysical Research: Biogeosciences 10.1002/2015JG002991
SANKEY ET AL. VEGETATION, COLORADO RIVER, AND CLIMATE 1545
if the surface is inundated for as little as 5% of the time (e.g., 18 d/yr), which might be a useful estimate ofinundation that can keep riparian vegetation expansion at bay.
ReferencesAkaike, H. (1974), A new look at the statistical model identification, IEEE Trans. Autom. Control, 19(6), 716–723.Allred, T. M., and J. C. Schmidt (1999), Channel narrowing by vertical accretion along the Green River near Green River, Utah, Geol. Soc. Am.
Bull., 111(12), 1757–1772.Auble, G. T., M. L. Scott, and J. M. Friedman (2005), Use of individualistic streamflow-vegetation relations along the Fremont River, Utah, USA
to assess impacts of flow alteration on wetland and riparian areas, Wetlands, 25(1), 143–154.Booth, D. T., S. E. Cox, C. Fifield, M. Phillips, and N. Williamson (2005), Image analysis compared with other methods for measuring ground
cover, Arid Land Res. Manage., 19(2), 91–100.Christensen, N. S., A. W. Wood, N. Voisin, D. P. Lettenmaier, and R. H. Palmer (2004), The effects of climate change on the hydrology and water
resources of the Colorado River Basin, Clim. Change, 62(1–3), 337–363.Clover, E. U., and L. Jotter (1944), Floristic studies in the canyon of the Colorado and tributaries, Am. Midl. Nat., 32(3), 591–642.Cook, E. R., R. Seager, R. R. Heim, R. S. Vose, C. Herweijer, and C. Woodhouse (2009), Megadroughts in North America: Placing IPCC projections
of hydroclimatic change in a long-term paleoclimate context, J. Quat. Sci., 25(1), 48–61.Cooper, D. J., D. C. Andersen, and R. A. Chimner (2003), Multiple pathways for woody plant establishment on floodplains at local to regional
scales, J. Ecol., 91(2), 182–196.Davis, P. A. (2012), Airborne digital-image data for monitoring the Colorado River corridor below Glen Canyon Dam, Arizona, 2009: Image-
mosaic production and comparison with 2002 and 2005 image mosaics, U.S. Geol. Surv. Open File Rep., 2012–1139, 82 pp.Davis, P. A. (2013), Natural-color and color-infrared image mosaics of the Colorado River corridor in Arizona derived from the May 2009
airborne image collection, U.S. Geol. Surv. Data Ser., 780, 15 pp.Dixon, M. D., W. Johnson, M. L. Scott, D. E. Bowen, and L. A. Rabbe (2012), Dynamics of plains cottonwood (Populus deltoides) forests and
historical landscape change along unchannelized segments of the Missouri River, USA, Environ. Manage., 49(5), 990–1008.Duniway, M. C., J. W. Karl, S. Schrader, N. Baquera, and J. E. Herrick (2012), Rangeland and pasture monitoring: An approach to interpretation
of high-resolution imagery focused on observer calibration for repeatability, Environ. Monit. Assess., 184(6), 3789–3804.Friedman, J. M., G. T. Auble, P. B. Shafroth, J. M. Scott, M. F. Merigliano, M. D. Freehling, and E. R. Griffin (2005), Dominance of non-native
riparian trees in western USA, Biol. Invasions, 7(4), 747–751.Gloss, S., J. E. Lovich, and T. S. Melis (Eds.) (2005), The state of the Colorado River ecosystem in Grand Canyon: A report of the Grand Canyon
Monitoring and Research Center 1991–2004, U.S. Geol. Surv. Circ., 1282, 220 pp.Grams, P. E., and J. C. Schmidt (2002), Streamflow regulation and multi-level flood plain formation: Channel narrowing on the aggrading
Green River in the eastern Uinta Mountains, Colorado and Utah, Geomorphology, 44(3), 337–360.Grams, P. E., J. C. Schmidt, and D. J. Topping (2007), The rate and pattern of bed incision and bank adjustment on the Colorado River in Glen
Canyon downstream from Glen Canyon Dam, 1956–2000, Geol. Soc. Am. Bull., 119(5–6), 556–575.Grantz, K., B. Rajagopalan, M. Clark, and E. Zagona (2007), Seasonal shifts in the North American monsoon, J. Clim., 20(9), 1923–1935.Hereford, R., G. E. Bennett, and H. C. Fairley (2014), Precipitation variability of the Grand Canyon region, 1983 to 2009, and its implications for
studying effects of gullying of Holocene terraces and associated archeological sites in Grand Canyon, Arizona, U.S. Geol. Surv. Open FileRep., 2014–1006, 23 pp.
Howard, A. D., and R. Dolan (1981), Geomorphology of the Colorado River in Grand Canyon, J. Geol., 89(3), 269–298.Johnson, W. C. (1994), Woodland expansion in the Platte River, Nebraska: Patterns and causes, Ecol. Monogr., 64(1), 45–84.Johnson, W. C. (2002), Riparian vegetation diversity along regulated rivers: Contribution of novel and relict habitats, Freshwater Biol., 47(4),
749–759.Jones, N. E. (2013), The dual nature of hydro-peaking rivers: Is ecopeaking possible?, River Res. Appl., 30(4), 521–526.Kearsley, M. J. C., K. Green, M. Tukman, M. Reid, M. Hall, T. Ayers, and K. Christie (2015), Grand Canyon National Park-Grand Canyon/Parashant
National Monument vegetation classification and mapping project, Natural Resource Report NPS/GRCA/NRR—2015/913, National ParkService, Fort Collins, Colo., Published Report-2221240. [Available at https://irma.nps.gov/App/Reference/Profile/2221240.]
Laursen, E. M., and E. Silverston (1976), Hydrology and sedimentology of the Colorado River in Grand Canyon, contract CX821060030 toNational Park Service, 26 pp., Univ. of Arizona, Tucson, Ariz. [Available at http://www.riversimulator.org/Resources/NPS/GCresearch/1976no13sedimentHydrology.pdf.]
Magirl, C. S., M. J. Breedlove, R. H. Webb, and P. G. Griffiths (2008), Modeling water-surface elevations and virtual shorelines for the ColoradoRiver in Grand Canyon, Arizona, U.S. Geol. Surv. Sci. Invest. Rep., 2008–5075, 32 pp.
Manners, R. B., J. C. Schmidt, and M. L. Scott (2014), Mechanisms of vegetation-induced channel narrowing of an unregulated canyon river:Results from a natural field-scale experiment, Geomorphology, 211(2014), 100–115.
Mast, J. N., and G. Waring (1997), Dendrochronological analysis of Goodding willows in Grand Canyon National Park, paper presented atThird Biennial Conference of Research on Colorado Plateau, National Park Service Transactions and Proceedings Series NPS/NRNAU/NRTP-97/12, Flagstaff, Ariz., October 17–20, 1995.
Melis, T. S., (Ed.) (2011), Effects of three high-flow experiments on the Colorado River ecosystem downstream from Glen Canyon Dam,Arizona, U.S. Geol. Surv. Circ., 1366, 147 pp.
Merritt, D. M., and D. J. Cooper (2000), Riparian vegetation and channel change in response to river regulation: A comparative study ofregulated and unregulated streams in the Green River Basin, USA, Regul. Rivers: Res. Manage., 16(6), 543–564.
Mortenson, S. G., and P. J. Weisberg (2010), Does river regulation increase the dominance of invasive woody species in riparian landscapes?,Global Ecol. Biogeogr., 19(4), 562–574.
Mortenson, S. G., P. J. Weisberg, and L. E. Stevens (2012), The influence of floods and precipitation on Tamarix establishment in GrandCanyon, Arizona: Consequences for flow regime restoration, Biol. Invasions, 14(5), 1061–1076.
Nilsson, C., and K. Berggren (2000), Alterations of riparian ecosystems caused by river regulation, BioScience, 50(9), 783–792.Nilsson, C., C. A. Reidy, M. Dynesius, and C. Revenga (2005), Fragmentation and flow regulation of the world’s large river systems, Science,
308(5720), 405–408.Perry, L. G., D. C. Andersen, L. V. Reynolds, S. M. Nelson, and P. B. Shafroth (2012), Vulnerability of riparian ecosystems to elevated CO2 and
climate change in arid and semiarid western North America, Global Change Biol., 18(3), 821–842.
AcknowledgmentsThis study was supported by the U.S.Department of the Interior Bureau ofReclamation through the Glen CanyonDam Adaptive Management Program,with logistical and managerial supportfrom the U.S. Geological Survey GrandCanyon Monitoring and ResearchCenter. Mention of trade names orcommercial products in this publicationis solely for the purpose of providingspecific information and does not implyrecommendation or endorsement bythe U.S. Geological Survey. Data used inthis paper are freely available from theauthors, from the U.S. Geological SurveyGrand Canyon Monitoring and ResearchCenter (doi:10.5066/F7J67F0P; http://sbsc.wr.usgs.gov/geospatial/Data/USGS_2015_JSankey_Riparian_Vegeta-tion_And_Colorado_River.zip; https://www.sciencebase.gov/catalog/item/5575b3c1e4b08f9309d4bafc; http://www.gcmrc.gov/), from references, andurl links cited in this manuscript. Wethank Charles Yackulic, Tom Gushue,and Terry Arundel for their helpfuladvice on data analysis and manage-ment. We thank Mark Dixon, AlanKasprak, Daniel Sarr, one anonymousreviewer, and the Associate Editor fortheir constructive reviews that greatlyimproved the manuscript.
Journal of Geophysical Research: Biogeosciences 10.1002/2015JG002991
SANKEY ET AL. VEGETATION, COLORADO RIVER, AND CLIMATE 1546
http://sbsc.wr.usgs.gov/geospatial/Data/USGS_2015_JSankey_Riparian_Vegetation_And_Colorado_River.zip
http://sbsc.wr.usgs.gov/geospatial/Data/USGS_2015_JSankey_Riparian_Vegetation_And_Colorado_River.zip
http://sbsc.wr.usgs.gov/geospatial/Data/USGS_2015_JSankey_Riparian_Vegetation_And_Colorado_River.zip
Perry, L. G., P. B. Shafroth, D. M. Blumenthal, J. A. Morgan, and D. R. LeCain (2013), Elevated CO2 does not offset greater water stress predictedunder climate change for native and exotic riparian plants, New Phytol., 197(2), 532–543.
Ralston, B. E., P. A. Davis, R. M. Weber, and J. M. Rundall (2008), A vegetation database for the Colorado River ecosystem from Glen CanyonDam to the western boundary of Grand Canyon National Park, Arizona, U.S. Geol. Surv. Open File Rep., 2008–1216, 37 pp.
Rubin, D. M., J. C. Schmidt, and J. N. Moore (1990), Origin, structure, and evolution of a reattachment bar, Colorado River, Grand Canyon,Arizona, J. Sediment. Petrol., 60(6), 982–991.
Schmidt, J. C., and D. M. Rubin (1995), Regulated streamflow, fine-grained deposits, and effective discharge in canyons with abundantdebris fans, in Natural and Anthropogenic Influences in Fluvial Geomorphology, Geophys. Monogr. Ser., vol. 89, edited by J. E. Costa et al.,pp. 177–195, AGU, Washington, D. C.
Schmidt, J. C., and J. B. Graf (1990), Aggradation and degradation of alluvial sand deposits, 1965–1986, Colorado River, Grand CanyonNational Park, Arizona, U.S. Geol. Surv. Prof. Pap., 1493, 74 pp.
Schmidt, J. C., and P. E. Grams (2011a), The high flows—Physical science results, in Effects of Three High-flow Experiments on the Colorado RiverEcosystem Downstream From Glen Canyon Dam, Arizona, U.S. Geological Survey Circular, vol. 1366, edited by T. S. Melis, pp. 53–91,U.S. Geological Survey, Reston, Va.
Schmidt, J. C., and P. E. Grams (2011b), Understanding physical processes of the Colorado River, in Effects of Three High-flow Experiments on theColorado River Ecosystem Downstream From Glen Canyon Dam, Arizona, edited by T. S. Melis, pp. 17–51, U.S. Geological Survey, Reston, Va.
Schmidt, J. C., and P. R. Wilcock (2008), Metrics for assessing the downstream effects of dams, Water Resour. Res., 44, W04404,doi:10.1029/2006WR005092.
Schmidt, J. C., D. J. Topping, P. E. Grams, and J. E. Hazel, Jr. (2004), System-wide changes in the distribution of fine sediment in the ColoradoRiver corridor between Glen Canyon Dam and Bright Angel Creek, Arizona: Final report, final report to U.S. Geological Survey, GrandCanyon Monitoring and Research Center, 107 pp., Logan, Utah. [Available at http://www.gcmrc.gov/library/reports/Physical/Fine_Sed/Schmidt2004.pdf.]
Stephens, H. G., and E. M. Shoemaker (1987), In the Footsteps of John Wesley Powell: An Album of Comparative Photographs of the Green andColorado Rivers, 1871–72 and 1968, pp. 286, Johnson Books, Boulder, Colo.
Stevens, L. E., and G. L. Waring (1986), Effects of post-dam flooding on riparian substrates, vegetation, and invertebrate populations in theColorado River corridor in Grand Canyon, Arizona, 166 pp., final report to the Glen Canyon Environmental Studies, Bureau of Reclamation,Flagstaff, Ariz. [Available at http://www.gcmrc.gov/library/reports/GCES/Stevens1986.pdf.]
Stevens, L. E., J. C. Schmidt, T. J. Ayers, and B. T. Brown (1995), Flow regulation, geomorphology, and Colorado River marsh development inthe Grand Canyon, Arizona, Ecol. Appl., 5(4), 1025–1039.
Stromberg, J. C., V. C. Beauchamp, M. D. Dixon, S. J. Lite, and C. Paradzick (2007), Importance of low-flow and high-flow characteristics torestoration of riparian vegetation along rivers in arid south-western United States, Freshwater Biol., 52(4), 651–679.
Topping, D. J., D. M. Rubin, and L. E. Vierra Jr. (2000), Colorado River sediment transport: 1. Natural sediment supply limitation and theinfluence of the Glen Canyon Dam, Water Resour. Res., 36(2), 515–542, doi:10.1029/1999WR900285.
Topping, D. J., J. C. Schmidt, and L. E. Vierra (2003), Computation and analysis of the instantaneous-discharge record for the Colorado River atLees Ferry, Arizona: May 8, 1921, through September 30, 2000, U.S. Geol. Surv. Prof. Pap., 1677, 118 pp.
Turner, R. M., and M. M. Karpiscak (1980), Recent vegetation changes along the Colorado River between Glen Canyon Dam and Lake Mead,Arizona, U.S. Geol. Surv. Prof. Pap., 1132, 125 pp.
U.S. Department of the Interior (1996), Record of Decision, Operation of Glen Canyon Dam: Final Environmental Impact Statement, pp. 15, Officeof the Secretary of the Interior, Bureau of Reclamation, Washington, D. C.
U.S. Department of the Interior (2012), Colorado River Basin Water Supply and Demand Study: Executive Summary, 28 pp., Office of theSecretary of the Interior, Bureau of Reclamation, Washington, D. C.
Waring, G. L. (1995), Current and historical riparian vegetation trends in Grand Canyon, using multitemporal remote sensing analyses of GISsites: Final report, final report to Bureau of Reclamation, Glen Canyon Environmental Studies, and National Park Service, 24 pp., NorthernArizona Univ., Flagstaff, Ariz. [Available at http://www.gcmrc.gov/library/reports/GCES/Biological/Terrestrial/Waring1996.pdf.]
Webb, R. H. (1996), Grand Canyon, A Century of Change: Rephotography of the 1889–1890 Stanton Expedition, 290 pp., Univ. of Arizona Press,Tucson.
Webb, R. H., and S. A. Leake (2006), Ground-water surface-water interactions and long-term change in riverine riparian vegetation in thesouthwestern United States, J. Hydrol., 320(3–4), 301–323.
Webb, R. H., D. L. Wegner, E. D. Andrews, R. A. Valdez, and D. T. Patten (1999), Downstream effects of Glen Canyon Dam in Grand Canyon: Areview, in The Controlled Flood in Grand Canyon, Geophys. Monogr. Ser., vol. 110, edited by R. H. Webb et al., pp. 1–21, AGU, Washington, D. C.
White, M. A., J. C. Schmidt, and D. J. Topping (2005), Application of wavelet analysis for monitoring hydrologic effects of dam operation: GlenCanyon Dam and the Colorado River at Lees Ferry, Arizona, River Res. Appl., 21, 551–565.
Williams, G. P., and Wolman, M. G. (1984), Downstream effects of dams on alluvial rivers, U.S. Geol. Surv. Prof. Pap., 1286, 83 pp. [Available athttp://pubs.er.usgs.gov/usgspubs/pp/pp1286.]
Woodhouse, C. A., D. M. Meko, G. M. MacDonald, D. W. Stahle, and E. R. Cook (2010), A 1,200-year perspective of 21st century drought insouthwestern North America, Proc. Natl. Acad. Sci. U.S.A., 107(50), 21,283–21,288.
Wright, S. A., J. C. Schmidt, T. S. Melis, D. J. Topping, and D. M. Rubin (2008), Is there enough sand? Evaluating the fate of Grand Canyonsandbars, GSA Today, 18(8), 4–10.
Journal of Geophysical Research: Biogeosciences 10.1002/2015JG002991
SANKEY ET AL. VEGETATION, COLORADO RIVER, AND CLIMATE 1547
Related Documents