Katalog BPS : 3201013 BADAN PUSAT STATISTIK RINGKASAN EKSEKUTIF PENGELUARAN DAN KONSUMSI PENDUDUK INDONESIA Survei Sosial Ekonomi Nasional Berdasarkan Hasil Susenas Maret 2012 Based on Susenas March 2012 Executive Summary of Consumption and Expenditure of Indonesia National Socio-Economic Survey http://www.bps.go.id

Welcome message from author
This document is posted to help you gain knowledge. Please leave a comment to let me know what you think about it! Share it to your friends and learn new things together.
Transcript
Katalog BPS : 3201013
BADAN PUSAT STATISTIK
RINGKASAN EKSEKUTIF PENGELUARAN DAN KONSUMSIPENDUDUK INDONESIA
Survei Sosial Ekonomi Nasional
Berdasarkan Hasil Susenas Maret 2012Based on Susenas March 2012
Executive Summary of Consumption and Expenditure of Indonesia
National Socio-Economic Survey
http
://www.b
ps.g
o.id

http
://www.b
ps.g
o.id
RINGKASAN EKSEKUTIF PENGELUARAN DAN KONSUMSIPENDUDUK INDONESIA
Berdasarkan Hasil Susenas Maret 2012Based on Susenas March 2012
Executive Summary of Consumption and Expenditure of Indonesia
Survei Sosial Ekonomi NasionalNational Socio-Economic Survey
http
://www.b
ps.g
o.id
RINGKASAN EKSEKUTIF PENGELUARAN DAN KONSUMSI PENDUDUK INDONESIA
Berdasarkan Hasil Susenas Maret 2012Based on Susenas March 2012
ISSN: 2089-2438 No. Publikasi: 04210.1208 Katalog BPS: 3201013Ukuran Buku: 17 cm x 24 cm
Naskah:Subdirektorat Statistik Rumah Tangga
Gambar Kulit :Sub Direktorat Publikasi dan Kompilasi Statistik
Diterbitkan oleh:Badan Pusat Statistik, Jakarta-Indonesia
Dicetak oleh:
Boleh dikutip dengan menyebut sumbernya
Executive Summary of Consumption and Expenditure of Indonesia
http
://www.b
ps.g
o.id
KATA PENGANTAR ______________________________________________________________
Survei Sosial Ekonomi Nasional (Susenas) merupakan salah satu survei yang diselenggarakan oleh BPS setiap tahun. Data yang dihasilkan Susenas berupa data berbagai aspek sosial ekonomi dan pemenuhan kebutuhan hidup seperti sandang, pangan, papan, pendidikan, kesehatan, keamanan dan kesempatan kerja. Data tersebut sangat dibutuhkan oleh pemerintah sebagai informasi pencapaian hasil program pembangunan dan untuk mengetahui seberapa jauh program-program pembangunan yang diimplementasikan telah meningkatkan kesejahteraan masyarakat.
Seiring dengan meningkatnya frekuensi permintaan data konsumsi/pengeluaran rumah tangga untuk penghitungan estimasi angka kemiskinan dan kebutuhan lintas sektor, maka pengumpulan data konsumsi/pengeluaran rumah tangga mulai tahun 2011 dilaksanakan setiap triwulan.
Publikasi yang lebih rinci hasil Susenas Maret 2012 disajikan dalam tiga buku publikasi, yaitu Buku 1: Pengeluaran untuk Konsumsi Penduduk Indonesia, Buku 2: Konsumsi Kalori dan Protein Penduduk Indonesia dan Provinsi, dan Buku 3: Pengeluaran untuk Konsumsi Penduduk Indonesia dan Provinsi.
Kepada semua pihak yang telah ikut berpartisipasi dalam mewujudkan publikasi ini, baik langsung maupun tidak langsung, diucapkan terima kasih.
Jakarta, September 2012
KEPALA BADAN PUSAT STATISTIK REPUBLIK INDONESIA
Dr. Suryamin, M.Sc
http
://www.b
ps.g
o.id
PREFACE ______________________________________________________________
The National Socio-Economic Survey (Susenas) is one of the survey carried out by BPS every year. The result from Susenas are data on various aspecs of socio-economic and subsistence such as food, clothing, shelter, education, health, security, and employment. Such data are needed by the government as an information of the achievements of the development programs, and to find out what extent national development program has improve the public welfare. Along with the increasing frequency of the consumption/expenditure data demand for the calculation of poverty estimates and cross-sectoral needs, then the collection of data consumption/expenditure beginning in 2011 conducted every quarter. A more detailed publication of March 2012 Susenas is presented in three publications, namely book 1: Expenditure for Consumption of Indonesia, book 2: Consumption of Calorie and Protein of Indonesia and Province, and book 3: Expenditure for Consumption of Indonesia by Province. To all those who have participated, either directly or indirectly, in the endeavor to realize this publication, we would like to say thank you.
Jakarta, September 2012
BPS – STATISTICS INDONESIA
Dr. Suryamin, M.Sc Chief Statistician
http
://www.b
ps.g
o.id
DAFTAR ISI / CONTENTS _____________________________________________________________
Umum / General 1
Tujuan / Objective 2
Cakupan / Coverage 3
Penjelasan Teknis / Technical Explanation 3
Pengeluaran Rumah Tangga / Household Expenditure 6
Konsumsi per Kapita Beberapa Komoditi Pokok / 13 Consumption per Capita of Some Commodities
Konsumsi Kalori dan Protein / Consumption of Calorie And Protein 17
Distribusi Pendapatan / Income Distribution 24
Tabel-Tabel Lampiran / Appendix Tables 33
http
://www.b
ps.g
o.id

http
://www.b
ps.g
o.id
___________________________________________________________________________________________________
Ringkasan Eksekutif Hasil Survei Sosial Ekonomi Nasional Maret 2012 -------------------------------------------------------------- 1
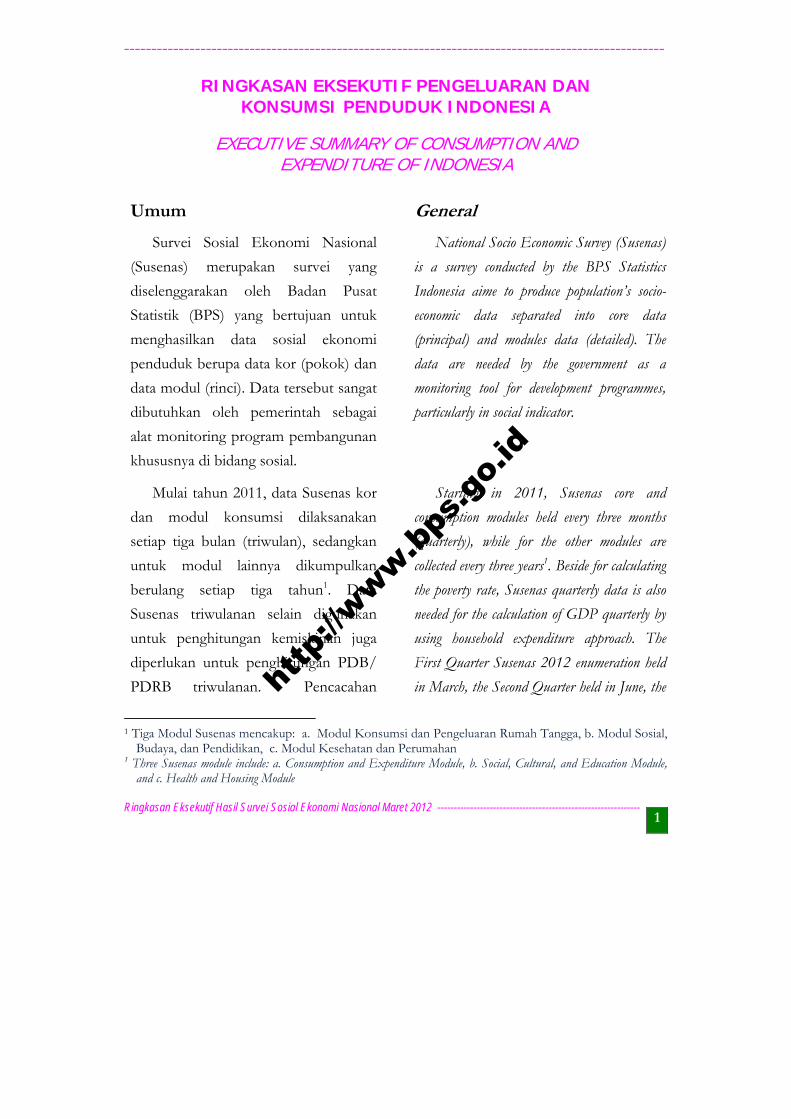
RINGKASAN EKSEKUTIF PENGELUARAN DAN KONSUMSI PENDUDUK INDONESIA
EXECUTIVE SUMMARY OF CONSUMPTION AND EXPENDITURE OF INDONESIA
Umum General
Survei Sosial Ekonomi Nasional
(Susenas) merupakan survei yang
diselenggarakan oleh Badan Pusat
Statistik (BPS) yang bertujuan untuk
menghasilkan data sosial ekonomi
penduduk berupa data kor (pokok) dan
data modul (rinci). Data tersebut sangat
dibutuhkan oleh pemerintah sebagai
alat monitoring program pembangunan
khususnya di bidang sosial.
National Socio Economic Survey (Susenas)
is a survey conducted by the BPS Statistics
Indonesia aime to produce population’s socio-
economic data separated into core data
(principal) and modules data (detailed). The
data are needed by the government as a
monitoring tool for development programmes,
particularly in social indicator.
Mulai tahun 2011, data Susenas kor
dan modul konsumsi dilaksanakan
setiap tiga bulan (triwulan), sedangkan
untuk modul lainnya dikumpulkan
berulang setiap tiga tahun1. Data
Susenas triwulanan selain digunakan
untuk penghitungan kemiskinan juga
diperlukan untuk penghitungan PDB/
PDRB triwulanan. Pencacahan
Starting in 2011, Susenas core and
consumption modules held every three months
(quarterly), while for the other modules are
collected every three years1. Beside for calculating
the poverty rate, Susenas quarterly data is also
needed for the calculation of GDP quarterly by
using household expenditure approach. The
First Quarter Susenas 2012 enumeration held
in March, the Second Quarter held in June, the
1 Tiga Modul Susenas mencakup: a. Modul Konsumsi dan Pengeluaran Rumah Tangga, b. Modul Sosial,
Budaya, dan Pendidikan, c. Modul Kesehatan dan Perumahan 1 Three Susenas module include: a. Consumption and Expenditure Module, b. Social, Cultural, and Education Module,
and c. Health and Housing Module
http
://www.b
ps.g
o.id
__________________________________________________________________________________________________
---------------------------------------------------------- Executive Summary of the March 2012 National Socio-Economic Survey 2
Jumlah sampel Susenas Maret 2012 sebanyak 75 000 rumah tangga
Sample size of the March 2012 Susenas is 75 000 households
Susenas 2012 Triwulan I dilaksanakan
pada Maret, Triwulan II pada Juni,
Triwulan III pada September dan
Triwulan IV pada Desember 2012.
Third Quarter held in September, and the
Fourth Quarter held in December 2012.
Jumlah sampel setiap triwulan
adalah sebanyak 75 000 rumah tangga.
Jumlah sampel Susenas Maret 2012
dapat disajikan baik pada tingkat
nasional maupun provinsi dan dapat
dibedakan menurut perkotaan dan
perdesaan. Dalam buku ini, disajikan
hasil-hasil Susenas Triwulan I 2012
disebut Susenas Maret 2012.
The samples size of each quarter as many
as 75 000 households. Number of samples the
March 2012 Susenas can be disseminated both
at national and provincial levels and can be
disaggregated by urban-rural classification
(urban and rural). In this book, presented the
First Quarter Susenas 2012 called March
2012 Susenas.
Tujuan Objective
Tujuan penyusunan buku ini adalah
menyajikan data hasil Susenas Maret
2012 dalam bentuk ulasan dan grafik
serta tabel yang lebih ringkas untuk
memudahkan pengguna data dalam
memahami data-data pokok yang
dihasilkan. Tabel yang lebih rinci juga
disajikan pada lampiran, yaitu data
The purpose of this book is to disseminate
data of the March 2012 Susenas in analysis,
graphs, and tables to ease data users in
understanding the generated basic data. More
detailed tables are also presented in the
appendix. ht
tp://w
ww.bps
.go.
id
___________________________________________________________________________________________________
Ringkasan Eksekutif Hasil Survei Sosial Ekonomi Nasional Maret 2012 -------------------------------------------------------------- 3
konsumsi per kelompok barang dan
pengeluaran menurut provinsi.
Cakupan Coverage
Pembahasan hasil Susenas Maret
2012 dalam publikasi ini dibagi menjadi
beberapa pokok bahasan yaitu
pengeluaran rumah tangga, konsumsi
per kapita beberapa komoditas pokok,
konsumsi kalori dan protein, dan
distribusi pengeluaran.
Pembahasan juga di lengkapi
dengan data bulan Maret 2011 sebagai
pembanding untuk melihat
perkembangannya. Untuk melihat
keterbandingan antar daerah, beberapa
data dan ulasan disajikan menurut
provinsi.
The results of the March 2012 Susenas in
this publication, is divided into several subjects
namely household expenditure, per capita
consumption of some staple commodities,
consumption of calories and protein, and income
distribution.
It is also equipped with data in March
2011 as a comparison to observe its
development. To observing comparison among
regions, some of the data and analysis are
presented by province.
Penjelasan Teknis Technical Explanation
Konsumsi rumah tangga yang
dicakup dalam Susenas Maret 2012
dibedakan atas konsumsi makanan dan
bukan makanan tanpa memperhatikan
asal barang baik berasal dari pembelian,
produksi sendiri maupun pemberian.
Untuk pengeluaran rumah tangga
terbatas pada pengeluaran untuk
kebutuhan rumah tangga saja, tidak
The household consumption covered by the
March 2012 Susenas, was distinguished into
consumption of food and non food, regardless
source of the goods whether from purchases, own
production or gift. Meanwhile, household
expenditure is focused on household needs only,
excluding expenses for business purposes or for
other parties
http
://www.b
ps.g
o.id
__________________________________________________________________________________________________
---------------------------------------------------------- Executive Summary of the March 2012 National Socio-Economic Survey 4
termasuk pengeluaran untuk keperluan
usaha atau yang diberikan kepada pihak
lain.
Data konsumsi/pengeluaran untuk konsumsi makanan dirinci menjadi 215 komoditi, masing-masing dikumpulkan data kuantitas dan nilainya. Sedangkan
untuk konsumsi bukan makanan pada umumnya yang dikumpulkan hanya data nilainya, kecuali untuk beberapa jenis pengeluaran tertentu, seperti
penggunaan listrik, air, gas, dan bahan bakar minyak (BBM), yang juga dikumpulkan kuantitasnya.
The consumption/expenditure for food consumption are divided into 215 commodities, completed with quantity and value data. However the data on non food consumption are
collected with values data only, except for some specific types of expenditures, such as on electricity, water, gas and fuel oil, are also collected its quantity.
Pengeluaran untuk konsumsi
makanan dihitung selama seminggu
terakhir, sedangkan konsumsi bukan makanan sebulan dan 3 (tiga) bulan terakhir. Pengeluaran konsumsi
makanan maupun bukan makanan
(pengeluaran tiga bulan) selanjutnya dikonversikan ke dalam pengeluaran rata-rata sebulan. Angka-angka
konsumsi/pengeluaran rata-rata per
kapita yang disajikan dalam publikasi ini diperoleh dari hasil bagi jumlah konsumsi seluruh rumah tangga (baik
konsumsi makanan maupun bukan
makanan) terhadap jumlah penduduk.
Expenditures of food consumption is
calculated during the last week, while the
consumption of non food during the last month and the last 3 (three) months. The consumption expenditure on both food and non food are
converted into monthly average expenditure. The
figures of average consumption expenditure per capita presented in this publication is obtained by dividing the total consumption of all
households (both food and non food
consumption) with the total population.
http
://www.b
ps.g
o.id
___________________________________________________________________________________________________
Ringkasan Eksekutif Hasil Survei Sosial Ekonomi Nasional Maret 2012 -------------------------------------------------------------- 5
Data konsumsi kalori dan protein
yang disajikan merupakan hasil
konversi zat gizi yang berpedoman
pada beberapa sumber, yaitu
The consumption data of calorie and
protein represents the conversion result of
nutrients based on several sources, namely:
1. Daftar Komposisi Bahan Makanan,
Direktorat Gizi - Departemen
Kesehatan, 1981;
1. List of Food Stuff Composition,
Directorate of Nutrition - Ministry of
Health, 1981;
2. Daftar Komposisi Zat Gizi Pangan
Indonesia, Departemen Kesehatan,
1995;
2. List of Nutrient Substance Composition of
Indonesia Food Nutrition, Ministry of
Health, 1995;
3. Daftar Kandungan Gizi Bahan
Makanan (berdasarkan hasil print-
out), Puslitbang Gizi-Bogor, 1996.
3. List of Food Stuff Nutrition (based on a
print-out), Center for Research and
Development of Nutrition, Bogor Ministry
of Health, 1996
Faktor konversi untuk nama makanan jadi yang digunakan tidak semuanya tersedia. Oleh karena itu dibuat perkiraan dari makanan sejenis yang tersedia konversinya (Lampiran Tabel 7).
The conversion factors are not all available for the prepared food. Therefore similar estimates are made from the available food conversion (Annex Table 7).
Pengeluaran makanan dihitung seminggu terakhir. Pengeluaran bukan makanan dihitung sebulan dan tiga bulan terakhir
Expenditure for food was calculated for past week while for non food for past month and past three months
http
://www.b
ps.g
o.id
__________________________________________________________________________________________________
---------------------------------------------------------- Executive Summary of the March 2012 National Socio-Economic Survey 6
Pengeluaran Rumah Tangga Household Expenditure
Data pengeluaran (dalam rupiah) yang dibedakan menurut kelompok makanan dan bukan makanan dapat digunakan untuk melihat pola pengeluaran penduduk. Berdasarkan data pengeluaran (sebagai proksi data pendapatan) dapat pula dihitung tingkat ketimpangan pendapatan penduduk di suatu wilayah.
Expenditure data (in rupiahs) by food and non food groups can be used to observe the population expenditure pattern. Based on the expenditure data (as proxy of income data), it can also be calculated inequality of population-level income in certain area.
Pada kondisi pendapatan terbatas, pemenuhan kebutuhan makanan akan menjadi prioritas utama, sehingga pada kelompok masyarakat berpendapatan rendah akan terlihat bahwa sebagian besar pendapatannya digunakan untuk membeli makanan. Seiring dengan peningkatan pendapatan maka lambat laun akan terjadi pergeseran pola pengeluaran, yaitu penurunan porsi pendapatan yang dibelanjakan untuk makanan dan peningkatan porsi pendapatan yang dibelanjakan untuk bukan makanan.
In the condition of limited incomes, food needs
fulfillment will be a top priority, so that in low-
income household groups tend to allocate most of
their income for buying food. Along with
increasing the revenue, apparently it will gradually
shift in expenditure patterns decreasing share of
income spent on food and increasing portion of
income spent on non food.
Pola pengeluaran dapat digunakan sebagai salah satu alat untuk menilai tingkat kesejahteraan (ekonomi) penduduk, dimana semakin rendah persentase pengeluaran untuk makanan terhadap total pengeluaran maka semakin baik tingkat perekonomian
Expenditure patterns can be used as a tool to identify population welfare (economic) level where the lower the percentage of food expenditure compared to total expenditure, the better economic level of the population. Ernst Engel (1857) stated that in the condition of indifferent taste, as income increase then
http
://www.b
ps.g
o.id
___________________________________________________________________________________________________
Ringkasan Eksekutif Hasil Survei Sosial Ekonomi Nasional Maret 2012 -------------------------------------------------------------- 7
penduduk. Seperti hukum yang dikemukakan oleh Ernst Engel (1857) bahwa bila selera tidak berbeda maka persentase pengeluaran untuk makanan menurun seiring dengan meningkatnya pendapatan, hukum ini ditemukan Engel dari perangkat data survei pendapatan dan pengeluaran.
percentage of food expenditure would decrease, this law was found by Engel based on the income and expenditure survey data.
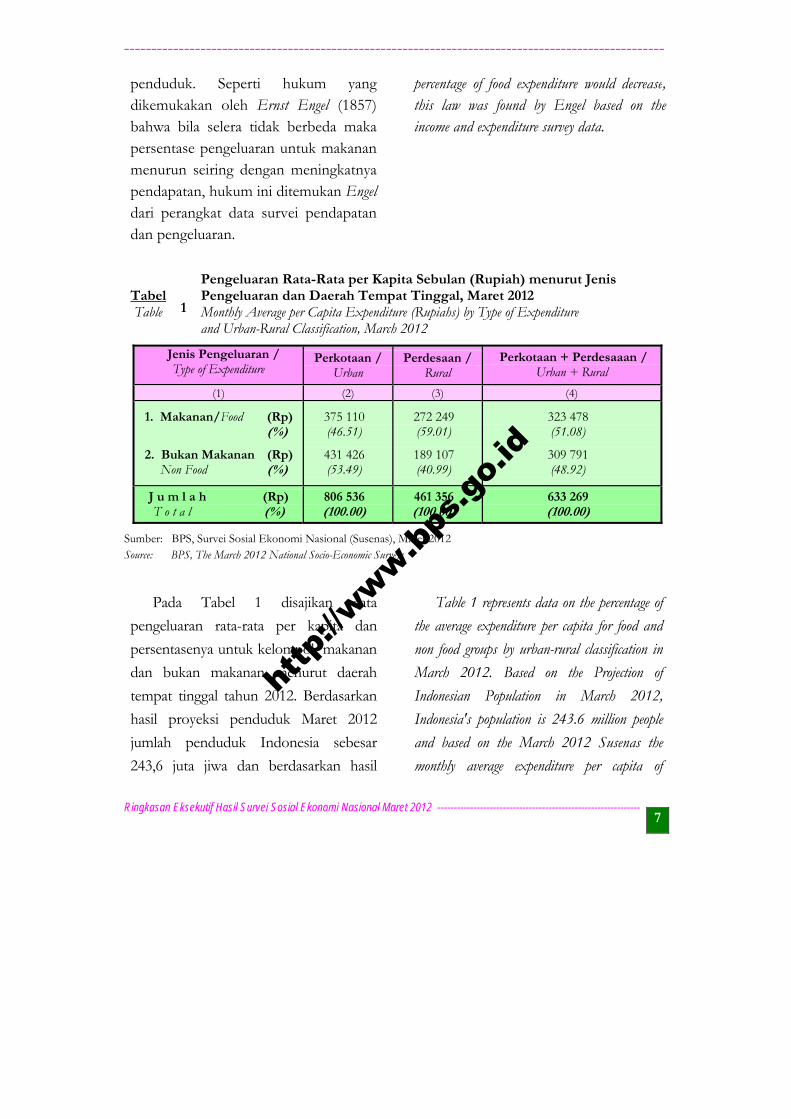
Tabel 1
Pengeluaran Rata-Rata per Kapita Sebulan (Rupiah) menurut Jenis Pengeluaran dan Daerah Tempat Tinggal, Maret 2012
Table Monthly Average per Capita Expenditure (Rupiahs) by Type of Expenditure and Urban-Rural Classification, March 2012
Jenis Pengeluaran / Type of Expenditure
Perkotaan / Urban
Perdesaan / Rural
Perkotaan + Perdesaaan / Urban + Rural
(1) (2) (3) (4)
1. Makanan/Food (Rp) (%)
2. Bukan Makanan (Rp) Non Food (%)
375 110 (46.51)
431 426 (53.49)
272 249 (59.01)
189 107 (40.99)
323 478 (51.08)
309 791 (48.92)
J u m l a h (Rp) T o t a l (%)
806 536 (100.00)
461 356 (100.00)
633 269 (100.00)
Sumber: BPS, Survei Sosial Ekonomi Nasional (Susenas), Maret 2012 Source: BPS, The March 2012 National Socio-Economic Surveys
Pada Tabel 1 disajikan data
pengeluaran rata-rata per kapita dan
persentasenya untuk kelompok makanan
dan bukan makanan menurut daerah
tempat tinggal tahun 2012. Berdasarkan
hasil proyeksi penduduk Maret 2012
jumlah penduduk Indonesia sebesar
243,6 juta jiwa dan berdasarkan hasil
Table 1 represents data on the percentage of
the average expenditure per capita for food and
non food groups by urban-rural classification in
March 2012. Based on the Projection of
Indonesian Population in March 2012,
Indonesia's population is 243.6 million people
and based on the March 2012 Susenas the
monthly average expenditure per capita of
http
://www.b
ps.g
o.id
__________________________________________________________________________________________________
---------------------------------------------------------- Executive Summary of the March 2012 National Socio-Economic Survey 8
Susenas Maret 2012 pengeluaran rata-
rata per kapita sebulan penduduk
Indonesia sebesar 633 269 rupiah.
Sebesar 323 478 rupiah atau 51,08
persen dari pengeluaran digunakan untuk
kebutuhan makanan dan sisanya sebesar
309 791 rupiah atau 48,92 persen
digunakan untuk kebutuhan bukan
makanan.
Indonesia's population was 633 269 rupiahs.
A sum of 323 478 rupiahs or 51.08 percent of
the expenditures was used for fulfilling food needs
and the rest of 309 791 rupiahs or 48.92
percent was used for non food needs.
Bila dilihat menurut daerah tempat tinggal, persentase pengeluaran penduduk di perkotaan cenderung sudah beralih ke kebutuhan sekunder/tersier (bukan makanan), dimana persentase untuk makanan hanya sebesar 46,51 persen, jauh lebih rendah dibandingkan di daerah perdesaan dengan persentase sebesar 59,01 persen. Hal ini dapat menunjukkan bahwa tingkat kesejahteraan penduduk di daerah perkotaan lebih baik jika dibandingkan dengan di perdesaan.
By urban-rural classification, percentage of population expenditure in urban areas tend to shift to the secondary/tertiary (non food) needs, which the percentage for food only at 46.51 percent, far lower than in rural areas with percentage of 59.01 percent. This may indicate that the level of welfare of population in urban areas is better than in rural areas.
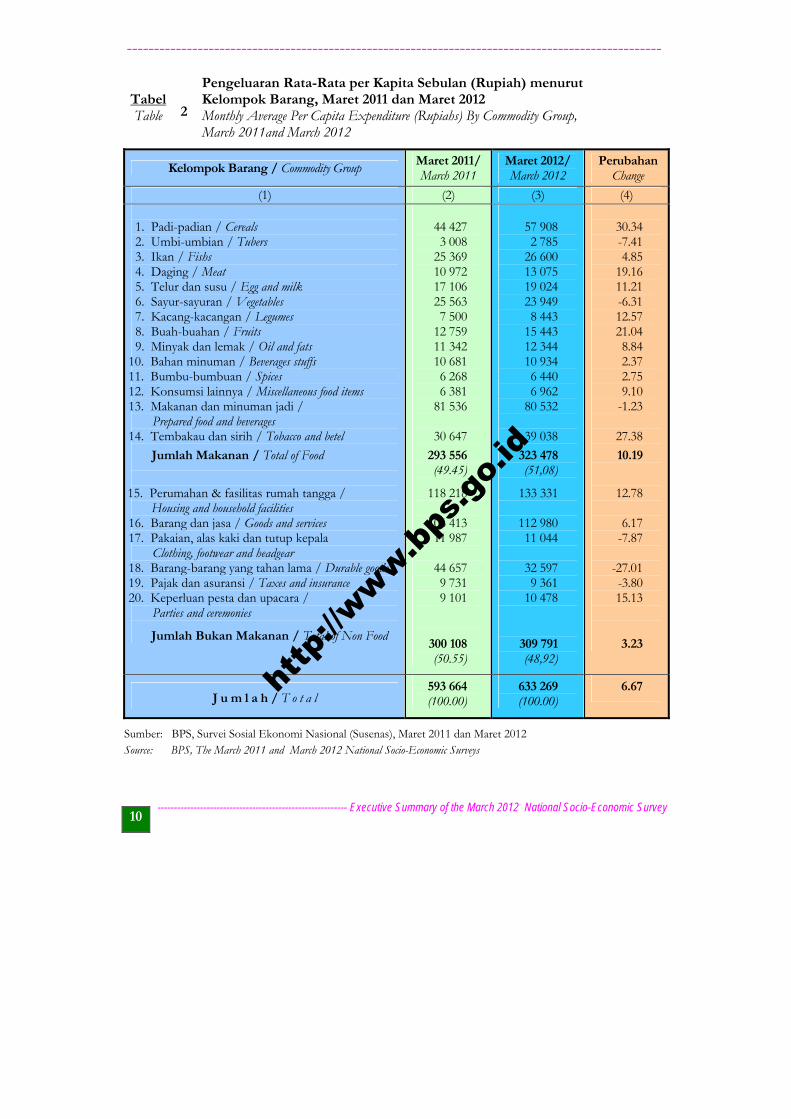
Pengeluaran rata-rata per kapita menurut kelompok barang tahun 2011 dan 2012 dapat dilihat pada Tabel 2. Peningkatan pengeluaran pada periode
The average expenditure per capita by commodity group in 2011 and 2012 are shown in Table 2. Increasing of expenditure in the period of 2011-2012 occurred almost in
Berdasarkan data pola pengeluaran, penduduk perkotaan lebih sejahtera dibandingkan penduduk perdesaan
Based on the pattern of expenditure data at the level of welfare of population in urban areas is better than in rural areas
http
://www.b
ps.g
o.id
___________________________________________________________________________________________________
Ringkasan Eksekutif Hasil Survei Sosial Ekonomi Nasional Maret 2012 -------------------------------------------------------------- 9
2011-2012 terjadi di hampir semua kelompok makanan kecuali umbi-umbian, sayur-sayuran, serta makanan dan minuman jadi. Pada kelompok bukan makanan hanya sebagian yang mengalami penurunan yaitu pakaian/alas kaki/tutup kepala, barang-barang tahan lama, dan pajak dan asuransi.
all groups of foods unless tubers, vegetables, and prepared food and beverages. Only half of non food group having decreased namely clothing, footwear, and headgear, durable goods, and taxes and insurance.
Pengeluaran rata-rata per kapita sebulan tahun 2012 mengalami peningkatan sebesar 6,67 persen dibanding tahun 2011. Pada kelompok makanan peningkatan terjadi sebesar 10,19 persen dan pada kelompok bukan makanan hanya sebesar 3,23 persen.
The monthly average expenditure per capita in March 2012 increased 6.67 percent compared to the March 2011. In the food group the increasing was 10.19 percent and in non food group increasing was 3.23 percent.
Pengeluaran penduduk meningkat hampir pada semua kelompok barang kecuali umbi-umbian, sayur-sayuran, dan makanan dan minuman jadi, serta pakaian, alas
kaki dan tutup kepala, barang tahan lama, dan pajak dan asuransi.
Population expenditure inclined in nearly all commodity groups except for tubers, vegetables, and prepared food and beverages, as well as clothing, footwear and
headgear, durable goods, and taxes and insurance.
http
://www.b
ps.g
o.id
__________________________________________________________________________________________________
---------------------------------------------------------- Executive Summary of the March 2012 National Socio-Economic Survey 10
Tabel 2
Pengeluaran Rata-Rata per Kapita Sebulan (Rupiah) menurut Kelompok Barang, Maret 2011 dan Maret 2012
Table Monthly Average Per Capita Expenditure (Rupiahs) By Commodity Group, March 2011and March 2012
Kelompok Barang / Commodity Group Maret 2011/ March 2011
Maret 2012/ March 2012
Perubahan Change
(1) (2) (3) (4) 1. Padi-padian / Cereals 2. Umbi-umbian / Tubers 3. Ikan / Fishs 4. Daging / Meat 5. Telur dan susu / Egg and milk 6. Sayur-sayuran / Vegetables 7. Kacang-kacangan / Legumes 8. Buah-buahan / Fruits 9. Minyak dan lemak / Oil and fats 10. Bahan minuman / Beverages stuffs 11. Bumbu-bumbuan / Spices 12. Konsumsi lainnya / Miscellaneous food items 13. Makanan dan minuman jadi / Prepared food and beverages 14. Tembakau dan sirih / Tobacco and betel
Jumlah Makanan / Total of Food
15. Perumahan & fasilitas rumah tangga /
Housing and household facilities 16. Barang dan jasa / Goods and services 17. Pakaian, alas kaki dan tutup kepala Clothing, footwear and headgear 18. Barang-barang yang tahan lama / Durable goods 19. Pajak dan asuransi / Taxes and insurance 20. Keperluan pesta dan upacara / Parties and ceremonies
Jumlah Bukan Makanan / Total of Non Food
44 427 3 008
25 369 10 972 17 106 25 563 7 500
12 759 11 342 10 681 6 268 6 381
81 536
30 647
293 556 (49.45)
118 218
106 413 11 987
44 657 9 731 9 101
300 108 (50.55)
57 908 2 785
26 600 13 075 19 024 23 949 8 443
15 443 12 344 10 934 6 440 6 962
80 532
39 038
323 478 (51,08)
133 331
112 980 11 044
32 597 9 361
10 478
309 791 (48,92)
30.34 -7.41 4.85
19.16 11.21 -6.31 12.57 21.04 8.84 2.37 2.75 9.10
-1.23
27.38
10.19
12.78
6.17 -7.87
-27.01 -3.80 15.13
3.23
J u m l a h / T o t a l 593 664 (100.00)
633 269 (100.00)
6.67
Sumber: BPS, Survei Sosial Ekonomi Nasional (Susenas), Maret 2011 dan Maret 2012 Source: BPS, The March 2011 and March 2012 National Socio-Economic Surveys
http
://www.b
ps.g
o.id
___________________________________________________________________________________________________
Ringkasan Eksekutif Hasil Survei Sosial Ekonomi Nasional Maret 2012 -------------------------------------------------------------- 11
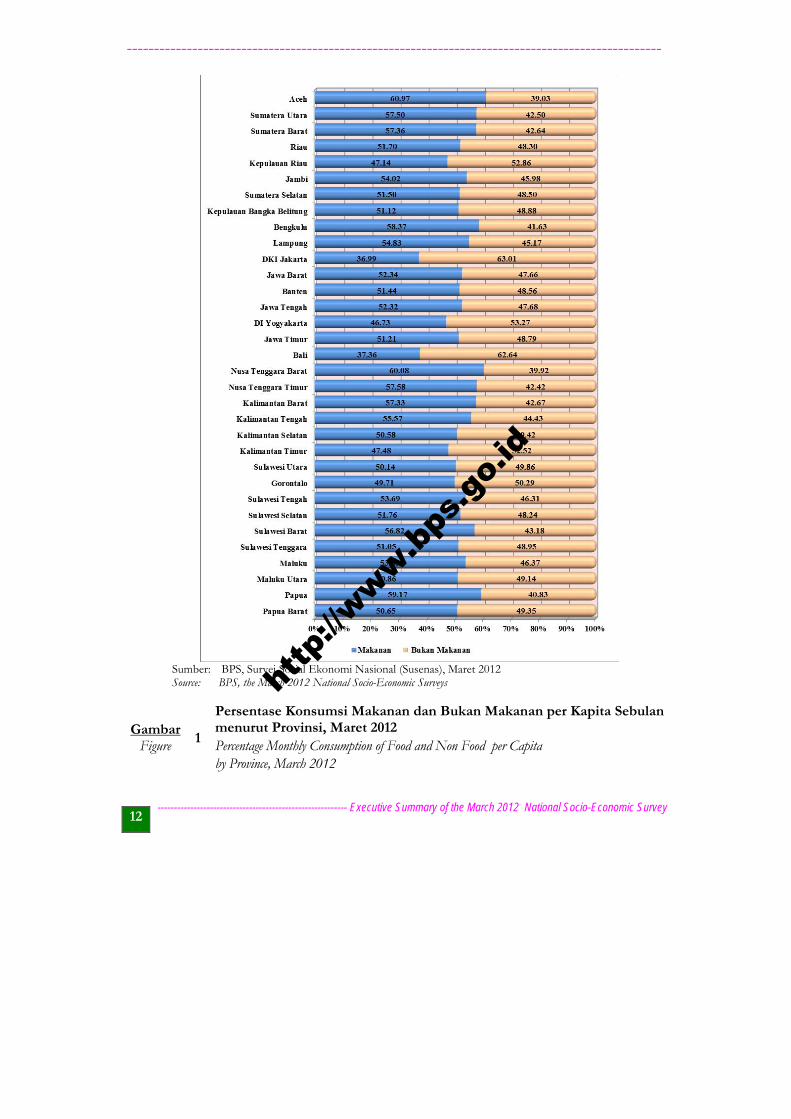
Pada tingkat provinsi terdapat variasi
komposisi pengeluaran untuk makanan
dan bukan makanan yang cukup tinggi.
Pada Gambar 1 dapat dilihat hanya ada 6
provinsi yang persentase pengeluaran
untuk makanannya di bawah 50 persen
yaitu Kepulauan Riau, DKI Jakarta, DI
Yogyakarta, Bali, Kalimantan Timur, dan
Gorontalo. Hal ini berarti bahwa
penduduk di 6 provinsi tersebut bila
dilihat dari pola pengeluarannya dapat
dikatakan lebih sejahtera dibandingkan
provinsi lainnya. Persentase pengeluaran
makanan terendah (tertinggi untuk
bukan makanan) terdapat di DKI
Jakarta, yaitu sebesar 36,99 persen pada
tahun 2012, sebaliknya persentase
pengeluaran makanan tertinggi (terendah
untuk bukan makanan) adalah Provinsi
Aceh, yaitu sebesar 60,97 persen.
The composition of expenditure for food and
non food varies at province level. In Figure 1 can
be shown that only 6 provinces having percentage
of food expenditure below 50 percent, i.e.
Kepulauan Riau, DKI Jakarta, DI
Yogyakarta, Bali, Kalimantan Timur, and
Gorontalo. This means that the population in
the 6 provinces, in terms of the pattern of
expenditure, were more prosperous than other
provinces. The lowest percentage of food
expenditure (the highest for non food) was in
DKI Jakarta, amounting of 36.99 percent in
March 2012 Susenas, while the highest
percentage of food expenditure (the lowest for non
food) was in Aceh, which is 60.97 percent.
Berdasarkan pola pengeluaran, terdapat 6 provinsi dengan tingkat kesejahteraan yang lebih baik dibandingkan provinsi lainnya
Based on expenditure patterns, there are 6 provinces of the welfare level is better than other provinces
http
://www.b
ps.g
o.id
__________________________________________________________________________________________________
---------------------------------------------------------- Executive Summary of the March 2012 National Socio-Economic Survey 12
Sumber: BPS, Survei Sosial Ekonomi Nasional (Susenas), Maret 2012 Source: BPS, the March 2012 National Socio-Economic Surveys
Gambar
1
Persentase Konsumsi Makanan dan Bukan Makanan per Kapita Sebulan menurut Provinsi, Maret 2012
Figure Percentage Monthly Consumption of Food and Non Food per Capita by Province, March 2012
http
://www.b
ps.g
o.id
___________________________________________________________________________________________________
Ringkasan Eksekutif Hasil Survei Sosial Ekonomi Nasional Maret 2012 -------------------------------------------------------------- 13
Konsumsi per Kapita Beberapa Komoditi Pokok
Per Capita Consumption of Several Food Items
Konsumsi rata-rata per kapita untuk
beberapa jenis bahan makanan penting
dapat dilihat pada Tabel 3. Pada periode
2011-2012 sebagian besar bahan
makanan penting mengalami penurunan
konsumsi. Namun demikian ada
beberapa komoditi yang mengalami
kenaikan seperti jagung pocelan/pipilan
naik sebesar 30,26 persen dan jenis
sayur-sayuran yaitu bawang merah (16,90
persen), bawang putih (18,71 persen),
cabe merah (10,63 persen), dan cabe
rawit (15,83 persen) serta minyak kelapa
sebesar 4,84 persen.
Weekly average of consumption per capita
for some several food items can be shown in
Table 3. In the 2011-2012, various foodstuffs
consumption mostly have dereased. However the
consumption of some commodities have risen such
as dry shelled corn rose (30.26 percent), and
kind of vegetables i.e., onion (16.90 percent),
garlic (18.71 percen), chilies (10.63 percent),
cayenne pepper (15.83 percent), and
coconut/maize/other frying oil (4.84 percent).
Penurunan konsumsi dengan persentase yang cukup besar terjadi pada komoditas susu bubuk kaleng/bayi yaitu sebesar 54,67 persen, ketela pohon sebesar 38,21 persen, dan gaplek sebesar 30,58 persen, sedangkan penurunan konsumsi kurang dari 5 persen terjadi pada komoditas beras lokal/ketan,
The decline consumption of by a large enough percentage occurred in commodity canned liquid milk that is equal to 54.67 percent, 38.21 percent for cassava and dried cassava by 30.58 percent, while decreasing the consumption of less than 5 percent occurred on rice, fresh corn with husk, canned fish and shrimp, and fermented soybean cake. There are
Hampir seluruh konsumsi bahan makanan mengalami penurunan sedangkan konsumsi jagung pocelan/pipilan, cabe, bawang, dan minyak kelapa mengalami
peningkatan
Nearly all the consumption of foods consumption has decreased while dry shelled corn, chilies, onions, and coconut/maize/other frying oil having increased
http
://www.b
ps.g
o.id
__________________________________________________________________________________________________
---------------------------------------------------------- Executive Summary of the March 2012 National Socio-Economic Survey 14
jagung basah berkulit, ikan dan udang diawetkan serta tempe. Ada dua bahan makanan pokok mengalami penurunan konsumsi lebih dari 20 persen yaitu kacang kedelai (21,81 persen) dan gula merah (26,69 persen).
two basic food consumption has decreased more than 20 percent of that is soybeans (21.81 percent) and sugar (26.69 percent).
Ada beberapa komoditi penting lainnya yang juga mengalami penurunan antara 10 sampai 20 persen yaitu ketela rambat, daging sapi/kerbau, susu kental manis, telur itik/manila, gula pasir, dan telur ayam ras/kampung.
There are several food items have also
declined from 10 to 20 percent that is sweet
potatoes, cow/buffalo meat, canned liquid
milk, duck salted egg, sugar, and chicken eggs.
Konsumsi beras lokal/ketan per kapita seminggu berdasarkan data Maret tahun 2012 sebesar 1,675 kg atau sekitar 86,14 kg dalam setahun (tidak termasuk beras/ketan yang berasal dari makanan jadi). Apabila dibandingkan dengan tahun sebelumnya konsumsi beras per kapita turun sebesar 2,63 persen. Hampir semua bahan makanan yang mengandung karbohidrat mengalami penurunan seperti beras lokal/ketan, jagung basah dengan kulit, ketela pohon, ketela rambat, dan gaplek, namun ada satu bahan makanan yang mengandung karbohidrat yang pada periode Maret 2012 ini justru mengalami kenaikan yang cukup besar yaitu jagung pocelan/ pipilan.
Consumption of rice per capita per week
based on data in March of 2012 at 1.675 kg,
or about 86.14 kg per year (not including rice
that comes from prepared food). Comparing to
a year before consumption per capita of rice fell
by 2.63 percent. Almost all foods containing
carbohydrates declined such as rice, fresh corn
with husk, cassava, sweet potatoes, and dried
cassava, but there is one food which contains
carbohydrates in the period of March 2012
increased significantly that is dry shelled corn.
http
://www.b
ps.g
o.id
___________________________________________________________________________________________________
Ringkasan Eksekutif Hasil Survei Sosial Ekonomi Nasional Maret 2012 -------------------------------------------------------------- 15
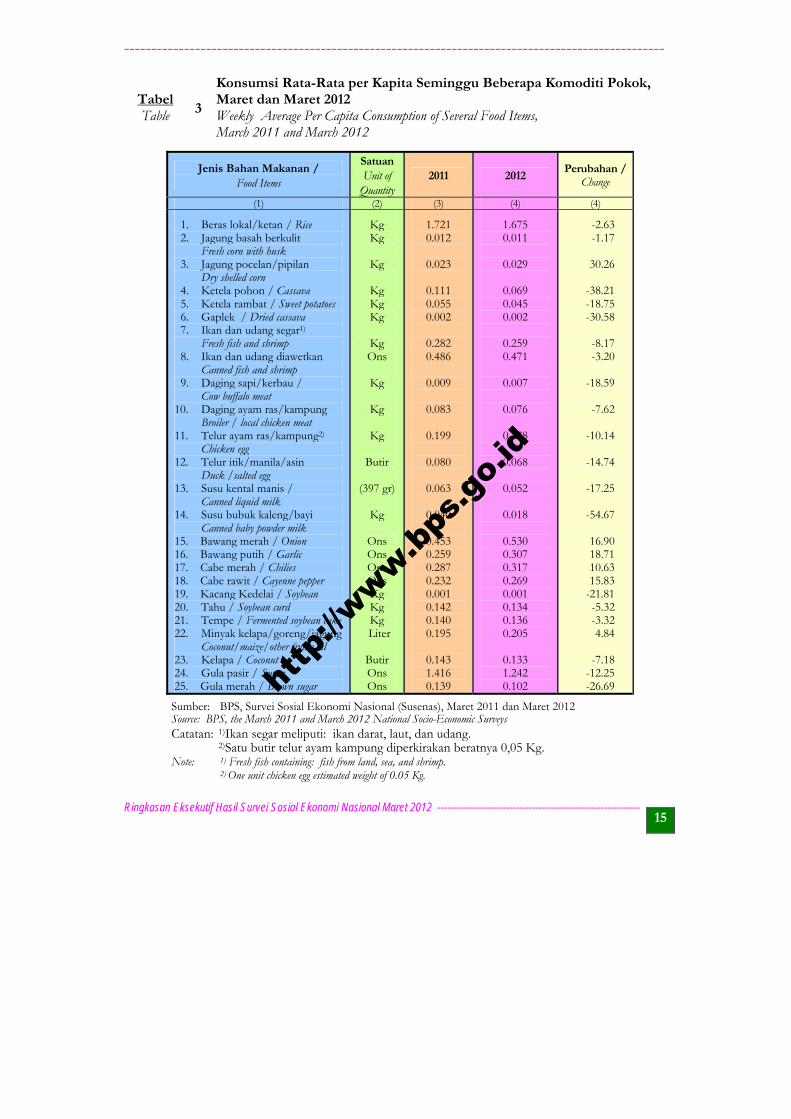
Tabel 3
Konsumsi Rata-Rata per Kapita Seminggu Beberapa Komoditi Pokok, Maret dan Maret 2012
Table Weekly Average Per Capita Consumption of Several Food Items, March 2011 and March 2012
Jenis Bahan Makanan / Food Items
Satuan Unit of
Quantity2011 2012
Perubahan / Change
(1) (2) (3) (4) (4)
1. Beras lokal/ketan / Rice 2. Jagung basah berkulit Fresh corn with husk 3. Jagung pocelan/pipilan Dry shelled corn 4. Ketela pohon / Cassava 5. Ketela rambat / Sweet potatoes 6. Gaplek / Dried cassava 7. Ikan dan udang segar1)
Fresh fish and shrimp 8. Ikan dan udang diawetkan Canned fish and shrimp 9. Daging sapi/kerbau / Cow buffalo meat 10. Daging ayam ras/kampung Broiler / local chicken meat 11. Telur ayam ras/kampung2) Chicken egg 12. Telur itik/manila/asin Duck /salted egg 13. Susu kental manis / Canned liquid milk 14. Susu bubuk kaleng/bayi Canned baby powder milk 15. Bawang merah / Onion 16. Bawang putih / Garlic 17. Cabe merah / Chilies 18. Cabe rawit / Cayenne pepper 19. Kacang Kedelai / Soybean 20. Tahu / Soybean curd 21. Tempe / Fermented soybean cake 22. Minyak kelapa/goreng/jagung Coconut/maize/other frying oil 23. Kelapa / Coconut 24. Gula pasir / Sugar 25. Gula merah / Brown sugar
Kg Kg
Kg
Kg Kg Kg
Kg Ons
Kg
Kg
Kg
Butir
(397 gr)
Kg
Ons Ons Ons Ons Kg Kg Kg Liter
Butir Ons Ons
1.721 0.012
0.023
0.111 0.055 0.002
0.282 0.486
0.009
0.083
0.199
0.080
0.063
0.040
0.453 0.259 0.287 0.232 0.001 0.142 0.140 0.195
0.143 1.416 0.139
1.675 0.011
0.029
0.069 0.045 0.002
0.259 0.471
0.007
0.076
0.178
0.068
0.052
0.018
0.530 0.307 0.317 0.269 0.001 0.134 0.136 0.205
0.133 1.242 0.102
-2.63 -1.17
30.26
-38.21 -18.75 -30.58
-8.17 -3.20
-18.59
-7.62
-10.14
-14.74
-17.25
-54.67
16.90 18.71 10.63 15.83
-21.81 -5.32 -3.32 4.84
-7.18
-12.25 -26.69
Sumber: BPS, Survei Sosial Ekonomi Nasional (Susenas), Maret 2011 dan Maret 2012 Source: BPS, the March 2011 and March 2012 National Socio-Economic Surveys Catatan: 1)Ikan segar meliputi: ikan darat, laut, dan udang.
2)Satu butir telur ayam kampung diperkirakan beratnya 0,05 Kg. Note: 1) Fresh fish containing: fish from land, sea, and shrimp.
2) One unit chicken egg estimated weight of 0.05 Kg.
http
://www.b
ps.g
o.id
__________________________________________________________________________________________________
---------------------------------------------------------- Executive Summary of the March 2012 National Socio-Economic Survey 16
Penurunan bahan makanan yang mengandung protein hewani yang harganya cukup tinggi seperti ikan dan udang, daging sapi/kerbau, daging ayam, telur dan susu ternyata tidak dibarengi dengan peningkatan konsumsi bahan makanan mengandung protein lainnya yang harganya cukup terjangkau yaitu tahu dan tempe. Pada periode ini terjadi pengurangan konsumsi protein baik kualitas maupun kuantitas.
The decline of foods containing animal protein whose price is quite expensive such as fish and shrimp, cow/buffalo meat, chicken, eggs and milk was not accompanied by the increased consumption of foods containing protein which is quite cheap such as fermented soybean cake and tofu. Period of March 2012 there was a reduction in the consumption of protein both in quality and quantity.
Konsumsi tahu dan tempe yang merupakan “makanan rakyat” dan mengandung bahan protein nabati yang utama bagi sebagian besar penduduk Indonesia juga mengalami penurunan. Konsumsi tahu turun sebesar 5,32 persen yaitu dari 0,142 kg menjadi 0,134 kg per minggu. Konsumsi tempe juga mengalami penurunan yakni sebesar 3,32 persen yaitu dari 0,140 kg menjadi 0,136 kg per-minggu. Penurunan konsumsi dua bahan makanan yang berbahan dasar kedelai tersebut ternyata juga diikuti oleh penurunan konsumsi kacang kedelai dalam bentuk butiran yang turun sebesar 21,81 persen.
Consumption of tofu and fermented soybean cake which are called "people food" and contains the main ingredients of vegetable protein for most of Indonesia's population also decreased. Tofu consumption fell by 5.32 percent, from 0.142 kg to 0.134 kg per week. Fermented soybean cake consumption also decreased to 3.32 percent from 0.140 kg to 0.136 kg per week. The decreasing consumption of two food ingredients that soybean was also followed by a decrease in the consumption of soy in the form of granules which fell by 21.81 percent.
http
://www.b
ps.g
o.id
___________________________________________________________________________________________________
Ringkasan Eksekutif Hasil Survei Sosial Ekonomi Nasional Maret 2012 -------------------------------------------------------------- 17
Konsumsi Kalori dan Protein Consumption of Calorie and Protein
Angka kecukupan konsumsi kalori dan protein penduduk Indonesia per kapita per hari berdasarkan Widyakarya Nasional Pangan dan Gizi VIII (2004)2 yaitu 2000 kkal dan 52 gram protein. Tingkat kecukupan kalori dan protein adalah salah satu indikator yang dapat digunakan untuk mengukur tingkat kesejahteraan penduduk.
The adequacy rate of calorie and protein consumption per capita of Indonesia's population per day based on the National Food and Nutrition Widyakarya VIII (2004)2 is 2000 kcal and 52 grams of protein. Adequacy level of calorie and protein level is an indicator that can be used to measure the level of the population welfare.
Hasil Susenas Maret 2012menunjukkan rata-rata konsumsi kalori per kapita sehari 1 852,64 kkal dan konsumsi protein perkapita sehari 53,14 gram. Berdasarkan pada batas standar kecukupan konsumsi kalori dan protein per kapita sehari seperti dijelaskan sebelumnya, maka rata-rata konsumsi kalori penduduk berdasarkan Susenas Maret 2012 berada dibawah angka kecukupan konsumsi kalori (lihat Tabel 4).
The Maret 2012 Susenas showed that the average daily per capita calorie consumption was 1 852.64 kcal per capita and daily consumption of protein was 53.14 grams. Based on standards limit of adequacy in calorie and protein consumption per capita per day as previous described, the average of calorie consumption in March 2012 Susenas was below the calorie consumption adequacy (see Table 4).
Berdasarkan daerah tempat tinggal,rata-rata konsumsi kalori di daerah perdesaan (1 885,57 kkal) maupun daerah perkotaan (1 819,45 kkal) belum
Based on urban-rural classification,average of calorie consumption in rural areas (1 885.57 kcal) and urban (1 819.45 kcal) has not met standart of adequacy of calorie
2 Hardiansyah dan Victor Tambunan: Angka Kecukupan Energi, Protein, Lemak, dan Serat Makanan,
Widyakarya Nasional Pangan dan Gizi VIII, Jakarta, 17-19 Mei 2004, LIPI-Jakarta. 2 Hardiansyah and Victor Tambunan: Sufficiency Rate for Energy, Protein, Fat, and Fiber Foods, National Food and
Nutrition Widyakarya VIII, Jakarta, 17-19 May, 2004, LIPI Jakarta.
http
://www.b
ps.g
o.id
__________________________________________________________________________________________________
---------------------------------------------------------- Executive Summary of the March 2012 National Socio-Economic Survey 18
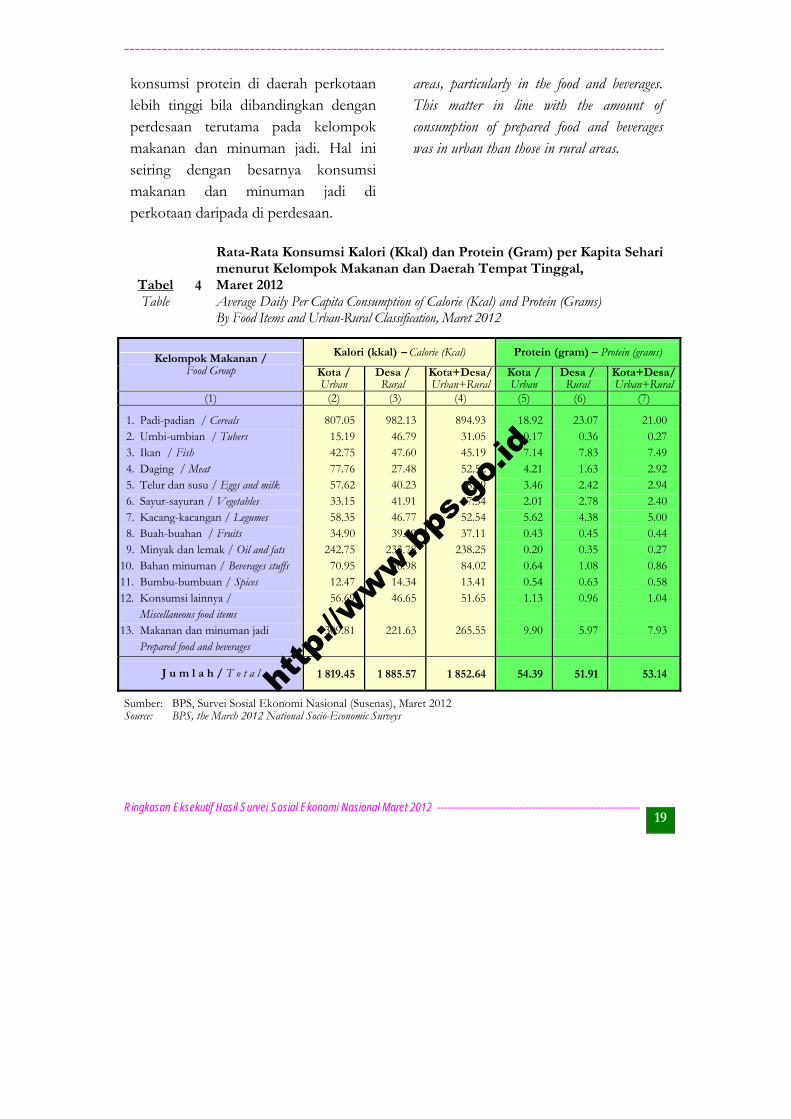
memenuhi standar kecukupan konsumsi kalori. Pada Tabel 4 terlihat bahwa rata-rata konsumsi kalori di daerah perdesaan lebih tinggi dibandingkan perkotaan pada kelompok makanan seperti padi-padian dan umbi-umbian yang pada dasarnya kelompok makanan tersebut dapat dibudidayakan dan diperoleh lebih mudah dan murah di perdesaan. Sebaliknya pada kelompok makanan daging, telur dan susu, konsumsi lainnya serta makanan dan minuman jadi di daerah perkotaan lebih tinggi konsumsi kalorinya dibandingkan di perdesaan.
intake. Table 4 shows that average of calorie consumption in rural areas was higher if compared with urban areas in the food groups, such as cereal and tubers which are basically can be cultivated and acquired more easily and cheaply in rural areas. In contrary, the meat group, eggs and milk, miscellaneous food items as well as prepared food and beverages in urban areas was higher calorie intake than those in rural areas.
Hal yang berbeda ditunjukkan pada rata-rata konsumsi protein di perkotaan yang sudah memenuhi standar kecukupan konsumsi protein per kapita sehari yaitu sebesar 54,39 gram. Untuk daerah perdesaan masih berada di bawah standar kecukupan kalori, yaitu sebesar 51,91 gram per kapita sehari. Pada Tabel 4 terlihat bahwa rata-rata
Different pattern was shown in the average of protein consumption in urban areas, which has already met the standards of adequacy of protein intake per capita per day amounting of 54.39 grams. For rural areas are still under of caloric of adequacy standards, which amounted to 51.91 grams per capita per day. Table 4 shows that the average of protein consumption in urban areas was higher if compared to rural
Konsumsi kalori belum memenuhi standar kecukupan namun konsumsi protein sudah memenuhi standar
Consumption of calories has not met the adequacy standards but already meet the standard protein intake
http
://www.b
ps.g
o.id
___________________________________________________________________________________________________
Ringkasan Eksekutif Hasil Survei Sosial Ekonomi Nasional Maret 2012 -------------------------------------------------------------- 19
konsumsi protein di daerah perkotaan lebih tinggi bila dibandingkan dengan perdesaan terutama pada kelompok makanan dan minuman jadi. Hal ini seiring dengan besarnya konsumsi makanan dan minuman jadi di perkotaan daripada di perdesaan.
areas, particularly in the food and beverages. This matter in line with the amount of consumption of prepared food and beverages was in urban than those in rural areas.
Tabel 4
Rata-Rata Konsumsi Kalori (Kkal) dan Protein (Gram) per Kapita Seharimenurut Kelompok Makanan dan Daerah Tempat Tinggal, Maret 2012
Table Average Daily Per Capita Consumption of Calorie (Kcal) and Protein (Grams) By Food Items and Urban-Rural Classification, Maret 2012
Kelompok Makanan / Food Group
Kalori (kkal) – Calorie (Kcal) Protein (gram) – Protein (grams)
Kota /Urban
Desa /Rural
Kota+Desa/Urban+Rural
Kota /Urban
Desa / Rural
Kota+Desa/Urban+Rural
(1) (2) (3) (4) (5) (6) (7)
1. Padi-padian / Cereals 2. Umbi-umbian / Tubers 3. Ikan / Fish 4. Daging / Meat 5. Telur dan susu / Eggs and milk 6. Sayur-sayuran / Vegetables 7. Kacang-kacangan / Legumes 8. Buah-buahan / Fruits 9. Minyak dan lemak / Oil and fats 10. Bahan minuman / Beverages stuffs 11. Bumbu-bumbuan / Spices 12. Konsumsi lainnya / Miscellaneous food items 13. Makanan dan minuman jadi Prepared food and beverages
807.05 15.19 42.75 77.76 57.62 33.15 58.35 34.90
242.75 70.95 12.47 56.69
309.81
982.13 46.79 47.60 27.48 40.23 41.91 46.77 39.29
233.78 96.98 14.34 46.65
221.63
894.93 31.05 45.19 52.52 48.89 37.54 52.54 37.11
238.25 84.02 13.41 51.65
265.55
18.92 0.17 7.14 4.21 3.46 2.01 5.62 0.43 0.20 0.64 0.54 1.13
9.90
23.07 0.36 7.83 1.63 2.42 2.78 4.38 0.45 0.35 1.08 0.63 0.96
5.97
21.00 0.27 7.49 2.92 2.94 2.40 5.00 0.44 0.27 0.86 0.58 1.04
7.93
J u m l a h / T o t a l 1 819.45 1 885.57 1 852.64 54.39 51.91 53.14
Sumber: BPS, Survei Sosial Ekonomi Nasional (Susenas), Maret 2012 Source: BPS, the March 2012 National Socio-Economic Surveys
http
://www.b
ps.g
o.id
__________________________________________________________________________________________________
---------------------------------------------------------- Executive Summary of the March 2012 National Socio-Economic Survey 20
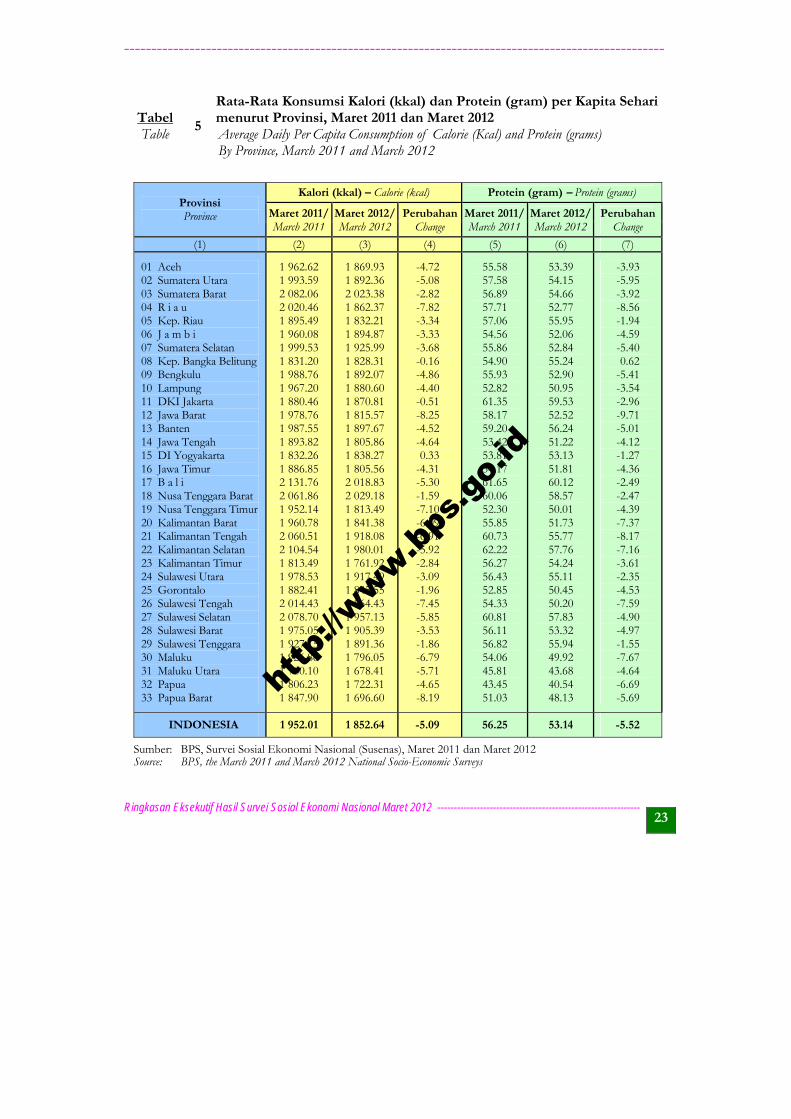
Tabel 5 menyajikan rata-rata konsumsi kalori dan protein penduduk Indonesia dan provinsi pada tahun 2011 dan 2012. Provinsi dengan rata-rata konsumsi kalori tertinggi pada tahun 2012 adalah Provinsi Nusa Tenggara Barat sebesar 2 029,18 kkal, sedangkan yang paling rendah adalah Maluku Utara yaitu 1 678,41 kkal. Jika secara nasional standar kecukupan konsumsi kalori belum terpenuhi, namun ada 3 provinsi yang sudah mencapai standar kecukupan konsumsi kalori yaitu Sumatera Barat, Bali, dan Nusa Tenggara Barat. Sementara itu 30 provinsi lainnya belum mencapai standar kecukupan kalori.
Table 5 presented the average of calorie and protein consumption of population in Indonesia and province in March 2011 and Maret 2012 Susenas. The province having the highest average of calorie consumption in Maret 2012 was Nusa Tenggara Barat with 2 029.18 kcal, while the lowest was Maluku Utara with 1 678.41 kcal. Nationally, the standard of adequacy of calorie consumption has not been met yet, but there were 3 (three) provinces having fulfilled the adequacy standard of calorie consumption, i.e. Sumatera Barat, Bali, and Nusa Tenggara Barat while the other 30 provinces had not fulfilled the adequacy standard of calories consumption yet.
Secara nasional rata-rata konsumsi kalori menunjukkan penurunan sebesar 5,09 persen (dari 1 952.01 kkal menjadi 1 852,64 kkal) dalam satu tahun terakhir. Dilihat menurut provinsi, hanya satu provinsi yang rata-rata konsumsi kalorinya mengalami peningkatan yaitu di DI Yogyakarta (0,33 persen), sebanyak 32 Provinsi
Nationally the average of calorie consumption showed decreasing of 5.09 percent (from 1 952.01 kcal to 1 852.64 kcal) in the last one year. By provinces, only one provinces that the average of calorie consumption is increasing that is DI Yogyakarta (0.33 percent) as the remaining 32 provinces, the consumption of calorie decreased. The highest decrease happened in Jawa Barat Province by
Secara nasional, standar kecukupan kalori belum terpenuhi, namun ada 3 provinsi yang sudah mencapai standar kecukupan konsumsi kalori
Nationally, calorie adequacy standards were not met, but there are three provinces that have reached the standard of sufficiency of calorie consumption
http
://www.b
ps.g
o.id
___________________________________________________________________________________________________
Ringkasan Eksekutif Hasil Survei Sosial Ekonomi Nasional Maret 2012 -------------------------------------------------------------- 21
lainnya mengalami penurunankonsumsi kalori. Penurunan tertinggi terjadi di Provinsi Jawa Barat sebesar 8,25 persen sementara penurunan terendah terjadi di Provinsi Kepulauan Bangka Belitung 0,16 persen.
8.25 percent while the lowest was in theKepulauan Bangka Belitung by 0.16 percent.
Pada Tabel 5 terlihat juga rata-rata konsumsi protein tertinggi adalah Provinsi Bali sebesar 60,12 gram, sedangkan yang paling rendah adalah Provinsi Papua 40,54 gram.
On table 5 looks the highest average protein intake was in Bali amounted to 60.12 grams, while the lowest was in Papua by 40.54 grams.
Pada tahun 2012, 11 provinsi belum mencapai standar kecukupan konsumsi protein per kapita sehari, walaupun secara nasional standar tersebut sudah terpenuhi. Provinsi yang belum mencapai standar kecukupan konsumsi protein per kapita sehari yaitu Jawa Timur (51.81 gram), Kalimantan Barat (51.73 gram), Jawa Tengah (51.22 gram), Lampung (50.95 gram), Gorontalo (50.45 gram), Sulawesi Tengah (50.20 gram), Nusa Tenggara Timur (50.01 gram), Maluku (49.92 gram), Papua Barat (48.13 gram), Maluku Utara (43.68 gram), dan Papua
On 2012, 11 provinces had not fulfilled the adequacy standard of protein consumption per capita per day yet, eventhough national stancard are met. Province which had not fulfilled the adequacy standard of protein consumption per capita per day i.e. Jawa Timur (51,81 grams), Kalimantan Barat (51,73 grams), Jawa Tengah (51,22 grams), Lampung (50,95 grams), Gorontalo (50,45 grams), Sulawesi Tengah (50,20 grams), Nusa Tenggara Timur (50,01 grams), Maluku (49,92 grams), Papua Barat (48,13 grams), Maluku Utara (43,68 grams), and Papua (40,54 grams). Comparing to the previous year, the national average of protein
Rata-rata konsumsi kalori dan protein mengalami penurunan masing-masing sebesar 5,09 persen dan 5,52 persen
The average consumption of calories and protein decreased respectively by 5.09 percent and 5.52 percent
http
://www.b
ps.g
o.id
__________________________________________________________________________________________________
---------------------------------------------------------- Executive Summary of the March 2012 National Socio-Economic Survey 22
(40.54 gram). Apabila dibandingkan tahun sebelumnya, secara nasional rata-rata konsumsi protein menunjukkan penurunan sebesar 5,52 persen dalam setahun terakhir.
consumption per capita per day showed a decrease of 5.52 percent in the past year.
Penurunan konsumsi protein pada tahun 2012 dibanding tahun 2011 terjadi hampir di semua provinsi kecuali Provinsi Bangka Belitung. Penurunan tertinggi terjadi di Provinsi Jawa Barat sebesar 9,71 persen (dari 58,17 gram menjadi 52,52 gram), Riau sebesar 8,56 persen (dari 57,71 gram menjadi 52,77 gram), dan Kalimantan Tengah sebesar 8,17 persen (dari 60,73 gram menjadi 55,77 gram). Sedangkan di 29 provinsi lainnya, rata-rata konsumsi protein mengalami penurunan antara 1 sampai dengan 7 persen dengan persentase penurunan terendah di Provinsi DI Yogyakarta sebesar 1,27 persen (dari 53,81 gram menjadi 53,13 gram).
The decrease of protein consumption in 2012 than that of 2011 occurred nearly in all provinces except Bangka Belitung Province. The highest decline occured in Jawa Barat at 9.71 percent (from 58.17 grams to 52.52 grams), Riau at 8.56 percent (from 57.71 grams to 52.77 grams), and Kalimantan Tengah at 8.17 percent (from 60.73 grams to 55.77 grams). While in 29 other provinces, the average of protein consumption has decreased between 1 to 7 percent with the lowest percentage drop in DI Yogyakarta at 1.27 percent (from 53,81 grams to 53.13 grams).
Walau rata-rata konsumsi protein mengalami penurunan sebesar 5,52 persen tetapi standar kecukupan konsumsi protein sudah terpenuhi.
Although the average of protein consumption decreased by 5.52 percent but the protein intake adequacy standards are met.
http
://www.b
ps.g
o.id
___________________________________________________________________________________________________
Ringkasan Eksekutif Hasil Survei Sosial Ekonomi Nasional Maret 2012 -------------------------------------------------------------- 23
Tabel 5
Rata-Rata Konsumsi Kalori (kkal) dan Protein (gram) per Kapita Sehari menurut Provinsi, Maret 2011 dan Maret 2012
Table Average Daily Per Capita Consumption of Calorie (Kcal) and Protein (grams) By Province, March 2011 and March 2012
Sumber: BPS, Survei Sosial Ekonomi Nasional (Susenas), Maret 2011 dan Maret 2012 Source: BPS, the March 2011 and March 2012 National Socio-Economic Surveys
Provinsi Province
Kalori (kkal) – Calorie (kcal) Protein (gram) – Protein (grams)
Maret 2011/March 2011
Maret 2012/March 2012
PerubahanChange
Maret 2011/March 2011
Maret 2012/ March 2012
PerubahanChange
(1) (2) (3) (4) (5) (6) (7)
01 Aceh 02 Sumatera Utara 03 Sumatera Barat 04 R i a u 05 Kep. Riau 06 J a m b i 07 Sumatera Selatan 08 Kep. Bangka Belitung 09 Bengkulu 10 Lampung 11 DKI Jakarta 12 Jawa Barat 13 Banten 14 Jawa Tengah 15 DI Yogyakarta 16 Jawa Timur 17 B a l i 18 Nusa Tenggara Barat 19 Nusa Tenggara Timur 20 Kalimantan Barat 21 Kalimantan Tengah 22 Kalimantan Selatan 23 Kalimantan Timur 24 Sulawesi Utara 25 Gorontalo 26 Sulawesi Tengah 27 Sulawesi Selatan 28 Sulawesi Barat 29 Sulawesi Tenggara 30 Maluku 31 Maluku Utara 32 Papua 33 Papua Barat
1 962.62 1 993.59 2 082.06 2 020.46 1 895.49 1 960.08 1 999.53 1 831.20 1 988.76 1 967.20 1 880.46 1 978.76 1 987.55 1 893.82 1 832.26 1 886.85 2 131.76 2 061.86 1 952.14 1 960.78 2 060.51 2 104.54 1 813.49 1 978.53 1 882.41 2 014.43 2 078.70 1 975.05 1 927.15 1 926.86 1 780.10 1 806.23 1 847.90
1 869.93 1 892.36 2 023.38 1 862.37 1 832.21 1 894.87 1 925.99 1 828.31 1 892.07 1 880.60 1 870.81 1 815.57 1 897.67 1 805.86 1 838.27 1 805.56 2 018.83 2 029.18 1 813.49 1 841.38 1 918.08 1 980.01 1 761.92 1 917.49 1 845.55 1 864.43 1 957.13 1 905.39 1 891.36 1 796.05 1 678.41 1 722.31 1 696.60
-4.72 -5.08 -2.82 -7.82 -3.34 -3.33 -3.68 -0.16 -4.86 -4.40 -0.51 -8.25 -4.52 -4.64 0.33
-4.31 -5.30 -1.59 -7.10 -6.09 -6.91 -5.92 -2.84 -3.09 -1.96 -7.45 -5.85 -3.53 -1.86 -6.79 -5.71 -4.65 -8.19
55.58 57.58 56.89 57.71 57.06 54.56 55.86 54.90 55.93 52.82 61.35 58.17 59.20 53.42 53.81 54.17 61.65 60.06 52.30 55.85 60.73 62.22 56.27 56.43 52.85 54.33 60.81 56.11 56.82 54.06 45.81 43.45 51.03
53.39 54.15 54.66 52.77 55.95 52.06 52.84 55.24 52.90 50.95 59.53 52.52 56.24 51.22 53.13 51.81 60.12 58.57 50.01 51.73 55.77 57.76 54.24 55.11 50.45 50.20 57.83 53.32 55.94 49.92 43.68 40.54 48.13
-3.93 -5.95 -3.92 -8.56 -1.94 -4.59 -5.40 0.62
-5.41 -3.54 -2.96 -9.71 -5.01 -4.12 -1.27 -4.36 -2.49 -2.47 -4.39 -7.37 -8.17 -7.16 -3.61 -2.35 -4.53 -7.59 -4.90 -4.97 -1.55 -7.67 -4.64 -6.69 -5.69
INDONESIA 1 952.01 1 852.64 -5.09 56.25 53.14 -5.52
http
://www.b
ps.g
o.id
__________________________________________________________________________________________________
---------------------------------------------------------- Executive Summary of the March 2012 National Socio-Economic Survey 24
Distribusi Pendapatan Income Distribution
Salah satu indikator ekonomi makro
untuk menilai tingkat ketidakmerataan
(ketimpangan) pendapatan penduduk
adalah dengan menggunakan Indeks Gini
atau Gini Ratio berdasarkan kriteria Bank
Dunia. Pada kriteria Bank Dunia
penduduk digolong- kan menjadi tiga (3)
kelas, yaitu 40 persen penduduk
berpendapatan rendah, 40 persen
penduduk berpendapatan sedang, dan 20
persen penduduk berpendapatan tinggi.
Dalam Susenas tidak diperoleh data
pendapatan, maka penghitungan
distribusi pendapatan di proksi dengan
data pengeluaran.
One of the macro-economic indicators to
assess the level of inequality population income
was by using the Gini Index or the Gini Ratio
and the World Bank’s criteria. On the criteria
of the World Bank's, population is classified
into three (3) classes, namely 40 percent low-
income population, 40 percent medium-income
population and 20 percent high income
population. Calculating of the Gini Index and
the World Bank's criteria in the data obtained
Susenas no income so the calculation of income
distribution in the proxied by expenditure data.
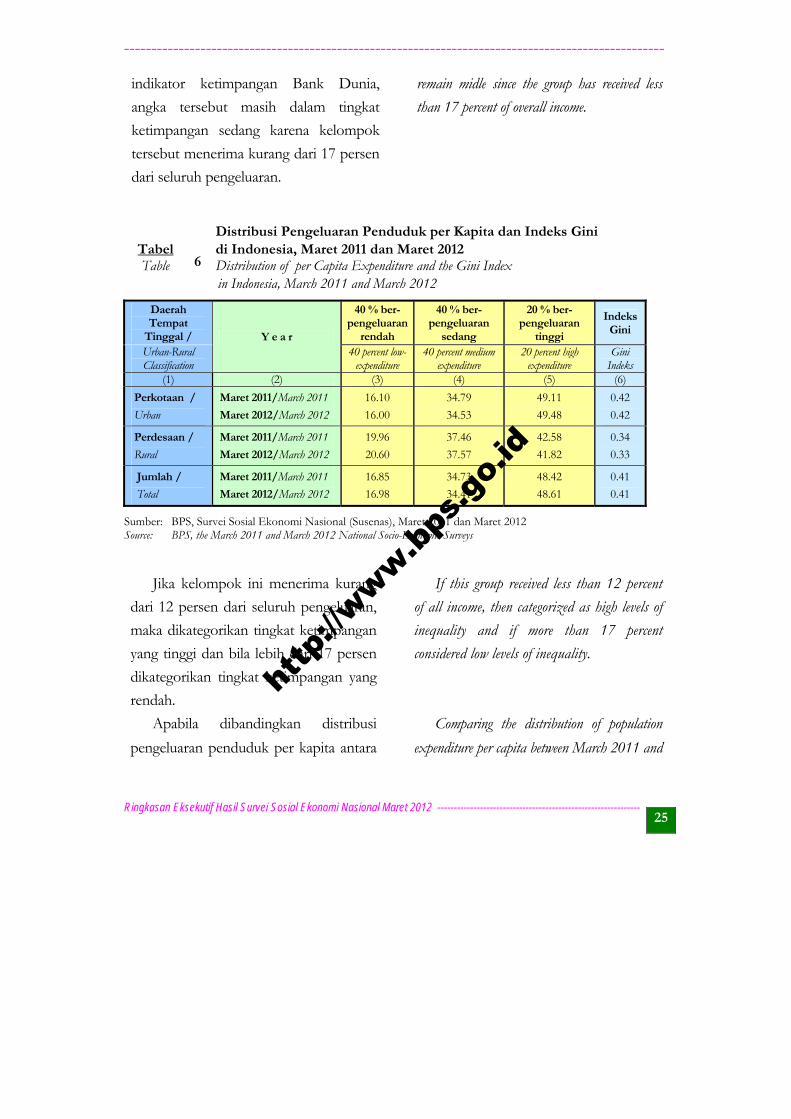
Tabel 6 menyajikan distribusi
pengeluaran penduduk per kapita dan
Indeks Gini di Indonesia pada Maret
2011 dan Maret 2012. Dari tabel tersebut
terlihat bahwa pada Maret 2012, 40
persen penduduk yang berpengeluaran
rendah menerima 16,98 persen dari
seluruh pengeluaran. Berdasarkan
Table 6 presented the distribution of
population expenditure per capita and Gini
Index in Indonesia in March 2011 and March
2012. It was shown that in March 2012, 40
percent of the population having low expenditure
received 16.98 percent of overall income. Based
on inequality indicators of the World Bank, the
figures indicated that the level of inequality
Data pengeluaran digunakan sebagai dasar penghitungan indikator ketimpangan Indeks Gini dan kriteria Bank Dunia
Expenditure data is used as the basis for calculating the Gini Index of inequality indicators and criteria or the World Bank
http
://www.b
ps.g
o.id
___________________________________________________________________________________________________
Ringkasan Eksekutif Hasil Survei Sosial Ekonomi Nasional Maret 2012 -------------------------------------------------------------- 25
indikator ketimpangan Bank Dunia,
angka tersebut masih dalam tingkat
ketimpangan sedang karena kelompok
tersebut menerima kurang dari 17 persen
dari seluruh pengeluaran.
remain midle since the group has received less
than 17 percent of overall income.
Tabel 6
Distribusi Pengeluaran Penduduk per Kapita dan Indeks Gini di Indonesia, Maret 2011 dan Maret 2012
Table Distribution of per Capita Expenditure and the Gini Indexin Indonesia, March 2011 and March 2012
Daerah Tempat
Tinggal / Y e a r
40 % ber- pengeluaran
rendah
40 % ber- pengeluaran
sedang
20 % ber- pengeluaran
tinggi
Indeks Gini
Urban-Rural Classification
40 percent low-expenditure
40 percent medium expenditure
20 percent high expenditure
Gini Indeks
(1) (2) (3) (4) (5) (6)
Perkotaan /
Urban
Maret 2011/March 2011
Maret 2012/March 2012
16.10
16.00
34.79
34.53
49.11
49.48
0.42
0.42
Perdesaan /
Rural
Maret 2011/March 2011
Maret 2012/March 2012
19.96
20.60
37.46
37.57
42.58
41.82
0.34
0.33
Jumlah /
Total
Maret 2011/March 2011
Maret 2012/March 2012
16.85
16.98
34.73
34.41
48.42
48.61
0.41
0.41
Sumber: BPS, Survei Sosial Ekonomi Nasional (Susenas), Maret 2011 dan Maret 2012 Source: BPS, the March 2011 and March 2012 National Socio-Economic Surveys
Jika kelompok ini menerima kurang
dari 12 persen dari seluruh pengeluaran,
maka dikategorikan tingkat ketimpangan
yang tinggi dan bila lebih dari 17 persen
dikategorikan tingkat ketimpangan yang
rendah.
If this group received less than 12 percent
of all income, then categorized as high levels of
inequality and if more than 17 percent
considered low levels of inequality.
Apabila dibandingkan distribusi
pengeluaran penduduk per kapita antara
Comparing the distribution of population
expenditure per capita between March 2011 and
http
://www.b
ps.g
o.id
__________________________________________________________________________________________________
---------------------------------------------------------- Executive Summary of the March 2012 National Socio-Economic Survey 26
Susenas Maret 2011 dan Maret 2012
terlihat bahwa penduduk yang termasuk
40 persen berpengeluaran rendah
mengalami peningkatan, yaitu dari 16,85
persen menjadi 16,98 persen. Pada
kelompok penduduk berpengeluaran
sedang justru terlihat ada penurunan
persentase, yaitu dari 34,73 persen
menjadi 34,41 persen. Tidak demikian
halnya pada kelompok penduduk
berpengeluaran tinggi dimana terdapat
peningkatan persentase, yaitu dari 48,42
persen menjadi 48,61 persen. Penurunan
persentase pada 40 persen penduduk
berpengeluaran rendah dan sedang
terjadi pada daerah perkotaan namun
untuk penduduk berpengeluaran tinggi
mengalami kenaikan di perkotaan tetapi
turun di perdesaan. Keadaan ini
menggambarkan bahwa distribusi
pengeluaran penduduk di perkotaan
pada tahun 2012 cenderung memburuk
dibandingkan dengan tahun 2011.
March 2012 Susenas showed that 40 percent of
the population having low expenditure decreased,
from 16.85 percent to 16.98 percent. In the
population group with medium expenditure also
indicated a increasing, from 34.73 percent to
34.41 percent. On the contrary for high
expenditure population groups, there was an
decreasing percentage from 48.42 percent to
48.61 percent. Decreasing of the percentage on
40 percent of the population group with low and
medium expenditure occured in urban areas but
for population group with high expenditure
increased in urban area but decreased in rural
area. This situation illustrated that the
distribution of population expenditure in urban
area have been deteriorated in March 2011
compared to March 2012.
Dalam dua tahun terakhir distribusi pengeluaran penduduk secara umum cenderung tidak mengalami perubahan yang besar
In the last six months distribution of expenditure of the population in general tends to stable
http
://www.b
ps.g
o.id
___________________________________________________________________________________________________
Ringkasan Eksekutif Hasil Survei Sosial Ekonomi Nasional Maret 2012 -------------------------------------------------------------- 27
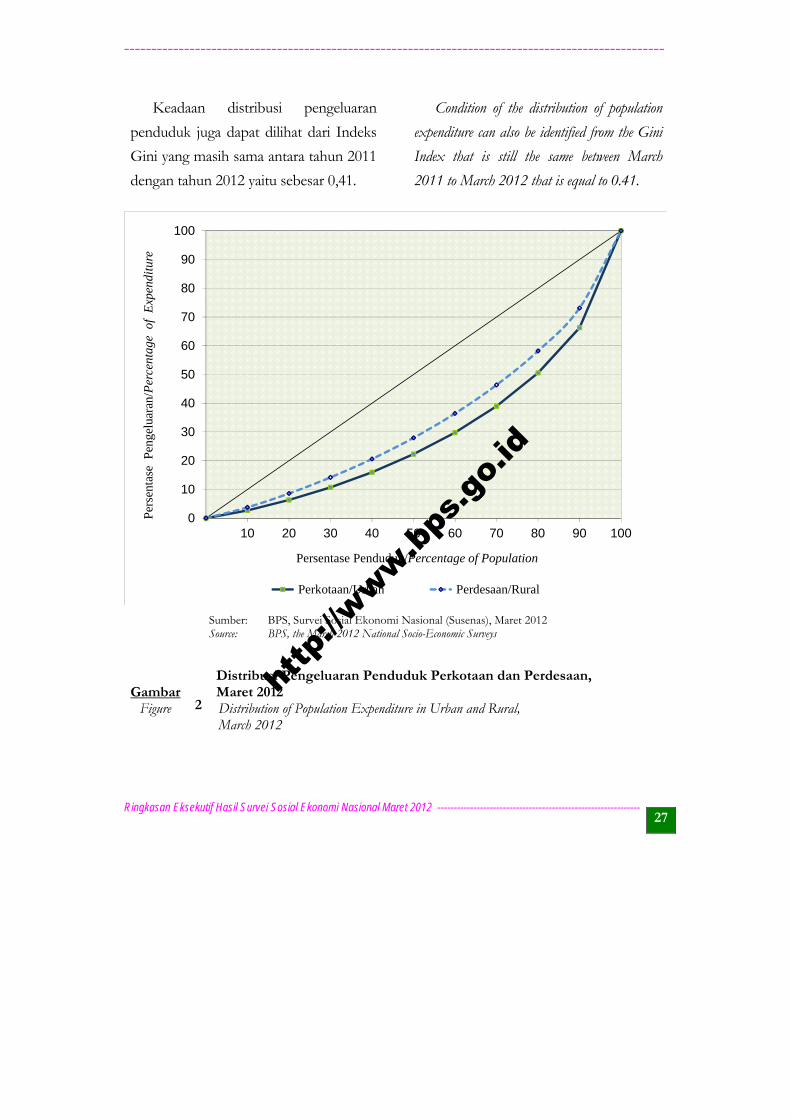
Keadaan distribusi pengeluaran
penduduk juga dapat dilihat dari Indeks
Gini yang masih sama antara tahun 2011
dengan tahun 2012 yaitu sebesar 0,41.
Condition of the distribution of population
expenditure can also be identified from the Gini
Index that is still the same between March
2011 to March 2012 that is equal to 0.41.
0
10
20
30
40
50
60
70
80
90
100
10 20 30 40 50 60 70 80 90 100
Per
sent
ase
Pen
gelu
aran
/Per
cent
age
of
Exp
endi
ture
Persentase Penduduk/Percentage of Population
Perkotaan/Urban Perdesaan/Rural
Sumber: BPS, Survei Sosial Ekonomi Nasional (Susenas), Maret 2012 Source: BPS, the March 2012 National Socio-Economic Surveys
Gambar 2
Distribusi Pengeluaran Penduduk Perkotaan dan Perdesaan, Maret 2012
Figure Distribution of Population Expenditure in Urban and Rural, March 2012
http
://www.b
ps.g
o.id
__________________________________________________________________________________________________
---------------------------------------------------------- Executive Summary of the March 2012 National Socio-Economic Survey 28
Indeks Gini daerah perkotaan
dan perdesaan dapat dilihat pada
Gambar 2. Berdasarkan gambar tersebut
dapat diketahui bahwa ketimpangan
distribusi pengeluaran di daerah
perkotaan lebih besar dibandingkan
daerah perdesaan. Hal tersebut
ditunjukkan oleh lebih jauhnya kurva
Lorenz perkotaan dari garis ideal3, yaitu
garis diagonal.
The Gini Index in urban and rural
areas presented in Figure 2. Based on the figure
it can be observed that the inequality level of the
expenditure distribution in urban areas was
larger than in rural areas. It was indicated by
the distance of the Lorenz curve for urban far
away from the ideal line3 which is the diagonal
line.
Tabel 7 menggambarkan perbedaan
tingkat ketimpangan pengeluaran
antarprovinsi. Berdasarkan tabel tersebut
dapat dilihat bahwa secara umum tingkat
ketimpangan pengeluaran penduduk
pada beberapa provinsi termasuk dalam
kategori rendah. Provinsi dengan
kontribusi pengeluaran yang paling
rendah pada kelompok 40 persen
penduduk berpengeluaran rendah ada
sebanyak 10 provinsi, yaitu Papua,
Sulawesi Utara, DI Yogyakarta, DKI
Jakarta, Gorontalo, Papua Barat,
Table 7 presented the differences of the
expenditure inequality level among provinces. It
was shown in the table that generally, the
inequality level of the population expenditure in
several provinces was included in the low category.
The provinces with the lowest contribution of
expenditure in the group of 40 percent
population having low expenditure were 10
provinces, namely Papua, Sulawesi Utara, DI
Yogyakarta, DKI Jakarta, Gorontalo, Papua
Barat, Sulawesi Selatan, Bali, Sulawesi
Tenggara, and Jawa Barat, with the lowest
percentage was in Papua, which is 14.82
3 Garis ideal adalah garis pada kurva lorentz yang menunjukkan tingkat pendapatan merata 3 Ideal line is a line on the lorentz curve that shows equitable distribution in income
Indeks Gini di perdesaan mengalami penurunan sedangkan di perkotaan tetap
Gini index in rural areas has decreased while in urban remain stable
http
://www.b
ps.g
o.id
___________________________________________________________________________________________________
Ringkasan Eksekutif Hasil Survei Sosial Ekonomi Nasional Maret 2012 -------------------------------------------------------------- 29
Sulawesi Selatan, Bali, Sulawesi
Tenggara, dan Jawa Barat, dengan
persentase paling rendah adalah Papua,
yaitu sebesar 14,82 persen. Ke-10
provinsi tersebut dapat dikategorikan
sebagai provinsi dengan tingkat
ketimpangan kategori sedang. Sedangkan
provinsi yang mempunyai kontribusi
pengeluaran yang tinggi pada kelompok
40 persen berpengeluaran rendah adalah
Kepulauan Bangka Belitung (22,54
persen) dan Aceh (21,19 persen). Hanya
terdapat 10 provinsi yang 40 persen
penduduk berpengeluaran rendah
mempunyai kontribusi pengeluaran lebih
kecil dari kontribusi nasional (16,98
persen).
percent. The tenth provinces above mentioned
were categorized as province with medium level of
inequality category. While the provinces having
high contribution in the group of 40 percent
having low income were Kepulauan Bangka
Belitung (22.54 percent) and Aceh (21.19
percent). In the group of low expenditure 40
percent of the population, there are 10
provincial expenditure has contributed less
than the national contributions (16.98
percent).
Secara umum tingkat ketimpangan distribusi pengeluaran penduduk termasuk dalam kategori rendah
In general, the unequal distribution of expenditure included in the category of low population
http
://www.b
ps.g
o.id
__________________________________________________________________________________________________
---------------------------------------------------------- Executive Summary of the March 2012 National Socio-Economic Survey 30
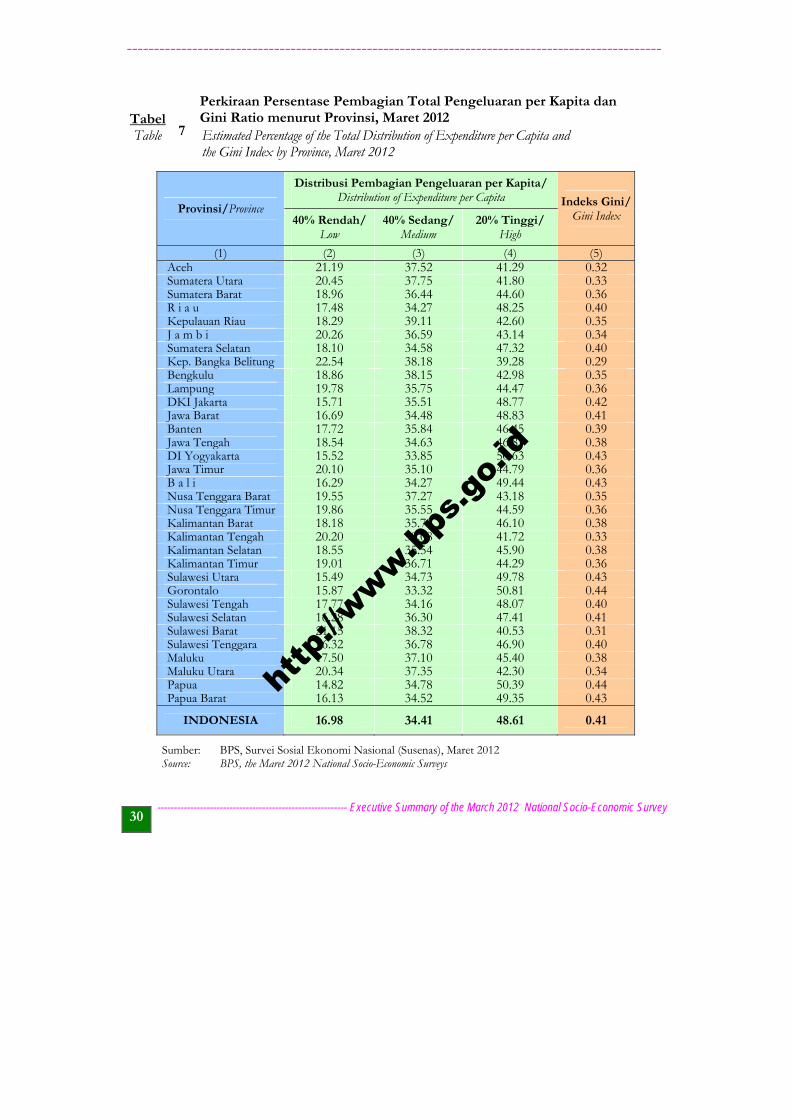
Tabel 7
Perkiraan Persentase Pembagian Total Pengeluaran per Kapita dan Gini Ratio menurut Provinsi, Maret 2012
Table Estimated Percentage of the Total Distribution of Expenditure per Capita and the Gini Index by Province, Maret 2012
Provinsi/Province
Distribusi Pembagian Pengeluaran per Kapita/ Distribution of Expenditure per Capita Indeks Gini/
Gini Index 40% Rendah/ Low
40% Sedang/ Medium
20% Tinggi/ High
(1) (2) (3) (4) (5) Aceh 21.19 37.52 41.29 0.32 Sumatera Utara 20.45 37.75 41.80 0.33 Sumatera Barat 18.96 36.44 44.60 0.36 R i a u 17.48 34.27 48.25 0.40 Kepulauan Riau 18.29 39.11 42.60 0.35 J a m b i 20.26 36.59 43.14 0.34 Sumatera Selatan 18.10 34.58 47.32 0.40 Kep. Bangka Belitung 22.54 38.18 39.28 0.29 Bengkulu 18.86 38.15 42.98 0.35 Lampung 19.78 35.75 44.47 0.36 DKI Jakarta 15.71 35.51 48.77 0.42 Jawa Barat 16.69 34.48 48.83 0.41 Banten 17.72 35.84 46.45 0.39 Jawa Tengah 18.54 34.63 46.83 0.38 DI Yogyakarta 15.52 33.85 50.63 0.43 Jawa Timur 20.10 35.10 44.79 0.36 B a l i 16.29 34.27 49.44 0.43 Nusa Tenggara Barat 19.55 37.27 43.18 0.35 Nusa Tenggara Timur 19.86 35.55 44.59 0.36 Kalimantan Barat 18.18 35.72 46.10 0.38 Kalimantan Tengah 20.20 38.08 41.72 0.33 Kalimantan Selatan 18.55 35.54 45.90 0.38 Kalimantan Timur 19.01 36.71 44.29 0.36 Sulawesi Utara 15.49 34.73 49.78 0.43 Gorontalo 15.87 33.32 50.81 0.44 Sulawesi Tengah 17.77 34.16 48.07 0.40 Sulawesi Selatan 16.28 36.30 47.41 0.41 Sulawesi Barat 21.15 38.32 40.53 0.31 Sulawesi Tenggara 16.32 36.78 46.90 0.40 Maluku 17.50 37.10 45.40 0.38 Maluku Utara 20.34 37.35 42.30 0.34 Papua 14.82 34.78 50.39 0.44 Papua Barat 16.13 34.52 49.35 0.43
INDONESIA 16.98 34.41 48.61 0.41
Sumber: BPS, Survei Sosial Ekonomi Nasional (Susenas), Maret 2012 Source: BPS, the Maret 2012 National Socio-Economic Surveys
http
://www.b
ps.g
o.id
___________________________________________________________________________________________________
Ringkasan Eksekutif Hasil Survei Sosial Ekonomi Nasional Maret 2012 -------------------------------------------------------------- 31
Indeks Gini dapat menggambarkan
tingkat ketimpangan pendapatan
penduduk suatu wilayah. Pada tahun
2012 sebanyak tujuh (7) provinsi
memiliki Indeks Gini diatas angka
nasional (0,41), yaitu Papua (0,44)
Gorontalo (0,44), DI Yogyakarta (0,43),
Bali (0,43), Sulawesi Utara (0,43), Papua
Barat (0,43), dan DKI Jakarta (0,42).
Provinsi dengan Indeks Gini tertinggi
adalah Papua dan Gorontalo, yaitu 0,44
sedangkan yang terendah adalah
Kepulauan Bangka Belitung, yaitu
sebesar 0,29. Keadaan ini menunjukan
bahwa tingkat ketimpangan di Provinsi
Papua dan Gorontalo tergolong tinggi,
sedangkan tingkat ketimpangan di
Kepulauan Bangka Belitung tergolong
rendah atau distribusi pengeluarannya
lebih baik bila dibandingkan dengan
provinsi lainnya.
Gini Index is able to present the inequality
level of the population income in certain area.
In March 2012 Susenas, there were seven
provinces having the Gini Index above the
national figure (0.41), namely Papua (0,44),
Gorontalo (0,44), DI Yogyakarta (0,43), Bali,
0.,43), Sulawesi Utara (0,43), Papua Barat
(0,43, and DKI Jakarta (0,42). Provinces
with the highest Gini Index was Papua and
Gorontalo, which is 0.44, while the lowest was
Kepulauan Bangka Belitung, amounting of
0.29. The situation indicated that the level of
inequality in Papua and Gorontalo province
was high, while in Kepulauan Bangka
Belitung was low meaning that the expenditure
distribution was better compared with other
provinces.
Indeks Gini tertinggi untuk provinsi sebesar 0,44 dan terendah 0,29
By provinces, the highest Gini Index of 0.44 and the lowest of 0.29
http
://www.b
ps.g
o.id

http
://www.b
ps.g
o.id
___________________________________________________________________________________________________
Ringkasan Eksekutif Hasil Survei Sosial Ekonomi Nasional Maret 2012 -------------------------------------------------------------- 33
TABEL-TABEL LAMPIRAN APPENDIX TABLES
http
://www.b
ps.g
o.id

http
://www.b
ps.g
o.id
___________________________________________________________________________________________________
Ringkasan Eksekutif Hasil Survei Sosial Ekonomi Nasional Maret 2012 -------------------------------------------------------------- 35
54 851 60 941 57 908
1 939 3 625 2 785
28 706 24 511 26 600
18 146 8 043 13 075
25 007 13 088 19 024
25 051 22 856 23 949
9 637 7 258 8 443
19 079 11 835 15 443
13 478 11 220 12 344
9 662 12 197 10 934
6 805 6 078 6 440
8 105 5 828 6 962
112 566 48 749 80 532
42 078 36 023 39 038
375 110 272 249 323 478
190 919 76 193 133 331
155 599 70 694 112 980
13 271 8 835 11 044
42 161 23 108 32 597
13 812 4 945 9 361
15 664 5 332 10 478
431 426 189 107 309 791
806 536 461 356 633 269
Housing and household facilities
15. Perumahan & fasilitas rumah tangga /
Jumlah Makanan / Total of Food
14. Tembakau dan sirih / Tobacco and betel
13. Makanan dan minuman jadi / Prepared food and beverages
J u m l a h / T o t a l
20. Keperluan pesta dan upacara / Parties and ceremonies
19. Pajak dan asuransi / Taxes and insurance
18. Barang-barang yang tahan lama / Durable goods
Clothing, footwear and headgear
17. Pakaian, alas kaki dan tutup kepala /
16. Barang dan jasa / Goods and services
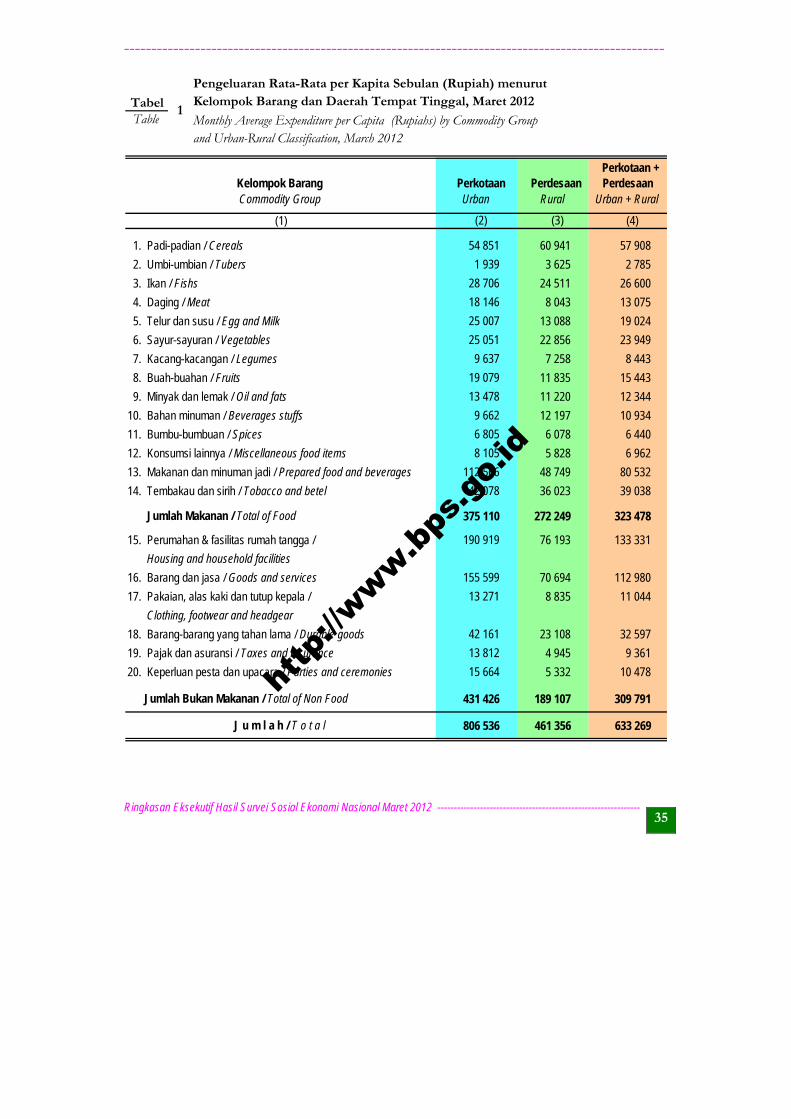
TabelTable
Kelompok Barang Commodity Group
(1)
1. Padi-padian / Cereals
and Urban-Rural Classification, March 2012
1
12. Konsumsi lainnya / Miscellaneous food items
11. Bumbu-bumbuan / Spices
10. Bahan minuman / Beverages stuffs
9. Minyak dan lemak / Oil and fats
8. Buah-buahan / Fruits
Pengeluaran Rata-Rata per Kapita Sebulan (Rupiah) menurut Kelompok Barang dan Daerah Tempat Tinggal, Maret 2012
Monthly Average Expenditure per Capita (Rupiahs) by Commodity Group
7. Kacang-kacangan / Legumes
6. Sayur-sayuran / Vegetables
5. Telur dan susu / Egg and Milk
4. Daging / Meat
3. Ikan / Fishs
2. Umbi-umbian / Tubers
RuralUrban
Jumlah Bukan Makanan / Total of Non Food
Perkotaan + Perdesaan
(4)
Perkotaan
(2)
Perdesaan
(3)
Urban + Rural
http
://www.b
ps.g
o.id
__________________________________________________________________________________________________
---------------------------------------------------------- Executive Summary of the March 2012 National Socio-Economic Survey 36
(2)
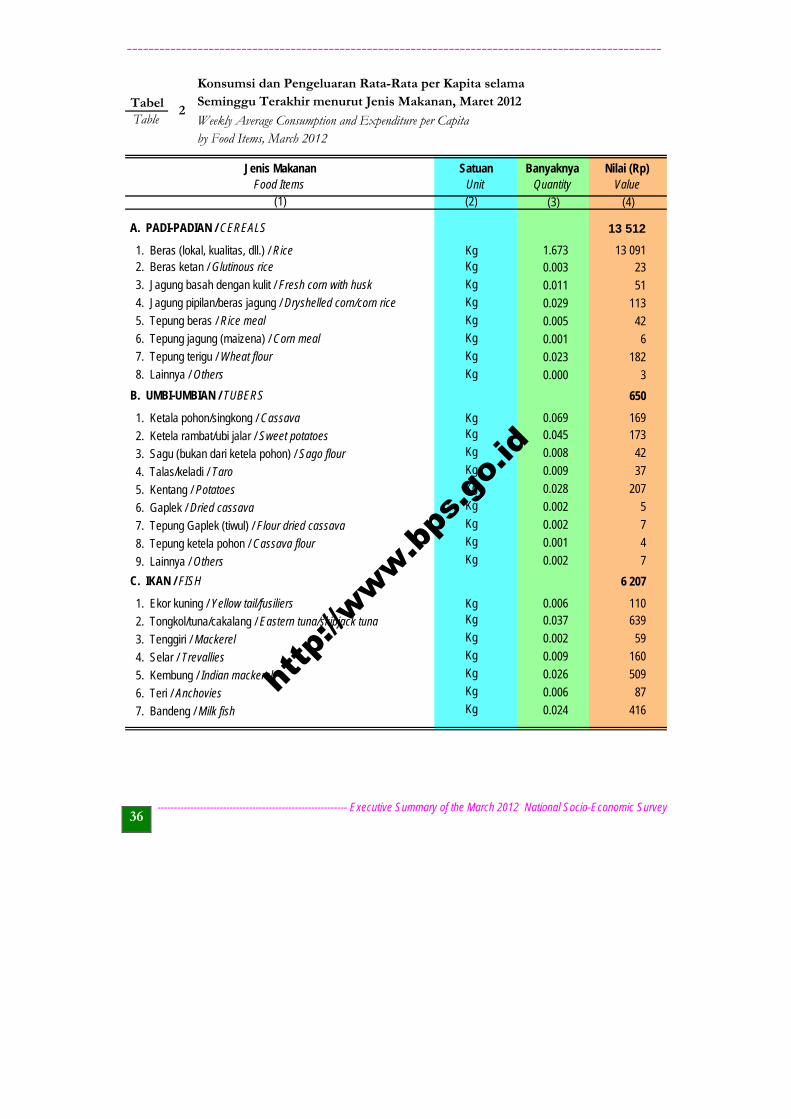
13 512
Kg 1.673 13 091Kg 0.003 23Kg 0.011 51Kg 0.029 113Kg 0.005 42Kg 0.001 6Kg 0.023 182Kg 0.000 3
650
Kg 0.069 169Kg 0.045 173Kg 0.008 42Kg 0.009 37Kg 0.028 207Kg 0.002 5Kg 0.002 7Kg 0.001 4Kg 0.002 7
6 207
Kg 0.006 110Kg 0.037 639Kg 0.002 59Kg 0.009 160Kg 0.026 509Kg 0.006 87Kg 0.024 416
5. Kembung / Indian mackerel
6. Teri / Anchovies
7. Bandeng / Milk fish
Unit Quantity Value
9. Lainnya / Others
C. IKAN / FISH
2. Tongkol/tuna/cakalang / Eastern tuna/skipjack tuna
2. Ketela rambat/ubi jalar / Sweet potatoes
B. UMBI-UMBIAN / TUBERS
8. Lainnya / Others
7. Tepung terigu / Wheat flour
1. Beras (lokal, kualitas, dll.) / Rice
A. PADI-PADIAN / CEREALS
1. Ketala pohon/singkong / Cassava
Satuan
5. Tepung beras / Rice meal
3. Tenggiri / Mackerel
3. Sagu (bukan dari ketela pohon) / Sago flour
4. Talas/keladi / Taro
5. Kentang / Potatoes
6. Gaplek / Dried cassava
TableTabel
2Weekly Average Consumption and Expenditure per Capita
Jenis Makanan
(1)
6. Tepung jagung (maizena) / Corn meal
1. Ekor kuning / Yellow tail/fusiliers
Banyaknya
4. Jagung pipilan/beras jagung / Dryshelled corn/corn rice
4. Selar / Trevallies
7. Tepung Gaplek (tiwul) / Flour dried cassava
8. Tepung ketela pohon / Cassava flour
(3) (4)
by Food Items, March 2012
Food Items
3. Jagung basah dengan kulit / Fresh corn with husk
2. Beras ketan / Glutinous rice
Konsumsi dan Pengeluaran Rata-Rata per Kapita selama Seminggu Terakhir menurut Jenis Makanan, Maret 2012
Nilai (Rp)
http
://www.b
ps.g
o.id

___________________________________________________________________________________________________
Ringkasan Eksekutif Hasil Survei Sosial Ekonomi Nasional Maret 2012 -------------------------------------------------------------- 37
(2)
Kg 0.008 165
Kg 0.022 351Kg 0.014 332Kg 0.019 320Kg 0.004 89Kg 0.001 24Kg 0.060 1 019Kg 0.011 374
Kg 0.005 138Kg 0.001 30Kg 0.002 25Kg 0.001 18
Ons / Ounce 0.056 133Ons / Ounce 0.004 14Ons / Ounce 0.066 154Ons / Ounce 0.105 401Ons / Ounce 0.018 43Ons / Ounce 0.024 74Ons / Ounce 0.019 57Ons / Ounce 0.007 30Ons / Ounce 0.014 55Ons / Ounce 0.138 319Ons / Ounce 0.006 20Ons / Ounce 0.004 23Ons / Ounce 0.009 19
3 051
Kg 0.007 460Kg 0.000 28Kg 0.000 20Kg 0.004 153
D. DAGING / MEAT
27. Gabus / Snake head
28. Ikan dalam kaleng / Canned fish
29. Lainnya / Others
22. Tongkol/tuna/cakalang / Eastern tuna/skipjack tuna
15. Udang / Shrimp
Satuan Banyaknya Nilai (Rp)Food Items Unit Quantity Value
20. Kembung (peda) / Indian mackerel
9. Mujair / Mozambique tilapia 10. Mas / Common carp
21. Tenggiri / Mackerel
16. Cumi-cumi/sotong / Common squid/cuttle fish 17. Ketam/kepiting/rajungan / Mud crab/swim crab
18. Kerang/siput / Cockle/snail
19. Lainnya / Others
TABLE 2 : CONTINUED
(3) (4)
11. Lele / Catfish
(1)
Jenis Makanan
8. Gabus / Snake head
25. Sepat / Snakeskin gourame
4. Daging babi / Pork
3. Daging kambing / Lamb meat
2. Daging kerbau / Buffalo meat 1. Daging sapi / Beef
32. Lainnya / Others
TABEL 2 : LANJUTAN
12. Kakap / Barramundi
13. Baronang / Baronang
14. Lainnya / Others
23. Teri / Anchovies
24. Selar /Trevallies
30. Udang (ebi) / Shrimps
31. Cumi-cumi/sotong / Common squids
26. Bandeng / Milk fishes
http
://www.b
ps.g
o.id
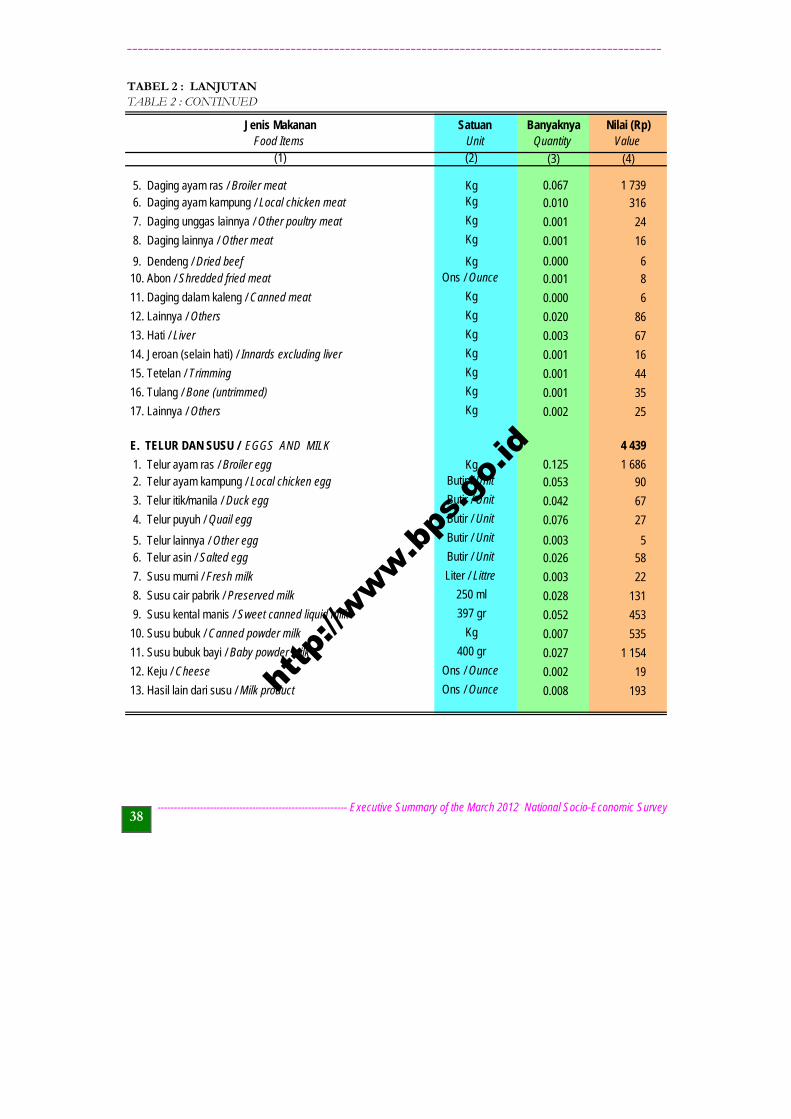
__________________________________________________________________________________________________
---------------------------------------------------------- Executive Summary of the March 2012 National Socio-Economic Survey 38
(2)
Kg 0.067 1 739Kg 0.010 316Kg 0.001 24Kg 0.001 16
Kg 0.000 6Ons / Ounce 0.001 8
Kg 0.000 6Kg 0.020 86Kg 0.003 67Kg 0.001 16Kg 0.001 44Kg 0.001 35Kg 0.002 25
4 439
Kg 0.125 1 686Butir / Unit 0.053 90Butir / Unit 0.042 67Butir / Unit 0.076 27Butir / Unit 0.003 5Butir / Unit 0.026 58Liter / Littre 0.003 22
250 ml 0.028 131397 gr 0.052 453
Kg 0.007 535400 gr 0.027 1 154
Ons / Ounce 0.002 19Ons / Ounce 0.008 193
14. Jeroan (selain hati) / Innards excluding liver
8. Daging lainnya / Other meat
2. Telur ayam kampung / Local chicken egg
13. Hati / Liver
Satuan Banyaknya
7. Susu murni / Fresh milk
Food Items Unit Quantity Value
TABLE 2 : CONTINUED
12. Lainnya / Others
15. Tetelan / Trimming
6. Telur asin / Salted egg
Jenis Makanan Nilai (Rp)
E. TELUR DAN SUSU / EGGS AND MILK
TABEL 2 : LANJUTAN
5. Daging ayam ras / Broiler meat 6. Daging ayam kampung / Local chicken meat
(1) (3) (4)
7. Daging unggas lainnya / Other poultry meat
5. Telur lainnya / Other egg
16. Tulang / Bone (untrimmed)
17. Lainnya / Others
1. Telur ayam ras / Broiler egg
9. Dendeng / Dried beef
4. Telur puyuh / Quail egg
3. Telur itik/manila / Duck egg
10. Abon / Shredded fried meat
11. Daging dalam kaleng / Canned meat
13. Hasil lain dari susu / Milk product
12. Keju / Cheese
11. Susu bubuk bayi / Baby powder milk
10. Susu bubuk / Canned powder milk
9. Susu kental manis / Sweet canned liquid milk
8. Susu cair pabrik / Preserved milk
http
://www.b
ps.g
o.id
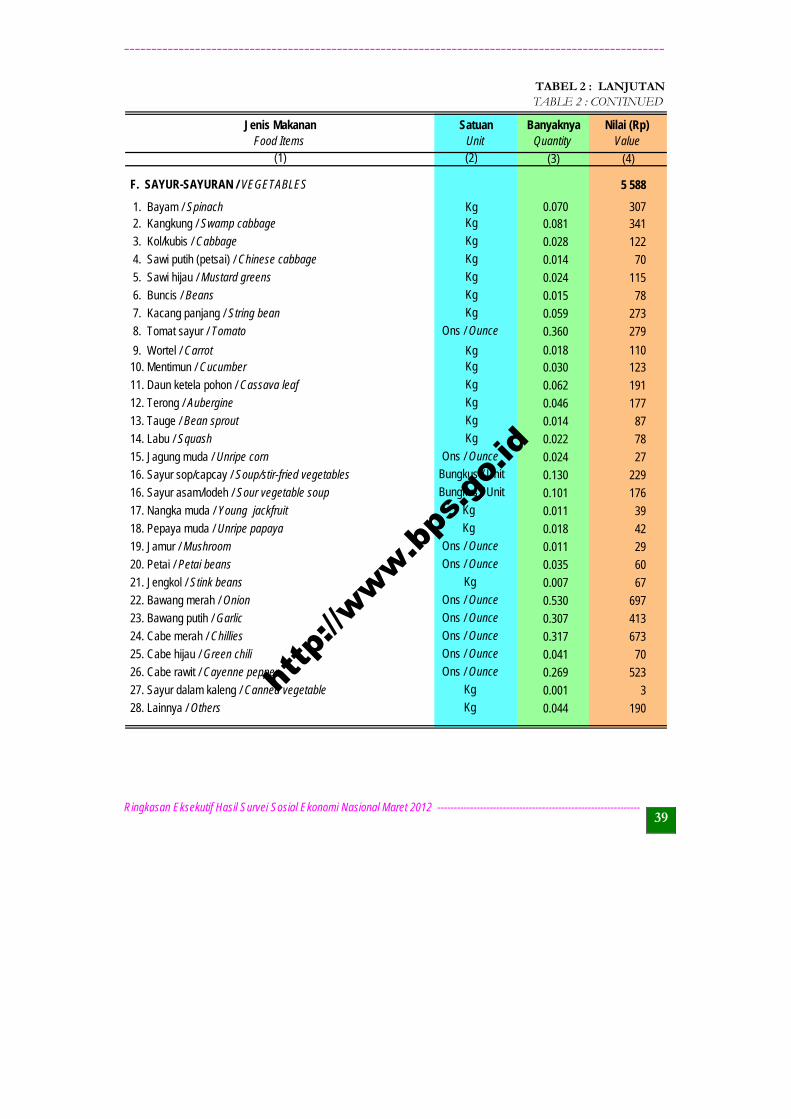
___________________________________________________________________________________________________
Ringkasan Eksekutif Hasil Survei Sosial Ekonomi Nasional Maret 2012 -------------------------------------------------------------- 39
(2)
5 588
Kg 0.070 307 Kg 0.081 341 Kg 0.028 122 Kg 0.014 70 Kg 0.024 115 Kg 0.015 78 Kg 0.059 273
Ons / Ounce 0.360 279
Kg 0.018 110 Kg 0.030 123 Kg 0.062 191 Kg 0.046 177 Kg 0.014 87 Kg 0.022 78
Ons / Ounce 0.024 27Bungkus / Unit 0.130 229Bungkus / Unit 0.101 176
Kg 0.011 39 Kg 0.018 42
Ons / Ounce 0.011 29Ons / Ounce 0.035 60
Kg 0.007 67Ons / Ounce 0.530 697Ons / Ounce 0.307 413Ons / Ounce 0.317 673Ons / Ounce 0.041 70Ons / Ounce 0.269 523
Kg 0.001 3Kg 0.044 190
16. Sayur sop/capcay / Soup/stir-fried vegetables
7. Kacang panjang / String bean
6. Buncis / Beans
21. Jengkol / Stink beans
22. Bawang merah / Onion
13. Tauge / Bean sprout
12. Terong / Aubergine
11. Daun ketela pohon / Cassava leaf
10. Mentimun / Cucumber 9. Wortel / Carrot
19. Jamur / Mushroom
18. Pepaya muda / Unripe papaya
17. Nangka muda / Young jackfruit
16. Sayur asam/lodeh / Sour vegetable soup
28. Lainnya / Others
27. Sayur dalam kaleng / Canned vegetable
26. Cabe rawit / Cayenne pepper
25. Cabe hijau / Green chili
24. Cabe merah / Chillies
23. Bawang putih / Garlic
20. Petai / Petai beans
4. Sawi putih (petsai) / Chinese cabbage
2. Kangkung / Swamp cabbage 1. Bayam / Spinach
F. SAYUR-SAYURAN / VEGETABLES
3. Kol/kubis / Cabbage
15. Jagung muda / Unripe corn
5. Sawi hijau / Mustard greens
14. Labu / Squash
8. Tomat sayur / Tomato
Unit Quantity Value(1) (3) (4)
Food Items
TABLE 2 : CONTINUED
Jenis Makanan Satuan Banyaknya Nilai (Rp)
TABEL 2 : LANJUTAN
http
://www.b
ps.g
o.id
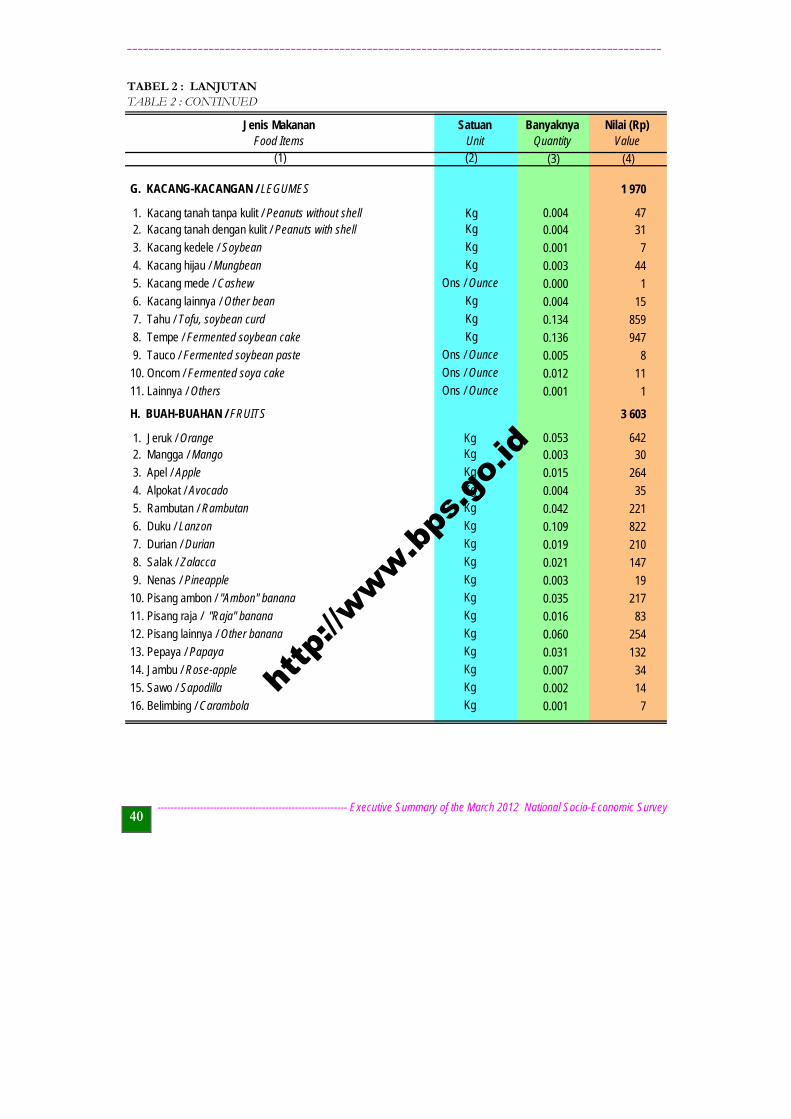
__________________________________________________________________________________________________
---------------------------------------------------------- Executive Summary of the March 2012 National Socio-Economic Survey 40
(2)
1 970
Kg 0.004 47Kg 0.004 31Kg 0.001 7Kg 0.003 44
Ons / Ounce 0.000 1Kg 0.004 15Kg 0.134 859Kg 0.136 947
Ons / Ounce 0.005 8Ons / Ounce 0.012 11Ons / Ounce 0.001 1
3 603
Kg 0.053 642Kg 0.003 30Kg 0.015 264Kg 0.004 35Kg 0.042 221Kg 0.109 822Kg 0.019 210Kg 0.021 147Kg 0.003 19Kg 0.035 217Kg 0.016 83Kg 0.060 254Kg 0.031 132Kg 0.007 34Kg 0.002 14Kg 0.001 7
Jenis Makanan
3. Apel / Apple
2. Mangga / Mango
G. KACANG-KACANGAN / LEGUMES
1. Jeruk / Orange
2. Kacang tanah dengan kulit / Peanuts with shell
7. Durian / Durian
6. Duku / Lanzon
5. Rambutan / Rambutan
5. Kacang mede / Cashew
4. Alpokat / Avocado
8. Salak / Zalacca
6. Kacang lainnya / Other bean
4. Kacang hijau / Mungbean
H. BUAH-BUAHAN / FRUITS
11. Lainnya / Others
10. Oncom / Fermented soya cake
9. Tauco / Fermented soybean paste
16. Belimbing / Carambola
7. Tahu / Tofu, soybean curd
10. Pisang ambon / "Ambon" banana
9. Nenas / Pineapple
8. Tempe / Fermented soybean cake
12. Pisang lainnya / Other banana
11. Pisang raja / "Raja" banana
13. Pepaya / Papaya
15. Sawo / Sapodilla
14. Jambu / Rose-apple
Unit Quantity Value(1)
Satuan Banyaknya Nilai (Rp)
TABEL 2 : LANJUTANTABLE 2 : CONTINUED
(3) (4)
3. Kacang kedele / Soybean
1. Kacang tanah tanpa kulit / Peanuts without shell
Food Items
http
://www.b
ps.g
o.id
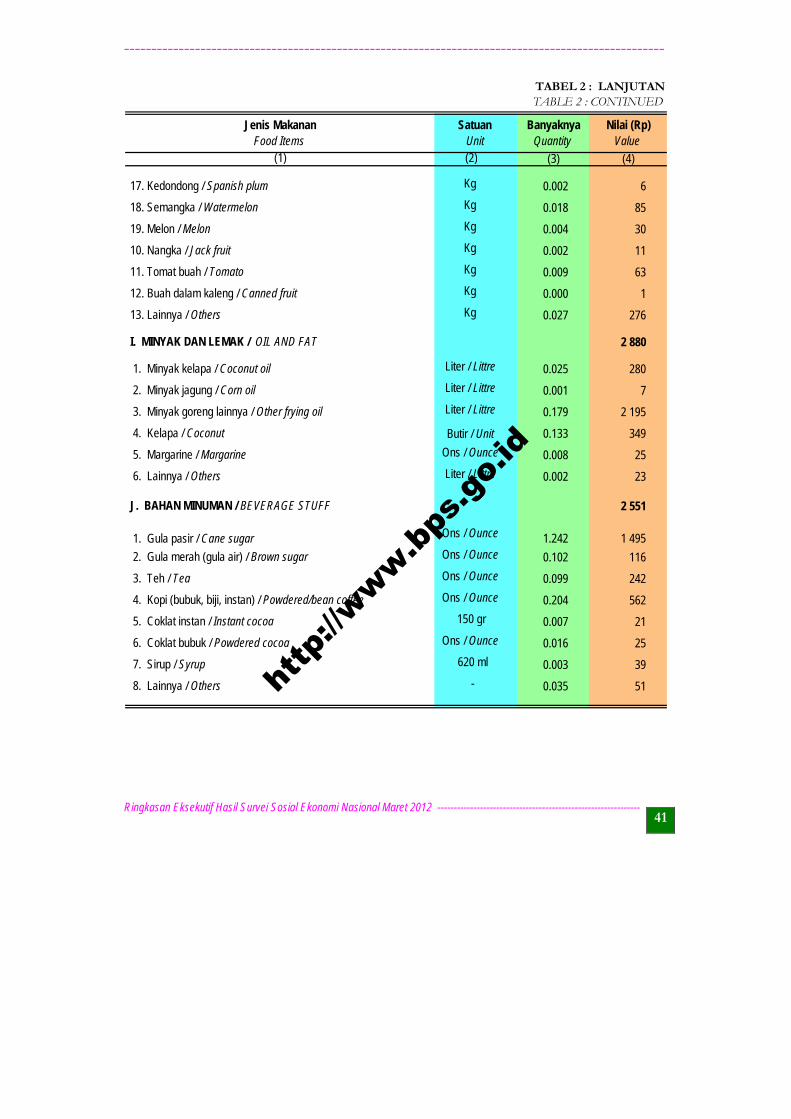
___________________________________________________________________________________________________
Ringkasan Eksekutif Hasil Survei Sosial Ekonomi Nasional Maret 2012 -------------------------------------------------------------- 41
(2)
Kg 0.002 6
Kg 0.018 85
Kg 0.004 30
Kg 0.002 11
Kg 0.009 63
Kg 0.000 1
Kg 0.027 276
2 880
Liter / Littre 0.025 280
Liter / Littre 0.001 7
Liter / Littre 0.179 2 195
Butir / Unit 0.133 349
Ons / Ounce 0.008 25
Liter / Littre 0.002 23
2 551
Ons / Ounce 1.242 1 495Ons / Ounce 0.102 116
Ons / Ounce 0.099 242
Ons / Ounce 0.204 562
150 gr 0.007 21
Ons / Ounce 0.016 25
620 ml 0.003 39
- 0.035 51
Banyaknya
5. Margarine / Margarine
4. Kelapa / Coconut
8. Lainnya / Others
7. Sirup / Syrup
17. Kedondong / Spanish plum
2. Minyak jagung / Corn oil
1. Minyak kelapa / Coconut oil
I. MINYAK DAN LEMAK / OIL AND FAT
13. Lainnya / Others
10. Nangka / Jack fruit
19. Melon / Melon
18. Semangka / Watermelon
2. Gula merah (gula air) / Brown sugar
1. Gula pasir / Cane sugar
J. BAHAN MINUMAN / BEVERAGE STUFF
6. Lainnya / Others
12. Buah dalam kaleng / Canned fruit
6. Coklat bubuk / Powdered cocoa
5. Coklat instan / Instant cocoa
4. Kopi (bubuk, biji, instan) / Powdered/bean coffee
3. Teh / Tea
3. Minyak goreng lainnya / Other frying oil
TABEL 2 : LANJUTAN
Quantity Value(1)
Satuan Nilai (Rp)Food Items
(3) (4)
Unit
11. Tomat buah / Tomato
TABLE 2 : CONTINUED
Jenis Makanan
http
://www.b
ps.g
o.id
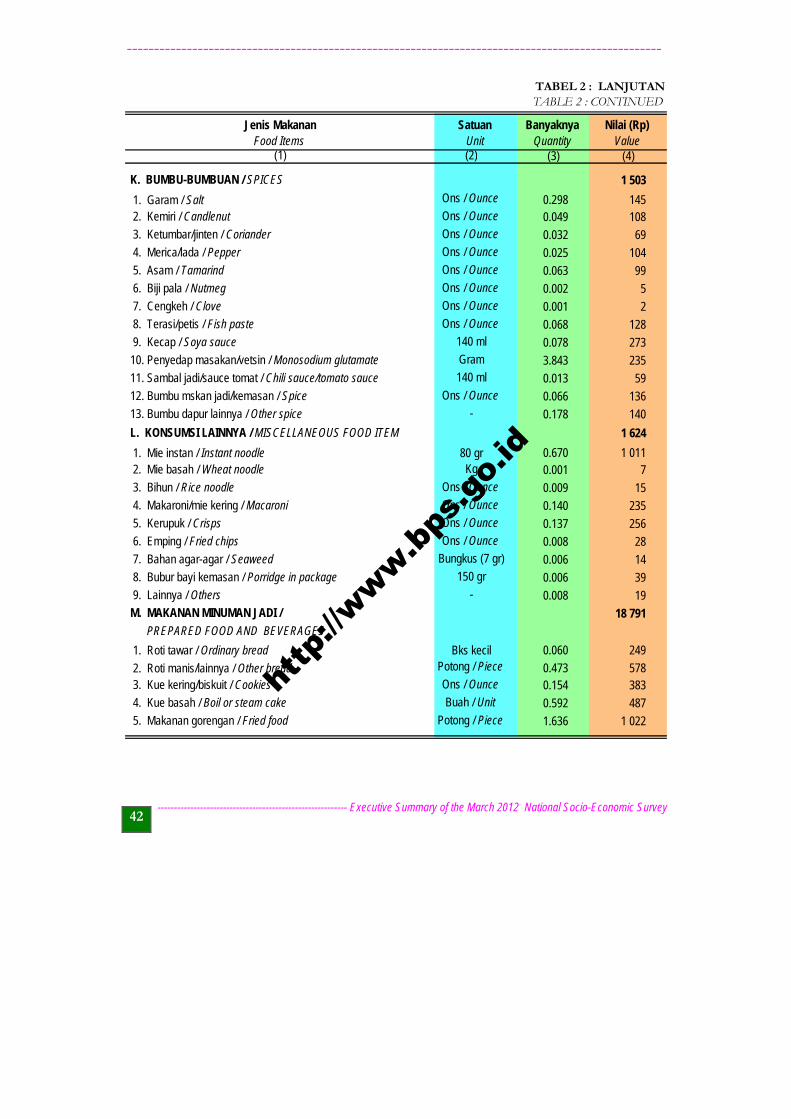
__________________________________________________________________________________________________
---------------------------------------------------------- Executive Summary of the March 2012 National Socio-Economic Survey 42
(2)
1 503
Ons / Ounce 0.298 145Ons / Ounce 0.049 108Ons / Ounce 0.032 69Ons / Ounce 0.025 104Ons / Ounce 0.063 99Ons / Ounce 0.002 5Ons / Ounce 0.001 2Ons / Ounce 0.068 128
140 ml 0.078 273Gram 3.843 235140 ml 0.013 59
Ons / Ounce 0.066 136- 0.178 140
1 624
80 gr 0.670 1 011Kg 0.001 7
Ons / Ounce 0.009 15Ons / Ounce 0.140 235Ons / Ounce 0.137 256Ons / Ounce 0.008 28
Bungkus (7 gr) 0.006 14150 gr 0.006 39
- 0.008 19
18 791
Bks kecil 0.060 249Potong / Piece 0.473 578Ons / Ounce 0.154 383Buah / Unit 0.592 487
Potong / Piece 1.636 1 022
3. Ketumbar/jinten / Coriander
2. Kemiri / Candlenut 1. Garam / Salt
PREPARED FOOD AND BEVERAGES
9. Kecap / Soya sauce
8. Terasi/petis / Fish paste
7. Cengkeh / Clove
6. Biji pala / Nutmeg
5. Asam / Tamarind
4. Merica/lada / Pepper
1. Mie instan / Instant noodle
L. KONSUMSI LAINNYA / MISCELLANEOUS FOOD ITEM
13. Bumbu dapur lainnya / Other spice
12. Bumbu mskan jadi/kemasan / Spice
11. Sambal jadi/sauce tomat / Chili sauce/tomato sauce
10. Penyedap masakan/vetsin / Monosodium glutamate
TABEL 2 : LANJUTAN
Jenis Makanan Satuan Banyaknya Nilai (Rp)
TABLE 2 : CONTINUED
Food Items(4)
9. Lainnya / Others
8. Bubur bayi kemasan / Porridge in package
7. Bahan agar-agar / Seaweed
(3)
K. BUMBU-BUMBUAN / SPICES
5. Makanan gorengan / Fried food
4. Kue basah / Boil or steam cake
3. Kue kering/biskuit / Cookies 2. Roti manis/lainnya / Other bread
1. Roti tawar / Ordinary bread
M. MAKANAN MINUMAN JADI /
6. Emping / Fried chips
5. Kerupuk / Crisps
4. Makaroni/mie kering / Macaroni
3. Bihun / Rice noodle
Unit Quantity Value(1)
2. Mie basah / Wheat noodle
http
://www.b
ps.g
o.id

___________________________________________________________________________________________________
Ringkasan Eksekutif Hasil Survei Sosial Ekonomi Nasional Maret 2012 -------------------------------------------------------------- 43
(2)
Porsi / Portion 0.048 114Porsi / Portion 0.121 521Porsi / Portion 0.588 4 116
Porsi / Portion 0.088 630Porsi / Portion 0.141 399Porsi / Portion 0.112 412
Porsi / Portion 0.110 683Porsi / Portion 0.060 424Porsi / Portion 0.330 1 756Porsi / Portion 0.017 55Ons / Ounce 0.487 1 196
Potong / Piece 0.093 461Potong / Piece 0.095 663
- 0.675 1 276600 ml 0.095 217Galon 0.112 797250 ml 0.068 97200 ml 0.102 213250 ml 0.019 79100 ml 0.030 71
Gelas / Glass 0.655 1 114Mangkuk kecil 0.059 179Gelas 200 ml 0.382 532
620 ml 0.001 17620 ml 0.000 7620 ml 0.009 40
9 109Batang / Unit 0.624 5 479Batang / Unit 0.336 2 494Batang / Unit 0.082 862Ons / Ounce 0.032 163
Bungkus / Unit 0.015 61 - 0.044 50
6. Bubur kacang hijau / Porridge of mung bean 7. Gado-gado/ketoprak/pecel / Kind of salad with peanuts sauce
Rice steamed in a banana leaf or coconut leaf
A plate of rice accompanied by a mixture of dishes
13. Sate/tongseng / Roasted meat on skewer 12. Soto/gule/sop/rawon / Soup
11. Lontong/ketupat sayur / 10. Nasi putih / Rice 9. Nasi goreng / Fried rice
8. Nasi campur/rames /
19. Makanan jadi lainnya / Other prepared food 18. Ayam/daging (goreng, dll.) / Chicken/meat (fried, roasted, etc) 17. Ikan (goreng, bakar, dll.) / Fish (fried, roasted, etc) 16. Makanan ringan anak-anak / Snack for children 15. Mie instan / Instant noodle 14. Mie bakso/rebus/goreng / Noodle (with meatball/boiled/fried)
25. Minuman kesehata/energi / Health drink 24. Minuman ringan CO2 (soda) / CO2 drink 23. Sari buah kemasan / Packed juice 22. Air teh kemasan / Packed tea 21. Air kemasan galon / Mineral water (galon) 20. Air kemasan / Mineral water (bottle)
31. Minuman keras lainnya / Other alcoholic beverage 30. Anggur / Wine 29. Bir / B e e r 28. Es lainnya / Other ice 27. Es krim / Ice cream 26. Minuman lainnya (kopi) / Other drinks (coffee, milk, etc)
(1) (3) (4)
6. Lainnya / Others 5. Sirih/pinang / Betel/areca nut 4. Tembakau / Tobacco 3. Rokok putih / Cigarettes 2. Rokok kretek tanpa filter / Clove non filter cigarettes 1. Rokok kretek filter / Clove filter cigarettes N. TEMBAKAU DAN SIRIH / TOBACCO AND BETEL
Jenis Makanan Satuan Banyaknya Nilai (Rp) Food Items Unit Quantity Value
TABEL 2 : LANJUTANTABLE 2 : CONTINUED
http
://www.b
ps.g
o.id
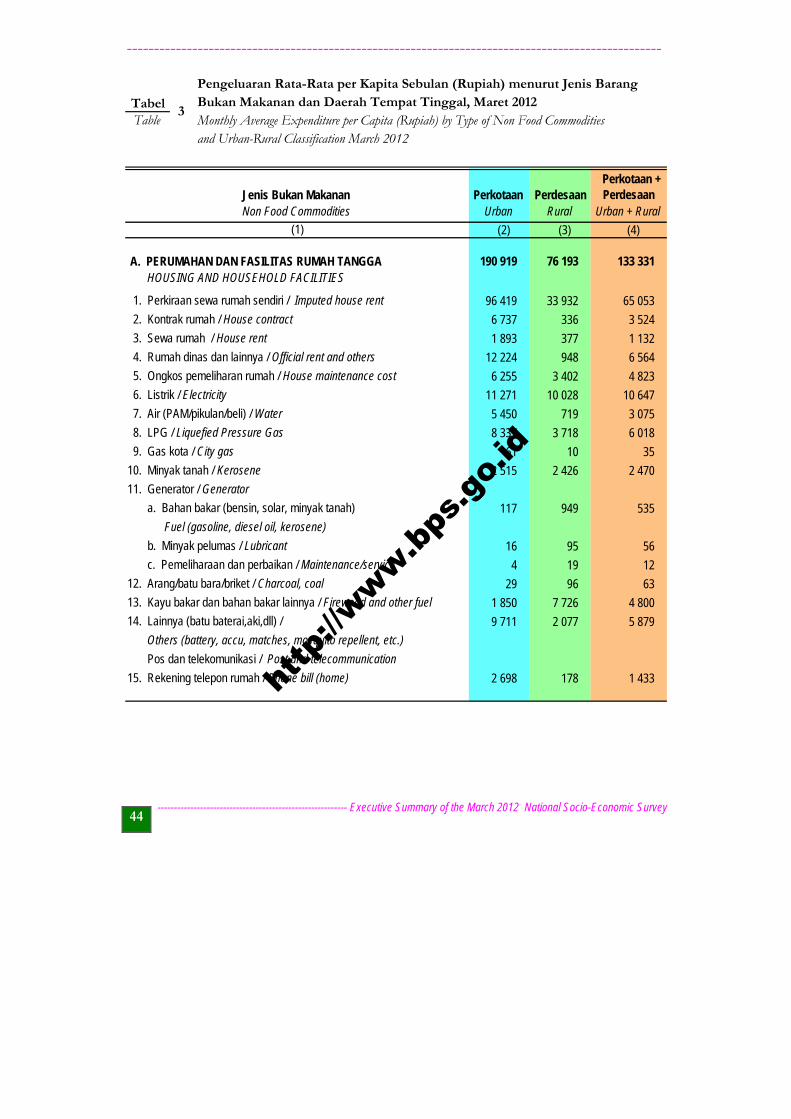
__________________________________________________________________________________________________
---------------------------------------------------------- Executive Summary of the March 2012 National Socio-Economic Survey 44
Perkotaan Perdesaan Perkotaan +
PerdesaanUrban Rural Urban + Rural
(2) (3) (4)
190 919 76 193 133 331
96 419 33 932 65 053
6 737 336 3 524
1 893 377 1 132
12 224 948 6 564
6 255 3 402 4 823
11 271 10 028 10 647
5 450 719 3 075
8 337 3 718 6 018
61 10 35
2 515 2 426 2 470
117 949 535
16 95 56
4 19 12
29 96 63
1 850 7 726 4 800
9 711 2 077 5 879
2 698 178 1 433
HOUSING AND HOUSEHOLD FACILITIES
Fuel (gasoline, diesel oil, kerosene)
Others (battery, accu, matches, mosquito repellent, etc.)
a. Bahan bakar (bensin, solar, minyak tanah)
14. Lainnya (batu baterai,aki,dll) /
13. Kayu bakar dan bahan bakar lainnya / Firewood and other fuel
c. Pemeliharaan dan perbaikan / Maintenance/service
b. Minyak pelumas / Lubricant
3. Sewa rumah / House rent
8. LPG / Liquefied Pressure Gas
12. Arang/batu bara/briket / Charcoal, coal
Pos dan telekomunikasi / Post and telecommunication
15. Rekening telepon rumah / Phone bill (home)
Jenis Bukan Makanan
Pengeluaran Rata-Rata per Kapita Sebulan (Rupiah) menurut Jenis Barang
5. Ongkos pemeliharan rumah / House maintenance cost
11. Generator / Generator
10. Minyak tanah / Kerosene
9. Gas kota / City gas
2. Kontrak rumah / House contract
7. Air (PAM/pikulan/beli) / Water
6. Listrik / Electricity
4. Rumah dinas dan lainnya / Official rent and others
Non Food Commodities
(1)
Bukan Makanan dan Daerah Tempat Tinggal, Maret 2012 TabelTable Monthly Average Expenditure per Capita (Rupiah) by Type of Non Food Commodities
and Urban-Rural Classification March 2012
A. PERUMAHAN DAN FASILITAS RUMAH TANGGA
1. Perkiraan sewa rumah sendiri / Imputed house rent
3
http
://www.b
ps.g
o.id
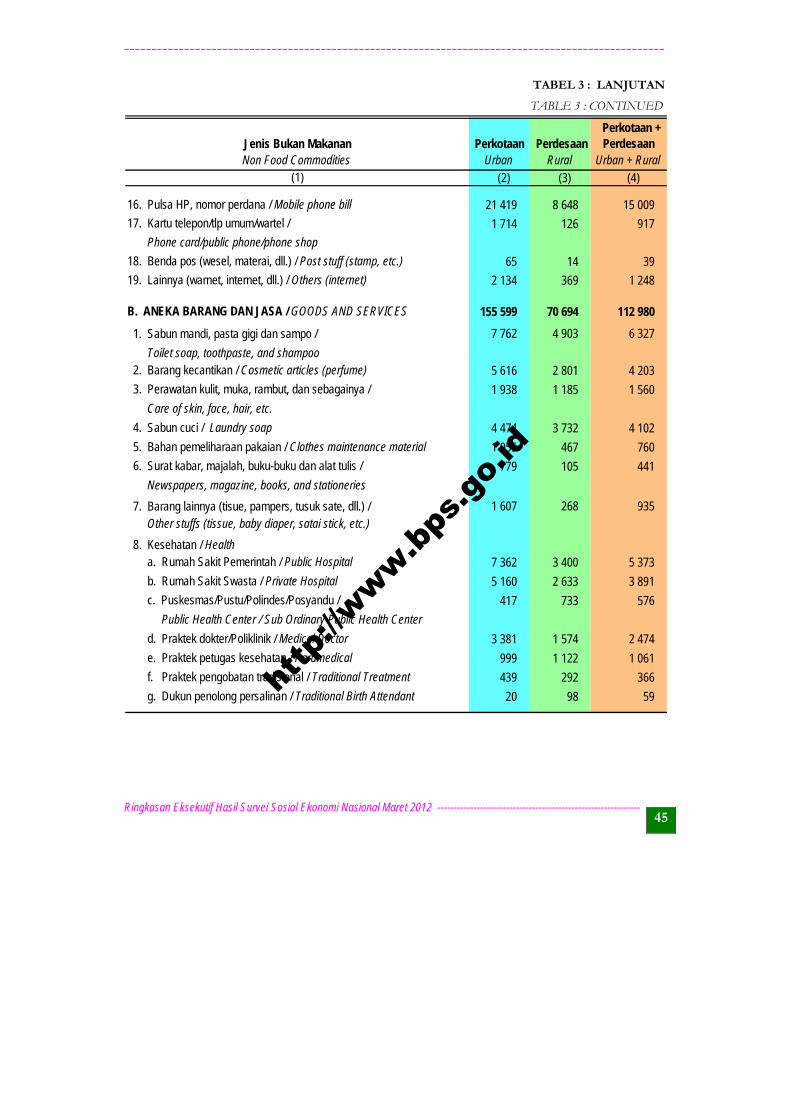
___________________________________________________________________________________________________
Ringkasan Eksekutif Hasil Survei Sosial Ekonomi Nasional Maret 2012 -------------------------------------------------------------- 45
Perkotaan Perdesaan Perkotaan +
PerdesaanUrban Rural Urban + Rural (2) (3) (4)
21 419 8 648 15 009
1 714 126 917
65 14 39
2 134 369 1 248
155 599 70 694 112 980
7 762 4 903 6 327
5 616 2 801 4 203
1 938 1 185 1 560
4 474 3 732 4 102
1 055 467 760
779 105 441
1 607 268 935
7 362 3 400 5 373
5 160 2 633 3 891
417 733 576
3 381 1 574 2 474
999 1 122 1 061
439 292 366
20 98 59
Phone card/public phone/phone shop
Toilet soap, toothpaste, and shampoo
Care of skin, face, hair, etc.
Newspapers, magazine, books, and stationeries
Other stuffs (tissue, baby diaper, satai stick, etc.)
Jenis Bukan MakananNon Food Commodities
(1)
Public Health Center / Sub Ordinary Public Health Center
8. Kesehatan / Health
7. Barang lainnya (tisue, pampers, tusuk sate, dll.) /
6. Surat kabar, majalah, buku-buku dan alat tulis /
a. Rumah Sakit Pemerintah / Public Hospital
19. Lainnya (warnet, internet, dll.) / Others (internet)
4. Sabun cuci / Laundry soap
3. Perawatan kulit, muka, rambut, dan sebagainya /
2. Barang kecantikan / Cosmetic articles (perfume)
1. Sabun mandi, pasta gigi dan sampo /
TABLE 3 : CONTINUED
5. Bahan pemeliharaan pakaian / Clothes maintenance material
d. Praktek dokter/Poliklinik / Medical Doctor
c. Puskesmas/Pustu/Polindes/Posyandu /
b. Rumah Sakit Swasta / Private Hospital
g. Dukun penolong persalinan / Traditional Birth Attendant
f. Praktek pengobatan tradisional / Traditional Treatment
e. Praktek petugas kesehatan / Paramedical
B. ANEKA BARANG DAN JASA / GOODS AND SERVICES
18. Benda pos (wesel, materai, dll.) / Post stuff (stamp, etc.)
17. Kartu telepon/tlp umum/wartel /
16. Pulsa HP, nomor perdana / Mobile phone bill
TABEL 3 : LANJUTAN
http
://www.b
ps.g
o.id
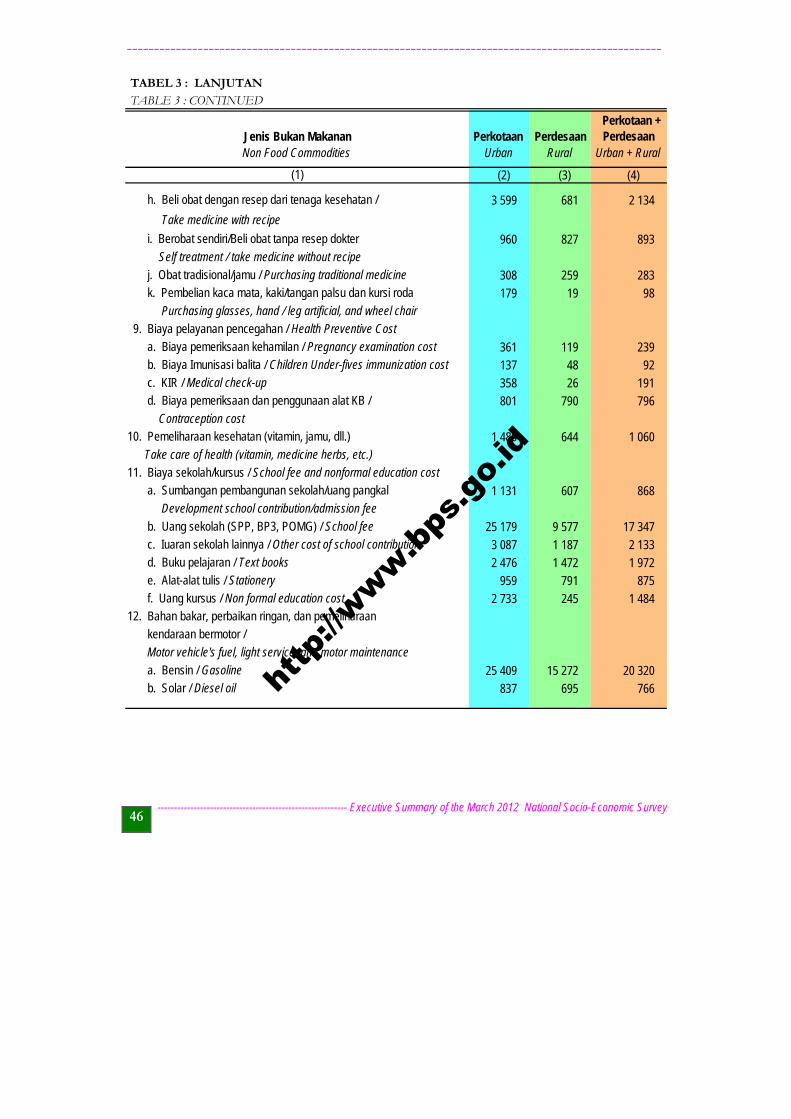
__________________________________________________________________________________________________
---------------------------------------------------------- Executive Summary of the March 2012 National Socio-Economic Survey 46
Perkotaan Perdesaan Perkotaan +
PerdesaanUrban Rural Urban + Rural
(2) (3) (4)
3 599 681 2 134
960 827 893
308 259 283
179 19 98
361 119 239
137 48 92
358 26 191
801 790 796
1 480 644 1 060
1 131 607 868
25 179 9 577 17 347
3 087 1 187 2 133
2 476 1 472 1 972
959 791 875
2 733 245 1 484
25 409 15 272 20 320
837 695 766
Take care of health (vitamin, medicine herbs, etc.)
b. Uang sekolah (SPP, BP3, POMG) / School fee
a. Sumbangan pembangunan sekolah/uang pangkal11. Biaya sekolah/kursus / School fee and nonformal education cost
Development school contribution/admission fee
Jenis Bukan MakananNon Food Commodities
Take medicine with recipe
Self treatment / take medicine without recipe
kendaraan bermotor /
12. Bahan bakar, perbaikan ringan, dan pemeliharaan f. Uang kursus / Non formal education cost
e. Alat-alat tulis / Stationery
d. Buku pelajaran / Text books
c. Iuaran sekolah lainnya / Other cost of school contribution
i. Berobat sendiri/Beli obat tanpa resep dokter
(1)
a. Bensin / Gasoline
TABEL 3 : LANJUTAN
TABLE 3 : CONTINUED
b. Solar / Diesel oil
9. Biaya pelayanan pencegahan / Health Preventive Cost
k. Pembelian kaca mata, kaki/tangan palsu dan kursi roda j. Obat tradisional/jamu / Purchasing traditional medicine
h. Beli obat dengan resep dari tenaga kesehatan /
Purchasing glasses, hand / leg artificial, and wheel chair
b. Biaya Imunisasi balita / Children Under-fives immunization cost
a. Biaya pemeriksaan kehamilan / Pregnancy examination cost
10. Pemeliharaan kesehatan (vitamin, jamu, dll.)
d. Biaya pemeriksaan dan penggunaan alat KB / c. KIR / Medical check-up
Contraception cost
Motor vehicle's fuel, light service, and motor maintenance
http
://www.b
ps.g
o.id
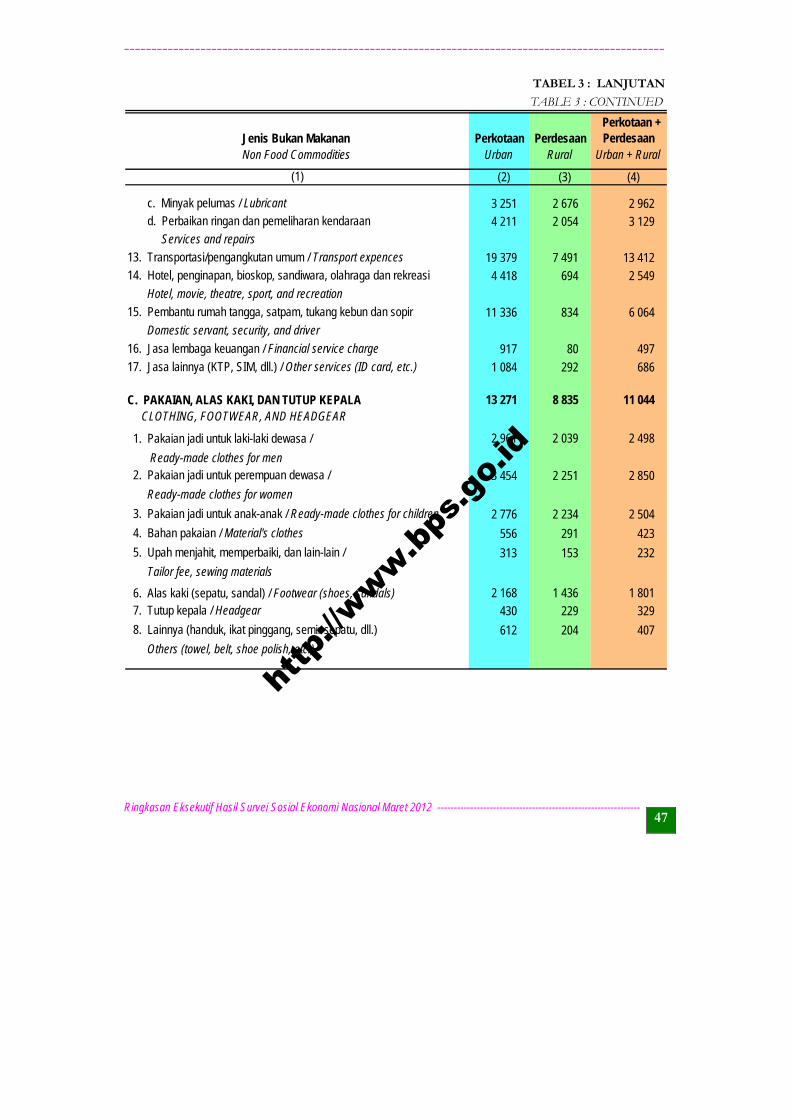
___________________________________________________________________________________________________
Ringkasan Eksekutif Hasil Survei Sosial Ekonomi Nasional Maret 2012 -------------------------------------------------------------- 47
Perkotaan Perdesaan Perkotaan +
PerdesaanUrban Rural Urban + Rural
(2) (3) (4)
3 251 2 676 2 962
4 211 2 054 3 129
19 379 7 491 13 412
4 418 694 2 549
11 336 834 6 064
917 80 497
1 084 292 686
13 271 8 835 11 044
2 961 2 039 2 498
3 454 2 251 2 850
2 776 2 234 2 504
556 291 423
313 153 232
2 168 1 436 1 801
430 229 329
612 204 407
14. Hotel, penginapan, bioskop, sandiwara, olahraga dan rekreasi
Hotel, movie, theatre, sport, and recreation
8. Lainnya (handuk, ikat pinggang, semir sepatu, dll.)
7. Tutup kepala / Headgear 6. Alas kaki (sepatu, sandal) / Footwear (shoes, sandals)
Non Food Commodities
TABEL 3 : LANJUTAN
TABLE 3 : CONTINUED
Jenis Bukan Makanan
5. Upah menjahit, memperbaiki, dan lain-lain /
4. Bahan pakaian / Material's clothes
d. Perbaikan ringan dan pemeliharan kendaraan c. Minyak pelumas / Lubricant
17. Jasa lainnya (KTP, SIM, dll.) / Other services (ID card, etc.)
16. Jasa lembaga keuangan / Financial service charge
15. Pembantu rumah tangga, satpam, tukang kebun dan sopir
(1)
13. Transportasi/pengangkutan umum / Transport expences
CLOTHING, FOOTWEAR, AND HEADGEAR
3. Pakaian jadi untuk anak-anak / Ready-made clothes for children
2. Pakaian jadi untuk perempuan dewasa /
Domestic servant, security, and driver
Services and repairs
1. Pakaian jadi untuk laki-laki dewasa /
C. PAKAIAN, ALAS KAKI, DAN TUTUP KEPALA
Tailor fee, sewing materials
Others (towel, belt, shoe polish, etc.)
Ready-made clothes for men
Ready-made clothes for women
http
://www.b
ps.g
o.id
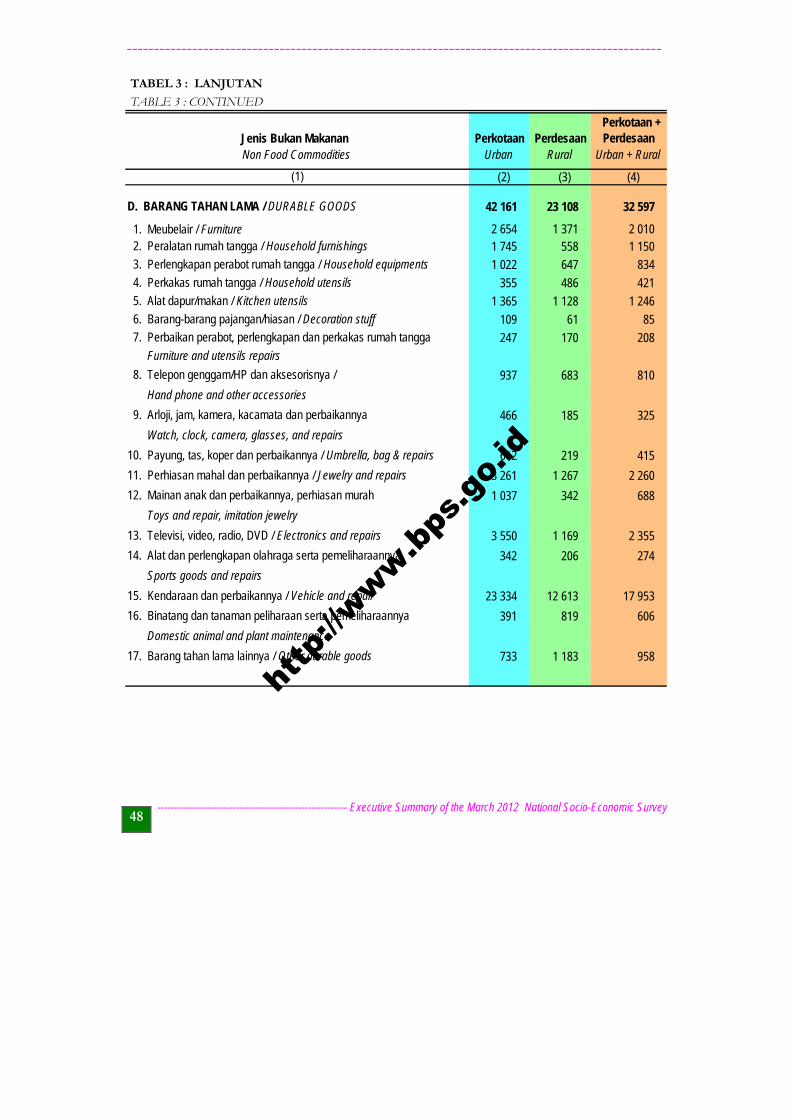
__________________________________________________________________________________________________
---------------------------------------------------------- Executive Summary of the March 2012 National Socio-Economic Survey 48
Perkotaan Perdesaan Perkotaan +
PerdesaanUrban Rural Urban + Rural
(2) (3) (4)
42 161 23 108 32 597
2 654 1 371 2 0101 745 558 1 150
1 022 647 834
355 486 421
1 365 1 128 1 246
109 61 85
247 170 208
937 683 810
466 185 325
612 219 415
3 261 1 267 2 260
1 037 342 688
3 550 1 169 2 355
342 206 274
23 334 12 613 17 953
391 819 606
733 1 183 958
TABEL 3 : LANJUTAN
TABLE 3 : CONTINUED
Jenis Bukan Makanan Non Food Commodities
5. Alat dapur/makan / Kitchen utensils
(1)
Hand phone and other accessories
Watch, clock, camera, glasses, and repairs
11. Perhiasan mahal dan perbaikannya / Jewelry and repairs
17. Barang tahan lama lainnya / Other durable goods
16. Binatang dan tanaman peliharaan serta pemeliharaannya
15. Kendaraan dan perbaikannya / Vehicle and repair
14. Alat dan perlengkapan olahraga serta pemeliharaannya
13. Televisi, video, radio, DVD / Electronics and repairs
12. Mainan anak dan perbaikannya, perhiasan murah
Domestic animal and plant maintenance
Toys and repair, imitation jewelry
Sports goods and repairs
10. Payung, tas, koper dan perbaikannya / Umbrella, bag & repairs
9. Arloji, jam, kamera, kacamata dan perbaikannya
8. Telepon genggam/HP dan aksesorisnya /
Furniture and utensils repairs
7. Perbaikan perabot, perlengkapan dan perkakas rumah tangga
6. Barang-barang pajangan/hiasan / Decoration stuff
4. Perkakas rumah tangga / Household utensils
3. Perlengkapan perabot rumah tangga / Household equipments
2. Peralatan rumah tangga / Household furnishings 1. Meubelair / Furniture
D. BARANG TAHAN LAMA / DURABLE GOODS
http
://www.b
ps.g
o.id
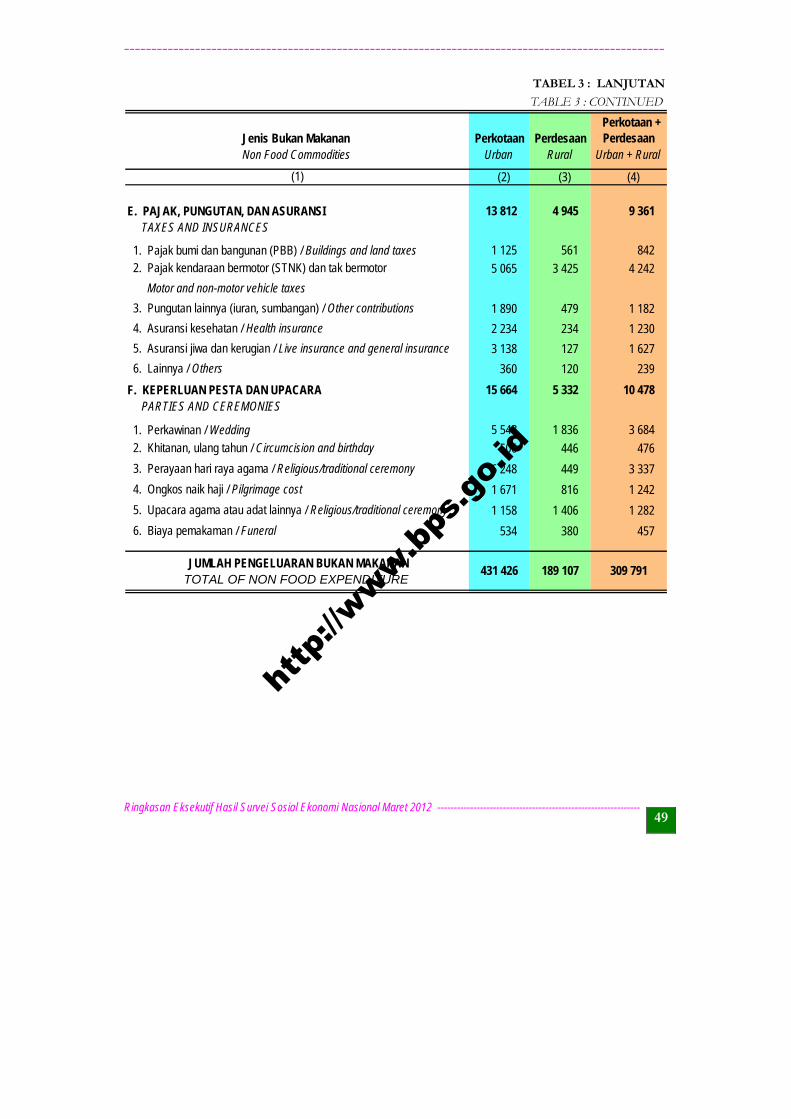
___________________________________________________________________________________________________
Ringkasan Eksekutif Hasil Survei Sosial Ekonomi Nasional Maret 2012 -------------------------------------------------------------- 49
Perkotaan Perdesaan Perkotaan +
PerdesaanUrban Rural Urban + Rural
(2) (3) (4)
13 812 4 945 9 361
1 125 561 842
5 065 3 425 4 242
1 890 479 1 182
2 234 234 1 230
3 138 127 1 627
360 120 239
15 664 5 332 10 478
5 548 1 836 3 684
506 446 476
6 248 449 3 337
1 671 816 1 242
1 158 1 406 1 282
534 380 457
JUMLAH PENGELUARAN BUKAN MAKANAN
E. PAJAK, PUNGUTAN, DAN ASURANSI
1. Perkawinan / Wedding
F. KEPERLUAN PESTA DAN UPACARA
3. Pungutan lainnya (iuran, sumbangan) / Other contributions
2. Pajak kendaraan bermotor (STNK) dan tak bermotor 1. Pajak bumi dan bangunan (PBB) / Buildings and land taxes
6. Biaya pemakaman / Funeral
5. Upacara agama atau adat lainnya / Religious/traditional ceremony
4. Ongkos naik haji / Pilgrimage cost
3. Perayaan hari raya agama / Religious/traditional ceremony
2. Khitanan, ulang tahun / Circumcision and birthday
TAXES AND INSURANCES
Motor and non-motor vehicle taxes
6. Lainnya / Others
5. Asuransi jiwa dan kerugian / Live insurance and general insurance
4. Asuransi kesehatan / Health insurance
TOTAL OF NON FOOD EXPENDITURE431 426
(1)
189 107 309 791
Non Food Commodities
TABEL 3 : LANJUTAN
TABLE 3 : CONTINUED
Jenis Bukan Makanan
PARTIES AND CEREMONIES
http
://www.b
ps.g
o.id
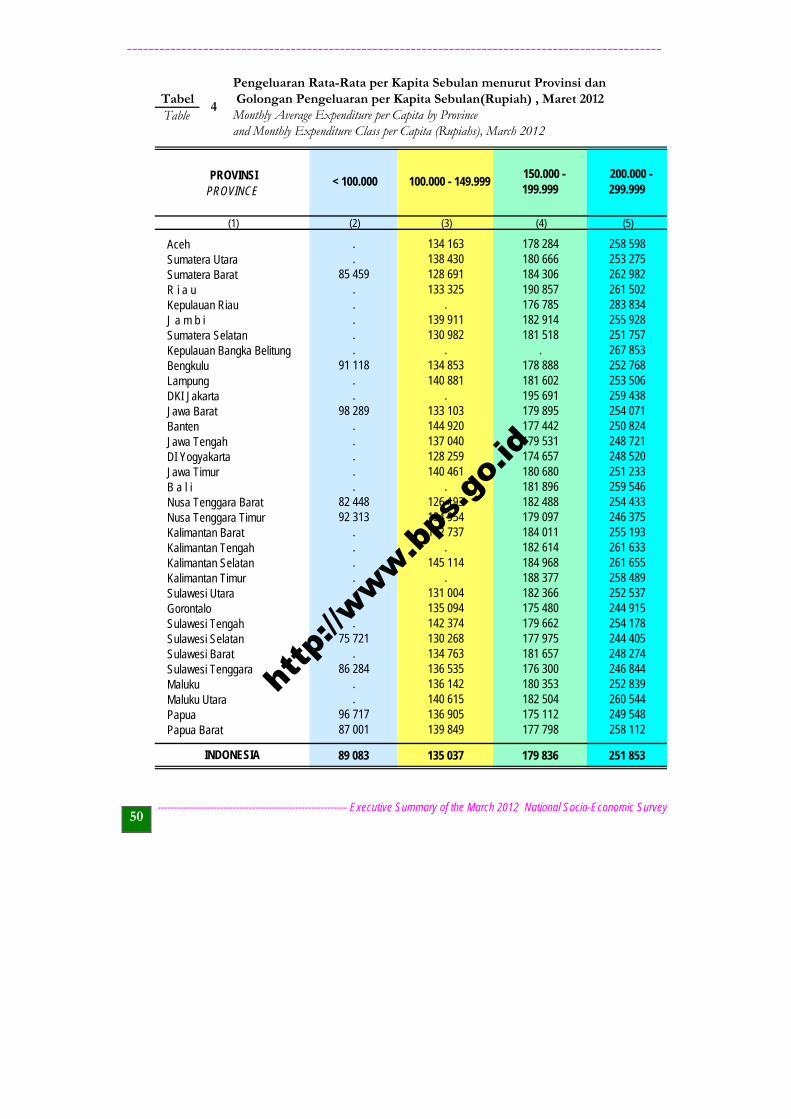
__________________________________________________________________________________________________
---------------------------------------------------------- Executive Summary of the March 2012 National Socio-Economic Survey 50
(2) (3) (4) (5)
. 134 163 178 284 258 598
. 138 430 180 666 253 27585 459 128 691 184 306 262 982
. 133 325 190 857 261 502
. . 176 785 283 834
. 139 911 182 914 255 928
. 130 982 181 518 251 757
. . . 267 85391 118 134 853 178 888 252 768
. 140 881 181 602 253 506
. . 195 691 259 43898 289 133 103 179 895 254 071
. 144 920 177 442 250 824
. 137 040 179 531 248 721
. 128 259 174 657 248 520
. 140 461 180 680 251 233
. . 181 896 259 54682 448 126 193 182 488 254 43392 313 134 954 179 097 246 375
. 142 737 184 011 255 193
. . 182 614 261 633
. 145 114 184 968 261 655
. . 188 377 258 489
. 131 004 182 366 252 537
. 135 094 175 480 244 915
. 142 374 179 662 254 17875 721 130 268 177 975 244 405
. 134 763 181 657 248 27486 284 136 535 176 300 246 844
. 136 142 180 353 252 839
. 140 615 182 504 260 54496 717 136 905 175 112 249 54887 001 139 849 177 798 258 112
89 083 135 037 179 836 251 853
PROVINCE 200.000 -
299.999 150.000 -
199.999 100.000 - 149.999 < 100.000
Aceh
and Monthly Expenditure Class per Capita (Rupiahs), March 2012 Monthly Average Expenditure per Capita by Province Golongan Pengeluaran per Kapita Sebulan(Rupiah) , Maret 2012 Pengeluaran Rata-Rata per Kapita Sebulan menurut Provinsi dan
Sumatera SelatanJ a m b iKepulauan RiauR i a u Sumatera Barat
DI YogyakartaJawa Tengah
Sumatera Utara
Banten Jawa BaratDKI JakartaLampungBengkuluKepulauan Bangka Belitung
Kalimantan TengahKalimantan BaratNusa Tenggara TimurNusa Tenggara BaratB a l iJawa Timur
Sulawesi SelatanSulawesi TengahGorontaloSulawesi UtaraKalimantan TimurKalimantan Selatan
(1)
INDONESIA
Papua BaratPapua Maluku UtaraMalukuSulawesi TenggaraSulawesi Barat
TabelTable
4
PROVINSI
http
://www.b
ps.g
o.id
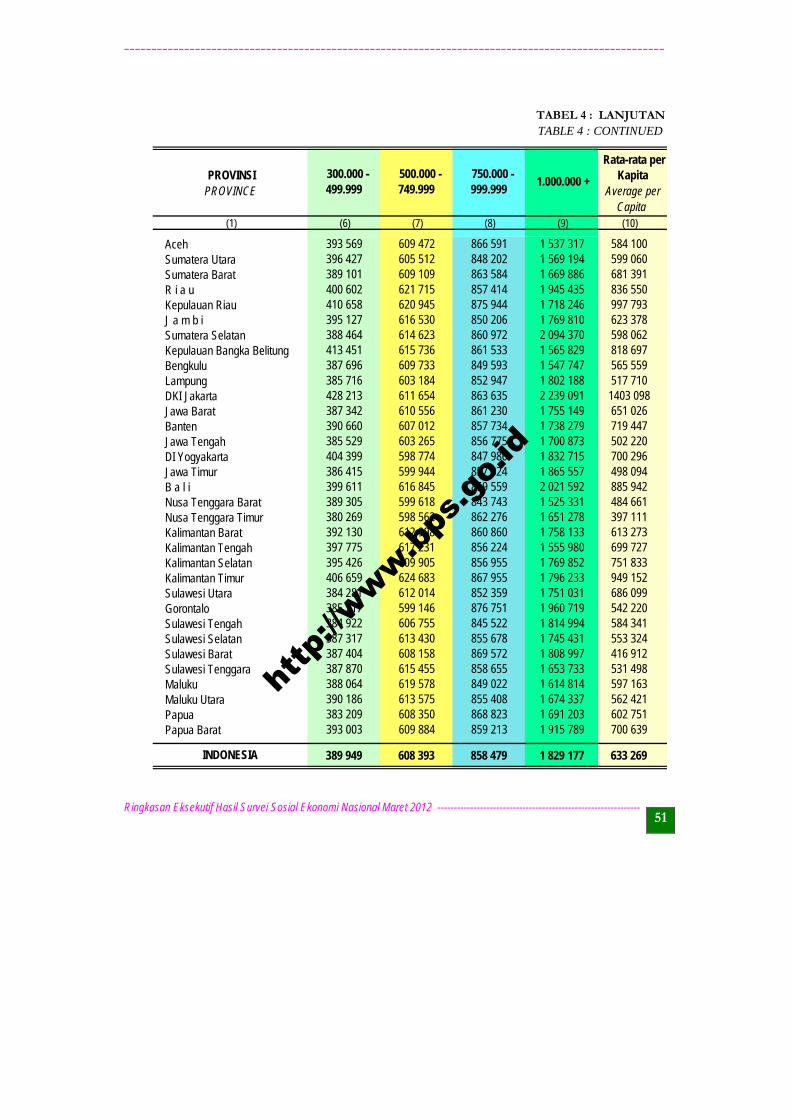
___________________________________________________________________________________________________
Ringkasan Eksekutif Hasil Survei Sosial Ekonomi Nasional Maret 2012 -------------------------------------------------------------- 51
(6) (7) (8) (9) (10)
393 569 609 472 866 591 1 537 317 584 100396 427 605 512 848 202 1 569 194 599 060389 101 609 109 863 584 1 669 886 681 391400 602 621 715 857 414 1 945 435 836 550410 658 620 945 875 944 1 718 246 997 793395 127 616 530 850 206 1 769 810 623 378388 464 614 623 860 972 2 094 370 598 062413 451 615 736 861 533 1 565 829 818 697387 696 609 733 849 593 1 547 747 565 559385 716 603 184 852 947 1 802 188 517 710428 213 611 654 863 635 2 239 091 1403 098387 342 610 556 861 230 1 755 149 651 026390 660 607 012 857 734 1 738 279 719 447385 529 603 265 856 775 1 700 873 502 220404 399 598 774 847 986 1 832 715 700 296386 415 599 944 857 824 1 865 557 498 094399 611 616 845 859 559 2 021 592 885 942389 305 599 618 843 743 1 525 331 484 661380 269 598 562 862 276 1 651 278 397 111392 130 612 998 860 860 1 758 133 613 273397 775 617 231 856 224 1 555 980 699 727395 426 609 905 856 955 1 769 852 751 833406 659 624 683 867 955 1 796 233 949 152384 281 612 014 852 359 1 751 031 686 099385 217 599 146 876 751 1 960 719 542 220384 922 606 755 845 522 1 814 994 584 341387 317 613 430 855 678 1 745 431 553 324387 404 608 158 869 572 1 808 997 416 912387 870 615 455 858 655 1 653 733 531 498388 064 619 578 849 022 1 614 814 597 163390 186 613 575 855 408 1 674 337 562 421383 209 608 350 868 823 1 691 203 602 751393 003 609 884 859 213 1 915 789 700 639
389 949 608 393 858 479 1 829 177 633 269
500.000 - 749.999
300.000 - 499.999
TABLE 4 : CONTINUED
PROVINCE 1.000.000 +
750.000 - 999.999
MalukuMaluku UtaraPapua
Nusa Tenggara BaratNusa Tenggara TimurKalimantan BaratKalimantan Tengah
Papua Barat
INDONESIA
Sulawesi UtaraGorontaloSulawesi TengahSulawesi SelatanSulawesi Barat Sulawesi Tenggara
Kalimantan SelatanKalimantan Timur
Jawa BaratBanten Jawa TengahDI YogyakartaJawa TimurB a l i
J a m b iSumatera SelatanKepulauan Bangka BelitungBengkuluLampungDKI Jakarta
(1)
AcehSumatera UtaraSumatera BaratR i a u Kepulauan Riau
PROVINSI Rata-rata per
Kapita Average per
Capita
TABEL 4 : LANJUTAN
http
://www.b
ps.g
o.id
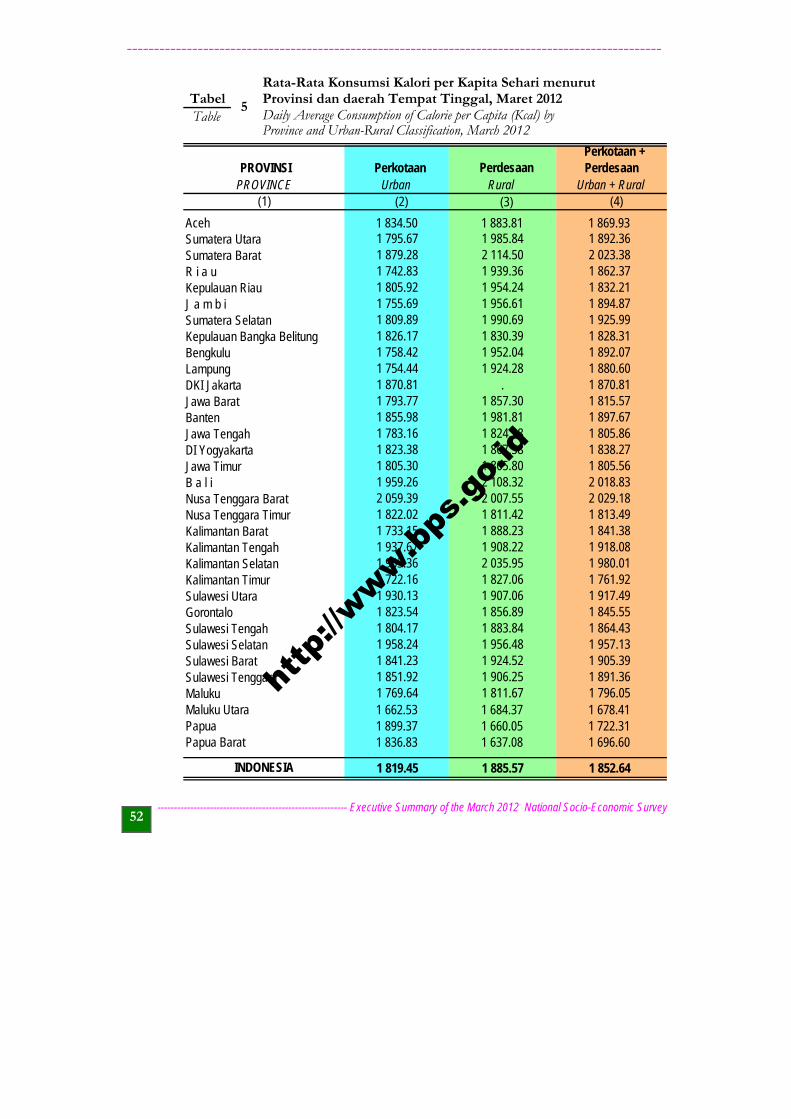
__________________________________________________________________________________________________
---------------------------------------------------------- Executive Summary of the March 2012 National Socio-Economic Survey 52
Perkotaan Perdesaan Urban Rural (2) (3)
1 834.50 1 883.81 1 869.931 795.67 1 985.84 1 892.361 879.28 2 114.50 2 023.381 742.83 1 939.36 1 862.371 805.92 1 954.24 1 832.211 755.69 1 956.61 1 894.871 809.89 1 990.69 1 925.991 826.17 1 830.39 1 828.311 758.42 1 952.04 1 892.071 754.44 1 924.28 1 880.601 870.81 . 1 870.811 793.77 1 857.30 1 815.571 855.98 1 981.81 1 897.671 783.16 1 824.98 1 805.861 823.38 1 867.38 1 838.271 805.30 1 805.80 1 805.561 959.26 2 108.32 2 018.832 059.39 2 007.55 2 029.181 822.02 1 811.42 1 813.491 733.15 1 888.23 1 841.381 937.67 1 908.22 1 918.081 903.36 2 035.95 1 980.011 722.16 1 827.06 1 761.921 930.13 1 907.06 1 917.491 823.54 1 856.89 1 845.551 804.17 1 883.84 1 864.431 958.24 1 956.48 1 957.131 841.23 1 924.52 1 905.391 851.92 1 906.25 1 891.361 769.64 1 811.67 1 796.051 662.53 1 684.37 1 678.411 899.37 1 660.05 1 722.311 836.83 1 637.08 1 696.60
1 819.45 1 885.57 1 852.64
Tabel 5
Rata-Rata Konsumsi Kalori per Kapita Sehari menurut Provinsi dan daerah Tempat Tinggal, Maret 2012
Province and Urban-Rural Classification, March 2012 Daily Average Consumption of Calorie per Capita (Kcal) by
Perkotaan + Perdesaan
Urban + Rural
Papua Barat
DKI JakartaLampung
Maluku
(1) (4)
Banten Jawa Tengah
Jawa Barat
AcehSumatera Utara
Sulawesi Tenggara
Kalimantan TengahKalimantan Selatan
INDONESIA
B a l iNusa Tenggara BaratNusa Tenggara TimurKalimantan Barat
Gorontalo
Maluku UtaraPapua
Table
PROVINSI PROVINCE
Bengkulu
Sumatera BaratR i a u Kepulauan RiauJ a m b iSumatera SelatanKepulauan Bangka Belitung
Sulawesi TengahSulawesi SelatanSulawesi Barat
Kalimantan TimurSulawesi Utara
DI YogyakartaJawa Timur
http
://www.b
ps.g
o.id
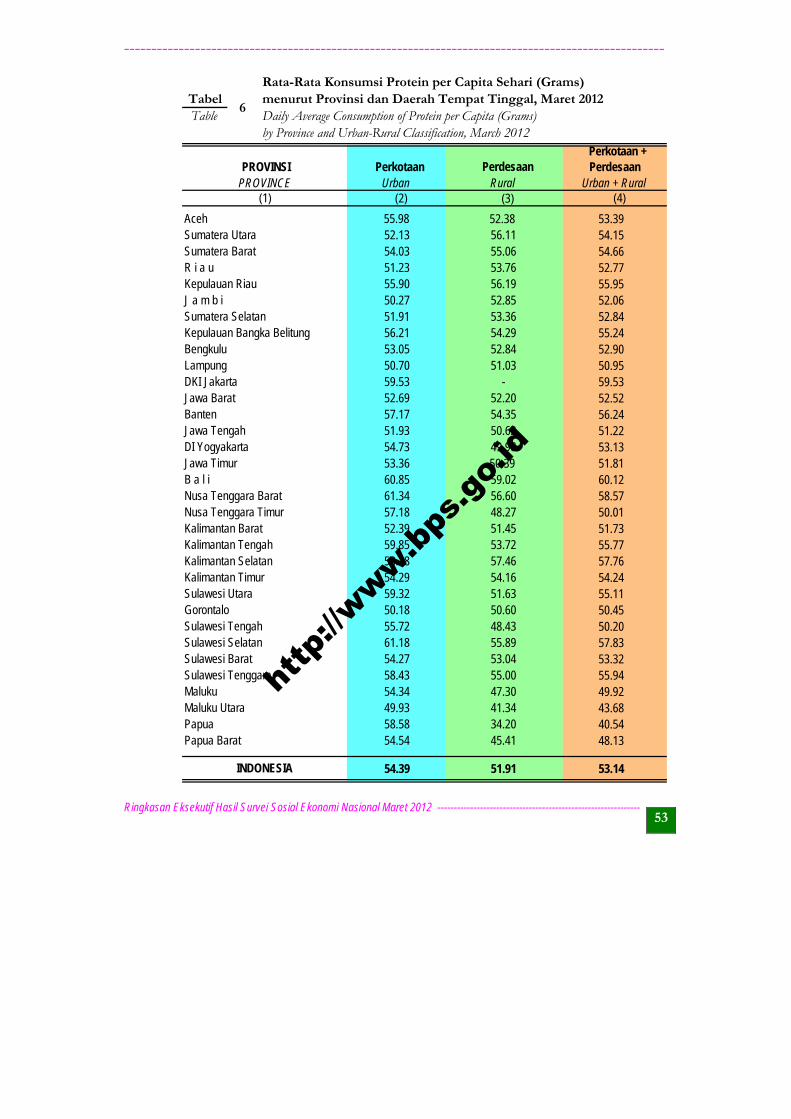
___________________________________________________________________________________________________
Ringkasan Eksekutif Hasil Survei Sosial Ekonomi Nasional Maret 2012 -------------------------------------------------------------- 53
Perkotaan Perdesaan Urban Rural (2) (3)
55.98 52.38 53.3952.13 56.11 54.1554.03 55.06 54.6651.23 53.76 52.7755.90 56.19 55.9550.27 52.85 52.0651.91 53.36 52.8456.21 54.29 55.2453.05 52.84 52.9050.70 51.03 50.9559.53 - 59.5352.69 52.20 52.5257.17 54.35 56.2451.93 50.62 51.2254.73 49.98 53.1353.36 50.39 51.8160.85 59.02 60.1261.34 56.60 58.5757.18 48.27 50.0152.39 51.45 51.7359.85 53.72 55.7758.18 57.46 57.7654.29 54.16 54.2459.32 51.63 55.1150.18 50.60 50.4555.72 48.43 50.2061.18 55.89 57.8354.27 53.04 53.3258.43 55.00 55.9454.34 47.30 49.9249.93 41.34 43.6858.58 34.20 40.5454.54 45.41 48.13
54.39 51.91 53.14
Perkotaan + Perdesaan
PROVINCE Urban + Rural (4)
Maluku UtaraPapua Papua Barat
INDONESIA
6Table
by Province and Urban-Rural Classification, March 2012 Daily Average Consumption of Protein per Capita (Grams) menurut Provinsi dan Daerah Tempat Tinggal, Maret 2012 Rata-Rata Konsumsi Protein per Capita Sehari (Grams)
Kalimantan TimurSulawesi UtaraGorontaloSulawesi TengahSulawesi Selatan
PROVINSI
(1)
AcehSumatera Utara
B a l iNusa Tenggara Barat
Sumatera Selatan
Sulawesi Barat
DKI JakartaJawa BaratBanten Jawa TengahDI YogyakartaJawa Timur
Sulawesi TenggaraMaluku
Nusa Tenggara TimurKalimantan BaratKalimantan TengahKalimantan Selatan
Tabel
Kepulauan Bangka BelitungBengkuluLampung
R i a u Kepulauan RiauJ a m b i
Sumatera Barat
http
://www.b
ps.g
o.id

__________________________________________________________________________________________________
---------------------------------------------------------- Executive Summary of the March 2012 National Socio-Economic Survey 54
TabelTable
Satuan Kalori (kkal) Protein (gram)Unit Calorie (kcal) Protein (grams)
(1) (3) (4) (5)002 Beras / Rice Kg 3 622.00 84.75003 Beras ketan / Glutinous rice Kg 3 605.00 77.00004 Jagung basah dgn kulit / Fresh corn with husk Kg 361.20 11.48005 Jagung pocelan/pipilan / Dryshelled corn/corn rice Kg 3 200.00 82.80006 Tepung beras / Rice meal Kg 3 640.00 70.00007 Tepung jagung (maizena) / Corn meal Kg 3 550.00 92.00008 Tepung terigu / Wheat flour Kg 3 330.00 90.00009 Lainnya / Others Kg 3 520.00 73.00011 Ketela pohon / Cassava Kg 1 309.00 8.50012 Ketela rambat / Sweet potatoes Kg 1 252.20 11.78013 Sagu / Sago flour Kg 3 380.00 6.00014 Tales/Keladi / Taro Kg 1 135.40 15.50015 Kentang / Potatoes Kg 520.80 17.64016 Gaplek / Dried cassava Kg 3 380.00017 Tepung gaplek (tiwul) / Flour dried cassava Kg 3 630.00 11.00018 Tepung ketela pohon / Cassava flour Kg 3 620.00 5.00019 Lainnya / Others Kg 1 794.50 13.00021 Ekor kuning / Yellow tail/fusiliers Kg 872.00 136.00022 Tongkol/Tuna/Cakalang / Eastern tuna/skipjack tuna Kg 904.00 136.00023 Tenggiri / Mackerel Kg 904.00 136.00024 Selar / Trevallies Kg 480.00 90.24025 Kembung / Indian mackerel Kg 824.00 176.00026 Teri / Anchovies Kg 740.00 103.00027 Bandeng / Milk fish Kg 1 032.00 160.00028 Gabus / Snake head Kg 477.40 76.88029 Mujair / Mozambique tilapia Kg 712.00 149.60030 Mas / Common carp Kg 688.00 128.00031 Lele / Catfish Kg 477.40 76.88032 Kakap / Barramundi Kg 736.00 160.00033 Baronang / Baronang Kg 1 200.00 165.00034 Lainnya / Others Kg 904.00 136.00035 Udang / Shrimp Kg 618.80 142.80036 Cumi-cumi/Sotong / Common squid/cuttle fish Kg 750.00 161.00037 Ketam/Kepiting/Rajungan / Mud crab/swim crab Kg 679.50 62.10038 Kerang/Siput / Cockle/snail Kg 1 010.00 144.00
*) No komoditi berdasarkan no urut pada kuesioner Susenas Modul
*) Commodity number is based on a Module Susenas questionnaire
No *CommodityKomoditi
(2)
7Daftar Konversi Zat Gizi (Kalori dan Protein)
List Convertion Nutrition (Calorie and Protein)
http
://www.b
ps.g
o.id
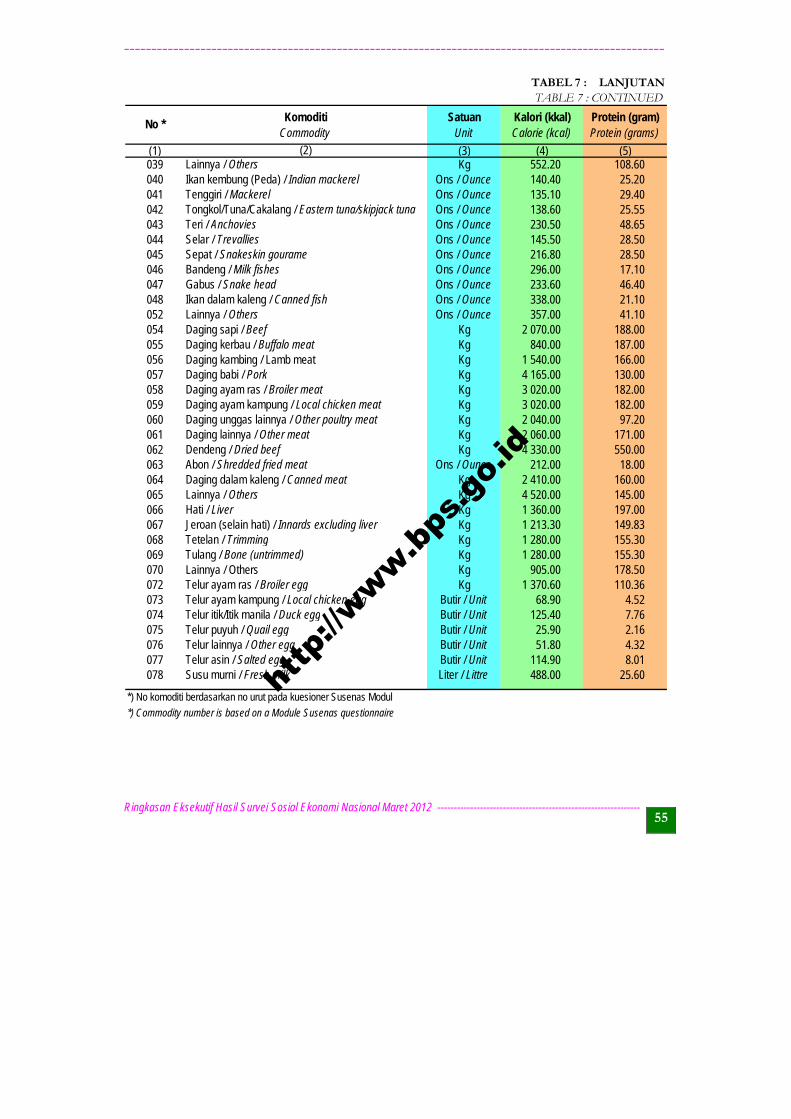
___________________________________________________________________________________________________
Ringkasan Eksekutif Hasil Survei Sosial Ekonomi Nasional Maret 2012 -------------------------------------------------------------- 55
Satuan Kalori (kkal) Protein (gram)Unit Calorie (kcal) Protein (grams)
(1) (3) (4) (5)039 Lainnya / Others Kg 552.20 108.60040 Ikan kembung (Peda) / Indian mackerel Ons / Ounce 140.40 25.20041 Tenggiri / Mackerel Ons / Ounce 135.10 29.40042 Tongkol/Tuna/Cakalang / Eastern tuna/skipjack tuna Ons / Ounce 138.60 25.55043 Teri / Anchovies Ons / Ounce 230.50 48.65044 Selar / Trevallies Ons / Ounce 145.50 28.50045 Sepat / Snakeskin gourame Ons / Ounce 216.80 28.50046 Bandeng / Milk fishes Ons / Ounce 296.00 17.10047 Gabus / Snake head Ons / Ounce 233.60 46.40048 Ikan dalam kaleng / Canned fish Ons / Ounce 338.00 21.10052 Lainnya / Others Ons / Ounce 357.00 41.10054 Daging sapi / Beef Kg 2 070.00 188.00055 Daging kerbau / Buffalo meat Kg 840.00 187.00056 Daging kambing / Lamb meat Kg 1 540.00 166.00057 Daging babi / Pork Kg 4 165.00 130.00058 Daging ayam ras / Broiler meat Kg 3 020.00 182.00059 Daging ayam kampung / Local chicken meat Kg 3 020.00 182.00060 Daging unggas lainnya / Other poultry meat Kg 2 040.00 97.20061 Daging lainnya / Other meat Kg 2 060.00 171.00062 Dendeng / Dried beef Kg 4 330.00 550.00063 Abon / Shredded fried meat Ons / Ounce 212.00 18.00064 Daging dalam kaleng / Canned meat Kg 2 410.00 160.00065 Lainnya / Others Kg 4 520.00 145.00066 Hati / Liver Kg 1 360.00 197.00067 Jeroan (selain hati) / Innards excluding liver Kg 1 213.30 149.83068 Tetelan / Trimming Kg 1 280.00 155.30069 Tulang / Bone (untrimmed) Kg 1 280.00 155.30070 Lainnya / Others Kg 905.00 178.50072 Telur ayam ras / Broiler egg Kg 1 370.60 110.36073 Telur ayam kampung / Local chicken egg Butir / Unit 68.90 4.52074 Telur itik/Itik manila / Duck egg Butir / Unit 125.40 7.76075 Telur puyuh / Quail egg Butir / Unit 25.90 2.16076 Telur lainnya / Other egg Butir / Unit 51.80 4.32077 Telur asin / Salted egg Butir / Unit 114.90 8.01078 Susu murni / Fresh milk Liter / Littre 488.00 25.60
*) No komoditi berdasarkan no urut pada kuesioner Susenas Modul
*) Commodity number is based on a Module Susenas questionnaire
No *Komoditi
Commodity(2)
TABEL 7 : LANJUTANTABLE 7 : CONTINUED
http
://www.b
ps.g
o.id
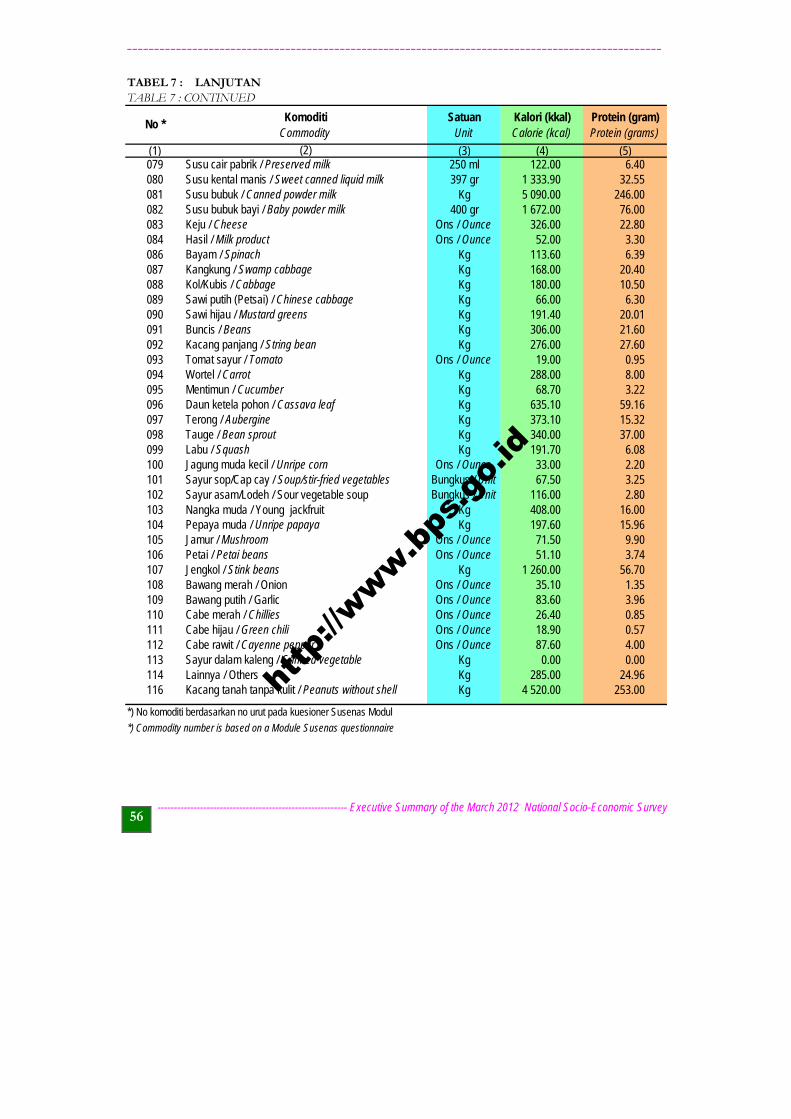
__________________________________________________________________________________________________
---------------------------------------------------------- Executive Summary of the March 2012 National Socio-Economic Survey 56
Satuan Kalori (kkal) Protein (gram)Unit Calorie (kcal) Protein (grams)
(1) (3) (4) (5)079 Susu cair pabrik / Preserved milk 250 ml 122.00 6.40080 Susu kental manis / Sweet canned liquid milk 397 gr 1 333.90 32.55081 Susu bubuk / Canned powder milk Kg 5 090.00 246.00082 Susu bubuk bayi / Baby powder milk 400 gr 1 672.00 76.00083 Keju / Cheese Ons / Ounce 326.00 22.80084 Hasil / Milk product Ons / Ounce 52.00 3.30086 Bayam / Spinach Kg 113.60 6.39087 Kangkung / Swamp cabbage Kg 168.00 20.40088 Kol/Kubis / Cabbage Kg 180.00 10.50089 Sawi putih (Petsai) / Chinese cabbage Kg 66.00 6.30090 Sawi hijau / Mustard greens Kg 191.40 20.01091 Buncis / Beans Kg 306.00 21.60092 Kacang panjang / String bean Kg 276.00 27.60093 Tomat sayur / Tomato Ons / Ounce 19.00 0.95094 Wortel / Carrot Kg 288.00 8.00095 Mentimun / Cucumber Kg 68.70 3.22096 Daun ketela pohon / Cassava leaf Kg 635.10 59.16097 Terong / Aubergine Kg 373.10 15.32098 Tauge / Bean sprout Kg 340.00 37.00099 Labu / Squash Kg 191.70 6.08100 Jagung muda kecil / Unripe corn Ons / Ounce 33.00 2.20101 Sayur sop/Cap cay / Soup/stir-fried vegetables Bungkus / Unit 67.50 3.25102 Sayur asam/Lodeh / Sour vegetable soup Bungkus / Unit 116.00 2.80103 Nangka muda / Young jackfruit Kg 408.00 16.00104 Pepaya muda / Unripe papaya Kg 197.60 15.96105 Jamur / Mushroom Ons / Ounce 71.50 9.90106 Petai / Petai beans Ons / Ounce 51.10 3.74107 Jengkol / Stink beans Kg 1 260.00 56.70108 Bawang merah / Onion Ons / Ounce 35.10 1.35109 Bawang putih / Garlic Ons / Ounce 83.60 3.96110 Cabe merah / Chillies Ons / Ounce 26.40 0.85111 Cabe hijau / Green chili Ons / Ounce 18.90 0.57112 Cabe rawit / Cayenne pepper Ons / Ounce 87.60 4.00113 Sayur dalam kaleng / Canned vegetable Kg 0.00 0.00114 Lainnya / Others Kg 285.00 24.96116 Kacang tanah tanpa kulit / Peanuts without shell Kg 4 520.00 253.00
*) No komoditi berdasarkan no urut pada kuesioner Susenas Modul
*) Commodity number is based on a Module Susenas questionnaire
TABEL 7 : LANJUTANTABLE 7 : CONTINUED
No *Komoditi
Commodity(2)
http
://www.b
ps.g
o.id
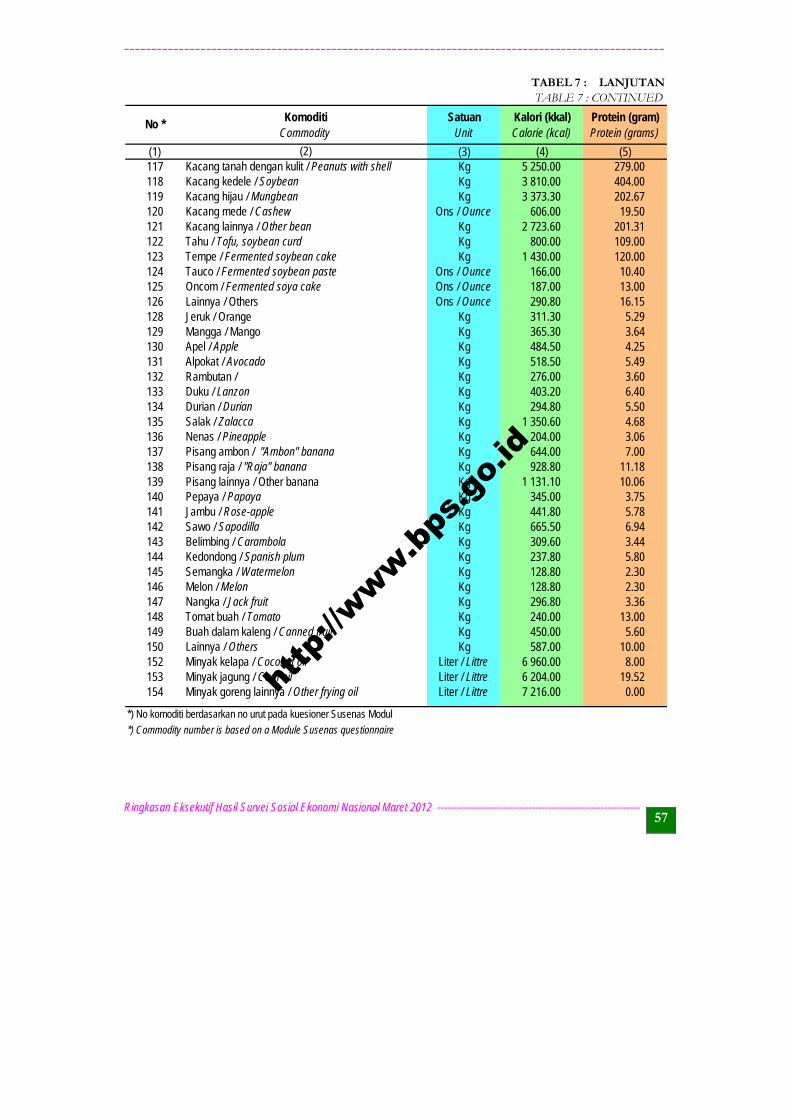
___________________________________________________________________________________________________
Ringkasan Eksekutif Hasil Survei Sosial Ekonomi Nasional Maret 2012 -------------------------------------------------------------- 57
Satuan Kalori (kkal) Protein (gram)Unit Calorie (kcal) Protein (grams)
(1) (3) (4) (5)117 Kacang tanah dengan kulit / Peanuts with shell Kg 5 250.00 279.00118 Kacang kedele / Soybean Kg 3 810.00 404.00119 Kacang hijau / Mungbean Kg 3 373.30 202.67120 Kacang mede / Cashew Ons / Ounce 606.00 19.50121 Kacang lainnya / Other bean Kg 2 723.60 201.31122 Tahu / Tofu, soybean curd Kg 800.00 109.00123 Tempe / Fermented soybean cake Kg 1 430.00 120.00124 Tauco / Fermented soybean paste Ons / Ounce 166.00 10.40125 Oncom / Fermented soya cake Ons / Ounce 187.00 13.00126 Lainnya / Others Ons / Ounce 290.80 16.15128 Jeruk / Orange Kg 311.30 5.29129 Mangga / Mango Kg 365.30 3.64130 Apel / Apple Kg 484.50 4.25131 Alpokat / Avocado Kg 518.50 5.49132 Rambutan / Kg 276.00 3.60133 Duku / Lanzon Kg 403.20 6.40134 Durian / Durian Kg 294.80 5.50135 Salak / Zalacca Kg 1 350.60 4.68136 Nenas / Pineapple Kg 204.00 3.06137 Pisang ambon / "Ambon" banana Kg 644.00 7.00138 Pisang raja / "Raja" banana Kg 928.80 11.18139 Pisang lainnya / Other banana Kg 1 131.10 10.06140 Pepaya / Papaya Kg 345.00 3.75141 Jambu / Rose-apple Kg 441.80 5.78142 Sawo / Sapodilla Kg 665.50 6.94143 Belimbing / Carambola Kg 309.60 3.44144 Kedondong / Spanish plum Kg 237.80 5.80145 Semangka / Watermelon Kg 128.80 2.30146 Melon / Melon Kg 128.80 2.30147 Nangka / Jack fruit Kg 296.80 3.36148 Tomat buah / Tomato Kg 240.00 13.00149 Buah dalam kaleng / Canned fruit Kg 450.00 5.60150 Lainnya / Others Kg 587.00 10.00152 Minyak kelapa / Coconut oil Liter / Littre 6 960.00 8.00153 Minyak jagung / Corn oil Liter / Littre 6 204.00 19.52154 Minyak goreng lainnya / Other frying oil Liter / Littre 7 216.00 0.00
*) No komoditi berdasarkan no urut pada kuesioner Susenas Modul
*) Commodity number is based on a Module Susenas questionnaire
(2)
KomoditiCommodity
No *
TABEL 7 : LANJUTANTABLE 7 : CONTINUED
http
://www.b
ps.g
o.id
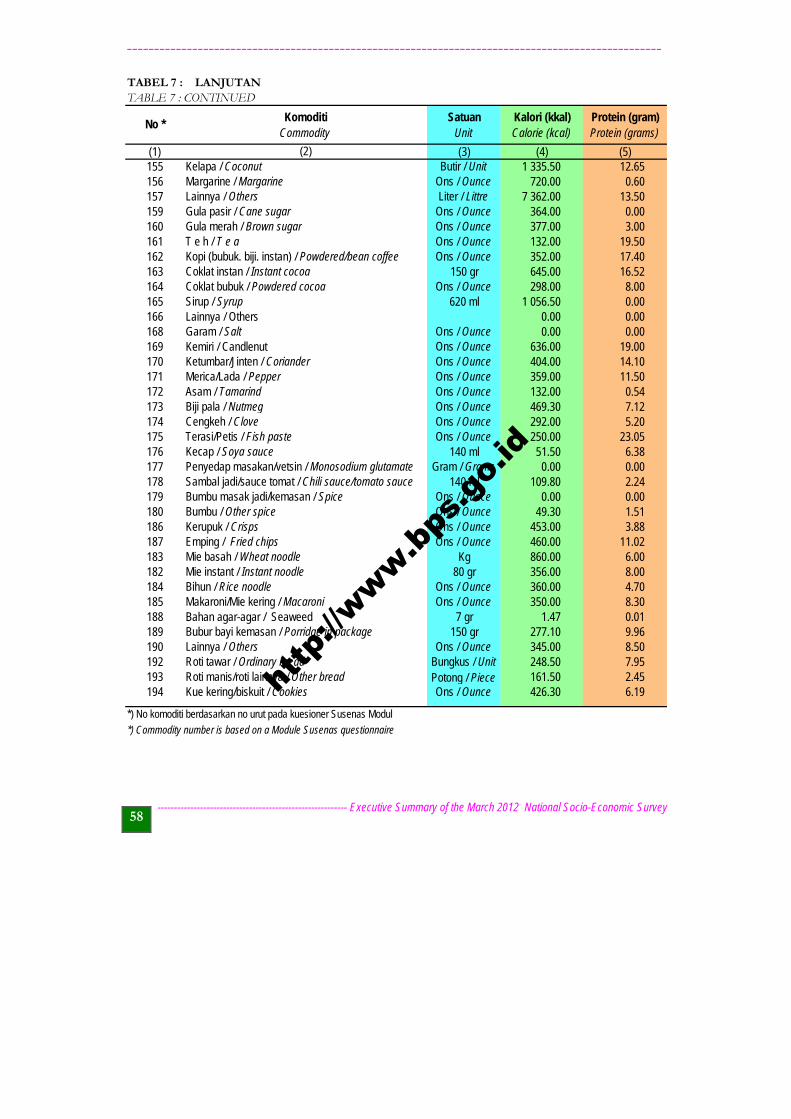
__________________________________________________________________________________________________
---------------------------------------------------------- Executive Summary of the March 2012 National Socio-Economic Survey 58
Satuan Kalori (kkal) Protein (gram)Unit Calorie (kcal) Protein (grams)
(1) (3) (4) (5)155 Kelapa / Coconut Butir / Unit 1 335.50 12.65156 Margarine / Margarine Ons / Ounce 720.00 0.60157 Lainnya / Others Liter / Littre 7 362.00 13.50159 Gula pasir / Cane sugar Ons / Ounce 364.00 0.00160 Gula merah / Brown sugar Ons / Ounce 377.00 3.00161 T e h / T e a Ons / Ounce 132.00 19.50162 Kopi (bubuk. biji. instan) / Powdered/bean coffee Ons / Ounce 352.00 17.40163 Coklat instan / Instant cocoa 150 gr 645.00 16.52164 Coklat bubuk / Powdered cocoa Ons / Ounce 298.00 8.00165 Sirup / Syrup 620 ml 1 056.50 0.00166 Lainnya / Others 0.00 0.00168 Garam / Salt Ons / Ounce 0.00 0.00169 Kemiri / Candlenut Ons / Ounce 636.00 19.00170 Ketumbar/Jinten / Coriander Ons / Ounce 404.00 14.10171 Merica/Lada / Pepper Ons / Ounce 359.00 11.50172 Asam / Tamarind Ons / Ounce 132.00 0.54173 Biji pala / Nutmeg Ons / Ounce 469.30 7.12174 Cengkeh / Clove Ons / Ounce 292.00 5.20175 Terasi/Petis / Fish paste Ons / Ounce 250.00 23.05176 Kecap / Soya sauce 140 ml 51.50 6.38177 Penyedap masakan/vetsin / Monosodium glutamate Gram / Grams 0.00 0.00178 Sambal jadi/sauce tomat / Chili sauce/tomato sauce 140 ml 109.80 2.24179 Bumbu masak jadi/kemasan / Spice Ons / Ounce 0.00 0.00180 Bumbu / Other spice Ons / Ounce 49.30 1.51186 Kerupuk / Crisps Ons / Ounce 453.00 3.88187 Emping / Fried chips Ons / Ounce 460.00 11.02183 Mie basah / Wheat noodle Kg 860.00 6.00182 Mie instant / Instant noodle 80 gr 356.00 8.00184 Bihun / Rice noodle Ons / Ounce 360.00 4.70185 Makaroni/Mie kering / Macaroni Ons / Ounce 350.00 8.30188 Bahan agar-agar / Seaweed 7 gr 1.47 0.01189 Bubur bayi kemasan / Porridge in package 150 gr 277.10 9.96190 Lainnya / Others Ons / Ounce 345.00 8.50192 Roti tawar / Ordinary bread Bungkus / Unit 248.50 7.95193 Roti manis/roti lainnya / Other bread Potong / Piece 161.50 2.45194 Kue kering/biskuit / Cookies Ons / Ounce 426.30 6.19
*) No komoditi berdasarkan no urut pada kuesioner Susenas Modul
*) Commodity number is based on a Module Susenas questionnaire
No *Komoditi
Commodity
TABEL 7 : LANJUTANTABLE 7 : CONTINUED
(2)
http
://www.b
ps.g
o.id
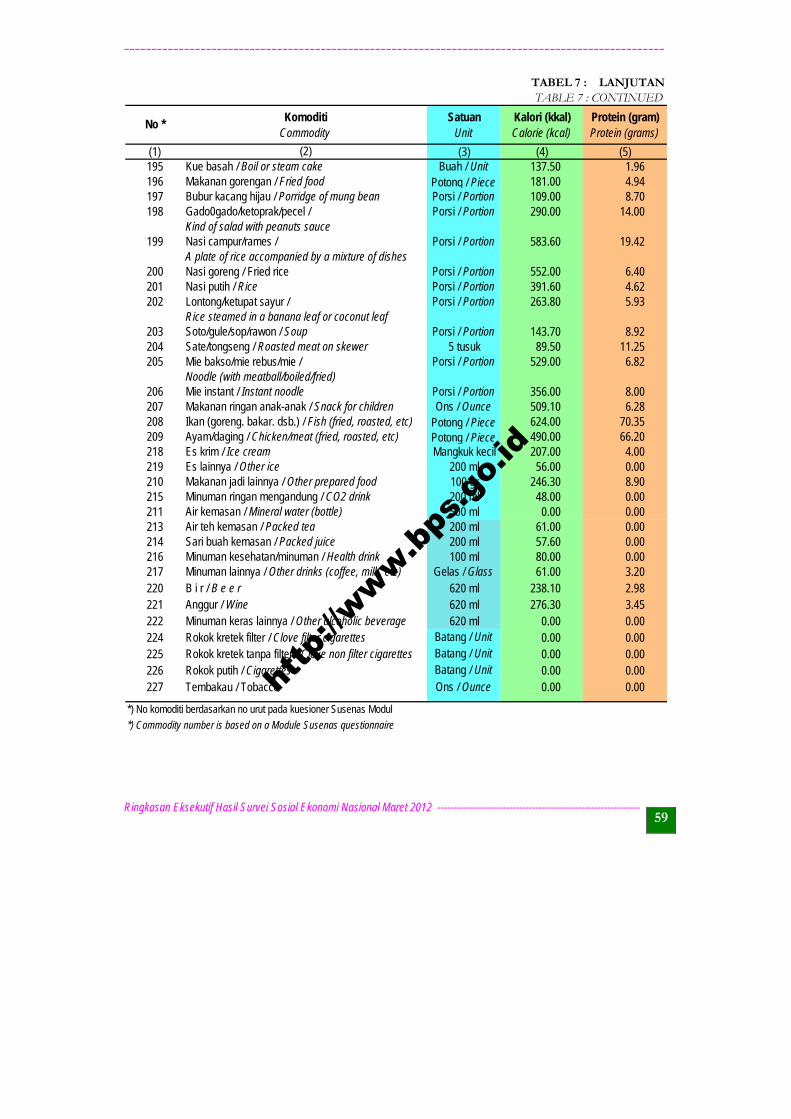
___________________________________________________________________________________________________
Ringkasan Eksekutif Hasil Survei Sosial Ekonomi Nasional Maret 2012 -------------------------------------------------------------- 59
Satuan Kalori (kkal) Protein (gram)Unit Calorie (kcal) Protein (grams)
(1) (3) (4) (5)195 Kue basah / Boil or steam cake Buah / Unit 137.50 1.96196 Makanan gorengan / Fried food Potong / Piece 181.00 4.94197 Bubur kacang hijau / Porridge of mung bean Porsi / Portion 109.00 8.70198 Gado0gado/ketoprak/pecel / Porsi / Portion 290.00 14.00
199 Nasi campur/rames / Porsi / Portion 583.60 19.42
200 Nasi goreng / Fried rice Porsi / Portion 552.00 6.40201 Nasi putih / Rice Porsi / Portion 391.60 4.62202 Lontong/ketupat sayur / Porsi / Portion 263.80 5.93
203 Soto/gule/sop/rawon / Soup Porsi / Portion 143.70 8.92204 Sate/tongseng / Roasted meat on skewer 5 tusuk 89.50 11.25205 Mie bakso/mie rebus/mie / Porsi / Portion 529.00 6.82
206 Mie instant / Instant noodle Porsi / Portion 356.00 8.00207 Makanan ringan anak-anak / Snack for children Ons / Ounce 509.10 6.28208 Ikan (goreng. bakar. dsb.) / Fish (fried, roasted, etc) Potong / Piece 624.00 70.35209 Ayam/daging / Chicken/meat (fried, roasted, etc) Potong / Piece 490.00 66.20218 Es krim / Ice cream Mangkuk kecil 207.00 4.00219 Es lainnya / Other ice 200 ml 56.00 0.00210 Makanan jadi lainnya / Other prepared food 100 gr 246.30 8.90215 Minuman ringan mengandung / CO2 drink 200 ml 48.00 0.00211 Air kemasan / Mineral water (bottle) 500 ml 0.00 0.00213 Air teh kemasan / Packed tea 200 ml 61.00 0.00214 Sari buah kemasan / Packed juice 200 ml 57.60 0.00216 Minuman kesehatan/minuman / Health drink 100 ml 80.00 0.00217 Minuman lainnya / Other drinks (coffee, milk, etc) Gelas / Glass 61.00 3.20220 B i r / B e e r 620 ml 238.10 2.98221 Anggur / Wine 620 ml 276.30 3.45222 Minuman keras lainnya / Other alcoholic beverage 620 ml 0.00 0.00224 Rokok kretek filter / Clove filter cigarettes Batang / Unit 0.00 0.00225 Rokok kretek tanpa filter / Clove non filter cigarettes Batang / Unit 0.00 0.00226 Rokok putih / Cigarettes Batang / Unit 0.00 0.00227 Tembakau / Tobacco Ons / Ounce 0.00 0.00
*) No komoditi berdasarkan no urut pada kuesioner Susenas Modul
*) Commodity number is based on a Module Susenas questionnaire
Kind of salad with peanuts sauce
A plate of rice accompanied by a mixture of dishes
Rice steamed in a banana leaf or coconut leaf
Noodle (with meatball/boiled/fried)
TABEL 7 : LANJUTANTABLE 7 : CONTINUED
No *Komoditi
Commodity
(2)
http
://www.b
ps.g
o.id

http
://www.b
ps.g
o.id
ORGANISASI PENULISAN WRITING ORGANIZATION
_____________________________________________________________
Penanggung Jawab / Person in charge:
Dr. Hamonangan Ritonga, M.Sc
Editor / Editors:
Nona Iriana, S.Si, M.Si
Ida Eridawaty Harahap, S.Si
Penulis / Authors :
Gaib Hakiki, SE
Pengolah Data / Data Processors :
Ahmad Azhari, S.Si
Ofi Ana Sari, SST ht
tp://w
ww.bps
.go.
id

http
://www.b
ps.g
o.id

http
://www.b
ps.g
o.id
Jl. dr. Sutomo No. 6-8 Jakarta 10710Telp.: (021) 3841195, 3842508, 3810291-4, Fax.: (021) 3857046 Homepage: http://www.bps.go.id E-mail: [email protected]
9 772089 243005
ISSN 2089-2438
http
://www.b
ps.g
o.id
Related Documents