Rilis augiati siscilit venis nim 2014 edition ESS handbook for quality reports Manuals and guidelines ISSN 1681-4789 ISSN 2315-0815

Welcome message from author
This document is posted to help you gain knowledge. Please leave a comment to let me know what you think about it! Share it to your friends and learn new things together.
Transcript

Rilis augiati siscilit venis nim
2014 edition
ESS handbook for quality reports
Exer in vu
lla faci blam
con
se euis n
ibh
el utat d
ip ex elestisim
R
ilis aug
iati siscilit venis n
im
Manuals and guidelines
ISSN 1681-4789
2013
ed
ition
ISSN 2315-0815


Subtitle
2013 edition
ESS handbook for quality reports
Manuals and guidelines
2014 edition

Europe Direct is a service to help you find answersto your questions about the European Union.
Freephone number (*):
00 800 6 7 8 9 10 11(*) The information given is free, as are most calls (though some operators, phone
boxes or hotels may charge you).
More information on the European Union is available on the Internet (http://europa.eu).
Luxembourg: Publications Office of the European Union, 2015
ISBN 978-92-79-45487-5ISSN 2315-0815doi:10.2785/983454Cat. No: KS-GQ-15-003-EN-N
Theme 1: General and regional statisticsCollection: Manuals and guidelines
© European Union, 2015Reproduction is authorised provided the source is acknowledged.

FOREWORD
Quality is of primary importance in the world of statistics. With the basic legal framework for European Statistics, i.e. Regulation 223/2009, the 2011 revision of the European Statistics Code of Practice and the adoption of Communication 211 of 2011 "Towards robust quality management for European Statistics" the ESS clearly demonstrates that quality is at the heart of all statistical considerations.
The role of quality reporting had already been strengthened in Regulation 223/2009 on European Statistics. Producers of official statistics have to guarantee that European statistics are developed, produced and disseminated on the basis of uniform standards and of harmonised methods. Furthermore, users of statistics are guaranteed access to appropriate metadata describing the quality of statistical outputs, so that they are able to interpret and use the statistics correctly.
In 2009-2011, a high-level ESSC Sponsorship on Quality worked on further improving quality and efficiency in the ESS and: i) revised the European Statistics Code of Practice; ii) developed the ESS Quality Assurance Framework; and iii) provided recommendations on quality reporting.
The Working Group on Quality in Statistics set up a specific Task Force on Quality Reporting to take forward the recommendations of the Sponsorship on Quality concerning quality reporting.
The 2013 edition of the ESS Handbook for Quality Reports updates the previous, 2009 edition by including the outcomes of the work of the Sponsorship on Quality (revision of the standard quality indicators) as well as of the specific Quality Reporting Task Force (development of the Single Integrated Metadata Structure – SIMS and revision of the Handbook's content). The Handbook assists National Statistical Institutes, Eurostat and Other National Authorities in meeting the Code of Practice standards by providing recommendations on how comprehensive quality reports for the full range of statistical processes and their outputs have to be prepared – it also provides detailed guidelines and examples of quality reporting practices. The document and the structure of a standard ESS quality report are built around the fifteen principles articulated in the European Statistics Code of Practice.
The Handbook is applicable to National Statistical Institutes, to Eurostat and to Other National Authorities in their roles as producers, compilers and disseminators of European statistics. A key objective is to promote harmonised quality reporting across statistical processes and across Member States and hence to facilitate cross-comparisons of processes and outputs.
The 2013 edition of the Handbook has been prepared by the Task Force on Quality Reporting, in cooperation with the members of the Directors of Methodology Group and the Working Group on Quality in Statistics. I would like to thank all colleagues in the ESS who have contributed to the revision of the document.
Walter Radermacher
Director General Eurostat
ESS Handbook for Quality Reports eurostat 4
Table of Contents ABBREVIATIONS AND ACRONYMS .................................................................................. 6 PART I: Introduction ................................................................................................................. 8 1 Objectives of the Handbook ............................................................................................... 8 2 Structure of the Handbook ................................................................................................. 9 3 Quality in the ESS, the European Statistics Code of Practice and the ESS Quality Assurance Framework .............................................................................................................. 10
3.1 Quality definition ....................................................................................................... 10 3.2 Quality assurance ....................................................................................................... 12
4 Types of Statistical Processes .......................................................................................... 12 5 Quality reporting in the ESS ............................................................................................ 13 PART II: Guidelines for preparing detailed quality reports ..................................................... 19 1 Synthesis of the quality report, introduction .................................................................... 19
1.1 ESS Quality definition ............................................................................................... 19 1.2 For all statistical processes ........................................................................................ 19
2 Relevance, assessment of user needs and perceptions ..................................................... 21 2.1 ESS Quality Definition .............................................................................................. 21 2.2 For all statistical processes ........................................................................................ 22 2.3 For Statistical Processes Using Administrative Source(s) ........................................ 27 2.4 Price Index Processes ................................................................................................ 28 2.5 For Statistical Compilations ...................................................................................... 29
3 Accuracy and reliability ................................................................................................... 31 3.1 ESS Quality Definitions ............................................................................................ 31 3.2 For all statistical processes ........................................................................................ 33 3.3 For Sample Surveys ................................................................................................... 36 3.4 For Censuses .............................................................................................................. 58 3.5 For Statistical Processes Using Administrative Source(s) ........................................ 60 3.6 For Statistical Processes Involving Multiple Data Sources ....................................... 64 3.7 For Price and Other Economic Index Processes ........................................................ 65 3.8 For Statistical Compilations ...................................................................................... 68 3.9 Some Special Issues Concerning Accuracy ............................................................... 72
4 Timeliness and Punctuality .............................................................................................. 80 4.1 ESS Quality Definitions ............................................................................................ 80 4.2 For all statistical processes ........................................................................................ 80
5 Coherence and Comparability .......................................................................................... 84 5.1 ESS Quality Definition .............................................................................................. 84 5.2 For all statistical processes ........................................................................................ 85 5.3 Reasons for Lack of Coherence/Comparability ......................................................... 86 5.4 Assessment and Reporting......................................................................................... 89
6 Accessibility and Clarity, Dissemination Format .......................................................... 103 6.1 ESS Quality Definitions .......................................................................................... 103 6.2 For all statistical processes ...................................................................................... 104
7 Cost and Burden ............................................................................................................. 108 7.1 ESS Quality Definition ............................................................................................ 108 7.2 For all statistical processes ...................................................................................... 108 7.3 Cost .......................................................................................................................... 109 7.4 Respondent Burden.................................................................................................. 111

eurostat ESS Handbook for Quality Reports 5
8 Confidentiality ................................................................................................................ 115 8.1 ESS Quality Definition ............................................................................................ 115 8.2 For all statistical processes ...................................................................................... 115
9 Statistical processing ...................................................................................................... 117 9.1 ESS Quality Definition ............................................................................................ 117
PART III: Annexes ................................................................................................................. 119 1 Standard ESS Quality and Performance Indicators ........................................................ 119 2 Technical Manual of the Single Integrated Metadata Structure (SIMS) ........................ 136 3 References and key documents ...................................................................................... 157
KEY DOCUMENTS, LINKS ..................................................................................................... 162
ESS Handbook for Quality Reports eurostat 6
ABBREVIATIONS AND ACRONYMS
CoP European Statistics Code of Practice
QAF Quality Assurance Framework
CPI Consumer Price Index
DESAP ESS Checklist for Survey Managers
EHQR ESS Handbook for Quality Reports
ESMS Euro-SDMX Metadata Structure
ESQRS ESS Standard for Quality Reports Structure
ESS European Statistical System
EU-SILC EU-Statistics on Income and Living Conditions
HICP Harmonised Index of Consumer Prices
MCV Metadata Common Vocabulary
NA National Accounts
NACE EU statistical classification of economic activities
NSI National Statistical Institute
NSO National Statistical Office (NSI or other office producing official statistics)
PPI Producer Price Index
PPP Purchasing Power Parity
QPI Standard ESS Quality and Performance Indicators
SIMS Single Integrated Metadata Structure
SDMX Statistical Data and Metadata Exchange
SPPI Services Producer Price Index


ESS Handbook for Quality Reports eurostat 8
PART I: Introduction
1 Objectives of the Handbook
The general aim of the ESS Handbook for Quality Reports (EHQR) is to provide guidelines for the preparation of comprehensive quality reports for a full range of statistical processes and their outputs. In this context the term statistical process means sample survey, census, use of administrative data, production of price or other economic index, or any other statistical compilation commonly performed by Eurostat or by a national statistical office, and the term national statistical office (NSO) refers to the national statistical institute (NSI) that plays the lead role in a national statistical system or to any other national agency or unit that produces official statistics of relevance to the European Statistical System (ESS).
The specific objectives of the Guidelines are:
to promote harmonised quality reporting across statistical processes and their outputs within a Member State and hence to facilitate comparisons across processes and outputs;
to promote harmonised quality reporting for similar statistical processes and outputs across Member States and hence to facilitate comparisons across countries; and
to ensure that reports include all the information required to facilitate identification of statistical process and output quality problems and potential improvements.
The present Handbook is addressed to:
1. NSOs, for their own internal assessments of process and output quality;
2. NSOs, as the starting point for preparing user-oriented quality reports;
3. NSOs, for the preparation and submission of producer-oriented quality reports to the corresponding Eurostat units;
4. Eurostat units, to prepare quality reports for their own statistical processes and outputs;
5. Eurostat units, to summarise process and output quality across the Member States based on NSO submissions into ESS level quality reports and to report, for example, to the European Parliament or the Council;
6. Eurostat units, to report to users of European statistics; and
7. Eurostat units who are preparing statistical regulations or guidelines and wish to incorporate material on quality reporting.
The Handbook is primarily designed to assist NSOs in internal self-assessment and reporting to Eurostat (the first and third items above). However, as the Handbook puts considerable emphasis on output quality, it also includes all the information that is necessary for user-oriented quality reporting (the second item). In addition, it provides some guidance on the preparation of European level quality reports (the fourth, fifth and sixth items) and gives very specific guidance to those who develop ESS regulations (the seventh item).
The Handbook can be considered as the accompanying guidelines of the Single Integrated Metadata Structure (SIMS, cf. point 5 of Part I and Annex 2) by providing an analysis of the different quality criteria as well as concrete examples on how they should be reported. The Single Integrated Metadata Structure is a dynamic inventory and conceptual framework for all

eurostat ESS Handbook for Quality Reports 9
ESS quality and reference metadata concepts, with a unique definition and clear reporting guidelines.
2 Structure of the Handbook
In addition to describing the objectives and users of the EHQR, Part I indicates the basis on which the guidelines in Part II were constructed. Readers who want simply to refer to the guidelines can skip the rest of Part I.
Part II provides guidelines for preparing detailed quality reports. They are organised by statistical output and process quality criteria or components, with the primary section headings being:
1. Synthesis of the quality report, introduction to the statistical process and its outputs – an overview to provide the context of the report;
2. Relevance, assessment of user needs and perceptions – an output quality component;
3. Accuracy and reliability- an output quality component;
4. Timeliness and punctuality - output quality components;
5. Accessibility and clarity - output quality components;
6. Coherence and comparability - output quality components;
7. Cost and burden – process quality components;
8. Confidentiality – a process quality component.
Each section is organised in a standard way, reporting:
• ESS definition of the involved concepts and ESS Guidelines from SIMS
• Additional information and clarification on the concepts and on what should be included in the quality report, if necessary detailed by type of statistical process
• Practical examples of reporting on the quality criterion in question
• Eventual peculiarities for the reporting at ESS level
• ESS Quality and Performance indicators related to the concept/subconcept
• A box containing the summary of "What should be included in the quality report" Part III contains the Annexes of the Handbook and includes
• The templates of the standard Quality and Performance Indicators (QPIs) which help quantify the different quality criteria;
• The description of the Single Integrated Metadata Structure (SIMS) and its accompanying ESS Guidelines as well as the Technical Manual for its use (for more information on SIMS, please refer to the end of Point 5 "Quality reporting in the ESS");
• List of relevant references and links to key documents. To the extent possible, definitions of the terms used in this document are in line with the ESS Quality Glossary. Where a term is not in the ESS Glossary its definition is drawn from

ESS Handbook for Quality Reports eurostat 10
another international source where available, such as the Metadata Common Vocabulary (MCV), otherwise it is created for this document.
Using the term “statistical process” to describe the primary object of a quality report is not ideal as the same term could equally well be used to describe each of the various functions, such as questionnaire design, or editing, of which a statistical process is made up. However, it is felt to be the best choice. The alternative commonly used term “survey” is even less exact.
3 Quality in the ESS, the European Statistics Code of Practice and the ESS Quality Assurance Framework
3.1 Quality definition
Quality is a multi-dimensional concept and encompasses all aspects of how well statistics are fit for their purpose. In the European Statistical System (ESS), quality of statistics is managed in the framework of the European Statistics Code of Practice1 (CoP) which sets the standards for developing, producing and disseminating European statistics.
Several NSIs have formulated their own individual quality models, mostly in line with the ESS output quality criteria/components. For reporting quality at ESS level and for cross-country comparisons, the ESS model is appropriate.
In accordance with the 15 principles of the European Statistics (ES) Code of Practice and the provisions of Regulation (EC) No 223/2009 on European statistics2, quality is approached along 3 lines: quality or characteristics of the institutional environment (6 principles), quality of the statistical processes (4 principles) and quality of the statistical output (5 principles). Each of the 15 principles of the ES Code of Practice (Principles : 1st level of quality assurance) contains specific indicators which reflect good practice and how compliance with the principle can be demonstrated (Indicators: 2nd level of quality assurance).
Output/Product Quality Criteria
In line with the last five ES Code of Practice Principles, output quality in the ESS is assessed in terms of the following quality criteria:
Relevance: outputs, i.e. European Statistics meet the needs of users.
Accuracy and Reliability: outputs accurately and reliably portray reality.
Timeliness and Punctuality: outputs are released in a timely and punctual manner.
Coherence and Comparability: outputs are consistent internally, over time and comparable between regions and countries; it is possible to combine and make joint use of related data from different sources.
Accessibility and Clarity: outputs are presented in a clear and understandable form, released in a suitable and convenient manner, available and accessible on an impartial basis with supporting metadata and guidance.
1 http://epp.eurostat.ec.europa.eu/portal/page/portal/product_details/publication?p_product_code=KS-32-11-955 2 http://eur-lex.europa.eu/LexUriServ/LexUriServ.do?uri=OJ:L:2009:087:0164:0173:EN:PDF
eurostat ESS Handbook for Quality Reports 11
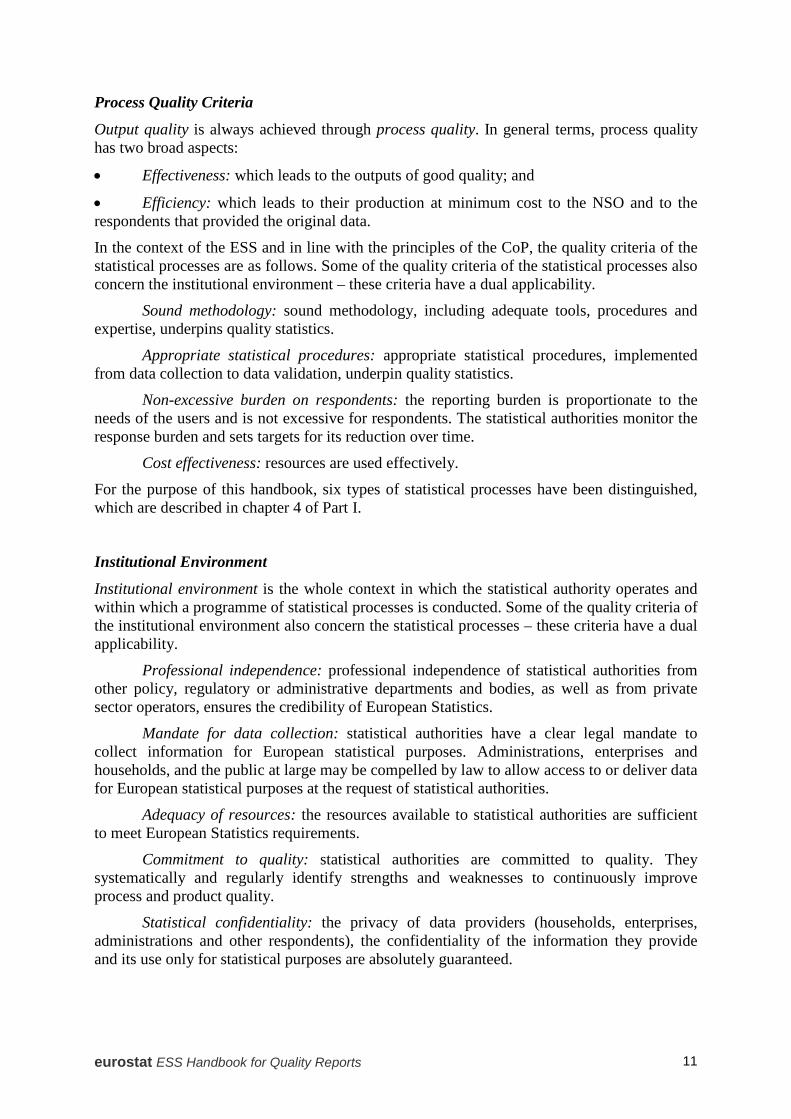
Process Quality Criteria
Output quality is always achieved through process quality. In general terms, process quality has two broad aspects:
• Effectiveness: which leads to the outputs of good quality; and
• Efficiency: which leads to their production at minimum cost to the NSO and to the respondents that provided the original data.
In the context of the ESS and in line with the principles of the CoP, the quality criteria of the statistical processes are as follows. Some of the quality criteria of the statistical processes also concern the institutional environment – these criteria have a dual applicability.
Sound methodology: sound methodology, including adequate tools, procedures and expertise, underpins quality statistics.
Appropriate statistical procedures: appropriate statistical procedures, implemented from data collection to data validation, underpin quality statistics.
Non-excessive burden on respondents: the reporting burden is proportionate to the needs of the users and is not excessive for respondents. The statistical authorities monitor the response burden and sets targets for its reduction over time.
Cost effectiveness: resources are used effectively.
For the purpose of this handbook, six types of statistical processes have been distinguished, which are described in chapter 4 of Part I.
Institutional Environment
Institutional environment is the whole context in which the statistical authority operates and within which a programme of statistical processes is conducted. Some of the quality criteria of the institutional environment also concern the statistical processes – these criteria have a dual applicability.
Professional independence: professional independence of statistical authorities from other policy, regulatory or administrative departments and bodies, as well as from private sector operators, ensures the credibility of European Statistics.
Mandate for data collection: statistical authorities have a clear legal mandate to collect information for European statistical purposes. Administrations, enterprises and households, and the public at large may be compelled by law to allow access to or deliver data for European statistical purposes at the request of statistical authorities.
Adequacy of resources: the resources available to statistical authorities are sufficient to meet European Statistics requirements.
Commitment to quality: statistical authorities are committed to quality. They systematically and regularly identify strengths and weaknesses to continuously improve process and product quality.
Statistical confidentiality: the privacy of data providers (households, enterprises, administrations and other respondents), the confidentiality of the information they provide and its use only for statistical purposes are absolutely guaranteed.

ESS Handbook for Quality Reports eurostat 12
Impartiality and objectivity: statistical authorities develop, produce and disseminate European Statistics respecting scientific independence and in an objective, professional and transparent manner in which all users are treated equitably.
3.2 Quality assurance
Compliance with the ES Code of Practice is regularly monitored through the ESS-wide exercise of peer reviews which start with a national self-assessment questionnaire – improvement actions identified in the peer review exercise are then monitored and reported upon on an annual basis.
As a 3rd level of quality assurance, the ESS Quality Assurance Framework3 (QAF) has been developed in 2011-2012. Similarly to other existing quality assurance frameworks like UNSD's NQAF4, the ESS QAF provides methods and tools for implementation at institutional and process level for the indicators of the ES Code of Practice5 as well as links to relevant reference documentation. Therefore, it provides clear guidance to compliance assessors.
In addition to Regulation (EC) No 223/2009 on European statistics, quality is also a consideration in other regulations adopted by the Council and the Parliament creating the legal basis for the provision of European statistics in various domains. Council Regulations are themselves quality assurance mechanisms, setting specific timeliness targets, establishing methodological standards leading to enhanced accuracy and comparability, and covering relevance in the form of the needs of European institutions for national statistics.
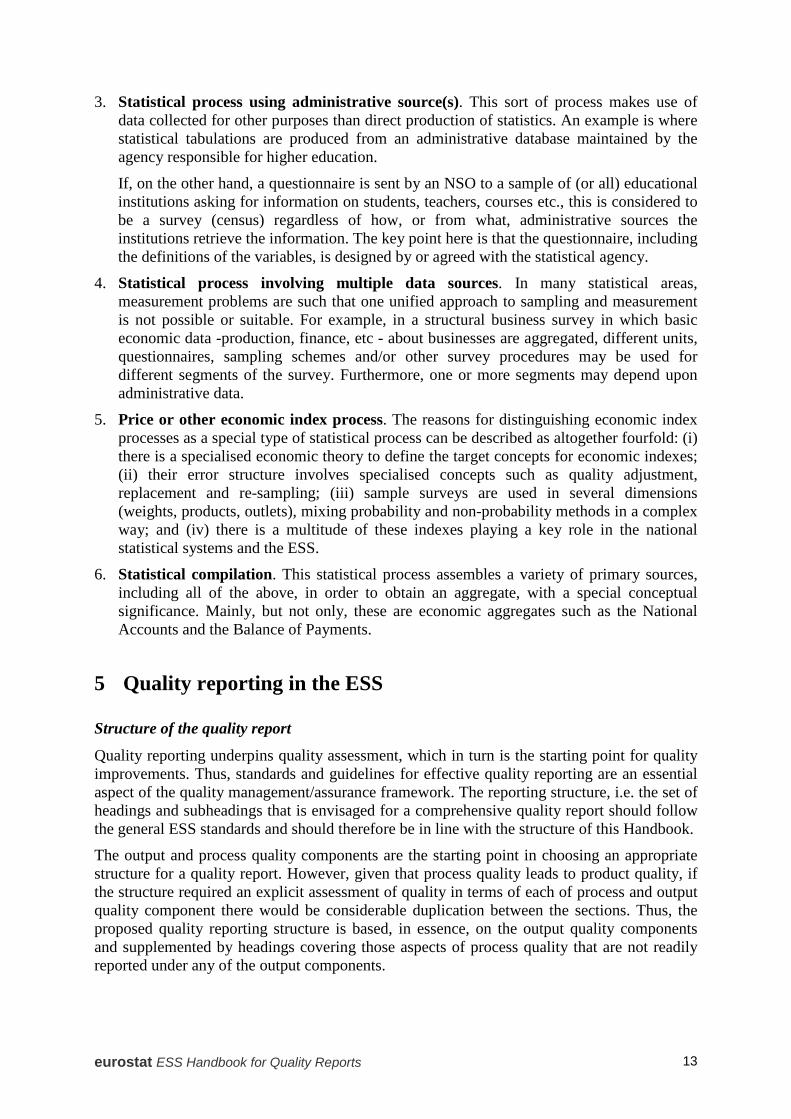
4 Types of Statistical Processes
The methods of producing ESS statistics show a great diversity from a technical statistical perspective. A standard approach to errors is only well developed for surveys based on probability sampling from a frame of sampling units. Hence a single set of recommendations, especially those regarding accuracy, cannot apply to all statistics regardless of their mode of production; it is necessary to introduce some distinctions.
A typology of statistical processes is needed. Such a typology can be drawn up in a variety of different ways. For the purpose of this Handbook six types of statistical processes are distinguished. Defining these six types should be regarded simply as a pragmatic device solely for the purpose of the Handbook. It is expected that, in the future, new categories and improved distinctions will emerge.
1. Sample survey. This is a survey based on a, usually probabilistic, sampling procedure involving direct collection of data from respondents. For this kind of survey there is an established theory on accuracy that allows reporting on well-defined accuracy components (sampling and non-sampling errors).
2. Census. This can be seen as a special case of the sample survey, where all frame units are covered. There are population, economic and agricultural censuses.
3 http://epp.eurostat.ec.europa.eu/cache/ITY_PUBLIC/QAF_2012/EN/QAF_2012-EN.PDF 4 http://unstats.un.org/unsd/dnss/QualityNQAF/nqaf.aspx 5 Currently, the ESS QAF covers Principles 4 and 7-15 of the ES Code of Practice and its extension to Principles 5 and 6 is also foreseen. Since Principles 1 to 3 are considered as "self-explanatory", the extension of the QAF to these 3 Principles is not deemed necessary.
eurostat ESS Handbook for Quality Reports 13
3. Statistical process using administrative source(s). This sort of process makes use of data collected for other purposes than direct production of statistics. An example is where statistical tabulations are produced from an administrative database maintained by the agency responsible for higher education.
If, on the other hand, a questionnaire is sent by an NSO to a sample of (or all) educational institutions asking for information on students, teachers, courses etc., this is considered to be a survey (census) regardless of how, or from what, administrative sources the institutions retrieve the information. The key point here is that the questionnaire, including the definitions of the variables, is designed by or agreed with the statistical agency.
4. Statistical process involving multiple data sources. In many statistical areas, measurement problems are such that one unified approach to sampling and measurement is not possible or suitable. For example, in a structural business survey in which basic economic data -production, finance, etc - about businesses are aggregated, different units, questionnaires, sampling schemes and/or other survey procedures may be used for different segments of the survey. Furthermore, one or more segments may depend upon administrative data.
5. Price or other economic index process. The reasons for distinguishing economic index processes as a special type of statistical process can be described as altogether fourfold: (i) there is a specialised economic theory to define the target concepts for economic indexes; (ii) their error structure involves specialised concepts such as quality adjustment, replacement and re-sampling; (iii) sample surveys are used in several dimensions (weights, products, outlets), mixing probability and non-probability methods in a complex way; and (iv) there is a multitude of these indexes playing a key role in the national statistical systems and the ESS.
6. Statistical compilation. This statistical process assembles a variety of primary sources, including all of the above, in order to obtain an aggregate, with a special conceptual significance. Mainly, but not only, these are economic aggregates such as the National Accounts and the Balance of Payments.
5 Quality reporting in the ESS
Structure of the quality report
Quality reporting underpins quality assessment, which in turn is the starting point for quality improvements. Thus, standards and guidelines for effective quality reporting are an essential aspect of the quality management/assurance framework. The reporting structure, i.e. the set of headings and subheadings that is envisaged for a comprehensive quality report should follow the general ESS standards and should therefore be in line with the structure of this Handbook.
The output and process quality components are the starting point in choosing an appropriate structure for a quality report. However, given that process quality leads to product quality, if the structure required an explicit assessment of quality in terms of each of process and output quality component there would be considerable duplication between the sections. Thus, the proposed quality reporting structure is based, in essence, on the output quality components and supplemented by headings covering those aspects of process quality that are not readily reported under any of the output components.

ESS Handbook for Quality Reports eurostat 14
The primary section headings of a standard ESS quality report should follow the structure of this Handbook and should therefore include the quality components as already outlined in point 4:
1. Synthesis of the quality report, introduction to the statistical process and its outputs
2. Relevance, assessment of user needs and perceptions 3. Accuracy 4. Timeliness and punctuality 5. Accessibility and clarity 6. Coherence and comparability 7. Cost and burden 8. Confidentiality 9. Statistical processing
Types of the quality report
There is a wide range of different possible quality reports according to the scope of the report, the level of detail, the producer or user orientation, and the perspective of process or output. The various types and how they are covered in the guidelines are described in the following paragraphs.
Scope/level of Report
A quality report can have narrow or wide scope, from dealing with a specific indicator and the process that produced it, to the whole ESS, as illustrated in Figure 2. The guidelines in this document are primarily aimed at describing all quality aspects of a statistical process (direct or register based survey, price index or other major statistical compilation as previously defined) at national or at European level, in other words the grey row in Figure 2. The guidelines can also be used for lower level domains (in the bottom two rows of Figure 2) but to a less extent for higher level domains (the upper level rows in Figure 2).
Figure 2: Scope/Levels of Quality Reporting
Scope National level European level
Institution NSI and all other NSOs Whole ESS; Eurostat
Broad statistical domain (e.g. health, agriculture)
All statistical processes within broad statistical domain
All statistical processes in all Member States within same broad statistical domain
Statistical process Process with full set of outputs, as determined by NSO
Same process and outputs, as determined by ESS for all Member States
Subdomain within statistical process
Subgroups or specific data items for which outputs are produced
European aggregates* for same subgroups or specific indicators
Specific indicator(s) Outputs in the form of single numbers or time series of such numbers
European aggregates* of single numbers or time series of such numbers
* European aggregates are functions (averages, totals, etc.) of national estimates for EU-28, EEA, Euro Zone, etc.
eurostat ESS Handbook for Quality Reports 15
ESS level report
Based on quality reports from Member States, quality reports may be produced for European (ESS) level statistics. Such reports may not only bring together in one place information about the quality of all the national outputs and the processes that produced them but also present the quality of aggregated estimates at the European level, comparisons between countries, and specific uses of European level data.
Two aspects of ESS level statistics stand out as distinct from national statistics and hence of special importance.
• European level statistics may include aggregations (averages, sums etc.) of national estimates applicable to a European entity (EU-28, EEA, Euro area etc.). If so, the quality report will refer to these aggregations.
• European level statistics may include comparisons and contrasts of national estimates. If so, the quality report will refer to the comparability of outputs across Member States.
Thus, the two possible objectives of an ESS quality report are to provide information, first, on the quality of aggregate statistics and, second, on the quality of comparisons of national statistics. In addition, there is a third possible objective, namely to give a condensed overview of the quality of national outputs.
Producer/User Orientation of Report
A quality report may be user-oriented, producer-oriented or both. There are producers and users at various levels. A producer of statistics may at the same time be a user of other statistics. Reports may be required to communicate quality information between the producers. Users of final outputs can be advanced analysts and researchers, or the public at large, often represented by media.
These guidelines are producer-oriented with a special focus on the statistical process and on what is needed for ensuring the quality of the ESS system. User-oriented quality reporting is in general much less detailed and focuses rather on the output quality. However, a quality report produced according to these guidelines will include all the information required for the production of user-oriented reports which are in general a sub-set of the detailed, producer-oriented quality reports.
Process/Output Orientation of Report
A quality report may have a process or an output orientation. As noted earlier in this section the guidelines in Part II have an output orientation even though the primary target users are producers.
Level of Detail in Report
A quality report can range from very short and concise to very detailed. For example, a quality profile may cover only a few specific attributes and indicators; a completed self-assessment checklist (e.g. Development of a Self-Assessment Programme, DESAP checklist) covers all aspects of the statistical process and its outputs, but not in great detail.
The guidelines in this document are aimed at the most comprehensive form of report commonly prepared, i.e., a full scale report with qualitative and quantitative information,

ESS Handbook for Quality Reports eurostat 16
dealing with all important aspects of output and process quality in detail. Thus, the guidelines require not only a description of processes and quality measurements but also quantitative quality measures or assessments and discussions of how to deal with deficiencies.
Related Documentation
The quality report is one type of documentation for statistical processes. Many others are used as well and in this regard national practices differ widely. Some countries produce technical reports and the like where the statistical methodology is described in detail, for example with estimation formulas, etc. When such documentation exists, the quality report can refer to it and need not repeat all the same information in the body of the report. However, when such documentation is not available, information on methodology must be included in the quality report itself.
Reporting Frequency
Quality reports may be prepared for every cycle of the statistical process with the periodicity that is in line with the type and specificity of the statistical process. Typically the more frequent the report the less detail. The guidelines in this document are aimed at the sort of comprehensive document that will be produced periodically, say every five years, or after major changes. In between such comprehensive quality reports it is envisaged that less detailed reports may be prepared, for example quality and performance indicators for every survey occasion, and a checklist completed annually.
Whilst it is not the role of this document to define a quality policy to the NSOs or the ESS units, it is recommended that quality reports should be updated annually. This would not actually place an undue burden on the report writers, since, if no major changes have taken place, material could be cut-and-pasted from one year to the next and the only new material would be in the form of updated quality and performance indicators.
Reports for processes involving multiple data sources
When multiple data sources are used (e.g. containing both administrative sources and sampling), quality reports and the relevant quality dimensions should be filled in for each data sources (in this case for administrative sources and sampling as well), not just for multiple data sources in general.
Role of quality reporting
Within a quality management framework, a quality report is a means to an end, not an end in itself. First of all, it should provide a factual account of quality according to the reporting structure. Moreover, recommendations for quality improvement should be identified and later implemented based on the quality report.
Practical implementation of quality reporting – recent developments In line with the latest developments, metadata structures have been used for the purpose of quality reporting.
The Euro-SDMX Metadata Structure (ESMS) was recommended as reference metadata report structure in Commission Recommendation 498/2009. This ESMS has until now been

eurostat ESS Handbook for Quality Reports 17
considered as the concise, user-oriented format of quality reporting because it contains a basic level of quality information which is structured along the quality criteria as defined in the ES Code of Practice and Regulation 223/2009 – the information focuses more on the statistical output rather than the underlying process itself.
As a counterpart, a more detailed quality reporting structure called ESS Standard for Quality Reports Structure (ESQRS) was developed in 2010 which is more addressed to the producers of statistics and which focuses more on the statistical process side. It was elaborated on the basis of the 2009 edition of the ESS Standard and Handbook for Quality Reports, and is also embedded in the SDMX-compliant metadata environment and the ESS Metadata Handler.
In 2011, the high-level ESSC Sponsorship on Quality finished its 2-year work and made recommendations – among others – on quality reporting, calling for streamlining and rationalisation of quality reporting in the ESS:
The use of a single metadata structure from which both the producer-oriented and user-oriented quality reports could be derived, accompanied by a specific Manual (cf. recommendations 6.4.1 and 6.3.2 of the SoQ);
Maximum re-use of information in the common ESS metadata system (cf. recommendation 6.4.2 of the SoQ);
A reduction and simplification of the different documents and templates which determine the rules of quality reporting (cf. recommendation 6.4.1 of the SoQ);
Readability of the ESMS files, the short user oriented quality reports, should be improved (cf. recommendation 6.3.1 of the SoQ).
In 2012-2013 an ESS Task Force on Quality Reporting, a sub-group of the ESS Working Group on Quality in Statistics, took forward the recommendations of the Sponsorship on Quality and developed the Single Integrated Metadata Structure (SIMS) and its accompanying Technical Manual (cf. Annex 2) and has also updated the 2009 edition of the present Handbook. Regarding the SIMS, this dynamic and unique inventory of ESS quality and metadata statistical concepts has been created in order to:
streamline and harmonise metadata and quality reporting in the ESS decrease the reporting burden on the statistical authorities by creating the framework for “once for all purposes” reporting, where each concept is only reported upon once and is re-usable for other reporting create an integrated and consistent quality and metadata reporting framework where the reports are stored in the same database create a flexible and up-to-date system where future extensions are possible by adding new concepts. In this structure, all statistical concepts of the two existing ESS report structures (ESMS and ESQRS) have been included and streamlined, by assuring that all concepts appear and are therefore reported upon only once (direct re-usability of existing information). It is a dynamic structure in the sense that additional statistical metadata and quality concepts can be included if necessary in the future.


eurostat ESS Handbook for Quality Reports 19
PART II: Guidelines for preparing detailed quality reports
1 Synthesis of the quality report, introduction
1.1 ESS Quality definition
The Introduction is a general description of the statistical process and its outputs, and their evolution over time.
ESS Guidelines: Describe briefly the statistical PROCESS generating the data in question, the broad statistical domain to which the outputs belong, the related statistical OUTPUTS as well as the boundary of the quality report at hand and references to related quality reports.
1.2 For all statistical processes
To facilitate an understanding of its technical parts, a quality report should include some background information on the statistical process and outputs that are the subject of the report. This is the purpose of the Introduction.
It is natural to start by providing a brief history. When was the process in question initiated and what were its initial objectives? What major changes have subsequently been made and why? This should be followed by a general description of the process and its outputs, and their evolution over time.
In a national level quality report, an overview of the national European regulations governing the statistical outputs and the processes by which they are to be produced should be given.
The broad statistical domain (or domains) to which the statistical outputs belong should be stated and related outputs in the same domain listed. The boundary between the process and outputs described in the quality report at hand and those described in other reports should be made clear. This boundary is sometimes not obvious since outputs with different names and conceptual targets can have one or more subprocesses in common and even share the same micro-data base. Where this is an issue, the reasons for the chosen boundary should be explained
An overview of all outputs associated with the process should be given, including:
all media (Internet, paper reports, reports to general statistical compilations like yearbooks etc.);
national outputs as well as outputs reported to international organisations;
outputs to the ESS system should be separately listed.
The format and structure chosen for the quality report should be motivated by the general type and characteristics of the process. The most important quality problems should be indicated.
References, preferably by hyperlinks, should be given to other documentation on the methodology of the process and quality of the outputs. References concerning specific quality aspects should also be given in other places in the quality report. (This statement applies for each quality component but is not repeated.)

ESS Handbook for Quality Reports eurostat 20
ESS level
In an ESS level quality report, an overview of the regulations at European level (if any) governing the statistical outputs and the processes by which they are to be produced should be given, together with a list of the Member States that have produced quality reports and the general coverage of these reports.
Quality and Performance Indicators
None specifically identified.
Summary
What should be included in the Introduction
General description of the process and its outputs A brief history of the statistical process and outputs in question. The broad statistical domain to which the outputs belong; related statistical outputs. The boundary of the quality report at hand and references to related quality reports. An overview of all output produced by the statistical process. References to other documentation, especially on methodology.
eurostat ESS Handbook for Quality Reports 21
2 Relevance, assessment of user needs and perceptions
2.1 ESS Quality Definition
Relevance is an attribute of statistics measuring the degree to which statistical information meets current and potential needs of the users.
Relevance is concerned with whether the available information sheds light on the issues that are important to users. Assessing relevance is subjective and depends upon the varying needs of users. The Agency's challenge is to weight and balance the conflicting needs of current and potential users to produce statistics that satisfy the most important needs within given resource constraints. In assessing relevance, one approach is to gauge relevance directly, by polling users about the data. Indirect evidence of relevance may be found by ascertaining where there are processes in place to determine the uses of data and the views of their users or to use the data inhouse for research and other analysis. Relevance refers to the processes for monitoring the relevance and practical usefulness of existing statistics in meeting users’ needs and how these processes impact the development of statistical programmes.
This concept is further broken down into:
a) User needs Description: Description of users and their respective needs with respect to the statistical data. ESS Guidelines: Provide: - a classification of users with some indication of their importance; - an indication of the uses for which they want the statistical outputs; - an assessment regarding the key outputs/indicators desired by different categories of users and any shortcomings in outputs for important users; - information on unmet user needs, the reasons why certain needs cannot be fully satisfied, - any plans to satisfy needs more completely in the future ; and - details of definitions which differ from requirements.
b) User satisfaction Description: Measures to determine user satisfaction. ESS Guidelines: Describe how the views and opinions of the users are regularly collected (e.g. user satisfaction surveys, other user consultations, ...). In addition the main results regarding investigation of user satisfaction should be shown (in the form of a user satisfaction index if available) and the date of most recent user satisfaction survey.
c) Completeness Description: The extent to which all statistics that are needed are available. ESS Guidelines: Provide qualitative information on completeness compared with relevant regulations/ guidelines. Applicable for Eurostat: if any Member State is not transmitting all necessary data items.
ESS Handbook for Quality Reports eurostat 22
2.2 For all statistical processes
2.2.1 Understanding and Classifying Users The starting point for design and conduct of a statistical process is user needs. Such needs are expressed not only in terms of data content but also in terms of the degree of accuracy required, the timing, the dissemination arrangements, the metadata required for interpretation, and the relationship to other relevant statistical outputs. In other words, they cover the whole range of the output quality components.
Assessment of user needs is not trivial, first because there are many types of users, second, because there are many different uses for which the users want the outputs.
The first step is to assemble information about the users - who they are, how many they are, and how important they are individually and collectively from the perspective of the NSO. Based on information available from advisory committees, lists of paying recipients, Internet accesses, the usual approach is to develop a classification of users and to estimate the number of each type
The second step is to determine the needs of each class of users, and, in the case of important users, their individual needs. For users, acquiring output data is a means to an end, not an end in itself, and the uses to which these data are put are relevant. Quite frequently users may not fully understand what data they actually need nor what is available. By understanding the uses of data, the NSO is in a better position to determine the actual needs. Furthermore, these needs have to be interpreted in the statistical context in which they are to be addressed – concepts, accuracy, timing, etc., have to be aligned with what can actually be delivered. Information about user needs is typically accomplished through subject matter advisory committees, user groups, ad hoc focus groups, requests, complaints and other user feedback.
The third step is to determine in general terms the priorities to be given to the various classes of users in satisfying their needs. For example the needs of government policy makers may be set ahead those of academic researchers. Some needs are important but transient. Some users may also be respondents and their requirements merit special consideration.
The fourth step is to determine the associated metadata needs of users, i.e., what explanatory and quality related material should accompany the data and how it should be presented. For this purpose it is convenient to classify users into groups according to the complexity of their data, and associated metadata, needs. For example, the Australian Bureau of Statistics uses three groups, which it refers to as tourists, harvesters and miners, reflecting increasing levels of demand, as mentioned in example 2.2.C
In summary the quality report should contain a classification of users, an indication of the uses for which they want the outputs, the priorities in satisfying their needs, and an account of how this information was obtained, for example through general or domain specific advisory committees, other regularly convened user groups, ad hoc focus groups, feedback/complaints from users.
ESS level
In an ESS level quality report, an overview of the users and uses of national outputs should be given as well as the additional, specific uses of the ESS level aggregations and comparisons.
eurostat ESS Handbook for Quality Reports 23
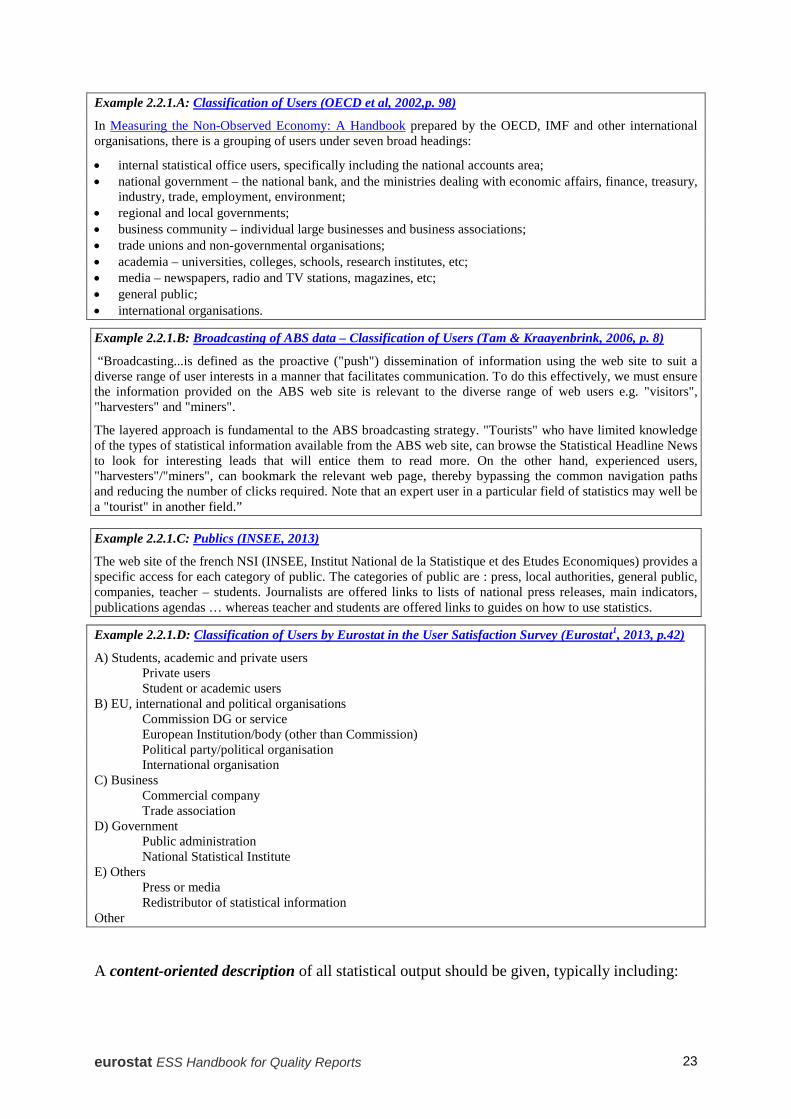
Example 2.2.1.A: Classification of Users (OECD et al, 2002,p. 98)
In Measuring the Non-Observed Economy: A Handbook prepared by the OECD, IMF and other international organisations, there is a grouping of users under seven broad headings:
• internal statistical office users, specifically including the national accounts area; • national government – the national bank, and the ministries dealing with economic affairs, finance, treasury,
industry, trade, employment, environment; • regional and local governments; • business community – individual large businesses and business associations; • trade unions and non-governmental organisations; • academia – universities, colleges, schools, research institutes, etc; • media – newspapers, radio and TV stations, magazines, etc; • general public; • international organisations.
Example 2.2.1.B: Broadcasting of ABS data – Classification of Users (Tam & Kraayenbrink, 2006, p. 8)
“Broadcasting...is defined as the proactive ("push") dissemination of information using the web site to suit a diverse range of user interests in a manner that facilitates communication. To do this effectively, we must ensure the information provided on the ABS web site is relevant to the diverse range of web users e.g. "visitors", "harvesters" and "miners".
The layered approach is fundamental to the ABS broadcasting strategy. "Tourists" who have limited knowledge of the types of statistical information available from the ABS web site, can browse the Statistical Headline News to look for interesting leads that will entice them to read more. On the other hand, experienced users, "harvesters"/"miners", can bookmark the relevant web page, thereby bypassing the common navigation paths and reducing the number of clicks required. Note that an expert user in a particular field of statistics may well be a "tourist" in another field.” Example 2.2.1.C: Publics (INSEE, 2013)
The web site of the french NSI (INSEE, Institut National de la Statistique et des Etudes Economiques) provides a specific access for each category of public. The categories of public are : press, local authorities, general public, companies, teacher – students. Journalists are offered links to lists of national press releases, main indicators, publications agendas … whereas teacher and students are offered links to guides on how to use statistics.
Example 2.2.1.D: Classification of Users by Eurostat in the User Satisfaction Survey (Eurostat1, 2013, p.42)
A) Students, academic and private users Private users Student or academic users
B) EU, international and political organisations Commission DG or service European Institution/body (other than Commission) Political party/political organisation International organisation
C) Business Commercial company Trade association
D) Government Public administration National Statistical Institute
E) Others Press or media Redistributor of statistical information
Other
A content-oriented description of all statistical output should be given, typically including:
ESS Handbook for Quality Reports eurostat 24
• key indicators (especially those emphasised in press releases, e.g., national unemployment rate, 12-month inflation, GDP growth);
• variables, e.g. turnover, consumption, employment, salaries;
• subdomains, (for which indicators are shown separately);
• estimates of level versus change (time series); and
• reference period (month, quarter, year, etc.) and frequency of release.
An assessment regarding the key outputs/ indicators desired by different categories of users should be given and any shortcomings in outputs for important users should be mentioned. This could, for example, involve insufficient breakdown of data into sub-domains, time series that are too short, or outputs that are too infrequent, for example quarterly instead of monthly. Not all user needs can be met, reasons being either budgetary or technical. The quality report should include information on unmet user needs, the reasons why certain needs cannot be fully satisfied, and any plans to satisfy needs more completely in the future.
Eventual discrepancies between adopted definitions of statistical concepts and the definitions that would be ideal from a user perspective should be given. Concepts defined during the design and planning of the statistical process include target population, target definition of units, and aggregation formula. It is often the case that what is ideal differs between users and, if so, this should be noted. Sometimes it is possible to apply different definitions to the same set of micro-data and present all the results. More usually this is not possible and a single definition has to be selected, in which case the motivation for the chosen definition should then be given. Any discrepancies between the definitions used and accepted ESS or international definitions should always be clearly pointed out.
Numerical illustrations of the likely sensitivities of the results to the chosen definitions can be very informative and should be provided whenever possible. The basis for these illustrations could be sensitivity analyses or simulations. Such illustrations inform users of the risks of a relevance problem for their particular application, i.e., of a discrepancy between the definitions used and what the user wants.
Definitions also affect coherence and comparability and thus, instead or as well, can be discussed under that heading (see Chapter 6).
There is a grey zone between certain relevance problems and accuracy, as further discussed in connection with sampling errors (using a cut-off threshold) and coverage errors in Chapter 3.
ESS level
In an ESS level quality report, national compliance with agreed ESS or other international definitions should be described in detail. Other important differences in definitions between Member States should be noted.
Example 2.2.1.F: Summary of Quality: Relevance (Office of the First Minister and Deputy First Minister, 2012,p. 1)
The degree to which the statistical product meets user needs for both coverage and content.
The Labour Force statistics published in the LFS Religion Report are intended to compare the labour market outcomes of Protestants and Roman Catholics in Northern Ireland.
eurostat ESS Handbook for Quality Reports 25
The data is primarily used by OFMDFM, statutory organisations such as the Equality Commission and by researchers. The users are interested in a variety of indicators relating to religious affiliation and the labour market, including the number of people in employment, the number of unemployed people and the number economically inactive (defined according to the International Labour Organisation - ILO). They also sometimes require more detailed analysis of these series by age groups and sex, which the report provides.
Example 2.2.1.G: Relevance of Statistical Concepts in Slovenian Household Budget Survey (Arnež et al., 2008, p. 9-10)
Key Users of Survey Results
Public sector: The Government of the Republic of Slovenia and its offices, ministries, administrative units, the National Assembly and National Council, the Bank of Slovenia, Chamber of Commerce and Industry of Slovenia
Commercial operators: legal entities, trade unions
Science, research and education: the Institute for Economic Research, libraries, faculties, students
Media: radio and television houses, printed media, the Slovene Press Agency
Foreign users: Eurostat, statistical offices of other countries, UNICEF, Luxembourg Income Study, researchers
Internal users: national accounts, price statistics
Share of Missing Statistics (R3)
The share of missing statistics is 0.007 (3/457), considering all variables which should be submitted to Eurostat. The implementation of HBS is not governed by regulations of the European Commission. Therefore, Eurostat collects data provided in this questionnaire under a Gentlemen’s Agreement, every 5 years. The document Doc.E2/HBS/153-B/2003/EN „Data transmission for the HBS round of the reference year 2005“ as of the end of January 2004 lays down 457 variables which should be communicated to Eurostat. Of these, 430 are basic variables and 27 derived variables at the household level. In order to calculate derived variables at the household level, 16 basic and derived variables at the level of a member should be calculated, which are not to be submitted to Eurostat. Of the basic variables at the household level, there are only three which we cannot ensure: HD02 (furnishing of a rented dwelling), HD03 (type of dwelling; individual houses cannot be divided into two types); HD08.01 (the number of years spent in the present dwelling). The missing variables are included in the HBS questionnaire as from 2005 onwards; therefore all variables required will be provided in the future. On 15 June 2007, individual data at the household level for 2004 were communicated to Eurostat (on the basis of data collected in 2003, 2004 and 2005), and 25 tables for 2004, which included data for 2004 with the consumer price index, calculated according to the Eurostat reference year 2005. The small size of the sample is the reason that the HBS data is available only at the state level; tables for some requests are made simultaneously. In order to satisfy the needs of users as much as possible, we plan to elaborate additional standard tables considering their present demand.
Example 2.2.1.H: Relevance in the EU-SILC (Eurostat2, 2013, p. 3-4)
The relevance of an instrument has to be assessed in the light of the needs of its users. As for EU-SILC the main users are the following:
• Institutional users like DG EMPL of the Commission and the Social Protection Committee, in charge of the monitoring of social protection and social inclusion, or other Commission services;
• Statistical users in Eurostat or in Member States National Statistical Institutes to feed sectorial or transversal publications;
• Researchers having access to microdata; and
• End users – including the media - interested in living conditions and social cohesion in the EU.
The EU-SILC instrument is the main source for comparable indicators for monitoring and reporting on living conditions and social cohesion at the EU level. It has been moreover recognized by Heads of States and Governments as the data source for the Europe 2020 strategy headline target on poverty.
ESS Handbook for Quality Reports eurostat 26
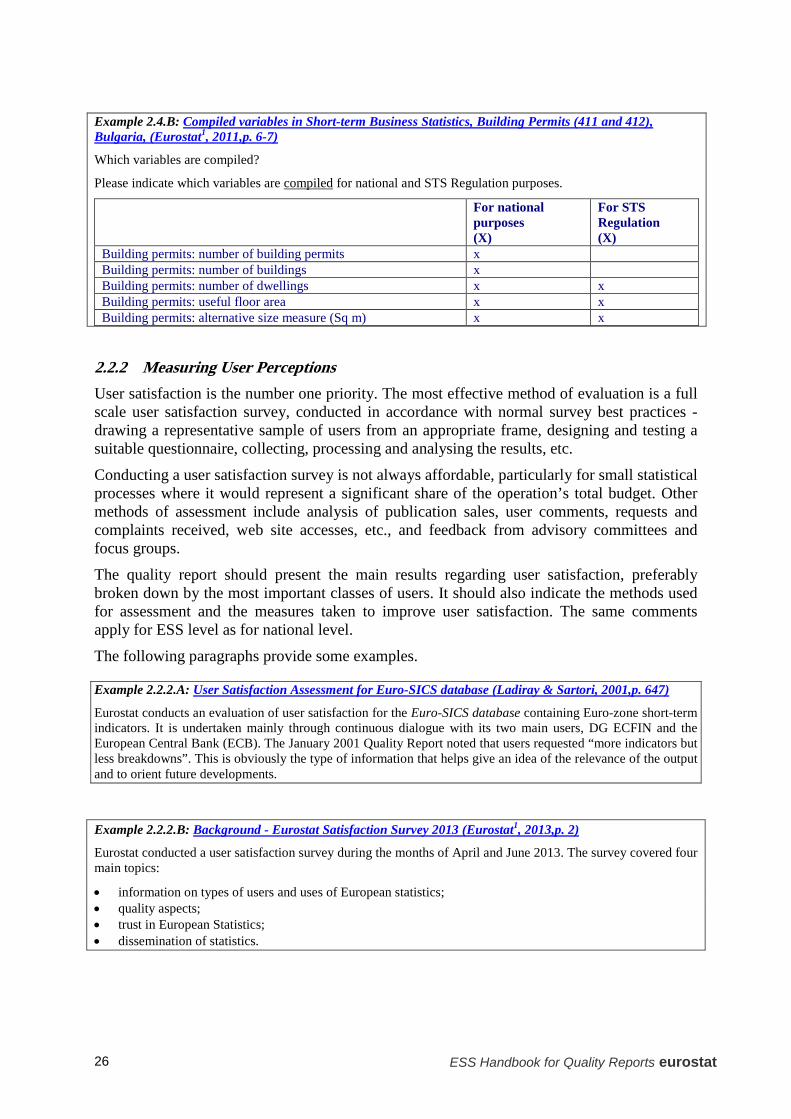
Example 2.4.B: Compiled variables in Short-term Business Statistics, Building Permits (411 and 412), Bulgaria, (Eurostat1, 2011,p. 6-7)
Which variables are compiled?
Please indicate which variables are compiled for national and STS Regulation purposes.
For national purposes (X)
For STS Regulation (X)
Building permits: number of building permits x Building permits: number of buildings x Building permits: number of dwellings x x Building permits: useful floor area x x Building permits: alternative size measure (Sq m) x x
2.2.2 Measuring User Perceptions User satisfaction is the number one priority. The most effective method of evaluation is a full scale user satisfaction survey, conducted in accordance with normal survey best practices - drawing a representative sample of users from an appropriate frame, designing and testing a suitable questionnaire, collecting, processing and analysing the results, etc.
Conducting a user satisfaction survey is not always affordable, particularly for small statistical processes where it would represent a significant share of the operation’s total budget. Other methods of assessment include analysis of publication sales, user comments, requests and complaints received, web site accesses, etc., and feedback from advisory committees and focus groups.
The quality report should present the main results regarding user satisfaction, preferably broken down by the most important classes of users. It should also indicate the methods used for assessment and the measures taken to improve user satisfaction. The same comments apply for ESS level as for national level.
The following paragraphs provide some examples.
Example 2.2.2.A: User Satisfaction Assessment for Euro-SICS database (Ladiray & Sartori, 2001,p. 647)
Eurostat conducts an evaluation of user satisfaction for the Euro-SICS database containing Euro-zone short-term indicators. It is undertaken mainly through continuous dialogue with its two main users, DG ECFIN and the European Central Bank (ECB). The January 2001 Quality Report noted that users requested “more indicators but less breakdowns”. This is obviously the type of information that helps give an idea of the relevance of the output and to orient future developments.
Example 2.2.2.B: Background - Eurostat Satisfaction Survey 2013 (Eurostat1, 2013,p. 2)
Eurostat conducted a user satisfaction survey during the months of April and June 2013. The survey covered four main topics:
• information on types of users and uses of European statistics; • quality aspects; • trust in European Statistics; • dissemination of statistics.
eurostat ESS Handbook for Quality Reports 27
Example 2.2.2.C: INSEE Satisfaction Surveys (to be published soon)
During the year 2012, the french National Statistics Institute realized six satisfaction surveys on various topics. These can be general subjects, like the presence of the institute on the social networks or on the public image of the institute, or they can be on specific topic like the satisfaction concerning the Elaboration of annual statistics of companies. At the end of each survey, a document describing the methodology of the survey and analysing the results is released.
2.2.3 Completeness If certain indicators, variables and/or domains foreseen by the ESS or other international regulations/ guidelines are not covered, the statistics are incomplete. An explicit statement of the degree of completeness in terms of ESS regulations should be given where relevant, including plans for improvements in this respect in the future. Completeness can also be measured relative to a national target.
ESS level
In an ESS level quality report, the completeness of the national statistical outputs should be analysed. In this respect, two dimensions are important:
• Are any Member States not producing the statistics in question?
• Are important variables missing from the outputs of some Member States?
2.3 For Statistical Processes Using Administrative Source(s)
When administrative data are used for statistical purposes, the registered population and definitions of the included variables are already fixed based on the primary purpose of the administrative register or transaction database. These definitions are often not ideal for statistical purposes and may give rise to constraints when defining the target population and target variables. The quality report should include definitions of important variables including population definition in the register/database and discuss their relation to / accordance with the definitions desired by key users of the statistics.
ESS level
An overview over national definitions and sources should be given.
Example 2.3.A: Quality description for adoptions statistics 2010, Finland (Statistics Finland, 2011)
Relevance of statistical information
The main source used when producing Finnish population statistics is the Population Information System of the Population Register Centre. Changes in the data on the vital events of the resident population are updated into the Population Information System continuously by local population register authorities. From 1975 Statistics Finland has obtained population data from the Population Register Centre.
The last population registration was carried out in Finland on 1 January 1989. After that the Population Information System has been updated by notifications of changes. The data stored in the Population Information System are specified in the Population Information Act (11 June 1993/507).
Statistics Finland’s function is to compile statistics on conditions in society (Statistics Finland Act of 24 January 1992/48). These also include demographic statistics. Statistics Finland’s Rules of Procedure defines the Population Statistics unit as the producer of demographic statistics (Statistics Finland’s Rules of Procedure, TK-00-1469-10).
In accordance with the Act on the Municipality of Domicile, the municipality of domicile and the place of residence of individuals are recorded in the Population Information System. The municipality in which a person
ESS Handbook for Quality Reports eurostat 28
lives or the one construed by the inhabitant as the municipality of domicile on the grounds of residence, family ties, livelihood or other equivalent circumstances, or to which the inhabitant has close links due to the aforementioned circumstances is deemed the municipality of domicile. (Act on the Municipality of Domicile, 201/1994.) The population registered in the Population Information System is divided into those present and those absent. Those present are permanent residents of Finland, either Finnish nationals or aliens. Those absent are Finnish nationals who when emigrating from the country have reported that they intend to be absent from Finland for more than one year, with the exception of Finnish nationals who are diplomats and those working in development co-operation (Act on the Municipality of Domicile, 201/1994.) Only changes in the population resident in Finland on 31 December are taken into account when compiling statistics on vital events. Persons moving to Finland from abroad are classified in the population statistics if the place of residence they have declared as their municipality of domicile is later confirmed as their place of residence.
Adoptions
Adoption, or acceptance as one's own child, refers to the creation of a parent-child relationship that is confirmed by a court decision and replaces the biological parent-child relationship. A new law (391/2009) took effect in September 2009 and it gave possibility to apply for adoption to her or him who lived in a registrated partnership so that another partner had children. An adoption is taken into consideration in statistics when at least one of the adoptive parents is permanently resident in Finland at the time of the decision. The permanent place of residence of the adopted child at the time of the decision has no significance when cases are selected into statistics.
2.4 Price Index Processes
In price indexes, although defined in general terms by economic theory, the target of estimation is usually impossible to specify exactly and is even open to some controversy. A quality report should discuss important issues concerning the target of estimation and its relation to approaches and methods chosen, also relating these to recommendations in international manuals and legal documents in the ESS system.
Example 2.4.A: Discussion on the purpose of HICP as a CPI (Eurostat, 2001, p. 36-37)
6.1. Relevance
Relevance refers to the purpose of the HICP. As noted in Section 3.1. above the aim of the HICP is to measure inflation as distinct from the cost of living. It is therefore inappropriate to criticise the HICP from the latter perspective. However, a great deal has been said over the years about bias in CPIs without recognition of the fact that there is a limit to what can be said with any degree of certainty. Unless the target has been precisely defined, it is impossible to say by how much it has been missed. CPIs can be compared one with another, and it can be argued that certain differences should be removed, as has been done in the harmonization process, but there is no operational definition of the unbiased index by which to judge all other CPIs. Each CPI has been developed over a long period of time with the index compilers solving the operational problems in as consistent and coherent a way as possible. The actual conceptual framework for any CPI is thus embodied in its history. Meanwhile, efforts have been made to build alternative conceptual frameworks relying on economic and statistical theory. These ideas have influenced index design but have not, for the most part, determined actual operational practice.
The Treaty and the framework Council Regulation define the HICP. The Treaty required a consumer price inflation index; the Council Regulation required that it should be a Laspeyres-type index measuring the average change in the prices of goods and services available for purchase in the economic territory of the MSs. This definition was agreed, following the requirement of the Treaty, between Eurostat and the main users. As such, the definition constitutes a broad operational definition of ‘inflation’.
There are many unresolved operational issues and, given the dynamic nature of European economies, there always will be. These issues give rise to a concern that there is potential for bias and probably actual bias.
Reduction of bias can only be achieved by progressive improvement of current practices within a developing conceptual framework. It is in the latter where economic and statistical theory can contribute.
As noted in the previous Report to the Council, the Boskin Report on the US CPI challenged the question whether CPIs in general were of sufficient reliability in respect to possible bias. It took the view that the US CPI was biased upwards, mainly because of a presumed failure to deal with the adjustment for quality change in goods and services (especially in hi-tech areas such as PCs and surgical operations). Whilst rejecting the
eurostat ESS Handbook for Quality Reports 29
suggestion that the size or the direction of any bias on this count can be determined without defining and constructing an actual index the Working Party on HICP has recognised from the outset that the treatment of quality change was the most likely source of bias as well as non-comparability.
There is however an important issue of terminology. As regards HICPs, ‘validity bias’ in Eurostat’s vocabulary can be described as the systematic difference between the index as required by the HICP legal framework and the index as defined. That is the difference between ‘concept’ and ‘definition’, e.g. the difference between the ideal ‘pure price HICP’ and the particular HICPs defined by Eurostat and the MSs. On the contrary, bias in the vocabulary of the Boskin Commission takes a Cost Of Living Index (COLI) as the point of reference. Utility may be based on costs that do not necessarily involve expenditure or purchaser prices faced by consumers. They can be opportunity costs or physical consumption valued at imaginary prices and may never result to actual expenditure. These costs do not involve monetary transactions and are not relevant in the measure of inflation required for monetary policy. Utility theory further involves assumptions about the nature of the consumer and the hidden mechanisms by which prices are established. While the Laspeyres index approach makes no such assumptions it is, nevertheless, accepted that agreement on how to treat quality change will necessarily involve a conceptual elaboration of the consumer valuation of product difference and how it is to be measured.
Suitability of a CPI as an appropriate measure of inflation in this vocabulary means in fact suitability of a CPI to approximate as close as possible an undefined COLI. This approach does not seem applicable to HICPs as it suggests, contrary to the spirit and the letter of the HICP legal framework, that there would be by concept and definition a validity bias in the HICP.
2.5 For Statistical Compilations
The quality report needs to relate to the definitions and conceptual choices made in line with recommended international manuals or other forms of general agreement.
For the National Accounts there are two relevant manuals, the System of National Accounts 1993 (or the updated 2008 version) at international level and ESA95 / ESA2010 at the EU level.
For the Balance of Payments there are, for example, the IMF Balance of Payments Manual and the OECD benchmark definition of Foreign Direct Investment (FDI).
Example 2.5.A: Relevance - BOP and Related Results Compilation 2011, Ireland (Central Statistics Office Ireland, 2013, p. 13)
These statutory inquiries are conducted to meet the requirements of Regulation (EC) No 184/2005 of the European Parliament and of the Council of 12 January 2005 on community statistics concerning balance of payments, international trade in services and foreign direct investment (as amended by Regulation Nos 601/2006, 602/2006, 1137/2008 and 707/2009) and the ECB Guideline ECB/2004/15 (as amended by ECB Guideline ECB/2007/3 and recast in Guideline ECB/2011/23) on the statistical reporting requirements of the European Central Bank in the field of balance of payments and international investment position statistics.
As a result of its role in monitoring Ireland’s economic performance, the Department of Finance is interested in all aspects of the BOP. The main focus of the Department of Enterprise, Trade and Employment is on industrial development in the manufacturing and services sectors. This Department and Forfás, an agency operating under its aegis and involved in attracting foreign direct investment to Ireland, are particularly interested in the direct investment aspects of the BOP, as well as in the data on merchandise and services. Data are also used by stockbrokers, analysts in the field of economic and social research as well as universities. The National Accounts Division also uses BOP results internally within the CSO. The CSO supplies data to international organisations such as the ECB, the European Commission (Eurostat), the IMF and the OECD.
Quality and Performance Indicators
R1. Data completeness – rate for Producers of statistics
General definition: The ratio of the number of data cells provided to the number of data cells required.
ESS Handbook for Quality Reports eurostat 30
To be further defined for subject-matter domain: (i) the set of relevant data elements; (ii) possible weighting, distinguishing key and non-key data elements.
It should be noted that:
1. This indicator is applicable only if there is an ESS regulation or guideline.
2. Not all output data elements are of equal importance. Thus, an appropriate weighting system will often improve the usefulness of this indicator.
ESS level
(i) Presentation of R1 over all Member States.
(ii) Presentation of an overall (weighted or un-weighted) R1 over all Member States.
Summary
What should be included on Relevance • A content-oriented description of all statistical outputs. • Definitions of statistical target concepts (population, definition of units and aggregation formula) including discrepancies from ESS/international concepts. (May also be discussed under Coherence and Comparability.) • Information on completeness compared with relevant regulations/guidelines. • Available quality indicators. • Means of obtaining information on users and uses. • Description and classification of users. • Uses for which users want the outputs. • Unmet user needs, including reasons for not meeting them. • Users and uses given special consideration. • Means of obtaining user views. • Main results regarding user satisfaction. • Date of most recent user satisfaction survey.
eurostat ESS Handbook for Quality Reports 31
3 Accuracy and reliability
3.1 ESS Quality Definitions
The accuracy of statistical outputs in the general statistical sense is the degree of closeness of computations or estimates to the exact or true values that the statistics were intended to measure.
Reliability refers to the closeness of the initial estimated value to the subsequent estimated value. The concept of accuracy is further broken down into:
a) Overall accuracy Description: Overall accuracy is the assessment of accuracy linked to a certain data set or domain, which is summarising the various components. ESS Guidelines: Describe the main sources of random and systematic error in the statistical outputs and provide a summary assessment of all errors with special focus on the impact on key estimates. The bias assessment can be in quantitative or qualitative terms, or both. It should reflect the producer’s best current understanding (sign and order of magnitude) including actions taken to reduce bias. Revision aspects should also be included here if considered relevant.
b) Sampling error Description: That part of the difference between a population value and an estimate thereof, derived from a random sample, which is due to the fact that only a subset of the population is enumerated. ESS Guidelines: If probability sampling is used, the range of variation, among key variables, of the A1: Sampling error – indicator should be reported. It should be also stated if adjustments for non-response, misclassifications and other uncertainty sources such as outlier treatment are included. The calculation of sampling error could be also affected by imputation. This should be noted unless special methods have been applied to deal with this. If non-probability sampling is used, the person responsible for the statistical domain should provide estimates of the accuracy, a motivation for the invoked model for this estimation, and brief discussion of sampling bias.
c) Non-sampling error Description: Error in survey estimates which cannot be attributed to sampling fluctuations. ESS Guidelines: For users, provide a user-oriented summary of the (preferably quantitative) assessment of the non-sampling errors, non-response rates and the bias risks which are associated with them (coverage error: over/ undercoverage and multiple listings; measurement error: survey instrument, respondent and interviewer effect where relevant; non-response error: level of unit (non)response including causes and measures for non-response, level of item non-response for key variables; processing error: data editing, coding and imputation error where relevant; model assumption error: specific models used in estimation) and actions undertaken to reduce
ESS Handbook for Quality Reports eurostat 32
the different types of errors. For producers of statistics, not to be reported, information to be included in the following sub-concepts:
i. Coverage error Description: Divergence between the frame population and the target population.
ESS Guidelines: Some information on the register or other frame source should be reported upon (this assists in understanding coverage errors and their effects): reference period, frequency and timing of frame updates, updating actions, eventual discrepancies between the units reported in the frame and the target population unit, references to other documents on frame quality and effects of frame deficiencies on the outputs. Provide an assessment, whenever possible quantitative, on overcoverage and multiple listings, and on the extent of undercoverage. Report also an evaluation of the bias risks associated with the latter. Describe actions taken for reduction of undercoverage and associated bias risks.
ii. Measurement error Description: Measurement errors are errors that occur during data collection and cause recorded values of variables to be different from the true ones.
ESS Guidelines: Identification and general assessment of the main sources of measurement error should be reported. The efforts made in questionnaire design and testing, information on interviewer training and other work on error prevention should be described. If available, assessments based on comparisons with external data, re-interviews or experiments should be stated. Also results of indirect analysis, e.g.: based on the results on editing phase, could be reported. Describe actions taken to correct measurement errors.
iii. Non-response error Description: Non-response errors occur when the survey fails to get a response to one, or possibly all, of the questions.
ESS Guidelines: Provide a qualitative assessment on the level of unit non response. Highlight the presence of variables that are more subject to item non response (e.g. sensitive questions). Provide a qualitative assessment on the bias associated with non-response. Describe the breakdown of non-respondents according to cause for non-response. Report efforts and measures, including response modelling, to reduce non-response in the primary data collection and follow-ups and technical treatment of non-response at the estimation stage.
iv. Processing error Description: The error in final data collection process results arising from the faulty implementation of correctly planned implementation methods.
ESS Guidelines: Identification of the main issues regarding processing errors for the statistical process and its outputs should be taken into consideration. Where relevant and available, an analysis of processing errors affecting individual observations should be presented; else a qualitative assessment should be included. The treatment of micro-data processing errors needs to be
eurostat ESS Handbook for Quality Reports 33
proportional to their importance. When they are significant, their extent and impact on the results should be evaluated. Describe linking and coding errors if applicable.
3.2 For all statistical processes
A purpose of statistics is to produce estimates of unknown values of quantifiable characteristics of a target population. Estimates are not equal to the true values because of errors that can happen in the various phases of the production processes. There are several types of error originating from all the various production processes and a classification of errors has been developed. Sampling errors, which apply only to sample surveys; arise because only a subset of the population is selected, usually randomly. Non-sampling errors, which apply to all statistical processes, may be categorised as:
• coverage errors:
• non-response errors;
• measurement errors; and
• processing errors. Model assumption errors are not considered an independent type of error. Usually models are used precisely in order to reduce other errors. If so, they are second-order error types and do not merit a separate heading. However, it is important to distinguish different cases with regard to the use of models in official statistics (see Section 3.9.1 below.)
The above forms of non-sampling errors have clear definitions in probability sample surveys, but for other statistical processes their meanings are not so well established and need more elaboration as the error classification above may not be the one best suited for reporting accuracy. Therefore the error profiles for each type of statistical process are discussed in separate sections.
In order to get an idea of the impact of the various errors on the final estimates it is important to understand the nature of errors. Variable errors are due to random effects (e.g. these errors cancel out when averaging a series of values affected by them) while systematic errors are due to particular causes, that tend to be in the same direction with respect to the true value (these errors do not cancel out when averaging a series of values affected by them). To understand the impact of these errors it is necessary to consider the collection of final estimates as obtained over many hypothetical repetitions of the process under essentially the same conditions. In general, when the interest is in population means, totals, proportions (linear estimates) variable errors determine the variability, i.e. random fluctuations of the final estimates around the true unknown value from implementation to implementation of the statistical process; the systematic errors introduce bias into the final estimates (the average of the possible values of the statistics from implementation to implementation is not equal to the true value; the bias of an estimator equals the difference between its expected value and the true value). Unfortunately, when the interest is in nonlinear estimates such as correlation coefficients, regression coefficients, complex indices etc., both systematic and variable errors can lead to bias of final estimates. For instance, variable errors determine underestimation of the regression coefficient (attenuation).
A section on overall accuracy is required in any quality report. The section should begin with identification of the main sources of variability and bias of the statistical outputs. Distinctions should be made between the main variables, domains of study and estimates. The section
ESS Handbook for Quality Reports eurostat 34
should contain a summary discussion of all errors. For key indicators an assessment of the aggregate risk of the impact of random and systematic errors should be made.
Random variation can be associated with all types of error, its main sources are normally sampling, measurement and processing errors. Sampling is usually the major source and, because of the difficulties in estimating the variability due to measurement and processing errors, it is common to document the random variation only in the sub-section on sampling. An assessment of the risks of bias for important estimates is often best made in the overall accuracy section, except where bias is associated mainly with a particular source of error, in which case the assessment can be included in the relevant sub-section on that type of error.
According to the state of knowledge of the producer, the assessment of bias can be in quantitative or qualitative terms, or both. It should reflect the producer’s best current understanding including actions taken to reduce bias. A qualitative assessment should refer to the likely sign of the net bias and include a statement referring to its order of size, for example using general terms like negligible, small, or large or by stating its likely maximum value. The basis for this statement should be included as well.
Specific sources of error could be described in separate sub-sections under accuracy. Different types of statistics are affected by different types of errors and the relative importance of each type varies. Therefore, the detailed organisation of the section on accuracy in a quality report needs to be unique for each statistical process and outputs. Domain-specific regulations may give more guidance. This document provides advice for each specific type of statistical process.
A useful general reference on reporting accuracy is Measuring and Reporting Sources of Error in Surveys produced by the US Office of Management and Budget (2001). An example of national quality guidelines is Statistics Finland’s Quality Guidelines for Official Statistics (2007).
There is a grey zone between certain relevance problems and accuracy. This occurs when the definitions most appropriate for users are modified so as to fit the practical measurement circumstances, with the consequence that the statistical outputs become less relevant to the users. To avoid ambiguity, accuracy as defined here refers to the difference between the estimates and the true values as defined in the practical situation.
ESS level
In an ESS level quality report, the key methodological divergences by Member States from ESS and/or international norms should be described under Accuracy or in the Introduction. There should also be information on other important differences affecting accuracy between Member States.
An assessment of the most critical issues concerning accuracy should be included. Separate sub-sections should deal with each of these issues. Where European aggregates are calculated their computation should be explained and their specific error profiles, based on national estimates, should be analysed based on currently best available knowledge.
The detailed structure of the accuracy section depends on the key issues for each type of statistical process and its outputs. The ultimate objective is to provide the best overview assessment possible of the possible margins of error associated with the estimates in the national and European level outputs. Special emphasis should be on how these margins of error could affect comparisons between Member States.
eurostat ESS Handbook for Quality Reports 35
Evaluation
To report on accuracy it is necessary to evaluate accuracy, i.e., to acquire the relevant information about accuracy. Note there is a distinction between quality control (meaning ensuring quality of output) and evaluation (meaning acquiring information about the quality of output).
At this point it is appropriate to note that the methodology work on estimating the total error of an estimate is still rather limited. In the "Introduction to Survey Quality" Biemer and Lyberg (2003) note that most of the developments were focused on variance properties; in particular, estimation of variance due to sampling error in probability surveys, and estimation of some variance components due to measurement and processing errors (which usually requires additional costs). However, methods to evaluate total survey error by various components, in particular the bias, are being gradually developed (Biemer, 2011, Groves and Lyberg 2011). Thus evaluation methods are indicated in several of the subsections below.
The methods and approaches for evaluation described below are less well defined than variance estimation used for evaluating sampling error, for which there is a solid statistical theory. Often they have a more common sense character and the results they provide have to be used with judgement and accompanied by a discussion of the possible risks of error.
The first approach is to make a comparison with another source. For example, employment is often estimated by labour force surveys as well as by business surveys. In practice the differences observed in comparisons between such sources are combinations of errors and differences in definitions (as further discussed in the chapter on Coherence). An analysis aiming at decomposing the differences can shed light on total error.
Consistency studies can be used when there are known relations between different parameters, for example: • number of married men equals number of married women (according to traditional marriage laws);
• number of dwellings in year 1 = number of dwellings in year 0 + new construction – demolition (+ net change in use);
• income = expenditure + saving - new loans. Relations need not be exactly satisfied by the data. However, significant discrepancies require further exploration of possible errors or mistakes. Consistency studies should normally be done before statistical results are published but for reasons of time this is not always possible. If different parameters are estimated independently, inconsistencies between estimates for them could be a starting point for analysing errors in each one of them.
Summary
What should be included on Overall Accuracy
Identification of the main sources of error for the main variables. If micro-data are accessible for research purposes, it may be necessary to make additional comments to assist such uses. A summary assessment of all sources of error with special focus on the key estimates. An assessment of the potential for bias (sign and order of magnitude) for each key indicator in quantitative or qualitative terms.
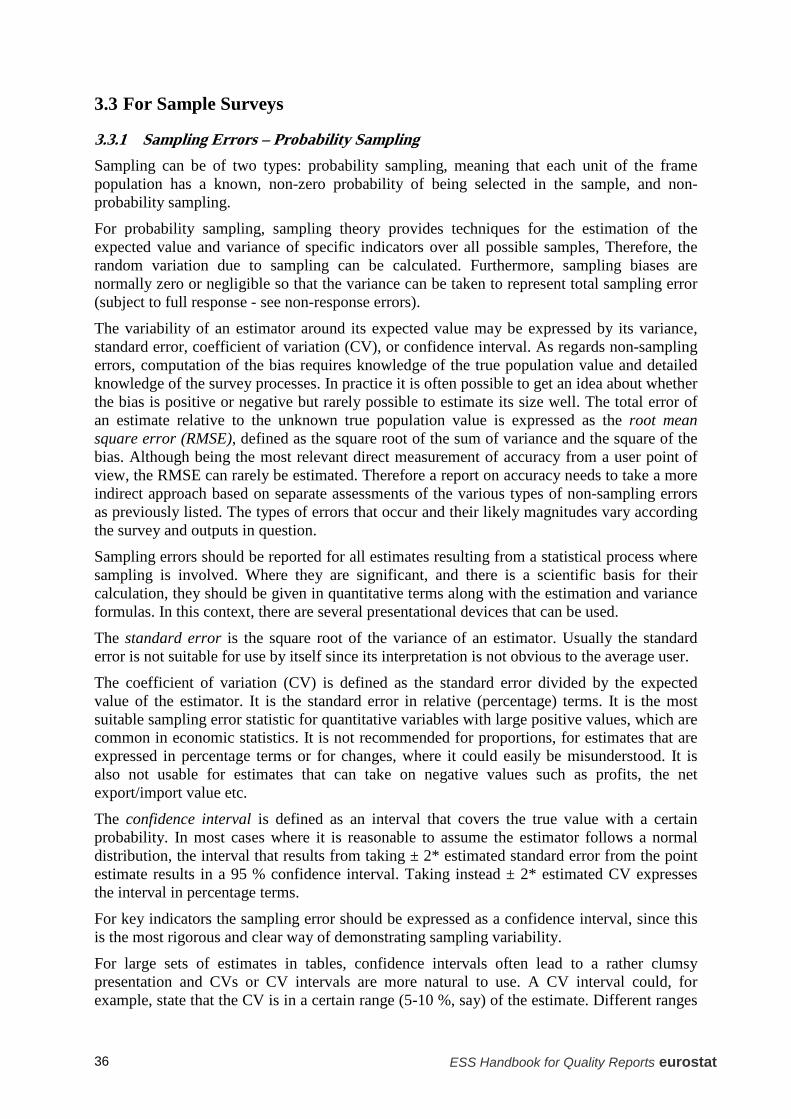
ESS Handbook for Quality Reports eurostat 36
3.3 For Sample Surveys
3.3.1 Sampling Errors – Probability Sampling Sampling can be of two types: probability sampling, meaning that each unit of the frame population has a known, non-zero probability of being selected in the sample, and non-probability sampling.
For probability sampling, sampling theory provides techniques for the estimation of the expected value and variance of specific indicators over all possible samples, Therefore, the random variation due to sampling can be calculated. Furthermore, sampling biases are normally zero or negligible so that the variance can be taken to represent total sampling error (subject to full response - see non-response errors).
The variability of an estimator around its expected value may be expressed by its variance, standard error, coefficient of variation (CV), or confidence interval. As regards non-sampling errors, computation of the bias requires knowledge of the true population value and detailed knowledge of the survey processes. In practice it is often possible to get an idea about whether the bias is positive or negative but rarely possible to estimate its size well. The total error of an estimate relative to the unknown true population value is expressed as the root mean square error (RMSE), defined as the square root of the sum of variance and the square of the bias. Although being the most relevant direct measurement of accuracy from a user point of view, the RMSE can rarely be estimated. Therefore a report on accuracy needs to take a more indirect approach based on separate assessments of the various types of non-sampling errors as previously listed. The types of errors that occur and their likely magnitudes vary according the survey and outputs in question.
Sampling errors should be reported for all estimates resulting from a statistical process where sampling is involved. Where they are significant, and there is a scientific basis for their calculation, they should be given in quantitative terms along with the estimation and variance formulas. In this context, there are several presentational devices that can be used.
The standard error is the square root of the variance of an estimator. Usually the standard error is not suitable for use by itself since its interpretation is not obvious to the average user.
The coefficient of variation (CV) is defined as the standard error divided by the expected value of the estimator. It is the standard error in relative (percentage) terms. It is the most suitable sampling error statistic for quantitative variables with large positive values, which are common in economic statistics. It is not recommended for proportions, for estimates that are expressed in percentage terms or for changes, where it could easily be misunderstood. It is also not usable for estimates that can take on negative values such as profits, the net export/import value etc.
The confidence interval is defined as an interval that covers the true value with a certain probability. In most cases where it is reasonable to assume the estimator follows a normal distribution, the interval that results from taking ± 2* estimated standard error from the point estimate results in a 95 % confidence interval. Taking instead ± 2* estimated CV expresses the interval in percentage terms.
For key indicators the sampling error should be expressed as a confidence interval, since this is the most rigorous and clear way of demonstrating sampling variability.
For large sets of estimates in tables, confidence intervals often lead to a rather clumsy presentation and CVs or CV intervals are more natural to use. A CV interval could, for example, state that the CV is in a certain range (5-10 %, say) of the estimate. Different ranges
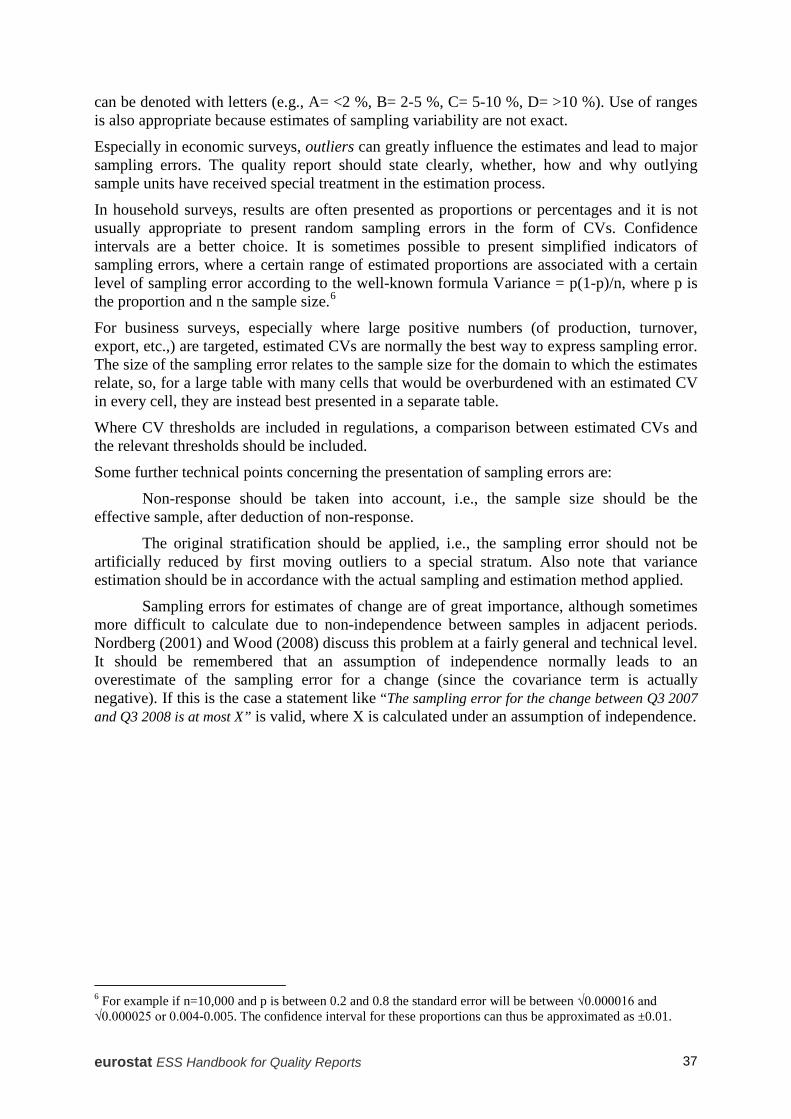
eurostat ESS Handbook for Quality Reports 37
can be denoted with letters (e.g., A= <2 %, B= 2-5 %, C= 5-10 %, D= >10 %). Use of ranges is also appropriate because estimates of sampling variability are not exact.
Especially in economic surveys, outliers can greatly influence the estimates and lead to major sampling errors. The quality report should state clearly, whether, how and why outlying sample units have received special treatment in the estimation process.
In household surveys, results are often presented as proportions or percentages and it is not usually appropriate to present random sampling errors in the form of CVs. Confidence intervals are a better choice. It is sometimes possible to present simplified indicators of sampling errors, where a certain range of estimated proportions are associated with a certain level of sampling error according to the well-known formula Variance = p(1-p)/n, where p is the proportion and n the sample size.6
For business surveys, especially where large positive numbers (of production, turnover, export, etc.,) are targeted, estimated CVs are normally the best way to express sampling error. The size of the sampling error relates to the sample size for the domain to which the estimates relate, so, for a large table with many cells that would be overburdened with an estimated CV in every cell, they are instead best presented in a separate table.
Where CV thresholds are included in regulations, a comparison between estimated CVs and the relevant thresholds should be included.
Some further technical points concerning the presentation of sampling errors are:
Non-response should be taken into account, i.e., the sample size should be the effective sample, after deduction of non-response.
The original stratification should be applied, i.e., the sampling error should not be artificially reduced by first moving outliers to a special stratum. Also note that variance estimation should be in accordance with the actual sampling and estimation method applied.
Sampling errors for estimates of change are of great importance, although sometimes more difficult to calculate due to non-independence between samples in adjacent periods. Nordberg (2001) and Wood (2008) discuss this problem at a fairly general and technical level. It should be remembered that an assumption of independence normally leads to an overestimate of the sampling error for a change (since the covariance term is actually negative). If this is the case a statement like “The sampling error for the change between Q3 2007 and Q3 2008 is at most X” is valid, where X is calculated under an assumption of independence.
6 For example if n=10,000 and p is between 0.2 and 0.8 the standard error will be between √0.000016 and √0.000025 or 0.004-0.005. The confidence interval for these proportions can thus be approximated as ±0.01.
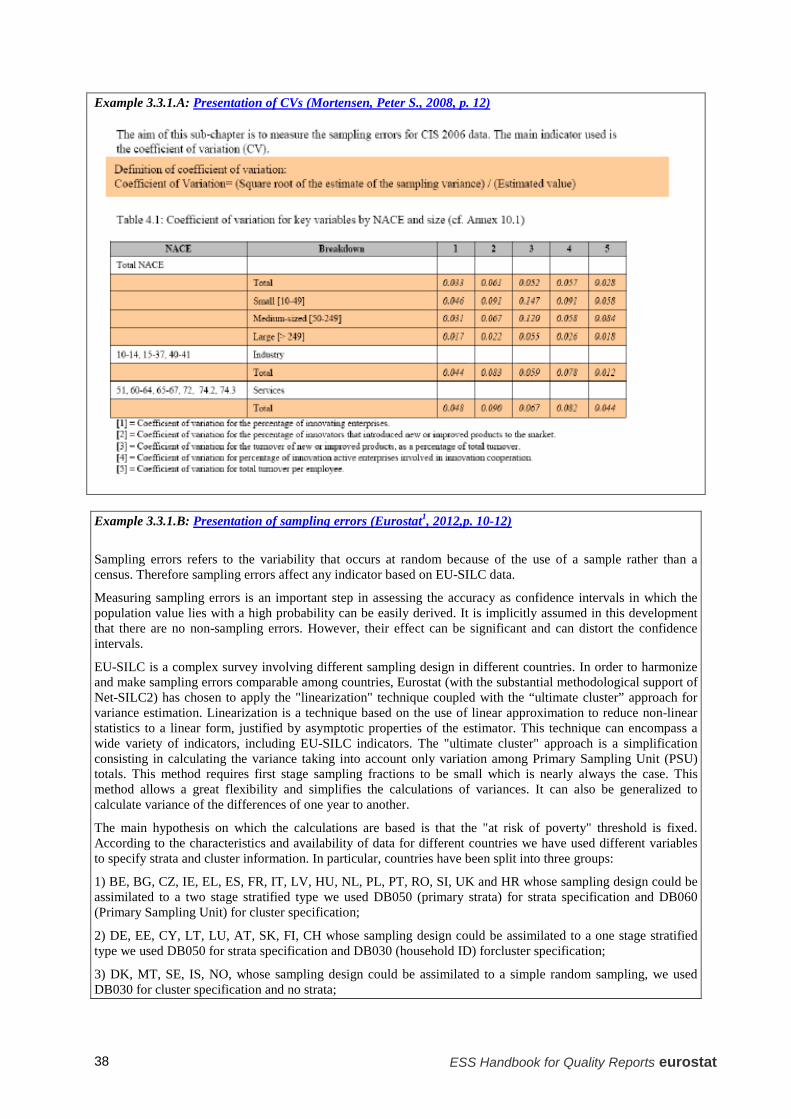
ESS Handbook for Quality Reports eurostat 38
Example 3.3.1.A: Presentation of CVs (Mortensen, Peter S., 2008, p. 12)
Example 3.3.1.B: Presentation of sampling errors (Eurostat1, 2012,p. 10-12)
Sampling errors refers to the variability that occurs at random because of the use of a sample rather than a census. Therefore sampling errors affect any indicator based on EU-SILC data.
Measuring sampling errors is an important step in assessing the accuracy as confidence intervals in which the population value lies with a high probability can be easily derived. It is implicitly assumed in this development that there are no non-sampling errors. However, their effect can be significant and can distort the confidence intervals.
EU-SILC is a complex survey involving different sampling design in different countries. In order to harmonize and make sampling errors comparable among countries, Eurostat (with the substantial methodological support of Net-SILC2) has chosen to apply the "linearization" technique coupled with the “ultimate cluster” approach for variance estimation. Linearization is a technique based on the use of linear approximation to reduce non-linear statistics to a linear form, justified by asymptotic properties of the estimator. This technique can encompass a wide variety of indicators, including EU-SILC indicators. The "ultimate cluster" approach is a simplification consisting in calculating the variance taking into account only variation among Primary Sampling Unit (PSU) totals. This method requires first stage sampling fractions to be small which is nearly always the case. This method allows a great flexibility and simplifies the calculations of variances. It can also be generalized to calculate variance of the differences of one year to another.
The main hypothesis on which the calculations are based is that the "at risk of poverty" threshold is fixed. According to the characteristics and availability of data for different countries we have used different variables to specify strata and cluster information. In particular, countries have been split into three groups:
1) BE, BG, CZ, IE, EL, ES, FR, IT, LV, HU, NL, PL, PT, RO, SI, UK and HR whose sampling design could be assimilated to a two stage stratified type we used DB050 (primary strata) for strata specification and DB060 (Primary Sampling Unit) for cluster specification;
2) DE, EE, CY, LT, LU, AT, SK, FI, CH whose sampling design could be assimilated to a one stage stratified type we used DB050 for strata specification and DB030 (household ID) forcluster specification;
3) DK, MT, SE, IS, NO, whose sampling design could be assimilated to a simple random sampling, we used DB030 for cluster specification and no strata;
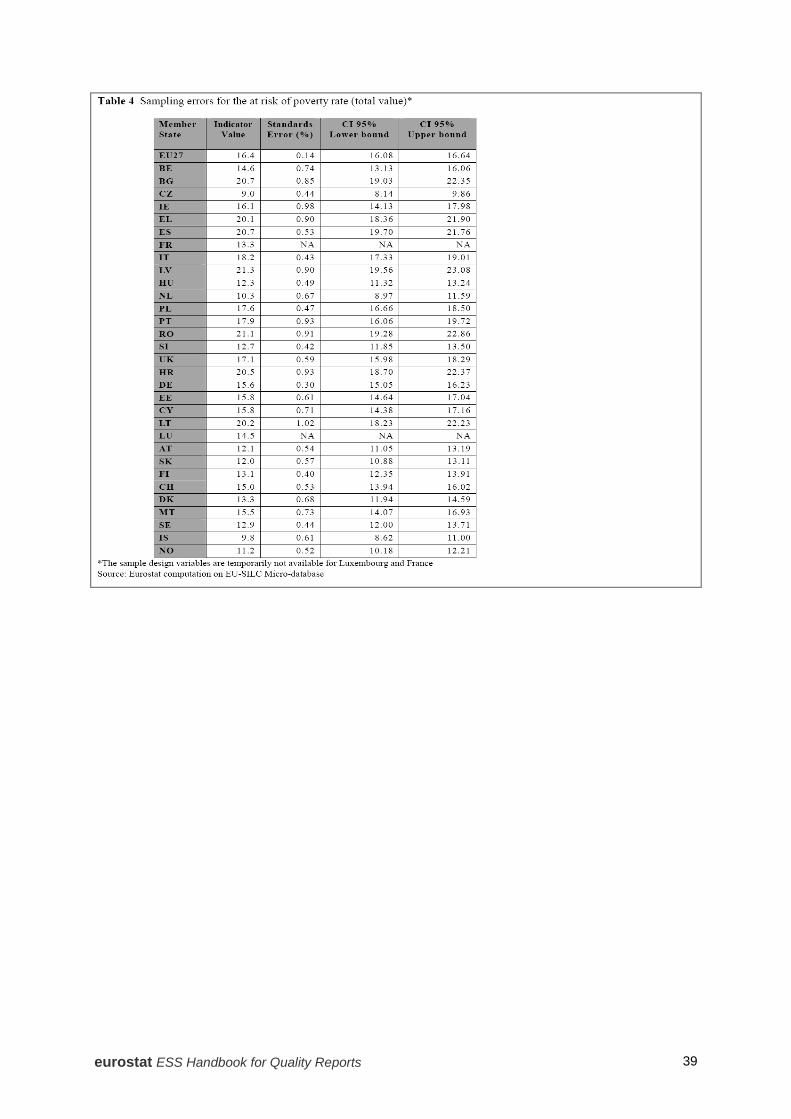
eurostat ESS Handbook for Quality Reports 39
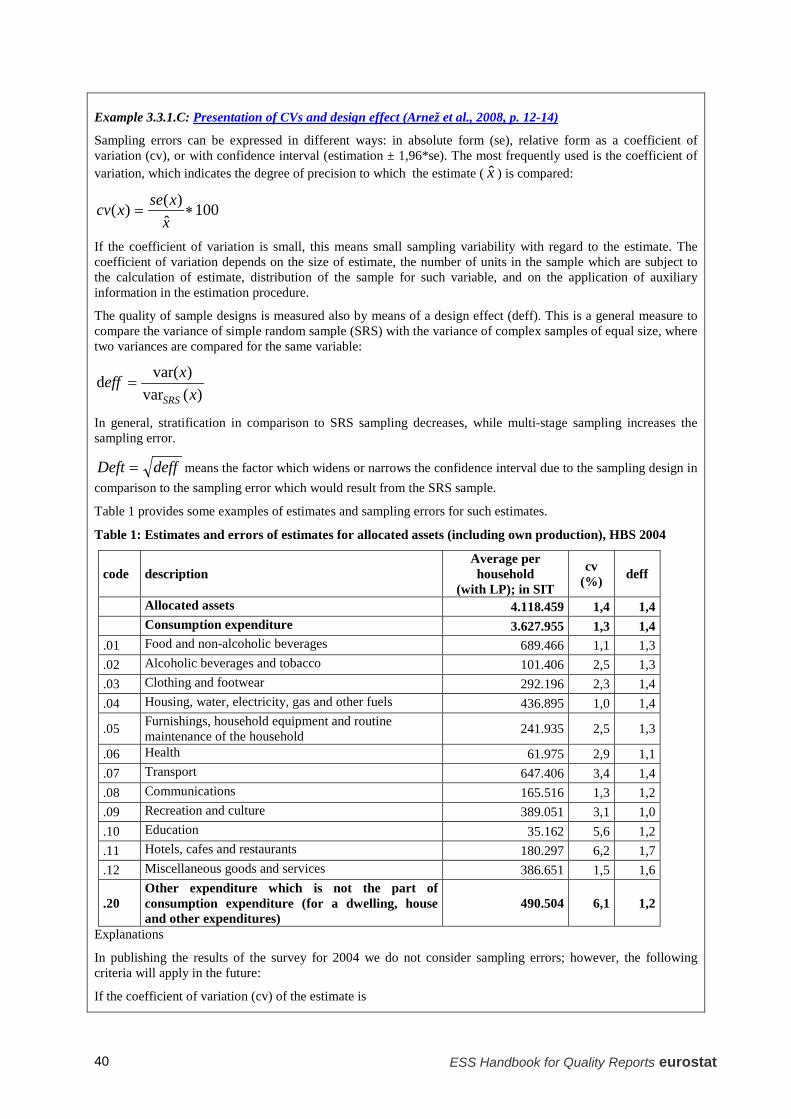
ESS Handbook for Quality Reports eurostat 40
Example 3.3.1.C: Presentation of CVs and design effect (Arnež et al., 2008, p. 12-14)
Sampling errors can be expressed in different ways: in absolute form (se), relative form as a coefficient of variation (cv), or with confidence interval (estimation ± 1,96*se). The most frequently used is the coefficient of variation, which indicates the degree of precision to which the estimate ( x̂ ) is compared:
100ˆ
)()( ∗=xxsexcv
If the coefficient of variation is small, this means small sampling variability with regard to the estimate. The coefficient of variation depends on the size of estimate, the number of units in the sample which are subject to the calculation of estimate, distribution of the sample for such variable, and on the application of auxiliary information in the estimation procedure.
The quality of sample designs is measured also by means of a design effect (deff). This is a general measure to compare the variance of simple random sample (SRS) with the variance of complex samples of equal size, where two variances are compared for the same variable:
)(var)var(dx
xeffSRS
=
In general, stratification in comparison to SRS sampling decreases, while multi-stage sampling increases the sampling error.
deffDeft = means the factor which widens or narrows the confidence interval due to the sampling design in comparison to the sampling error which would result from the SRS sample.
Table 1 provides some examples of estimates and sampling errors for such estimates.
Table 1: Estimates and errors of estimates for allocated assets (including own production), HBS 2004
code description Average per household
(with LP); in SIT
cv (%) deff
Allocated assets 4.118.459 1,4 1,4 Consumption expenditure 3.627.955 1,3 1,4 .01 Food and non-alcoholic beverages 689.466 1,1 1,3 .02 Alcoholic beverages and tobacco 101.406 2,5 1,3 .03 Clothing and footwear 292.196 2,3 1,4 .04 Housing, water, electricity, gas and other fuels 436.895 1,0 1,4
.05 Furnishings, household equipment and routine maintenance of the household 241.935 2,5 1,3
.06 Health 61.975 2,9 1,1
.07 Transport 647.406 3,4 1,4
.08 Communications 165.516 1,3 1,2
.09 Recreation and culture 389.051 3,1 1,0
.10 Education 35.162 5,6 1,2
.11 Hotels, cafes and restaurants 180.297 6,2 1,7
.12 Miscellaneous goods and services 386.651 1,5 1,6
.20 Other expenditure which is not the part of consumption expenditure (for a dwelling, house and other expenditures)
490.504 6,1 1,2
Explanations
In publishing the results of the survey for 2004 we do not consider sampling errors; however, the following criteria will apply in the future:
If the coefficient of variation (cv) of the estimate is
eurostat ESS Handbook for Quality Reports 41
10 % or less (cv<=10 %), the estimate is precise enough and is therefore published without restrictions
within the interval from 10 % to including 30 % (10%<cv<= 30 %), the estimate is less precise, and is therefore marked with the letter M
more than 30% (cv<=10 %), the estimate is not sufficiently precise to be published and is therefore replaced by the letter N
3.3.2 Sampling Errors – Non-Probability Sampling When non-probability sampling is applied, random error cannot be estimated without reference to a model of some kind. Furthermore, sampling biases may well be significant and need to be assessed as well. There are many types of non-probability sampling, each of which require their own evaluation depending on the situation at hand.
One type of non-probability sampling that is frequently applied in economic surveys and therefore needs special attention is the use of a cut-off threshold. Units (businesses, enterprises, establishments) below a certain size threshold, although belonging to the target population, are not sampled at all; there is a term cut-off sampling for such a procedure. Technically this situation is similar to undercoverage (further discussed below under coverage errors) but with the distinctive feature that the cut-off is intentional and there is register information for the excluded units, which gives a better opportunity for model-dependent estimation. Two of the reasons for a cut-off threshold are reduction of the response burden for small units and considerable contributions to the errors (sampling and non-sampling) of the design-based estimator.
The introduction of a cut-off threshold results in a different situation than probability sampling, including a bias (according to the design-based survey sampling paradigm) due to the sampling probability being zero. On the other hand, if, by definition, the target population refers only to the sampled portion of the population, then instead of an accuracy problem there is a relevance problem for those users who are interested in properties of all units and not just of those above the threshold. When the population below the threshold is included in the target, a model-based estimator is natural. From this perspective, the quality reporting rather belongs to Section 3.9.1 below, but it is put here.
A cut-off threshold is often combined with probability sampling above the threshold and in this case can be called sampling with cut-off as opposed to census with cut-off where all units above the threshold are included. For an example of census with cut-off see Example 3.9.1.C below.
For reporting on sampling with cut-off the most suitable approach is two-fold. For the sampled portion of the population, random sampling error may be presented as above. For the non-sampled portion a discussion about the (explicit or implicit) model used in the estimation process should be included. Often this model simply assumes that the units cut off behave similarly to those in the sampled portion. This assumption should be analysed as far as possible. Such an analysis is useful also where the cut-off is considered as a relevance problem rather than contributing to sampling error. If the accuracy has been evaluated on an intermittent basis by sampling in the cut-off portion this should be reported.
For other forms of non-probability sampling, for example those applied for price indexes, it may be reasonable to apply standard error estimators as if the sample is effectively random, using an assumption for the design or some model based approach. This approach has, however, to be complemented with a discussion of possible sampling bias and of possible limitations in the sampling model used. For example it can often be determined whether (and
ESS Handbook for Quality Reports eurostat 42
why) the estimates of sampling error thus derived are “conservative” (i.e., upper limits) relative to the real errors.
It is not enough just to declare that a sample is “purposive” or “subjective” without providing more information. Technical details on how the sample was selected should always be reported. The rationale for not using probability sampling should be stated as well as an assessment of how the sampling procedures can affect the estimates.
Quality and Performance Indicators
A1. Sampling error – indicators for Producers of statistics
General definition: Precision measures for estimating the random variation of an estimator due to sampling
To be further defined for subject-matter domain: list of variables and domains for which CVs or confidence intervals are to be provided as well as devices for summarising the information.
ESS level:
(i) CVs or confidence intervals for variables and Member States;
(ii) CVs or confidence intervals for European aggregates (if any).
It should be noted that CVs are useful primarily for variables taking on large values. They are not appropriate for proportions or for indicators that can take on negative values.
Summary
What should be included on Sampling Errors
Always applicable • Where sampling is used there should be a section on sampling errors.
• As far as possible sampling error should be presented for estimates of change in addition to estimates of level. If necessary, reasonable assumptions can be used. If probability sampling is used: • There should be a presentation of sampling errors calculated according to formulas that should also be made available. If the estimators include adjustments for non-sampling errors, for example non-response, this should be explained and included also in the accuracy assessment. • The most appropriate presentational device should be chosen, normally CVs, ranges of CVs, or confidence intervals. • If outliers have received special treatment in estimation, this must be clearly described. If non-probability sampling is used: • For sampling with cut-off an assessment of the accuracy due to the cut-off procedure should be included in addition to the presentation of sampling error for the sampled portion of the population (see also Section 3.9.1 below).
• For other forms of non-probability a sampling model can be invoked for the estimation of sampling error. A motivation for the chosen model and a discussion of sampling bias should be included.
3.3.3 Non- sampling errors - Coverage and Other Frame Errors The target population is the population for which inferences are made. The frame (or frames, as sometimes several frames are used) is a device that permits access to population units. The frame population is the set of population units which can be accessed through the frame and the survey data really refer to this population. The frame also contains sufficient information about the units for their stratification, sampling and contact.
eurostat ESS Handbook for Quality Reports 43
The concept of a frame is traditionally used for sample surveys, but applies equally to censuses. For some other types of statistical process the concept may also be useful but has to be defined in each case.
Coverage errors (or frame errors) are due to divergences between the frame population and the target population.
Three types of coverage error are distinguished:
• Undercoverage: there are target population units that are not accessible via the frame (e.g., persons without a phone will not be listed in a telephone catalogue);
• Overcoverage: there are units accessible via the frame which do not belong to the target population (e.g., deceased persons still listed in a telephone catalogue);
• Multiple listings (duplication): target population units are present more than once in the frame (e.g., persons with two or more telephone connections).
Other sorts of frame deficiencies that can cause errors involve incorrect classification, contact and auxiliary information about the units included in the frame. Such deficiencies can also cause errors other than coverage errors. For example, wrong contact information (address, phone number) may result in non-response error, or if the size of a unit as recorded in the frame is smaller than its actual size, the sampling error may increase (sometimes dramatically where an outlier is created).
Overcoverage can be detected during the measurement process, is straight forward to handle in the estimation procedure, and results in increases in sampling error and survey costs.
Multiple listings, if recognised, can be handled by statistical methods and also result in an increase of sampling error and cost but no significant biases. However, multiple listings of smaller units for which sampling rates are low are difficult to detect. If there is a significant risk of such error this should be reported.
As a matter of good practice, in annual or less frequent survey, the frame information for every contacted unit should be checked to see whether it is accurate. For subannual surveys, frame information should be checked for all new units and periodically, say annually, for continuing units. In this way overcoverage, inaccurate classification, contact and auxiliary information and multiple listings can be detected. The extent of these problems among the selected units can give an idea about their extent over the whole frame. Response burden has to be taken into account when deciding how to check the accuracy.
Quantitative information on overcoverage and multiple listings is normally easy to obtain in sample surveys and censuses. This information should be included in the quality report in sufficient detail with respect to important sub-domains. For other statistical outputs, frame and coverage errors should be included where relevant.
Undercoverage cannot be detected in the measurement process and is the most serious type of coverage error. The resulting bias depends on the units outside the frame population but in the target population and the differences between the characteristics of these units and those in the frame population. Thus, a qualitative description of these units is a first step in assessing the undercoverage bias. Methods to detect undercoverage and assess its effects include, for example (i) when there is a time lag in registering frame units, a later frame version can provide information, and (ii) comparisons with another frame or other external information. Where undercoverage is suspected to be significant, an assessment is always needed. As far as possible estimates of undercoverage (extent and effect) should be included in the quality report.
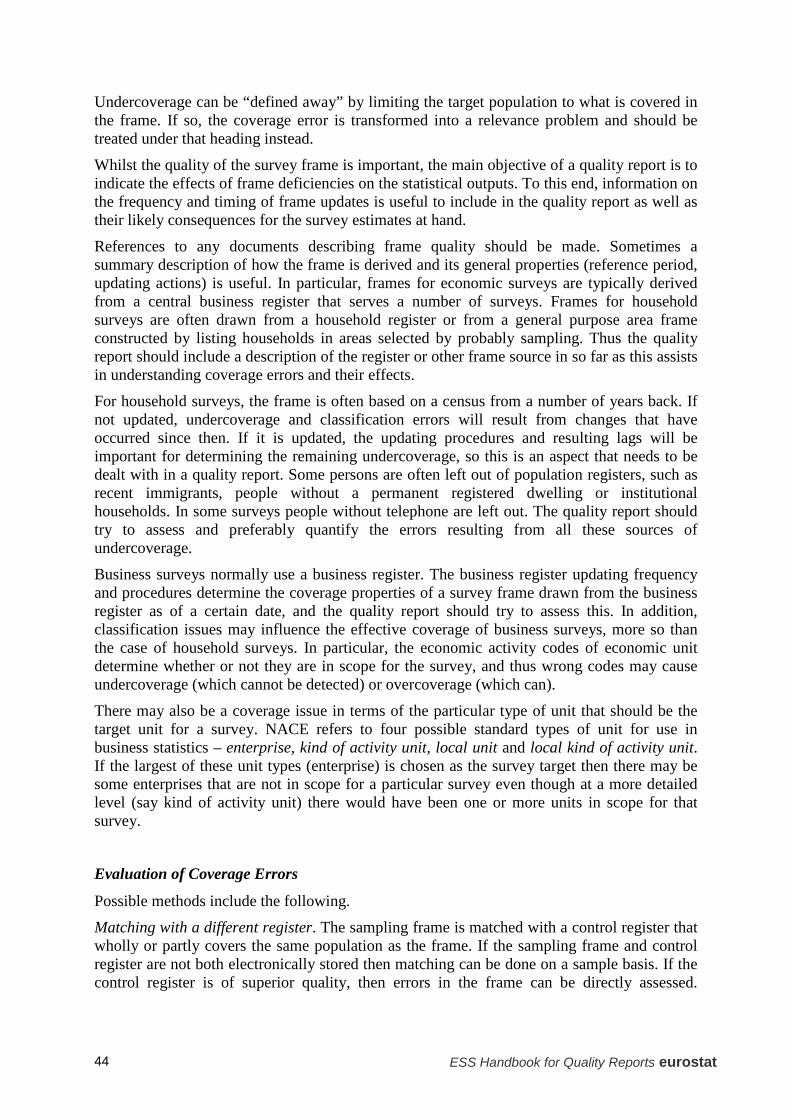
ESS Handbook for Quality Reports eurostat 44
Undercoverage can be “defined away” by limiting the target population to what is covered in the frame. If so, the coverage error is transformed into a relevance problem and should be treated under that heading instead.
Whilst the quality of the survey frame is important, the main objective of a quality report is to indicate the effects of frame deficiencies on the statistical outputs. To this end, information on the frequency and timing of frame updates is useful to include in the quality report as well as their likely consequences for the survey estimates at hand.
References to any documents describing frame quality should be made. Sometimes a summary description of how the frame is derived and its general properties (reference period, updating actions) is useful. In particular, frames for economic surveys are typically derived from a central business register that serves a number of surveys. Frames for household surveys are often drawn from a household register or from a general purpose area frame constructed by listing households in areas selected by probably sampling. Thus the quality report should include a description of the register or other frame source in so far as this assists in understanding coverage errors and their effects.
For household surveys, the frame is often based on a census from a number of years back. If not updated, undercoverage and classification errors will result from changes that have occurred since then. If it is updated, the updating procedures and resulting lags will be important for determining the remaining undercoverage, so this is an aspect that needs to be dealt with in a quality report. Some persons are often left out of population registers, such as recent immigrants, people without a permanent registered dwelling or institutional households. In some surveys people without telephone are left out. The quality report should try to assess and preferably quantify the errors resulting from all these sources of undercoverage.
Business surveys normally use a business register. The business register updating frequency and procedures determine the coverage properties of a survey frame drawn from the business register as of a certain date, and the quality report should try to assess this. In addition, classification issues may influence the effective coverage of business surveys, more so than the case of household surveys. In particular, the economic activity codes of economic unit determine whether or not they are in scope for the survey, and thus wrong codes may cause undercoverage (which cannot be detected) or overcoverage (which can).
There may also be a coverage issue in terms of the particular type of unit that should be the target unit for a survey. NACE refers to four possible standard types of unit for use in business statistics – enterprise, kind of activity unit, local unit and local kind of activity unit. If the largest of these unit types (enterprise) is chosen as the survey target then there may be some enterprises that are not in scope for a particular survey even though at a more detailed level (say kind of activity unit) there would have been one or more units in scope for that survey.
Evaluation of Coverage Errors
Possible methods include the following.
Matching with a different register. The sampling frame is matched with a control register that wholly or partly covers the same population as the frame. If the sampling frame and control register are not both electronically stored then matching can be done on a sample basis. If the control register is of superior quality, then errors in the frame can be directly assessed.
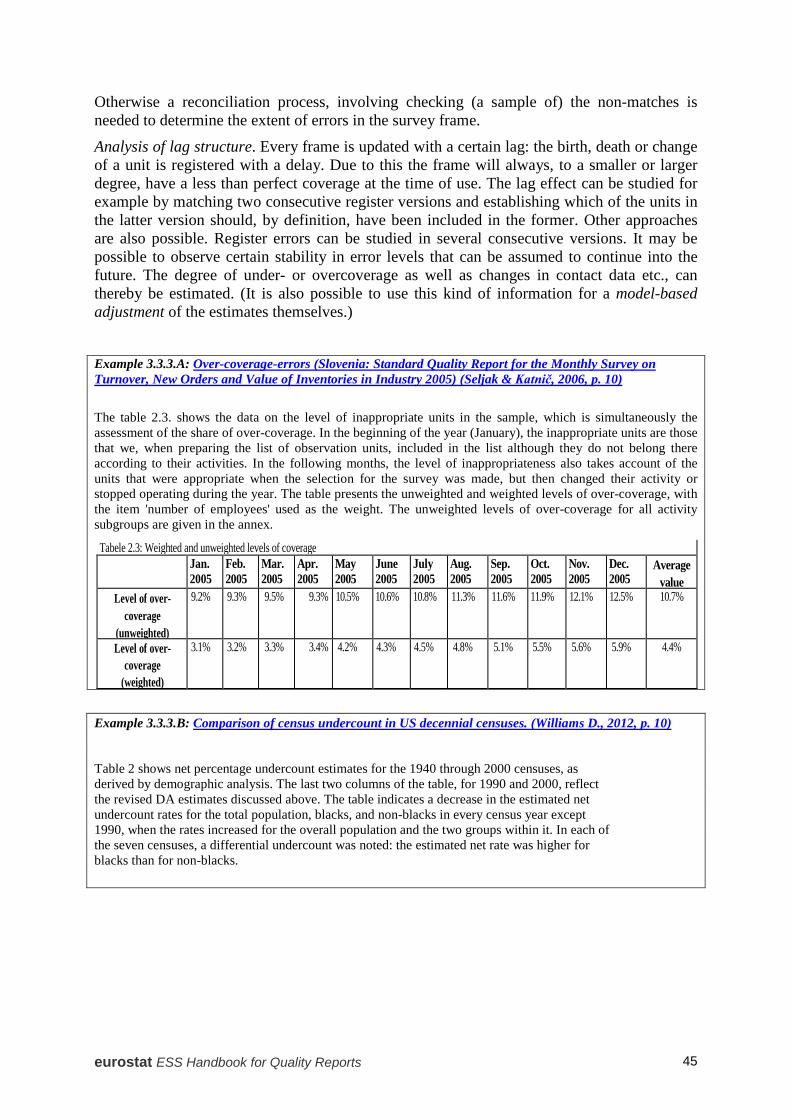
eurostat ESS Handbook for Quality Reports 45
Otherwise a reconciliation process, involving checking (a sample of) the non-matches is needed to determine the extent of errors in the survey frame.
Analysis of lag structure. Every frame is updated with a certain lag: the birth, death or change of a unit is registered with a delay. Due to this the frame will always, to a smaller or larger degree, have a less than perfect coverage at the time of use. The lag effect can be studied for example by matching two consecutive register versions and establishing which of the units in the latter version should, by definition, have been included in the former. Other approaches are also possible. Register errors can be studied in several consecutive versions. It may be possible to observe certain stability in error levels that can be assumed to continue into the future. The degree of under- or overcoverage as well as changes in contact data etc., can thereby be estimated. (It is also possible to use this kind of information for a model-based adjustment of the estimates themselves.)
Example 3.3.3.A: Over-coverage-errors (Slovenia: Standard Quality Report for the Monthly Survey on Turnover, New Orders and Value of Inventories in Industry 2005) (Seljak & Katnič, 2006, p. 10)
The table 2.3. shows the data on the level of inappropriate units in the sample, which is simultaneously the assessment of the share of over-coverage. In the beginning of the year (January), the inappropriate units are those that we, when preparing the list of observation units, included in the list although they do not belong there according to their activities. In the following months, the level of inappropriateness also takes account of the units that were appropriate when the selection for the survey was made, but then changed their activity or stopped operating during the year. The table presents the unweighted and weighted levels of over-coverage, with the item 'number of employees' used as the weight. The unweighted levels of over-coverage for all activity subgroups are given in the annex.
Tabele 2.3: Weighted and unweighted levels of coverage Jan.
2005 Feb. 2005
Mar. 2005
Apr. 2005
May 2005
June 2005
July 2005
Aug. 2005
Sep. 2005
Oct. 2005
Nov. 2005
Dec. 2005
Average value
Level of over-coverage
(unweighted)
9.2% 9.3% 9.5% 9.3% 10.5% 10.6% 10.8% 11.3% 11.6% 11.9% 12.1% 12.5% 10.7%
Level of over-coverage
(weighted)
3.1% 3.2% 3.3% 3.4% 4.2% 4.3% 4.5% 4.8% 5.1% 5.5% 5.6% 5.9% 4.4%
Example 3.3.3.B: Comparison of census undercount in US decennial censuses. (Williams D., 2012, p. 10) Table 2 shows net percentage undercount estimates for the 1940 through 2000 censuses, as derived by demographic analysis. The last two columns of the table, for 1990 and 2000, reflect the revised DA estimates discussed above. The table indicates a decrease in the estimated net undercount rates for the total population, blacks, and non-blacks in every census year except 1990, when the rates increased for the overall population and the two groups within it. In each of the seven censuses, a differential undercount was noted: the estimated net rate was higher for blacks than for non-blacks.

ESS Handbook for Quality Reports eurostat 46
Quality and Performance Indicators
A2. Over-coverage – rate. General definition: proportion of units accessible via the frame that do not belong to the target population.
It should be noted that:
1. Overcoverage is best reported together with non-response in a coherent manner so that, for example, the treatment of units with unknown status is made clear.
2. It is also possible to define rates of misclassification, incorrect contact details and multiple listings in straight-forward ways. However, in most cases these indicators are not as important as A2.
3. Although the rate of undercoverage is the most important indicator it is not usually directly observable and thus not included in the list.
A3 - Common units proportion, for the case of using both survey and administrative sources
General definition: The proportion of units covered by both the survey and the administrative sources in relation to the total number of units in the survey.
It should be noted that it is often possible to define quality indicators that are specific to the particular administrative sources used.
ESS level
Individual values and aggregates of A2 and A3 over Member States.
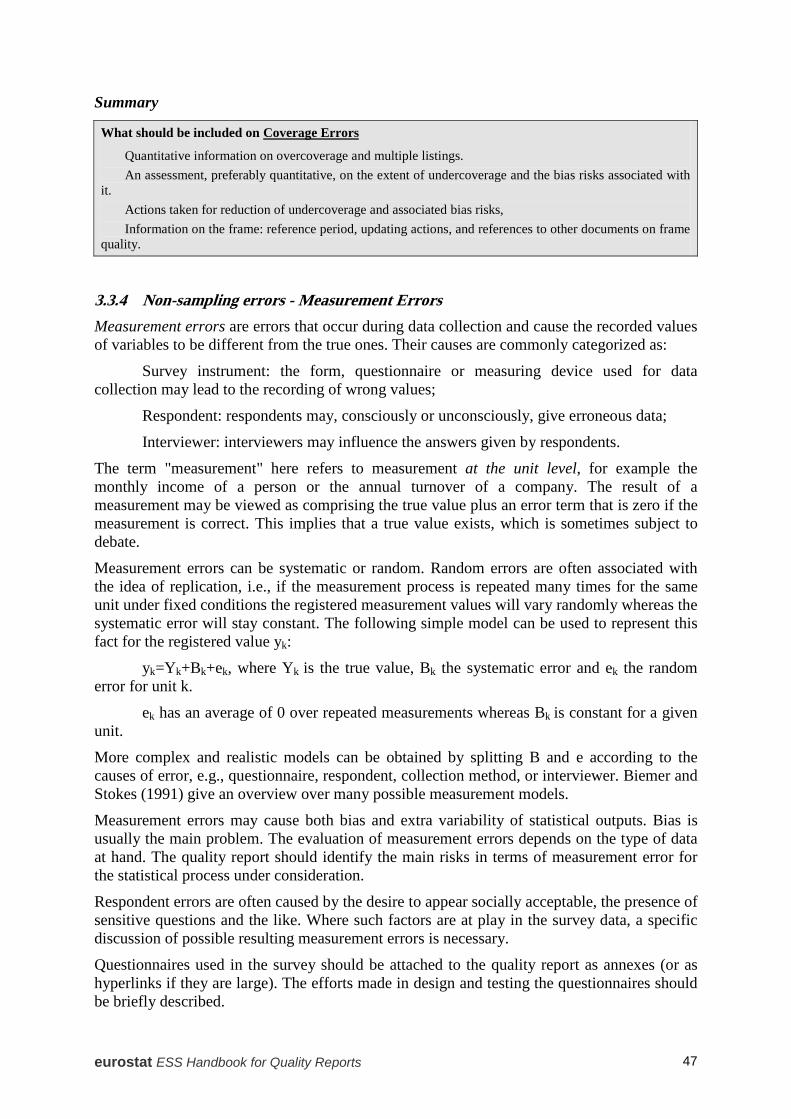
eurostat ESS Handbook for Quality Reports 47
Summary
What should be included on Coverage Errors
Quantitative information on overcoverage and multiple listings. An assessment, preferably quantitative, on the extent of undercoverage and the bias risks associated with it. Actions taken for reduction of undercoverage and associated bias risks, Information on the frame: reference period, updating actions, and references to other documents on frame quality.
3.3.4 Non-sampling errors - Measurement Errors Measurement errors are errors that occur during data collection and cause the recorded values of variables to be different from the true ones. Their causes are commonly categorized as:
Survey instrument: the form, questionnaire or measuring device used for data collection may lead to the recording of wrong values;
Respondent: respondents may, consciously or unconsciously, give erroneous data;
Interviewer: interviewers may influence the answers given by respondents.
The term "measurement" here refers to measurement at the unit level, for example the monthly income of a person or the annual turnover of a company. The result of a measurement may be viewed as comprising the true value plus an error term that is zero if the measurement is correct. This implies that a true value exists, which is sometimes subject to debate.
Measurement errors can be systematic or random. Random errors are often associated with the idea of replication, i.e., if the measurement process is repeated many times for the same unit under fixed conditions the registered measurement values will vary randomly whereas the systematic error will stay constant. The following simple model can be used to represent this fact for the registered value yk:
yk=Yk+Bk+ek, where Yk is the true value, Bk the systematic error and ek the random error for unit k.
ek has an average of 0 over repeated measurements whereas Bk is constant for a given unit.
More complex and realistic models can be obtained by splitting B and e according to the causes of error, e.g., questionnaire, respondent, collection method, or interviewer. Biemer and Stokes (1991) give an overview over many possible measurement models.
Measurement errors may cause both bias and extra variability of statistical outputs. Bias is usually the main problem. The evaluation of measurement errors depends on the type of data at hand. The quality report should identify the main risks in terms of measurement error for the statistical process under consideration.
Respondent errors are often caused by the desire to appear socially acceptable, the presence of sensitive questions and the like. Where such factors are at play in the survey data, a specific discussion of possible resulting measurement errors is necessary.
Questionnaires used in the survey should be attached to the quality report as annexes (or as hyperlinks if they are large). The efforts made in design and testing the questionnaires should be briefly described.

ESS Handbook for Quality Reports eurostat 48
Data editing identifies inconsistencies. They can be the result of processing errors due to coding or data entry but may also be the consequence of errors in the collected data. Information from the data editing process should be included in the quality report, since it is indicative of the risk of measurement error. The failure rate of each edit rule can be calculated over the records to which the edit is applied. Clerical correction and/or automatic imputation are usually applied in order to remove inconsistencies in the data. The failure rates, therefore, are an indication of the quality of data collection and processing and not of the quality of the final data. The amount of detail on data editing in a quality report should be related to the importance of measurement errors in the survey in general and for the key indicators.
Important measurement errors are unique for each survey and thus need to be accompanied by any available analyses, or, in the absence of such analyses, the producer’s best knowledge.
Evaluation
When the risk of substantial bias is considered high, evaluation studies are needed. Respondent error can be assessed by a re-interview study in which the respondent is asked to provide the same data on a second occasion. If there is no memory effect, the two interviews may be considered independent and the difference between the responses is an indication of the size of the measurement error.
In order to assess instrument or interviewer effects, repeated measurements can be made with different instruments (e.g., alternative phrasing of questions) or different interviewers. Alternatively an experiment can be carried out with subsamples being randomly allocated to different instruments and /or interviewers. This approach is mostly appropriate for surveys on attitudes/opinions or where memory effects are involved. Information on relevant aspects of interviewer training could also be included. The interviewer effect can also be estimated with the data from the survey (without a further reinterview on a subsample), if the allocation of units to interviewers was random (this is quite simple in CATI surveys) or carried out with the interpenetrating sampling technique.
For data of a factual nature, especially economic data, the potential for finding other databases with similar data is often good. Such databases may contain similar data with a time lag and can be used for evaluating earlier versions of the present statistical output. However, when comparing two sets of data, it is necessary to distinguish measurement errors from comparability issues, such as differences in definitions, with which they may be confounded.
Another method for finding errors is to subject economic data to accounting rules and reasonableness checks. These approaches are usually used in the editing stage in order to correct the data before final estimation.
Four groups of methods are applicable for evaluating errors at unit level. Such errors could have been generated in the measurement phase, the processing phase or they could have existed already in the sampling frame.
Comparisons with other information at the unit level. This is of course the best way to obtain a quality check provided there is a common unit identification scheme for both sources. Matching of registers, as mentioned under coverage errors above, can be used also for this purpose, provided the control register can be assumed to have good information about the units for certain variables. Care must be taken to distinguish actual errors from differences in definition or measurement points in time.
Control at source /re-interview with superior method. Control at source means that the evaluator gets access to source data (company accounts or records kept at an agency etc.) A
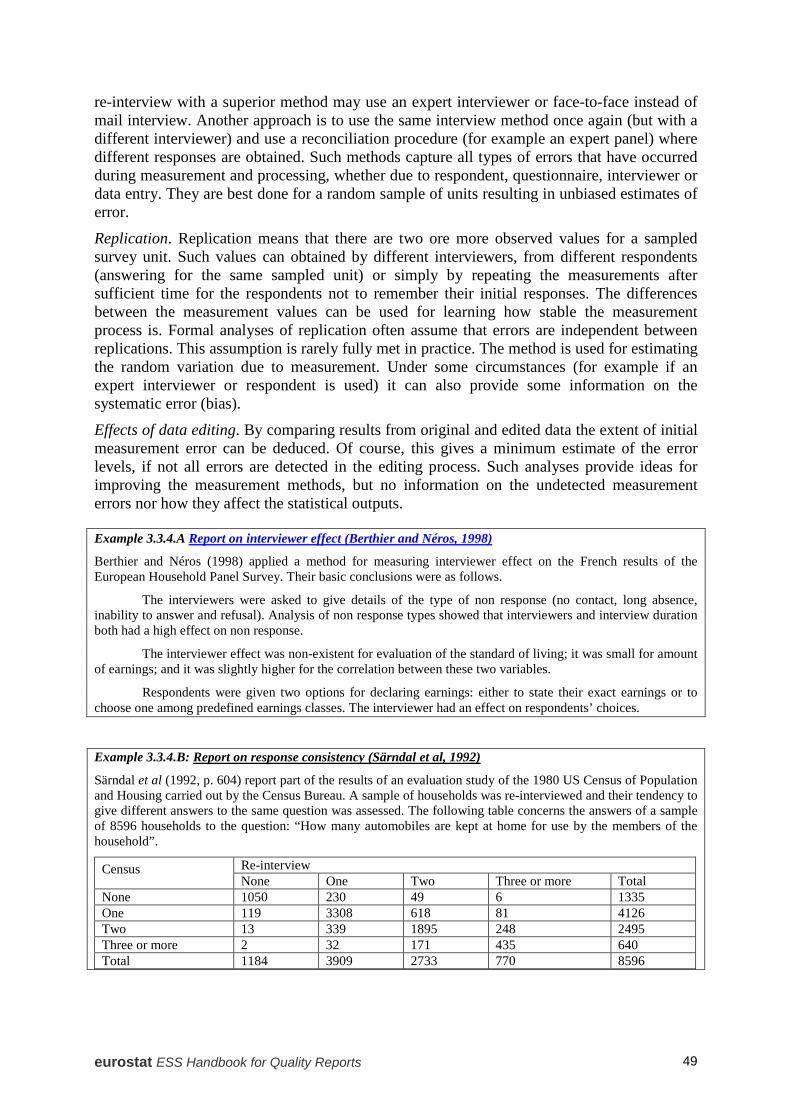
eurostat ESS Handbook for Quality Reports 49
re-interview with a superior method may use an expert interviewer or face-to-face instead of mail interview. Another approach is to use the same interview method once again (but with a different interviewer) and use a reconciliation procedure (for example an expert panel) where different responses are obtained. Such methods capture all types of errors that have occurred during measurement and processing, whether due to respondent, questionnaire, interviewer or data entry. They are best done for a random sample of units resulting in unbiased estimates of error.
Replication. Replication means that there are two ore more observed values for a sampled survey unit. Such values can obtained by different interviewers, from different respondents (answering for the same sampled unit) or simply by repeating the measurements after sufficient time for the respondents not to remember their initial responses. The differences between the measurement values can be used for learning how stable the measurement process is. Formal analyses of replication often assume that errors are independent between replications. This assumption is rarely fully met in practice. The method is used for estimating the random variation due to measurement. Under some circumstances (for example if an expert interviewer or respondent is used) it can also provide some information on the systematic error (bias).
Effects of data editing. By comparing results from original and edited data the extent of initial measurement error can be deduced. Of course, this gives a minimum estimate of the error levels, if not all errors are detected in the editing process. Such analyses provide ideas for improving the measurement methods, but no information on the undetected measurement errors nor how they affect the statistical outputs.
Example 3.3.4.A Report on interviewer effect (Berthier and Néros, 1998)
Berthier and Néros (1998) applied a method for measuring interviewer effect on the French results of the European Household Panel Survey. Their basic conclusions were as follows.
The interviewers were asked to give details of the type of non response (no contact, long absence, inability to answer and refusal). Analysis of non response types showed that interviewers and interview duration both had a high effect on non response.
The interviewer effect was non-existent for evaluation of the standard of living; it was small for amount of earnings; and it was slightly higher for the correlation between these two variables.
Respondents were given two options for declaring earnings: either to state their exact earnings or to choose one among predefined earnings classes. The interviewer had an effect on respondents’ choices.
Example 3.3.4.B: Report on response consistency (Särndal et al, 1992)
Särndal et al (1992, p. 604) report part of the results of an evaluation study of the 1980 US Census of Population and Housing carried out by the Census Bureau. A sample of households was re-interviewed and their tendency to give different answers to the same question was assessed. The following table concerns the answers of a sample of 8596 households to the question: “How many automobiles are kept at home for use by the members of the household”.
Census Re-interview None One Two Three or more Total
None 1050 230 49 6 1335 One 119 3308 618 81 4126 Two 13 339 1895 248 2495 Three or more 2 32 171 435 640 Total 1184 3909 2733 770 8596
ESS Handbook for Quality Reports eurostat 50
Summary What should be included on Measurement Errors
• Identification and general assessment of the main risks in terms of measurement error. • If available, assessments based on comparisons with external data, re-interviews, experiments or data editing. • The efforts made in questionnaire design and testing, information on interviewer training and other work on error reduction.
• Questionnaires used should be annexed (if very long by hyperlink)
3.3.5 Non-sampling errors - Non-response errors Non-response is the failure of a sample survey (or a census) to collect data for all data items in the survey questionnaire from all the population units designated for data collection. The difference between the statistics computed from the collected data and those that would be computed if there were no missing values is the non-response error. There are two types of non-response:
unit non-response which occurs when no data are collected about a population unit designated for data collection, and
item non-response which occurs when data only on some but not all the survey variables are collected about a designated population unit.
The extent of response (and accordingly of non-response) is measured in terms of response rates of two kinds:
unit response rate: the ratio of the number of units for which data for at least some variables have been collected to the total number of units designated for data collection;
item response rate: the ratio of the number of units which have provided data for a given variable to the total number of designated units or to the number of units that have provided data at least for some data items.
Other ratios are sometimes used instead of, or as well as, these ratios of counts. They are:
design-weighted response rates, which sum the weights of the responding units according to the sample design;
size-weighted response rates, which sum the values of auxiliary variables multiplied with the design weights, instead of the design weights alone.
Mathematical definitions of non-response rates
The American Association for Public Opinion Research (AAPOR 2011) provides exact definitions of unit and item response rates for different types of surveys. Here slightly more simplified definitions are provided, which also cover the weighted cases.
The sample can be divided into the following categories:
R: Responding units belonging to the target population; of which
F: Responding units (in R) for which full responses were obtained;
P: Responding units (in R) for which only partial responses were obtained;
N: Non-responding units which belong to the target population;
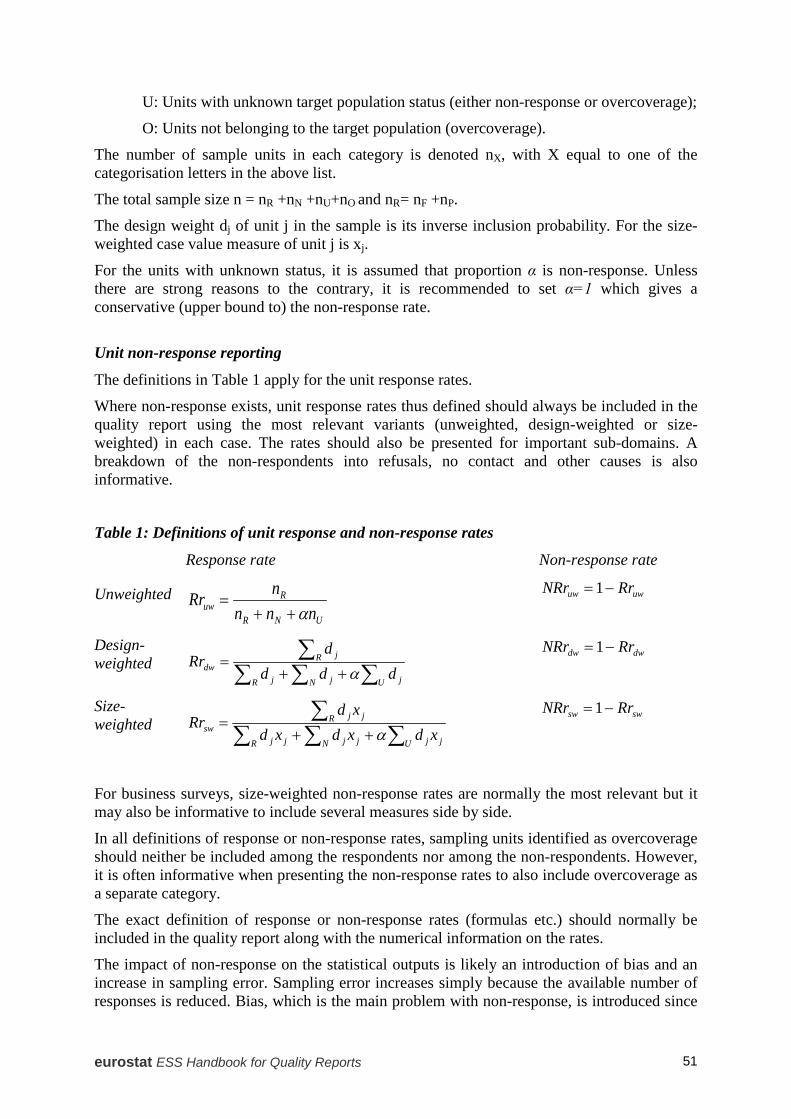
eurostat ESS Handbook for Quality Reports 51
U: Units with unknown target population status (either non-response or overcoverage);
O: Units not belonging to the target population (overcoverage).
The number of sample units in each category is denoted nX, with X equal to one of the categorisation letters in the above list.
The total sample size n = nR +nN +nU+nO and nR= nF +nP.
The design weight dj of unit j in the sample is its inverse inclusion probability. For the size-weighted case value measure of unit j is xj.
For the units with unknown status, it is assumed that proportion α is non-response. Unless there are strong reasons to the contrary, it is recommended to set α=1 which gives a conservative (upper bound to) the non-response rate.
Unit non-response reporting
The definitions in Table 1 apply for the unit response rates.
Where non-response exists, unit response rates thus defined should always be included in the quality report using the most relevant variants (unweighted, design-weighted or size-weighted) in each case. The rates should also be presented for important sub-domains. A breakdown of the non-respondents into refusals, no contact and other causes is also informative.
Table 1: Definitions of unit response and non-response rates
Response rate Non-response rate
Unweighted UNR
Ruw nnn
nRrα++
= uwuw RrNRr −= 1
Design-weighted ∑∑∑
∑++
=U jN jR j
R jdw ddd
dRr
α dwdw RrNRr −= 1
Size-weighted ∑∑∑
∑++
=U jjN jjR jj
R jjsw xdxdxd
xdRr
α swsw RrNRr −= 1
For business surveys, size-weighted non-response rates are normally the most relevant but it may also be informative to include several measures side by side.
In all definitions of response or non-response rates, sampling units identified as overcoverage should neither be included among the respondents nor among the non-respondents. However, it is often informative when presenting the non-response rates to also include overcoverage as a separate category.
The exact definition of response or non-response rates (formulas etc.) should normally be included in the quality report along with the numerical information on the rates.
The impact of non-response on the statistical outputs is likely an introduction of bias and an increase in sampling error. Sampling error increases simply because the available number of responses is reduced. Bias, which is the main problem with non-response, is introduced since

ESS Handbook for Quality Reports eurostat 52
non-respondents are not similar to respondents for all variables in all strata whilst standard methods for handling non-response assume they are.
Item non-response reporting
For item non-response rates there is basically a choice between two reporting approaches, which can also be used in parallel. If the focus is on a particular variable Y, response rates with regard to that variable can be defined as in Table 1 above but with R defined as “responding to variable Y”. These rates are the most relevant ones for judging the accuracy of an estimate for variable Y and should be used for all key variables in a survey. They are referred to as item Y response rates. These rates are included in the list of ESS Quality and Performance indicators. In addition overall rates of full response with regard to all variables can also be of interest. The indicator for full response is normally of less interest, however. In cases of item non-response, there is a choice of explicitly imputing, or not, the values of missing data. Practices regarding imputation should be included in the quality report together with an assessment of their impact on estimates and sampling errors for all data items. (Imputation is further discussed in Section 3.9.3.)
Effects of Non-response
Response rates provide an indication of the risk of bias but the actual bias depends also (and mainly) on the average differences between the respondents and non-respondents with respect to survey variables. Normally there is some evidence, although rarely firm, on this matter, which should be included in the quality report in the form of a qualitative assessment.
As previously noted in Section 3.3.1, the increased sampling errors due to non-response can and should be taken into account when computing CVs or confidence intervals.
Efforts and measures, including response modelling, to reduce non-response in the primary data collection and follow-ups should be described. The technical treatment of non-response at the estimation stage (by imputation, re-weighting, or by exclusion) should also be clearly stated. Efficient use of auxiliary information can sometimes improve precision considerably in the presence of non-response.
Evaluation
The increase in sampling error due to non-response is monitored through the sampling error, as described in Section 3.3.1. The remaining and more difficult issue is how to obtain information on non-response bias. The basic approach is to compare the response and non-response strata with respect to any variables that are available for both these strata.
Complementing with register data. The method assumes that there is a strong enough correlation between a survey variable for which there is non-response and another variable in the sampling frame or another register. This information can be utilised in various ways. For evaluation, one way is to compare the “estimate” of this other variable derived from the whole sample with that derived from the sample excluding non respondents. A small difference provides some indication of a small non-response bias for the survey variable as well. The better the correlation is between the two variables, the better, of course, is the judgement that can be made in this way.
Special data collections. These methods aim to show how the non-response error would change if it were possible to increase the response rate. The studies are done so that a higher
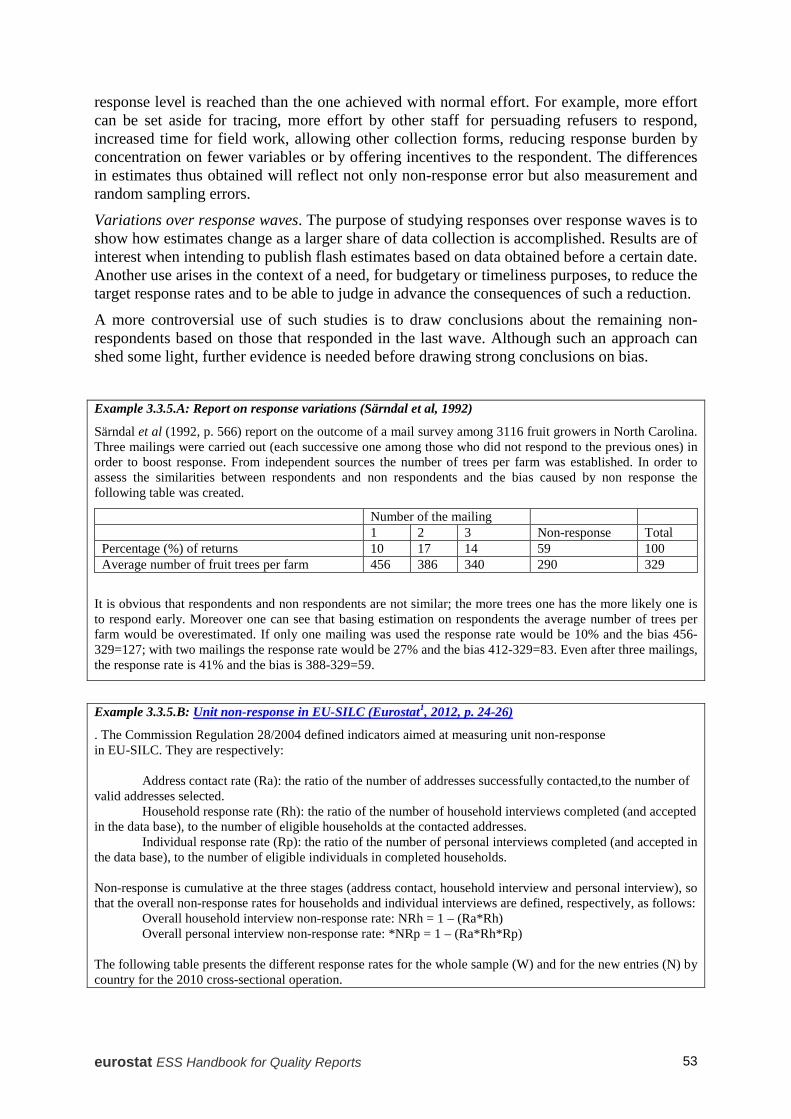
eurostat ESS Handbook for Quality Reports 53
response level is reached than the one achieved with normal effort. For example, more effort can be set aside for tracing, more effort by other staff for persuading refusers to respond, increased time for field work, allowing other collection forms, reducing response burden by concentration on fewer variables or by offering incentives to the respondent. The differences in estimates thus obtained will reflect not only non-response error but also measurement and random sampling errors.
Variations over response waves. The purpose of studying responses over response waves is to show how estimates change as a larger share of data collection is accomplished. Results are of interest when intending to publish flash estimates based on data obtained before a certain date. Another use arises in the context of a need, for budgetary or timeliness purposes, to reduce the target response rates and to be able to judge in advance the consequences of such a reduction.
A more controversial use of such studies is to draw conclusions about the remaining non-respondents based on those that responded in the last wave. Although such an approach can shed some light, further evidence is needed before drawing strong conclusions on bias.
Example 3.3.5.A: Report on response variations (Särndal et al, 1992)
Särndal et al (1992, p. 566) report on the outcome of a mail survey among 3116 fruit growers in North Carolina. Three mailings were carried out (each successive one among those who did not respond to the previous ones) in order to boost response. From independent sources the number of trees per farm was established. In order to assess the similarities between respondents and non respondents and the bias caused by non response the following table was created.
Number of the mailing 1 2 3 Non-response Total Percentage (%) of returns 10 17 14 59 100 Average number of fruit trees per farm 456 386 340 290 329
It is obvious that respondents and non respondents are not similar; the more trees one has the more likely one is to respond early. Moreover one can see that basing estimation on respondents the average number of trees per farm would be overestimated. If only one mailing was used the response rate would be 10% and the bias 456-329=127; with two mailings the response rate would be 27% and the bias 412-329=83. Even after three mailings, the response rate is 41% and the bias is 388-329=59.
Example 3.3.5.B: Unit non-response in EU-SILC (Eurostat1, 2012, p. 24-26)
. The Commission Regulation 28/2004 defined indicators aimed at measuring unit non-response in EU-SILC. They are respectively: Address contact rate (Ra): the ratio of the number of addresses successfully contacted,to the number of valid addresses selected. Household response rate (Rh): the ratio of the number of household interviews completed (and accepted in the data base), to the number of eligible households at the contacted addresses. Individual response rate (Rp): the ratio of the number of personal interviews completed (and accepted in the data base), to the number of eligible individuals in completed households. Non-response is cumulative at the three stages (address contact, household interview and personal interview), so that the overall non-response rates for households and individual interviews are defined, respectively, as follows: Overall household interview non-response rate: NRh = 1 – (Ra*Rh) Overall personal interview non-response rate: *NRp = 1 – (Ra*Rh*Rp) The following table presents the different response rates for the whole sample (W) and for the new entries (N) by country for the 2010 cross-sectional operation.
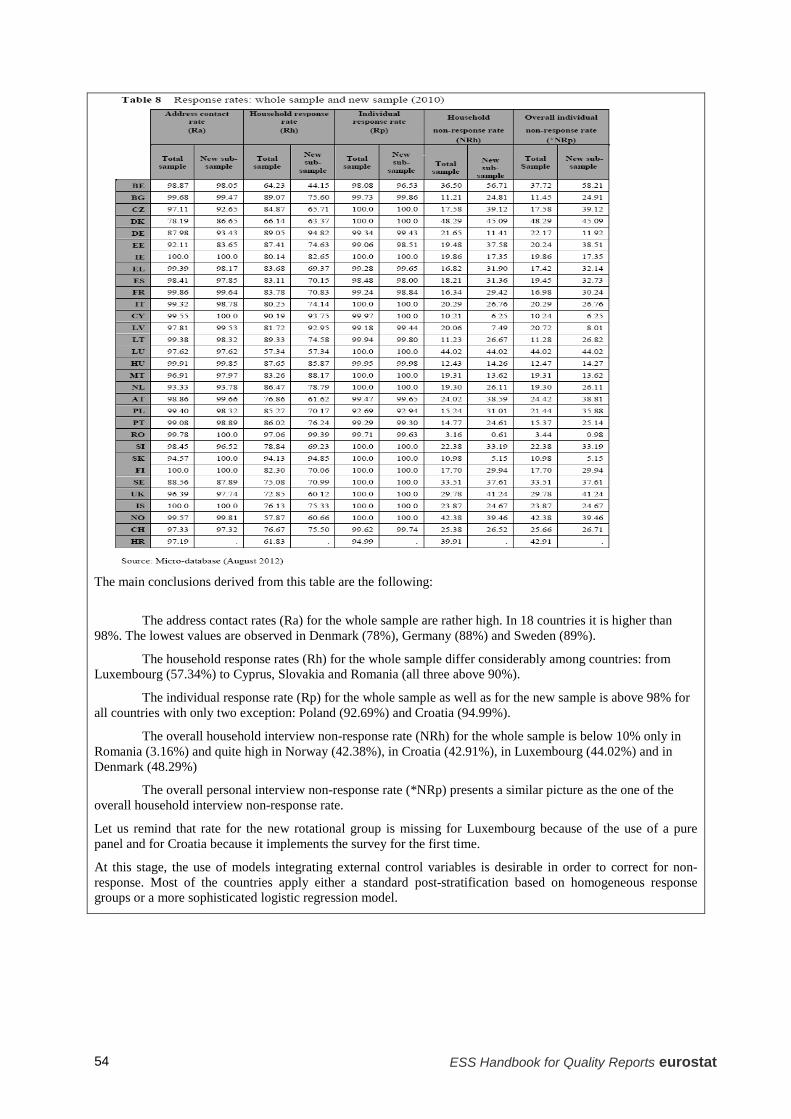
ESS Handbook for Quality Reports eurostat 54
The main conclusions derived from this table are the following:
The address contact rates (Ra) for the whole sample are rather high. In 18 countries it is higher than 98%. The lowest values are observed in Denmark (78%), Germany (88%) and Sweden (89%).
The household response rates (Rh) for the whole sample differ considerably among countries: from Luxembourg (57.34%) to Cyprus, Slovakia and Romania (all three above 90%).
The individual response rate (Rp) for the whole sample as well as for the new sample is above 98% for all countries with only two exception: Poland (92.69%) and Croatia (94.99%).
The overall household interview non-response rate (NRh) for the whole sample is below 10% only in Romania (3.16%) and quite high in Norway (42.38%), in Croatia (42.91%), in Luxembourg (44.02%) and in Denmark (48.29%)
The overall personal interview non-response rate (*NRp) presents a similar picture as the one of the overall household interview non-response rate.
Let us remind that rate for the new rotational group is missing for Luxembourg because of the use of a pure panel and for Croatia because it implements the survey for the first time.
At this stage, the use of models integrating external control variables is desirable in order to correct for non-response. Most of the countries apply either a standard post-stratification based on homogeneous response groups or a more sophisticated logistic regression model.
eurostat ESS Handbook for Quality Reports 55
Quality and Performance Indicators
A4. Unit non-response – rate. General definition: The ratio of the number of units with no information or no usable information to the number of in-scope (eligible) units.
A5. Item non-response rate. General definition: The ratio of the in-scope (eligible) units which have not responded to a particular item and the in-scope units that are required to respond to that particular item.
ESS level
Individual values and aggregates of A4 and A5 over Member States.
Summary
What should be included on Non-response errors
• Non-response rates according to the most relevant definitions for the whole survey and for important sub-domains. • Item non-response rates for key variables. • A breakdown of non-respondents according to cause for non-response. • A qualitative statement on the bias risks associated with non-response. • Measures to reduce non-response.
• Technical treatment of non-response at the estimation stage.
3.3.6 Non-sampling errors - Processing errors Between data collection and the beginning of statistical analysis, data must undergo processing comprising data entry, data editing (checks and corrections), sometimes coding and imputation. Errors introduced in these stages are called processing errors. Like measurement errors they affect micro-data and evaluations of either type of error tend to involve the other type. Another type of processing error concerns macro-data, as described in Section 3.9.4.
A case where processing error is especially important to evaluate and report is where there is coding of response data provided in free text format. This typically occurs when information on occupation or education are requested, for example in a population census. The coding of business activity for inclusion in a business register is another example. The quality of a coding operation depends in a complex way on the coding rules, how they are interpreted in practice and on the downright mistakes committed by the coders.
Processing errors affecting individual observations cause bias and variation in the resulting statistics, just as measurement errors do. The importance of micro-data processing errors varies greatly between different statistical processes and their treatment in a quality report needs to be proportional to their importance. When they are significant, their extent and impact on the results should be evaluated. If such an evaluation has been made it should be included in the quality report.

ESS Handbook for Quality Reports eurostat 56
Evaluation
Studies of effects of editing. The effects of editing are obtained by comparing edited and unedited data. By calculating the final estimates based on both data sets, the total net effect of editing can be measured. These effects can be broken down by unit in a so called top-down list, where the effects by unit are sorted in descending sequence and the most influential units can be seen. Such a list can serve several purposes. One is to check once more that the influential units have their correct values; another is to generate ideas for optimising the editing procedures. For more information on editing procedures including quality aspects the reader is referred to the UN handbook in three volumes: Statistical Data Editing (UN), Vol 1, Statistical Data Editing (UN), Vol 2 and Statistical Data Editing (UN), Vol 3 Studies of coding variation. In an independent coding control study the coding is done twice without the coders being allowed to see each other’s results. In dependent coding the second coder has access to the first coder’s proposals. Dependent coding gives, as expected, smaller variation between the coders. Lyberg (1981) gives an extensive treatment of the topic of coding. High coding variation is of course an indicator of a large potential processing error. Similar control studies can be conducted to evaluate processing errors deriving from other forms of treatment, for example data entry.
Example 3.3.6.A: SBS 2010 Quality Declaration: Processing Error (Statistics Sweden, pg 18-19)
Processing errors are errors that may occur when processing the collected materials, manually or automatically.
Data from the Swedish Tax Agency are given a brief check
The administrative material from the Swedish Tax Agency is examined primarily to check those values that have the greatest impact on their study domain. In reviewing this material, Statistics Sweden relies on comparisons with previous years, other sources or annual reports because there is no possibility of directly verifying the data of the respondents.
The risk of error is small because electronic collection dominates
The vast majority of enterprises provide electronic data and the proportion has increased year after year. This reduces manual data registration and thus the risk of error from this. In 2010, 95 percent of the enterprises included in the three specification tests submitted their data electronically, compared with 48 percent in 2005.
Automated checking and manual measures to minimise errors
Material that has been collected directly from the larger, major enterprises is examined automatically and very carefully by Statistics Sweden's department of data collection using logical controls (summaries), reasonability checks and relation checks. If these checks show that the data may be divergent or inaccurate, measures are taken to insure their accuracy or to correct them. Examples of measures taken are contacting the respondent for verification or verifying the data with the help of other sources, such as annual reports.
Other sample surveyed enterprises are also examined automatically, if not quite as thoroughly as with the major enterprises. All enterprises are examined at an overall level. Those enterprises that contribute the largest values are also examined in detail. If deviations are detected, manual verification is done in a similar way as for the larger major enterprises.
All data are reviewed at industry and national levels.
As a final step, the material is examined at industry and national levels. To ensure the quality of the time series, comparative analyses are made with the results from previous years. Reconciliation is carried out as far as possible with other surveys to detect any possible deviations prior to publication.
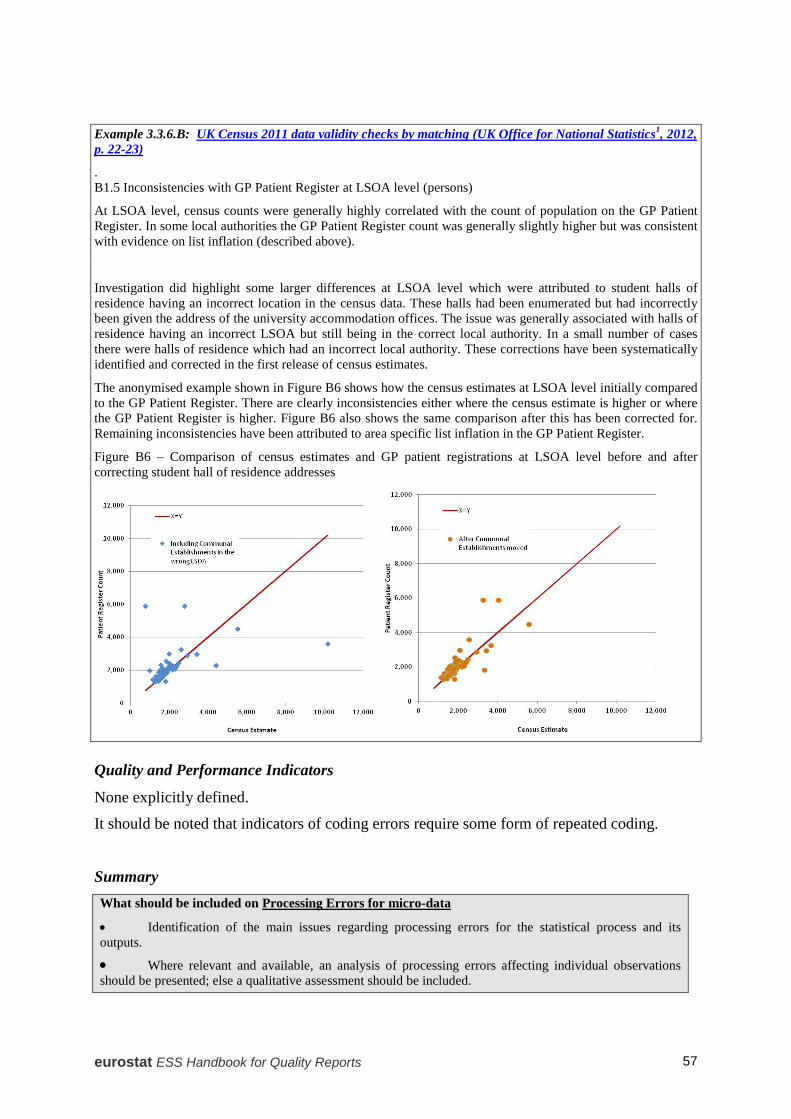
eurostat ESS Handbook for Quality Reports 57
Example 3.3.6.B: UK Census 2011 data validity checks by matching (UK Office for National Statistics1, 2012, p. 22-23)
. B1.5 Inconsistencies with GP Patient Register at LSOA level (persons)
At LSOA level, census counts were generally highly correlated with the count of population on the GP Patient Register. In some local authorities the GP Patient Register count was generally slightly higher but was consistent with evidence on list inflation (described above).
Investigation did highlight some larger differences at LSOA level which were attributed to student halls of residence having an incorrect location in the census data. These halls had been enumerated but had incorrectly been given the address of the university accommodation offices. The issue was generally associated with halls of residence having an incorrect LSOA but still being in the correct local authority. In a small number of cases there were halls of residence which had an incorrect local authority. These corrections have been systematically identified and corrected in the first release of census estimates.
The anonymised example shown in Figure B6 shows how the census estimates at LSOA level initially compared to the GP Patient Register. There are clearly inconsistencies either where the census estimate is higher or where the GP Patient Register is higher. Figure B6 also shows the same comparison after this has been corrected for. Remaining inconsistencies have been attributed to area specific list inflation in the GP Patient Register.
Figure B6 – Comparison of census estimates and GP patient registrations at LSOA level before and after correcting student hall of residence addresses
Quality and Performance Indicators
None explicitly defined.
It should be noted that indicators of coding errors require some form of repeated coding.
Summary What should be included on Processing Errors for micro-data
• Identification of the main issues regarding processing errors for the statistical process and its outputs.
• Where relevant and available, an analysis of processing errors affecting individual observations should be presented; else a qualitative assessment should be included.

ESS Handbook for Quality Reports eurostat 58
3.4 For Censuses
The objective of a census is to collect data from all units according to an agreed definition. Three important categories of census are:
population census - the units are households and individuals;
economic census - the units are enterprises and local units (a producing unit of an enterprise with a physical address) or other intermediate units (kind-of-activity units, local kind of activity units.)
agricultural census - the units can be of two kinds – agricultural businesses (farms) and/or land based units.
By definition there is no sampling error in a census but what is said on non-sampling errors in Section 3.2 is relevant also for a census. The error profile of a census may be very different from a sample survey, however, and may also vary greatly depending on type of census and type of approach used. This affects the relative emphasis that should be put in the quality report.
In general the following aspects are known to be of special importance for censuses based on extensive field work.
Undercoverage and overcoverage (also referred to as undercount and over- or double count in the census context). The quality report should assess this potential source of error, i.e., that field procedures do not reach all target units or that they reach them twice. A special, deliberate, case of not covering all units arises in the context of a cut-off threshold as previously described in Section 3.3.2 and below in Section 3.9.1.
Measurement and non-response errors may well be important. The same assessment and reporting principles apply to censuses as to sample surveys - see Sections 3.3.4 and 3.3.5.
Processing errors in the form of data entry or coding errors can be of great importance in a census. Data entry errors may occur when the information is provided by respondents on paper and is data captured either manually or through an optical reading device. Coding is a further source of error, occurring when variables like occupation, education, or economic activity are provided by a respondent in free text format and have to be interpreted by a coder in terms of a pre-determined code structure, as described in Section 3.3.6.
Example 3.4.A: Census Program for Evaluation and Experiments (US Census Bureau, 2010)
For US censuses there is a huge literature on the associated errors. Bureau of the Census, describes the testing and evaluation program for the 2010 Population Census in an ad hoc web page.

eurostat ESS Handbook for Quality Reports 59
Example 3.4.B: Coverage assessment in the 2001 Census in England and Wales (UK Office for National Statistics, 2005, p. 36-37)
Coverage error
3.2.2.2 Coverage is the extent to which the people receiving a census form account for the whole population. Undercoverage may bias or diminish the reliability of census results. Coverage error was a potential source of error in the 2001 Census, hence the ONC process adjusted for undercoverage.
Maximising coverage
3.2.2.3 Methods aimed to maximise the coverage of the 2001 Census included
• The use of a Geography Area Planning System (GAPS), an electronic mapping system. The system provided maps and lists of addresses to assist the enumerators in locating all households in an area.
• Extensive training of field staff, so that enumerators were aware that they needed to identify all properties within their enumeration districts.
• Quality checks by field staff prior to enumeration to become familiar with area boundaries.
• Special arrangements for groups of the population where it was difficult to follow the normal enumeration procedures.
• Special procedures to react to the outbreak of Foot and Mouth disease in rural communities.
• A public enquiry unit, so that people who had not received a form could request one.
Coverage
3.2.2.4 For the first time in an England and Wales Census, results were adjusted for estimated underenumeration. The Census Coverage Survey was carried out a few weeks after Census fieldwork. By using statistical methods to combine the results of the two operations, ONS was able to derive census estimates representing 100 per cent of the population.
3.2.2.5 In 1991, it was estimated that 98 per cent of the population were accounted for in the Census results, including some 2 per cent estimated by enumerators to be resident in identified households but from whom no completed Census form was collected.
3.2.2.6 In 2001, coverage was close to 100 per cent due to the One Number Census process. Total overall response was 98 per cent, including some 4 per cent of the population estimated to be resident in households identified by enumerators but from whom no completed census form was returned.
3.2.2.7 Table 3.1 contains the overall components of the Census response and coverage rates for 1991 and 2001 for England and Wales. Further information on response rates is given below.
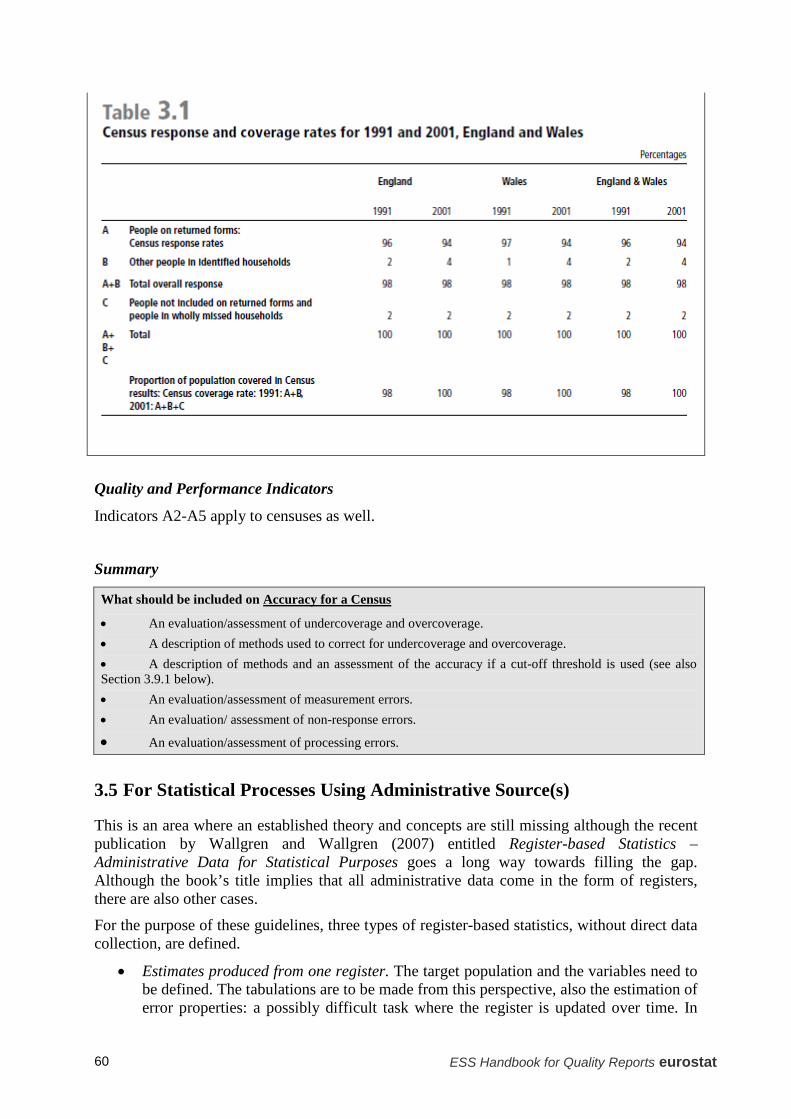
ESS Handbook for Quality Reports eurostat 60
Quality and Performance Indicators
Indicators A2-A5 apply to censuses as well.
Summary
What should be included on Accuracy for a Census
• An evaluation/assessment of undercoverage and overcoverage. • A description of methods used to correct for undercoverage and overcoverage. • A description of methods and an assessment of the accuracy if a cut-off threshold is used (see also Section 3.9.1 below). • An evaluation/assessment of measurement errors. • An evaluation/ assessment of non-response errors.
• An evaluation/assessment of processing errors.
3.5 For Statistical Processes Using Administrative Source(s)
This is an area where an established theory and concepts are still missing although the recent publication by Wallgren and Wallgren (2007) entitled Register-based Statistics – Administrative Data for Statistical Purposes goes a long way towards filling the gap. Although the book’s title implies that all administrative data come in the form of registers, there are also other cases.
For the purpose of these guidelines, three types of register-based statistics, without direct data collection, are defined.
• Estimates produced from one register. The target population and the variables need to be defined. The tabulations are to be made from this perspective, also the estimation of error properties: a possibly difficult task where the register is updated over time. In
eurostat ESS Handbook for Quality Reports 61
particular, lags in updating register units may cause errors in the results, depending on the time when data is extracted from the register for statistical purposes. (See also Business Registers, Section 3.5 below.)
• Integration of several registers in order to obtain and describe new populations and variables. This more complex case is treated in some length by Wallgren & Wallgren. For example, population censuses in some Scandinavian countries are currently made in this way. The interested reader is left to consult Wallgren & Wallgren and other, mainly but not only Nordic, sources directly.
• Event-reporting systems. Three examples are crime statistics, statistics of road accidents and statistics on the causes of death. Extra-EU external trade, as reported to Customs authorities when goods pass the EU borders, is another example. In these cases the responsible administrative authority (police, hospitals, customs, etc) reports an event, including a number of variables characterising the event. The report is triggered by the event itself rather than by a questionnaire sent by the statistical agency. The events may or may not be entered into a register before being reported to the statistical agency.
3.5.1 Estimates produced from one register Registers, whether for administrative or for statistical purposes, cover all units according to a certain definition. Thus, as for censuses, sampling errors do not exist. Pertinent errors are:
Coverage. Over- and under- coverage of eligible units according to the target definition, using also the register definition, should be assessed and reported. Lags in entering information into registers are crucial for understanding the coverage properties of a register. Evaluation approaches regarding these errors have much in common with those mentioned in Section 3.3.3.
Non-response. Unit and mainly item non-response (missing data) should be assessed and reported.
Measurement errors (Errors in register variables). For various measurement or processing reasons a register unit may have erroneous value for one or more variables. The cause of the error may be that the value was erroneously provided or miscaptured in the first place or that a later change in the variable has not yet been recorded in the register. The lag structure associated with register updating (see Section 3.3.3) can be analysed in order to throw light on the latter aspect.
Processing Errors. When registers are maintained by external agencies, two levels of data treatment can be identified: data treatment phases performed at level of provider, and processing carried out in the NSI in order to integrate different register, or to derive statistics form a given register. The quality report should cover the latter ones, and when possible provide a summary of data treatment of the provider.
Differences in concepts. If target concepts differ from register concepts the effect on outputs of differences should be assessed quantitatively to the extent possible for key indicators.
Quality report should describe the actions taken with respect to the units and variables originally included in the register - whether they are kept as they are or whether new units and/or values are derived. Models and estimation procedures used should be presented.
A more complex situation occurs for so called multi-valued variables in registers, for example, businesses active in several industries, persons with more than one job, etc.
ESS Handbook for Quality Reports eurostat 62
Wallgren and Wallgren give examples of how multi-valued variables can be treated when producing statistics from registers. The approach used should be described and motivated in the quality report.
The procedures for assigning economic activity codes to businesses is of crucial importance register-based business statistics and should be dealt with at length.
3.5.2 Integration of several registers When integrating two or more registers, a key role is played by the unit’s identifiers. The availability of a unique record identifier simplifies the integration process which will consist of a merging of different registers based on such an identifier, provided that it is recorded without errors (measurement). When the unit’s identifier presents errors, the integration process can require more complex record linkage procedures in which the identification of the same unit in two registers is based on the agreement between common units’ indicators (for details about data integration methods see documents from the ESSnet Statistical Methodology Project on Integration of Survey and Administrative Data). Record linkage procedures can be used even in the absence of unique units’ identifiers, and an identifier is created instead by utilizing some of the available information shared by the registers (e.g. name, birthdate, address, etc.). The risk with record linkage is twofold: erroneously linked records (false matches), and erroneously non-linked records (i.e. units that refer to the same entity but that are not linked, false nonmatches). In the first case, it is shown that false matches can introduce bias when analyzing relationships among variables coming from two different registers integrated via record linkage.
For this reason it is important to assess the accuracy of the units’ identifiers or of the key indicators used in record linkage (missing values, measurement/processing errors); in the latter case the risk of false matches and false nonmatches should be assessed.
Example 3.5.2.A: Accuracy section in the Statistics Denmark Quality Declaration on “Coherent Social Statistics (Recipient of Income Compensating Benefits)”, (Statistics Denmark1, 2007)
3 Accuracy
3.1 Overall accuracy
As a linked and integrated statistical system, the overall reliability depends to a large extent on the reliability of the linked source data (please see the specific declarations). In connection with the establishment and linkage of the registers, data reductions and harmonisations have been necessary in order to create a coherent statistical register which unites data in spite of the apparent incompatibility of data. Some strategic decisions have been made in connection with the definition of the populations. The register has from the very start served as an important source in various research projects and presentations initiated by private as as well public organisations. The user response and the evaluation show a high degree of reliability.
3.2 Sources of inaccuracy
The reliability of the data relates mainly to the specific registers making up the complete data system. There have been difficulties defining the individual amounts of benefits paid to persons receiving labour market benefits. Data and methods have occasionally been improved, but data are still not covered in full.
In connection with the harmonisation of data, a common measure for the duration of the benefits is used, namely the number of days in a month. One month is max. 30 days and one year is max. 360 days. For persons receiving cash benefits or local government activation, data are only available at the level of month, hence the duration in days is defined as 30 days per month, i.e. 12 months equal 360 days. The weekly unemployment rate is known for persons receiving unemployment benefits. This measure is converted into days per week (one week = 7 days), and subsequently cumulated into days per month (max. 30 days). The days in a week split between two months are divided by ratio.
eurostat ESS Handbook for Quality Reports 63
The data for recipients of sickness benefits, maternity benefits and central government activation, where the duration of the benefits is based on calendar data: day/month/year, are calculated on the basis of more exact information concerning first day/last day.
The duration of benefits received by recipients of permanent benefits is calculated on the basis of a combination of exact data (calendar data) and logic imputation.
In general: Intensive and detailed use of cross-year compiled data often leaves the conclusions to be drawn on the basis of decisions and concepts (guided by knowledge of changes in legislation and administration).
3.3 Measures on accuracy
There are no sampling errors as the statistics are compiled on the basis of a census.
3.5.3 Event-reporting Systems The quality of data from an event-reporting system depends first and foremost on the completeness of the reporting system. The rate of unreported events is a key quality factor, although sometimes difficult to estimate. It is a special type of undercoverage error which should be evaluated according to the target population, administrative reference population can be different from the target population for statistical purposes.
Errors in the classifying variables (type of crime, type of accident, type of goods) can best be regarded as a processing error. Approaches to monitor these errors are normally domain related. For example in crime statistics there is an intricate system for coding main crimes and related crimes, counting crimes, etc., that depends upon principles and practices in the area of criminology. A similar situation occurs for cause of death statistics, where the measurement procedures depend upon medical principles and practices.
Example 3.5.3.A: Accuracy section in the Statistics Finland Quality Declaration about number of domestic adoptions in 2011 (Statistics Finland, 2012)
3. Correctness and accuracy of data
In general, the Population Information System of the Population Register Centre can be considered very exhaustive as regards persons. In order for a person to obtain a personal identity code, he or she has to be registered in the Population Information System. The registration is possible if he or she moves to Finland permanently or temporarily. It is practically impossible to live in Finland without a personal identity code. A personal identity code is needed so that one can work legally, open a bank account, have dealings with authorities and so on. It can be safely assumed that Finland cannot have any substantial numbers of ’moonlighters’ who receive their pay in cash for periods of over one year, for example. Residing in Finland for at least one year is the prerequisite for registering into the population of Finland.
After the abolishment of the yearly checking of domicile registers (January 1) in 1989 the Population Information System has been maintained only by notifications of changes to population information. Their correctness level is determined by a reliability survey made on the addresses in the Population Information System.
The Population Register Centre charges Statistics Finland with the task of conducting a yearly sample survey on correctness of address information. Around 11,000 people are asked whether their address in the Population Information System is correct. In the 2011 survey, the address was correct for 99.0 per cent of the respondents.
In connection with municipal elections, returned notifications of voting sent to foreigners usually reveal around 1,000 persons who have moved from the country without giving notice and are thus still included in the Finnish population. The local register office removes them from the resident population in the Population Information System before the following turn of the year.
ESS Handbook for Quality Reports eurostat 64
Quality and Performance Indicators
Indicator A3 - Common units proportion can be used here.
Summary
What should be included on Accuracy for a Statistical Process using Administrative Source(s)
• An evaluation/assessment of overcoverage, undercoverage and item non-response (missing data). • An evaluation/assessment of measurement errors.
• For integration of several registers, an evaluation/assessment of the errors in units’ identifiers and, in case of record linkage, of errors in linkage. For event-reporting systems, an estimate/assessment of the rate of unreported events.
3.6 For Statistical Processes Involving Multiple Data Sources
In many statistical areas, measurement problems are such that a single approach to sampling and measurement is not possible or suitable. For example, for Structural Business Surveys, in which the basic economic data about businesses (production, finance etc.,) are aggregated, different units, questionnaires and sampling schemes may be used for different segments of the survey.
When presenting a quality report for statistical process involving multiple sources, there is a need to focus on the whole picture as well as the segments. The introduction of the report should contain an overall description of the organisation of the survey, the various segments, and a summary of the quality aspects. Then the accuracy section of the quality report should be organized by type of errors instead of segment by segment. When dealing with output from a statistical process involving multiple data sources sometimes it is difficult to assess the accuracy because of the many sampling and non-sampling errors involved in the different sources being considered. In some cases, when the production of the outputs requires complex processing and the different input data sources may be available or updated at different times, it is a common practice to provide preliminary estimates and then update them when new input data become available. In this context, one can look the closeness of the initially released estimates to the subsequent released estimates which corresponds to assess reliability (cf. OECD Quality Framework, 2011). In particular, assessing reliability is based on the analysis of revisions (for major details, see section 3.9.5). Revisions show the degree of closeness of initial estimates to subsequent or final estimates. Since all estimates are affected by error, this type of analysis cannot definitively demonstrate the accuracy of initial estimates. But clearly the amount of revision is still an indicator of accuracy, since it is reasonable to assume that estimates are converging towards the true value as estimates are based on more and more reliable sources.
Quality and Performance Indicators
Indicators A1-A5 above can be used.
When revision policy is followed, indicator A6 can be used.
When integrating registers and survey data, indicator A3 (common units - proportion) can be used. It should be noted that:

eurostat ESS Handbook for Quality Reports 65
1. CVs (when applicable) are often straight-forward to calculate based on the composite sampling design.
2. With supplementary specifications other indicators, like overcoverage and non-response rates can also be defined.
Summary
What should be included on Accuracy for a Statistical Process Involving Multiple Data Sources
• An overall description of the organisation of the process, the various segments and a summary of the quality aspects. • For each segment, the items as specified in the appropriate sections in these guidelines. These items should be grouped by error type.
• When revisions of the estimates are released some information should be provided (see Summary in section 3.8.5)
3.7 For Price and Other Economic Index Processes
Price indexes (CPI, HICP, PPI, SPPI, PPP, Construction and Real Estate price indexes) play an important role in the European Statistical System as well as in all national statistical systems. They are based on statistical surveys and their objective is to monitor price differences in space (PPP) or over time (all others) for all products (goods or services) within their scope, and to provide an overall estimate of price change/difference. In addition there is the Industrial Production Index and other volume indexes that can be seen as a part of a system of economic indexes.
Price, volume (and the less common productivity) indexes are economic indexes for which economic theory and index theory provide a conceptual framework, for which the target concepts are complex.
Price indexes often involve data from multiple sources and are thus a special case of a process in Section 3.6 but their importance merits special treatment. Different measurement approaches are typically used for different types of products. For example, in a CPI/HICP there is a long list of products requiring special approaches (such as cars, PCs, insurance, telecom services, and electricity). A quality report needs to include and assess the approaches for each one of these special products.
Approaches for estimating sampling error in price indexes have been pioneered by some countries but no generally agreed approach exists. The ILO CPI manual (chapter 5) includes discussions and further references on this topic. It is important to note that there are several sampling dimensions in a price index. In a CPI there is sampling of households (for weights), of products, and of outlets (by type and region). In a PPI there is usually sampling of companies, and of products within companies. In practice probability sampling is not used in all these dimensions and the nature of the purposive procedures are therefore important to describe. A quality report should include a discussion of all relevant sampling dimensions. (See also Section 3.3.2. above on non-probability sampling in general.)
Coverage errors likewise have to be considered in all sampling dimensions. Normally, there are limitations in coverage in all these dimensions that need to be reported and their consequences analysed. Where non-probability sampling is used, the distinction between sampling and coverage error becomes to some extent blurred.
ESS Handbook for Quality Reports eurostat 66
A particular and very important source of error in price indexes is quality adjustment including replacements and re-sampling – the treatment of changes over time in the product universe - between different varieties/models of a product with sometimes different values to the user. Since it is not possible to define the target of estimation exactly, the issue is often stated as a comparability problem, especially in the ESS context (HICP). But strictly speaking, quality adjustment should be regarded as a type of measurement problem. The quality report needs to describe and assess the replacement, re-sampling and quality adjustment methods used for all products, which together determine the way in which price index estimation works. Model assumptions (e.g. hedonic models), implicit or explicit, are often used in the treatment of quality change and what is said below in Section 3.9.1 is therefore also relevant here.
Non-response and other errors are normally regarded as secondary problems in price indexes. The reason for this can be expressed as an “efficient market hypothesis”. No outlet or company could, in the medium or long term, deviate from the rest of the market in its price policy. If this is true then non-response bias is small. In a PPI, a distinction needs to be made between non-response in the first phase (when a company is recruited) and in the ongoing phase (when the company is asked monthly for its current prices). In the latter case there will be a temporarily or permanently missing price. In any case there should be a discussion of the non-response problem for a PPI in a quality report. Example 3.7.A: CPI 2012 Quality Declaration,Sampling Error, Statistics Sweden (Tarassiouk, 2013, p.11-12)
Complexity in the CPI affects sampling error
In statistics, sampling error or estimation error is the amount of inaccuracy in estimating some value caused by only measuring a portion of a population (i.e. a sample) rather than the whole population. This amount of inaccuracy is commonly referred to as sampling error and expressed as confidence intervals.
The complexity of the CPI statistics implies complex structure of the sampling error. Dalén & Ohlsson (1995) states that the independent sampling of outlets and products yield a two-dimensional, cross-classified sample. A design based variance formula is derived by exploiting the general theory for cross-classified sampling. This can be applied to the annual link from the base period (December year, y-1) to each month in the current year (year, y, and month, m).
The sampling errors due to sampling of outlets and products have a constant impact on one calendar year at a time. Norberg (2004) finds that the third sampling process of product varieties generally contributes most to the total sampling error. This sampling error is also found to be least correlated over time.
Some of the most important CPI-statistics involve several annual links, for example the inflation rate which is computed as the change from year, y-1, and month, m, to year, y, and month, m. The sampling error for the change statistics includes sampling errors for two samples (for two years).
Estimation of sampling error in the CPI
Dalén & Ohlsson (1995) proposes an analytic approach for estimation of variance in a cross-classified sample design of outlets and products. This can be applied to the annual link from base period (December year, y-1) to each month in current year (year, y, and month, m).
Dalén (2001) uses approximations and reasoning to motivate the best estimates of sampling errors for various reported measures of CPI changes that comprise more than one annual link.
Norberg (2004) studies the character of variation in price changes using analysis of variance models. Variance estimators in analytical forms are compared to estimators based on re-sampling procedures and models. All three methods result in estimates of roughly the same magnitude. Re-sampling procedures make it possible to estimate the variance for complex functions of index links such as the inflation rate and change of inflation rate without extra assumptions.
Nilsson, H. et. al. (2008) produces new estimates of sampling errors for the centrally collected product groups. These correspond to 46 % of consumer expenditure.

eurostat ESS Handbook for Quality Reports 67
Estimates of sampling error
Based on the four papers above, the sampling errors of the CPI-measures have been assessed and are given for the last years in the table below:
Table 1: Estimated sampling errors, lengths of 95% confidence intervals 2012
Statistics Estimated length of 95% confidence interval
Comment
Monthly change ±0,15 - ±0,2 ± 0,15 in April, May, June, November and ±0,2 other months
Annual change (inflation rate) ±0,3 Somewhat lower in December1
Monthly change of inflation ±0,2 - ±0,25 ±0,2 in April, May, June, November, December and ±0,25 other months
1The annual link from December to December is based on one and the same sample.
Figure 1 Inflation rate 2008-2011. 95% confidence interval
Figure 2 Monthly change of inflation rate 2008-2011. 95% confidence interval

ESS Handbook for Quality Reports eurostat 68
During 2011 the inflation rate change was “statistically significant” in March (up), April (up), October (down) and December (down). The inflation rate was +2.3 0.3%
Quality and Performance Indicators
None explicitly defined.
It should be noted that:
1. An indicator that has been tried for the HICP is the Implicit Quality Index. See example 3.9.6.A for a detailed presentation.
2. For the Purchasing Power Parities, the quality report is primarily an issue for the ESS level, since the objective is about comparisons between countries.
Summary
What should be included on Accuracy for Price or Other Economic Index Process
• Information on all sampling dimensions (for weights, products, outlets/companies, etc). • Any attempt at estimating or assessing the sampling error in all or some of these dimensions. • Quality adjustment methods (including replacement and re-sampling rules) for at least major product groups.
• Assessment of other types of error, where they could have a significant influence.
3.8 For Statistical Compilations
At the top level of national and European statistical systems are economic and other aggregates that are compiled from basic statistics from a variety of different sources and that concern various aspects of the economy, society and the environment. This section discusses quality reporting for such statistical compilations.
The most well known compilations are economic aggregates, of which the best known are the National Accounts and the Balance of Payments. (A longer list is provided by Statistics Canada.) Analysing and reporting the accuracy of these economic aggregates is extremely difficult since they involve many diverse sources. It is necessary to take a very different approach than for sample surveys. Sections 3.8.1 and 3.8.2 present examples for the National

eurostat ESS Handbook for Quality Reports 69
Accounts and the Balance of Payments. Other statistical compilations are briefly discussed in Section 3.8.3.
3.8.1 National Accounts There are a variety of approaches to the assessment and reporting of the accuracy of the National Accounts as illustrated in the following paragraphs.
Example 3.8.1.A DQAF Generic Framework from July 2003 (International Monetary Fund, 2006)
The International Monetary Fund (IMF) has developed its Data Quality Assessment Framework (DQAF). The first three levels of the framework are generic and the same for any statistical process, the final two levels are process specific. There is a version devoted to measurement of the quality of the National Accounts. The aspects of quality covered by the framework are: (i) assurances of integrity; (ii) methodological soundness; (iii) accuracy and reliability; (iv) serviceability (periodicity and timeliness; consistency; revision practice and policy); and (vi) accessibility. This approach shares many aspects with an approach based on the principles in the European Statistics Code of Practice, where the most of the criteria can be found.
Example 3.8.1.B: Accuracy section in the Quality report on the Final National Accounts (Statistics Denmark2, 2007)
3 Accuracy
3.1 Overall accuracy
When the national accounts were based on the definitions in the European System of National Accounts ESA95, the national accounts were at the same time undergoing a major revision, which means that all the levels were examined and evaluated, among other things for the sake of the Gross National Income compilations, which form the basis of a considerable amount of the financial contribution from Denmark to the EU. A reasonable accuracy of the national accounts figures is maintained by compiling the product balances at a very detailed level. Furthermore, the compilation of the central variable GDP is to the greatest extent possible compiled from the point of view: production, expenditure and income.
3.2 Sources of inaccuracy
The inaccuracy of the national accounts figures relates to the inaccuracy of the various sources which are used. However, the conceptual consistency and, over time, the uniform adaptation of the sources contribute to reducing the inaccuracy of the national accounts figures. In particular, the combination of the primary sources into a coherent system in many cases gives rise to errors, which therefore are not reflected in the final national accounts.
3.3 Measures on accuracy
Statistical inaccuracy estimates do not exist.
When dealing with figures of national accounts, a direct approach for measuring accuracy is difficultly applicable, thus, in such cases, the main instrument being considered is the analysis of revisions.
Example 3.8.1.C: Accuracy and reliability section in the Quality report on National Accounts ( Statistisches Bundesamt2, 2013, p. 7-8)
4 Accuracy and reliability
4.1 Overall qualitative assessment of accuracy
Generally, sampling and non-sampling errors of the source statistics integrated into national accounts may also be contained in the national accounting results. Also, applying estimation methods and extrapolating time series may lead to inaccuracies. However, this is necessary to meet the user requirements regarding timeliness of the national accounts data. For this reason, a certain degree of inaccuracy is the price to pay for having a high degree of timeliness of the national accounts data.
ESS Handbook for Quality Reports eurostat 70
The quality of the national accounting calculations is continuously checked during the calculation process so that possible shortcomings or errors can be detected and eliminated. Major elements of that quality assurance procedure are the following:
• Source statistics, where produced as part of official statistics and used by national accounts, are subjected to quality control in the relevant specialised departments
• In national accounts, the source data provided are checked again for completeness and plausibility
• A major quality assurance element is the far-reaching comparison of the source statistics used in national accounting and of the very results of national accounts with complementary data from other sources
• The national accounting results are reconciled with the results of input-output accounts
• Setting up sector accounts always involves checking the system coherence. The production, use and distribution approaches and also the financial accounts based on institutional sectors must be co-ordinated to reflect a closed economic cycle. Any discrepancies will easily be detected in the balancing items of the sectors
Also, due to their great importance for financial and economic policies and as they are widely used for administrative purposes in the European Union (e.g. payments to the EU budget, calculation of Maastricht criteria), national accounts are regularly subjected to international audits; for example by Eurostat, the European Court of Auditors and the International Monetary Fund (IWF Data-ROSC-Bericht).
4.2 Quality of data sources
Differing assessments of the quality of the diverse data sources can lead to differing adjustment mechanisms and ultimately also to differing results. This, however, is a problem that applies to virtually all accounting systems which are fed from various mutually independent sources that may contain errors. Therefore, the ultimate production of a result which is coherent and plausible in its structure must not blind us to the scope that exists for estimation in certain of the published overall results.
4.3 Revisions
4.3.1 Revision rules
Revision means the revising of results, for example, by including new data, new statistics and/or new methods into the accounting system. A distinction is made between regular revisions referring to minor corrections for individual quarters or years and comprehensive or major revisions. The latter are fundamental revisions of all national accounts and of very long time series. Such major revisions of national accounts take place approximately every five years. The most recent major revision took place in 2011 in the course of changing over to the new Classification of Economic Activities and Product Classification (WZ 2008 and GP 2009).
Reasons for comprehensive revisions may be the following:
• introducing new concepts, definitions or classifications into the accounting system;
• integrating new statistical bases for the calculation that have not been applied yet;
• applying new calculation methods;
• modernising the presentation and, where required, introducing new terms;
• enhancing international comparability.
Regular revisions refer to minor corrections for individual quarters or years. They are performed in the course of current calculations and can generally occur during any release date. Such revisions are performed to include into the system current information that differs significantly from the data bases available before. In this way, data users are supplied with the best possible results for analyses and forecasts.
Usually, the data for the quarters of the current year are checked at every quarterly release date, while data for the last four years, including the relevant quarters, are revised only once a year (in August).
4.3.2 Method of revision
National accounts were converted to the new Classification of Economic Activities and Product Classification (WZ 2008 and GP 2009, respectively) as part of the 2011 revision of national accounts, which was completed in

eurostat ESS Handbook for Quality Reports 71
September 2011. The new breakdown of economic industries into a total of 64 industries is internationally harmonised; with the exception of some aggregates, the industries correspond to the divisions.
Meader and Tily (2008) discuss UK National Accounts quality. They regard the most important tools for monitoring the accuracy and coherence of quarterly GDP growth estimates to be:
internal coherence – the analysis of published adjustments (alignment adjustments and statistical discrepancies) as well as unpublished adjustments; these three measures together contribute to understanding coherence within the GDP data set;
wider coherence – measures that indicate the degree of coherence between GDP and other ONS and external sources;
sources – the monitoring of the quality of source data that feed into GDP. While the above three measures concentrate on GDP output, this one looks at the accuracy of ONS surveys and administrative information.
Fixler and Grimm (2005) make a similar analysis for the US National Accounts.
A key problem for the National Accounts is the non-observed economy, i.e., that part of the economy that is not covered by the usual administrative and survey sources. Measurement of the Non-Observed Economy: A Handbook (OECD et al) provides guidance on measurement of the non-observed economy as included in, and as missing from, the National Accounts.
In summary, reporting accuracy for National Accounts needs quite a different approach to that used for other statistical processes.
3.8.2 Balance of Payments The Balance of Payments, like the National Accounts, is compiled from a wide range of administrative and statistical sources providing data on trade in goods, trade in services, capital flows, etc., and involves the same difficulty in evaluating accuracy.
The legal requirement for quality reporting is included in the Balance of Payments Regulation but there is no technical guidance on the content of a quality report. At national level, quality reports on such issue are very rare.
At the ESS level, however, there is a recent experience on quality reporting from Eurostat. In such case the assessment of accuracy is based on the analysis of revisions.
Example 3.8.2.A: Accuracy section in Eurostat's assessment of the BoP Quality Report 2010 (Eurostat2, 2011, p. 2)
2. Accuracy
Revisions in the Euroindicators and in the current account of the QBoP are small except in the case of direct investment income and, to a lesser extent, of other investment income and current transfers. Concerning the financial account, there are large revisions for most of the components. These large revisions are due to changes in the compilation method and to the lack of information on the operations of SPEs on time for the first data transmission.
Overall, revisions in annual FDI and ITS data were not very significant in relative terms. Only 2008 FDI flows (inward and outward) reported in the 2010 vintage show more relevant revisions.
It is worth noting that in the ESS the ECB compiles a Quality report on Balance of Payments , which however follows the basic principles of the International Monetary Fund (IMF) Data
ESS Handbook for Quality Reports eurostat 72
Quality Assessment Framework. The section entitled accuracy is very brief and, as in the case of the National Accounts, the main approach is through revisions analysis.
3.8.3 Other Compilations Environmental accounts provide an example of statistical compilation outside economic statistics. However, there are no established standards for such accounts, thus it is premature to formulate quality reporting guidelines for them.
A special case of great importance is that of statistics on Greenhouse Gas Emissions (GGE), for which detailed international guidelines are provided by a UN institution. GGE statistics are compiled from a large number of national and international reports of anthropogenic emissions and removals of greenhouse gases. Instructions on managing uncertainties are included in an annex to the guidelines. There is nothing that resembles a quality report of the kind discussed in this document but there is a special chapter on Gaps in Knowledge that has some aspects in common with a quality report.
Quality and Performance Indicators
See relevant manuals.
It should be noted that the main indicator of accuracy for economic aggregates is revisions. See Section 3.9.5 below.
Summary
What should be included on Accuracy for a Statistical Compilation
• Information and indicators relating to accuracy for example as defined in the IMF’s Data Quality Assessment Framework (DQAF) or other relevant, well accepted standard.
• Analysis of revisions between successively published estimates.
For National Accounts
• Analysis of the causes for the statistical discrepancy.
• Assessment of non-observed economy.
3.9 Some Special Issues Concerning Accuracy
There are several issues in the reporting of accuracy that are not specific to the type of statistical process. They are discussed in the following paragraphs.
3.9.1 Model Assumptions and Associated Errors Models are often applied in statistics. Sometimes the target of estimation relies on an abstract model defined by a subject matter discipline. In other cases, such as seasonal adjustment, which is treated in the next section, the model is of a purely mathematical-statistical nature. Sometimes a model is applied in estimation in order to improve precision.
Model-assisted estimation (in the sense of Särndal et al, 1992) is the first case. Here models are only used for the purpose of reducing sampling error as defined by the design-based paradigm. Sampling error calculated according to the relevant variance estimation formulas is sufficient and no separate discussion of model assumptions is needed in the quality report. If
eurostat ESS Handbook for Quality Reports 73
the basic design-based estimation is extended to adjust for non-sampling errors, such as non-response, a description should be provided.
Model-dependent estimation is a different matter. In this case there are no design-based estimators to use and the inference depends on the model, whose assumptions need to be critically checked. When model-dependent estimation is used as a remedy for a particular non-sampling error (like non-response or measurement errors) the discussion of the model should be in the relevant error section rather than in a separate section. A similar case is where models are used for a sample or a census with cut-off (discussed in Section 3.3.2).
In yet other cases even the target of estimation is model-based. The model is then usually developed by a domain related science. Natural science models are used in environmental statistics, medical models for some parts of health statistics and economic models for concepts in economic statistics such as productivity and inflation. (The National Accounts system is an economic model.) In such cases, the model should be described in the quality report and its validity for the data at hand assessed. Whether to do this in a general section on methodology or in a section on model assumptions is a matter of choice in each case.
Example 3.9.1.A: Healthy Life Years Expectancy (Eurostat2, 2012)
This is a case where the target of estimation is model-based (approved by the World Health Organisation). This document describes the method for calculation, but is not a full quality report, since, for example, no discussion of accuracy is included.
Example 3.9.1.B: Greenhouse Gas Emissions (Eurostat3, 2011)
This is another example, where the target of estimation is model-based (and very complex). It was developed by the UN Intergovernmental Panel on Climate Change.
Example 3.9.1.C: Foreign Trade Statistics (Eurostat, 2010, p. 7-9)
This is a case where model-dependent estimation is used for a relatively simple target concept. A model is used for estimating the part of trade that is below a threshold (a census with cut-off). The actual method used is different in different Member States. In the document the effects of the estimation are shown in Table 3 and the thresholds used are given in Tables 1 and 2. Strictly, the example belongs to Section 3.3.
Summary
What should be included on Model Assumptions and Associated Errors
• Models related to a specific source of error should be presented in the section concerned. This is recommended also in the case of a cut-off threshold and model-based estimation.
• Domain specific models, for example, as needed to define the target of estimation itself, should be thoroughly described and their validity for the data at hand assessed.
3.9.2 Seasonal Adjustment ESS guidelines on seasonal adjustment (EGSA) have been adopted. Their implementation will enhance quality of seasonally adjusted figures as well as enforce the robustness and reliability of European aggregates.
For statistical processes involving seasonal adjustment, a quality report should include a section on this topic. Where full documentation exists in other places and/or the metadata template provided in the EGSA has been compiled, a reference to the relevant documents can be made and a brief summary given. The following points then constitute a minimum:
ESS Handbook for Quality Reports eurostat 74
A short description of the method used, including pre-treatment (calendar effects corrected for, calendar used, type of outliers detected and corrected, model selection and revision and decomposition scheme adopted) and specification of the seasonal adjustment tool chosen (software, its version and operating system);
Validation: specification of the quality measures and diagnostics used to evaluate the appropriateness of the identified model and the results of the seasonal adjustment process.
Revisions: approach chosen for handling revision of seasonally adjusted data in combination or not with revision of raw data (specification of the horizon of revision seasonal factors).
In case no other documentation is available a full presentation of the process applied and of the methodological choices made with respect to each item of the EGSA (in particular for pre-treatment, seasonal adjustment, revision policies, quality of the seasonal adjustment process) should be included in the quality report.
Example 3.9.2.A: LFS 2013 Quality Declaration, Seasonal adjustment, Statistics Sweden (Beijron et al, 2013, p. 24)
Seasonal adjustment
Seasonal adjustment of the LFS time series is done with a method that is built into the standard program X12-ARIMA.4
The method uses time series analysis as a basis for trend cycle and seasonal component estimation. Seasonal adjustment in the LFS assumes that all time series follow an (S)ARIMA(p, d, q) x (P, D, Q)S –model where d =1, D=1, and S=12, without being transformed. All series are differentiated one time with reference to the periods that lie nearby, and one more time twelve months back in time. The seasonal components are calculated with a symmetrical 3x5 filter, and trend cycle components are calculated with a Henderson 23-point gliding average value, also symmetrical. When deriving the trend cycle and seasonal components, these are assumed to be additive.
Summary
What should be included in the Quality Report on Seasonal Adjustment
• A short description of the method used.
• A report on quality aspects in line with the ESS guidelines on seasonal adjustment.
3.9.3 Imputation Imputation is a response to deficiencies in the data received. In a sample survey or census the reasons for imputation could be non-response (usually item non-response) or to correct values affected by measurement or processing errors. In price index processes, imputation may occur due to temporarily missing prices.
The extent to which imputation is used, the reasons for it, and the imputation procedures should be described in the quality report. Where imputation is associated with a particular source of error, it is best to include its description under the relevant heading (for example non-response or measurement error).
Imputation is a part of data processing and thus may itself cause processing error. Normally this can be assumed to be a minor problem compared with the error sources that created the need for imputation in the first place and, if so, need not be dealt with explicitly.

eurostat ESS Handbook for Quality Reports 75
Imputation can also affect the calculation of sampling error. In particular if imputation based on replacement by stratum mean is used the result will be to introduce some underestimation of the real sampling error. This should be noted where sampling errors are presented unless special methods have been applied to deal with this.
Quality and Performance Indicators
A7. Imputation rate. General definition: The ratio of the number of replaced values to the total number of values for a given variable.
Imputation is the process used to assign replacement values for missing, invalid or inconsistent data that have failed edits. This includes automatic and manual imputations; it excludes follow-up with respondents and the corresponding corrections (if applicable). Thus, imputation as defined above occurs after data collection, no matter from which source or mix of sources the data have been obtained, including administrative data.
After imputation, the data file should normally only contain plausible and internally consistent data records.
ESS level
Individual values and aggregates of A7 over Member States.
Summary
What should be included in the Quality Report on Imputation
• Information on the extent to which imputation is used. • A short description of the methods used and their effects on the estimates. (Typically this information will be reported in the section(s) dealing with the errors that imputation is helping to correct rather than in a separate section.)
3.9.4 Mistakes There are two very different kinds of processing errors. The first type, which has already been discussed in Section 3.3.6 concerns micro-data. The second type concerns macro-data and involves serious mistakes in calculation or presentation of aggregates that are not found until after publication. Mistakes affect all types of statistical process in essentially the same way. They are the errors most visible to the public, typically receiving a lot of negative attention. Examples are when the methodology is not applied correctly, when the wrong number is inadvertently included in a press release, and when analytical presentations or diagrams give wrong impressions. They may occur in any stage in the production of statistics: programming, calculation, report writing, editing of manuscripts, etc. The type and number of mistakes that have been officially recognised and have resulted in unplanned revisions should be presented for several years back.
Procedures to minimise the risk of gross mistakes in calculation or presentation should be described in the quality report. Policies for handling the situation when mistakes are discovered should be presented as well.
ESS Handbook for Quality Reports eurostat 76
Summary
What should be included on Mistakes
• The nature of mistakes over the past few years should be described.
• Measures taken to avoid mistakes in the future should be described.
3.9.5 Revisions Revisions of estimates can be considered an update of the previously released estimates. Theycan be planned or unplanned. Unplanned revisions are usually caused by the discovery of a mistake in a published result as discussed in Section 3.9.4. This section deals with planned revisions, this is typically the case of complex production processes involving different input data sources which may be available or updated at different times, in such a case it is a common practice to provide preliminary estimates and then update them when new input data become available, this is done in accordance with a specific revision policy which essentially provides the number of planned revisions and their periodicity.
The European Statistics Code of Practice requires that a revision follows standard, well-established and transparent procedures. This means for example that pre-announcements are desirable and that the reasons for and nature of the revision (new source data available, new methods, etc.,) should be made clear. Whether this is the case should be stated in the quality report.
Revision practices vary greatly between countries and, especially, between statistical processes. The quality report should first state the relevant revision policy, if there is one, and then present the actual practice. The statement should detail the variables and domains that are subject to revision and the pattern of successive releases.
The quality report should also include information on the size and direction of revisions. This information should cover all key indicators. The size of revision gives an idea of the stability of estimates while direction is important to understand whether preliminary estimates tend to overestimate or underestimate the parameter of interest (further detail can be find in the ESS Guidelines for the implementation of the ESS Quality and performance indicators, 2010).
Example 3.9.5.A: ECB Euro Area Balance Of Payments And International Investment Position Statistics, 2011 Quality Report (European Central Bank1, 2012, p. 14)
3.2 ACCURACY AND RELIABILITY (STABILITY) OF THE STATISTICAL OUTPUT
When compiling the euro area aggregates at all frequencies, the ECB performs quality assurance procedures on the contributions received from all euro area countries, and from the ECB itself (derived from its accounting ledgers). The aim of these checks is to detect inaccurate, inconsistent or implausible data. Outliers in time series and inconsistencies with other data sources are analysed as well. If a potential problem is detected, the compiler in the country involved has to check, change or confirm the figures; in the latter case, a further explanation with regard to the underlying economic developments is often supplied.
The ECB publishes its revision practices. The euro area b.o.p. and i.i.p. are revised in line with the following predetermined schedule: quarterly data are revised with the publication of the following quarter’s statistics, and twice a year thereafter, namely in April and October; monthly b.o.p. data are revised with the publication of the following month’s statistics, as well as with the revisions of the relevant quarter; and the annual i.i.p. is revised with the publication of the same data for the two subsequent years. In addition, extraordinary revisions are justified in the case of major changes in methodology, coverage or data collection systems in the Member States, or when the composition of the euro area changes.

eurostat ESS Handbook for Quality Reports 77
The first release of the monthly b.o.p. for the euro area occurs seven weeks after the end of the reference period and is based on the contributions sent by national compilers four working days earlier. This report also involves a revision analysis to assess the reliability (or stability) of the euro area’s monthly b.o.p., based on a number of indicators that measure the proximity of these first assessments to the final assessments. Similarly, the i.i.p. revisions are analysed with due consideration of the different vintages resulting from the annual revisions.
Revisions are necessary to improve the data quality as the fi rst assessments may be based, in part, on estimates due to incomplete, late or erroneous responses by reporting agents. Revisions also provide users with more accurate data for time series analysis and forecasting. However, large or systematic revisions may signal weaknesses in the data collection or compilation systems that need to be resolved.
Example 3.9.5.B: Accuracy and reliability section in the Quality report on National Accounts (Statistisches Bundesamt2, 2013, p. 8-9)
Accuracy and reliability
[…]
4.3.3 Revision analyses
An opportunity to evaluate the reliability of national accounts data is to analyse the revision differences. This means to determine the discrepancy between the first estimate and the (final) result released at a later time. Calculating revision differences provides the user with information on the average corrections to be made to former estimates. Typically, a socalled mean revision (MR) measure and mean absolute revision (MAR) measure are determined. Mean revision refers to the arithmetic mean of the discrepancies observed in the past between provisional and final values, while taking account of the algebraic signs. Mean absolute revision, however, refers to the arithmetic mean of the discrepancies observed in the past between provisional and final values, while not taking account of the algebraic signs.
The following table shows these revision measures for the price-adjusted gross domestic product (quarterly values). The period under review starts in 1999. That was the year when the European System of National and Regional Accounts (1995 edition) was introduced, which since then has been a binding framework for national accounts in Germany.
The calculations show both that the regular revisions of the gross domestic product are within a reasonable scope considering the great timeliness and that they stand international comparison. In view of the complexity of the gross domestic product as an indicator of the overall economic performance, an average need for growth rate correction of slightly more than half a percentage point (mean absolute revision between first estimate and final quarterly result in a year-on-year comparison) is a justifiable uncertainty, as is also shown by international comparisons. See also the OECD comparative study on Main Economic Indicators (MEI) Revisions Database, August 2007. When interpreting the revision measures, it must be taken into account that a rather considerable part of the need for revision established in the context of major revisions of national accounts are due to methodological reasons and thus cannot really be attributed to data quality in the narrow sense.
More detailed information on national accounts revisions are available on the internet at www.destatis.de/EN > Facts &figures > National accounts > Methodology.

ESS Handbook for Quality Reports eurostat 78
Quality and Performance Indicators
A6. Data revision – average rate for Producers of statistics
General description: The average over a time period of the revisions of a key item. The "revision" is defined as the diference between a later and an earlier estimate of the key item.
ESS level
The above applies equally to revisions of European level data.
Revision policies and patterns in all Member States should be summarised with the main focus on how they affect published data at the European level.
Summary
What should be included on Revisions
• The revision policy. • The number of revisions (planned and unplanned). • The average size of revisions (one or more measures).
• The main reasons for revisions, and the extent to which the revisions improved accuracy.
3.9.6 Subject-dependent Techniques for Evaluation For any particular type of statistical process there are unique opportunities for error checking and evaluation. This section gives a few examples, mostly to inspire producers to invent other methods, similar or not, that are suitable for their particular statistical processes. Creativity is certainly a virtue in this field.
Mirror statistics. The classical example of mirror statistics is for foreign trade. In principle, Country A’s exports to country B over a certain period must equal country B’s imports from country A. In practice, the comparison is blurred by a factors such as valuation (cif/fob), timing (arrival at B may be later than departure from A), and classification differences. However, adjustments for these factors can usually be made so that the extent of the actual errors can be more or less accurately determined.
Another case where mirror statistics can be of use is for statistics on migration.
Unexplained variation over time in event-reporting. In event-reporting statistics, there is normally some stability in reporting patterns from the relevant authorities (police, hospitals, customs, etc). Lags in reporting or failure to report by a particular local institution cause undercoverage. It is simple to keep track of the reports from each institution subject to the reporting obligation. If this is done irregularities in the number of reports give rise to suspicion that something is wrong and corrective action can be taken.
Reasonability arguments. In all statistics, subject-matter knowledge on what is possible and reasonable is a useful tool. Often, all that is needed is a creative use of common sense. A more intricate example of such an argument is used in price statistics as described in the following example.

eurostat ESS Handbook for Quality Reports 79
Example 3.9.6.A: A control statistic based on a reasonability argument.
For a certain product in a Consumer Price Index, one could compute a raw average price for all observations in any given month. The ratio between such average prices between two months could be called the raw price index, which will differ from the actual price index due to implicit or explicit quality adjustments. Now the following statistic can be calculated
IQI=Implicit quality index =(raw price index)/(actual price index).
If the quality adjustments are correct and the IQI shows an increase of 10 %, then this implies that there has been a 10 % quality improvement in the product concerned. This could then be tested against the general consumer experience, which may for example be that quality improvements have occurred for high-tech goods (PCs, cars, TVs, stereos etc.) but not for non-technical goods such as clothing and household utensils.
ESS Handbook for Quality Reports eurostat 80
4 Timeliness and Punctuality
4.1 ESS Quality Definitions
Timeliness describes the length of time between data availability and the event or phenomenon they describe.
ESS Guidelines: Provide, for annual or more frequent releases, the average production time for each release of data and the reasons for possible long production times and efforts to improve the situation described, together with the TP1 and TP2 indicators explained for users.
Applicable for Eurostat: - National data deliveries: the agreed time frame for deliveries should be included as well as the achieved dates for deliveries during a past period. Describe the TP2 indicator for users.
Punctuality is the time lag between the actual delivery of data and the target date on which they were scheduled for release as announced in an official release calendar, laid down by Regulations or previously agreed among partners.
ESS Guidelines: Provide, for annual or more frequent releases:
• The percentage of releases delivered on time, based on scheduled release dates.
• The reasons for non-punctual releases explained and efforts to improve the situation described and the TP3 indicator, calculated and described for users.
National data deliveries to Eurostat: The agreed time frame for deliveries should be included as well as the achieved dates for deliveries during a past period. Where there are several stages of publication (e.g., preliminary and final results) all should be included.
4.2 For all statistical processes
Timeliness is relatively easy and straightforward to measure. A common measure is the production time measured from the end of the reference period (or point to which the data refer) to the day of release, averaged over a number of process implementations. The maximum production time is also useful by providing the worst recorded case. Average timeliness is meaningful for releases that are annual or more frequent.
Presentation of punctuality is likewise simple. The most relevant measure is the percentage of releases delivered on time, according to scheduled release dates laid out in Regulations, official timetables or other agreements. Such percentages are meaningful for releases that are annual or more frequent.
Some statistics are released in several versions, for example preliminary, revised and final. In this case each release then has its own timeliness and punctuality profile. The releases should be distinguished and separately presented in the quality report.
Where quality standards have been set up in domain specific regulations and the like, they can be used for benchmarking, for example by taking the ratio of, or difference between, the actual production time and the specified standard production time.
The reasons for possible long production times and non-punctual releases should be explained and efforts to improve the situation described.
eurostat ESS Handbook for Quality Reports 81
ESS level
Two aspects of timeliness and punctuality should be dealt with:
• National data deliveries to the ESS (see above)
• Publications from the ESS to the public. This should follow the same pattern as for national reporting, so the guidelines above are applicable here as well.
Example 4.2.A: National Accounts Quality Report (Statistisches Bundesamt2, 2013, p. 9)
Timeliness
The quarterly gross domestic product (GDP) is initially published in a GDP first release after about 45 days. This is followed by more detailed results in a press release published about 55 days after the end of the reference quarter (that is, for the first quarter of a year in May, for the second quarter in August, for the third quarter in November and for the fourth quarter in February). On those occasions, the previous results of the last few quarters – in August those of the last four years – are updated, too. The first annual result is published at a press conference in January, about 15 days after the end of the reference year. Although the legally binding European standards (t+70) thus are definitely more than met by German national accounts, the revisions caused by that are justifiable. However, there is a trade-off between timeliness and accuracy, that is, lower accuracy in the form of more need for revision is the price of more rapid calculation and earlier publication.
Generally, the last four years including the relevant quarters are revised in August of each year. The results of the earliest of the years become final at that status of calculation and need not be revised regularly any more. For example, the results of reference year 2008 became final in August 2012, subject to future major revisions. Such regular revisions are necessary to include into the national accounting system large-scale annual statistics whose results become available with some time lag from the end of the reference period. The results of these source statistics replace the data at the recent end of the series which was until then obtained partly through indicator-based calculations.
Punctuality
The release dates to be reported to Eurostat and the IMF are indicated in the annual release calendar of the Federal Statistical Office for major economic indicators one year in advance. In the past, those deadlines were always met.
Example 4.2.B: Labour Force Survey Quality and Methodology Information Report (UK Office for National Statistics, 2011, p. 3)
Timeliness and Punctuality
For the LFS, the time lag between the delivery date of data and the end of the reference period is approximately 16 days, and the elapsed time between the end of the reference period and the publication date is approximately six weeks. Publication takes place strictly in accordance with published release dates for Labour Market Statistics, following the Code of Practice for Official Statistics. The publication date has never been missed. Timeliness on a continuous survey such as the LFS should be carefully compared against surveys or administrative series which report on a point or only part of the reference period, particularly in regard to issues around discontinuities in the data (see the Labour Force Survey User Guide Volume 1: LFS Background and Methodology for guidance:
http://www.ons.gov.uk/ons/search/index.html?newquery=LFS+user+guides)
The frequency of LFS output is:
ESS Handbook for Quality Reports eurostat 82
1973 -1983 Biennially
1984 -1991 Annually
1992 - 2006 Seasonal quarters ( December – February, March – May, June – August, September –
November)
2006 - present Calendar Quarters (January – March, April – June, July – September, October – December)
For more details on related releases, the UK National Statistics Publication Hub is available online and provides 12 months’ advance notice of release dates. If there are any changes to the pre-announced release schedule, public attention will be drawn to the change and the reasons for the change will be explained fully at the same time, as set out in the Code of
Practice for Official Statistics.
http://www.ons.gov.uk/ons/guide-method/ons-independence/publication-hub/index.html
http://www.ons.gov.uk/ons/guide-method/revisions/ons-compliance-statement/index.html
Key labour market statistics are published in the Labour Market Statistical Bulletin (LM SB), (previously called Labour Market Statistics First Release) first published in April 1998 (see February 1998 Labour Market Trends article, Improved Labour Market Statistics). The LM SB, which is published monthly, gives prominence to the ILO measure of unemployment,
as measured by the LFS over the administrative claimant count measure and draws together statistics from a range of sources to provide a more coherent picture of the labour market. The claimant count is not an alternative measure of unemployment. LFS results in the LM SB are published on a UK basis, 6 weeks after the end of the survey period, and relate to the average of the latest three-month period. For the latest release see (http://www.ons.gov.uk/ons/index.html).
Since April 1998, the Department of Enterprise, Trade and Investment (DETINI) have published a Northern Ireland Labour Market Statistics Release to the same timetable as publication of the Labour Market Statistics First Release
Quality and Performance Indicators
TP1. Time lag – first results General definition: the number of days (or weeks or months) from the last day of the reference period to the day of publication of first results.
TP2: Time lag - final results General definition: The number of days (or weeks or months) from the last day of the reference period to the day of publication of complete and final results.
TP3. Punctuality – delivery and publication for Producers of statistics
General definition: The number of days between the delivery/ release date of data and the target date on which they were scheduled for delivery/release.
To be further defined for subject-matter domain:
(i) the unit of time to use;
(ii) the most appropriate function for a number of publication instances.

eurostat ESS Handbook for Quality Reports 83
ESS level
(i) functions (average, maximum) of national TP1 or TP2 data,
(ii) TP1 or TP2 for ESS level publications.
It should be noted that requirements for punctuality vary widely for different types of statistics. Market-sensitive economic indicators are often published at an exact pre-announced date and time, and any delay or early disclosure is a severe drawback. A possible definition of the indicator in such a situation could be rate of instances where the effective publication was more than one minute early or late. In other less sensitive cases, the rate of instances where the preannounced day of publication was missed along with the average delay in number of days may be the most appropriate indicators.
Summary
What should be included on Timeliness and Punctuality
• For annual or more frequent releases: the average production time for each release of data. • For annual or more frequent releases: the percentage of releases delivered on time, based on scheduled release dates.
• The reasons for non-punctual releases explained.
ESS Handbook for Quality Reports eurostat 84
5 Coherence and Comparability
5.1 ESS Quality Definition
Coherence measures the adequacy of the statistics to be combined in different ways and for various uses.
Comparability is a measurement of the impact of differences in applied statistical concepts, measurement tools and procedures where statistics are compared between geographical areas or over time.
These concepts are further broken down into:
a) Coherence - cross domain Description: The extent to which statistics are reconcilable with those obtained through other data sources or statistical domains.
ESS Guidelines: Describe the differences of the statistical outputs in question to other related statistical outputs (incl. main differences in concepts and definitions, statistical unit or object, classification (nomenclature) used, geographical breakdown, reference period, correction methods etc). The order of magnitude of the effects of the differences should be assessed as well. For each output the report should contain an assessment of incoherence in terms of possible sources and their impacts.
b) Coherence - sub annual and annual statistics Description: The extent to which statistics of different frequencies are reconcilable.
ESS Guidelines: Coherence between subannual and annual statistical outputs is a natural expectation but the statistical processes producing them are often quite different. Compare subannual and annual estimates and, eventually, describe reasons for lack of coherence between subannual and annual statistical outputs.
c) Coherence - National Accounts Description: The extent to which statistics are reconcilable with National Accounts.
ESS Guidelines: Where relevant, the results of comparisons with the National Account framework and feedback from National Accounts with respect to coherence and accuracy problems should be reported and should be a trigger for further investigation.
d) Coherence - internal Description: The extent to which statistics are consistent within a given data set. ESS Guidelines: Each set of outputs should be internally coherent: if statistical outputs within the data set in question are not consistent, any lack of coherence in the output of the statistical process itself should be stated as well as the reasons for publishing such results. For example it may occur that the process actually comprises data from different sources. In above circumstances a brief explanation should be given.
e) Comparability - geographical Description: The extent to which statistics are comparable between geographical areas.
eurostat ESS Handbook for Quality Reports 85
ESS Guidelines: Describe any problems of comparability between countries or regions. The reasons for the problems should be described and as well an assessment (preferably quantitative) of the possible effect of each reported difference on the output values should be done. Information on discrepancies from the ESS/ international concepts and definitions should be included. Differences between the statistical process and the corresponding European regulation/standard and/or international standard (if any) should be reported. Also asymmetries for statistical mirror flows should be described.
For Eurostat:
• Comparability over region may be assessed in two different ways: pair-wise comparisons of the metadata across regions; and comparison of metadata for the region with a standard, in particular an ESS standard or, in its absence, an example of best practice from one of the NSIs.
• A comparability matrix summarising by region the possible sources of lack of comparability relative to a specified standard should be given
f) Comparability - over time Description: The extent to which statistics are comparable or reconcilable over time.
ESS Guidelines: Provide information on possible limitations in the use of data for comparisons over time. In assessing comparability over time the first step is to determine (from the metadata) the extent of the changes in the underlying statistical process that have occurred from one period to the next. There are three broad possibilities:1. There have been no changes, in which case this should be reported 2. There have been some changes but not enough to warrant the designation of a break in series 3. There have been sufficient changes to warrant the designation of a break in series. In the second and third cases, the changes and their probable impacts should be reported. Particularly in the third case provide information on the length of comparable time series, reference periods at which series breaks occur, the reasons for the breaks and treatments of them.
5.2 For all statistical processes
European statistics should be consistent internally, over time and comparable between regions and countries; it should be possible to combine and make joint use of related data from different sources.
When originating from different sources, and in particular from statistical surveys using different methodology, statistics are often not completely identical, but show differences in results due to different approaches, classifications and methodological standards. There are several areas where the assessment of coherence is regularly conducted: between provisional and final statistics, between annual and short-term statistics, between statistics from the same socio-economic domain, and between survey statistics and national accounts.
Comparability aims at measuring the impact of differences in applied statistical concepts, definitions, measurement tools and procedures on the comparison of statistics between geographical areas, non-geographical dimensions, sectoral domains or over time. Comparability of statistics, i.e. their usefulness in drawing comparisons and contrast among different populations, is a complex concept, difficult to assess in precise or absolute terms. In

ESS Handbook for Quality Reports eurostat 86
general terms, it means that statistics for different populations can be legitimately aggregated, compared and interpreted in relation to each other or against some common standard. Metadata must convey such information that will help any interested party in evaluating comparability of the data, which is the result of a multitude of factors.
Typically, different sets of data elements are gathered by different processes, for example employment data are obtained by a monthly survey of employing enterprises and production data by monthly survey of manufacturing enterprises. Thus, the term coherence is usually used when assessing the extent to which the outputs from different statistical processes have the potential to be reliably used in combination, whereas comparability is used when assessing the extent to which outputs from (nominally) the same statistical process but for different time periods and/or for different regions have the potential to be reliably used in combination. More specifically in the example above, the validity of the combined use of employment data and production data for the same population and time period is said to depend upon their coherence, whereas the validity of the combined use of employment data for the same population and region but different time periods depends upon their comparability.
It is worth reiterating that although the coherence/comparability is considered a property of statistical outputs, it depends upon, and is assessed entirely in terms of, the statistical processes that produce those outputs.
5.3 Reasons for Lack of Coherence/Comparability
The possible reasons for lack of coherence/ comparability of the outputs of statistical processes may be summarised under two broad headings - differences in concepts, and differences in methods. Either or both of these may be a result of changes in the statistical process(es) as they are modified over time. Modifications may occur for a whole variety of reasons – introducing improved questionnaires, methods, automation, new technology, more up to date classifications, or in response to changes in legislation, or as a result of contractions or expansions in budget and hence in sample size or follow-up capacity, etc . For example, when Finland changed the data collection medium of the Labour Force Survey from postal enquiries to personal interviewing in 1983 the result was an increase of 100,000 in the estimate of employed people.
The possible reasons for lack of coherence/ comparability may be further broken down by type as described and exemplified below.
5.3.1 Possible differences in concepts: Target population – units and coverage
The target populations may differ for two statistical processes, or for the same process over time, in a variety of different ways, as illustrated in the following examples.
• The definition of economically active population used in the labour force survey may differ from one Member State to another. In one country it might be all persons aged 16-65 who are employed or seek employment, in another country all persons aged 15-70 who are employed or seek employment.
• Persons waiting to start a new job are counted as unemployed in the EU standard Labour Force Survey but as employed in the US Current Population Survey. This has resulted in a difference of 0.23% in unemployment rate (Sorrentino, 2000).
eurostat ESS Handbook for Quality Reports 87
• Monthly statistics of industry might include just manufacturing enterprises whereas another statistical output with the same name might include manufacture and electricity, gas and water production as well.
• An annual structural business survey might use an enterprise as its target statistical unit whereas a monthly production survey might use a kind of activity unit or legal unit.
Geographical coverage
For example, rural areas may be included in one country’s labour force survey and excluded from another’s.
Reference period
For example:
• in a survey of employees the enterprise might be asked for the number of full time employees as of third Monday in the month or as of the first of the month;
• an annual survey may refer to a fiscal year beginning in March, another to a calendar year.
Data item definitions, classifications
As an example of a difference in definitions, the labour force survey definition of unemployed person might be:
• Any economically active person who does not work, is actively looking for a job and is available for employment during the survey; or
• Any economically active person who does not work, is actively looking for a job and is or will be available for employment in the period of up to two weeks after the survey’s reference week Changes in classification schemes, in particular revisions in accordance with new versions of international standards, are a very common cause of coherence/ comparability problems. An example would be adoption of the latest version of NACE in place of an older classification of economic activities.
In addition, even without a change in classification, the procedures for assigning classification codes may be different or change over time, for example with improved training of staff or the introduction of an automated or computer assisted schemes.
5.3.2 Possible differences in methods: Frame population
Whatever the survey target units, the actual coverage of a survey depends upon the frame used for the survey. Possible examples of differences are as follows.
• In one case, enterprises with less than 5 employees might be excluded, in another case all enterprises included.
• A more substantive difference would occur where one frame was based on value added tax, i.e., a source covering all enterprises paying VAT, whereas another frame was
ESS Handbook for Quality Reports eurostat 88
based on employment deductions, i.e., a source covering all enterprises with employees subject to tax deductions.
• The legal requirements for VAT registration may change, resulting in more or fewer enterprises in survey frames.
• Surveys may be designed as cross sectional or longitudinal with significant difference in estimates of change as a result. Even within a longitudinal survey, panels or rotation patterns may change over time or between countries.
• Even without any nominal difference in statistical units, the procedures by which statistical units for large enterprises are actually delineated may differ, or change over time in accordance with better training or new methods. For example the procedures for treatment of the creation, amalgamation, merger, split, or cessation of an enterprise may change.
Source(s) of data and sample design
An example of a difference might be that in one statistical structural survey financial data for small enterprises was obtained from income tax data whereas in another it was obtained by direct survey.
Data collection, capture and editing
In one case there might be intensive follow-up of non–response and consequential reduction of non-response rate to 10%, in another there are no resources for follow-up and the non-response rate is 40% thus giving rise to a substantially increased probability of non-response bias. As noted above, if the probable biases due to non-response errors have been reported under Accuracy for both surveys then this would not need to be repeated as a comparability/coherence issue
Imputation and estimation
Different imputation methods may be used for dealing with missing data items. For example in one survey zeroes may be imputed for missing financial items whereas in another survey non-zero values may be imputed based on a “nearest neighbouring” record. Likewise in dealing with missing records in an enterprise survey there are various options, such as assuming the corresponding enterprises are non-operational or assuming they are similar to enterprises that have responded.
Crossover between Definitions of Coherence/Comparability and Accuracy
When bringing together outputs from two statistical processes, or the same process over time or across regions, the errors occurring (i.e., lacks of accuracy) in the processes have the potential to cause numerical inconsistency of the corresponding estimates. This can easily be confused with a lack of coherence/comparability. In other words, accuracy and coherence/comparability can easily be confounded.
The distinction made in this document is that coherence/comparability refers to, and is measured in terms of descriptive (design) metadata (i.e., concepts and methods) about the processes, whereas accuracy is measured and assessed in terms of operational metadata (sampling rates, data capture error rates, etc.) associated with the actual operations that

eurostat ESS Handbook for Quality Reports 89
produced the data. With this understanding coherence/comparability may be assessed in terms of the design metadata and accuracy in terms of operational metadata. It is also quite clear that the differences between preliminary, revised and final estimates generated by the same basic process relate to accuracy problems rather than coherence.
Where the error profiles of the statistical processes are known and included within the description of accuracy there is no need for further reference to them under coherence/ comparability. For example, suppose sampling error bounds are published for two values of the same data item for adjacent time periods indicating the range within which a movement from one period to the next may be due to chance alone and not reflect any actual change in the phenomenon being measured. If and only if the measured movement is larger than this, is there any point in discussing whether the movement is real or due to lack of comparability.
However, where the error profiles are not fully and precisely known (and they rarely are), errors in the estimates may be confounded with the effects of lack of coherence/ comparability. Thus, in so far as the accuracy descriptions do not take into account the errors that may occur, the possibilities of these errors have to be included in the account of coherence/comparability. For example, if there is no assessment of non-response error then the assessment of coherence/comparability has to include the possible consequences of differential non-response rates and patterns.
Another way of viewing the relationship between coherence/comparability and accuracy is to note that the numeric consistency of estimates depends upon two factors:
• the logical consistency (which we call coherence/ comparability) of the processes that generated those estimates; and
• the errors that actually occurred in those processes in generating the estimates. Thus, coherence/comparability is a prerequisite for numerical consistency. The degree of coherence/ comparability determines the potential for numerical consistency. It does not guarantee numerical consistency as this depends also upon the errors.
5.4 Assessment and Reporting
Methods for assessing and reporting coherence/ comparability are presented in the following paragraphs in two groups, first general methods that apply to all type of coherence/ comparability and subsequently those methods that are specific to a particular type.
5.4.1 General Approach The cause of any lack of coherence/comparability whether due to changes in concepts or methods or both should be clearly explained. In this situation the producer should facilitate reconciliation of the estimates by quantifying, at least approximately, the effects of the main sources of incoherence/ incomparability. The minimum requirement is that each instance is indicated in the quality report and that the reason for it and its order of magnitude is stated according to the producer’s best knowledge.
Any general changes that have occurred that may have impact on coherence/ comparability should be reported, for example changes in legislation affecting data sources or definitions, re-engineering or continual improvement of statistical processes, changes in operations resulting from reductions or increases in processing budget, etc.
Deviations from relevant ESS legislation and other international standards that could affect coherence/ comparability should be reported
ESS Handbook for Quality Reports eurostat 90
As previously noted, statistical outputs that describe the same phenomenon may be coherent, and yet not present identical values because of the errors that occur.
Concepts and methods should be presented in the quality report in the introduction or relevance chapters or as part of the error profile descriptions in the accuracy chapter. Under coherence/ comparability the report should make as clear as possible to what causes a given problem can be attributed. Ideally, the sources of incoherence/ non-comparability should be quantitatively decomposed by each possible source. If this is possible the corresponding sets of statistical outputs are reconcilable. Although this is usually not fully attainable, the quality report should as be as informative as possible with this goal in mind.
More precisely, for the statistical process(es) in question, the first step is to conduct a systematic assessment of possible reasons (as listed in Section 6.7) for lack of coherence/ comparability. The assessment should be based primarily on examination of the key metadata elements, and identification and analysis of differences. Looking at the data themselves may provide some indication of the likely magnitude of any lack of coherence/ comparability but not of its causes.
For each difference in metadata, for example differing frame populations, the next step is to deduce the likely effect of such a difference on the statistical outputs. The final step is to aggregate and summarise in some way the total possible effect, in other words to form an impression of the degree of (lack of) coherence/ comparability.
5.4.2 Coherence – cross domain As previously noted, the domains over which comparisons may be made include economic activity group, occupational group, and sex. The methods of assessment and reporting are similar to those used for comparability over region. Again there is a useful distinction to be made between situations where essentially the same statistical instrument is used, for example a direct survey, and those where different instruments are used.
Example 5.4.2.A: Coherence between the Norwegian Structure of Earnings Survey and the Labour Force Survey (Lien et al, 2009, p. 17-19)
6.3. Coherence with the Labour Force Survey (LFS) 3rd quarter 2006
The following is a short presentation and comparison of the Norwegian SES and the Norwegian LFS surveys. It is important to point out basic differences that possibly could be the cause of differences between the surveys as they are observed in the following tables. Statistics from the LFS are based on published figures.
6.3.1. Comparison of basic information on model assumption, sampling, units and purpose
In the following three short chapters, several basic aspects of the LFS and SES are compared. One of the main reasons for different surveys is to meet different needs. Consequently, the statistics are based on assumptions that meet these specific user needs. The LFS survey monitors and documents quarterly changes in the composition and distribution of the work force. It is based on a sample survey covering individuals (the sample unit is family) that report on their status in the work force.
The earnings statistics on the other hand are structured to answer questions concerning the level and distribution of earnings. As described earlier, the source is a sample of enterprises that reports on employees. There is significant overlap between the populations of the two surveys, but the source of information is different and so are the sampling models. Furthermore, the two surveys have different reference periods and utilize different sources for control, verification and finally dissemination.
Both statistics are nonetheless used for explaining different properties of the same field of interest and in this capacity we can use the LFS to understand the distribution and composition of jobs and employees as they are described in the earnings survey. Discrepancies should, where they occur, be explained and understood as a consequence of overlapping information.
6.3.1.1. Population and sampling units
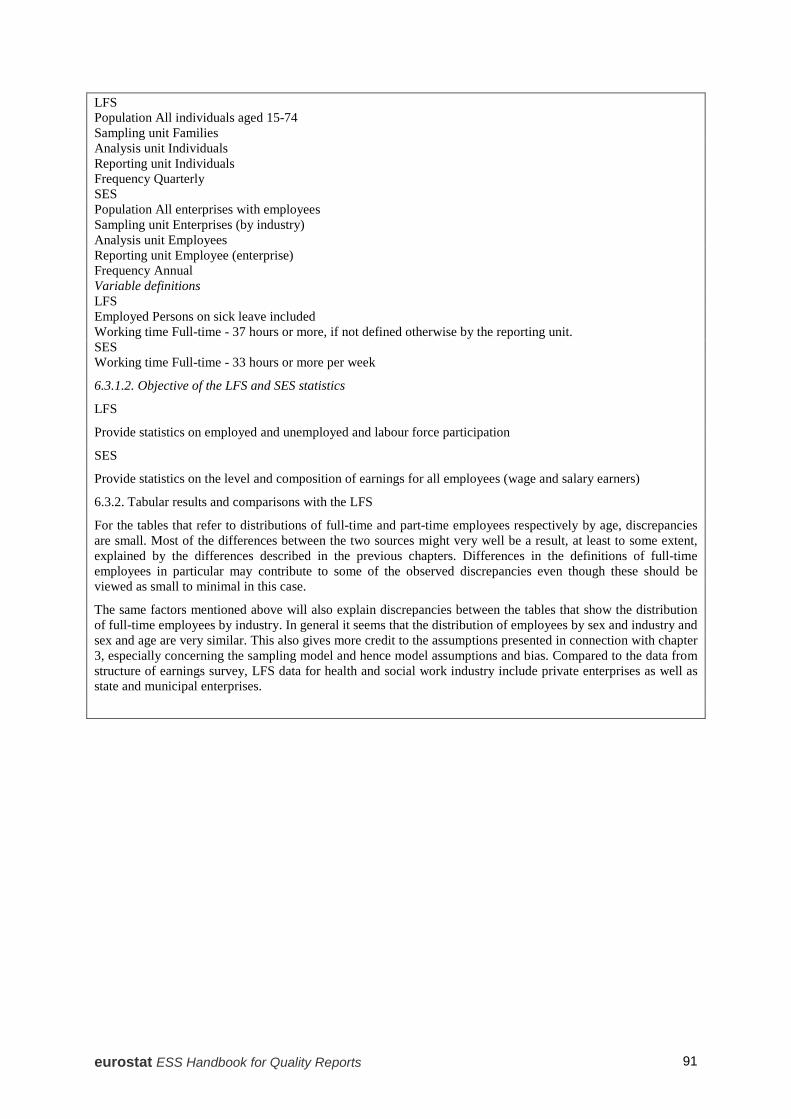
eurostat ESS Handbook for Quality Reports 91
LFS Population All individuals aged 15-74 Sampling unit Families Analysis unit Individuals Reporting unit Individuals Frequency Quarterly SES Population All enterprises with employees Sampling unit Enterprises (by industry) Analysis unit Employees Reporting unit Employee (enterprise) Frequency Annual Variable definitions LFS Employed Persons on sick leave included Working time Full-time - 37 hours or more, if not defined otherwise by the reporting unit. SES Working time Full-time - 33 hours or more per week
6.3.1.2. Objective of the LFS and SES statistics
LFS
Provide statistics on employed and unemployed and labour force participation
SES
Provide statistics on the level and composition of earnings for all employees (wage and salary earners)
6.3.2. Tabular results and comparisons with the LFS
For the tables that refer to distributions of full-time and part-time employees respectively by age, discrepancies are small. Most of the differences between the two sources might very well be a result, at least to some extent, explained by the differences described in the previous chapters. Differences in the definitions of full-time employees in particular may contribute to some of the observed discrepancies even though these should be viewed as small to minimal in this case.
The same factors mentioned above will also explain discrepancies between the tables that show the distribution of full-time employees by industry. In general it seems that the distribution of employees by sex and industry and sex and age are very similar. This also gives more credit to the assumptions presented in connection with chapter 3, especially concerning the sampling model and hence model assumptions and bias. Compared to the data from structure of earnings survey, LFS data for health and social work industry include private enterprises as well as state and municipal enterprises.
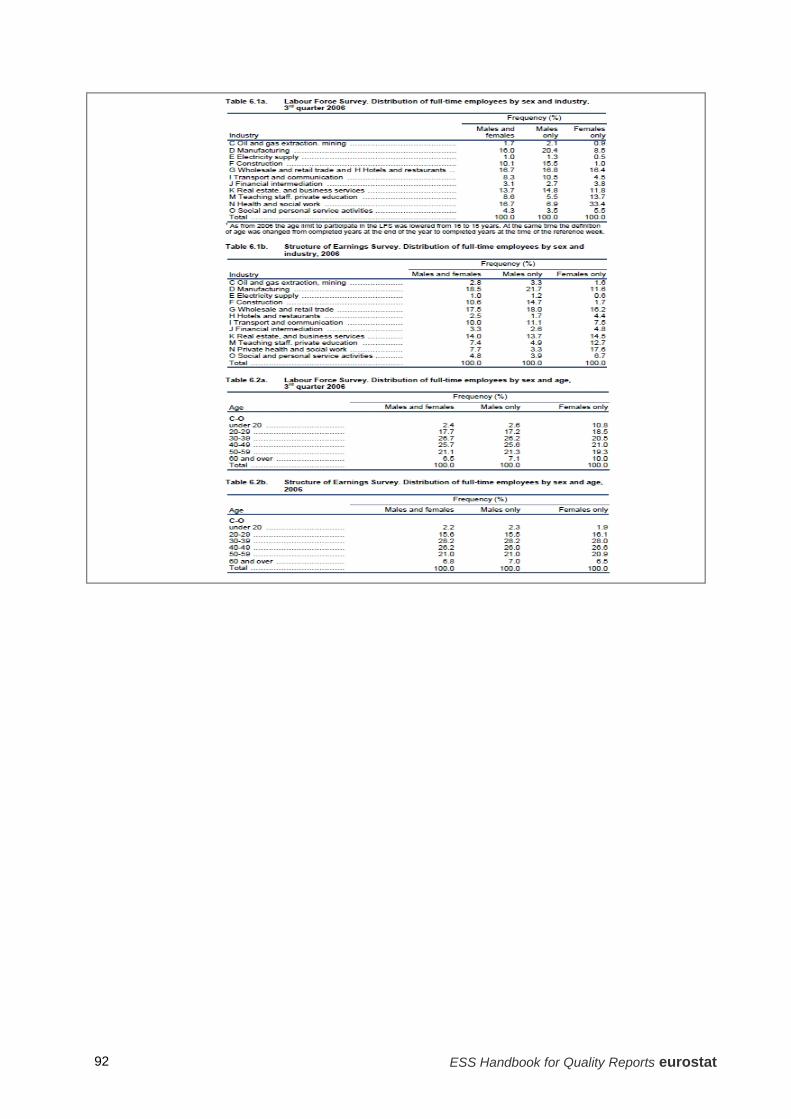
ESS Handbook for Quality Reports eurostat 92
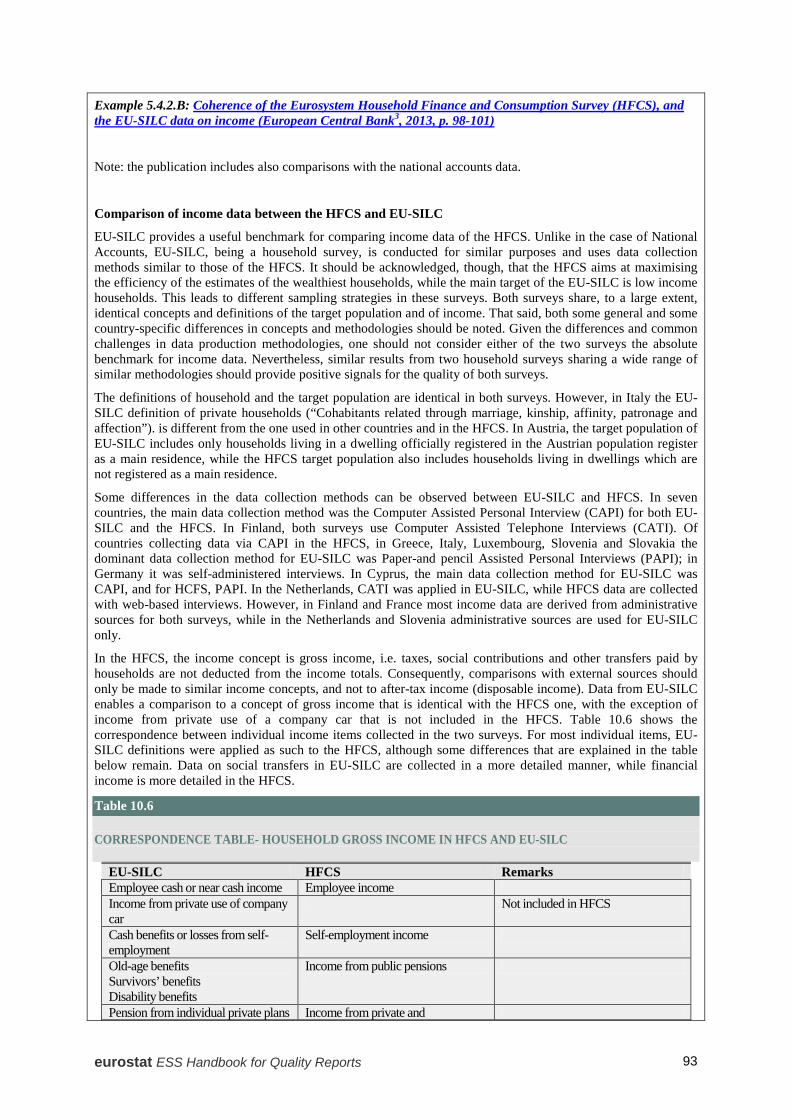
eurostat ESS Handbook for Quality Reports 93
Example 5.4.2.B: Coherence of the Eurosystem Household Finance and Consumption Survey (HFCS), and the EU-SILC data on income (European Central Bank3, 2013, p. 98-101)
Note: the publication includes also comparisons with the national accounts data.
Comparison of income data between the HFCS and EU-SILC
EU-SILC provides a useful benchmark for comparing income data of the HFCS. Unlike in the case of National Accounts, EU-SILC, being a household survey, is conducted for similar purposes and uses data collection methods similar to those of the HFCS. It should be acknowledged, though, that the HFCS aims at maximising the efficiency of the estimates of the wealthiest households, while the main target of the EU-SILC is low income households. This leads to different sampling strategies in these surveys. Both surveys share, to a large extent, identical concepts and definitions of the target population and of income. That said, both some general and some country-specific differences in concepts and methodologies should be noted. Given the differences and common challenges in data production methodologies, one should not consider either of the two surveys the absolute benchmark for income data. Nevertheless, similar results from two household surveys sharing a wide range of similar methodologies should provide positive signals for the quality of both surveys.
The definitions of household and the target population are identical in both surveys. However, in Italy the EU-SILC definition of private households (“Cohabitants related through marriage, kinship, affinity, patronage and affection”). is different from the one used in other countries and in the HFCS. In Austria, the target population of EU-SILC includes only households living in a dwelling officially registered in the Austrian population register as a main residence, while the HFCS target population also includes households living in dwellings which are not registered as a main residence.
Some differences in the data collection methods can be observed between EU-SILC and HFCS. In seven countries, the main data collection method was the Computer Assisted Personal Interview (CAPI) for both EU-SILC and the HFCS. In Finland, both surveys use Computer Assisted Telephone Interviews (CATI). Of countries collecting data via CAPI in the HFCS, in Greece, Italy, Luxembourg, Slovenia and Slovakia the dominant data collection method for EU-SILC was Paper-and pencil Assisted Personal Interviews (PAPI); in Germany it was self-administered interviews. In Cyprus, the main data collection method for EU-SILC was CAPI, and for HCFS, PAPI. In the Netherlands, CATI was applied in EU-SILC, while HFCS data are collected with web-based interviews. However, in Finland and France most income data are derived from administrative sources for both surveys, while in the Netherlands and Slovenia administrative sources are used for EU-SILC only.
In the HFCS, the income concept is gross income, i.e. taxes, social contributions and other transfers paid by households are not deducted from the income totals. Consequently, comparisons with external sources should only be made to similar income concepts, and not to after-tax income (disposable income). Data from EU-SILC enables a comparison to a concept of gross income that is identical with the HFCS one, with the exception of income from private use of a company car that is not included in the HFCS. Table 10.6 shows the correspondence between individual income items collected in the two surveys. For most individual items, EU-SILC definitions were applied as such to the HFCS, although some differences that are explained in the table below remain. Data on social transfers in EU-SILC are collected in a more detailed manner, while financial income is more detailed in the HFCS.
Table 10.6 CORRESPONDENCE TABLE- HOUSEHOLD GROSS INCOME IN HFCS AND EU-SILC
EU-SILC HFCS Remarks Employee cash or near cash income Employee income Income from private use of company car
Not included in HFCS
Cash benefits or losses from self-employment
Self-employment income
Old-age benefits Survivors’ benefits Disability benefits
Income from public pensions
Pension from individual private plans Income from private and
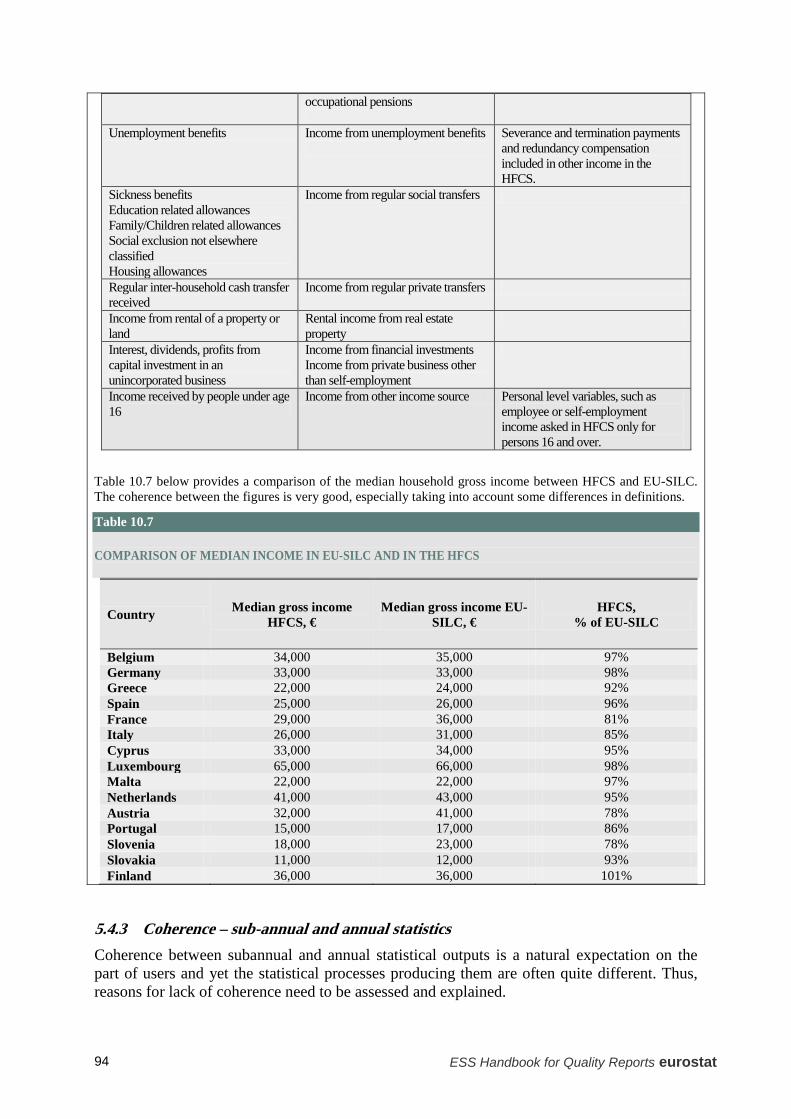
ESS Handbook for Quality Reports eurostat 94
occupational pensions
Unemployment benefits Income from unemployment benefits
Severance and termination payments and redundancy compensation included in other income in the HFCS.
Sickness benefits Education related allowances Family/Children related allowances Social exclusion not elsewhere classified Housing allowances
Income from regular social transfers
Regular inter-household cash transfer received
Income from regular private transfers
Income from rental of a property or land
Rental income from real estate property
Interest, dividends, profits from capital investment in an unincorporated business
Income from financial investments Income from private business other than self-employment
Income received by people under age 16
Income from other income source Personal level variables, such as employee or self-employment income asked in HFCS only for persons 16 and over.
Table 10.7 below provides a comparison of the median household gross income between HFCS and EU-SILC. The coherence between the figures is very good, especially taking into account some differences in definitions.
Table 10.7 COMPARISON OF MEDIAN INCOME IN EU-SILC AND IN THE HFCS
Country Median gross income HFCS, €
Median gross income EU-SILC, €
HFCS, % of EU-SILC
Belgium 34,000 35,000 97% Germany 33,000 33,000 98% Greece 22,000 24,000 92% Spain 25,000 26,000 96% France 29,000 36,000 81% Italy 26,000 31,000 85% Cyprus 33,000 34,000 95% Luxembourg 65,000 66,000 98% Malta 22,000 22,000 97% Netherlands 41,000 43,000 95% Austria 32,000 41,000 78% Portugal 15,000 17,000 86% Slovenia 18,000 23,000 78% Slovakia 11,000 12,000 93% Finland 36,000 36,000 101%
5.4.3 Coherence – sub-annual and annual statistics Coherence between subannual and annual statistical outputs is a natural expectation on the part of users and yet the statistical processes producing them are often quite different. Thus, reasons for lack of coherence need to be assessed and explained.
eurostat ESS Handbook for Quality Reports 95
A starting point for assessing the likely magnitude of differences due to lack of coherence is to compare subannual and annual estimates:
If both annual and subannual series measure levels then annual aggregates can be constructed from subannual estimates and compared to totals from the annual series;
If one or other of the series produces only growth rates not levels, then comparison can be made of year over year growth rates.
If the differences thereby observed cannot be fully explained in terms of sampling error or other measure of accuracy then their explanation requires assessment of the possible causes by metadata comparison, as for all forms of coherence assessment.
5.4.4 Coherence – National Accounts As previously noted, the National Accounts compilation process is a method for detecting lack of coherence in data received from its various source statistical processes, whether they be direct surveys, register based surveys or indexes. Feedback from the National Accounts on the degree of incoherence and the adjustments that had to be made in order to bring the accounts into balance are excellent indicators of the accuracy and/or coherence of the statistical outputs received. They should be reported and should be a trigger for further investigation.
Example 5.4.4.A: Coherence between the UK Gross Value Added calculation in the Annual Business Survey and National Accounts (UK Office for National Statistics2, 2012, p. 60-63)
Comparison of ABS approximate GVA and National Accounts GVA
The Annual Business Survey (ABS) publishes an approximate measure of Gross Value Added at basic prices (aGVA).
Gross Value Added (GVA) at basic prices is output at basic prices minus intermediate consumption at purchaser prices. The basic price is the amount receivable by the producer from the purchaser for a unit of a good or service minus any tax payable plus any subsidy receivable on that unit.
There are differences between the ABS approximate measure of GVA and the measure published by National Accounts. National Accounts carry out scope adjustments, coverage adjustments, conceptual and value adjustments such as subtracting taxes and adding subsidies not included in the ABS measure, quality adjustments and coherence adjustments. The National Accounts estimate of GVA uses input from a number of sources, and covers the whole UK economy, whereas ABS does not include some parts of the agriculture and financial activities sectors, or public administration and defence. ABS total aGVA is two-thirds of the National Accounts whole economy GVA, because of these differences in scope, coverage and calculation.
No real (inflation-adjusted) estimates of regional GVA are published in the National Accounts, however, nominal (non-inflation-adjusted) regional GVA and approximate regional GVA at basic prices are published by Regional Accounts and ABS respectively.
The calculation of approximate GVA in ABS
Approximate GVA is calculated as follows. The variables in bold are those published in the ABS statistical releases. Other variables are available on request from [email protected].
aGVA = output at basic prices – intermediate consumption
= total turnover + movement in total stocks + work of a capital nature carried out by own staff + value of insurance claims received + other subsidies received + amounts paid in business rates + amounts paid in vehicle excise duty

ESS Handbook for Quality Reports eurostat 96
- total purchases - amounts received through the Work Programme (formerly the Welfare to Work Scheme) - total net taxes (note: for service industries, this is total taxes, not total net taxes) The National Accounts calculation of GVA
The official UK estimate of GVA published by National Accounts includes, in addition to the ABS variables:
• inclusion of own account work (i.e. work consumed by the producer, for example, farmers producing crops to feed their own animals, or computer software written in-house) and non-market output. These are conceptually out of scope of the ABS and are calculated from other survey data
• supplements to ABS data from other surveys and administrative sources, to cover the whole economy. This includes public corporations from company accounts and data on the public sector
• adjustments to output to account for income in kind, own account computer software, work in progress, and, for total sales, the addition of taxes less subsidies on production
• an undercoverage adjustment to output, to account for the one per cent of businesses not covered by the IDBR in terms of economic activity
• adjustments to intermediate consumption, including the addition of insurance premium supplements and financial intermediation services indirectly measured (FISIM)
These additional components account for the differences between the published values of GVA and aGVA.
Figure 9.1 and Figure 9.2 below show the size of the components of the National Accounts estimations of output and intermediate consumption. ABS total sales contribute the largest component of total output (around 70 per cent in 2010). Other key components of total output include non-market output and own account output. ABS total purchases contribute the largest component of intermediate consumption (around 80 per cent in 2010).
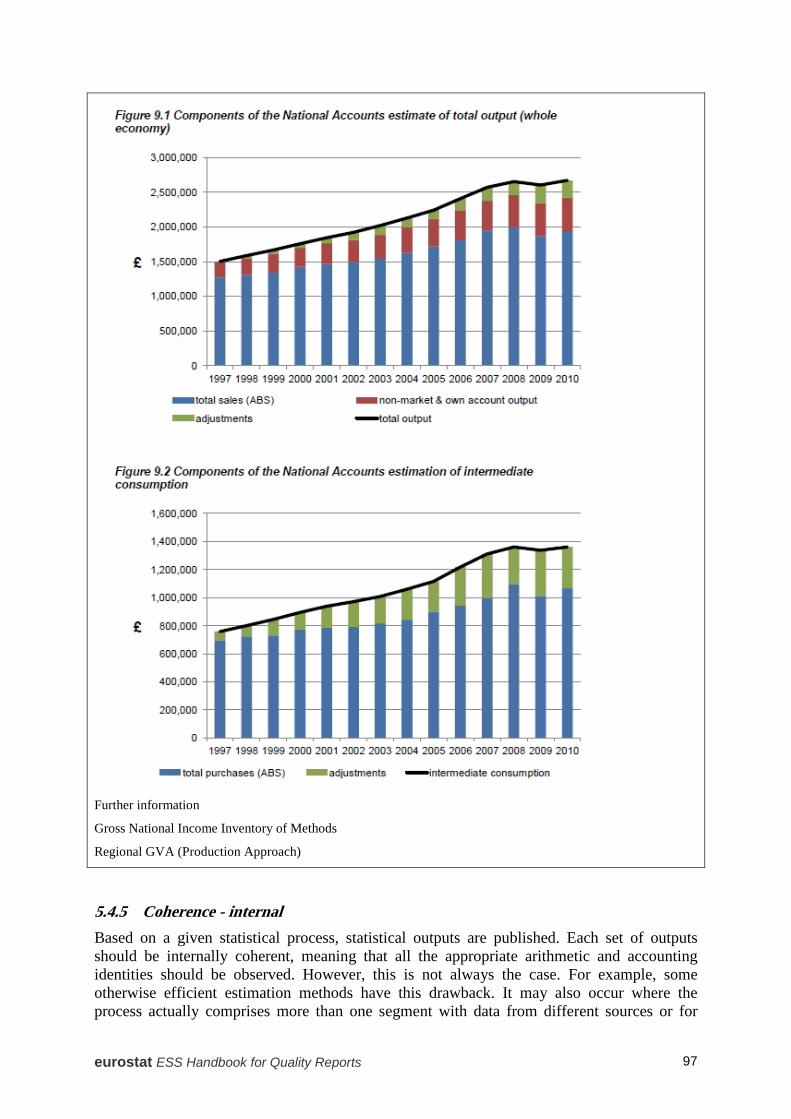
eurostat ESS Handbook for Quality Reports 97
Further information
Gross National Income Inventory of Methods
Regional GVA (Production Approach)
5.4.5 Coherence - internal Based on a given statistical process, statistical outputs are published. Each set of outputs should be internally coherent, meaning that all the appropriate arithmetic and accounting identities should be observed. However, this is not always the case. For example, some otherwise efficient estimation methods have this drawback. It may also occur where the process actually comprises more than one segment with data from different sources or for

ESS Handbook for Quality Reports eurostat 98
different units in each segment. In these circumstances a brief explanation should be given to users and also be reflected in a quality report, with the reasons for publishing non-coherent results explained.
5.4.6 Comparability -- geographical Comparability – geographical may be assessed in two different ways: pair-wise comparisons of the metadata across regions; and comparison of metadata for the region with a standard, in particular an ESS standard or, in its absence, an example of best practice from one of the NSIs.
Two broad categories of situation can be identified:
where essentially the same statistical processes are used, e.g., a labour force survey designed in accordance with ESS standard, and differences across regions are expected to be quite small; and
where a different sort of statistical process is used, for example a direct survey in one case and a register based survey in another. In such cases the differences are likely to be more profound.
To assess the overall impact of all the possible differences it may be worthwhile summarising the differences in terms of a scoring system. The most simple scoring scheme is to define the key metadata elements for which a difference could be significant and for each one to assign a binary score: no difference; difference. An overall impression of comparability can then be obtained by assigning a weighting to each key metadata element according to its potential effect on comparability and computing a weighted score across all metadata elements. Such an overall score would be useful not only in cross country comparisons but also in tracking a single process over time.
ESS level
Using a scoring scheme as described above is one way of summarising the results for all Members States in a matrix.
Mirror statistics
As previously noted in the section on the Subject-dependent Techniques for Evaluation of Accuracy (section 3.9.6), for certain selected statistical outputs from a Member State, notably in trade, balance of payments, migration and tourism, it may be possible to find counterpart statistical output in another Member State or country. For example the UK ONS may publish emigration from the UK to Australia and the Australian Bureau of Statistics may publish immigration from the UK.
Mirror statistics involve coherence, geographical comparability as well as accuracy issues. Having assessed the degree of lack of coherence, any difference in outputs that cannot be explained in terms of coherence are an indication of the lack of accuracy in either or both of the outputs and/or may reflect lack of comparability between the countries for the same data items.
eurostat ESS Handbook for Quality Reports 99
For example, if the UK estimate of emigration to Australia in a particular year exceeds that of the Australian estimate of immigration from the UK for the same year by 10% then this could reflect lack of accuracy in the form of overcounting in the UK or undercounting in Australia, and/or it may be the result of lack of comparability of UK and Australian definitions of immigration, or emigration, or both.
5.4.7 Comparability over Time Comparability over time is a crucial quality aspect for all statistical outputs published on a number of consecutive occasions. For many users, changes over time of economic or social phenomena are the most interesting aspects of the statistics, and comparability over time is essential if the data are to reflect the actual economic or social changes that occurred.
Regardless of whether statistics are directly published in time series form or whether the users have to construct their time series themselves from basic data, users need to be informed about possible limitations in the use of data for comparisons over time. This information also has to be included in the quality report.
In assessing comparability over time the first step is to determine (from the metadata) the extent of the changes in the underlying statistical process that have occurred from one period to the next. There are three broad possibilities:
1. There have been no changes, in which case this should be reported;
2. There have been some changes but not enough to warrant the designation of a break in series;
3. There have been sufficient changes to warrant the designation of a break in series.
In the second and third cases, the changes and their probable impacts should be reported.
In the second case, the effect of the change may be sufficiently small that is has negligible effect on outputs. The NSO may simply note it in metadata describing the process. Sometimes an effect may not be negligible but be too small to warrant a series break. In this case the NSI may wedge in the changes to the outputs over a period of time so that, between any two periods, the adjustments being made to move from old to new values is less than the sampling error and thus cannot by itself be detected and interpreted as a real change.
In the third case, users have to be informed that there has been break in series and provided with the information they need to deal with its consequences. The information provided may range from very complete to minimal depending upon the NSO resources available and the size of the break.
The most comprehensive treatment is to carry forward both series for a period of time and/or to backcast the series, i.e., to convert the old series to what it would have been with the new approach by duplicating the measurement in one time period using the original and the revised definitions/methods.
A less expensive treatment is to provide the users with transition adjustment factors giving them the means of dealing with the break for example by doing their own backcasting.
The least expensive treatment is to simply describe the changes that have occurred and provide only qualitative assessments of their probable impact upon the estimates. Obviously this is the least satisfactory from the user perspective

ESS Handbook for Quality Reports eurostat 100
Example 5.4.7.A: National Accounts revision changes in comparability over time (Statistics Finland, 2010)
( Note: this is only a small part of a lengthy comparison.)
Revision of national accounts time series 2010
Statistics Finland has revised its national accounts time series for the 1975-2008 period. The made revisions affect nearly all transactions, industries and sectors.
The revisions have been made necessary by new data in the source statistics, changes in the calculation methods and corrections of detected errors. This report elaborates on the most significant revisions made. In addition, the data concerning 2007 and 2008 were previously based on preliminary source statistics. The data on these years will continue to be preliminary and will become "final" when supply and use tables are being compiled.
National accounts for the 2003-2006 period, as well as volume changes for the 2004-2006 period are based on product-specific supply and use tables. Product-specific supply and use tables for the 2000-2002 period will be compiled during 2010 but they will not alter the data at current prices published here.
With certain exceptions, revisions of figures at current prices have mainly also been interpreted as volume changes rather than price changes.
Figures
GDP annual volume change %
GDP revision %

eurostat ESS Handbook for Quality Reports 101
Quality and Performance Indicators
CC1. Asymmetry for mirror flows statistics - coefficient General definition: The difference or the absolute difference of inbound and outbound flows between a pair of countries divided by the average of these two values.
It should be noted that in domains where there are mirror statistics it is possible to assess geographical comparability measuring the discrepancies between inbound and outbound flows for pairs of countries. Being a really quantitative measurement and not only the result of a count, this indicator represents an important assessment of the level of quality of the country data for the domains in which mirror statistics are available.
CC2. Length of comparable time series General definition: The number of reference periods in time series from last break.
It should be noted that the unit of measurement depends on the reference period of the survey (month, quarter, year etc.).
Summary What should be included on Coherence and Comparability
General
• Brief descriptions of all conceptual and methodological metadata elements that could affect coherence/ comparability. • An assessment (preferably quantitative) of the possible effect of each reported difference on the output values. • Differences between the statistical process and the corresponding European regulation/ standard
ESS Handbook for Quality Reports eurostat 102
and/or international standard (if any).
Comparability – geographical
• A quantitative assessment of comparability across regions based on the (weighted) number of differences in metadata elements.
• At ESS level, a coherence/comparability matrix summarising by region the possible sources of lack of comparability relative to a specified standard.
• Mirror Statistics: Assessment of discrepancies (if any).
Comparability – over time
• Reference periods at which series breaks (if any) occurred, the reasons for them and treatments of them.
Coherence – National Accounts
• Where relevant, the results of comparisons with National Account framework and feedback from National Accounts with respect to coherence and accuracy problems.
Internal Coherence
• Any lack of coherence in the output of the statistical process itself.
eurostat ESS Handbook for Quality Reports 103
6 Accessibility and Clarity, Dissemination Format
6.1 ESS Quality Definitions
Dissemination format refers to media, various means and formats by which statistical data and metadata are disseminated to users and their accessibility.
Accessibility and clarity refer to the simplicity and ease, the conditions and modalities by which users can access, use and interpret statistics, with the appropriate supporting information and assistance.
These concepts are further broken down into:
a) News release Description: Regular or ad-hoc press releases linked to the data.
ESS Guidelines: Regular or ad-hoc press releases linked to the data set in question should be described.
b) Publications Description: Regular or ad-hoc publications in which the data are made available to the public.
ESS Guidelines: The titles of publications using the data set in question should be listed, with publisher, year and link to on-line documents if available.
c) On-line database Description: Information about on-line databases in which the disseminated data can be accessed.
ESS Guidelines: The on-line database available for the data set in question should be described. This includes the domain names as released on the website and link to the on-line database.
d) Micro-data access Description: Information on whether micro-data are also disseminated.
ESS Guidelines: Describe if and how the data set is accessible as micro-data (e.g. for researchers). Also the micro-data anonymisation rules should be described in short.
e) Other Description: References to the most important other data dissemination done.
ESS Guidelines: The most important other data dissemination means should be described (e.g. within other publications, policy papers, etc.) and an overview of the different aspects of the dissemination practice and their impact on accessibility and clarity of the data should be stated. For Member States: Pricing policies and registration for database access and their likely effect on access should be described together with the limits on access set by confidentiality provisions and any other restrictions; dissemination of data to Eurostat and other international organisations (IMF, OECD, ... if applicable and not described under "S.7.1 Legal acts and other
ESS Handbook for Quality Reports eurostat 104
agreements"), and internal dissemination of data to other statistical activities within the NSI.
f) Documentation on methodology Description: Descriptive text and references to methodological documents available.
ESS Guidelines: Describe the availability of national reference metadata files, important methodological papers, summary documents or other important handbooks. Title, publisher, year and links to on-line documents if possible should be described.
g) Quality documentation Description: Documentation on procedures applied for quality management and quality assessment.
ESS Guidelines: Describe the availability of all quality related documents (quality reports, studies, etc). For Eurostat: The responsible statistical domain should also describe the availability of national quality reports. More detailed information about quality processes should be described in the SIMS subconcepts of Quality Assurance and Quality Assessment (cf. Annex 2) .
6.2 For all statistical processes
Accessibility is an attribute of statistics describing the set of conditions and modalities by which users can obtain data. According to the European Statistics Code of Practice, European statistics should be presented in a clear and understandable form, disseminated in a suitable and convenient manner, available and accessible on an impartial basis with supporting metadata and guidance.
Clarity is an attribute of statistics describing the extent to which easily comprehensible metadata are available, where these metadata are necessary to give a full understanding of statistical data. Clarity is sometimes referred to as "interpretability". It refers to the data information environment: whether data are accompanied by appropriate metadata, including information on their quality, and the extent to which additional assistance is provided to users by data providers. In the European Statistics Code of Practice, clarity is strictly associated to accessibility to form one single quality criteria: "accessibility and clarity": the conditions and modalities by which users can use and interpret data. European statistics should be presented in a clear and understandable form, disseminated in a suitable and convenient manner, available and accessible on an impartial basis with supporting metadata and guidance.
Dissemination format refers to the various means of dissemination used for making the data available to the public. It includes a description of the various formats available, including where and how to get the information (for instance paper, electronic publications, on-line databases).
Evaluation of accessibility can take a range of forms as accessibility is affected by the many aspects of dissemination practice, including:
• the dissemination channels;
• the form of the outputs - microdata or aggregates; and
• the pricing policies. The quality report should include a description of the various ways the statistical outputs can be accessed - in paper publications, through the Internet, etc. Pricing policies and their likely
eurostat ESS Handbook for Quality Reports 105
effect on access should be described together with the limits on access set by confidentiality provisions and any other restrictions.
Clarity depends upon the quality of statistical metadata that are disseminated alongside the statistical outputs. A summary description of these metadata (documentation, explanation, quality limitations, etc.,) should be included in the quality report.
Vale (2008) makes a number of useful points regarding both accessibility and clarity based on a division of users into occasional users (“tourists”) and more experienced, professional users (“harvesters” and “miners”). This division appears to be helpful especially for web-based publishing. “Tourists” typically prefer data in static formats so that they are easy to find and interpret. Therefore quality assessments for this group of users should focus on ease of access and search and on simple and clear presentation of data and accompanying metadata. “Harvesters” and “miners”, however, have rather different needs. Typically they prefer a database approach to statistical dissemination where they can select and download just those data that are of interest to them, sometimes for further data manipulation and analysis. Indirect assessment of user feedback on metadata can also be interesting and useful. It can be obtained, e.g., analysing the consultation of metadata files (ESMS) by the users (Indicator AC2 – Metadata Consultations).
The quality report should normally refer to the needs of each of these kinds of users and how well they have been addressed.
User feedback appears to be the best way to assess the clarity of published data from the user’s perspective. Questions on user experiences regarding ease of access to the data and their exact meaning and interpretation should be included when user satisfaction surveys are designed, and this and any other user feedback should be reported.
Recent and planned improvements to accessibility and clarity should also be described.
ESS level
The above applies equally to the ESS level.
Example 6.2.A: The collection of news releases by Eurostat (Eurostat3, 2013)
For each statistical topic, there is a quarterly news release at the following link:
http://epp.eurostat.ec.europa.eu/portal/page/portal/publications/collections/news_releases
Example 6.2.B: The collection of statistical books published by Eurostat (Eurostat4, 2013)
A list with all the publications of Eurostat can be found at the following link: http://epp.eurostat.ec.europa.eu/portal/page/portal/publications/collections/statistical_books
Example 6.2.C: The statistics database of Eurostat (Eurostat5, 2013)
Data are published under various themes at:
http://epp.eurostat.ec.europa.eu/portal/page/portal/statistics/search_database
ESS Handbook for Quality Reports eurostat 106
Example 6.2.D: Information about micro-data access by Eurostat (Eurostat6, 2013)
Instructions on how to apply for microdata access:
http://epp.eurostat.ec.europa.eu/portal/page/portal/microdata/introduction
Example 6.2.E: Methodology of Short-term Business Statistics, Interpretation and Guidelines (Eurostat, 2006)
http://epp.eurostat.ec.europa.eu/cache/ITY_OFFPUB/KS-BG-06-001/EN/KS-BG-06-001-EN.PDF
Example 6.2.F: Handbook for EU Agricultural Price Statistics (Eurostat, 2008)
http://ec.europa.eu/eurostat/ramon/statmanuals/files/Handbook%20for%20EU%20Agricultural%20Price%20Statistics%202008.pdf
Example 6.2.G: Quality Report on Harmonised indices of consumer prices in Estonia (Eurostat3, 2012)
The Quality Report sent to Eurostat is available at the address:
http://epp.eurostat.ec.europa.eu/cache/ITY_SDDS/EN/prc_hicp_nesms_ee.htm
Example 6.2.H: Accessibility and clarity for the EU Statistics on Income and Living Conditions (EU-SILC) instrument, from the 2010 EU Comparative Final Quality Report (Eurostat2, 2013, p. 12-13)
4. ACCESSIBILITY AND CLARITY
In accordance with Commission Regulation 831/2002, the Commission has released SILC anonymized micro-data via CD-ROM to researchers. The UDB (User database) with the cross-sectional 2010 micro-data was sent to countries and contractors in March 2012, while the UDB containing the longitudinal 2010 micro-data was released for the first time in August 2012.
In addition, agreed indicators on social inclusion and additional indicators as well as are available to the external users free of charge on Eurostat website -mainly in the SILC dedicated section but not only. Public information on data coding as well as methodological description of EU-SILC is available at Circabc. Furthermore, there is a dedicated section on the website of Eurostat containing key information on Income, Social Inclusion and Living conditions as well as on the EU2020 poverty target including:
Statistical books Statistics in focus New releases Methodologies and working papers Finally, it is worth to mention that two Statistics in Focus closely related to 2010 data have been disseminated in the last months: Children were the age group at the highest risk of poverty or social exclusion in 2011 – Issue number 4/2013 Living standards falling in most Member States – Issue number 8/2013
Quality and Performance Indicators
AC1. Data tables – consultations General definition: Number of consultations of data tables within a statistical domain for a given time period displayed in a graph.
AC 2. Metadata – consultations
eurostat ESS Handbook for Quality Reports 107
General definition: Number of metadata consultations (ESMS) within a statistical domain for a given time period.
AC 3. Metadata completeness – rate General definition: The ratio of the number of metadata elements provided to the total number of metadata elements applicable.
ESS level
(i) Individual values and aggregates of AC1 over Member States.
(ii) Subscriptions/purchases of ESS reports.
(iii) Individual values and aggregates of AC2 over Member States.
(iv) Web hits and downloads from ESS level websites.
(v) Presentation of AC3 over Member States and of an overall AC3.
Summary
What should be included on Accessibility, Clarity and Dissemination Format
• A description of the conditions of access to data: media, support, pricing policies, possible restrictions, etc.
• A summary description of the information (metadata) accompanying the statistics (documentation, explanation, quality limitations, etc).
• The description should refer to both less sophisticated and more advanced users and how their needs have been taken into account.
• A summary of user feedback on accessibility, clarity and dissemination format.

ESS Handbook for Quality Reports eurostat 108
7 Cost and Burden
7.1 ESS Quality Definition
Cost and burden is the cost associated with the collection and production of a statistical product and burden on respondents.
ESS Guidelines: Provide a summary of costs for production of statistical data and of the burden on respondents Concerning costs, where available, annual operational cost with breakdown by major cost component, should be provided as well as recent efforts made to improve efficiency and the extent to which information and communications technology (ICT) is effectively used in the statistical process.
With regard to response burden, where available, an estimate of respondent burden (in general measured in time used) should be reported as well as recent efforts made to reduce respondent burden. Other information related to respondent burden could be reported such as:
• Whether the range and detail of data collected by survey is limited to what is absolutely necessary;
• Whether administrative and other survey sources are used to the fullest extent possible;
• The extent to which data sought from businesses is readily available from their accounts;
• Whether electronic means are used to facilitate data collection;
• Whether best estimates and approximations are accepted when exact details are not readily available;
• Whether reporting burden on individual respondents is limited to the extent possible by minimizing the overlap with other surveys.
7.2 For all statistical processes
Performance, cost and respondent burden are aspects of process quality that cannot be covered under any of the output quality components. However, there are trade-offs to be considered between cost and response burden and the output quality components, or, expressed differently, cost and respondent burden are constraints on output quality.
The capacity to calculate costs is essential for efficient management in general, and for quality and performance assessment in particular. Cost benefit analyses are required in order to determine the appropriate trade-off between costs on the one hand and benefits in terms of the output quality components on the other. Likewise, respondent participation must be viewed as a cost (to respondents) that has to be balanced against the benefits of the data thus provided.
In the ESS Quality Assurance Framework (QAF) methods are presented on both the institutional and the survey level to deal with measuring costs and the trade-off between quality and costs.
eurostat ESS Handbook for Quality Reports 109
In some specific statistical domains, ESS legislation highlights the need to consider the relationships between output quality, cost and respondent burden, as indicated in the following examples. In addition, Eurostat has a rolling review programme.
Example 7.2.A: Regulation N°295/2008 of European Parliament and Council of 11 March 2008 concerning Structural Business Statistics (Regulation (EC), 2008)
Article 6 states “Quality evaluation shall be carried out comparing the benefits of the availability of the data with the costs of collection and the burden on business, especially on small enterprises”.
Example 7.2.B: Council Regulation N° 1165/98 of 19 May 1998 concerning Short-term Statistics (Council Regulation (EC), 1998)
Article 14 states “The Commission shall … submit a Report … on the statistics compiled … and in particular on their relevance … and the burden on business”.
Example 7.2.C: Eurostat Rolling Review Programme (Eurostat4, 2011)
Rolling Reviews are systematic reviews of Eurostat's statistical work looked at together with main users and partners in the Member States. They are based on several assessment tools such as an assessment checklist, user surveys and partner surveys and aim at evaluating issues such as:
Are the requirements of Eurostat's statistical programme met? Are the production processes organised in an efficient way? Are the partners satisfied with Eurostat's guidance and way of working? Do the users get adequate and satisfactory information and service? What are the costs to Eurostat and the Member States? Could the work be done more efficiently? Are the data disseminated by Eurostat of good quality? Rolling Reviews are in-house evaluations concerned with examining ways of improving and enhancing the implementation and management of interventions. They are conducted for a number of statistical processes in given intervals and have as a main purpose the improvement of Eurostat’s performance by finding possible ways to improve the functioning within each statistical area. They involve a thorough review of users’ satisfaction, partners’ satisfaction, Eurostat’s and Member States’ resources and costs.
7.3 Cost
A comprehensive assessment of the costs associated with a statistical output, like statistical products and services is complicated because it requires a mechanism for allocating shared costs (for example, the costs of the business register) and overheads (office space, utility bills etc). This approach is the so-called full-cost approach. A simple assessment of the principal direct costs is also feasible and would be mainly based on time spent for a given statistical output.
The choice of using a full-cost approach or an approach based on direct costs depends on the utilised cost accounting system in each Member State's administration.
Some examples are provided in the following paragraphs. Note that, in this context, the actual sources of funding are irrelevant as they have nothing to do with efficiency.
Example 7.3.A Cost Model Proposed by Eurostat Unit for planning and reporting (Harmonised lists […], Eurostat)
The total cost for a statistical output could be computed as the sum of the corresponding costs on:

ESS Handbook for Quality Reports eurostat 110
• Human resources and • Financial resources (operational and administrative costs)
Costs may be divided into two groups: those associated with national reporting obligations, whether or not an EU legal act specifies them; and those exclusively associated with EU reporting obligations, i.e., that would not be incurred in the absence of EU legislation. The latter are defined as costs related to EU reporting obligations.
In addition to the costs associated with the statistical output, the costs related to the quality work (for example quality management) can also be measured. For an example, please refer to the cost measurement of Statistics Netherlands as presented below.
Example 7.3.B Measurement for cost of quality management at Statistics Netherlands (Booleman & Zeelenberg, 2012, p. 3-5)
6 Tools
6.1 Introduction
The general frameworks for quality management at SN are EFQM and the Standard for statistical processes. This standard is structured according to the Object-oriented Quality and Risk Management model (OQRM) and encompasses the CoP and other quality frameworks such as the Data Quality Assurance Framework of the IMF. The standard has three levels, i.e., an object, one or more attributes of each objects and one or more requirements for each attribute of an object. Objects are for example agreements, statistical output and processes.
6.2 Statistical audits
At SN different tools are in place to inspect processes. Our 30 most important statistical processes are subject to statistical audits on a regular base. Every three year an audit team is evaluating these processes on a rolling base. In practice this means 10 audits per year. On every audit we spend in total around 0.6 full time equivalent. The audits are managed by a central department, the quality department. The auditors themselves are all internal statisticians and methodologists.
An audit team consists of one audit team leader, two auditors from statistical departments and one auditor from the methodological department. Our four audit team leaders have an external postgraduate degree in auditing. The other 60 auditors have all followed an internal audit course of 3 days. Audits are directly reported to the director general of SN. Based on the results process owners make a plan for their improvement actions.
On an ad hoc base or in case of emergencies the director general also could order an audit on other processes.
In total the annual costs are around 6½ full time equivalents.
6.3 Self-assessments
As described before, our principal processes are subject to statistical audits on a regular base. Our remaining statistical processes a subject to self-assessments every three years. The questionnaire on self-assessments is also based on our Standard for statistical processes. Process owners should send the questionnaire to the quality department. They will be checked if a follow up action is needed. Yearly 60 self-assessment forms will be compiled and checked.
Annual costs are in total ½ full time equivalents.
6.4 Process descriptions
This is integrated with the requirements of the information security guidelines of the Dutch government. Every statistical or IT process should be described and secured. The description should be up-to-date all the time. Every three years these descriptions are checked on their actuality.
Annual costs are in total 2½ full time equivalents.
6.5 Risk assessments
Every 4 or 5 years the Board of Management of SN discusses risks and risk policies in a special meeting followed by 3 or 4 special sessions to elaborate the risk profile and the policies. The risk profile and risk policies are updated every year and the status of measures is reported quarterly by each division.
The annual costs are very limited. At the maximum it will be 0.1 full time equivalents.
eurostat ESS Handbook for Quality Reports 111
6.6 Quality reporting
All statistical information should include also indications about the quality of the information. At the present this is not always detailed enough or even the case but based on the standard quality report framework of Eurostat in the future this kinds of reports will be available. At this moment there is a discussion within the office about what quality we want to deliver and how we could make it operational. Users do not know always what they want. And there are different kinds of users. Often they are satisfied with every quality SN delivers because they trust the brand SN. This means SN has an own responsibility to keep trust in statistics as high as it is nowadays.
Quality reporting is every day work. SN does not estimate these annual costs.
6.7 Internet quality
A special group of five senior employees, the so called ‘horseflies’, investigates on a irregular base the website of SN. Their main task is to act as external users without any regard of the internal organization to improve the usability of the statistical information. Very often tables and press releases are not user oriented but directly related to the internal production process. Secondly they report on errors or unclear descriptions. Individual findings are reported directly to the subject matter departments. They report on an annual base a summary of the findings to the Chief Statistical Officer and the board of directors.
The annual costs of this group is 0.1 full time equivalents.
6.8 Institutional quality
Statistical information with the brand ‘SN’ is highly appreciated in The Netherlands. To keep it this way SN highly appreciates quality activities on the European level like the Code of Practice and the Quality Assurance Framework. It supports on the national level the institutional embedding and perception of SN as trusted partner.
The annual costs of international cooperation directly related to quality work is 0.1 full time equivalents.
6.9 Internal reviews
Most departments at SN have some review process of their output. An example of a very structured review process can be found in the methodology department. On average, the department publishes 150 internal papers and 50 external papers each year. Every internal or external paper written by a methodologist is reviewed by a senior methodologist and by a manager. The senior methodologist reviews the technical aspects of the methodology developed in the paper and the way it is applied to the statistical problem at hand, and the manager looks into the wider aspects such formulations, in order to improve the degree of acceptance with statistical users.
6.10 Other quality work
Beside the above mentioned tools also other tools are in place. For example on a regular base user satisfaction surveys, employee satisfaction survey and peer reviews are carried out.
The annual costs of these other activities including general quality management is about 2½ full time equivalents.
6.11 Total costs
Summing the costs of the previous subsections, we get as total costs of direct quality work, approximately 12½ full time equivalents, i.e. almost 1 per cent of the total budget of Statistics Netherlands.
7.4 Respondent Burden
Over the past decade the EC has been making substantial efforts to reduce the administrative burden placed by legislation, and accompanying regulations, on businesses. A summary of progress is provided in European Commission's Document on Measuring Administrative Costs 2008. Associated with these activities is the EU Standard Cost Model for measuring costs imposed by legislation on businesses. This is the starting point for defining respondent burden, whether imposed on individuals, household members or businesses, by statistical processes.
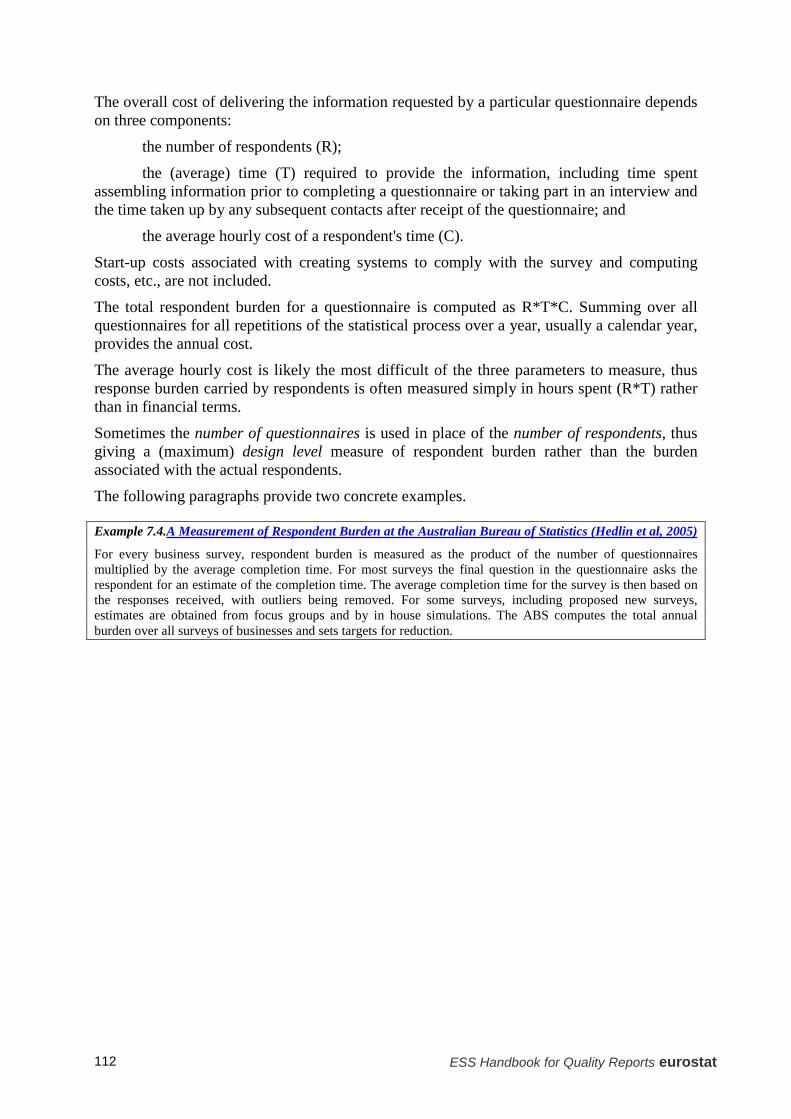
ESS Handbook for Quality Reports eurostat 112
The overall cost of delivering the information requested by a particular questionnaire depends on three components:
the number of respondents (R);
the (average) time (T) required to provide the information, including time spent assembling information prior to completing a questionnaire or taking part in an interview and the time taken up by any subsequent contacts after receipt of the questionnaire; and
the average hourly cost of a respondent's time (C).
Start-up costs associated with creating systems to comply with the survey and computing costs, etc., are not included.
The total respondent burden for a questionnaire is computed as R*T*C. Summing over all questionnaires for all repetitions of the statistical process over a year, usually a calendar year, provides the annual cost.
The average hourly cost is likely the most difficult of the three parameters to measure, thus response burden carried by respondents is often measured simply in hours spent (R*T) rather than in financial terms.
Sometimes the number of questionnaires is used in place of the number of respondents, thus giving a (maximum) design level measure of respondent burden rather than the burden associated with the actual respondents.
The following paragraphs provide two concrete examples.
Example 7.4.A Measurement of Respondent Burden at the Australian Bureau of Statistics (Hedlin et al, 2005)
For every business survey, respondent burden is measured as the product of the number of questionnaires multiplied by the average completion time. For most surveys the final question in the questionnaire asks the respondent for an estimate of the completion time. The average completion time for the survey is then based on the responses received, with outliers being removed. For some surveys, including proposed new surveys, estimates are obtained from focus groups and by in house simulations. The ABS computes the total annual burden over all surveys of businesses and sets targets for reduction.
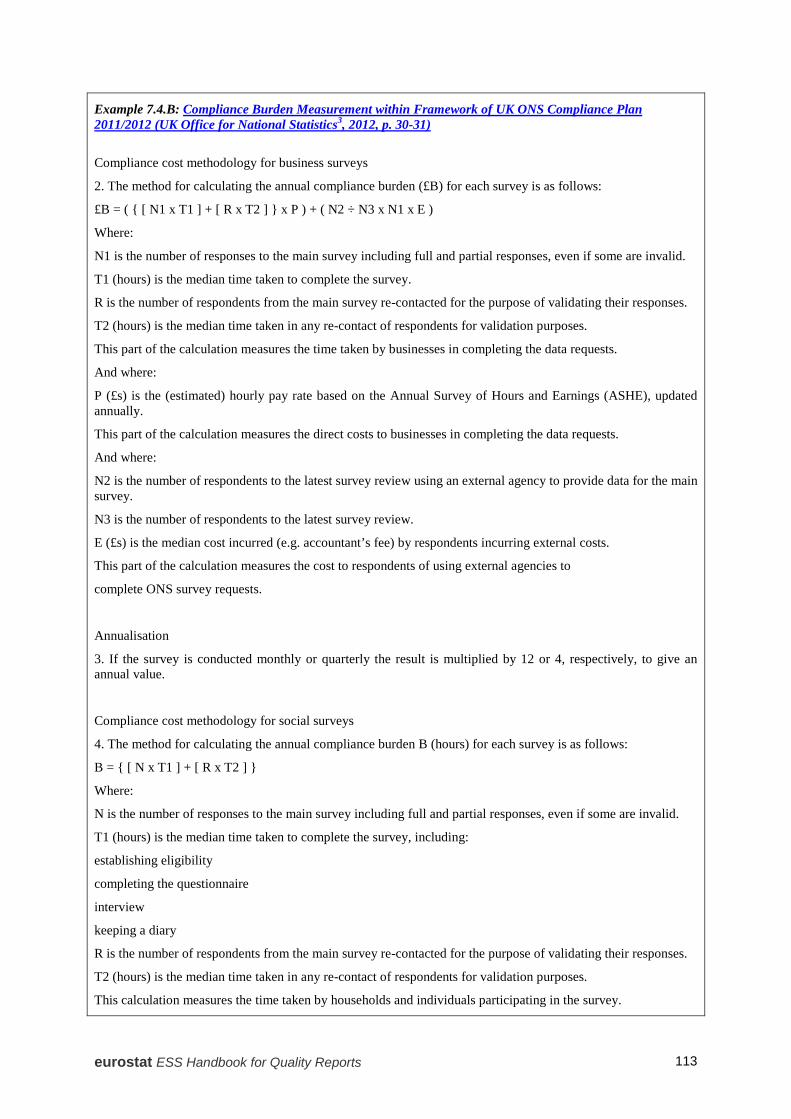
eurostat ESS Handbook for Quality Reports 113
Example 7.4.B: Compliance Burden Measurement within Framework of UK ONS Compliance Plan 2011/2012 (UK Office for National Statistics3, 2012, p. 30-31)
Compliance cost methodology for business surveys
2. The method for calculating the annual compliance burden (£B) for each survey is as follows:
£B = ( { [ N1 x T1 ] + [ R x T2 ] } x P ) + ( N2 ÷ N3 x N1 x E )
Where:
N1 is the number of responses to the main survey including full and partial responses, even if some are invalid.
T1 (hours) is the median time taken to complete the survey.
R is the number of respondents from the main survey re-contacted for the purpose of validating their responses.
T2 (hours) is the median time taken in any re-contact of respondents for validation purposes.
This part of the calculation measures the time taken by businesses in completing the data requests.
And where:
P (£s) is the (estimated) hourly pay rate based on the Annual Survey of Hours and Earnings (ASHE), updated annually.
This part of the calculation measures the direct costs to businesses in completing the data requests.
And where:
N2 is the number of respondents to the latest survey review using an external agency to provide data for the main survey.
N3 is the number of respondents to the latest survey review.
E (£s) is the median cost incurred (e.g. accountant’s fee) by respondents incurring external costs.
This part of the calculation measures the cost to respondents of using external agencies to
complete ONS survey requests.
Annualisation
3. If the survey is conducted monthly or quarterly the result is multiplied by 12 or 4, respectively, to give an annual value.
Compliance cost methodology for social surveys
4. The method for calculating the annual compliance burden B (hours) for each survey is as follows:
B = { [ N x T1 ] + [ R x T2 ] }
Where:
N is the number of responses to the main survey including full and partial responses, even if some are invalid.
T1 (hours) is the median time taken to complete the survey, including:
establishing eligibility
completing the questionnaire
interview
keeping a diary
R is the number of respondents from the main survey re-contacted for the purpose of validating their responses.
T2 (hours) is the median time taken in any re-contact of respondents for validation purposes.
This calculation measures the time taken by households and individuals participating in the survey.
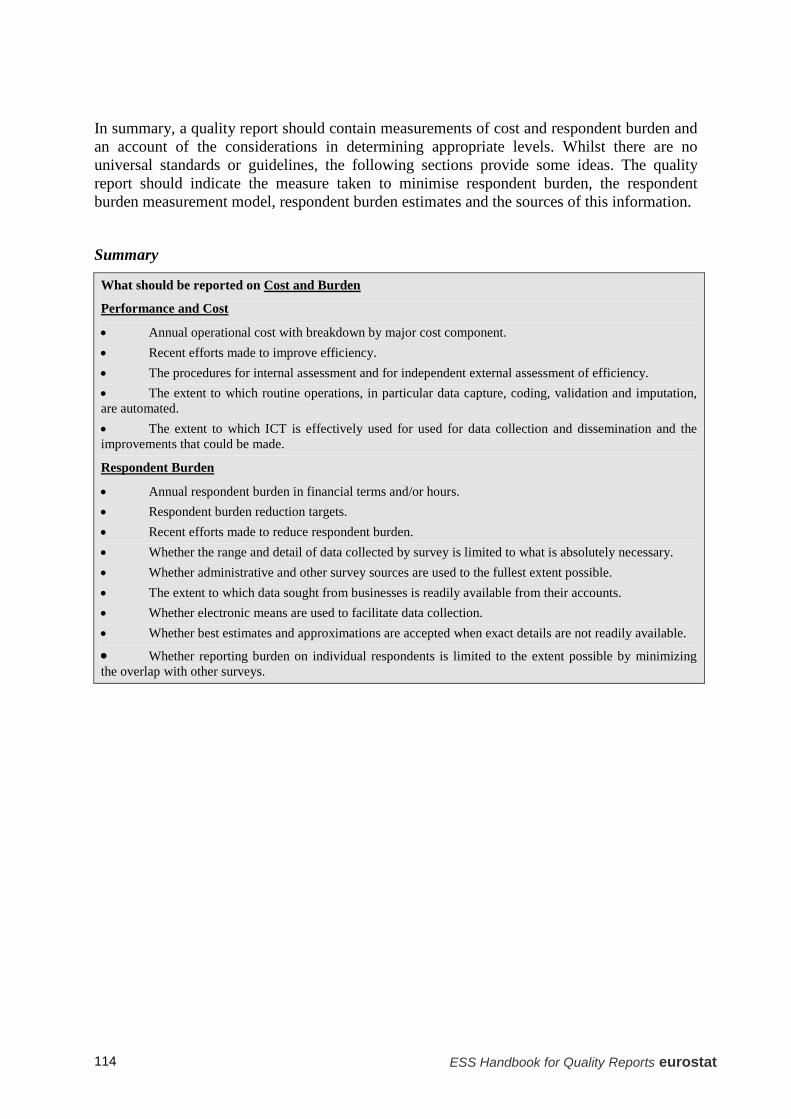
ESS Handbook for Quality Reports eurostat 114
In summary, a quality report should contain measurements of cost and respondent burden and an account of the considerations in determining appropriate levels. Whilst there are no universal standards or guidelines, the following sections provide some ideas. The quality report should indicate the measure taken to minimise respondent burden, the respondent burden measurement model, respondent burden estimates and the sources of this information.
Summary
What should be reported on Cost and Burden
Performance and Cost
• Annual operational cost with breakdown by major cost component. • Recent efforts made to improve efficiency. • The procedures for internal assessment and for independent external assessment of efficiency. • The extent to which routine operations, in particular data capture, coding, validation and imputation, are automated. • The extent to which ICT is effectively used for used for data collection and dissemination and the improvements that could be made.
Respondent Burden
• Annual respondent burden in financial terms and/or hours. • Respondent burden reduction targets. • Recent efforts made to reduce respondent burden. • Whether the range and detail of data collected by survey is limited to what is absolutely necessary. • Whether administrative and other survey sources are used to the fullest extent possible. • The extent to which data sought from businesses is readily available from their accounts. • Whether electronic means are used to facilitate data collection. • Whether best estimates and approximations are accepted when exact details are not readily available.
• Whether reporting burden on individual respondents is limited to the extent possible by minimizing the overlap with other surveys.

eurostat ESS Handbook for Quality Reports 115
8 Confidentiality
8.1 ESS Quality Definition
Confidentiality is a property of data indicating the extent to which their unauthorised disclosure could be prejudicial or harmful to the interest of the source or other relevant parties.
This concept is further borken down into :
a) Confidentiality - policy Description: Legislative measures or other formal procedures which prevent unauthorised disclosure of data that identify a person or economic entity either directly or indirectly.
ESS Guidelines: The European and national legislations (or any other formal provision) related to statistical confidentiality applied for the data set in question should be described. It means the assurance that all necessary methods assuring confidentiality have been applied to the data.
b) Confidentiality - data treatment Description: Rules applied for treating the data set to ensure statistical confidentiality and prevent unauthorised disclosure.
ESS Guidelines: The rules applied for treating the data set with regard to statistical confidentiality should be described (e.g. controlled rounding, cell suppression, aggregation of disclosed information, aggregation rules on aggregated confidential data, primary confidentiality with regard to single data values, etc.).
8.2 For all statistical processes
Typically confidentiality protection is required by law and survey staff have legal confidentiality commitments. The quality report should confirm such arrangements or report on any exceptions. It should also outline the procedures for ensuring confidentiality during collection, processing and dissemination. These include protocols for ensuring that individual data are accessed strictly on a need to know basis, rules for defining confidential cells in output tables, and procedures for detecting and preventing residual disclosure. In addition, the arrangements, if any, under which users outside the NSO may access microdata for research purposes, and the associated confidentiality provisions, should be described.
Summary
What should be included on Confidentiality
• Whether or not confidentiality is required by law and if so whether survey staff have signed legal confidentiality commitments. • Whether external users may access micro-data for research purposes, and, if so, the confidentiality provisions that are applied.
• The procedures for ensuring confidentiality during collection, processing and dissemination, including rules for determining confidential cells in output tables and procedures for detecting and preventing residual disclosure.

eurostat ESS Handbook for Quality Reports 117
9 Statistical processing
9.1 ESS Quality Definition
Statistical processing refers to the operations performed on data to derive new information according to a given set of rules.
This concept is further broken down into:
a) Source data Description: Characteristics and components of the raw statistical data used for compiling statistical aggregates. ESS Guidelines: Indicate if the data set is based on a survey, on administrative data sources, on a mix of multiple data sources or on data from other statistical activities. If sample surveys are used, some sample characteristics should also be given (e.g. population size, gross and net sample size, type of sampling design, reporting domain etc.). If administrative registers are used, the description of registers should be given (source, primary purpose, etc.).
b) Frequency of data collection Description: Frequency with which the source data are collected. ESS Guidelines: Indicate the frequency of data collection (e.g. monthly, quarterly, annually, continuous). The frequency can also be expressed in using the codes released in the harmonised code list available for the European Statistical System.
c) Data collection Description: Systematic process of gathering data for official statistics. ESS Guidelines: Describe the method used, in case of surveys, to gather data from respondents (e.g. sampling methods, postal survey, CAPI, on-line survey, etc.). Some additional information on questionnaire design and testing, interviewer training, methods used to monitor non-response etc. should be provided here. Questionnaires used should be annexed (if very long: via hyperlink).
d) Data validation Description: Process of monitoring the results of data compilation and ensuring the quality of statistical results. ESS Guidelines: Describe the procedures for checking and validating the source and output data and how the results of these validations are monitored and used. Validation activities can include: checking that the population coverage and response rates are as required; comparing the statistics with previous cycles (if applicable); confronting the statistics against other relevant data (both internal and external); investigating inconsistencies in the statistics; performing micro and macro data editing; verifying the statistics against expectations and domain intelligence, outlier detection.
e) Data compilation Description: Operations performed on data to derive new information according to a given set of rules.

ESS Handbook for Quality Reports eurostat 118
ESS Guidelines: Describe the data compilation process (e.g. imputation, weighting, adjustment for non-response, calibration, model used etc.). For imputation: • Information on the extent to which imputation is used and the reasons for it should be noted. • A short description of the methods used and their effects on the estimates. Each step of weighting should be described separately: * calculation of design weights; * non-response adjustment: how the design weight is corrected taking into account the differences in response rates; * calibration: the level and variables used in the adjustment, method applied; * calculation of final weights.
f) Adjustment Description: The set of procedures employed to modify statistical data to enable it to conform to national or international standards or to address data quality differences when compiling specific data sets. ESS Guidelines: Describe the time series to be adjusted and the statistical procedures used for adjusting the series (such as seasonal adjustment methods e.g. TRAMO-SEATS, ARIMA, time series decomposition, or other similar methods). In case of adjustment, mention the type of adjustment (e.g. seasonal, calendar, trend-cycle) and if applied, the calendar used. If outlier detection and replacement was done, mention which kind of outliers (impulse, transitory changes, level shifts) were detected. Report the software and its version used for adjustment. The following sub-concept applies to adjustment:
i. Seasonal adjustment Description: The statistical technique used to remove the effects of seasonal calendar influences operating on a series. ESS Guidelines: A short description of the method used, including pre-treatment (calendar effects corrected for, calendar used, type of outliers detected and corrected, model selection and revision and decomposition scheme adopted) and specification of the seasonal adjustment tool chosen (software and version); Validation: specification of the quality measures and diagnostics used to evaluate the appropriateness of the identified model and the results of the seasonal adjustment process. Revisions: approach chosen for handling revision of seasonally adjusted data in combination or not with revision of raw data (specification of the horizon of revision seasonal factors).
Quality and Performance Indicators
A7. Imputation rate. (please refer to chapter 3.9.3 under Accuracy and Reliability for more information about the Imputation process and the Imputation rate indicator)
eurostat ESS Handbook for Quality Reports 119
PART III: Annexes
1 Standard ESS Quality and Performance Indicators
EUROPEAN COMMISSION EUROSTAT Directorate B: Corporate statistical and IT services Unit B-1: Quality, Methodology and Research
Luxembourg ESTAT / B1/AB D(2013)
ESS GUIDELINES FOR THE IMPLEMENTATION OF THE
ESS QUALITY AND PERFORMANCE INDICATORS (QPI)
These indicators were reviewed by the Eurostat Expert Group on Quality Indicators in 2010
and then slightly updated by the Task Force on Quality Reporting in 2012-2013
For more information, please contact Unit B1 of Eurostat: [email protected]
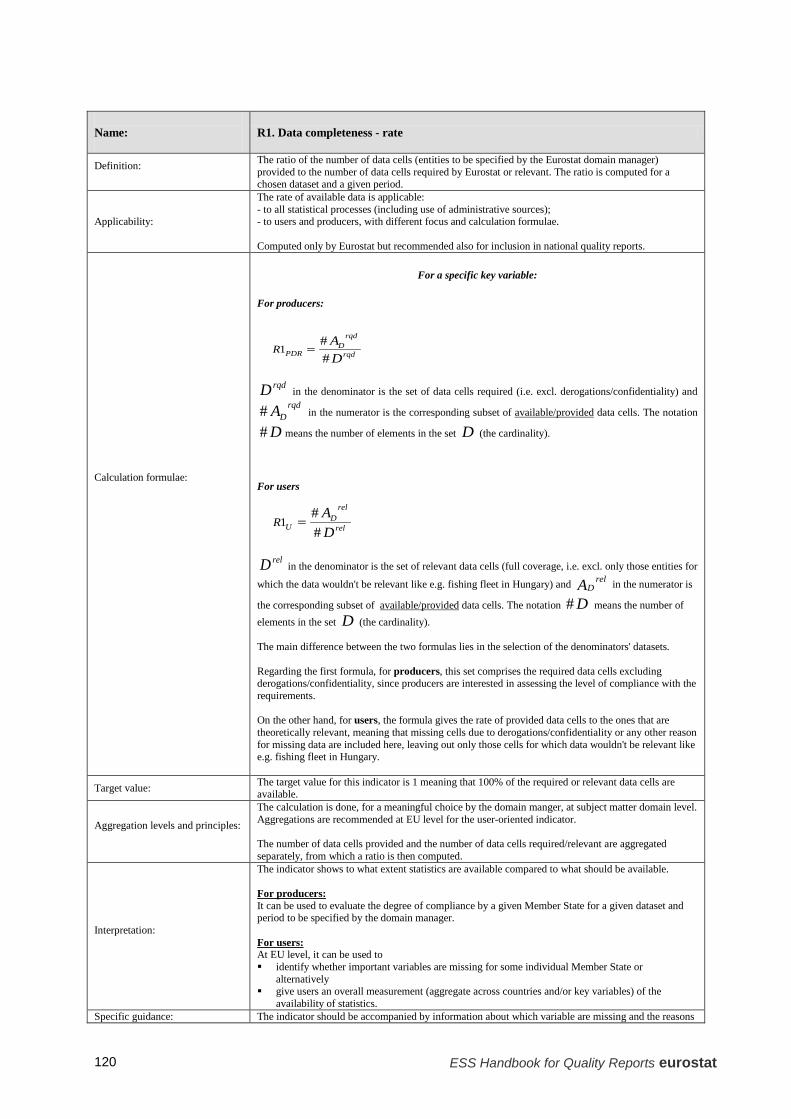
ESS Handbook for Quality Reports eurostat 120
Name:
R1. Data completeness - rate
Definition:
The ratio of the number of data cells (entities to be specified by the Eurostat domain manager) provided to the number of data cells required by Eurostat or relevant. The ratio is computed for a chosen dataset and a given period.
Applicability:
The rate of available data is applicable: - to all statistical processes (including use of administrative sources); - to users and producers, with different focus and calculation formulae. Computed only by Eurostat but recommended also for inclusion in national quality reports.
Calculation formulae:
For a specific key variable:
For producers:
rqd
rqdD
PDR DA
R##
1 =
rqdD in the denominator is the set of data cells required (i.e. excl. derogations/confidentiality) and
rqdDA# in the numerator is the corresponding subset of available/provided data cells. The notation
D# means the number of elements in the set D (the cardinality).
For users
rel
relD
U DA
R##
1 =
relD in the denominator is the set of relevant data cells (full coverage, i.e. excl. only those entities for
which the data wouldn't be relevant like e.g. fishing fleet in Hungary) and relDA in the numerator is
the corresponding subset of available/provided data cells. The notation D# means the number of elements in the set D (the cardinality). The main difference between the two formulas lies in the selection of the denominators' datasets. Regarding the first formula, for producers, this set comprises the required data cells excluding derogations/confidentiality, since producers are interested in assessing the level of compliance with the requirements. On the other hand, for users, the formula gives the rate of provided data cells to the ones that are theoretically relevant, meaning that missing cells due to derogations/confidentiality or any other reason for missing data are included here, leaving out only those cells for which data wouldn't be relevant like e.g. fishing fleet in Hungary.
Target value: The target value for this indicator is 1 meaning that 100% of the required or relevant data cells are available.
Aggregation levels and principles:
The calculation is done, for a meaningful choice by the domain manger, at subject matter domain level. Aggregations are recommended at EU level for the user-oriented indicator. The number of data cells provided and the number of data cells required/relevant are aggregated separately, from which a ratio is then computed.
Interpretation:
The indicator shows to what extent statistics are available compared to what should be available. For producers: It can be used to evaluate the degree of compliance by a given Member State for a given dataset and period to be specified by the domain manager. For users: At EU level, it can be used to identify whether important variables are missing for some individual Member State or
alternatively give users an overall measurement (aggregate across countries and/or key variables) of the
availability of statistics. Specific guidance: The indicator should be accompanied by information about which variable are missing and the reasons

eurostat ESS Handbook for Quality Reports 121
for incompleteness as well as, where relevant, the impact of the missing data on the EU aggregate and plans for improving completeness in the future. Calculation would need intervention by the Eurostat domain manager at the initial stage (to define the key variables and the period to be monitored). Later on, the indicators should be calculated automatically. Both formulas are to be computed per key variable, nevertheless an aggregate for all variables can be calculated. For producers: This indicator forms part of Eurostat compliance monitoring, thus for producers it should be computed per Member State. For users: If certain relevant variables are not reported, the statistics are incomplete. This can be due to data not being collected or data being of low quality or confidential. For users an aggregate across countries for all the key variables could suffice.
References:
ESS Handbook for Quality Reports – 2009 Edition (Eurostat). ESS Standard for Quality Reports – 2009 Edition (Eurostat). ISO/IEC FDIS 11179-1 "Information technology – Metadata registries – Part 1: Framework",
March 2004 (according to the SDMX Metadata Common Vocabulary draft Febr. 2008).
Name:
A1. Sampling error - indicators
Definition:
The sampling error can be expressed: a) in relative terms, in which case the relative standard error or, synonymously, the coefficient
of variation (CV) is used. (The standard error of the estimator θ̂ is the square root of its
variance )ˆV(θ .) The estimated relative standard error (the estimated CV) is the estimated standard error of the estimator divided by the estimated value of the parameter, see calculation formulae below.
b) in terms of confidence intervals, i.e. an interval that includes with a given level of
confidence the true value of a parameter θ . The width of the interval is related to the standard error.
The estimator should take into account the sampling design and should further integrate the effect on precision of adjustments for non-response, corrections for misclassifications, use of auxiliary information through calibration methods etc.
Applicability:
Sampling errors indicator are applicable: - to statistical processes based on probability samples or other sampling procedures allowing computation of such information. - to users and producers, with different level of details given.
Calculation formulae:
Coefficient of variation:
θθ
θ ˆ)ˆ(V̂
)ˆ( =e
CV
Remark: The subscript "e" stands for estimate.
Confidence interval, symmetric:
[ ]dd +− θθ ˆ;ˆ or d±θ̂ The length of the interval, which is 2∙d, depends on the confidence level (e.g. 95%), the assumptions convening the distribution of the estimator of the parameter, and the sampling error. In many cases d has the form below, where t depends on the distribution and the confidence level.
( )θ̂V̂td ×=
In case of totals, means and ratios, formulas for aggregation of coefficients of variation at EU level can be found in the third reference below. The calculation formulae depend on the sampling design, the estimator, and the method chosen for estimating the variance )ˆ(θV .
Target value: The smaller the CV, the standard error, and the width of the confidence interval, the more accurate is the estimator. Survey regulations may include specifications for precision thresholds at different population levels.

ESS Handbook for Quality Reports eurostat 122
Aggregation levels and principles:
The calculation is done for all statistics based on probability sample surveys or equivalent. Aggregations are possible at Member State and EU levels, depending on estimators and degree of harmonisation. The principle for computing the coefficient of variation of an aggregate depends on the method for aggregation of the estimator belonging to that variable.
Interpretation:
The CV is a relative (dimensionless) measure of the precision of a statistical estimator, often expressed as a percentage. More specifically, it has the property of eliminating measurement units from precision measures and one of its roles is to make possible comparisons between precision of estimates of different indicators. However, this property has no value added in case of proportions (which are by definition dimensionless indicators).
Specific guidance:
There are several precision measures which can be used to estimate the random variation of an estimator due to sampling, such as coefficients of variation, standard errors and confidence intervals. The coefficient of variation is suitable for quantitative variables with large positive values. It is not robust for percentages or changes and is not usable for data estimates of negative values, where they may be substituted by absolute measures of precision (standard errors or confidence intervals). The confidence interval is usually the precision measure preferred by data users. It is the clearest way of understanding and interpreting the sampling variability. Provision of confidence intervals is voluntary. The CV has the advantage of being dimensionless. The standard error or a confidence interval is sometimes preferable, as discussed.
Reference:
ESS Handbook for Quality Reports – 2009 Edition (Eurostat). ESS Standard for Quality Reports – 2009 Edition (Eurostat). Variance estimation methods in the European Union, Monographs of official Statistics, 2002
edition.
Name:
A2. Over-coverage - rate
Definition:
The rate of over-coverage is the proportion of units accessible via the frame that do not belong to the target population (are out-of-scope). The target population is the population for which inferences are made. The frame (or frames) is a device that permits access to population units. The frame population is the set of population units which can be accessed through the frame. The concept of a frame is traditionally used for sample surveys, but applies equally to several other statistical processes, e.g. censuses, processes using administrative sources, and processes involving multiple data sources. Coverage deficiencies may be due to delays in reporting (typical for business statistics) and to errors in unit identification, classification, coding etc. This is the case also when administrative data are used. The rate may be calculated either as un-weighted or as weighted to refer to the overall level (frame/population rather than sample). Units of unknown eligibility provide an inherent difficulty; see below.
Applicability : The rate of over-coverage is applicable: − to all statistical processes (including use of administrative sources); − to producers.
If the survey has more than one unit type, a rate may be calculated for each type. If there is more than one frame or if over-coverage rates vary strongly between sub-populations, rates should be separated.
Calculation formulae:
The over-coverage rate has three main versions written in one and the same formula as the weighted over-coverage rate
wOCr
( )∑∑∑
∑∑++
α−+=
Q jE jO j
Q jO jw www
wwOCr
1
O set of out-of-scope units (over-coverage, resolved and not belonging to the target population)
E set of in-scope units (resolved units belonging to the target population; eligible units)
Q set of units of unknown eligibility.
jw weight of unit j, described below.
α The estimated proportion of cases of unknown eligibility that are actually eligible. It should be
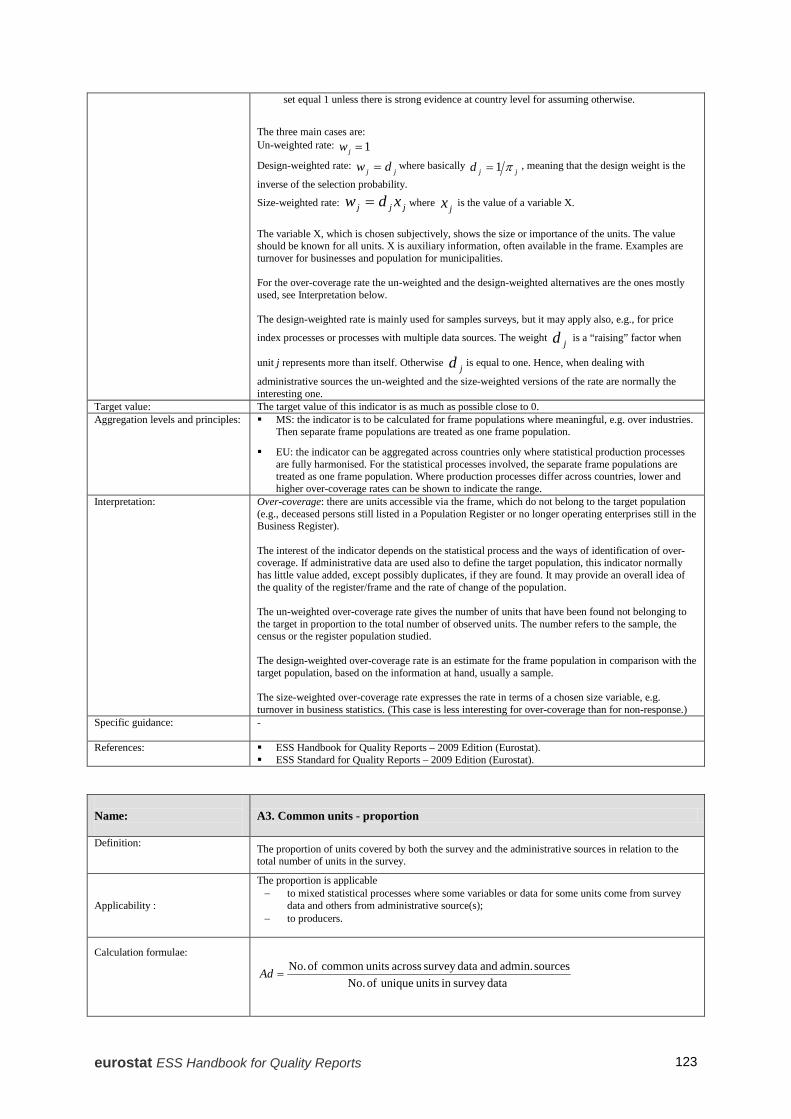
eurostat ESS Handbook for Quality Reports 123
set equal 1 unless there is strong evidence at country level for assuming otherwise.
The three main cases are: Un-weighted rate: 1=jw
Design-weighted rate: jj dw = where basically
jjd π1= , meaning that the design weight is the
inverse of the selection probability.
Size-weighted rate: jjj xdw = where jx is the value of a variable X.
The variable X, which is chosen subjectively, shows the size or importance of the units. The value should be known for all units. X is auxiliary information, often available in the frame. Examples are turnover for businesses and population for municipalities. For the over-coverage rate the un-weighted and the design-weighted alternatives are the ones mostly used, see Interpretation below. The design-weighted rate is mainly used for samples surveys, but it may apply also, e.g., for price
index processes or processes with multiple data sources. The weight jd is a “raising” factor when
unit j represents more than itself. Otherwise jd is equal to one. Hence, when dealing with
administrative sources the un-weighted and the size-weighted versions of the rate are normally the interesting one.
Target value: The target value of this indicator is as much as possible close to 0. Aggregation levels and principles:
MS: the indicator is to be calculated for frame populations where meaningful, e.g. over industries. Then separate frame populations are treated as one frame population.
EU: the indicator can be aggregated across countries only where statistical production processes are fully harmonised. For the statistical processes involved, the separate frame populations are treated as one frame population. Where production processes differ across countries, lower and higher over-coverage rates can be shown to indicate the range.
Interpretation:
Over-coverage: there are units accessible via the frame, which do not belong to the target population (e.g., deceased persons still listed in a Population Register or no longer operating enterprises still in the Business Register). The interest of the indicator depends on the statistical process and the ways of identification of over-coverage. If administrative data are used also to define the target population, this indicator normally has little value added, except possibly duplicates, if they are found. It may provide an overall idea of the quality of the register/frame and the rate of change of the population. The un-weighted over-coverage rate gives the number of units that have been found not belonging to the target in proportion to the total number of observed units. The number refers to the sample, the census or the register population studied. The design-weighted over-coverage rate is an estimate for the frame population in comparison with the target population, based on the information at hand, usually a sample. The size-weighted over-coverage rate expresses the rate in terms of a chosen size variable, e.g. turnover in business statistics. (This case is less interesting for over-coverage than for non-response.)
Specific guidance:
-
References: ESS Handbook for Quality Reports – 2009 Edition (Eurostat). ESS Standard for Quality Reports – 2009 Edition (Eurostat).
Name:
A3. Common units - proportion
Definition:
The proportion of units covered by both the survey and the administrative sources in relation to the total number of units in the survey.
Applicability :
The proportion is applicable − to mixed statistical processes where some variables or data for some units come from survey
data and others from administrative source(s); − to producers.
Calculation formulae:
datasurvey in units unique of No.sources admin. and datasurvey across unitscommon of No.
=Ad

ESS Handbook for Quality Reports eurostat 124
Target value: - Aggregation levels and principles::
-
Interpretation:
The indicator is used when administrative data is combined with survey data in such a way that data on unit level are obtained from both the survey and one or more administrative sources (some variables come from the survey and other variables from the administrative data) or when data for part of the units come from survey data and for another part of the units from one or more administrative sources. The indicator provides an idea of completeness/coverage of the sources – to what extent units exist in both administrative data and survey data. This indicator does not apply if administrative data is used only to produce estimates without being combined with survey data.
Specific guidance:
Common units refer to those units that are included in the data stemming from an administrative source and survey data. For the purpose of this indicator, the “unique units in survey data” in the denominator means that if a unit exists in more than one source it should only be counted once. If only a survey is conducted not for all of the units in the administrative source (e.g. conducting a survey only for larger enterprises), this indicator should be calculated only for the relevant subset. Linking errors should be detected and resolved before this indicator is calculated. If there are few common units due to the design of the statistical output (e.g. a combination of survey and administrative data), this should be explained.
References:
ESSNet use of administrative and accounts data in business statistics, WP6 Quality Indicators when using Administrative Data in Statistical Operations, November 2010.
Name:
A4. Unit non-response - rate
Definition: The ratio of the number of units with no information or not usable information (non-response, etc.) to the total number of in-scope (eligible) units. The ratio can be weighted or un-weighted.
Applicability:
The unit non-response rate is applicable: - to all statistical processes (including direct data collection and administrative data; the terminology varies between statistical processes, but the basic principle is the same; it may in some cases be difficult to distinguish between unit non-response and undercoverage, especially for administrative data sources (in the former case units are known to exist but data are missing, e.g. due to very late reporting or so low quality that the information is useless – in the latter case the units are not known at the frame construction); - to users and producers, with different level of details given.
Calculation formulae:
The non-response rate has three main versions written in one and the same formula as the weighted unit non-response rate wNRr
∑∑∑∑
α++−=
Q jNR jR j
jw www
wNRr R1
R the set of responding eligible units
NR the set of non-responding eligible units
Q the set of selected units with unknown eligibility (un-resolved selected units)
jw weight of unit j, described below
α The estimated proportion of cases of unknown eligibility that are actually eligible. It should be set equal 1 unless there is strong evidence at country level for assuming otherwise.
The three main cases are: Un-weighted rate: 1=jw
Design-weighted rate: jj dw = where basically jjd π1= , meaning that the design weight is the
inverse of the selection probability. Size-weighted rate:
jjj xdw = where jx is the value of a variable X.
The variable X, which is chosen subjectively, shows the size or importance of the units. The value should be known for all units. X is auxiliary information, often available in the frame. Examples are turnover for businesses and population for municipalities. For the unit non-response rate all three alternatives are frequently used, see Interpretation below.

eurostat ESS Handbook for Quality Reports 125
The design-weighted rate is mainly used for samples surveys, but it may apply also, e.g., for price index processes or processes with multiple data sources. The weight
jd is a “raising” factor when unit
j represents more than itself. Otherwise jd is equal to one. Hence, when dealing with administrative
sources the un-weighted and the size-weighted versions of the rate are normally the interesting one.
Target value: The target value for this indicator is as close to 0 as possible.
Aggregation levels and principles:
MS: the indicator is to be calculated at statistical process level EU: rather than aggregating this indicator over countries or to calculate a mean, lower and higher
unit non-response rates can be shown by Eurostat for a given variable at statistical process level.
Interpretation:
Unit non-response occurs when no data about an eligible unit are recorded (or data are so few or so low in quality that they are deleted). The un-weighted unit non-response rate shows the result of the data collection in the sample (the units included), rather than an indirect measure of the potential bias associated with non-response. If α=1, it assumes that all the units with unknown eligibility are eligible, so it provides a conservative estimate of A4 with regard to other choices of α . The design-weighted unit non-response rate shows how well the data collection worked considering the population of interest. The size-weighted unit non-response rate would represent an indirect indicator of potential bias caused by non-response prior to any calibration adjustments. Note overall that the bias may be low even if the non-response rate is high, depending on the pattern of the non-responses and the possibilities to adjust successfully for non-response.
Specific guidance:
Non-response is a source of errors in survey statistics mainly for two reasons: - it reduces the number of responses and therefore the precision of the estimates (this may be particularly relevant when samples are used); - it might introduce bias. The size of bias depends on the non-response rate but also on the differences between the respondents and the non- respondents with respect to the variable of interest; furthermore on the strength of auxiliary information.
References:
ESS Handbook for Quality Reports – 2009 Edition (Eurostat). ESS Standard for Quality Reports – 2009 Edition (Eurostat). U.S. Census Bureau Statistical Quality Standards, Reissued 2010. Trépanier, Julien, and Kovar. “Reporting Response Rates when Survey and Administrative Data
are Combined.” Proceedings of the Federal Committee on Statistical Methodology Research Conference 2005.
Name:
A5. Item non-response - rate
Definition:
The item non-response rate for a given variable is defined as the (weighted) ratio between in-scope units that have not responded and in-scope units that are required to respond to the particular item.
Applicability : The item non-response rate is applicable: - to all statistical processes (including direct data collection and administrative data; the terminology varies between statistical processes, but the basic principle is the same; - to users and producers, for selected key variables or for variables with very high item non-response rates, and with different level of details given. If the survey has more than one unit type or data sources, a rate may be calculated for each type or data source. If there is more than one frame, or if rates vary strongly between sub-populations, rates should (also) be calculated for separate sub-populations (or strata, groups).
Calculation formulae:
The item non-response rate has three main versions written in one and the same formula as the weighted item non-response rate wY rNR ,which is calculated as follows:
∑∑∑
+−=
YY
Y
N jj
jREQwY ww
wrNR
RR
R1
RY the set of eligible units responding to item Y (as required) NRY the set of eligible units not responding to item Y although this item is required. – The denominator
corresponds to the set of units for which item Y is required. (Other units do not get this item because their answers to earlier items gave them a skip past this item; they were “filtered away”.)
jw weight of unit j, described below

ESS Handbook for Quality Reports eurostat 126
The three main cases are: Un-weighted rate: 1=jw
Design-weighted rate: jj dw = where basically jjd π1= , meaning that the design weight is the
inverse of the selection probability. Size-weighted rate: jjj xdw = where
jx is the value of a variable X.
The variable X, which is chosen subjectively, shows the size or importance of the units. The value should be known for all units. X is auxiliary information, often available in the frame. Examples are turnover for businesses and population for municipalities. The design weight may in the computation of final estimates be modified to correct for non-response, under-coverage etc. This design weight should be used if the rates are to apply to final estimates. The design-weighted rate is mainly used for samples surveys, but it may apply also, e.g., for price index processes or processes with multiple data sources. The weight
jd is a “raising” factor when unit j
represents more than itself. Otherwise jd is equal to one. Hence, when dealing with administrative sources
the un-weighted and the size-weighted versions of the rate are normally the interesting one.
Target value:
The target value for this indicator is as close to 0 as possible.
Aggregation levels and principles:
MS: the indicator is to be calculated at statistical process level for key variables and variables with low
rates. EU: rather than to aggregate this indicator over countries or to calculate a mean, lower and higher item
non-response rates can be shown by Eurostat for a given variable at statistical process level. Interpretation:
A high item non-response rate indicates difficulties in providing information, e.g. a sensitive question or unclear wording for social statistics or information not available in the accounting system for business statistics. The indicator is a proxy indicator of the possible bias caused by item non-response. In spite of the low item response rate, the bias may still be low, depending on causes, response pattern, and auxiliary information to adjust/impute.
Specific guidance
The un-weighted item non-response rate should be calculated before the data editing and imputation in order to measure the impact of item non-response for the key variables.
References ESS Handbook for Quality Reports – 2009 Edition (Eurostat). ESS Standard for Quality Reports – 2009 Edition (Eurostat). U.S. Census Bureau Statistical Quality Standards, Reissued 2010. Trépanier, Julien, and Kovar. “Reporting Response Rates when Survey and Administrative Data are
Combined.” Proceedings of the Federal Committee on Statistical Methodology Research Conference 2005.
Name:
A6. Data revision - average size
Definition:
The average over a time period of the revisions of a key indicator. The “revision” is defined as the difference between a later and an earlier estimate of the key item. The number of releases (K) of a key item (number of times it is published) is fixed and specified in the revision policy. Usually, revisions involve a time series: when publishing an estimate of the key indicator referring to time t, it is a common practice to release the revised version of the indicator referring to a set of previous periods. In the following table this situation is illustrated for a revision analysis where the policy has K revisions and n reference periods are included in the analysis.
Reference periods Releases 1 … t … n
1st release 11X … tX1 … nX1 … … … … … …
thk release 1kX … ktX … knX … … … … … …
Kth and final release 1KX … KtX … KnX Different indicators can be derived by different ways of averaging the revisions for a time series (revisions can be averaged in absolute value or not, the indicator can be absolute or relative).
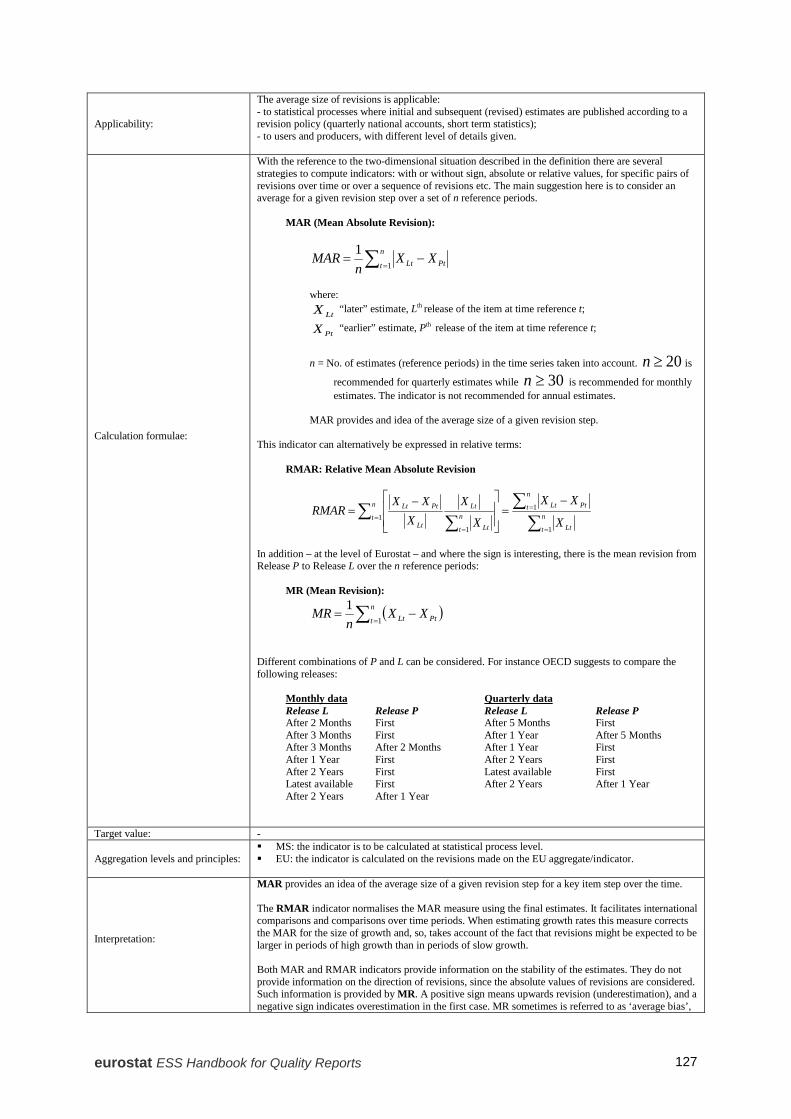
eurostat ESS Handbook for Quality Reports 127
Applicability:
The average size of revisions is applicable: - to statistical processes where initial and subsequent (revised) estimates are published according to a revision policy (quarterly national accounts, short term statistics); - to users and producers, with different level of details given.
Calculation formulae:
With the reference to the two-dimensional situation described in the definition there are several strategies to compute indicators: with or without sign, absolute or relative values, for specific pairs of revisions over time or over a sequence of revisions etc. The main suggestion here is to consider an average for a given revision step over a set of n reference periods.
MAR (Mean Absolute Revision):
∑ =−=
n
t PtLt XXn
MAR1
1
where:
LtX “later” estimate, Lth release of the item at time reference t;
PtX “earlier” estimate, Pth release of the item at time reference t;
n = No. of estimates (reference periods) in the time series taken into account. 20≥n is
recommended for quarterly estimates while 30≥n is recommended for monthly estimates. The indicator is not recommended for annual estimates.
MAR provides and idea of the average size of a given revision step.
This indicator can alternatively be expressed in relative terms:
RMAR: Relative Mean Absolute Revision
∑∑∑
∑ =
==
=
−=
−= n
t Lt
n
t PtLtn
t n
t Lt
Lt
Lt
PtLt
X
XX
X
XX
XXRMAR
1
11
1
In addition – at the level of Eurostat – and where the sign is interesting, there is the mean revision from Release P to Release L over the n reference periods:
MR (Mean Revision):
( )∑ =−=
n
t PtLt XXn
MR1
1
Different combinations of P and L can be considered. For instance OECD suggests to compare the following releases:
Monthly data Quarterly data Release L Release P Release L Release P After 2 Months First After 5 Months First After 3 Months First After 1 Year After 5 Months After 3 Months After 2 Months After 1 Year First After 1 Year First After 2 Years First After 2 Years First Latest available First Latest available First After 2 Years After 1 Year After 2 Years After 1 Year
Target value: -
Aggregation levels and principles: MS: the indicator is to be calculated at statistical process level. EU: the indicator is calculated on the revisions made on the EU aggregate/indicator.
Interpretation:
MAR provides an idea of the average size of a given revision step for a key item step over the time. The RMAR indicator normalises the MAR measure using the final estimates. It facilitates international comparisons and comparisons over time periods. When estimating growth rates this measure corrects the MAR for the size of growth and, so, takes account of the fact that revisions might be expected to be larger in periods of high growth than in periods of slow growth. Both MAR and RMAR indicators provide information on the stability of the estimates. They do not provide information on the direction of revisions, since the absolute values of revisions are considered. Such information is provided by MR. A positive sign means upwards revision (underestimation), and a negative sign indicates overestimation in the first case. MR sometimes is referred to as ‘average bias’,

ESS Handbook for Quality Reports eurostat 128
but a nonzero MR is not sufficient to establish whether the size of revisions is systematically biased in a given direction. To ascertain the presence of bias it has to be assessed whether MR is statistically different from zero (given no changes in definitions, methodologies, etc.).
Specific guidance: Either MAR or RMAR should be presented under this indicator. In addition MR could also be calculated at EU-level.
References: OECD: http://stats.oecd.org/mei/default.asp?rev=1
Name:
A7. Imputation - rate
Definition:
Imputation is the process used to assign replacement values for missing, invalid or inconsistent data that have failed edits. This includes automatic and manual imputations; it excludes follow-up with respondents and the corresponding corrections (if applicable). Thus, imputation as defined above occurs after data collection, no matter from which source or mix of sources the data have been obtained, including administrative data. After imputation, the data file should normally only contain plausible and internally consistent data records. This indicator is influenced both by the item non-response and the editing process. It measures both the relative amount of imputed values and the relative influence on the final estimates from the imputation procedures. The un-weighted imputation rate for a variable is the ratio of the number of imputed values to the total number of values requested for the variable. The weighted rate shows the relative contribution to a statistic from imputed values; typically a total for a quantitative variable. For a qualitative variable, the relative contribution is based on the number of units with an imputed value for the qualitative item.
Applicability : The imputation rate is applicable − to all statistical processes (with micro data; hence, e.g., direct data collection and administrative
data); − to producers.
Calculation formulae:
1. Un-weighted on the statistical process and variable level:
nAV and nOV are the numbers of assigned values and observed values, respectively. 2. The contribution of imputed values is calculated in an analogous way, but weighted and with variable values.
Here, AV and OV are the sets of units with assigned and observed values, respectively. In addition, j w is the weight (normally the weight used for estimation takes into account the sample design as well as adjustment for unit non response and final calibration) of the unit j. In case of a qualitative variable, the value of y equals 1.
In case of a qualitative variable, the value of 1=jy if the jth unit shows a given characteristic and 0
otherwise. When imputation is counted the following changes have to be considered:
i. imputation of a (non-blank) value for a missing item ii. imputation of a (non-blank) value to correct an observed invalid (non-blank) value
iii. imputation of a blank value to correct an undue invalid (non-blank) response. The two main cases for the imputation rate are: Design-weighted rate: jj dw = where basically jjd π1= , meaning that the design weight is the
inverse of the selection probability.

eurostat ESS Handbook for Quality Reports 129
Size-weighted rate: jjj xdw = where jx is the value of a variable X
Target value: A value equal or close to zero is desirable; imputation indicates missing and invalid values. Aggregation levels and principles: MS: The calculation is done for key variables at statistical process level.
EU: Aggregations can be made at the level of EU on the basis of harmonised statistical production processes across Member States, considering this as a single statistical process. Alternatively, Eurostat can report lower and higher imputation rates for a given variable at statistical process level.
Interpretation:
The un-weighted rate shows, for a particular variable, the proportion of units for which a value has been imputed due to the original value being a missing, implausible, or inconsistent value in comparison with the number of units with a value for this variable. Units with imputation of a blank value to correct an undue invalid (non-blank) response (type iii) have to be included in both numerator and denominator.
The weighted rate shows, for a particular variable, the relative contribution of imputed values to the estimate of this item/variable. Obviously this weighted indicator is meaningful when the objective of a survey is that of estimating the total amount or the average of a variable. When the objective of the estimation is that of estimating complex indices, the weighted indicator is not meaningful.
Specific guidance: - References: ESS Handbook for Quality Reports – 2009 Edition (Eurostat).
ESS Standard for Quality Reports – 2009 Edition (Eurostat). Statistics Canada Quality Guidelines, Fifth Edition – October 2009
Name: TP1. Time lag - first results
Definition:
General definition: The timeliness of statistical outputs is the length of time between the end of the event or phenomenon they describe and their availability. Specific definition: The number of days (or weeks or months) from the last day of the reference period to the day of publication of first results.
Applicability : This indicator is applicable: - to all statistical processes with preliminary data releases; - to producers. T1 is not applicable for statistical processes with only one, directly final, set of results/statistics – then only T2 is used.
Calculation formulae:
refpfrst ddT −=1 dfrst … Release date of first results; drefp… Last day (date) of the reference period of the statistics Measurement units: datum format (calendar days; if the number of days is large, it may be converted into weeks or months ) Instead of a period, the reference can also be a time point.
Target value: The target values usually are fixed by legislation or gentlemen's agreement. Nevertheless, smaller values denote higher timeliness.
Aggregation levels and principles: The calculation is done, for a meaningful choice, at subject matter domain level. It could refer to the current production round or be an average over a time period. Aggregations are possible at EU and domain (e.g. social statistics, business statistics) level.
Interpretation:
This indicator quantifies the gap between the release date of first results and the date of reference for the data. Comparisons could be made among statistical processes with the same periodicity.
Specific guidance
The reasons for possible long production times should be explained and efforts to improve the situation should be described. For annual statistics or where timeliness is measured in years rather than in days a sentence stating timeliness would be sufficient.
References: ESS Handbook for Quality Reports – 2009 Edition (Eurostat). ESS Standard for Quality Reports – 2009 Edition (Eurostat).
Name:
TP2. Time lag - final results
Definition:
General definition: The timeliness of statistical outputs is the length of time between the end of the event or phenomenon
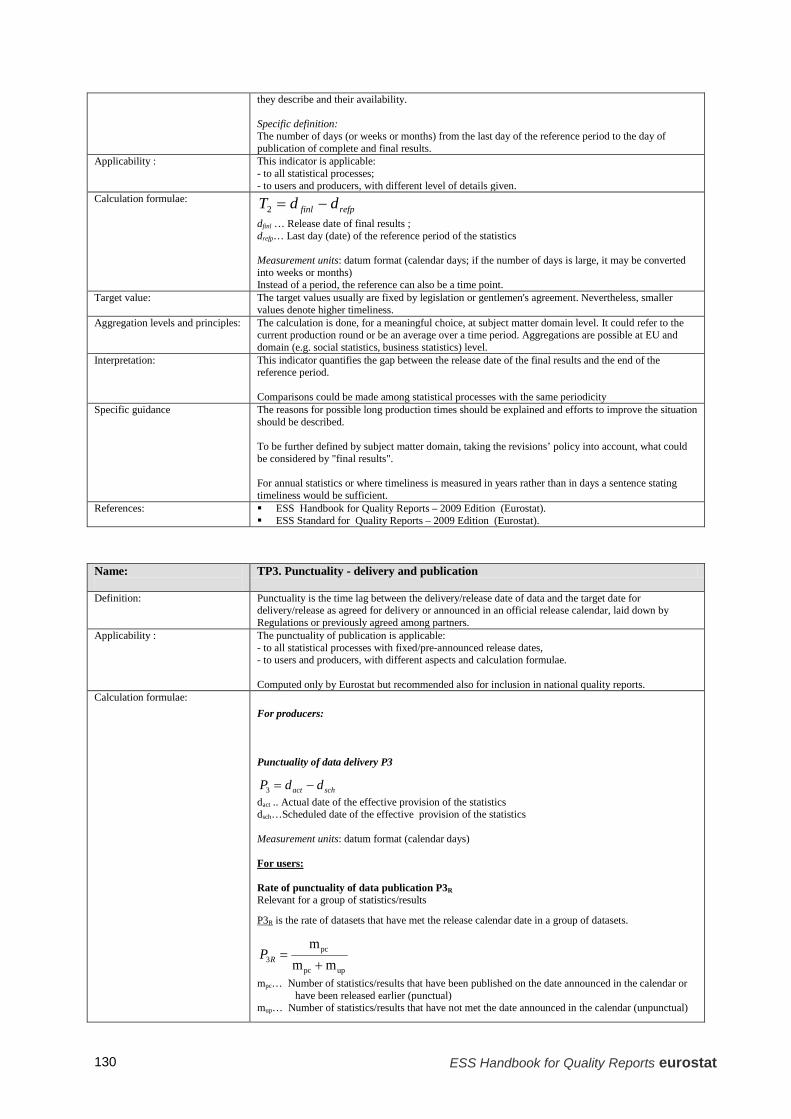
ESS Handbook for Quality Reports eurostat 130
they describe and their availability. Specific definition: The number of days (or weeks or months) from the last day of the reference period to the day of publication of complete and final results.
Applicability : This indicator is applicable: - to all statistical processes; - to users and producers, with different level of details given.
Calculation formulae:
refpfinl ddT −=2
dfinl … Release date of final results ; drefp… Last day (date) of the reference period of the statistics Measurement units: datum format (calendar days; if the number of days is large, it may be converted into weeks or months) Instead of a period, the reference can also be a time point.
Target value: The target values usually are fixed by legislation or gentlemen's agreement. Nevertheless, smaller values denote higher timeliness.
Aggregation levels and principles: The calculation is done, for a meaningful choice, at subject matter domain level. It could refer to the current production round or be an average over a time period. Aggregations are possible at EU and domain (e.g. social statistics, business statistics) level.
Interpretation:
This indicator quantifies the gap between the release date of the final results and the end of the reference period. Comparisons could be made among statistical processes with the same periodicity
Specific guidance The reasons for possible long production times should be explained and efforts to improve the situation should be described. To be further defined by subject matter domain, taking the revisions’ policy into account, what could be considered by "final results". For annual statistics or where timeliness is measured in years rather than in days a sentence stating timeliness would be sufficient.
References: ESS Handbook for Quality Reports – 2009 Edition (Eurostat). ESS Standard for Quality Reports – 2009 Edition (Eurostat).
Name:
TP3. Punctuality - delivery and publication
Definition:
Punctuality is the time lag between the delivery/release date of data and the target date for delivery/release as agreed for delivery or announced in an official release calendar, laid down by Regulations or previously agreed among partners.
Applicability : The punctuality of publication is applicable: - to all statistical processes with fixed/pre-announced release dates, - to users and producers, with different aspects and calculation formulae. Computed only by Eurostat but recommended also for inclusion in national quality reports.
Calculation formulae: For producers:
Punctuality of data delivery P3
schact ddP −=3
dact .. Actual date of the effective provision of the statistics dsch…Scheduled date of the effective provision of the statistics Measurement units: datum format (calendar days) For users: Rate of punctuality of data publication P3R Relevant for a group of statistics/results
P3R is the rate of datasets that have met the release calendar date in a group of datasets.
uppc
pc3 mm
m+
=RP
mpc… Number of statistics/results that have been published on the date announced in the calendar or have been released earlier (punctual)
mup… Number of statistics/results that have not met the date announced in the calendar (unpunctual)
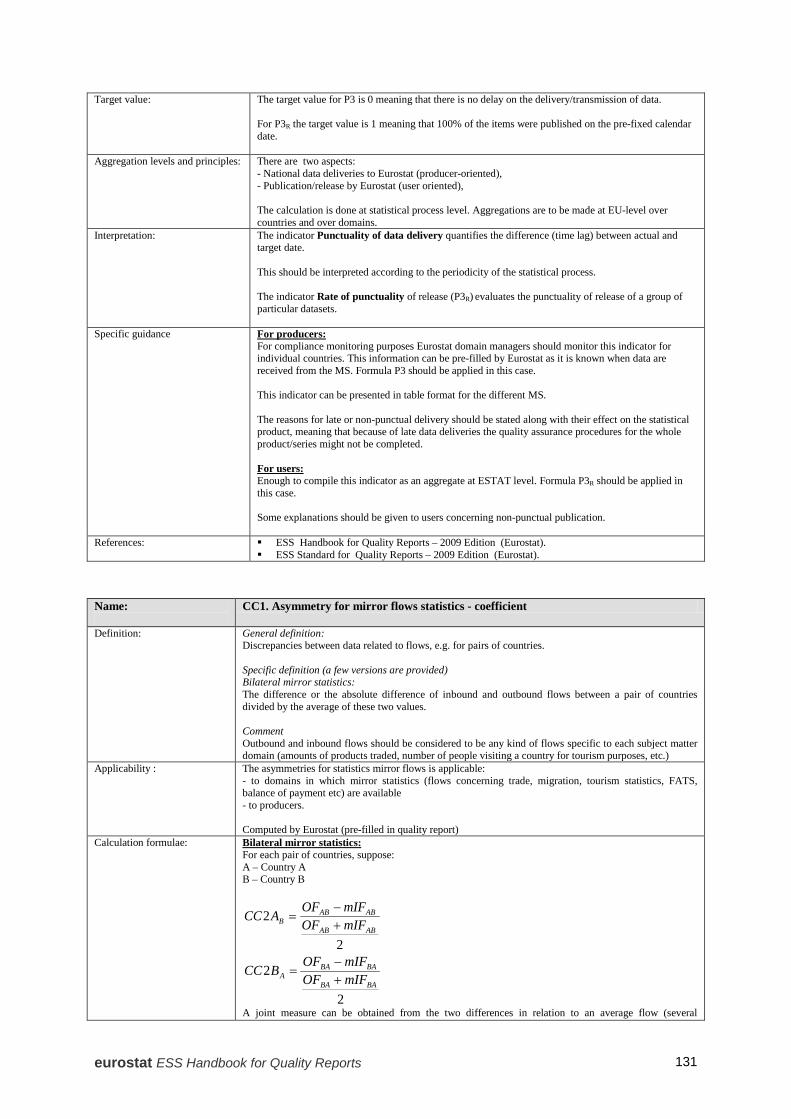
eurostat ESS Handbook for Quality Reports 131
Target value: The target value for P3 is 0 meaning that there is no delay on the delivery/transmission of data. For P3R the target value is 1 meaning that 100% of the items were published on the pre-fixed calendar date.
Aggregation levels and principles: There are two aspects: - National data deliveries to Eurostat (producer-oriented), - Publication/release by Eurostat (user oriented), The calculation is done at statistical process level. Aggregations are to be made at EU-level over countries and over domains.
Interpretation:
The indicator Punctuality of data delivery quantifies the difference (time lag) between actual and target date. This should be interpreted according to the periodicity of the statistical process. The indicator Rate of punctuality of release (P3R) evaluates the punctuality of release of a group of particular datasets.
Specific guidance
For producers: For compliance monitoring purposes Eurostat domain managers should monitor this indicator for individual countries. This information can be pre-filled by Eurostat as it is known when data are received from the MS. Formula P3 should be applied in this case. This indicator can be presented in table format for the different MS. The reasons for late or non-punctual delivery should be stated along with their effect on the statistical product, meaning that because of late data deliveries the quality assurance procedures for the whole product/series might not be completed. For users: Enough to compile this indicator as an aggregate at ESTAT level. Formula P3R should be applied in this case. Some explanations should be given to users concerning non-punctual publication.
References: ESS Handbook for Quality Reports – 2009 Edition (Eurostat). ESS Standard for Quality Reports – 2009 Edition (Eurostat).
Name:
CC1. Asymmetry for mirror flows statistics - coefficient
Definition:
General definition: Discrepancies between data related to flows, e.g. for pairs of countries. Specific definition (a few versions are provided) Bilateral mirror statistics: The difference or the absolute difference of inbound and outbound flows between a pair of countries divided by the average of these two values. Comment Outbound and inbound flows should be considered to be any kind of flows specific to each subject matter domain (amounts of products traded, number of people visiting a country for tourism purposes, etc.)
Applicability : The asymmetries for statistics mirror flows is applicable: - to domains in which mirror statistics (flows concerning trade, migration, tourism statistics, FATS, balance of payment etc) are available - to producers. Computed by Eurostat (pre-filled in quality report)
Calculation formulae:
Bilateral mirror statistics: For each pair of countries, suppose: A – Country A B – Country B
2
2ABAB
ABABB mIFOF
mIFOFACC+−
=
2
2BABA
BABAA mIFOF
mIFOFBCC+−
=
A joint measure can be obtained from the two differences in relation to an average flow (several
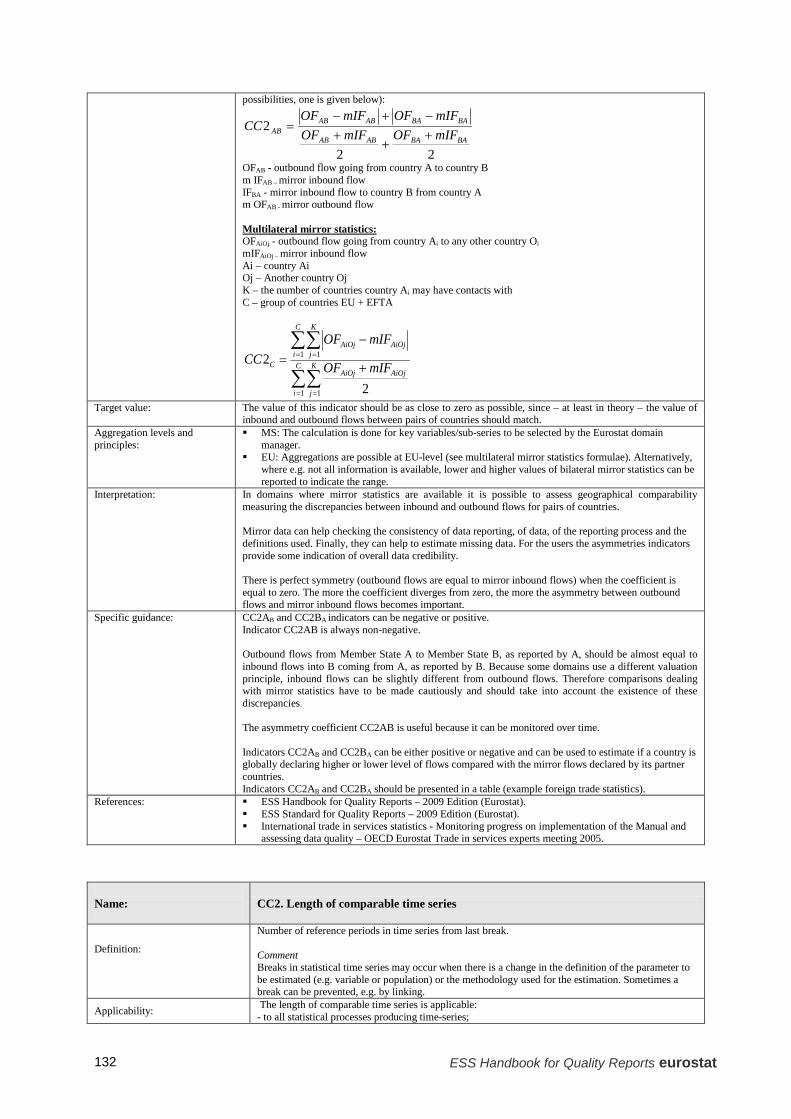
ESS Handbook for Quality Reports eurostat 132
possibilities, one is given below):
22
2BABAABAB
BABAABABAB mIFOFmIFOF
mIFOFmIFOFCC
++
+−+−
=
OFAB - outbound flow going from country A to country B m IFAB – mirror inbound flow IFBA - mirror inbound flow to country B from country A m OFAB - mirror outbound flow Multilateral mirror statistics: OFAiOj - outbound flow going from country Ai to any other country Oi mIFAiOj – mirror inbound flow Ai – country Ai Oj – Another country Oj K – the number of countries country Ai may have contacts with C – group of countries EU + EFTA
∑∑
∑∑
= =
= =
+
−= C
i
K
j
AiOjAiOj
C
i
K
jAiOjAiOj
C mIFOF
mIFOFCC
1 1
1 1
2
2
Target value: The value of this indicator should be as close to zero as possible, since – at least in theory – the value of inbound and outbound flows between pairs of countries should match.
Aggregation levels and principles:
MS: The calculation is done for key variables/sub-series to be selected by the Eurostat domain manager.
EU: Aggregations are possible at EU-level (see multilateral mirror statistics formulae). Alternatively, where e.g. not all information is available, lower and higher values of bilateral mirror statistics can be reported to indicate the range.
Interpretation:
In domains where mirror statistics are available it is possible to assess geographical comparability measuring the discrepancies between inbound and outbound flows for pairs of countries. Mirror data can help checking the consistency of data reporting, of data, of the reporting process and the definitions used. Finally, they can help to estimate missing data. For the users the asymmetries indicators provide some indication of overall data credibility. There is perfect symmetry (outbound flows are equal to mirror inbound flows) when the coefficient is equal to zero. The more the coefficient diverges from zero, the more the asymmetry between outbound flows and mirror inbound flows becomes important.
Specific guidance:
CC2AB and CC2BA indicators can be negative or positive. Indicator CC2AB is always non-negative. Outbound flows from Member State A to Member State B, as reported by A, should be almost equal to inbound flows into B coming from A, as reported by B. Because some domains use a different valuation principle, inbound flows can be slightly different from outbound flows. Therefore comparisons dealing with mirror statistics have to be made cautiously and should take into account the existence of these discrepancies. The asymmetry coefficient CC2AB is useful because it can be monitored over time. Indicators CC2AB and CC2BA can be either positive or negative and can be used to estimate if a country is globally declaring higher or lower level of flows compared with the mirror flows declared by its partner countries. Indicators CC2AB and CC2BA should be presented in a table (example foreign trade statistics).
References: ESS Handbook for Quality Reports – 2009 Edition (Eurostat). ESS Standard for Quality Reports – 2009 Edition (Eurostat). International trade in services statistics - Monitoring progress on implementation of the Manual and
assessing data quality – OECD Eurostat Trade in services experts meeting 2005.
Name:
CC2. Length of comparable time series
Definition:
Number of reference periods in time series from last break. Comment Breaks in statistical time series may occur when there is a change in the definition of the parameter to be estimated (e.g. variable or population) or the methodology used for the estimation. Sometimes a break can be prevented, e.g. by linking.
Applicability: The length of comparable time series is applicable: - to all statistical processes producing time-series;
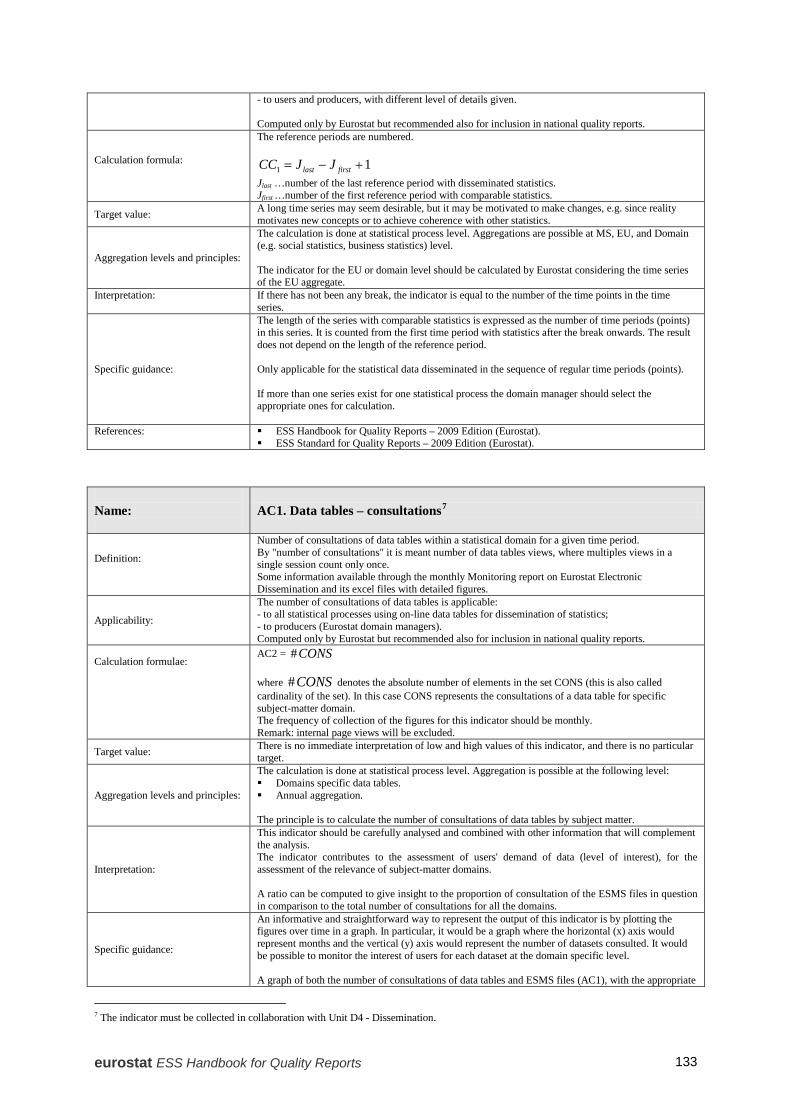
eurostat ESS Handbook for Quality Reports 133
- to users and producers, with different level of details given. Computed only by Eurostat but recommended also for inclusion in national quality reports.
Calculation formula:
The reference periods are numbered.
11 +−= firstlast JJCC
Jlast …number of the last reference period with disseminated statistics. Jfirst …number of the first reference period with comparable statistics.
Target value: A long time series may seem desirable, but it may be motivated to make changes, e.g. since reality motivates new concepts or to achieve coherence with other statistics.
Aggregation levels and principles:
The calculation is done at statistical process level. Aggregations are possible at MS, EU, and Domain (e.g. social statistics, business statistics) level. The indicator for the EU or domain level should be calculated by Eurostat considering the time series of the EU aggregate.
Interpretation:
If there has not been any break, the indicator is equal to the number of the time points in the time series.
Specific guidance:
The length of the series with comparable statistics is expressed as the number of time periods (points) in this series. It is counted from the first time period with statistics after the break onwards. The result does not depend on the length of the reference period. Only applicable for the statistical data disseminated in the sequence of regular time periods (points). If more than one series exist for one statistical process the domain manager should select the appropriate ones for calculation.
References:
ESS Handbook for Quality Reports – 2009 Edition (Eurostat). ESS Standard for Quality Reports – 2009 Edition (Eurostat).
Name:
AC1. Data tables – consultations7
Definition:
Number of consultations of data tables within a statistical domain for a given time period. By "number of consultations" it is meant number of data tables views, where multiples views in a single session count only once. Some information available through the monthly Monitoring report on Eurostat Electronic Dissemination and its excel files with detailed figures.
Applicability:
The number of consultations of data tables is applicable: - to all statistical processes using on-line data tables for dissemination of statistics; - to producers (Eurostat domain managers). Computed only by Eurostat but recommended also for inclusion in national quality reports.
Calculation formulae:
AC2 = CONS# where CONS# denotes the absolute number of elements in the set CONS (this is also called cardinality of the set). In this case CONS represents the consultations of a data table for specific subject-matter domain. The frequency of collection of the figures for this indicator should be monthly. Remark: internal page views will be excluded.
Target value: There is no immediate interpretation of low and high values of this indicator, and there is no particular target.
Aggregation levels and principles:
The calculation is done at statistical process level. Aggregation is possible at the following level: Domains specific data tables. Annual aggregation. The principle is to calculate the number of consultations of data tables by subject matter.
Interpretation:
This indicator should be carefully analysed and combined with other information that will complement the analysis. The indicator contributes to the assessment of users' demand of data (level of interest), for the assessment of the relevance of subject-matter domains. A ratio can be computed to give insight to the proportion of consultation of the ESMS files in question in comparison to the total number of consultations for all the domains.
Specific guidance:
An informative and straightforward way to represent the output of this indicator is by plotting the figures over time in a graph. In particular, it would be a graph where the horizontal (x) axis would represent months and the vertical (y) axis would represent the number of datasets consulted. It would be possible to monitor the interest of users for each dataset at the domain specific level. A graph of both the number of consultations of data tables and ESMS files (AC1), with the appropriate
7 The indicator must be collected in collaboration with Unit D4 - Dissemination.

ESS Handbook for Quality Reports eurostat 134
tuning, would be interesting to display. References:
ESS Handbook for Quality Reports – 2009 Edition (Eurostat). ESS Standard for Quality Reports – 2009 Edition (Eurostat).
Name:
AC2. Metadata - consultations 8
Definition:
Number of metadata consultations (ESMS) within a statistical domain for a given time period. By "number of consultations" it is meant the number of times a metadata file is viewed. Some information is available through the monthly Monitoring report on Eurostat Electronic Dissemination and its excel files with detailed figures.
Applicability This indicator is applicable: - to all statistical processes; - to producers (Eurostat domain managers). Computed only by Eurostat.
Calculation formulae:
AC1 = ESMS# where ESMS# denotes the absolute number of elements in the set ESMS (this is also called cardinality of the set). In this case the set ESMS represents the ESMS files consulted for a specific subject-matter domain for a given time period. Remark: internal page views will be excluded.
Target value: There is no immediate interpretation of low and high values of this indicator, and there is no particular target.
Aggregation levels and principles: The calculation is done at statistical process level. Aggregation is possible at the following levels: Domains specific ESMS files. Annual aggregation.
The principle is to calculate the number of consultations of ESMS files by subject matter domains.
Interpretation:
The indicator contributes to the assessment of users' demand of metadata (level of interest), for the assessment of the relevance of subject-matter domains. A ratio can be computed to give insight to the proportion of consultation of the ESMS files in question in comparison to the total number of consultations for all the domains.
Specific guidance
An informative and straightforward way to represent the output of this indicator is by plotting the figures over time in a graph. In particular, it would be a graph where the horizontal (x) axis would represent months and the vertical (y) axis would represent the number of ESMS files consulted. It would be possible to monitor the interest of users for each ESMS file at the domain specific level. A graph of both the number of consultations of data tables (indicator AC2) and metadata (ESMS) files with a correspondence, with the appropriate tuning, would be interesting to display, over time.
References: ESS Handbook for Quality Reports – 2009 Edition (Eurostat). ESS Standard for Quality Reports – 2009 Edition (Eurostat).
Name:
AC3. Metadata completeness - rate
Definition:
The ratio of the number of metadata elements provided to the total number of metadata elements applicable.
Applicability:
The rate of completeness of metadata is applicable: - to all statistical processes; - to producers (Eurostat domain managers). Computed only by Eurostat but recommended also for inclusion in national quality reports.
Calculation formulae:
∑
∑=
L
L
C
MAC
#
#3
L in the denominator is the set of applicable metadata elements under consideration and M L in the
numerator is the subset of L of available metadata elements. The notation L# means the number of elements in the set L (the cardinality). Letter C in the left-hand side of the formula stands for both
8 The indicator must be collected in collaboration with Unit D4 - Dissemination.
eurostat ESS Handbook for Quality Reports 135
EU and EFTA countries. The set L is obtained by calculation for a group of metadata elements as explained below over a geographical entity (MS or the EU+EFTA), a statistical domain, etc. There are three groups of metadata, described below together with a categorisation using the current EURO-SDMX concepts (only the main concepts are included in the following breakdown).
1. Metadata about statistical outputs; concepts 3, 4, 5, 8.1, 9, 10;
2. Metadata about statistical processes; concepts 11, 20.1, 20.2, 20.3, 20.4, 20.5, 20.6;
3. Metadata about quality: concepts 12-19
Computations are made separately for each of the three groups and for each of the combinations (group of metadata, EU level, etc.)
Target value: The target value is 1 meaning that 100% of metadata is available from what is required/applicable to the statistical process, or aggregate, in question.
Aggregation levels and principles:
The calculation is done at the level of ESMS files. Aggregations are possible at MS, EU, and Domain (e.g. social statistics, business statistics) level. The principle is to calculate the indicators as an un-weighted rate at the level of MS and EU for a statistical domain (social statistics, business statistics etc.).
Interpretation:
Each indicator shows to what extent metadata of a specific type is available compared to what should be available. This indicator should be carefully analysed since this rate only reflects the existing amount of metadata for a certain statistical process but not the quality of that information.
Specific guidance:
All the information is to be retrieved from ESMS files. In case the ESMS is empty for the different categories specified previously no calculation is needed but a descriptive text should be replaced. Concerning Eurostat, it is possible to have direct access to those files through Eurostat's website whereas for MS it will be possible to have access to ESMS files, in the near future, through the National RME tool. It should be taken into account what availability of metadata actually means.
References:
ESS Handbook for Quality Reports – 2009 Edition (Eurostat). ESS Standard for Quality Reports – 2009 Edition (Eurostat). Euro SDMX Metadata Structure, version March 2009.

ESS Handbook for Quality Reports eurostat 136
2 Technical Manual of the Single Integrated Metadata Structure (SIMS)
EUROPEAN COMMISSION EUROSTAT Directorate B: Corporate statistical and IT services Unit B-1: Quality, Methodology and Research
Luxembourg ESTAT/B1/AB D(2013)
TECHNICAL MANUAL
of the
SINGLE INTEGRATED METADATA STRUCTURE (SIMS)
- Dynamic inventory and conceptual framework for all ESS quality and reference metadata concepts, with a unique definition and clear reporting guidelines -
This Manual as well as the Single Integrated Metadata Structure were established by the Task Force on Quality Reporting, a sub-group of the Working Group on Quality in Statistics on the recommendation of the High-Level Task Force Sponsorship on Quality, in close co-operation with the
ESS Metadata Working Group, in 2012-2013 For more information, please contact Unit B1 of Eurostat: [email protected]
eurostat ESS Handbook for Quality Reports 137
1. Introduction In order to
• streamline and harmonise metadata and quality reporting in the ESS • decrease the reporting burden on the statistical authorities by creating the framework for “once for all purposes” reporting,
where each concept is only reported upon once and is re-usable for other reporting • create an integrated and consistent quality and metadata reporting framework where the reports are stored in the same
database • create a flexible and up to date system where future extensions are possible by adding new concepts,
a dynamic and unique inventory of ESS quality and metadata statistical concepts has been created: the “Single Integrated Metadata Structure” (SIMS) – cf. recommendation No 6.4.2. of the Sponsorship on Quality. In this structure, all statistical concepts of the two existing ESS report structures (ESMS and ESQRS) have been included and streamlined, by assuring that all concepts appear and are therefore reported upon only once (direct re-usability of existing information). It is a dynamic structure in the sense that additional statistical metadata and quality concepts can be included if necessary in the future. The two metadata and quality reporting structures ESMS and ESQRS9 have been integrated and harmonised on the basis of the following principles:
All concepts in the existing metadata and quality report structures are included; The statistical concepts appear only once; The same concept names and the same quality indicators are always used in the different ESS metadata and quality report
structures; The descriptions and the guidelines for the compilation of the concepts and sub-concepts have been reviewed and harmonised The concepts are consistent with the SDMX statistical standards as listed in the SDMX Content-oriented Guidelines.
This "Technical Manual of the Single Integrated Metadata Structure" gives an overview and guidance on the use of the structure, in particular in terms of deriving the appropriate ESS metadata and quality report structures from this conceptual framework. It has to be noted that some of the statistical concepts of the SIMS structure can be filled in before the statistical production process takes place, i.e. in the planning phase of the survey. Some items related to the statistical output (like timeliness, punctuality, errors etc) cannot be fully filled in before the statistical activity is carried out. This aspect of "regular circle" has to be taken into account when compiling the yearly statistical programme and when planning a regular quality reporting exercise describing processes for all statistical activities in the ESS. In accordance with the recommendations of the Sponsorship on Quality, it has to be underlined that data users and data producers have different needs with regard to statistical information and this has to be reflected by the quality reports that are addressed to them. The distinction between the user-(U) and producer (P) -oriented quality reporting is assured through the platform of the Single Integrated Metadata Structure which – through its unique and flexible nature – enables the derivation of different subsets of information in the form of pre-defined report structures. The short user-oriented or user quality report (U) is implemented through the improved visibility and readability of the quality related concepts that are included in ESMS (cf. chapter 3 of the Manual). The detailed producer-oriented or producer quality report (P) is implemented via the ESQRS report structure (cf. chapter 3 of the Manual). All quality related concepts and indicators of both the user and producer oriented quality reports – together with all other metadata concepts – form an integrated part of the SIMS inventory. The SIMS inventory is attached in Annex 1 of this Manual. In the SIMS, items stemming from the ESMS are marked in red, those coming from the ESQRS in green and if they are present in both structures, they are marked in yellow (50 concepts out of 103). Annex 2 includes the streamlined and harmonised ESS descriptions and guidelines for each of the concepts and sub-concepts which are part of the SIMS inventory. These descriptions and guidelines should be used by the producers of metadata. More specific reporting guidance is included in the updated ESS Handbook on Quality Reporting10. This Handbook gives practical examples for the production of most of the quality concepts and explains how the different types of data collection and compilation methods and processes have to be considered in the quality reports.
9 The “Euro-SDMX Metadata Structure” (ESMS) is recommended to the ESS in Commission Recommendation 2009/498 and the more specific quality report structure was prepared on the basis of the ESS Standard and Handbook for Quality Reports and is called The ESS Standard for Quality Reports Structure” (ESQRS). 10 The 2009 edition of the Handbook is available at http://epp.eurostat.ec.europa.eu/portal/page/portal/ver-1/quality/documents/EHQR_FINAL.pdf and the updated version will be published in 2014.
ESS Handbook for Quality Reports eurostat 138
Definitions The Single Integrated Metadata Structure is the dynamic inventory of statistical concepts used for quality and metadata reporting in the ESS.
The statistical concepts are units of knowledge which are created by a unique combination of characteristics. The statistical concepts (headings) used in this list are all part of the list of the standard SDMX cross-domain concepts and are therefore fully SDMX compliant. In SIMS, there are 22 statistical concepts used. A sub-concept is a breakdown of a statistical concept.
A quality report structure or a metadata report structure can be derived from the Single Integrated Metadata Structure inventory. Examples for ESS report structures currently in use are the ESMS metadata report structure and the ESQRS quality report structure.
Reference metadata describes the contents and the quality of the statistical data.
The National Reference Metadata Editor (NRME) is part of the ESS Metadata Handler and the tool for the production, exchange and dissemination of reference and quality related metadata within the ESS. It allows for an online production and transmission as well as the re-use of the information, for having more harmonised and available metadata on quality for both the users and producers of European statistics.
2. Use and general characteristics of the SIMS 2.1 Use of the structure The dynamic inventory of concepts, the Single Integrated Metadata Structure is implemented through specific quality and metadata related report structures. SIMS is used to define:
The ESS reference metadata report structure: the Euro SDMX Metadata Structure (ESMS). The ESMS is then technically implemented as SDMX-compliant metadata structure definition (MSD) using digit levels 1 and 2 of the respective concepts of SIMS;
A quality report, which contains detailed / less detailed information on quality concepts. For the user-oriented quality report the statistical concepts related to data quality are broken down into digit levels 1 and 2 whilst for the producer-oriented quality report those concepts are broken down further into details (i.e. into the digit levels 1, 2, 3 and 4 of SIMS).
In the future, the SIMS inventory (attached in Annex 1 to this document) as well as the descriptions and reporting guidelines of the different SIMS concepts (attached in Annex 2) can be updated and/or extended with additional concepts coming from additional user needs (e.g. by taking into account additional statistical concepts describing statistical processes more in detail cf. concept S.21, etc). These requests for revising the guidelines and/or the concepts of SIMS will have to be submitted to Eurostat. They will be treated by an electronic Task Force (e-Task Force) that will be periodically set up from the members of the Working Group on Quality in Statistics. The results of the work of the e-Task Force will be approved at the subsequent meeting of the Working Group on Quality in Statistics. The present document focuses on the quality concepts which are – with their full granularity – covered by the SIMS inventory. The ESS quality reports can be specified according to different dimensions. A quality report can be prepared:
By scope: For a specific statistical process (e.g. Labour Force Survey) or homogeneous group of processes; For an individual statistical indicator (e.g. Employment rate).
By level:
At national level of the ESS; At European (Eurostat) level.
By orientation/addressees:
To be addressed to the users of the statistics (U); To be addressed to the producers of the statistics (P).
Metadata or quality reports are normally attached to a statistical process producing a homogeneous dissemination/output dataset. In cases ESS quality reports are produced for statistical indicators, many concepts in this report will refer to the underlying statistical process. The frequency of an ESS quality report can vary in function of the needs of the subject of the quality report (infra-annual, yearly, every 2, 3… years, etc). Often an update of the quality report is required after broader changes of the data structures or of the underlying business processes.
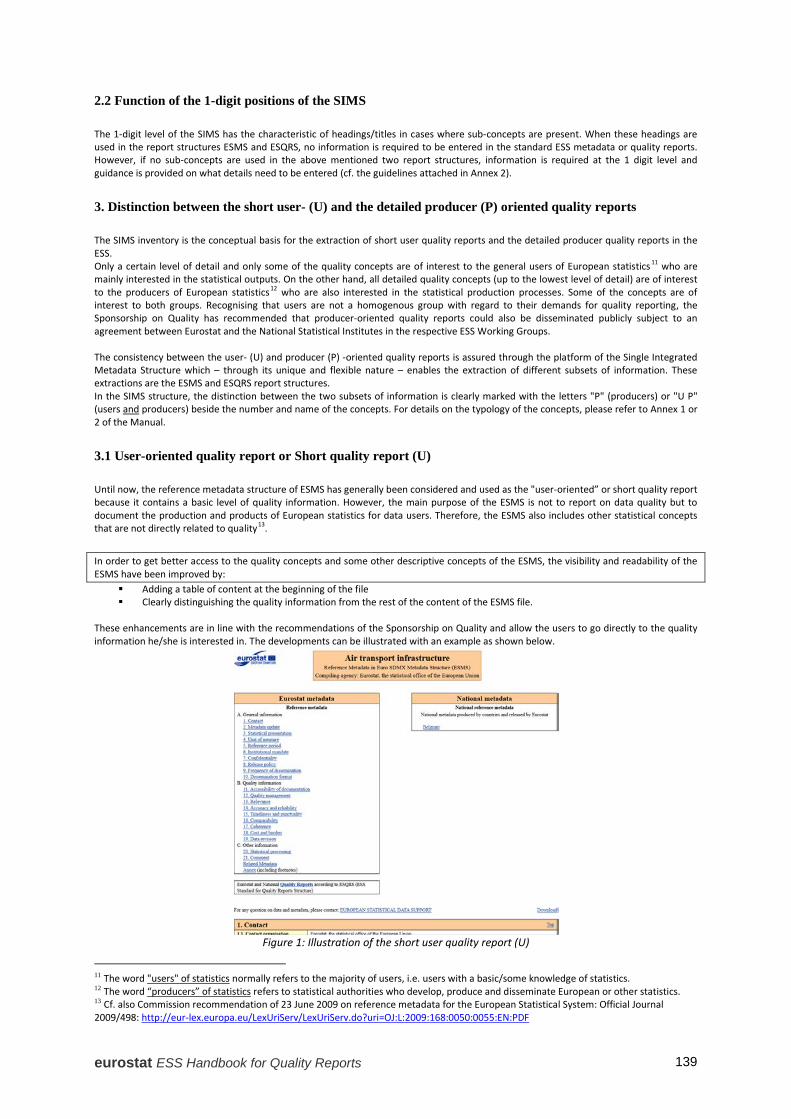
eurostat ESS Handbook for Quality Reports 139
2.2 Function of the 1-digit positions of the SIMS The 1-digit level of the SIMS has the characteristic of headings/titles in cases where sub-concepts are present. When these headings are used in the report structures ESMS and ESQRS, no information is required to be entered in the standard ESS metadata or quality reports. However, if no sub-concepts are used in the above mentioned two report structures, information is required at the 1 digit level and guidance is provided on what details need to be entered (cf. the guidelines attached in Annex 2).
3. Distinction between the short user- (U) and the detailed producer (P) oriented quality reports The SIMS inventory is the conceptual basis for the extraction of short user quality reports and the detailed producer quality reports in the ESS. Only a certain level of detail and only some of the quality concepts are of interest to the general users of European statistics 11 who are mainly interested in the statistical outputs. On the other hand, all detailed quality concepts (up to the lowest level of detail) are of interest to the producers of European statistics12 who are also interested in the statistical production processes. Some of the concepts are of interest to both groups. Recognising that users are not a homogenous group with regard to their demands for quality reporting, the Sponsorship on Quality has recommended that producer-oriented quality reports could also be disseminated publicly subject to an agreement between Eurostat and the National Statistical Institutes in the respective ESS Working Groups. The consistency between the user- (U) and producer (P) -oriented quality reports is assured through the platform of the Single Integrated Metadata Structure which – through its unique and flexible nature – enables the extraction of different subsets of information. These extractions are the ESMS and ESQRS report structures. In the SIMS structure, the distinction between the two subsets of information is clearly marked with the letters "P" (producers) or "U P" (users and producers) beside the number and name of the concepts. For details on the typology of the concepts, please refer to Annex 1 or 2 of the Manual.
3.1 User-oriented quality report or Short quality report (U) Until now, the reference metadata structure of ESMS has generally been considered and used as the "user-oriented” or short quality report because it contains a basic level of quality information. However, the main purpose of the ESMS is not to report on data quality but to document the production and products of European statistics for data users. Therefore, the ESMS also includes other statistical concepts that are not directly related to quality13. In order to get better access to the quality concepts and some other descriptive concepts of the ESMS, the visibility and readability of the ESMS have been improved by:
Adding a table of content at the beginning of the file Clearly distinguishing the quality information from the rest of the content of the ESMS file.
These enhancements are in line with the recommendations of the Sponsorship on Quality and allow the users to go directly to the quality information he/she is interested in. The developments can be illustrated with an example as shown below.
Figure 1: Illustration of the short user quality report (U)
11 The word "users" of statistics normally refers to the majority of users, i.e. users with a basic/some knowledge of statistics. 12 The word “producers” of statistics refers to statistical authorities who develop, produce and disseminate European or other statistics. 13 Cf. also Commission recommendation of 23 June 2009 on reference metadata for the European Statistical System: Official Journal 2009/498: http://eur-lex.europa.eu/LexUriServ/LexUriServ.do?uri=OJ:L:2009:168:0050:0055:EN:PDF
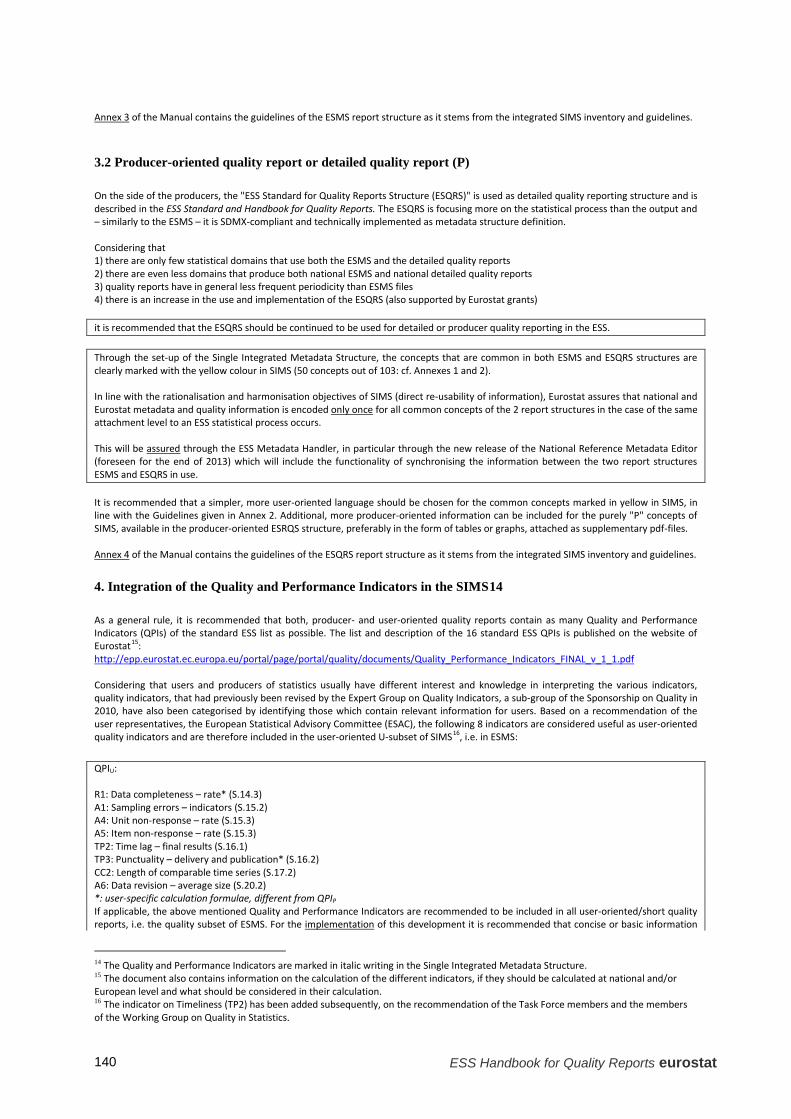
ESS Handbook for Quality Reports eurostat 140
Annex 3 of the Manual contains the guidelines of the ESMS report structure as it stems from the integrated SIMS inventory and guidelines. 3.2 Producer-oriented quality report or detailed quality report (P) On the side of the producers, the "ESS Standard for Quality Reports Structure (ESQRS)" is used as detailed quality reporting structure and is described in the ESS Standard and Handbook for Quality Reports. The ESQRS is focusing more on the statistical process than the output and – similarly to the ESMS – it is SDMX-compliant and technically implemented as metadata structure definition. Considering that 1) there are only few statistical domains that use both the ESMS and the detailed quality reports 2) there are even less domains that produce both national ESMS and national detailed quality reports 3) quality reports have in general less frequent periodicity than ESMS files 4) there is an increase in the use and implementation of the ESQRS (also supported by Eurostat grants) it is recommended that the ESQRS should be continued to be used for detailed or producer quality reporting in the ESS. Through the set-up of the Single Integrated Metadata Structure, the concepts that are common in both ESMS and ESQRS structures are clearly marked with the yellow colour in SIMS (50 concepts out of 103: cf. Annexes 1 and 2). In line with the rationalisation and harmonisation objectives of SIMS (direct re-usability of information), Eurostat assures that national and Eurostat metadata and quality information is encoded only once for all common concepts of the 2 report structures in the case of the same attachment level to an ESS statistical process occurs. This will be assured through the ESS Metadata Handler, in particular through the new release of the National Reference Metadata Editor (foreseen for the end of 2013) which will include the functionality of synchronising the information between the two report structures ESMS and ESQRS in use. It is recommended that a simpler, more user-oriented language should be chosen for the common concepts marked in yellow in SIMS, in line with the Guidelines given in Annex 2. Additional, more producer-oriented information can be included for the purely "P" concepts of SIMS, available in the producer-oriented ESRQS structure, preferably in the form of tables or graphs, attached as supplementary pdf-files. Annex 4 of the Manual contains the guidelines of the ESQRS report structure as it stems from the integrated SIMS inventory and guidelines. 4. Integration of the Quality and Performance Indicators in the SIMS14 As a general rule, it is recommended that both, producer- and user-oriented quality reports contain as many Quality and Performance Indicators (QPIs) of the standard ESS list as possible. The list and description of the 16 standard ESS QPIs is published on the website of Eurostat15: http://epp.eurostat.ec.europa.eu/portal/page/portal/quality/documents/Quality_Performance_Indicators_FINAL_v_1_1.pdf Considering that users and producers of statistics usually have different interest and knowledge in interpreting the various indicators, quality indicators, that had previously been revised by the Expert Group on Quality Indicators, a sub-group of the Sponsorship on Quality in 2010, have also been categorised by identifying those which contain relevant information for users. Based on a recommendation of the user representatives, the European Statistical Advisory Committee (ESAC), the following 8 indicators are considered useful as user-oriented quality indicators and are therefore included in the user-oriented U-subset of SIMS16, i.e. in ESMS: QPIU: R1: Data completeness – rate* (S.14.3) A1: Sampling errors – indicators (S.15.2) A4: Unit non-response – rate (S.15.3) A5: Item non-response – rate (S.15.3) TP2: Time lag – final results (S.16.1) TP3: Punctuality – delivery and publication* (S.16.2) CC2: Length of comparable time series (S.17.2) A6: Data revision – average size (S.20.2) *: user-specific calculation formulae, different from QPIP If applicable, the above mentioned Quality and Performance Indicators are recommended to be included in all user-oriented/short quality reports, i.e. the quality subset of ESMS. For the implementation of this development it is recommended that concise or basic information
14 The Quality and Performance Indicators are marked in italic writing in the Single Integrated Metadata Structure. 15 The document also contains information on the calculation of the different indicators, if they should be calculated at national and/or European level and what should be considered in their calculation. 16 The indicator on Timeliness (TP2) has been added subsequently, on the recommendation of the Task Force members and the members of the Working Group on Quality in Statistics.
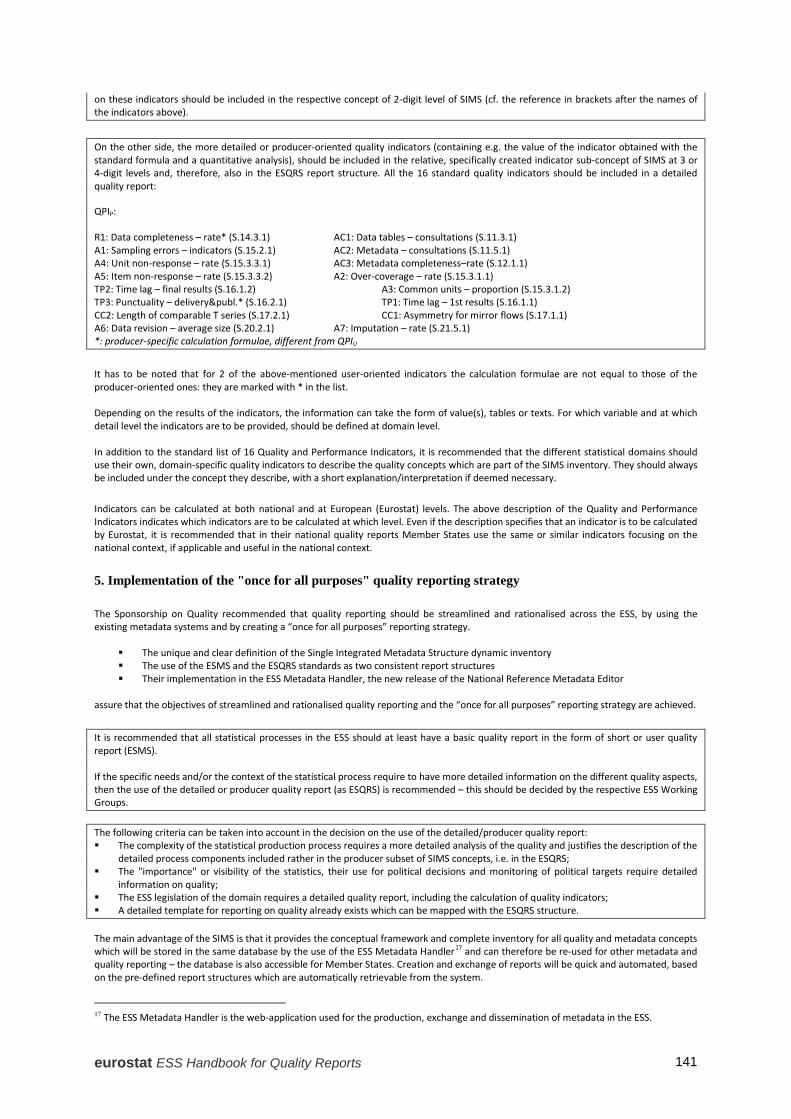
eurostat ESS Handbook for Quality Reports 141
on these indicators should be included in the respective concept of 2-digit level of SIMS (cf. the reference in brackets after the names of the indicators above).
On the other side, the more detailed or producer-oriented quality indicators (containing e.g. the value of the indicator obtained with the standard formula and a quantitative analysis), should be included in the relative, specifically created indicator sub-concept of SIMS at 3 or 4-digit levels and, therefore, also in the ESQRS report structure. All the 16 standard quality indicators should be included in a detailed quality report: QPIP: R1: Data completeness – rate* (S.14.3.1) AC1: Data tables – consultations (S.11.3.1) A1: Sampling errors – indicators (S.15.2.1) AC2: Metadata – consultations (S.11.5.1) A4: Unit non-response – rate (S.15.3.3.1) AC3: Metadata completeness–rate (S.12.1.1) A5: Item non-response – rate (S.15.3.3.2) A2: Over-coverage – rate (S.15.3.1.1) TP2: Time lag – final results (S.16.1.2) A3: Common units – proportion (S.15.3.1.2) TP3: Punctuality – delivery&publ.* (S.16.2.1) TP1: Time lag – 1st results (S.16.1.1) CC2: Length of comparable T series (S.17.2.1) CC1: Asymmetry for mirror flows (S.17.1.1) A6: Data revision – average size (S.20.2.1) A7: Imputation – rate (S.21.5.1) *: producer-specific calculation formulae, different from QPIU
It has to be noted that for 2 of the above-mentioned user-oriented indicators the calculation formulae are not equal to those of the producer-oriented ones: they are marked with * in the list. Depending on the results of the indicators, the information can take the form of value(s), tables or texts. For which variable and at which detail level the indicators are to be provided, should be defined at domain level. In addition to the standard list of 16 Quality and Performance Indicators, it is recommended that the different statistical domains should use their own, domain-specific quality indicators to describe the quality concepts which are part of the SIMS inventory. They should always be included under the concept they describe, with a short explanation/interpretation if deemed necessary. Indicators can be calculated at both national and at European (Eurostat) levels. The above description of the Quality and Performance Indicators indicates which indicators are to be calculated at which level. Even if the description specifies that an indicator is to be calculated by Eurostat, it is recommended that in their national quality reports Member States use the same or similar indicators focusing on the national context, if applicable and useful in the national context.
5. Implementation of the "once for all purposes" quality reporting strategy The Sponsorship on Quality recommended that quality reporting should be streamlined and rationalised across the ESS, by using the existing metadata systems and by creating a “once for all purposes” reporting strategy.
The unique and clear definition of the Single Integrated Metadata Structure dynamic inventory The use of the ESMS and the ESQRS standards as two consistent report structures Their implementation in the ESS Metadata Handler, the new release of the National Reference Metadata Editor
assure that the objectives of streamlined and rationalised quality reporting and the “once for all purposes” reporting strategy are achieved. It is recommended that all statistical processes in the ESS should at least have a basic quality report in the form of short or user quality report (ESMS). If the specific needs and/or the context of the statistical process require to have more detailed information on the different quality aspects, then the use of the detailed or producer quality report (as ESQRS) is recommended – this should be decided by the respective ESS Working Groups. The following criteria can be taken into account in the decision on the use of the detailed/producer quality report: The complexity of the statistical production process requires a more detailed analysis of the quality and justifies the description of the
detailed process components included rather in the producer subset of SIMS concepts, i.e. in the ESQRS; The "importance" or visibility of the statistics, their use for political decisions and monitoring of political targets require detailed
information on quality; The ESS legislation of the domain requires a detailed quality report, including the calculation of quality indicators; A detailed template for reporting on quality already exists which can be mapped with the ESQRS structure. The main advantage of the SIMS is that it provides the conceptual framework and complete inventory for all quality and metadata concepts which will be stored in the same database by the use of the ESS Metadata Handler17 and can therefore be re-used for other metadata and quality reporting – the database is also accessible for Member States. Creation and exchange of reports will be quick and automated, based on the pre-defined report structures which are automatically retrievable from the system.
17 The ESS Metadata Handler is the web-application used for the production, exchange and dissemination of metadata in the ESS.

ESS Handbook for Quality Reports eurostat 142
The unique and clear definition of each item of SIMS and the use of the two consistent report structures assure that the extracted ESS reports are coherent and comparable over time and across statistical domains. SIMS also assures that all ESS report structures such as the ESMS and the ESQRS used for user and producer oriented quality reports are kept consistent in terms of the statistical concepts used. SIMS could evolve over time with the new ESS metadata report structures and will be available on the Eurostat website, on the metadata and quality sections. The implementation of SDMX and the provision of the ESS Metadata Handler as shared services containing the ESMS and ESQRS report structures enable a further rationalisation and integration of metadata and quality reports within the ESS. Furthermore, the use of SDMX-compliant reporting structures will enhance the exchange of metadata among international organisations, i.e. already collected metadata can be retrieved from the ESS metadata system and reused which would thus reduce the reporting burden on countries. Please refer to Annex 5 of this Manual for further details on the National Reference Metadata Editor.
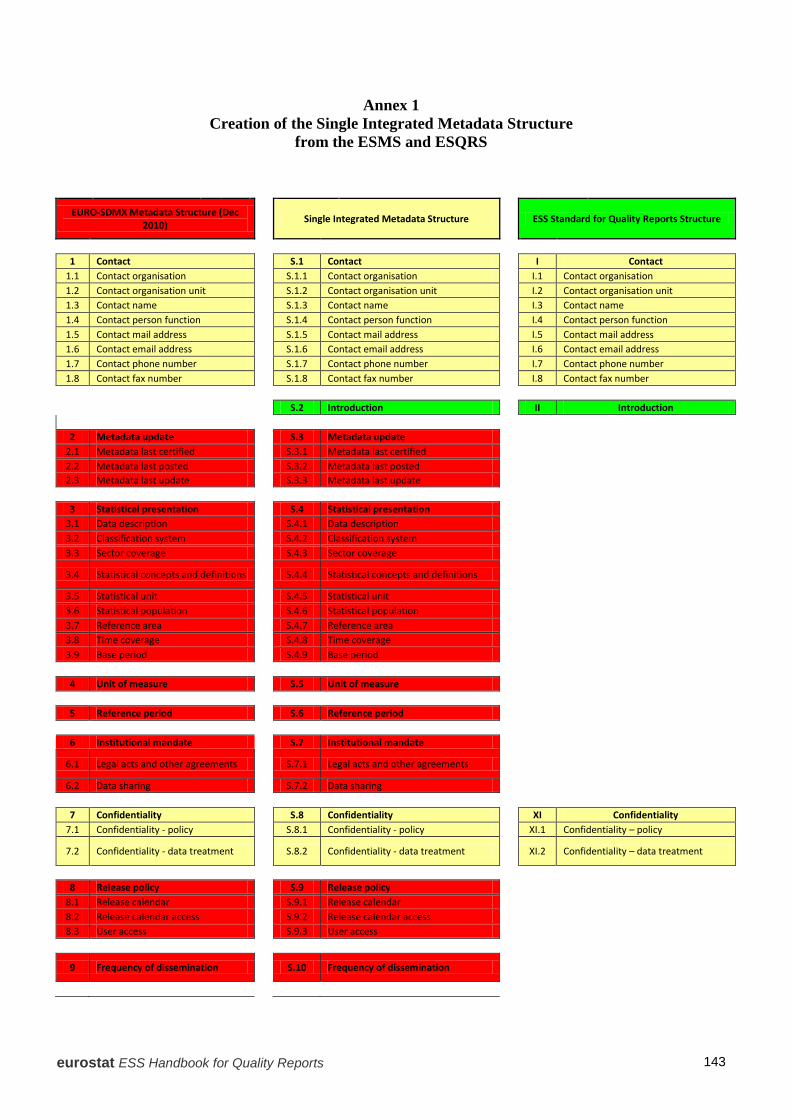
eurostat ESS Handbook for Quality Reports 143
Annex 1 Creation of the Single Integrated Metadata Structure
from the ESMS and ESQRS
EURO-SDMX Metadata Structure (Dec 2010) Single Integrated Metadata Structure
ESS Standard for Quality Reports Structure
1 Contact S.1 Contact
I Contact 1.1 Contact organisation S.1.1 Contact organisation
I.1 Contact organisation
1.2 Contact organisation unit S.1.2 Contact organisation unit
I.2 Contact organisation unit 1.3 Contact name S.1.3 Contact name
I.3 Contact name
1.4 Contact person function S.1.4 Contact person function
I.4 Contact person function 1.5 Contact mail address S.1.5 Contact mail address
I.5 Contact mail address
1.6 Contact email address S.1.6 Contact email address
I.6 Contact email address 1.7 Contact phone number S.1.7 Contact phone number
I.7 Contact phone number
1.8 Contact fax number S.1.8 Contact fax number
I.8 Contact fax number
S.2 Introduction
II Introduction
2 Metadata update S.3 Metadata update 2.1 Metadata last certified S.3.1 Metadata last certified 2.2 Metadata last posted S.3.2 Metadata last posted 2.3 Metadata last update S.3.3 Metadata last update 3 Statistical presentation S.4 Statistical presentation 3.1 Data description S.4.1 Data description 3.2 Classification system S.4.2 Classification system 3.3 Sector coverage S.4.3 Sector coverage
3.4 Statistical concepts and definitions S.4.4 Statistical concepts and definitions
3.5 Statistical unit S.4.5 Statistical unit 3.6 Statistical population S.4.6 Statistical population 3.7 Reference area S.4.7 Reference area 3.8 Time coverage S.4.8 Time coverage 3.9 Base period S.4.9 Base period
4 Unit of measure S.5 Unit of measure
5 Reference period S.6 Reference period
6 Institutional mandate S.7 Institutional mandate
6.1 Legal acts and other agreements S.7.1 Legal acts and other agreements
6.2 Data sharing S.7.2 Data sharing 7 Confidentiality S.8 Confidentiality
XI Confidentiality 7.1 Confidentiality - policy S.8.1 Confidentiality - policy
XI.1 Confidentiality – policy
7.2 Confidentiality - data treatment S.8.2 Confidentiality - data treatment
XI.2 Confidentiality – data treatment
8 Release policy S.9 Release policy
8.1 Release calendar S.9.1 Release calendar 8.2 Release calendar access S.9.2 Release calendar access 8.3 User access S.9.3 User access
9 Frequency of dissemination S.10 Frequency of dissemination

ESS Handbook for Quality Reports eurostat 144
10 Dissemination format S.11 Dissemination format, Accessibility and clarity
VII Accessibility and clarity
10.1 News release S.11.1 News release
VII.1 News release 10.2 Publications S.11.2 Publications
VII.2 Publication
10.3 On-line database S.11.3 On-line database
VII.3 On-line database
S.11.3.
1 AC1. Data tables - consultations
VII.3.1 Data tables - consultations
10.4 Micro-data access S.11.4 Micro-data access
VII.4 Micro-data access 10.5 Other S.11.5 Other
VII.5 Other
S.11.5.
1 AC 2. Metadata - consultations
VII.5.1 Metadata - consultations
11 Accessibility of documentation S.12 Accessibility of documentation
11.1 Documentation on methodology S.12.1 Documentation on methodology
VII.6 Documentation on methodology
S.12.1.
1 AC 3. Metadata completeness - rate
VII.6.1 Metadata completeness – rate
11.2 Quality documentation S.12.2 Quality documentation
VII.7 Quality documentation
12 Quality management S.13 Quality management 12.1 Quality assurance S.13.1 Quality assurance 12.2 Quality assessment S.13.2 Quality assessment
III Quality assessment
13 Relevance S.14 Relevance
IV Relevance 13.1 User needs S.14.1 User needs
IV.1 User needs
13.2 User satisfaction S.14.2 User satisfaction
IV.2 User satisfaction
13.3 Completeness S.14.3 Completeness and R1. Data completeness - rate for U
IV.3 Completeness
S.14.3.
1 R1. Data completeness - rate for P
IV.3.1 Data completeness - rate
14 Accuracy and reliability S.15 Accuracy and reliability
V Accuracy and reliability
14.1 Overall accuracy S.15.1 Overall accuracy
V.1 Overall accuracy
14.2 Sampling error S.15.2 Sampling error and A1. Sampling errors - indicators for U
V.2 Sampling error
S.15.2.
1 A1. Sampling errors - indicators for P
V.2.1 Sampling errors - indicators
14.3 Non-sampling error S.15.3 Non-sampling error and A4. Unit non-response - rate for U and A5. Item non-response - rate for U
V.3 Non-sampling error
S.15.3.1 Coverage error
V.3.1 Coverage error
S.15.3.1.1 A2. Over-coverage - rate
V.3.1.1 Over-coverage - rate
S.15.3.1.2 A3. Common units - proportion
S.15.3.2 Measurement error
V.3.2 Measurement error
S.15.3.3 Non response error
V.3.3 Non response error
S.15.3.3.1 A4. Unit non-response - rate for P
V.3.3.1 Unit non-response - rate
S.15.3.3.2 A5. Item non-response - rate for P
V.3.3.2 Item non-response - rate
S.15.3.4 Processing error
V.3.4 Processing error
V.3.4.1 Imputation - rate
V.3.4.2 Common units - proportion
S.15.3.5 Model assumption error
V.3.5 Model assumption error
V.3.7 Seasonal adjustment
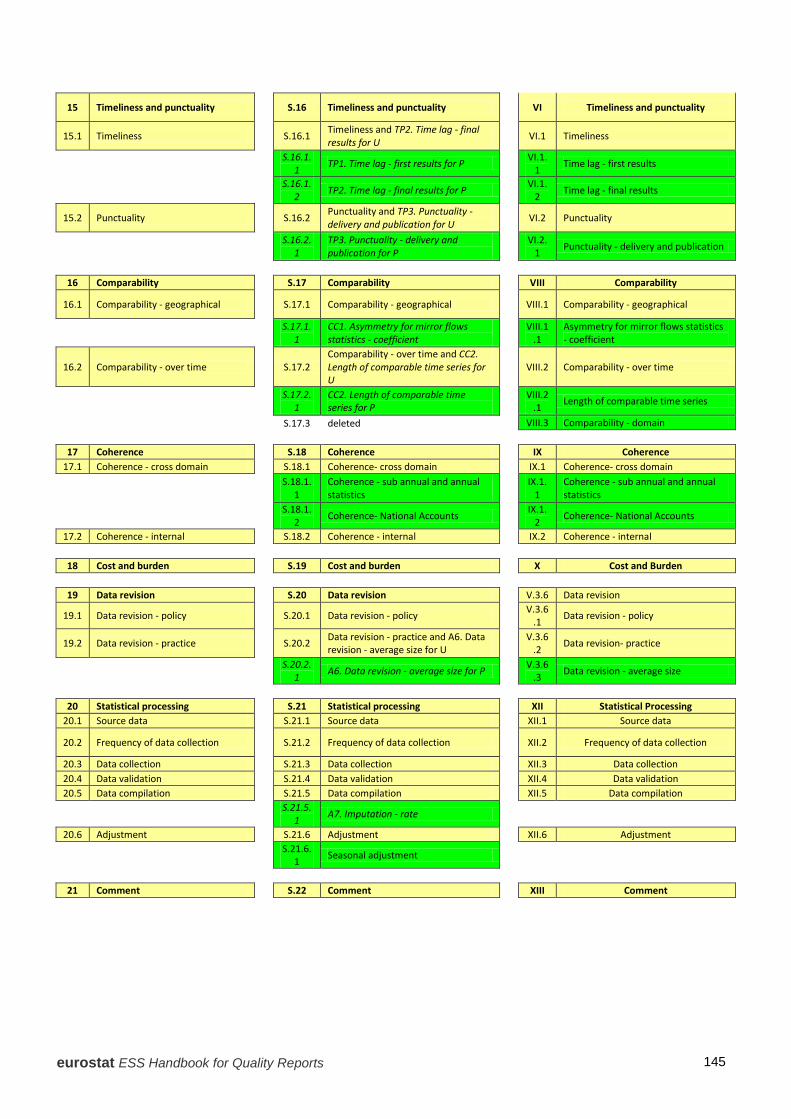
eurostat ESS Handbook for Quality Reports 145
15 Timeliness and punctuality S.16 Timeliness and punctuality
VI Timeliness and punctuality
15.1 Timeliness S.16.1 Timeliness and TP2. Time lag - final results for U
VI.1 Timeliness
S.16.1.1 TP1. Time lag - first results for P
VI.1.1 Time lag - first results
S.16.1.2 TP2. Time lag - final results for P
VI.1.2 Time lag - final results
15.2 Punctuality S.16.2 Punctuality and TP3. Punctuality - delivery and publication for U
VI.2 Punctuality
S.16.2.1
TP3. Punctuality - delivery and publication for P
VI.2.1 Punctuality - delivery and publication
16 Comparability S.17 Comparability
VIII Comparability
16.1 Comparability - geographical S.17.1 Comparability - geographical
VIII.1 Comparability - geographical
S.17.1.1
CC1. Asymmetry for mirror flows statistics - coefficient
VIII.1.1
Asymmetry for mirror flows statistics - coefficient
16.2 Comparability - over time S.17.2 Comparability - over time and CC2. Length of comparable time series for U
VIII.2 Comparability - over time
S.17.2.1
CC2. Length of comparable time series for P
VIII.2.1 Length of comparable time series
S.17.3 deleted
VIII.3 Comparability - domain
17 Coherence S.18 Coherence
IX Coherence 17.1 Coherence - cross domain S.18.1 Coherence- cross domain
IX.1 Coherence- cross domain
S.18.1.1
Coherence - sub annual and annual statistics
IX.1.1
Coherence - sub annual and annual statistics
S.18.1.2 Coherence- National Accounts
IX.1.2 Coherence- National Accounts
17.2 Coherence - internal S.18.2 Coherence - internal
IX.2 Coherence - internal
18 Cost and burden S.19 Cost and burden
X Cost and Burden
19 Data revision S.20 Data revision
V.3.6 Data revision
19.1 Data revision - policy S.20.1 Data revision - policy
V.3.6.1 Data revision - policy
19.2 Data revision - practice S.20.2 Data revision - practice and A6. Data revision - average size for U
V.3.6.2 Data revision- practice
S.20.2.1 A6. Data revision - average size for P
V.3.6.3 Data revision - average size
20 Statistical processing S.21 Statistical processing
XII Statistical Processing 20.1 Source data S.21.1 Source data
XII.1 Source data
20.2 Frequency of data collection S.21.2 Frequency of data collection
XII.2 Frequency of data collection
20.3 Data collection S.21.3 Data collection
XII.3 Data collection 20.4 Data validation S.21.4 Data validation
XII.4 Data validation
20.5 Data compilation S.21.5 Data compilation
XII.5 Data compilation
S.21.5.1 A7. Imputation - rate
20.6 Adjustment S.21.6 Adjustment
XII.6 Adjustment
S.21.6.1 Seasonal adjustment
21 Comment S.22 Comment
XIII Comment
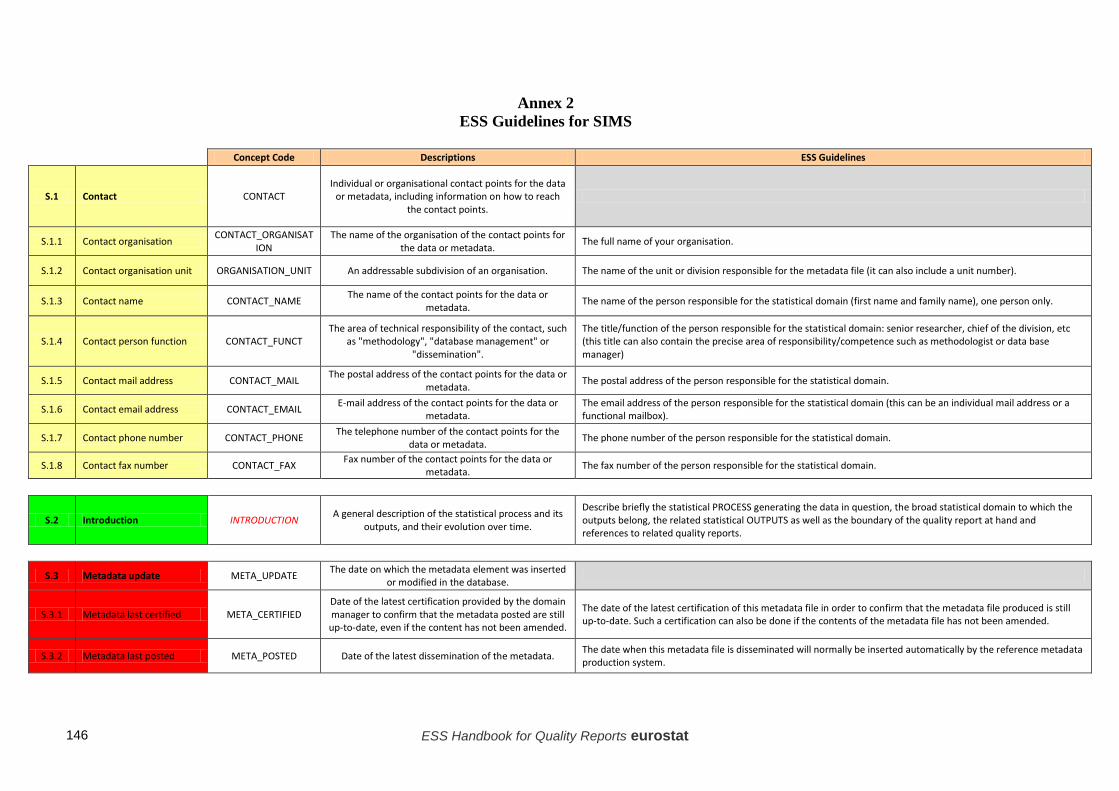
ESS Handbook for Quality Reports eurostat 146
Annex 2 ESS Guidelines for SIMS
Concept Code Descriptions ESS Guidelines
S.1 Contact CONTACT Individual or organisational contact points for the data
or metadata, including information on how to reach the contact points.
S.1.1 Contact organisation CONTACT_ORGANISATION
The name of the organisation of the contact points for the data or metadata. The full name of your organisation.
S.1.2 Contact organisation unit ORGANISATION_UNIT An addressable subdivision of an organisation. The name of the unit or division responsible for the metadata file (it can also include a unit number).
S.1.3 Contact name CONTACT_NAME The name of the contact points for the data or metadata. The name of the person responsible for the statistical domain (first name and family name), one person only.
S.1.4 Contact person function CONTACT_FUNCT The area of technical responsibility of the contact, such
as "methodology", "database management" or "dissemination".
The title/function of the person responsible for the statistical domain: senior researcher, chief of the division, etc (this title can also contain the precise area of responsibility/competence such as methodologist or data base manager)
S.1.5 Contact mail address CONTACT_MAIL The postal address of the contact points for the data or metadata. The postal address of the person responsible for the statistical domain.
S.1.6 Contact email address CONTACT_EMAIL E-mail address of the contact points for the data or metadata.
The email address of the person responsible for the statistical domain (this can be an individual mail address or a functional mailbox).
S.1.7 Contact phone number CONTACT_PHONE The telephone number of the contact points for the data or metadata. The phone number of the person responsible for the statistical domain.
S.1.8 Contact fax number CONTACT_FAX Fax number of the contact points for the data or metadata. The fax number of the person responsible for the statistical domain.
S.2 Introduction INTRODUCTION A general description of the statistical process and its outputs, and their evolution over time.
Describe briefly the statistical PROCESS generating the data in question, the broad statistical domain to which the outputs belong, the related statistical OUTPUTS as well as the boundary of the quality report at hand and references to related quality reports.
S.3 Metadata update META_UPDATE The date on which the metadata element was inserted
or modified in the database.
S.3.1 Metadata last certified META_CERTIFIED Date of the latest certification provided by the domain manager to confirm that the metadata posted are still up-to-date, even if the content has not been amended.
The date of the latest certification of this metadata file in order to confirm that the metadata file produced is still up-to-date. Such a certification can also be done if the contents of the metadata file has not been amended.
S.3.2 Metadata last posted META_POSTED Date of the latest dissemination of the metadata. The date when this metadata file is disseminated will normally be inserted automatically by the reference metadata production system.

eurostat ESS Handbook for Quality Reports 147
S.3.3 Metadata last update META_LAST_UPDATE Date of last update of the content of the metadata. The date when this metadata file is last updated will normally also be inserted by the reference metadata production system.
S.4 Statistical presentation STAT_PRES Description of the disseminated data which can be displayed to users as tables, graphs or maps.
S.4.1 Data description DATA_DESCR Main characteristics of the data set, referring to the data and indicators disseminated.
Describe shortly the main characteristics of the data set in an easily and quickly understandable manner, referring to the main data and indicators disseminated. More detailed descriptions on the variables are in S.4.4.
S.4.2 Classification system CLASS_SYSTEM Arrangement or division of objects into groups based on characteristics which the objects have in common.
List all international or standard classifications and breakdowns which are used for the data set produced (with their detailed names).
S.4.3 Sector coverage COVERAGE_SECTOR Main economic or other sectors covered by the statistics.
List the main economic or other sectors covered by the data set produced and the size classes/size bands used (e.g. number of employees, etc).
S.4.4 Statistical concepts and definitions STAT_CONC_DEF Statistical characteristics of statistical observations,
variables. Describe in short the main statistical variables provided. The definition and types of variables provided should be listed, together with any Information on discrepancies from the ESS/ international standards.
S.4.5 Statistical unit STAT_UNIT Entity for which information is sought and for which statistics are ultimately compiled.
List the basic units of statistical observation for which data are provided. These observation units (e.g. the enterprise, the local unit, private households,...) can be different from the reporting units used in the underlying statistical surveys.
S.4.6 Statistical population STAT_POP The total membership or population or "universe" of a defined class of people, objects or events.
Describe the target statistical population (one or more) which the data set refers to, i.e. the population about which information is to be sought.
S.4.7 Reference area REF_AREA The country or geographic area to which the measured statistical phenomenon relates.
At European level: The geographical area covered by the data set disseminated (e.g. EU Members states, EU regions, USA, Japan, etc. as well as aggregates such as EU-27, EEA). At national level: the country, the regions and aggregates covered by the data set disseminated.
S.4.8 Time coverage COVERAGE_TIME The length of time for which data are available. The time periods covered by the data set should be described (i.e. the length of time for which data set is disseminated, e.g. 1985-2006 or 2000-… for certain annual data).
S.4.9 Base period BASE_PER The period of time used as the base of an index number, or to which a constant series refers.
The period of time used as a base of an index number or to which a time series refers should be described (e.g. base year 2000 for certain annual data).
S.5 Unit of measure UNIT_MEASURE The unit in which the data values are measured. The units of measures used for the data set disseminated should be listed (units of measures are e.g. Euro, %,
number of persons). Also the exact use of magnitude (e.g. thousand, million) should be added.
S.6 Reference period REF_PERIOD The period of time or point in time to which the measured observation is intended to refer.
Statistical variables refer to specific time periods, which can be a specific day or a specific period (e.g. a month, a fiscal year, a calendar year or several calendar years). When there is a mismatch between the target and the actual reference period, for instance when data are not available for the target reference period, the difference should also be highlighted.
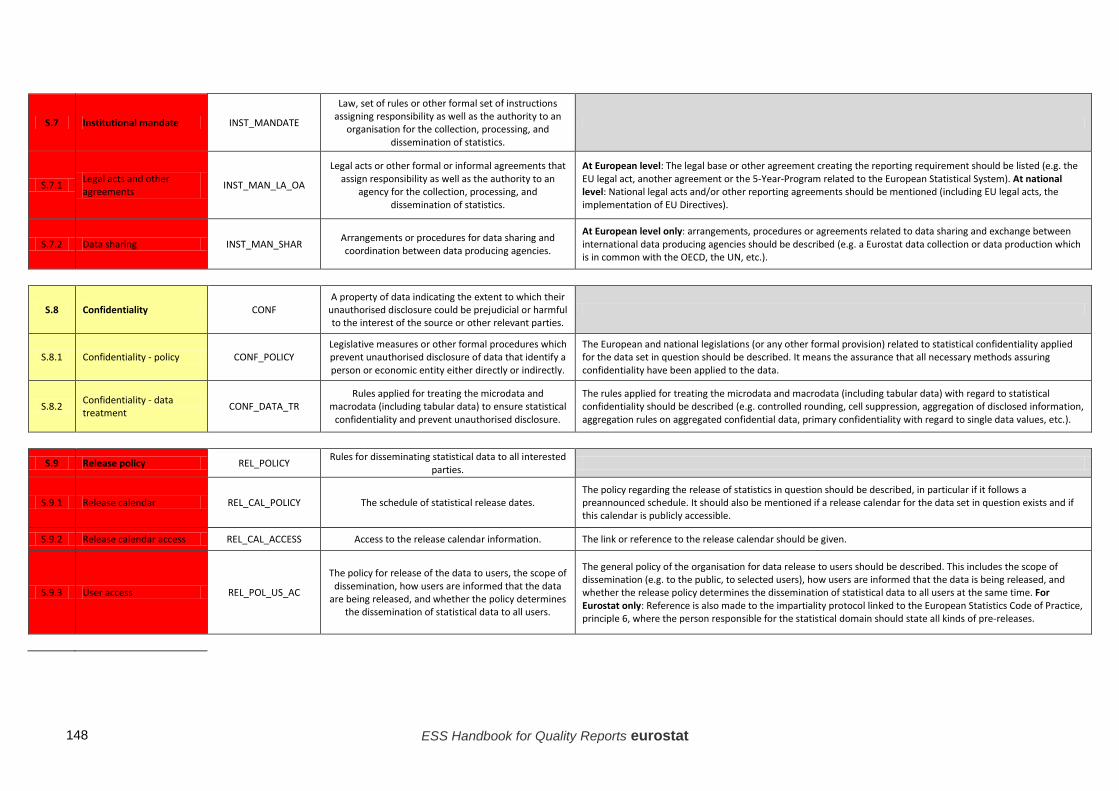
ESS Handbook for Quality Reports eurostat 148
S.7 Institutional mandate INST_MANDATE
Law, set of rules or other formal set of instructions assigning responsibility as well as the authority to an
organisation for the collection, processing, and dissemination of statistics.
S.7.1 Legal acts and other agreements INST_MAN_LA_OA
Legal acts or other formal or informal agreements that assign responsibility as well as the authority to an
agency for the collection, processing, and dissemination of statistics.
At European level: The legal base or other agreement creating the reporting requirement should be listed (e.g. the EU legal act, another agreement or the 5-Year-Program related to the European Statistical System). At national level: National legal acts and/or other reporting agreements should be mentioned (including EU legal acts, the implementation of EU Directives).
S.7.2 Data sharing INST_MAN_SHAR Arrangements or procedures for data sharing and coordination between data producing agencies.
At European level only: arrangements, procedures or agreements related to data sharing and exchange between international data producing agencies should be described (e.g. a Eurostat data collection or data production which is in common with the OECD, the UN, etc.).
S.8 Confidentiality CONF A property of data indicating the extent to which their
unauthorised disclosure could be prejudicial or harmful to the interest of the source or other relevant parties.
S.8.1 Confidentiality - policy CONF_POLICY Legislative measures or other formal procedures which prevent unauthorised disclosure of data that identify a person or economic entity either directly or indirectly.
The European and national legislations (or any other formal provision) related to statistical confidentiality applied for the data set in question should be described. It means the assurance that all necessary methods assuring confidentiality have been applied to the data.
S.8.2 Confidentiality - data treatment CONF_DATA_TR
Rules applied for treating the microdata and macrodata (including tabular data) to ensure statistical
confidentiality and prevent unauthorised disclosure.
The rules applied for treating the microdata and macrodata (including tabular data) with regard to statistical confidentiality should be described (e.g. controlled rounding, cell suppression, aggregation of disclosed information, aggregation rules on aggregated confidential data, primary confidentiality with regard to single data values, etc.).
S.9 Release policy REL_POLICY Rules for disseminating statistical data to all interested
parties.
S.9.1 Release calendar REL_CAL_POLICY The schedule of statistical release dates. The policy regarding the release of statistics in question should be described, in particular if it follows a preannounced schedule. It should also be mentioned if a release calendar for the data set in question exists and if this calendar is publicly accessible.
S.9.2 Release calendar access REL_CAL_ACCESS Access to the release calendar information. The link or reference to the release calendar should be given.
S.9.3 User access REL_POL_US_AC
The policy for release of the data to users, the scope of dissemination, how users are informed that the data
are being released, and whether the policy determines the dissemination of statistical data to all users.
The general policy of the organisation for data release to users should be described. This includes the scope of dissemination (e.g. to the public, to selected users), how users are informed that the data is being released, and whether the release policy determines the dissemination of statistical data to all users at the same time. For Eurostat only: Reference is also made to the impartiality protocol linked to the European Statistics Code of Practice, principle 6, where the person responsible for the statistical domain should state all kinds of pre-releases.

eurostat ESS Handbook for Quality Reports 149
S.10 Frequency of dissemination FREQ_DISS The time interval at which the statistics are
disseminated over a given time period.
The frequency with which the data is disseminated (e.g. monthly, quarterly, yearly) should be stated. The frequency can also be expressed by using the codes released in the harmonised code list available for the European Statistical System as long as it is easily understandable.
S.11 Dissemination format, Accessibility and clarity
DISS_FORMAT / ACCESS_CLARITY
Media, various means and formats by which statistical data and metadata are disseminated to users and their
accessibility. Accessibility and clarity refer to the simplicity and ease, the conditions and modalities by which users can access, use and interpret statistics,
with the appropriate supporting information and assistance.
S.11.1 News release NEWS_REL Regular or ad-hoc press releases linked to the data. Regular or ad-hoc press releases linked to the data set in question should be described.
S.11.2 Publications PUBLICATIONS Regular or ad-hoc publications in which the data are made available to the public.
The titles of publications using the data set in question should be listed, with publisher, year and link to on-line documents if available.
S.11.3 On-line database ONLINE_DB Information about on-line databases in which the disseminated data can be accessed.
The on-line database available for the data set in question should be described. This includes the domain names as released on the website and link to the on-line database.
S.11.3.1
AC1. Data tables - consultations DATATABLE_CONSULT
Number of consultations of data tables within a statistical domain for a given time period displayed in a
graph. QPI: AC1 Data tables - consultations
S.11.4 Micro-data access MICRO_DAT_ACC Information on whether micro-data are also disseminated.
Describe if and how the data set is accessible as micro-data (e.g. for researchers). Also the micro-data anonymisation rules should be described in short.
S.11.5 Other DISS_OTHER References to the most important other data dissemination done.
The most important other data dissemination means should be described (e.g. within other publications, policy papers, etc.) and an overview of the different aspects of the dissemination practice and their impact on accessibility and clarity of the data should be stated. For Member States: Pricing policies and registration for database access and their likely effect on access should be described together with the limits on access set by confidentiality provisions and any other restrictions; dissemination of data to Eurostat and other international organisations (IMF, OECD, ... if applicable and not described under "S.7.1 Legal acts and other agreements"), and internal dissemination of data to other statistical activities within the NSI.
S.11.5.1
AC 2. Metadata - consultations METADATA_CONSULT Number of metadata consultations within a statistical
domain for a given time period. QPI: AC2 Metadata - consultations
S.12 Accessibility of documentation ACCESS_DOC
The conditions and modalities by which users can obtain, use and interpret documentation on the data,
i.e. descriptive text used to define or describe an object, design, specification, instructions or procedure.
S.12.1 Documentation on methodology DOC_METHOD Descriptive text and references to methodological
documents available.
Describe the availability of national reference metadata files, important methodological papers, summary documents or other important handbooks. Title, publisher, year and links to on-line documents if possible should be described.
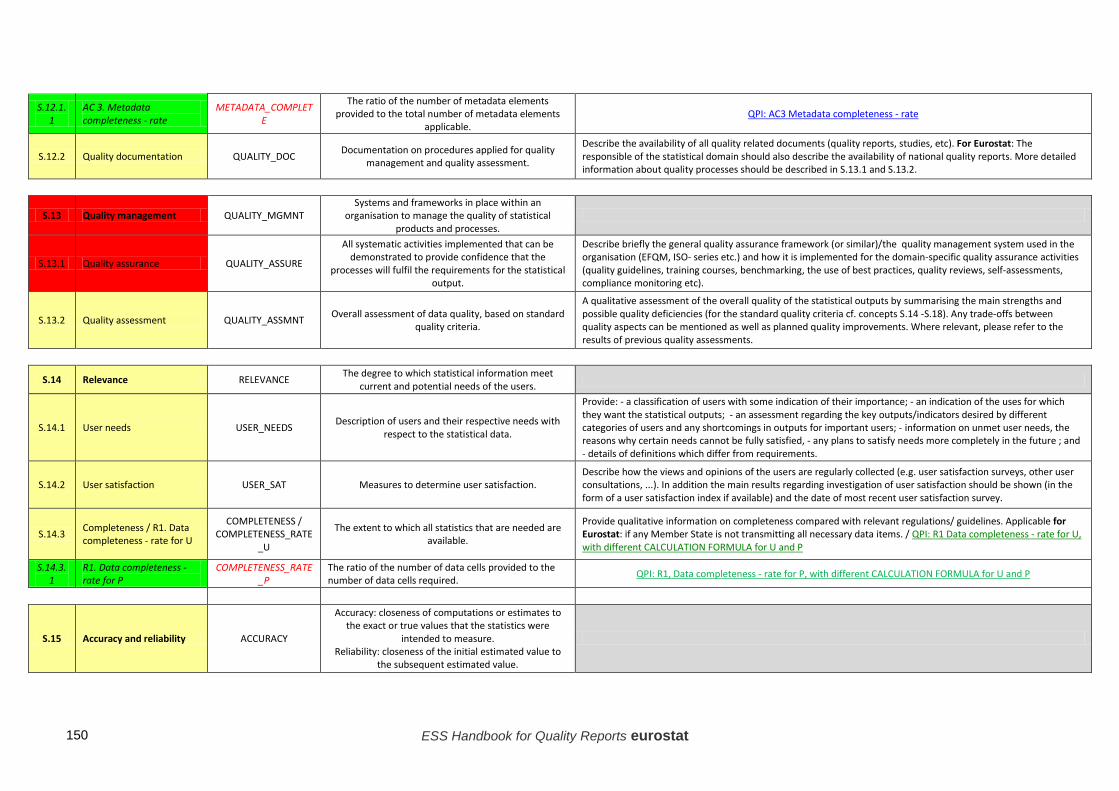
ESS Handbook for Quality Reports eurostat 150
S.12.1.1
AC 3. Metadata completeness - rate
METADATA_COMPLETE
The ratio of the number of metadata elements provided to the total number of metadata elements
applicable. QPI: AC3 Metadata completeness - rate
S.12.2 Quality documentation QUALITY_DOC Documentation on procedures applied for quality management and quality assessment.
Describe the availability of all quality related documents (quality reports, studies, etc). For Eurostat: The responsible of the statistical domain should also describe the availability of national quality reports. More detailed information about quality processes should be described in S.13.1 and S.13.2.
S.13 Quality management QUALITY_MGMNT Systems and frameworks in place within an
organisation to manage the quality of statistical products and processes.
S.13.1 Quality assurance QUALITY_ASSURE
All systematic activities implemented that can be demonstrated to provide confidence that the
processes will fulfil the requirements for the statistical output.
Describe briefly the general quality assurance framework (or similar)/the quality management system used in the organisation (EFQM, ISO- series etc.) and how it is implemented for the domain-specific quality assurance activities (quality guidelines, training courses, benchmarking, the use of best practices, quality reviews, self-assessments, compliance monitoring etc).
S.13.2 Quality assessment QUALITY_ASSMNT Overall assessment of data quality, based on standard quality criteria.
A qualitative assessment of the overall quality of the statistical outputs by summarising the main strengths and possible quality deficiencies (for the standard quality criteria cf. concepts S.14 -S.18). Any trade-offs between quality aspects can be mentioned as well as planned quality improvements. Where relevant, please refer to the results of previous quality assessments.
S.14 Relevance RELEVANCE The degree to which statistical information meet
current and potential needs of the users.
S.14.1 User needs USER_NEEDS Description of users and their respective needs with respect to the statistical data.
Provide: - a classification of users with some indication of their importance; - an indication of the uses for which they want the statistical outputs; - an assessment regarding the key outputs/indicators desired by different categories of users and any shortcomings in outputs for important users; - information on unmet user needs, the reasons why certain needs cannot be fully satisfied, - any plans to satisfy needs more completely in the future ; and - details of definitions which differ from requirements.
S.14.2 User satisfaction USER_SAT Measures to determine user satisfaction. Describe how the views and opinions of the users are regularly collected (e.g. user satisfaction surveys, other user consultations, ...). In addition the main results regarding investigation of user satisfaction should be shown (in the form of a user satisfaction index if available) and the date of most recent user satisfaction survey.
S.14.3 Completeness / R1. Data completeness - rate for U
COMPLETENESS / COMPLETENESS_RATE
_U
The extent to which all statistics that are needed are available.
Provide qualitative information on completeness compared with relevant regulations/ guidelines. Applicable for Eurostat: if any Member State is not transmitting all necessary data items. / QPI: R1 Data completeness - rate for U, with different CALCULATION FORMULA for U and P
S.14.3.1
R1. Data completeness - rate for P
COMPLETENESS_RATE_P
The ratio of the number of data cells provided to the number of data cells required. QPI: R1, Data completeness - rate for P, with different CALCULATION FORMULA for U and P
S.15 Accuracy and reliability ACCURACY
Accuracy: closeness of computations or estimates to the exact or true values that the statistics were
intended to measure. Reliability: closeness of the initial estimated value to
the subsequent estimated value.

eurostat ESS Handbook for Quality Reports 151
S.15.1 Overall accuracy ACCURACY_OVERALL Assessment of accuracy, linked to a certain data set or domain, which is summarising the various components.
Describe the main sources of random and systematic error in the statistical outputs and provide a summary assessment of all errors with special focus on the impact on key estimates. The bias assessment can be in quantitative or qualitative terms, or both. It should reflect the producer’s best current understanding (sign and order of magnitude) including actions taken to reduce bias. Revision aspects should also be included here if considered relevant.
S.15.2 Sampling error / A1. Sampling errors - indicators for U
SAMPLING_ERR / SAMPLING_ERR_IND_
U
That part of the difference between a population value and an estimate thereof, derived from a random
sample, which is due to the fact that only a subset of the population is enumerated.
If probability sampling is used, the range of variation, among key variables, of the A1 indicator should be reported. It should be also stated if adjustments for non-response, misclassifications and other uncertainty sources such as outlier treatment are included. The calculation of sampling error could be also affected by imputation. This should be noted unless special methods have been applied to deal with this. If non-probability sampling is used, the person responsible for the statistical domain should provide estimates of the accuracy, a motivation for the invoked model for this estimation, and brief discussion of sampling bias. / QPI: A1 Sampling errors - indicators for U, with different LEVEL OF DETAILS for U and P
S.15.2.1
A1. Sampling errors - indicators for P
SAMPLING_ERR_IND_P
Precision measures for estimating the random variation of an estimator due to sampling. QPI: A1 Sampling errors - indicators for P, with different LEVEL OF DETAILS for U and P
S.15.3
Non-sampling error and A4. Unit non-response - rate for U and A5. Item non-response - rate for U
NONSAMPLING_ERR / UNIT_NONRESPONSE_
RATE_U / ITEM_NONRESPONSE
_RATE_U
Error in survey estimates which cannot be attributed to sampling fluctuations.
U: Provide a user-oriented summary of the (preferably quantitative) assessment of the non-sampling errors, non-response rates and the bias risks which are associated with them (coverage error: over/ undercoverage and multiple listings; measurement error: survey instrument, respondent and interviewer effect where relevant; nonresponse error: level of unit (non)response including causes and measures for nonresponse, level of item nonresponse for key variables; processing error: data editing, coding and imputation error where relevant; model assumption error: specific models used in estimation) and actions undertaken to reduce the different types of errors. P: Not to be reported, information to be included in the sub-concepts S.15.3.1-S.15.3.5. / QPI: A4 Unit non-response - rate for U, with different LEVEL OF DETAILS for U and P / QPI: A5, Item non-response - rate for U, with different LEVEL OF DETAILS for U and P
S.15.3.1 Coverage error COVERAGE_ERR Divergence between the frame population and the
target population.
Some information on the register or other frame source should be reported upon (this assists in understanding coverage errors and their effects): reference period, frequency and timing of frame updates, updating actions, eventual discrepancies between the units reported in the frame and the target population unit, references to other documents on frame quality and effects of frame deficiencies on the outputs. Provide an assessment, whenever possible quantitative, on overcoverage and multiple listings, and on the extent of undercoverage. Report also an evaluation of the bias risks associated with the latter. Describe actions taken for reduction of undercoverage and associated bias risks.
S.15.3.1.1 A2. Over-coverage - rate OVERCOVERAGE_RAT
E The proportion of units accessible via the frame that do
not belong to the target population. QPI: A2, Overcoverage - rate
S.15.3.1.2
A3. Common units - proportion
COMMON_UNIT_SHARE
The proportion of units covered by both the survey and the administrative sources in relation to the total
number of units in the survey. QPI: A3, Common units - proportion

ESS Handbook for Quality Reports eurostat 152
S.15.3.2 Measurement error MEASUREMENT_ERR
Measurement errors are errors that occur during data collection and cause recorded values of variables to be
different from the true ones
Identification and general assessment of the main sources of measurement error should be reported. The efforts made in questionnaire design and testing, information on interviewer training and other work on error prevention should be described. If available, assessments based on comparisons with external data, re-interviews or experiments should be stated. Also results of indirect analysis, e.g.: based on the results on editing phase, could be reported. Describe actions taken to correct measurement errors.
S.15.3.3 Non response error NONRESPONSE_ERR Non-response errors occur when the survey fails to get
a response to one, or possibly all, of the questions
Provide a qualitative assessment on the level of unit non response. Highlight the presence of variables that are more subject to item non response (e.g. sensitive questions). Provide a qualitative assessment on the bias associated with nonresponse. Describe the breakdown of nonrespondents according to cause for nonresponse. Report efforts and measures, including response modelling, to reduce nonresponse in the primary data collection and follow-ups and technical treatment of nonresponse at the estimation stage.
S.15.3.3.1
A4. Unit non-response - rate for P
UNIT_NONRESPONSE_RATE_P
The ratio of the number of units with no information or not usable information to the total number of in-scope (eligible) units.
QPI: A4, Unit non-response - rate for P, with different LEVEL OF DETAILS for U and P
S.15.3.3.2
A5. Item non-response - rate for P
ITEM_NONRESPONSE_RATE_P
The ratio of the in-scope (eligible) units which have not responded to a particular item and the in-scope units that are required to respond to that particular item.
QPI: A5, Item non-response - rate for P, with different LEVEL OF DETAILS for U and P
S.15.3.4 Processing error PROCESSING_ERR
The error in final data collection process results arising from the faulty implementation of correctly planned implementation methods.
Identification of the main issues regarding processing errors for the statistical process and its outputs should be taken into consideration. Where relevant and available, an analysis of processing errors affecting individual observations should be presented; else a qualitative assessment should be included. The treatment of micro-data processing errors needs to be proportional to their importance. When they are significant, their extent and impact on the results should be evaluated. Describe linking and coding errors if applicable.
S.15.3.5 Model assumption error MODEL_ASSUMP_ERR Error due to domain specific models needed to define
the target of estimation.
Where models are applicable in relation to a specific source of error, they should be presented in the section concerned. This is recommended also in the case of a cut-off threshold and model based estimation. Domain specific models, for example, as needed to define the target of estimation itself, should be thoroughly described and their validity for the data at hand assessed.
S.16 Timeliness and punctuality TIMELINESS_PUNCT
T: Length of time between data availability and the event or phenomenon they describe. P: Time lag
between the actual delivery of the data and the target date when it should have been delivered.
S.16.1 Timeliness andTP2. Time lag - final results for U
TIMELINESS / TIMELAG_FINAL_U
Length of time between data availability and the event or phenomenon they describe.
Provide, for annual or more frequent releases, the average production time for each release of data and the reasons for possible long production times and efforts to improve the situation described, together with the TP1 and TP2 indicators explained for users. Applicable for Eurostat: - National data deliveries: the agreed time frame for deliveries should be included as well as the achieved dates for deliveries during a past period. Describe the TP2 indicator for users. / QPI: TP2 Time lag - final results for U, with different LEVEL OF DETAILS for U and P
S.16.1.1 TP1. Time lag - first results TIMELAG_FIRST
The number of days (or weeks or months) from the last day of the reference period to the day of publication of
first results. QPI: TP1, Time lag - first results
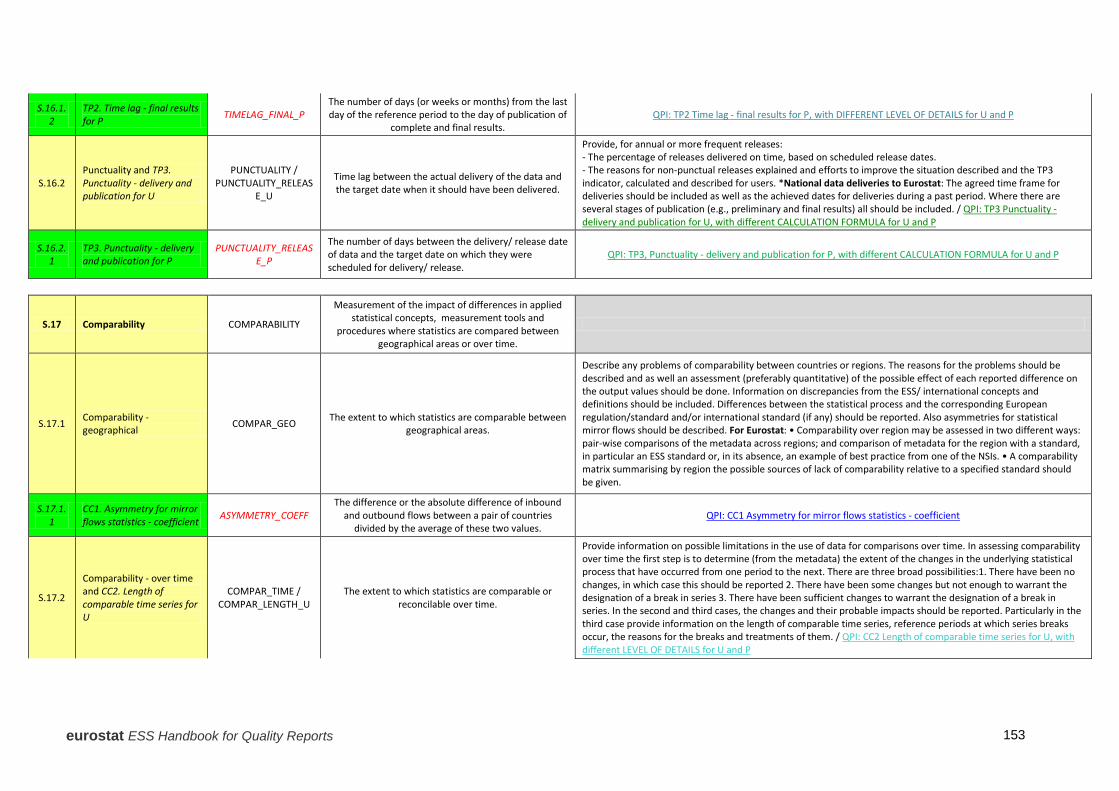
eurostat ESS Handbook for Quality Reports 153
S.16.1.2
TP2. Time lag - final results for P TIMELAG_FINAL_P
The number of days (or weeks or months) from the last day of the reference period to the day of publication of
complete and final results. QPI: TP2 Time lag - final results for P, with DIFFERENT LEVEL OF DETAILS for U and P
S.16.2 Punctuality and TP3. Punctuality - delivery and publication for U
PUNCTUALITY / PUNCTUALITY_RELEAS
E_U
Time lag between the actual delivery of the data and the target date when it should have been delivered.
Provide, for annual or more frequent releases: - The percentage of releases delivered on time, based on scheduled release dates. - The reasons for non-punctual releases explained and efforts to improve the situation described and the TP3 indicator, calculated and described for users. *National data deliveries to Eurostat: The agreed time frame for deliveries should be included as well as the achieved dates for deliveries during a past period. Where there are several stages of publication (e.g., preliminary and final results) all should be included. / QPI: TP3 Punctuality - delivery and publication for U, with different CALCULATION FORMULA for U and P
S.16.2.1
TP3. Punctuality - delivery and publication for P
PUNCTUALITY_RELEASE_P
The number of days between the delivery/ release date of data and the target date on which they were scheduled for delivery/ release.
QPI: TP3, Punctuality - delivery and publication for P, with different CALCULATION FORMULA for U and P
S.17 Comparability COMPARABILITY
Measurement of the impact of differences in applied statistical concepts, measurement tools and
procedures where statistics are compared between geographical areas or over time.
S.17.1 Comparability - geographical COMPAR_GEO The extent to which statistics are comparable between
geographical areas.
Describe any problems of comparability between countries or regions. The reasons for the problems should be described and as well an assessment (preferably quantitative) of the possible effect of each reported difference on the output values should be done. Information on discrepancies from the ESS/ international concepts and definitions should be included. Differences between the statistical process and the corresponding European regulation/standard and/or international standard (if any) should be reported. Also asymmetries for statistical mirror flows should be described. For Eurostat: • Comparability over region may be assessed in two different ways: pair-wise comparisons of the metadata across regions; and comparison of metadata for the region with a standard, in particular an ESS standard or, in its absence, an example of best practice from one of the NSIs. • A comparability matrix summarising by region the possible sources of lack of comparability relative to a specified standard should be given.
S.17.1.1
CC1. Asymmetry for mirror flows statistics - coefficient ASYMMETRY_COEFF
The difference or the absolute difference of inbound and outbound flows between a pair of countries
divided by the average of these two values. QPI: CC1 Asymmetry for mirror flows statistics - coefficient
S.17.2
Comparability - over time and CC2. Length of comparable time series for U
COMPAR_TIME / COMPAR_LENGTH_U
The extent to which statistics are comparable or reconcilable over time.
Provide information on possible limitations in the use of data for comparisons over time. In assessing comparability over time the first step is to determine (from the metadata) the extent of the changes in the underlying statistical process that have occurred from one period to the next. There are three broad possibilities:1. There have been no changes, in which case this should be reported 2. There have been some changes but not enough to warrant the designation of a break in series 3. There have been sufficient changes to warrant the designation of a break in series. In the second and third cases, the changes and their probable impacts should be reported. Particularly in the third case provide information on the length of comparable time series, reference periods at which series breaks occur, the reasons for the breaks and treatments of them. / QPI: CC2 Length of comparable time series for U, with different LEVEL OF DETAILS for U and P
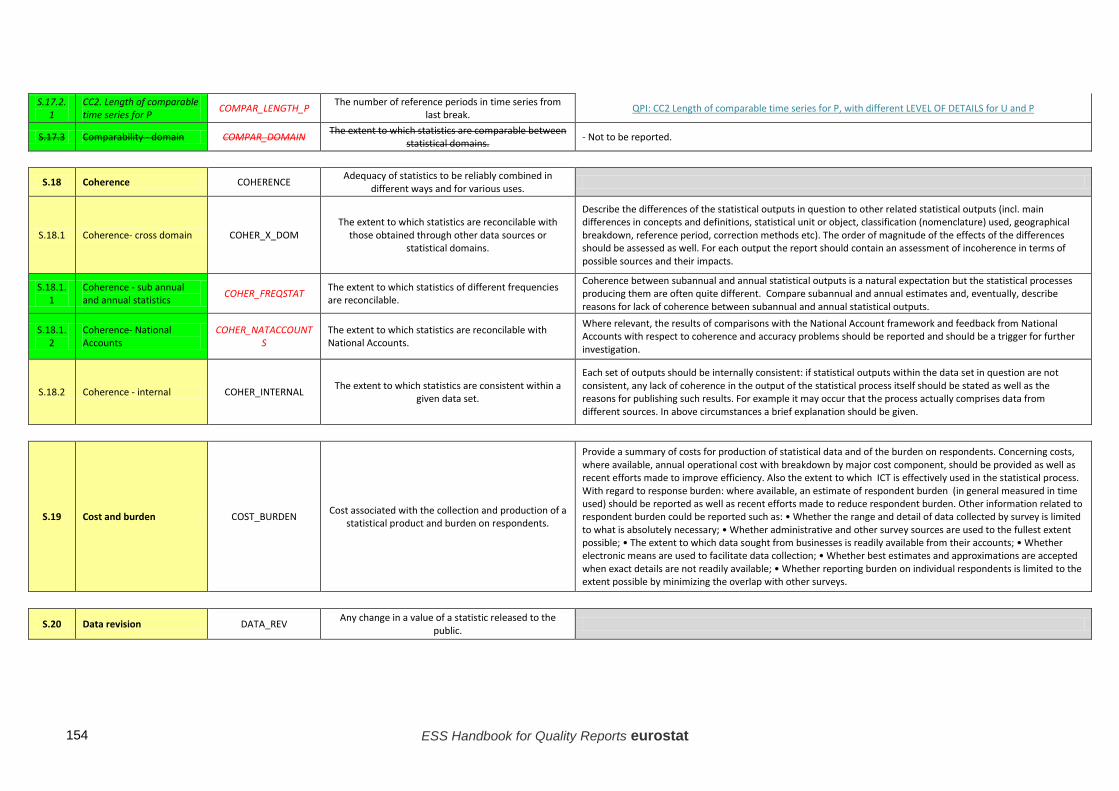
ESS Handbook for Quality Reports eurostat 154
S.17.2.1
CC2. Length of comparable time series for P COMPAR_LENGTH_P The number of reference periods in time series from
last break. QPI: CC2 Length of comparable time series for P, with different LEVEL OF DETAILS for U and P
S.17.3 Comparability - domain COMPAR_DOMAIN The extent to which statistics are comparable between statistical domains. - Not to be reported.
S.18 Coherence COHERENCE Adequacy of statistics to be reliably combined in different ways and for various uses.
S.18.1 Coherence- cross domain COHER_X_DOM The extent to which statistics are reconcilable with
those obtained through other data sources or statistical domains.
Describe the differences of the statistical outputs in question to other related statistical outputs (incl. main differences in concepts and definitions, statistical unit or object, classification (nomenclature) used, geographical breakdown, reference period, correction methods etc). The order of magnitude of the effects of the differences should be assessed as well. For each output the report should contain an assessment of incoherence in terms of possible sources and their impacts.
S.18.1.1
Coherence - sub annual and annual statistics COHER_FREQSTAT The extent to which statistics of different frequencies
are reconcilable.
Coherence between subannual and annual statistical outputs is a natural expectation but the statistical processes producing them are often quite different. Compare subannual and annual estimates and, eventually, describe reasons for lack of coherence between subannual and annual statistical outputs.
S.18.1.2
Coherence- National Accounts
COHER_NATACCOUNTS
The extent to which statistics are reconcilable with National Accounts.
Where relevant, the results of comparisons with the National Account framework and feedback from National Accounts with respect to coherence and accuracy problems should be reported and should be a trigger for further investigation.
S.18.2 Coherence - internal COHER_INTERNAL The extent to which statistics are consistent within a given data set.
Each set of outputs should be internally consistent: if statistical outputs within the data set in question are not consistent, any lack of coherence in the output of the statistical process itself should be stated as well as the reasons for publishing such results. For example it may occur that the process actually comprises data from different sources. In above circumstances a brief explanation should be given.
S.19 Cost and burden COST_BURDEN Cost associated with the collection and production of a statistical product and burden on respondents.
Provide a summary of costs for production of statistical data and of the burden on respondents. Concerning costs, where available, annual operational cost with breakdown by major cost component, should be provided as well as recent efforts made to improve efficiency. Also the extent to which ICT is effectively used in the statistical process. With regard to response burden: where available, an estimate of respondent burden (in general measured in time used) should be reported as well as recent efforts made to reduce respondent burden. Other information related to respondent burden could be reported such as: • Whether the range and detail of data collected by survey is limited to what is absolutely necessary; • Whether administrative and other survey sources are used to the fullest extent possible; • The extent to which data sought from businesses is readily available from their accounts; • Whether electronic means are used to facilitate data collection; • Whether best estimates and approximations are accepted when exact details are not readily available; • Whether reporting burden on individual respondents is limited to the extent possible by minimizing the overlap with other surveys.
S.20 Data revision DATA_REV Any change in a value of a statistic released to the public.

eurostat ESS Handbook for Quality Reports 155
S.20.1 Data revision - policy REV_POLICY Policy aimed at ensuring the transparency of
disseminated data, whereby preliminary data are compiled that are later revised.
A revision should follow standard, well-established and transparent procedures that are described here or accessible via links from here. Pre-announcements are desireable. Describe the general revision policy adopted for the organisation and the data disseminated. Include planned and unplanned revisions as well as data revisions and conceptual revisions.
S.20.2 Data revision - practice / A6. Data revision - average size for U
REV_PRACTICE / DATA_REV_AVGSIZE_
U Information on the data revision practice
Please note that from a quality point of view revisions can be regarded as a special aspect of accuracy and are also integrated in S.15.1. Report the schedule for the revisions. Describe the main reasons for revisions and their nature (new source data available, new methods, etc.,). Make a qualitative assessment on the average size of revisions and their direction based on historical data and describe the A6 indicator for users. / QPI: A6 Data revision - average size for U, with different LEVEL OF DETAILS for U and P
S.20.2.1
A6. Data revision - average size for P
DATA_REV_AVGSIZE_P
The average over a time period of the revisions of a key item. The “revision” is defined as the difference between a later and an earlier estimate of the key item.
QPI: A6 Data revision - average size for P, with different LEVEL OF DETAILS for U and P
S.21 Statistical processing STAT_PROCESS Operations performed on data to derive new information according to a given set of rules.
S.21.1 Source data SOURCE_TYPE Characteristics and components of the raw statistical data used for compiling statistical aggregates.
Indicate if the data set is based on a survey, on administrative data sources, on a mix of multiple data sources or on data from other statistical activities. If sample surveys are used, some sample characteristics should also be given (e.g. population size, gross and net sample size, type of sampling design, reporting domain etc.). If administrative registers are used, the description of registers should be given (source, primary purpose, etc.).
S.21.2 Frequency of data collection FREQ_COLL Frequency with which the source data are collected. Indicate the frequency of data collection (e.g. monthly, quarterly, annually, continuous). The frequency can also be
expressed in using the codes released in the harmonised code list available for the European Statistical System.
S.21.3 Data collection COLL_METHOD Systematic process of gathering data for official statistics.
Describe the method used, in case of surveys, to gather data from respondents (e.g. sampling methods, postal survey, CAPI, on-line survey, etc.). Some additional information on questionnaire design and testing, interviewer training, methods used to monitor non-response etc. should be provided here. Questionnaires used should be annexed (if very long: via hyperlink).
S.21.4 Data validation DATA_VALIDATION Process of monitoring the results of data compilation and ensuring the quality of statistical results.
Describe the procedures for checking and validating the source and output data and how the results of these validations are monitored and used. Validation activities can include: checking that the population coverage and response rates are as required; comparing the statistics with previous cycles (if applicable); confronting the statistics against other relevant data (both internal and external); investigating inconsistencies in the statistics; performing micro and macro data editing; verifying the statistics against expectations and domain intelligence, outlier detection.
S.21.5 Data compilation DATA_COMP Operations performed on data to derive new information according to a given set of rules.
Describe the data compilation process (e.g. imputation, weighting, adjustment for non-response, calibration, model used etc.). For imputation: • Information on the extent to which imputation is used and the reasons for it should be noted. • A short description of the methods used and their effects on the estimates. Each step of weighting should be described separately: * calculation of design weights; * non-response adjustment: how the design weight is corrected taking into account the differences in response rates; * calibration: the level and variables used in the adjustment, method applied; * calculation of final weights.
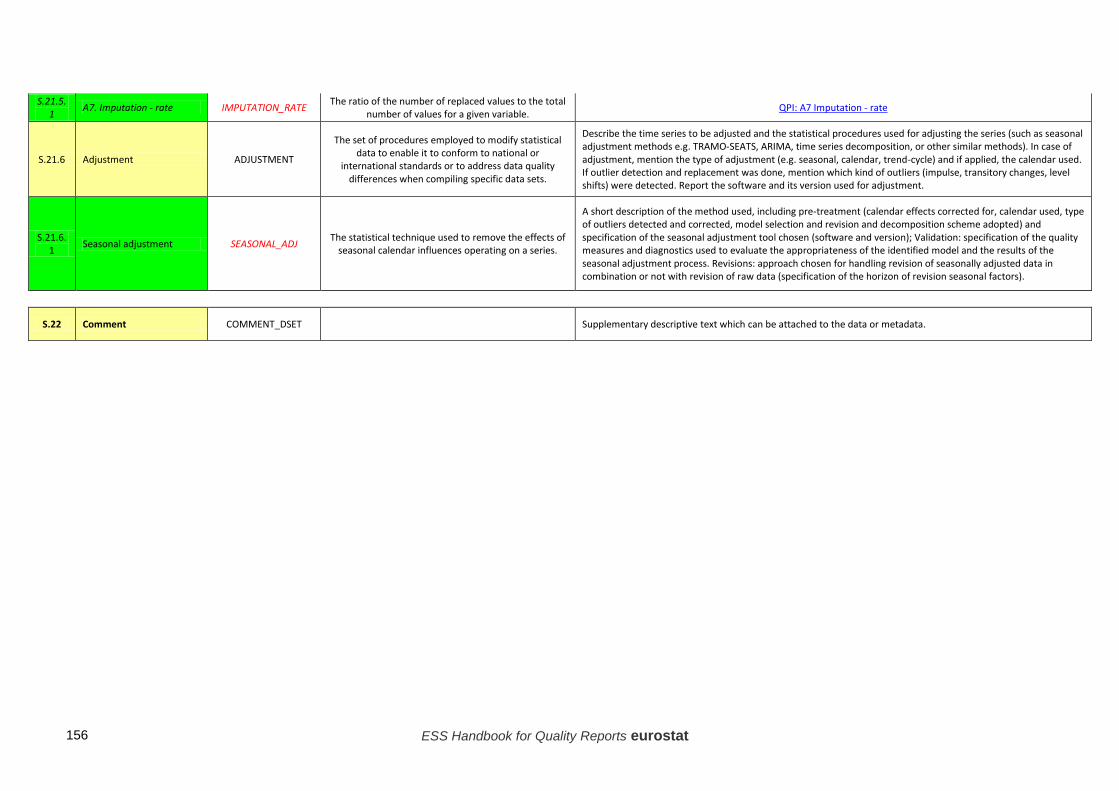
ESS Handbook for Quality Reports eurostat 156
S.21.5.1 A7. Imputation - rate IMPUTATION_RATE The ratio of the number of replaced values to the total
number of values for a given variable. QPI: A7 Imputation - rate
S.21.6 Adjustment ADJUSTMENT
The set of procedures employed to modify statistical data to enable it to conform to national or
international standards or to address data quality differences when compiling specific data sets.
Describe the time series to be adjusted and the statistical procedures used for adjusting the series (such as seasonal adjustment methods e.g. TRAMO-SEATS, ARIMA, time series decomposition, or other similar methods). In case of adjustment, mention the type of adjustment (e.g. seasonal, calendar, trend-cycle) and if applied, the calendar used. If outlier detection and replacement was done, mention which kind of outliers (impulse, transitory changes, level shifts) were detected. Report the software and its version used for adjustment.
S.21.6.1 Seasonal adjustment SEASONAL_ADJ The statistical technique used to remove the effects of
seasonal calendar influences operating on a series.
A short description of the method used, including pre-treatment (calendar effects corrected for, calendar used, type of outliers detected and corrected, model selection and revision and decomposition scheme adopted) and specification of the seasonal adjustment tool chosen (software and version); Validation: specification of the quality measures and diagnostics used to evaluate the appropriateness of the identified model and the results of the seasonal adjustment process. Revisions: approach chosen for handling revision of seasonally adjusted data in combination or not with revision of raw data (specification of the horizon of revision seasonal factors).
S.22 Comment COMMENT_DSET Supplementary descriptive text which can be attached to the data or metadata.
eurostat ESS Handbook for Quality Reports 157
3 References and key documents
REFERENCES
American Assiciation for Public Opinion Research (AAPOR) (2011), Standard Definitions Final Dispositions of Case Codes and Outcome Rates for Surveys Revised (www.aapor.org)
Andersson, C., Lindström, H. and Polfeldt, T. (1999): Att mäta statistikens kvalitet, (in Swedish), Statistics Sweden, R&D Report 1999:3.
Arnež, Marta; Hribar, Bernarda; Inthihar Stanka (2008), Standard Quality Report for Household Budget Survey for the year 2004, Statistical Office of the Republic of Slovenia
Beijron, Peter; Karlsson, Cecilia; Andersson, Elisabet (2013), Labour Force Surveys (LFS) 2013, Description of the Statistics, BV/AKU, Statistics Sweden
Berthier, C. and Néros, B. (1998) Une méthode de mesure de l'effet enquêteur, (in French), paper presented at the Journées de méthodologie Statistique de l’INSEE, Paris, France, March 17-18.
Biemer P. (2011). Total survey error - Design, implementation, and evaluation, in Public Opinion Quarterly, Vol. 74, No. 5, 817-848.
Biemer P., and Lyberg L. (2003), Introduction to Survey Quality. New York: Wiley,
Biemer, P. and Stokes, L. (1991): Approaches to Modeling Measurement Error, in Biemer, P. Groves, R.M. Lyberg, L.E. Mathiowetz, N.A. and Sudman, S., (eds.) (1991) Measurement Errors in Surveys. John Wiley & Sons, New York - ?
Booleman, Max; Zeelenberg, Kees (2012), The business case of quality management at Statistics Netherlands, European Conference on Quality in Official Statistics – Q 2012, Athens, Greece, 29 May – 1 June 2012
Bureau of the Census (2002): Census 2000 Testing, Experimentation and Evaluation Program.
Central Statistics Office Ireland (2013), Standard Report on Methods and Quality For BOP AND RELATED RESULTS COMPILATION 2011, available at: http://www.cso.ie/en/media/csoie/surveysandmethodologies/surveys/bop/documents/pdfs/bop_quality_report2011.pdf accessed on 26/11/2013
Chenu, A. and Guglielmetti, F. (2000) Coder la profession, nouvelles procédures, nouveaux enjeux, (in French), paper presented at the Journées de méthodologie Statistique de l’ INSEE, Paris, France, December 4-5, 2000.
Council Regulation (EC) No 1165/98 of 19 May 1998 concerning short-term statistics
Dalén, J. (1981): Metoder för evalvering av noggrannheten i SCBs statistik. En översikt, (in Swedish), Statistics Sweden, Promemorior från P/STM nr 6.
Dalén, J. (2001): Urvalsosäkerheter för olika tidshorisonter i KPI. Statistics Sweden, not published (in Swedish only)
Dalén, J. and Ohlsson, E. (1995): Variance Estimation in the Swedish Consumer Price Index. Journal of Business and Economic Statistics, Vol. 13, No. 3, 347–356
Djerf, K. (1997). Effects of Post-stratification on the Estimates of the Finnish Labour Force Survey, Journal of Official Statistics, Vol. 13, No. 1, 29-39.
EU-LFS Quality Report (2007): Quality Report of the European Union Labour Force Survey 2005.
European Central Bank1 (2012), ECB Euro Area Balance Of Payments And International Investment Position Statistics, 2011 Quality Report, Frankfurt am Main
ESS Handbook for Quality Reports eurostat 158
European Central Bank2 (2013), The Eurosystem Household Finance and Consumption Survey - Methodological Report for the First Wave. Frankfurt: ECB, Statistics Paper Series No 1
Eurostat (2001), Compendium of HICP reference documents (2/2001/B/5), European Communities, accessed at: http://epp.eurostat.ec.europa.eu/cache/ITY_OFFPUB/KS-AO-01-005/EN/KS-AO-01-005-EN.PDF, accessed on 26/11/2013
Eurostat (2006), Methodology of Short-term Business Statistics: Interpretation and Guidelines, Luxembourg: Office for Official Publications of the European Communities
Eurostat (2008), Handbook for EU Agricultural Price Statistics, Version 2.0, March 2008
Eurostat (2010), Quality Report on International Trade Statistics, available at: http://epp.eurostat.ec.europa.eu/cache/ITY_OFFPUB/KS-RA-10-026/EN/KS-RA-10-026-EN.PDF, accessed on 26/11/2013
Eurostat1 (2011), Building Permits (411 and 412), PEEI Questionnaire 2011, PEEI in focus Bulgaria,
Eurostat1 (2012), 2010 Comparative EU Intermediate Quality Report, EU-SILC, available at: < http://epp.eurostat.ec.europa.eu/portal/page/portal/income_social_inclusion_living_conditions/documents/tab9/2010_EU_Comparative%20Intermediate_QR_Rev%202.pdf>, accessed on: 26/11/2013
Eurostat1 (2013), Report on the Eurostat 2013 User Satisfaction Survey, available at: http://epp.eurostat.ec.europa.eu/portal/page/portal/quality/documents/Eurostat_user_satisfaction_survey_2013.pdf, accessed on 26/11/2013
Eurostat2 (2011), Eurostat's Assessment of the BoP Quality Report 2010, 9th Meeting of the Balance of Payments Committee, 1 July 2011, Luxembourg
Eurostat2 (2012), Healthy Life Years Expectancy, Disability Free Life Expectancy – DFLE, Method, Reference Metadata in Euro SDMX Metadata Structure (ESMS), Annex, available at: http://epp.eurostat.ec.europa.eu/cache/ITY_SDDS/Annexes/hlth_hlye_esms_an1.pdf, accessed on 26/11/2013
Eurostat2 (2013), 2010 EU Comparative Final Quality Report, EU-SILC, available at: http://epp.eurostat.ec.europa.eu/portal/page/portal/income_social_inclusion_living_conditions/documents/tab9/2010%20EU%20COMPARATIVE%20FQR.pdf, accessed on 26/11/2013
Eurostat3 (2011), Analysis of methodologies for calculating greenhouse gas and ammonia emissions and nutrient balances, Eurostat Methodologies and Working papers, Luxembourg: Publications Office of the European Union
Eurostat3 (2012), Harmonised indices of consumer prices (HICP), National Reference Metadata in Euro SDMX Metadata Structure (ESMS), compiled by Statistics Estonia, available at: http://epp.eurostat.ec.europa.eu/cache/ITY_SDDS/EN/prc_hicp_nesms_ee.htm, accessed on 26/11/2013
Eurostat3 (2013), Official website, Publications> Collections> News releases, URL: http://epp.eurostat.ec.europa.eu/portal/page/portal/publications/collections/news_releases, accessed on 18/11/2013
Eurostat4 (2011),Official website, Quality> Domain Specific Results> Eurostat carries out evaluations in specific statistical domains, official website of Eurostat, URL: http://epp.eurostat.ec.europa.eu/portal/page/portal/quality/introduction, accessed on 18/11/2013
Eurostat4 (2013), Official website, Publications> Collections> Statistical books, URL: http://epp.eurostat.ec.europa.eu/portal/page/portal/publications/collections/statistical_books, accessed on 18/11/2013
Eurostat5 (2013), Official website, Statistics> Browse/Search Database, URL: http://epp.eurostat.ec.europa.eu/portal/page/portal/statistics/search_database, accessed on 18/11/2013

eurostat ESS Handbook for Quality Reports 159
Eurostat6 (2013), Official website, Access to microdata> Introduction, URL: http://epp.eurostat.ec.europa.eu/portal/page/portal/microdata/introduction, accessed on 18/11/2013
Findley, D. F., Monsell, B. C., Bell, W. R., Otto, M. C. and Chen, B. C. (1998). New capabilities and methods of the X-12-ARIMA seasonal adjustment program (with discussion). J. Bus. Econ. Statist. 16, 127-177.
Fixler D. and Grimm B. (2005): Reliability of the NIPA Estimates of U.S. Economic Activity, Survey of Current Business, February 2005, pp. 8-19.
Groves, R, and. Lyberg L.. (2011) Total survey error - Past, present, and future, in Public Opinion Quarterly, Vol. 74, No. 5, 849-879
Harmonised lists of Statistical Production Processes & Projects and Statistical Products, as presented at the 818th Directors Meeting of 03.09.2013, Eurostat
Hedlin, Dan; Dale, Trine; Haraldsen, Gustav, Jones, Jacqui (2005), Developing methods for assessing perceived response burden, Eurostat official website, Quality section, ESS Practices, Selected ESS Practices, URL: http://epp.eurostat.ec.europa.eu/portal/page/portal/quality/documents/DEVELOPING%20METHODS%20FOR%20ASSESSING%20PERCEIVED%20RESPONSE%20BURD.pdf, accessed on 18/11/2013
Holt T., and Jones T. (1998): Quality work and conflicting quality objectives, paper presented at the 84th DGINS conference, Stockholm, Sweden, May 28-29, 1998.
Hörngren, J. (1992): The Use of Registers as Auxiliary Information in the Swedish Labour Force Survey, Statistics Sweden, R&D Report 1992:13.
INSEE (2013), Official Website, Publics, URL: http://www.insee.fr/en/publics/, accessed on 11/11/2013
International Labour Office (2004) Consumer Price Index Manual: Theory and Practice, International Working Group on Price Statistics.
International Monetary Fund (2006), DQAF – Generic Framework (July 2003), IMF Statistics Department, available online at: http://dsbb.imf.org/vgn/images/pdfs/dqrs_factsheet.pdf, accessed on 26/11/2013
Ladiray, Dominique; Sartori, Fabio (2001), Quality in short-term statistics: the Euro-SICS database of Eurostat, Eurostat, available at: http://epp.eurostat.ec.europa.eu/portal/page/portal/research_methodology/documents/66.pdf, accessed on 26/11/2013
Lien, Håvard Hungnes; Beyrer, Svetlana; Lunde, Harald (2009): Quality Report on the Norwegian Structure of Earnings Survey 2006 Oslo-Kongsvinger: Statistics Norway, Reports 2009/20
Meader R. and Tily G. (2008): Monitoring the quality of the National Accounts, Economic and Labour Market Review, Vol 2, No 3, 24-33.
Medin, K. and Wilson, B. (1994): Quality assurance and quality assessment in official statistics: the case of Sweden’s panel census of agriculture, Statistical journal of the United Nations, 11, 125-145.
Morgenstern, O. (1965): On the Accuracy of Economic Observations, Second Edition, Princeton University Press, Princeton, New Jersey.
Mortensen, Peter S. (2008), Quality Report for Country Denmark, CIS 2006 The 5th Community Innovation Survey, Danish Centre for Studies in Research and Research Policy
Nilsson, H., Ribe, M. and Norberg, A. (2008) ”Variansberäkningar KPI” Project report, SCB, 2008-04-10 (in Swedish only)

ESS Handbook for Quality Reports eurostat 160
Nordberg, L. (2000): On Variance Estimation for Measures of Change. When Samples are Coordinated by the Use of Permanent Random Numbers, Journal of Official Statistics, 16, 363-378.
Norberg, A. (2004). “Comparison of Variance Estimators for the Consumer Price Index” 8th Ottawa Group Meeting - Helsinki - 23-25 August 2004
OECD et al (2002): Measurement of the Non-Observed Economy: A Handbook, OECD Publications Service
Office of the First Minister and Deputy First Minister (2012), Summary Quality Report for the Northern Ireland Labour Force Survey Religion Report, Northern Ireland Statistics & Research Agency
Prewitt, K. (2000): Statement on the feasibility of using statistical methods to improve the accuracy of census 2000, US Bureau of the Census. Washington DC. Available online at:
Regulation (EC) No 295/2008 of the European Parliament and of the Council of 11 March 2008 concerning Structural Business Statistics
Särndal, C.-E., Swensson, B. and Wretman, J. (1992): Model assisted survey sampling, Springer-Verlag, New York.
Seljak, Rudi; Katnič, Nika (2006), Standard Quality Report for the Monthly Survey on Turnover, New Orders and Value of Inventories in Industry 2005, Statistical Office of the Republic of Slovenia
Sorrentino, C. (2000): International Unemployment Rates: How Comparable Are They? Monthly Labor Review, 123, 6, pp.3-2
Statistics Canada (2003): Statistics Canada Quality Guidelines, 4th edition, October 2003.
Statistics Denmark1 (2007), Coherent Social Statistics (Recipient of Income Compensating Benefits), official website of Statistics Denmark, URL: http://www.dst.dk/en/Statistik/dokumentation/Declarations/coherent-social-statistics--recipient-of-income-compensating-benefits-.aspx , accessed on 15/11/2013
Statistics Denmark2 (2007), Quality Report on the Final National Accounts, official website of Statistics Denmark, URL: http://www.dst.dk/en/Statistik/dokumentation/Declarations/final-national-accounts-.aspx#section3, accessed on 15/11/2013
Statistics Finland (2007): Quality Guidelines for Official Statistics, Multiprint, Helsinki
Statistics Finland (2010): Revision of national accounts time series 2010. National Accounts > Annual National Accounts, official website of Statistics Finland, URL: http://www.stat.fi/til/vtp/2008/vtp_2008_2010-01-29_men_001_en.html, accessed on 26/11/2013
Statistics Finland (2011), Quality description, adoptions (2010), official website of Statistics Finland, URL: http://www.stat.fi/til/adopt/2010/adopt_2010_2011-06-01_laa_001_en.html accessed on 12/11/2013
Statistics Finland (2012), Quality description, Adoptions 2011, official website of Statistics Finland, URL: http://stat.fi/til/adopt/2011/adopt_2011_2012-05-31_laa_001_en.html, accessed on 15/11/2013
Statistics Sweden (2001): The Swedish Consumer Price Index. A handbook of methods, Stockholm
Statistics Sweden (2010), SBS 2010 Quality declaration
Statistikersamfundet (2005): STANDARD FÖR BORTFALLSBERÄKNING, (in Swedish).
Statistisches Bundesamt1 (2012), Consumer Price Index, Quality Report, Wiesbaden
Statistisches Bundesamt2 (2013), Quality Report on National Accounts, Wiesbaden
eurostat ESS Handbook for Quality Reports 161
Swedish Environment Protection Agency (2006): Quality Report for Statistics on Generation and Recovery and Disposal of Waste in Sweden 2004 According to EU Regulation on Waste Statistics 2150/2002.
Tam, S.M.; Kraayenbrink, Regina (2006), Data Communication - Emerging International Trends and Practices of the Australian Bureau of Statistics (Research paper), ABS Catalogue No 1211.0
Tarassiouk, Oxana (2013), Consumer Price Index, Net Price Index, Harmonised Index for Consumer Prices 2013, Description of the Statistics, Economic Statistics department, Statistics Sweden
UK Office for national statistics (2005), Census 2001. Quality Report for England and Wales, Palgrave Macmillan, Crown Copyright
UK Office for National Statistics (2007): United Kingdom National Accounts The Blue Book 2007. UK Office for National Statistics1 (1999): Comparison of variance estimation software and methods,
Model Quality Report in Business Statistics Vol 2, Eds. Davies P. and Smith P.
UK Office for National Statistics1 (2011), Labour Force Survey Quality and Methodology Information Report,
UK Office for national statistics1 (2012), Quality Assurance of 2011 Census Population Estimates, 2011 Census – Methods and Quality Report
UK Office for National Statistics2 (1999): Model Quality Reports, Model Quality Report in Business Statistics Vol 3, Eds. Davies P. and Smith P.
UK Office for National Statistics2 (2012), Annual Business Survey (ABS) Technical Report, August 2012, Crown Copyright
UK Office for National Statistics3 (2012), Compliance and Quality Improvement Plan 2011-12. Reducing the administrative burden resulting from ONS surveys, Crown Copyright
United Nations Statistical Commission and Economic Commission for Europe (1994): Statistical Data Editing Volume No 1 Methods and Techniques
US Census Bureau (2010), Official website, 2010 Census Program for Evaluations and Experiments, URL: http://www.census.gov/2010census/about/cpex.php, accessed on 26/11/2013
US Office of Management and Budget (2001): Measuring and Reporting Sources of Error in Surveys Statistical Policy Working Paper 31, Statistical Policy Office.
Vale, S. (2008): Accessibility and clarity: The most neglected dimensions of quality? Presented at Conference on Data Quality for International Organizations, Rome, 7-8 July 2008.
Wallgren A. and Wallgren B. (2007): Register-Based Statistics. Administrative Data for Statistical Purposes, Wiley.
Williams, Jennifer D. (2012), The 2010 Decennial Census: Background and Issues Specialist in American National Government, Congressional Research Service
Wood, J. (2008): On the Covariance Between Related Horvitz-Thompson Estimators, Journal of Official Statistics, 24, 53-78.
Zarkovich S. (1966): Quality of Statistical Data, Food and Agriculture Organisation of the United Nations, Rome.
Zilhao, M. J. (2001) Quality Indicators Panel. Available from the “Quality in Statistics”, CIRCA Interest Group
ESS Handbook for Quality Reports eurostat 162
KEY DOCUMENTS, LINKS
European Statistics Code of Practice http://epp.eurostat.ec.europa.eu/cache/ITY_OFFPUB/KS-32-11-955/EN/KS-32-11-955-EN.PDF
Quality Assurance Framework of the European Statistical System http://epp.eurostat.ec.europa.eu/cache/ITY_PUBLIC/QAF_2012/EN/QAF_2012-EN.PDF
Regulation (EC) No 223/2009 on European statistics http://eur-lex.europa.eu/LexUriServ/LexUriServ.do?uri=OJ:L:2009:087:0164:0173:EN:PDF
ESS Quality Glossary http://ec.europa.eu/eurostat/ramon/coded_files/ESS_Quality_Glossary.pdf
Handbook on Data Quality Assessment Methods and Tools http://epp.eurostat.ec.europa.eu/portal/page/portal/quality/documents/HANDBOOK%20ON%20DATA%20QUALITY%20ASSESSMENT%20METHODS%20AND%20TOOLS%20%20I.pdf
Handbook on improving quality by analysis of process variables http://epp.eurostat.ec.europa.eu/portal/page/portal/quality/documents/HANDBOOK%20ON%20IMPROVING%20QUALITY.pdf
Quality and Performance Indicators http://epp.eurostat.ec.europa.eu/portal/page/portal/quality/documents/Quality_Performance_Indicators_FINAL_v_1_1.pdf
European Self Assessment Checklist for Survey Managers (DESAP) http://epp.eurostat.ec.europa.eu/portal/page/portal/quality/documents/desap%20G0-LEG-20031010-EN.pdf
Inventory of legislation on quality and quality reporting http://epp.eurostat.ec.europa.eu/portal/page/portal/quality/documents/Annex%201%20Legislation%20on%20QUALITY%20REPORTING%20for%20website.pdf
UN Fundamental Principles of Official Statistics http://unstats.un.org/unsd/dnss/gp/fundprinciples.aspx
UN Principles Governing International Statistical Activities http://unstats.un.org/unsd/methods/statorg/Principles_stat_activities/principles_stat_activities.pdf
ISO standards http://www.iso.org/iso/home.html
EFQM Quality standard http://www.efqm.org/
http://epp.eurostat.ec.europa.eu/portal/page/portal/quality/documents/desap%20G0-LEG-20031010-EN.pdf
http://epp.eurostat.ec.europa.eu/portal/page/portal/quality/documents/desap%20G0-LEG-20031010-EN.pdf
http://unstats.un.org/unsd/methods/statorg/Principles_stat_activities/principles_stat_activities.pdf

HOW TO OBTAIN EU PUBLICATIONS
Free publications: • one copy:
via EU Bookshop (http://bookshop.europa.eu);
• more than one copy or posters/maps: from the European Union’s representations (http://ec.europa.eu/represent_en.htm); from the delegations in non-EU countries (http://eeas.europa.eu/delegations/index_en.htm); by contacting the Europe Direct service (http://europa.eu/europedirect/index_en.htm) or calling 00 800 6 7 8 9 10 11 (freephone number from anywhere in the EU) (*). (*) The information given is free, as are most calls (though some operators, phone boxes or hotels may charge you).
Priced publications: • via EU Bookshop (http://bookshop.europa.eu).
Priced subscriptions: • via one of the sales agents of the Publications Office of the European Union
(http://publications.europa.eu/others/agents/index_en.htm).

Exer in vu
lla faci blam
con
se euis n
ibh
el utat d
ip ex elestisim
R
ilis aug
iati siscilit venis n
im
2013
ed
ition
KS-GQ-15-003-EN
-N
doi:10.2785/983454
Related Documents