Riksbank Governor Stefan Ingves Introduction on monetary policy Riksdag Committee on Finance 23 February 2012

Riksbank Governor Stefan Ingves Introduction on monetary policy Riksdag Committee on Finance 23 February 2012.
Dec 27, 2015
Welcome message from author
This document is posted to help you gain knowledge. Please leave a comment to let me know what you think about it! Share it to your friends and learn new things together.
Transcript
Riksbank Governor Stefan Ingves
Introduction on monetary policy
Riksdag Committee on Finance
23 February 2012
Today’s presentation
BackgroundRecent developments and monetary policy
Current monetary policy

Strong recovery from financial crisis in 2010 and 2011GDP growth in Sweden and the world
Background
Note. Annual percentage change, calendar-adjusted data. Broken column and line refer to the Riksbank’s forecast in February 2012.
Sources: The IMF, Statistics Sweden and the Riksbank
-6
-4
-2
0
2
4
6
-6
-4
-2
0
2
4
6
00 02 04 06 08 10
Sweden
The world

Large differences between regionsGDP growth in 2010 and2011 in different regions and countries
Background
Sources: Bureau of Economic Analysis, Eurostat, IMF, Statistics Sweden and the Riksbank
Note. Annual percentage change. 2011 refers to the Riksbank’s forecast in February 2012
0
1
2
3
4
5
6
7
8
9
10
0
1
2
3
4
5
6
7
8
9
10
Euro area USA BRIC Sweden
2010 2011

Poorer outlook in second half of 2011
We have for some time been expecting lower growth after 2010 and 2011
The question was how large the decline would be
Clear signs in autumn 2011 – the decline will be much greater than expected
Background
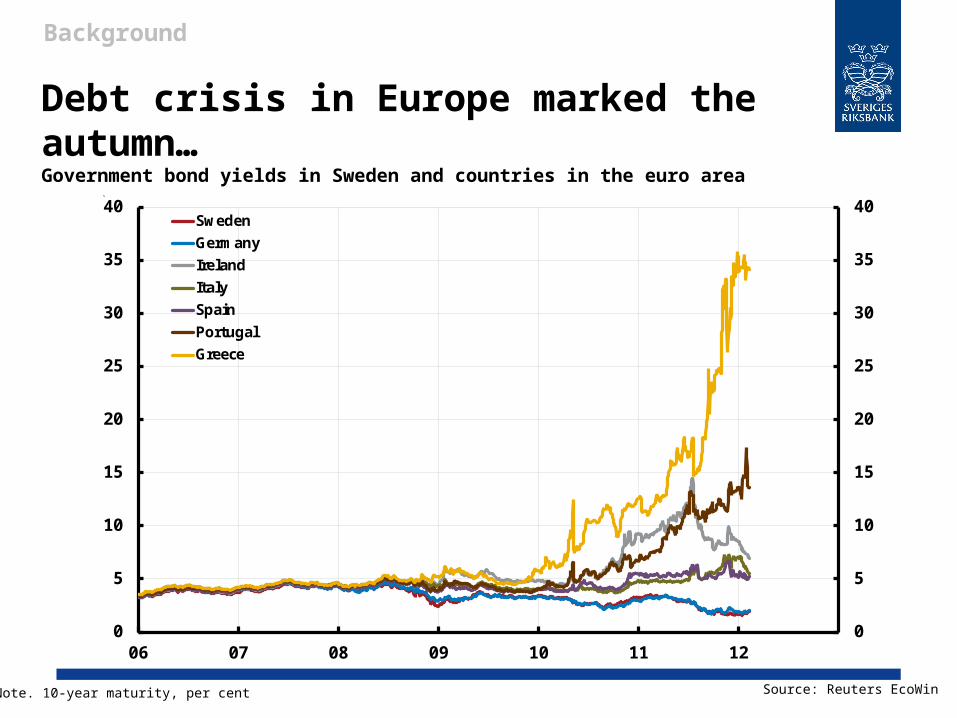
Debt crisis in Europe marked the autumn…Government bond yields in Sweden and countries in the euro area
Background
Note. 10-year maturity, per cent Source: Reuters EcoWin
0
5
10
15
20
25
30
35
40
0
5
10
15
20
25
30
35
40
06 07 08 09 10 11 12
Sweden
Germany
Ireland
Italy
Spain
Portugal
Greece

…which affected SwedenNational Institute of Economic Research’s economic tendency survey
Background
Source: National Institute of Economic ResearchNote. Index, average = 100, standardavvikelse = 10
70
80
90
100
110
120
70
80
90
100
110
120
00 01 02 03 04 05 06 07 08 09 10 11 12
The Economic Tendency Indicator
Mean

Pause in policy rate increases followed by cut in DecemberPolicy rates
Background
Source: Reuters EcoWinNote. Per cent
0
1
2
3
4
5
6
0
1
2
3
4
5
6
06 07 08 09 10 11 12
USA
Euro area
Sweden

60
70
80
90
100
110
120
60
70
80
90
100
110
120
00 01 02 03 04 05 06 07 08 09 10 11 12
Weaker export at the end of last year…Goods exports
Current monetary policy – present status
Note. Index, 2005 = 100, fixed prices, seasonally-adjusted dataThree-month moving average. Fixed prices calculated by the Riksbank.
Sources: Statistics Sweden and the Riksbank
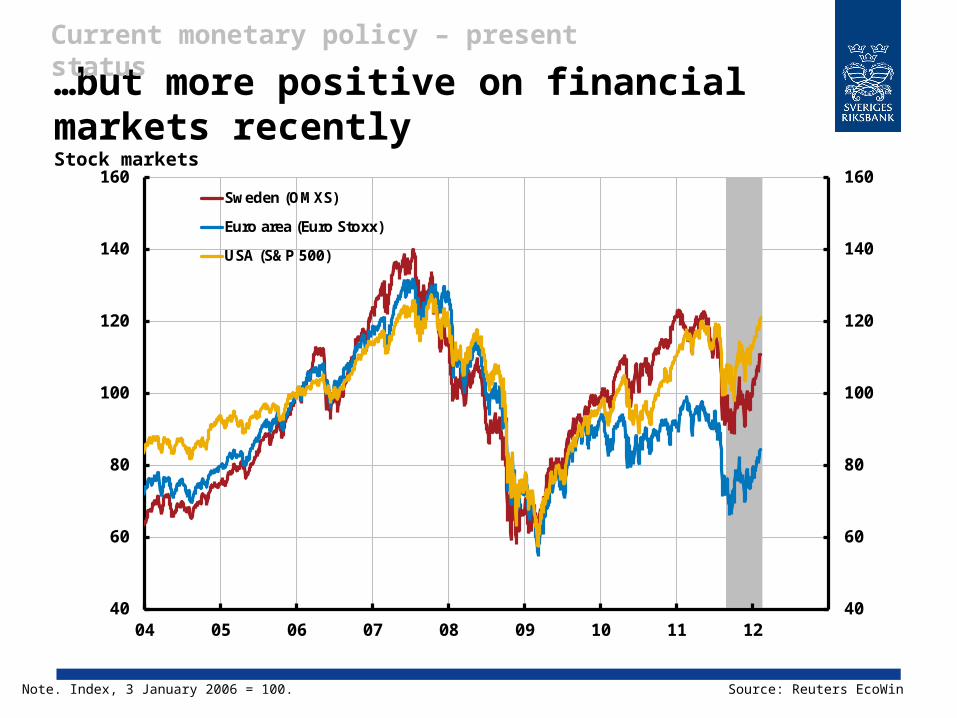
…but more positive on financial markets recentlyStock markets
Note. Index, 3 January 2006 = 100. Source: Reuters EcoWin
40
60
80
100
120
140
160
40
60
80
100
120
140
160
04 05 06 07 08 09 10 11 12
Sweden (OMXS)
Euro area (Euro Stoxx)
USA (S&P 500)
Current monetary policy – present status
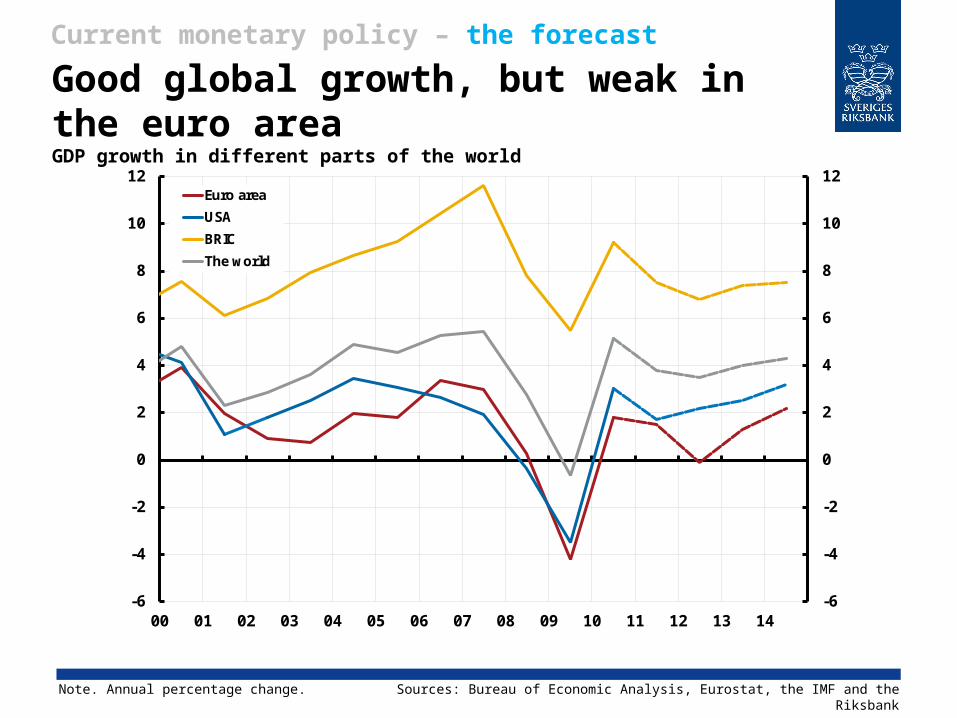
Good global growth, but weak in the euro areaGDP growth in different parts of the world
Note. Annual percentage change. Sources: Bureau of Economic Analysis, Eurostat, the IMF and the Riksbank
Current monetary policy – the forecast
-6
-4
-2
0
2
4
6
8
10
12
-6
-4
-2
0
2
4
6
8
10
12
00 01 02 03 04 05 06 07 08 09 10 11 12 13 14
Euro area
USA
BRIC
The world

Swedish exports slow down, despite new marketsPercentage of Sweden’s total goods exports
Source: Statistics Sweden
Note. Per cent. Figures for 2011 refer to average up to November. Percentages do not total 100 per cent as not all countries are reported.
Current monetary policy – the forecast
0
5
10
15
20
25
30
35
40
45
0
5
10
15
20
25
30
35
40
45
Euro area USA UK Denmark+Norway BRIC
2000
2005
2011

Poorer future prospects dampen willingness to consumeThe confidence indicator and household consumption
Note. Net figures (confidence indicator) and annual percentage change respectively (household consumption)
Current monetary policy – the forecast
Sources: National Institute of Economic Research, Statistics Sweden and the Riksbank
-3
-2
-1
0
1
2
3
4
5
6
-30
-20
-10
0
10
20
30
40
50
60
00 01 02 03 04 05 06 07 08 09 10 11 12 13 14
Household consumption (right scale)
Confidence indicator

Weak growth this year – recovery takes timeGDP
Sources: Statistics Sweden and the Riksbank
-6
-4
-2
0
2
4
6
-6
-4
-2
0
2
4
6
00 01 02 03 04 05 06 07 08 09 10 11 12 13 14
Note. Annual percentage change, calendar-adjusted data
Current monetary policy – the forecast

Labour market will deteriorate before improvingUnemployment
Sources: Statistics Sweden and the Riksbank
0
2
4
6
8
10
0
2
4
6
8
10
07 08 09 10 11 12 13 14 15
Current monetary policy – the forecast
Note. Per cent of labour force, seasonally-adjusted data
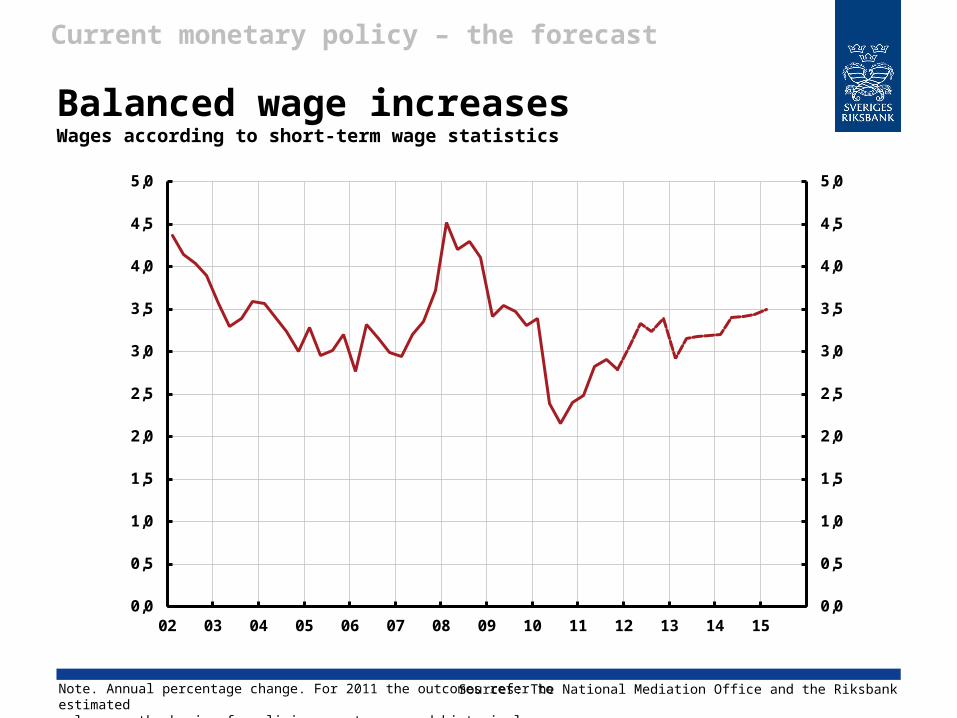
Balanced wage increasesWages according to short-term wage statistics
0,0
0,5
1,0
1,5
2,0
2,5
3,0
3,5
4,0
4,5
5,0
0,0
0,5
1,0
1,5
2,0
2,5
3,0
3,5
4,0
4,5
5,0
02 03 04 05 06 07 08 09 10 11 12 13 14 15
Note. Annual percentage change. For 2011 the outcomes refer to estimated values on the basis of preliminary outcomes and historical revisions.
Current monetary policy – the forecast
Sources: The National Mediation Office and the Riksbank

Stronger kronaCurrency-weighted exchange rate
110
120
130
140
150
160
110
120
130
140
150
160
00 02 04 06 08 10 12 14
Current monetary policy – the forecast
Note. TCW index, 18 November 1992 = 100 Source: The Riksbank

Continuing low inflationary pressureInflation measured according to the CPI and the CPIF
Note. Annual percentage change Sources: Statistics Sweden and the Riksbank
Current monetary policy – the forecast
-2
-1
0
1
2
3
4
5
-2
-1
0
1
2
3
4
5
07 08 09 10 11 12 13 14 15
CPIF
CPI
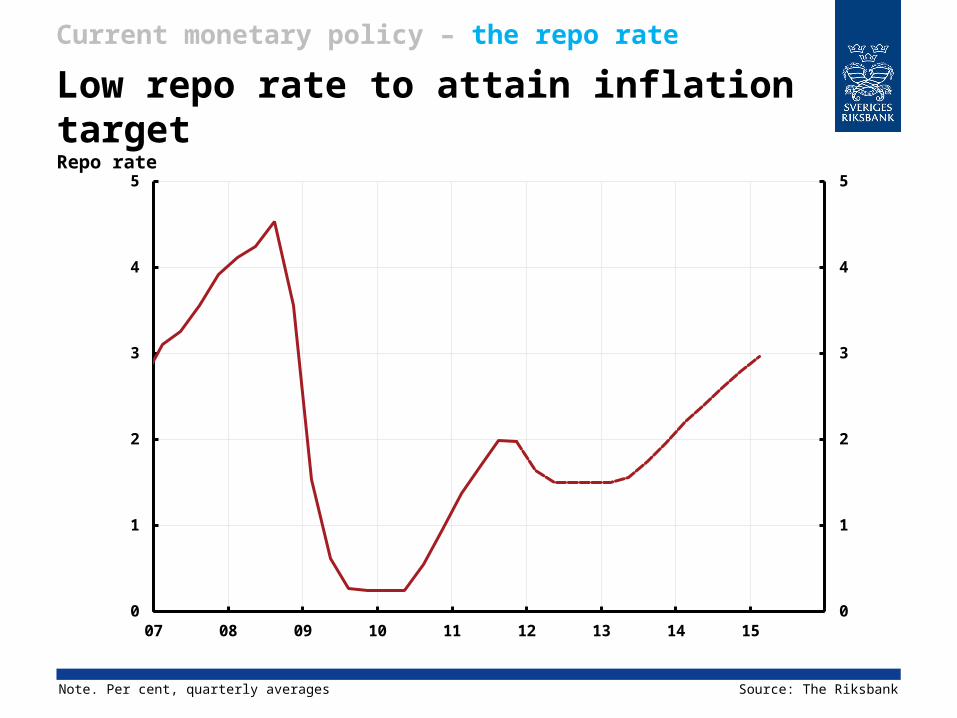
Low repo rate to attain inflation targetRepo rate
Note. Per cent, quarterly averages
Source: The Riksbank
0
1
2
3
4
5
0
1
2
3
4
5
07 08 09 10 11 12 13 14 15
Current monetary policy – the repo rate

”It is very difficult to make predictions, especially about the future.”
Niels Bohr
Current monetary policy – alternative outcome
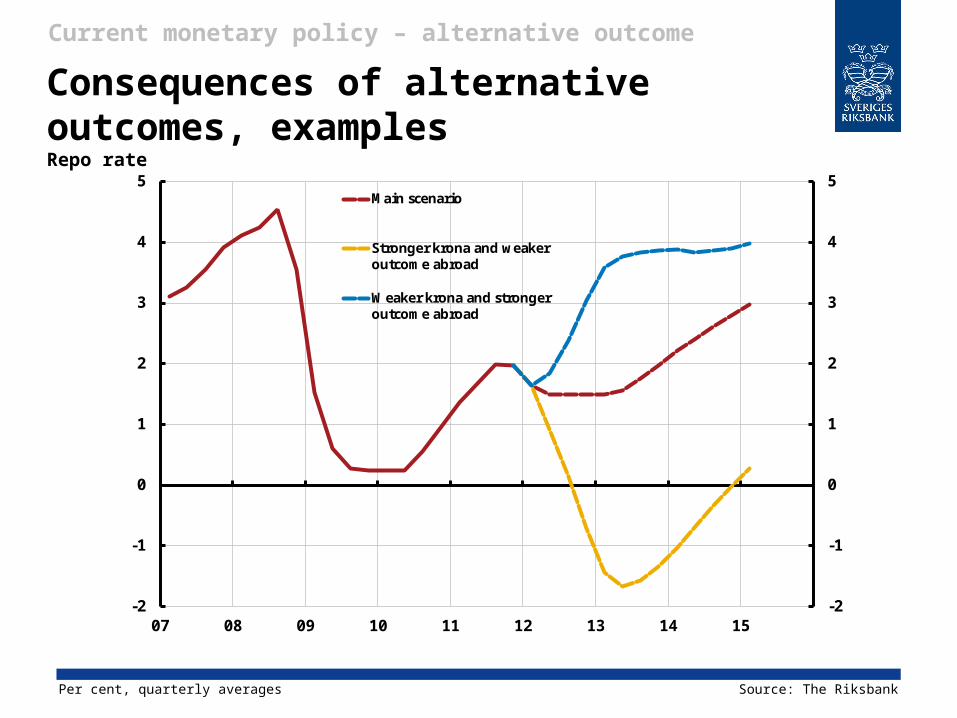
Consequences of alternative outcomes, examplesRepo rate
Current monetary policy – alternative outcome
Per cent, quarterly averages Source: The Riksbank
-2
-1
0
1
2
3
4
5
-2
-1
0
1
2
3
4
5
07 08 09 10 11 12 13 14 15
Main scenario
Stronger krona and weakeroutcome abroad
Weaker krona and strongeroutcome abroad

A forecast, not a promiseRepo rate
Note. Per cent, quarterly averages Source: The Riksbank
Current monetary policy – summary
-2
-1
0
1
2
3
4
5
6
7
-2
-1
0
1
2
3
4
5
6
7
07 08 09 10 11 12 13 14 15
90%75%50%OutcomeForecast
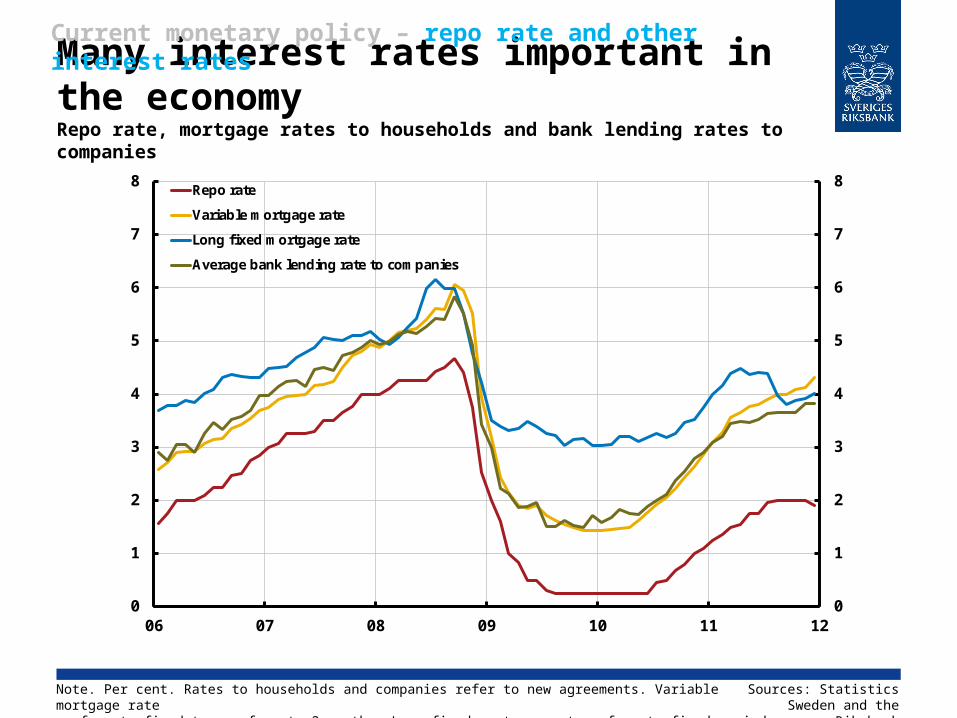
Many interest rates important in the economy Repo rate, mortgage rates to households and bank lending rates to companies
Current monetary policy – repo rate and other interest rates
Note. Per cent. Rates to households and companies refer to new agreements. Variable mortgage rate refers to fixed terms of up to 3 months. Long fixed mortgage rate refers to fixed periods of between 1 and 5 years.
Sources: Statistics Sweden and the
Riksbank
0
1
2
3
4
5
6
7
8
0
1
2
3
4
5
6
7
8
06 07 08 09 10 11 12
Repo rate
Variable mortgage rate
Long fixed mortgage rate
Average bank lending rate to companies
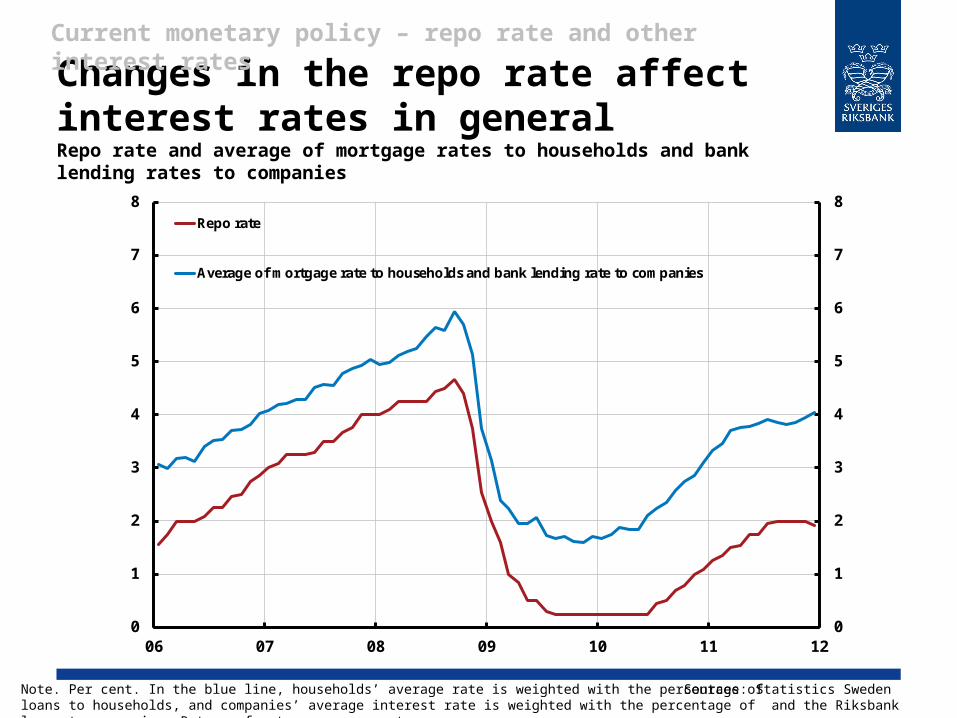
Changes in the repo rate affect interest rates in generalRepo rate and average of mortgage rates to households and bank lending rates to companies
Current monetary policy – repo rate and other interest rates
Sources: Statistics Sweden and the Riksbank
Note. Per cent. In the blue line, households’ average rate is weighted with the percentage of loans to households, and companies’ average interest rate is weighted with the percentage of loans to companies. Rates refer to new agreements.
0
1
2
3
4
5
6
7
8
0
1
2
3
4
5
6
7
8
06 07 08 09 10 11 12
Repo rate
Average of mortgage rate to households and bank lending rate to companies
Related Documents