RIIO Transmission Annual Report 2013-14 Annual Report Reference: Insert reference Contact: Paul O’Donovan Publication date: 19 March 2015 Team: Transmission Cost and Outputs Tel: 0207 901 7414 Email: paul.o’[email protected] Target Audience: This document may be of particular interest to users of the transmission networks, licensees, and providers of finance and consumer groups Overview: RIIO-T1 is the first transmission price control, along with its equivalent gas distribution (RIIO-GD1), that utilises the RIIO (Revenue = Incentives + innovation + outputs) price control model. This price control began on 1 April 2013 and runs for eight years, to 2021. This report reviews the progress transmission companies have made in the first year, and their forecast for the remainder of the eight year period, comparing their performance with the outputs they are committed to deliver and the costs they have incurred against allowed revenues. In addition, the report outlines the performance of the system operator (SO) companies, whose role is to ensure that the gas and electricity system remains in balance.

Welcome message from author
This document is posted to help you gain knowledge. Please leave a comment to let me know what you think about it! Share it to your friends and learn new things together.
Transcript

RIIO Transmission Annual Report 2013-14
Annual Report
Reference: Insert reference Contact: Paul O’Donovan
Publication date: 19 March 2015 Team: Transmission Cost and Outputs
Tel: 0207 901 7414
Email: paul.o’[email protected]
Target Audience: This document may be of particular interest to users of the transmission
networks, licensees, and providers of finance and consumer groups
Overview:
RIIO-T1 is the first transmission price control, along with its equivalent gas distribution
(RIIO-GD1), that utilises the RIIO (Revenue = Incentives + innovation + outputs) price
control model. This price control began on 1 April 2013 and runs for eight years, to 2021.
This report reviews the progress transmission companies have made in the first year, and
their forecast for the remainder of the eight year period, comparing their performance with
the outputs they are committed to deliver and the costs they have incurred against allowed
revenues.
In addition, the report outlines the performance of the system operator (SO) companies,
whose role is to ensure that the gas and electricity system remains in balance.

RIIO Transmission Annual Report 2013-14
Context
We regulate the monopoly and some of the competitive segments of the gas and
electricity markets. The competitive segment broadly encompasses the wholesale
and retail markets of electricity and gas. The networks that transport the gas and
electricity from producers to consumers are largely monopoly businesses except for
where competition is introduced. The regulation of the monopoly network businesses
is mainly through periodical price controls. These limit the amount by which costs
can rise and stipulates levels of performance, thus ensuring value for money for
consumers.
The electricity transmission network consists of the high voltage electricity wires
which convey electricity from power stations to local distribution networks and large
customers directly connected to the transmission system. The gas transmission
network consists of high-pressure long distance gas pipelines and compressors which
transport gas from offshore, storage and LNG facilities to local gas distribution
networks.
There are three onshore monopoly electricity transmission owners (TO) and one gas
TO in Great Britain:
National Grid Electricity Transmission plc (NGET), which owns the high voltage electricity network in England and Wales
Scottish Hydro Electric Transmission plc (SHE Transmission), which owns the high
voltage electricity network in the north of Scotland
SP Transmission plc (SPTL), which owns the high voltage electricity network in
the south of Scotland
National Grid Gas plc (NGGT), which owns the high pressure gas transportation system across Britain.
In addition to their TO responsibilities, NGET and NGGT are the designated electricity
and gas System Operators (SOs) respectively. They are responsible for day-to-day
system operation, including balancing of the system and constraint management.
The price controls for NGET and NGGT include allowances for the internal costs (staff
and IT costs)for NGET SO and NGGT SO. All external SO cost allowances for system
balancing are determined via a separate process.
In December 2012 we published our final proposals for RIIO-T1. This set out the
baseline revenues the TOs and SOs could recover and the outputs they would deliver
for the eight year period commencing 1 April 2013. It also contains processes to vary
revenues as the needs for the transmission system develops and/or their
performance exceeds or falls short of pre-set targets.
The key changes between the RIIO price control and previous price controls are as
follows:
An emphasis on outputs that companies are expected to deliver to
provide a clearer link between value for consumers and costs.

RIIO Transmission Annual Report 2013-14
3
Incentives are equalised between operating costs and capital
expenditure. Companies are therefore monitored on total expenditure
(totex) performance.
A longer period of eight years (rather than five) to give companies
more certainty and enable them to focus more on delivering for
consumers.
The introduction of a process to feed TOs’ actual performance into
revenue calculations annually.
The first year of the price control ended on 31 March 2014, and this report draws
upon the data and supporting information submitted by TOs and SOs. This report
reviews how the companies have performed and are forecasting to perform against
the outputs and allowances set. It reviews their effectiveness in delivering services
cost-efficiently and the benefits they have delivered to consumers and stakeholders.
This and subsequent annual reports will build the picture of TOs’ and SOs’
performance over RIIO-T1. These reports will also highlight to them and other
stakeholders where we will be focusing our analysis in future. This should encourage
TOs and SOs to provide better explanations of performance in returns and
information provided to all stakeholders.
Note
Please note that all financial figures are quoted in 2013-14 prices unless stated
otherwise. This includes forecast figures.

RIIO Transmission Annual Report 2013-14
Associated documents
Price Control Documents
RIIO-T1: Final Proposals for NGGT and NGET - Overview
RIIO-T1: Final Proposals for NGGT and NGET – Outputs, incentives and innovation
RIIO-T1: Final Proposals for NGET and NGGT – Cost assessment and uncertainty
RIIO-T1: Final Proposals for NGGT and NGET – Finance
RIIO-T1: Final proposals for SP Transmission Ltd and Scottish Hydro Electricity
Transmission
Transmission networks own reports on their 2013-14 performance
RIIO-T1: performance data
NGET’s 2013-14 performance report
NGGT’s 2013-14 performance report
SHE Transmission’s 2013-14 performance report
SPTL’s 2013-14 performance report
Ofgem TPCR-4 performance report
Transmission networks: Report on the performance of Transmission Owners during
he regulatory periods TPCR4 and TPCR4RO

RIIO Transmission Annual Report 2013-14
5
Contents
Executive Summary 7
1. Revenue and Customer Bill Impact 10 Analysis of Transmission Revenue 10 Customer Bill Impact 14
2. Outputs 18 Overall output targets and performance 18 Electricity outputs, measures and incentives performance 19 Reliability 19
Energy not supplied (ENS) 19 Availability 20
Network Access Policy (NAP) 20 Customer Satisfaction 20
Customer/stakeholder satisfaction survey 20 Connections 22
Wider works outputs 22 General connection activity 23
Environmental 24 Sulphur hexafluoride (SF6) 24 Business carbon footprint (BCF) all TOs 24 Losses 25 Environmental discretionary reward 26
Gas outputs, measures and incentives performance 27 Reliability 27
System Reliability 27 Additional capacity 28 Constraint management 28
Availability 28 Customer satisfaction 28 Connections 29 Environmental 29
Business Carbon Footprint (BCF) 29
3. Innovation 30 Network innovation allowance 30 Network innovation competition 31
4. Costs 32 Total expenditure (Totex) performance and forecasts 32 Network capital expenditure (Capex) and forecasts 37
Electricity load-related 37 Electricity non load-related 42
Gas 46 NGGT capex 46
Non-operational capex 51 Operating costs (Opex) and forecasts 52 Transmission investment for renewable generation (TIRG) 57

RIIO Transmission Annual Report 2013-14
5. Financial Performance 59 Regulatory Asset Value 59 Return on Regulatory Equity (RoRE) 60
Appendices 64
Appendix 1 – System Operator Performance 65
Appendix 2 – Customer Bill Impact Methodology 70
RIIO Transmission Annual Report 2013-14
7
Executive Summary
In July 2014 the Transmission Owners (TOs) submitted to Ofgem their regulatory
reporting packs covering the first year of RIIO-T1 (2013-14). We have now reviewed
these results and where necessary discussed them with individual companies. In
RIIO the focus is on outputs, incentives and innovation as well as total expenditure
(totex). Some of the required outputs will not be fully delivered until the end of RIIO-
T1 (2020-21) and therefore this report considers forecast performance across the
whole price control as well as in the current year.
As part of the agreed initiative to make company performance more transparent in
RIIO, TOs have already published their own annual performance reports on their
company websites at the end of September 2014. This report is therefore designed
to give a combined picture of the results rather than re-presenting the numbers
which are already in the public domain. We will also highlight to TOs and other
stakeholders areas where we will be focusing our attention in future years. This
hopefully will encourage TOs to address our concerns in their future returns.
2013-14 Performance Headlines
Customer Bill Impact
The electricity transmission share of an average customer’s bill between April 2013
to March 2015 increased by £0.81 from £21.78 to £22.59. This reflects the increased
investment in the transmission network by all three TOs to facilitate the growth in
renewable generation. The gas transmission share of an average customer’s bill
decreased £2.95 from £16.63 to £13.68 over the same period. This reflects the
reduced financing impact of the RIIO-T1 final proposals and lower expenditure on the
gas transmission network as the immediate need to expand the network identified
durig the RIIO process has further reduced. The electricity transmission element of
customer bills is expected to rise further in future years reflecting the large scale
investment in assets that is taking place. In terms of gas we expect the transmission
expect the element of customer bills to fall in future years, reflecting the lower
investment.
Output Performance
After one year’s results it is too early to say whether TOs’ expected output delivery
will meet the targets set against the six output categories. Some measures such as
energy not supplied and customer satisfaction are calculated each year and in year
one all TOs have performed better than target. In other areas such as business
carbon footprint (BCF), stakeholder engagement, and the environment discretionary
reward, performance has improved but not yet reached the level expected. Where
targets have not been met, we expect TOs to improve their performance.
For electricity TOs the future volume of connections activity is not totally certain and
we have therefore assumed a baseline level of generation connection will be
delivered. There are mechanisms in place so that the allowed funding will be
recalculated depending on connections outputs delivered. Larger investment
schemes are dealt with under the strategic wider works (SWW) process and we have

RIIO Transmission Annual Report 2013-14
already agreed three such projects for SHE Transmission under SWW. Other schemes
are in the planning stage and we have recently received an application from NGET
regarding reinforcement in the Hinkley-Seabank area.
All TOs made use of their network innovation allowance to develop ideas and projects
that may bring benefits in the future.
We note progress in a number of areas, but more work is required to ensure that all
outputs will be delivered. We will be working with the TOs to improve reporting and
understanding of asset health and network output measures (NOMs) which were
included to ensure we had leading indicators of network performance in place for
RIIO.
Financial performance
The financial performance of transmission companies is presented using the return
on regulatory equity (RoRE) measure. Based on the latest forecasts from the TOs, all
of them expect to exceed the expected return allowed in the RIIO-T1 Final Proposals,
by between 0.4% and 1.6%. The allowed return for electricity TOs was 7% and for
gas 6.8%. The forecast RoRE is dependent on future delivery of outputs, which is not
confirmed at this stage, and so this should be seen as the best estimate that is
available.
The regulatory asset values (RAV) of the electricity TOs are expected to grow
significantly over the RIIO-T1 period reflecting the investment necessary to remodel
the system to cope with the impacts of new generation.
Totex performance
In 2013-14 all TOs have spent less than their allowance mainly as a result of lower
load related (new connections activity) capex due to changes and delays in demand.
For electricity TOs, if the baseline connections outputs are not achieved, the level of
allowances will be scaled back by the mechanisms in place to reflect volume
uncertainty. NGGT underspent its load-related allowance by 98% reflecting the
current lack of new connections activity for gas transmission. In the future all TOs
are expecting outperform the efficiency targets used in setting allowances for RIIO-
T1 and a share of these efficiencies (savings) will be shared with consumers.
We expect TOs to make savings against the price control allowances. Despite making
forecasting savings against allowances TOs say that they will meet output targets..
Having analysed TOs’ submissions for 2013-14 we are concerned that some of these
projected underspends may impact on output delivery such as NOMs performance
and we will monitor this closely over the RIIO-T1 period. In particular we need to
consider further the changes in NGGT’s latest RIIO-GT1 forecast and the drivers for
these changes. There are a number of projects NGGT identified in the development
of its RIIO-T1 plan which have been funded which NGGT are stating are no longer
needed. We need to understand further the new information received by NGGT to
inform this decision.

RIIO Transmission Annual Report 2013-14
9
Quality of regulatory reporting submissions
Every year we require all TOs to provide us with financial data and information that
is of good quality and consistent with other information they put into the public
domain. This year we have had to ask NGET and NGGT to resubmit some of their
regulatory reporting packs due to the poor quality of the original submissions. NGET
and NGGT have confirmed they are taking steps to improve their reporting for the
ongoing period and we will consider whether any further regulatory action is
necessary if we do not see the expected improvements..
Having reviewed the reporting from the TOs in 2013-14 we have also identified scope
for improvements in reporting. These developments should help us to better
understand and critically review TOs’ performance during RIIO-T1 and improve the
information within the annual report.

RIIO Transmission Annual Report 2013-14
1. Revenue and Customer Bill Impact
Chapter Summary
This chapter explains how expenditure made by the Transmission Operators to
improve the UK’s transmission infrastructure in RIIO-T1 impacts on customer
electricity and gas bills.
Analysis of Transmission Revenue
Background
1.1. In TPCR4 the electricity and gas transmission licensees spent £11bn over a
six-year period on the transmission network in order to move to a more carbon
neutral energy system and maintain safety, security and affordability for existing and
future consumers.
1.2. Out of this £11bn, £9bn was invested in new electricity and gas transmission
assets with the remainder being spent on network maintenance and other related
activities.
Electricity
1.3. Over RIIO-T1, the transmission licensees expect to spend c. £17bn1
developing smarter transmission networks, connecting new sources of renewable
generation and improving environmental performance. This will contribute to a
higher allowed revenue profile for the licensees between 2013-14 and 2020-21 (see
Figure 1 and 2 below) and consequently an increase in electricity network charges as
explained below.
1.4. In the first year of RIIO-T1, total allowed revenues have increased £73m
(3.7%) compared to the final year of TPCR4. This is consistent with higher additions
to the regulated asset base in 2013-14 compared to 2012-13 which has caused base
revenues to increase.
1.5. There is a minor decrease in revenue from incentives in 2013-14 due to the
two-year lag in the recognition of actual incentive performance (compared to TPCR4
incentives which were mostly settled in 2012-13).
1 This represents 2013-14 actual totex plus seven years forecasted spend for 2014-15 to 2020-21 based upon the TOs’ latest published figures.

RIIO Transmission Annual Report 2013-14
11
Figure 1: Base revenue2 (£m) profiles for SHE Transmission and SPTL
0
50
100
150
200
250
300
350
2009201020112012201320142015201620172018201920202021
£m
SPT SHE Transmission
1.6. The increase in SHE Transmission’s forecast base revenue over the first three
years of RIIO-T1 is driven by large new infrastructure projects (eg Beauly Denny)
being undertaken. This reflects the major growth in the North of Scotland network
that is required to connect new forms of generation (predominantly windfarms). Over
the RIIO-T1 period the Regulatory Asset Value for SHE Transmission is expected to
triple in size (see chapter 4).
1.7. SPTL’s eight-year base revenue forecast reflects a steady increase in
expenditure over RIIO-T1 as new renewable generation is connected to the
transmission network (with an accompanying increase in shared infrastructure
assets), and strategic wider works projects to upgrade the network as a result of
increased renewable generation.
2Base revenue figures for 2008-9 to 2012-13 are derived from SHE Transmission and SPTL’s submitted Revenue RRPs. Base revenues for 2013-14 to 2020-21 are derived from the PCFM published as part of the November 2014 Annual Iteration Process. The impact of 2013-14 actual totex performance is reflected in the 2015-16 MOD adjustment to base revenue. The networks’ published totex forecasts for 2014-15 to 2020-21 are not incorporated in the base revenue forecasts for the equivalent years.

RIIO Transmission Annual Report 2013-14
Figure 2: Base revenue3 (£m) profile for National Grid Electricity
Transmission (TO)
1,200
1,300
1,400
1,500
1,600
1,700
1,800
1,900
2009 2010 2011 2012 2013 2014 2015 2016 2017 2018 2019 2020 2021
£m
1.8. NGET has stated that the outputs included in its Final Proposals baseline
(based upon the ‘Gone Green scenario’) are no longer representative of what has
actually transpired in 2013-14 due to the state of the UK economy and other factors.
As a result generation, demand and incremental wider works outputs are expected to
be significantly below baseline. Around 21GW less generation is currently anticipated
to connect over RIIO-T1 and as a result of lower demand around 20 fewer super-
grid transformers (SGTs) are required to facilitate connections over the same period.
1.9. At the end of 2013-14 there has been underspend on both load and non-load
related capex. Uncertainty mechanisms are in place within RIIO-T1 to adjust the
level of funding over the eight year price control period based upon variations in
stakeholder needs.
Gas
1.10. Over RIIO-T1, NGGT has forecast that c. £2bn4 of expenditure will be required
to connect incremental capacity, improve network flexibility, meet emission targets
3 Base revenue figures for 2008-9 to 2012-13 are derived from NGET’s submitted Revenue RRPs. Base revenues for 2013-14 to 2020-21 are derived from the PCFM published as part of the November 2014 Annual Iteration Process. The impact of 2013-14 actual totex performance is reflected in the 2015-16 MOD adjustment to base revenue. NGET’s published totex forecasts and forecast allowances for 2014-15 to 2020-21 are not incorporated in the base revenue forecasts for the equivalent years. 4 This represents 2013-14 actual totex plus seven years forecasted spend for 2014-15 to 2020-21 based
upon the TOs’ latest published figures.

RIIO Transmission Annual Report 2013-14
13
and maintain asset health. Overall it was expected that total allowed revenues for
NGGT will be higher in RIIO-T1 compared to TPCR4 (see Figure 5 below).
1.11. In the first year of RIIO-T1, total allowed revenues have decreased £179m
compared to the final year of TPCR4, which has resulted in a fall in gas network
charges as explained above. This decrease reflects phasing in load-related
investment in capacity to future years and a focus on non load-related expenditure
on asset health in the first few years of RIIO-T1. Phased load-related investment on
Scottish ‘1 in 20’ projects and the Avonmouth LNG replacement solution is expected
to contribute to higher revenue allowances in the later years of RIIO-T1.
Figure 3: Base revenue5 (£m) profile for National Grid Gas Transmission (TO
& SO)
500
550
600
650
700
750
800
850
900
950
1000
2009 2010 2011 2012 2013 2014 2015 2016 2017 2018 2019 2020 2021
£m
1.12. In order to fully understand how NGGT’s base revenue will impact annual
consumer bills over the eight year price control period both the TO and SO elements
of base revenue need to be considered. NGGT’s combined base revenue is forecast
to decline between 2013-14 and 2020-21 with shift in revenue from the SO to TO
between 2017-18 and 2020-21. This reflects the end of legacy SO revenue driver
allowances from TPCR-4 (which will decline from £94m in 2013-14 to £0m in 2017-
5 Base revenue figures for 2008-9 to 2012-13 are derived from NGGT’s submitted Revenue RRPs. Base
revenues for 2013-14 to 2020-21 are derived from the PCFM published as part of the November 2014 Annual Iteration Process. The impact of 2013-14 actual totex performance is reflected in the 2015-16 MOD adjustment to base revenue. NGGT’s published totex forecasts and forecast allowances for 2014-15 to 2020-21 are not incorporated in the base revenue forecasts for the equivalent years.
RIIO Transmission Annual Report 2013-14
18), with a corresponding increase in the TO base revenue allowances from 2017-18
onwards.
1.13. NGGT has highlighted in its 2013-14 regulatory reporting submissions that a
number of external economic and political factors are influencing the business case
for development of gas projects in the UK, resulting in a challenging investment
environment for new gas-fired generation and storage. As a result of this and other
factors NGGT expects limited load-related investment on the National Transmission
System (NTS).
1.14. At the end of 2013-14 there has been underspend on both load- and non load-
related capex, which is expected to create a lower allowed revenue profile over RIIO-
T1 than expected at Final Proposals.
Customer Bill Impact
1.15. Consumers pay licensed Transmission Operators (TOs) to operate and
maintain the transmission networks through their annual gas and electricity bills.
Transmission network charges accounted for approximately 4% of the average
annual customer electricity bill and 2% of the average annual customer gas bill at
the beginning of RIIO-T1 (1 April 2013)6.
1.16. In 2013-14 the average electricity transmission charge increased by £0.81
from £21.787 to £22.59 and the average gas transmission charge decreased by
£2.95 from £16.63 to £13.68. A breakdown of the transmission charge movements
in the average annual electricity and gas bills is shown in figures 4 and 5 below:
6 The % shares of the average annual customer gas and electricity bills attributable to transmission network charges are estimated from October 2014 Supplier Market Indicator data collected by Ofgem. 7 The average transmission network charges per household at the end of TPCR4, which was the price control in place between 2007-08 and 2012-13, were £21.24 and £16.22 for gas and electricity respectively. The opening positions for RIIO-T1 have been re-based from 2012-13 to 2013-14 prices for the purposes of the bill impact analysis.

RIIO Transmission Annual Report 2013-14
15
Figure 4: £ impact of RIIO-T1 on the average annual household electricity
bill (2013-14 from 2012-13)
21.78
22.59
1.78
0.23-0.12-0.68
-0.41
20.00
20.50
21.00
21.50
22.00
22.50
23.00
23.50
24.00
24.50
25.00
Average ElectricityTransmission Charge
(Apr 2013)
Base Revenue Change in IncentiveMechanisms
TIRG Legacy Items &Other
Under/(over)recovery from
2012/13
Average ElectricityTransmission Charge
(Mar 2014)
Figure 5: £ impact of RIIO-T1 on the average annual household gas bill
(2013-14 from 2012-13)
16.63
13.68
-0.72
-0.45
-1.64-0.07
-0.87
10.00
11.00
12.00
13.00
14.00
15.00
16.00
17.00
Average GasTransmission
Charge (Apr 2013)
Base Revenue Pass through Change in IncentiveMechanisms
Legacy Items &Other
Under/(over)recovery from
2012/13
Average GasTransmission
Charge (Mar 2014)
1.17. The annual bill impact is driven primarily by changes in the levels of
investment and returns set for RIIO-T1, which impacts the allowed revenue that can
be earned by the TOs and subsequently the transmission network charges passed
onto the consumer. Our methodology to calculate the annual bill impact is set out in
Appendix 2.

RIIO Transmission Annual Report 2013-14
1.18. The agreed level of investment was set by the Authority for the eight-year
price control period (2013-14 to 2020-21) at RIIO-T1 Final Proposals. The increase in
electricity allowed revenues between 2013-14 vs. 2012-13 relates to:
• Base Revenue: The allowed return (set by the Authority) that licensees can
earn from operating regulated transmission assets and making efficient
investments in new transmission infrastructure. Base revenue is the most
significant determinant of network charges levied by the licensees on
customers and is annually updated for actual outputs delivered and cost
performance.
• Pass through: Costs that we agree are outside of the licensees’ complete
control and are therefore allowed to be passed on in full to the customer e.g.
licence fees, business rates.
• Change in incentive mechanisms: In RIIO-T1 TOs will receive payments
(two years in arrears) under various incentive schemes relating to safety,
wider works, reliability, connections, customer service, social obligations and
environment where they have delivered outputs above the assumed level. The
impact on annual bills reflects this delayed timing.
• Transmission Investment in Renewable Generation (TIRG): TIRG was
introduced in 2004 as a mechanism to fund projects that connect renewable
generation to the electricity transmission network. To minimise delays in
funding TIRG sits outside base revenue until projects have reached
completion and then transfer to the main regulated asset base.
• Legacy items and other: Legacy items relate to revenue from mechanisms
and incentives that were part of the previous price control and that have been
recognised in 2013-14. These items reflect adjustments to TPCR4
expenditures. This category also includes other items which are not
recoverable through base revenue.
• Under-/over-recovery from 2012-13: Relates to the difference between
2012-13 actual revenue and 2012-13 allowed revenue, which is corrected for
in 2013-14.
1.19. The key driver of change in the annual electricity bill is the increased
investment in assets such as new lines. For example major investment is being
carried out on schemes such as the Western HVDC (£240m this year), Beauly to
Denny (£200m) and Kintyre to Hunterston (£27m).
1.20. For gas transmission, the reduction in the annual bill reflects lower allowed
returns, a lower investment in new assets, and less incentive payments than in the

RIIO Transmission Annual Report 2013-14
17
prior year (which included settlement of some incentives relating to the whole TPCR4
period).

RIIO Transmission Annual Report 2013-14
2. Outputs
Chapter Summary
This chapter examines the first year performance and forecast performance of the
TOs in meeting their output commitments and incentive targets over the RIIO-T1
period.
Overall output targets and performance
2.1. As part of RIIO-T1, we set outputs the TOs have committed to deliver over the
price control period. The following six outputs form the cornerstone of the new RIIO
price control framework8:
safety
reliability
availability
customer satisfaction
connections
environmental
2.2. In most cases it is impossible to measure the outputs with a single metric.
Therefore we identified a number of outputs or measures which we consider are
measurable, as shown in the table below. If TOs achieve the measures satisfactorily
we consider that they will have achieved the primary outputs. After one year results
it is difficult and potentially misleading to draw any firm conclusions from the TOs’
performance.
2.3. This chapter considers delivery by the electricity TOs then delivery by NGGT
TO.
8 Further detail of the outputs framework in RIIO-T1 is available on the Ofgem website in the link RIIO-
T1: Final Proposals for NGGT and NGET – Outputs, incentives and innovation

RIIO Transmission Annual Report 2013-14
19
Electricity outputs, measures and incentives performance
Table 1: Electricity outputs and measures
Primary Output Measures
Safety Network Output Measures
(NOMs)
Reliability Energy not Supplied
(ENS)
NOMs
Availability Network Access Policy
Customer Satisfaction Customer Satisfaction
Survey, Stakeholder
engagement
discretionary reward
Connections Baseline and Strategic
Wide Works Connections
Generation connections
Local Demand
connections
NGET planning
requirements
Environmental SF6
Business Carbon
Footprint
Losses
Environmental
Discretionary Reward
2.4. Outputs that are directly linked with network capex (NOMs and connections)
are discussed in Chapter 4.
Reliability
Energy not supplied (ENS)
2.5. All three Electricity Transmission Owners (ETOs) outperformed against their
targets in 2014 as shown in table 2 below.

RIIO Transmission Annual Report 2013-14
Table 2: ENS performance in 2013-14
2014
Units NGET SHE_T SPT
Energy not supplied (Incidents)
Number of transmission system incidents # 9 20 17
Number of excluded incidents (other than exceptional events)*
# 2 17 10
Number of transmission system incidents categorised as 'exceptional events'
# - - 1
Number of transmission system incidents due to Incentivised Loss of Supply Events # 7 3 6
Energy not supplied (Volumes)
Volume of unsupplied energy MWh 135.9 79.8 42.4
Volume of unsupplied energy from excluded incidents (other than exceptional events)*
MWh 0.9 44.2 0.1
Volume of unsupplied energy in incidents categorised as 'exceptional events'
MWh - - 0.1
Volume of unsupplied energy in incidents due to Incentivised Loss of Supply Events MWh 135.0 35.6 42.2
Energy not supplied (Targets)
Output target volume (fixed for RIIO-T1) MWh 316.0 120.0 225.0
Difference (negative indicates outperformance of targets)
MWh -181.0 -84.4 -182.8
* Events of the type specified to be excluded from the definition of 'Incentivised Loss of Supply Event' under the transmission licence Special Condition 3C
Availability
Network Access Policy (NAP)
2.6. The output was to develop a NAP within a month of the start of RIIO-T1, and
use this as a live document. The NAP was required to be reviewed regularly and
potentially updated. All three TOs have developed a NAP and are operating
consistently with these. Regular meetings demonstrate continued communication on
how to preserve and enhance the benefits of effective SO:TO interaction identified in
developing the NAP.
Customer Satisfaction
Customer/stakeholder satisfaction survey
National Grid Electricity
2.7. NGET uses customer & stakeholder satisfaction surveys combined as a
measure of its performance. The raw results that inform the financial incentive in this
area are focused on the same overarching question rating satisfaction on a scale
from 1 – 10, one for customer and the other for stakeholder survey.

RIIO Transmission Annual Report 2013-14
21
2.8. NGET had developed a customer satisfaction survey during the previous
control period. This gave us confidence in the baseline set to apply throughout the
RIIO-T1 period of 6.9. A cap and collar are applied to ensure the financial incentives
are not distorted by outlier figures.
2.9. While the survey considers the different transmission activities, the question
that feeds into the financial incentive is an overarching question on overall
satisfaction with NGET. This is scored on a 0 to 10 scale with the baseline set at 6.9.
NGET scored 7.4 against the baseline Each year provides more information on the
way stakeholders respond to surveys that will help with the design of future
incentives in this area.
SP Transmission and SHE Transmission
2.10. The two Scottish TOs record performance against a stakeholder satisfaction
survey and against a set of key performance indicators (recognising that as above
for NGET we have very limited evidence as to how stakeholders respond to surveys).
The survey performance is also driven by an overarching question on a 0 – 10 scale.
In the absence of evidence, we set the baseline or bar at 5. Table 3 summarises their
performance.
Table 3: Scottish TOs stakeholder satisfaction results
Company Survey (0-10, baseline 5) KPI (0-100, baseline 50)
SP Transmission 7.4 72.1
SHE Transmission 6.5 91
2.11. These key performance indicators (KPIs) are measures that each of SPT and
SHE Transmission developed to cover their respective connections activities, working
with the system operator and where the quality of delivery of these is not otherwise
assessed ie by other output measures. This supports the stakeholder survey where
there remains significant uncertainty about how stakeholders (without contractual
links) might mark the survey.
2.12. There remains uncertainty in how stakeholders respond to a survey and in the
early years around performance against the KPIs. This is the reason we set
conservative baseline levels. We will review this further for future years of the
control. Despite this uncertainty and any future changes, we see the above scores as
reflecting strong performance by both companies.
Stakeholder engagement discretionary reward
2.13. All three electricity TOs made submissions to our stakeholder engagement
discretionary reward. This provides financial reward where effective stakeholder
engagement results in high quality outcomes. This is designed to lock in the
improvements we saw in the RIIO-T1 price control in the way the TOs worked with

RIIO Transmission Annual Report 2013-14
their stakeholders to understand their needs and increase general understanding of
priorities.
2.14. Compared to distribution companies, transmission companies have to make
more progress, since in general they collectively scored lower. The results of this
year’s assessment, while improving over the ‘dry run’ in the year before RIIO-T1 was
introduced, still leave room for improvement. This is understandable given the more
established direct relationship between distribution network companies and
customers. More detail is in our report on this year’s stakeholder engagement
discretionary reward9.
Table 4 Stakeholder engagement discretionary rewards scores
Company Score (out of 10)
NGET 5.75
SHE Transmission 5.4
SP Transmission 4.9
Connections
Wider works outputs
2.15. To connect new generation, maintain security of supply and bring low carbon
benefits, we have been managing programmes which fund the TOs for transmission
network reinforcement. Two major investments projects funded prior to RIIO-T1 are
due to complete by 2017.
9 See https://www.ofgem.gov.uk/ofgem-
publications/91799/reporttosstakeholderengagementscheme2014.pdf

RIIO Transmission Annual Report 2013-14
23
Baseline wider works outputs
Beauly-Denny: this upgrades the existing 132kV transmission line to 400kV
between Beauly in the north of Scotland and Denny in central Scotland. This will
help to reduce constraints and losses on the network, and facilitate the
connection of additional renewable generation. The majority of the northern
section of the project has now been energised, with the southern section
expected to be completed between November 2015 and summer 2016. In
November 2014 we approved a request for additional funding and an extended
construction period for the project by SPTL for the forecast cost increase and
delays in its section.
Western HVDC link: this is a new sub-sea link between Scotland and England
with a capacity of 2,400MW and will help reduce constraints between Scotland
and England. Delivery was expected to be completed in summer 2017, but this is
now unlikely due to technical difficulties and the final date is subject to review.
The funding for this project was approved in 2012.
Strategic wider works outputs
2.16. RIIO-T1 put in place the Strategic Wider Works (SWW) process for the
approval of future major investments. In their RIIO-T1 business plans, the three
onshore TOs identified transmission projects totalling approximately £9 billion that
may be needed over the next decade.
2.17. To date, we have received three proposals for new transmission projects in
northern Scotland from SHE Transmission with a combined total value of around £1.5
billion for assessment under SWW. In 2013-14 we approved two of these projects:
Kintyre-Hunterston and Beauly-Mossford. The first project is designed to deliver
270MW of additional transmission capacity from late 2015-16, reducing existing
constraints and enabling new connections in Kintyre. The second project, Beauly-
Mossford, will provide 252MW of additional transmission capacity in 2015-16 north-
west of Inverness. In December 2014 we also approved the third project, Caithness-
Moray. This will deliver an additional 795MW of transmission capacity across the
transmission system boundary B0, and 850MW across boundary B1. The additional
capacity is needed by 2018 to allow around 1.2GW of renewable generation to
connect.
General connection activity
2.18. We hold all transmission owners accountable for delivering timely and
effective connections to the network through their licences10. SP Transmission and
SHE Transmission also face a timely connections financial incentive where their
revenues are reduced if they fail to deliver an offer of terms within the specified
period.
2.19. SHE Transmission completed all 47 of its offers within this time. This covered
a number of different types of connection including tidal and CHP, though most were
10 NGET has no financial incentive but needs to comply with its licence condition obligations.

RIIO Transmission Annual Report 2013-14
onshore wind. SPTL failed, on two of its 50 offers (one onshore wind, the other
biomass), to meet the 3 month timescale as set out in its licence. We have discussed
this with SPTL and this seems to be a transitional problem that has now been
resolved. We will continue to keep monitoring progress.
Environmental
Sulphur hexafluoride (SF6)
2.20. Both NGET and SPTL outperformed against target emissions levels of this
greenhouse gas. A single leakage incident at SHE Transmission’s Fort Augustus
substation caused by a rupture disc failure on a newly commissioned 275 kV circuit
breaker resulted in the loss of 113 kg of SF6. This incident meant that SHE
Transmission exceeded its target emissions level by 72% and will therefore be
penalised under the SF6 incentive mechanism. Had the Fort Augustus incident been
avoided then SHE Transmission would have slightly outperformed its target.
Figure 6: SF6 Performance 2013-14
Business carbon footprint (BCF) all TOs
2.21. Companies must report annually on the transmission network BCF. The
network BCF includes:
Scope 1 emissions directly related to the day-to-day business activities of network
business.
Scope 2 emissions which arise from operating the network, including the CO2
emissions from losses of electricity or shrinkage of gas that occur as a result of
transporting energy on the network.
Scope 3 emissions which are due to third party contractors carrying out business
activities on behalf of the network.

RIIO Transmission Annual Report 2013-14
25
2.22. In 2013-14 the four transmission companies all reported to us a BCF in terms
of tonnes of carbon dioxide equivalent as follows:
Table 5: BCF in terms of tonnes of carbon dioxide equivalent per licensee11
SHE SPT NGET NGGT
Total 183,676 237,596 2,233,421 350,192
2.23. We have also reviewed the information publicly provided by the companies to
stakeholders on company BCF. We think there are some problems with the
information provided, and suggest some improvements are made in the information
published next year. For example:
More information is needed to put company-specific carbon emission targets in
context – a target of an X% reduction is not particularly meaningful if emissions
in the base year are not referenced and there is no definition on the scope of
emissions that are included in the target measure.
Only SHE Transmission provided a complete breakdown of its BCF by category .
We think that the information on network BCF would be more useful if all the
companies provided a full breakdown of total emissions by source, and relative to
the target the companies have set.
Losses
2.24. All TOs have a reputational incentive in relation to their overall approach to
contribution to fewer transmission losses where they can do do so and provide long
term value to consumers. To date all three TOs have complied with the license
condition, all transmission companies have strategies in place to reduce losses on
their networks and report against these annually12.
11 The figures for SHE Transmission and SPT represent revised submissions following the correction of
significant anomalies in their original figures. We note that SPTL does not provide an estimate for the
amount of emissions that are attributable to its own use of electricity at substations on its network. While this would not increase the revised BCF total above, we think it is undesirable that substation energy use (a Scope 1 emission) is not monitored and measured as this is the first step required to look for mitigation opportunities. We think there is an urgent need for both companies to review BCF monitoring and calculation processes to ensure these are fit for purpose.
12 Losses Reports
NGET - http://www2.nationalgrid.com/WorkArea/DownloadAsset.aspx?id=36719 SHE Transmission - https://www.ssepd.co.uk/WorkArea/DownloadAsset.aspx?id=3939 SPT - http://www.spenergynetworks.co.uk/userfiles/file/SPT%20Losses%20Report%20%202014.pdf

RIIO Transmission Annual Report 2013-14
Environmental discretionary reward
2.25. The Environmental Discretionary Reward (EDR) is a reputational and financial
incentive for electricity transmission licensees. The aims of the scheme are to
encourage the companies to contribute to the transition to a low carbon energy
system and to achieve high standards of environmental management. The scheme
covers activities in the following categories:
Strategic understanding and commitment to low carbon objectives
Whole electricity system planning
Connections for low-carbon generators
Collaboration on innovation
Network development solutions that avoid the need to reinforce the
network
Direct environmental impact
Business greenhouse gas emissions
2.26. All three electricity TOs applied to the voluntary scheme in 2013-14, which is
the first year it has been run following a trial in 2013. A company must provide
evidence of its activity in each category to show how it has met the required criteria.
We score the evidence and assign a company to a performance band (‘engaged’,
‘proactive’, or ‘leadership’). Only companies that achieve a “leadership” score can get
a financial reward. We indicate in the scheme guidance that to achieve leadership
performance, a company must show evidence of how it is looking beyond business as
usual, takes a whole system perspective, and collaborates with a range of
stakeholders to achieve outstanding performance across the scheme categories. We
hope to see all three companies achieve this overall level of performance in future
years.
2.27. Although in all cases the underlying scores were higher than in the trial held
last year, none of the companies accomplished a leadership performance band
overall (see table below).

RIIO Transmission Annual Report 2013-14
27
Table 6: EDR performance in 2013-14
Company Performance band Financial reward
NGET Proactive No
SHE Transmission Engaged No
SPTL Proactive No
Gas outputs, measures and incentives performance
Table 7: Gas secondary outputs and measures
Primary Output Measures
Safety Network output measures
(NOMs)
Reliability System reliability
Additional capacity
Constraint management
Availability Baseline capacity for
each entry and exit point
(as set out in the licence)
Customer Satisfaction Customer satisfaction
survey, stakeholder
engagement
discretionary reward
Connections Connections process
established through
UNC373
Environmental Business carbon footprint
Note: Outputs that are directly linked with network capex (NOMs and connections)
are discussed in Chapter 3.
Reliability
System Reliability
2.28. While there is no specific target, we expect NGGT to meet its 1:20 obligations.
This means that a 1 in 20 highest winter peak demand for gas can be delivered. Our
understanding of the lasting quality of the network reliability is provided by our
NOMs.

RIIO Transmission Annual Report 2013-14
Additional capacity
2.29. Only a small amount of additional capacity was delivered during the period.
This was triggered during the previous price control (TPCR4 and TPCR4 roll over). No
new triggers for extra network capacity at entry points were received during the first
year of RIIO-T1. At exit, a small demand was met entirely through the process of
substitution where capacity at a neighbouring point can be used.
Constraint management
2.30. The gas constraint management incentive on NGGT encourages the company
to be efficient in managing buyback costs (costs through retrieving capacity
previously sold to shippers) net of related revenues eg from gas shippers who use
more than the gas they contracted for. While significant buyback activity can be very
costly, NGGT's performance in 2013-14 follows recent years where the net costs
were relatively small.
Availability
2.31. NGGT is meeting the availability targets. These are set as baseline capacity for
each entry and exit point within its transmission licence.
Customer satisfaction
2.32. Like NGET, NGGT performed well against both customer and stakeholder
surveys. The margin over expectation on the customer satisfaction was limited but
reflected an improvement on previous survey results experienced by NGGT13. Its
stakeholder survey score was 8 out of 10. At present as with electricity 90% of the
financial incentive will be determined by the customer satisfaction survey while
confidence in the use of surveys of stakeholders grow.
2.33. NGGT also made submission for our stakeholder engagement discretionary
reward. This provides financial reward where high quality outcomes result from
effective stakeholder engagement. This is designed to lock in the improvements we
saw in the RIIO-T1 price control in the way the TOs worked with their stakeholders
to understand their needs and increase general understanding of priorities.
2.34. NGGT scored 5.75 out of 10. As with NGET, this was the strongest TO
performance. However, this still tended to trail most of the distribution companies by
some distance. It is possible that NGGT like the other TOs can make enough
progress next year to achieve equivalent performance with some of the distribution
13 National Grid carried out customer satisfaction surveys for several years before we set this as part of
the RIIO-T1 output incentive measures.

RIIO Transmission Annual Report 2013-14
29
companies. There is more detail in our report on this year’s stakeholder engagement
discretionary reward14.
Connections
2.35. There are no specific incentive measures in place for NGGT’s connections
performance. The output that it needs to meet is the process established under
Uniform Network Code (UNC) 373 Governance of NTS connection processes, which
sets out what customers can expect from NGGT in delivery of connections.
2.36. NGGT is required under UNC 373 to publish on a quarterly basis: the number
of application forms submitted; and the number of full and initial connections offers
made by NGGT. We understand that NGGT has complied with the required
arrangements and we are not aware of any concerns.
Environmental
Business Carbon Footprint (BCF)
2.37. See BCF performance details under electricity paragraph 2.21 above
14 See https://www.ofgem.gov.uk/ofgem-publications/91799/reporttosstakeholderengagementscheme2014.pdf

3. Innovation
Chapter Summary
This chapter presents an overview of TO’s expenditure in relation to the various
innovation incentives in RIIO-T1
Network innovation allowance
3.1. The Network Innovation Allowance (NIA) was established as part of the RIIO-
T1 price control. The NIA provides each licensee with a set ‘use it or lose it’
allowance to spend on innovation projects in line with the NIA Governance
Document15 16. The table below shows each licensee’s NIA percentage.
Table 8: Licensees Network Innovation Allowance for RIIO-T1
Licensee NIA Percentage of Annual Base
Revenue
National Grid Electricity Transmission plc 0.7
SHE Transmission plc 0.7
SP Transmission plc 0.5
National Grid Gas plc 0.7
3.2. In the first year of RIIO-T1 all licensees have implemented NIA projects.
Projects have been started which if successful should: reduce safety risks, improve
reliability, reduce the environmental impacts of the network, facilitate new
connections, develop new commercial frameworks, strategically develop licensees’
networks, improve system operability and enhance working processes.
3.3. Licensees have registered a number of projects so far: these include
developing new insulated cross arms on overhead lines and researching new ways of
protecting gas pipes travelling below roadways. While a project can be registered in
one year the expenditure can continue over a number of years. National Grid Gas plc
has registered projects with a value of £9.8m and it has spent £3m. Electricity
transmission licensees have registered projects with a value of £76.1m and
collectively they have spent £8.4m. All licensees spent in line with the amount that
was available to them in 2013-14.
3.4. Licensees have begun to develop useful learning from this investment. Details
on all projects can be found on the Energy Network Association’s (ENA’s) Smarter
Networks Portal17.While we are pleased that the NIA is working well and developing
15 The Gas Network Innovation Allowance Governance Document can be found here 16The Electricity Network Innovation Allowance Governance Document can be found here. 17 http://www.smarternetworks.org/

RIIO Transmission Annual Report 2013-14
31
new learning we need to ensure this is shared effectively. We recently published an
open letter encouraging them to improve the quality of project reporting on the
Smarter Networks Portal. We encourage all licensees to consider how this can be
improved. While we are concerned regarding the standard of project reporting we
were generally pleased with the Annual Summary of NIA Activity published by
licensees18.
Network innovation competition
3.5. Ofgem runs two annual competitions to which transmission companies can
apply: the Network Innovation Competitions (NIC) for Electricity and one for Gas.
The competitions help to encourage Network Licensees (distribution and
transmission) to innovate in the design, build, development and operation of their
networks.
3.6. The NIC provides funding to a small number of large-scale innovation
projects. Trials financed through the NIC will generate learning for all Network
Licensees and will be made available to all interested parties. This learning brings
potential benefits and cost savings for current and future consumers. In 2013, the
first year of the NIC, two electricity transmission projects were selected and funded a
total of £17.8 million. This funding is being recovered across all electricity customers
during 2014-15.
Table 9 – Transmission projects selected for funding in the 2013 NIC19
Project Title Lead company
Brief explanation Funding request
Timescale
Visualisation of Real Time System Dynamics using Enhanced Monitoring (Anglo-Scottish Border)
SP Transmission plc
This project would use new sources of data and methods of analysis to optimise use of capacity on the Anglo-Scottish interconnector.
£6.5m December 2013 to March 2017
Multi-Terminal Test Environment for high voltage direct current (HVDC) Systems (Scottish Hydro Electric Transmission Licence Area)
Scottish Hydro Electric plc
This project would establish a collaborative test and development facility for HVDC systems.
£11.3m January 2014 to March 2021
18 http://www.smarternetworks.org/Project.aspx?ProjectID=738#downloads 19 More detail on the NICs and the progress of the projects can be found here:
https://www.ofgem.gov.uk/network-regulation-%E2%80%93-riio-model/network-innovation

RIIO Transmission Annual Report 2013-14
4. Costs
Chapter Summary
This chapter evaluates RIIO-T1 actual and forecast expenditure against the costs
allowed in the RIIO-T1 settlement, taking into account actual and forecast workloads.
It looks at the various cost categories and activities which make up total expenditure
(totex). It also explains how we incorporate uncertain costs.
Note: The RIIO-T1 final proposals included a number of uncertainty and incentive
mechanisms that allow the TOs to claim additional allowances if they are required to
do work over and above the base allowances. Conversely, if they deliver fewer new
connection outputs than assumed in the baseline then the allowances are reduced.
We and the TOs have adjusted the allowances based on current estimates of what
might happen in the future years of RIIO-T1.
Total expenditure (Totex) performance and forecasts
4.1. As part of RIIO-T1 we set a total expenditure allowance (totex) to enable
companies to deliver their outputs. Companies are incentivised to outperform their
totex allowance as part of the totex incentive mechanism (TIM). Any outperformance
is shared with the customer. For RIIO-T1 around 50 per cent is retained by the
company and 50 per cent of any out performance is returned to customers through
revenue charges. Any underperformance (over-spend) against their allowed totex is
similarly shared with the customer.
4.2. The companies reported annual totex is used to determine future revenue with
any out/underperformance adjusted after a two year lag. This should ultimately
impact consumers’ electricity and gas bills, but is reliant on the companies’
customers, the gas shippers, passing this on.
4.3. Throughout RIIO-T1 we will monitor the TOs actual totex and will compare
this with allowances set and companies annual forecast. Companies will have to
explain any variances as part of their annual reporting. When looking at the
companies’ annual performance it is essential to put this in the context that outputs
are required to be delivered over the full eight year price control period.
4.4. A fundamental change between the previous price control and the RIIO
framework is that companies are free to deliver outputs based on total whole life
costs without being constrained to using either operating expenditure (opex) or
capital expenditure (capex). This enables companies to select the best solutions and
optimises costs and benefits.
4.5. We will still monitor performance against capex and opex allowances to help
us understand overall totex performance. For capex, we discuss load-related
expenditure (increasing the size or reinforcing the network to accommodate new

RIIO Transmission Annual Report 2013-14
33
connections) and non load (expenditure on maintaining the existing network). This
chapter therefore goes into greater detail than one might expect in the RIIO price
control model. The reasons are: there is no benchmarking between companies as in
electricity and gas distribution, the TOs have forecasted significant underspends
against allowances, the allowances in some areas relate to single multi-million pound
projects, and, we believe some of the changes in forecast will affect how TOs might
or might not achieve their outputs.
2013-14 Actual Totex performance
Figure 7 shows performance for all four TOs in 2013-14 not only against the
allowance but also against the business plans each submitted to us for the price
review. The figures for the Scottish TOs show business plans equalling allowances
since we accepted their plans as submitted (and hence they were fast-tracked) in the
price control review process.
Figure 7: Actual totex for 2013-14 with allowances
4.6. In year one of the price control all TOs underspent their allowances, due in
part to lower load-related expenditure. Below is more detail on each TO.
NGETSHE
TransmissionSPTL NGGT
Business Plan Forecast 2137.2 227.4 360.9 345.2
RIIO Allowances 1790.1 227.4 360.9 261.4
2014 Actuals 1399.2 174.5 242.8 215.8
0
500
1000
1500
2000
2500
£m
Business Plan Forecast RIIO Allowances 2014 Actuals

RIIO Transmission Annual Report 2013-14
4.7. NGET totex is lower than allowances in 2013-14 due primarily to lower load
related capex. The reasons given by NGET are:
Delivery efficiencies
Customers are delaying connections
Delays to some incremental wider works and strategic wider works
projects
Opex for NGET and NGGT is higher than allowances, especially in the
case of NGET. This is due to the costs of a reorganisation
4.8. SHE Transmission totex is below allowances due to underspending on load-
and non load-related capex. The additional reasons given are:
Lower load due to planning and consenting issues
Non load lower than the allowance due to two overhead line schemes
being cancelled – superseded by other wider reinforcement schemes
4.9. Where non load outputs are effectively achieved by load expenditure we
expect TOs to review the merit of alternative use of the non load allowances to
improve asset health elsewhere in the transmission system. This will be taken into
account when we review NOMs targets and achievements.
4.10. SPTL totex is below allowances due to underspending on load-related capex,
offset somewhat by higher non load-related expenditure. The reasons given by SPTL
are as follows:
Lower load capex lower due to planning and consenting issues (this
was a continual problem in TPCR4)
Non load capex is higher than allowances. As SPT indicated in its
business plan, delays in its load programme have meant it has been
able to bring forward some non load expenditure. Of note, 130km of
overhead line conductor were replaced this year instead of later in
RIIO-T1.
4.11. NGGT totex is lower than allowances in 2013-14 due to lower capex. The
reasons given by NGGT are as follows:
Lower load-related capex due to a decline in customer activity
Network flex capex is on hold in Scotland as NGGT are assessing user
requirements
The Avonmouth pipeline reinforcement (incremental capacity) has
been delayed as the needs case is being reviewed
NGGT is implementing a solution to reducing the emissions (Industrial
Emissions Directive) at Aylesbury compressor station by using a
simpler less expensive one than proposed in the RIIO-T1 business plan
4.12. We accept that some of these reasons are outside the TO’s control. Others we
believe are within the TOs’ control and may have an impact on the TO’s output

RIIO Transmission Annual Report 2013-14
35
performance later in the period. We accept that many of these reflect an impact in
2013-14 which will unwind over the RIIO-T1 period.
4.13. We will be monitoring these in future years but we expect that TOs will deliver
all of their required outputs. Failure to do so will see these allowances clawed back
which will benefit consumers.
Forecast performance for the RIIO-T1 period
Figure 8: Forecast totex for RIIO-T1 period with allowances
4.14. As well as the performance in 2013-14 we have asked TOs to provide
forecasts for the whole of the RIIO-T1 period. In September 2014 NGET published
three forecasts, high, central and low. Our analysis is based upon the central forecast
(which should represent their ‘best view’). The four TOs are all forecasting to
underspend their totex allowance. NGET in particular is forecasting, even at this early
stage of RIIO-T1, to significantly underspend its allowance. Below is more detail on
each TO.
4.15. NGET’s forecast Totex for RIIO-T1 is lower than allowances because:
NGETSHE
TransmissionSPTL NGGT
Business Plan Forecast 14870.5 3234.1 2694.3 3228.5
RIIO Allowances 12158.5 3363.0 2694.3 2503.7
2014 Actuals and Forecasts 11153.1 3223.8 2623.2 2392.3
0
2000
4000
6000
8000
10000
12000
14000
16000
£m
Business Plan Forecast RIIO Allowances 2014 Actuals and Forecasts

RIIO Transmission Annual Report 2013-14
The economic slowdown since submitting its RIIO-T1 business plan has
meant that customers are delaying connections, with some load-
related work being delayed until RIIO-T2, and delays to incremental
and strategic wider work.
Non load-related capex is expected to be lower than allowances due to
new management approaches and efficiency measures reducing overall
costs while delivering target outputs.
4.16. It should be noted that where outputs are delayed beyond RIIO-T1, NGET’s
RIIO-T1 allowances will be reduced by the volume driver mechanism. We consider
this and non related efficiencies in section 4.23 onwards.
4.17. SHE Transmission’s forecast totex for RIIO-T1 is lower than allowances
because:
Load-related connections capex is expected to be lower reflecting
efficiency in delivery and some gains from baseline funding where
schemes are no longer required (eg OFTO connection to Argyll Array).
There is a small opex saving forecast which mainly reflects lower
business overhead costs
4.18. At the moment, we are unsure how these efficiencies will be delivered. We will
seek further clarification from SHE Transmission with next year’s submission.
4.19. SPT’s forecast totex for RIIO-T1 is almost in line with allowances:
The volume of renewable generation in Scotland is uncertain and
volatile which means forecasting is difficult and the allowances are set
to reflect actual outputs delivered. Load-related connections volumes
over the whole period are expected to be higher than baseline
assumption, which will trigger additional allowances.
SPT has reacted to delays in its load-related activity by bringing
forward non load expenditure. It explains that this approach will allow
it to deliver more load related activity later in the period.
SPT has indicated that despite its claim that the volume driver unit
cost being set too low and connection volumes expected to be higher,
it will underspend the load-related allowances by c. £110m. At the
moment we are unsure how it will deliver, and will seek more
clarification from SPT.
4.20. NGGT’s forecast totex for RIIO-T1 is lower than allowances because:
Lower load-related capex is significantly lower at £200m (85%) below
allowances. A number of external factors that are influencing the
economic case for the development of gas projects in the UK, resulting
in a challenging investment environment for new gas-fired generation

RIIO Transmission Annual Report 2013-14
37
and storage. NGGT now expect limited load-related investment on the
system.
Non load-related capex is expected to be higher than allowances with
additional investment proposed to address emissions issues. This is a
significant area of investment which we plan to scrutinise later in
2015.
4.21. We give further detail on NGGT delivery in paras 4.64 below.
4.22. The forecast expenditure and comments highlight what areas of performance
we should focus our monitoring in future years. These are:
Network Output Measures (NOMs) for all TOs. We will closely monitor whether
the targets at the end of RIIO-T1 are achieved. We are working with TOs to
further develop the NOMs methodology. Amongst other things, this would
help inform our assessment of how NGET achieve the non-load capex savings.
TOs’ achievement of efficiencies. We will examine in more detail how the
delivery efficiencies claimed by the TOs are achieved.
NGGT plans not to do some doing work that it highlighted as ‘essential’ in its
RIIO business plan, eg Avonmouth reinforcement, and for which funding was
allowed.
NGGT is forecasting an overspend of non-load allowance, reflecting
substantial investment in reducing emissions. As indicated above we shall be
focussing on this later in 2015.
Network capital expenditure (Capex) and forecasts
4.23. Capex is divided into load-related and non load-related. Load-related is the
installation of new assets on the network to accommodate changes in the level or
pattern of electricity or gas supply and demand. Non load-related expenditure is
expenditure that is spent on maintaining the existing network rather than to increase
capacity. Typically, this will be asset replacement or refurbishment.
Electricity load-related
4.24. Figure 9 below shows a breakdown of 2013-14 actual and latest forecast load
related capital expenditure for each TO against their allowances. It should be noted
that the current load-related capital expenditure forecasts from each TO differ from
their initial business plan submission to Ofgem in 2012. This was expected since
load-related expenditure relies heavily on generation and demand connections
materialising (over which TOs have little influence). We have therefore reassessed
the current year and forecast allowances in line with the relevant uncertainty
mechanisms and based on TO forecast outputs.
RIIO Transmission Annual Report 2013-14
NGET
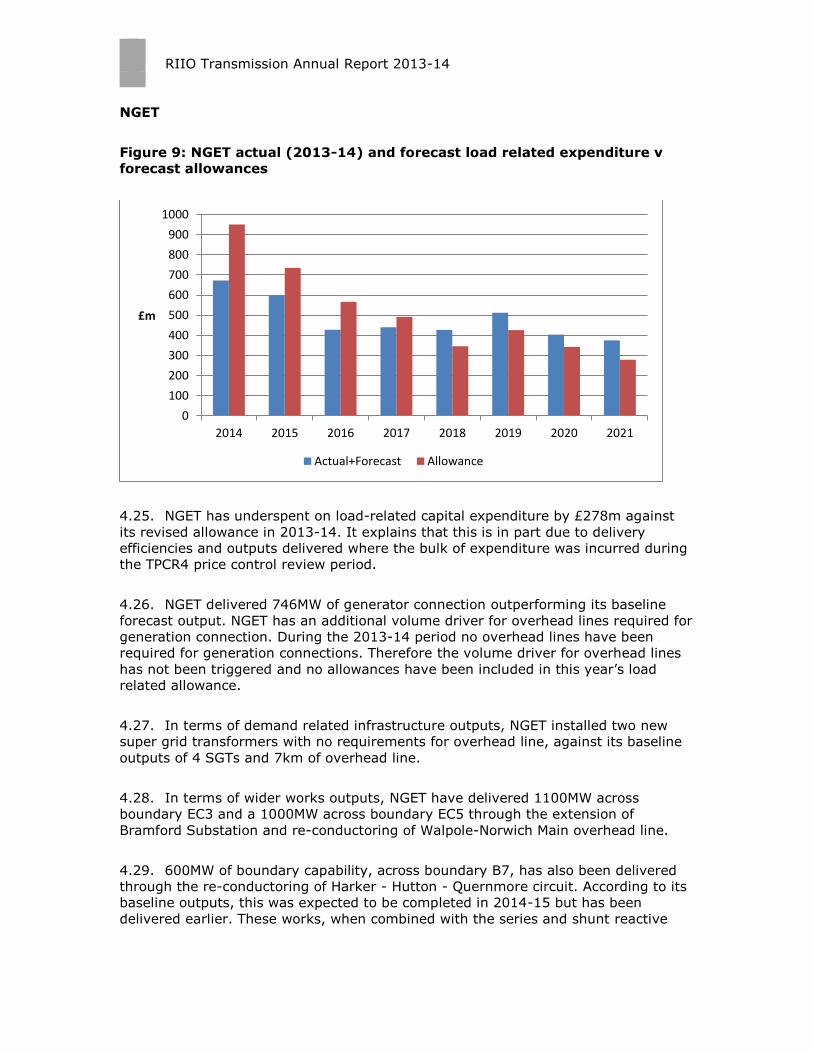
Figure 9: NGET actual (2013-14) and forecast load related expenditure v
forecast allowances
4.25. NGET has underspent on load-related capital expenditure by £278m against
its revised allowance in 2013-14. It explains that this is in part due to delivery
efficiencies and outputs delivered where the bulk of expenditure was incurred during
the TPCR4 price control review period.
4.26. NGET delivered 746MW of generator connection outperforming its baseline
forecast output. NGET has an additional volume driver for overhead lines required for
generation connection. During the 2013-14 period no overhead lines have been
required for generation connections. Therefore the volume driver for overhead lines
has not been triggered and no allowances have been included in this year’s load
related allowance.
4.27. In terms of demand related infrastructure outputs, NGET installed two new
super grid transformers with no requirements for overhead line, against its baseline
outputs of 4 SGTs and 7km of overhead line.
4.28. In terms of wider works outputs, NGET have delivered 1100MW across
boundary EC3 and a 1000MW across boundary EC5 through the extension of
Bramford Substation and re-conductoring of Walpole-Norwich Main overhead line.
4.29. 600MW of boundary capability, across boundary B7, has also been delivered
through the re-conductoring of Harker - Hutton - Quernmore circuit. According to its
baseline outputs, this was expected to be completed in 2014-15 but has been
delivered earlier. These works, when combined with the series and shunt reactive
0
100
200
300
400
500
600
700
800
900
1000
2014 2015 2016 2017 2018 2019 2020 2021
£m
Actual+Forecast Allowance

RIIO Transmission Annual Report 2013-14
39
compensation project, are expected to deliver a combined capacity increase of
1000MW for boundary B6 and 1400MW for boundary B7 during the 2014-15 period.
4.30. By 2018 NGET’s load-related expenditure is forecast to exceed allowances as
project investment to deliver transmission network capacity, for generation and
demand connecting in later years, increases. This trend is expected to carry on until
the end of the RIIO-T1 period as projects are delivered and generation and demand
connections materialise.
4.31. NGET has stated that fewer generation and demand connections are now
being required compared to the baseline allowances and outputs. This reduction in
generation and demand also reduces the need for incremental wider works, which
would have otherwise been needed to resolve boundary capacity constraints on the
transmission system.
4.32. NGET claims the out performance over the remaining RIIO-T1 period is due to
the delivery of the load-related capital programme in a more efficient way. It has, for
instance, reduced the number of delivery contractors for overhead line and
substation construction from eight to five, and broadened its contracting approach
with supply chain partners. It explains that the expected delivery efficiencies are
common across NGET’s entire capital programme and therefore relate also to its
non-load related investments. See the Electricity Non Load-Related section below for
further discussion of delivery efficiencies.
SHE Transmission
Figure 10: SHE Transmission actual (2013-14) and forecast expenditure vs
forecast allowances
0
100
200
300
400
500
600
700
800
2014 2015 2016 2017 2018 2019 2020 2021
£m
Actual+Forecast Allowance

RIIO Transmission Annual Report 2013-14
4.33. SHE Transmission has underspent on load-related capital expenditure by
£45m against its revised allowance in 2013-14.
4.34. SHE Transmission delivered the required substation works for the Beauly-
Mossford overhead line project as part of their baseline wider works outputs in 2013-
14. The Beauly-Mossford overhead line scheme is funded via two different
mechanisms and over two different price controls. The substation works started off in
TPCR4 and was funded through the TII20 mechanism. It is now part of the base line
wider works in RIIO-T1 and was completed by March 2014. The remaining overhead
line related work received funding approval in August 2014 via the strategic wider
works RIIO-T1 mechanism. However for 2013-14 no boundary transfer benefit has
been recorded for Sub-Boundary B10. The expected boundary benefit of 252MW can
only be achieved when the entire scheme is completed by 31 December 2015.
4.35. SHE Transmission has also delivered 217MW of new generation connections.
4.36. SHE Transmission explains that its underspend on load-related capital
expenditure was through connection scheme terminations and delays, efficiency
savings on particular projects such as Dounreay, Berryburn, Shin & Alness schemes
and on the timing difference between investment from previous price control regimes
and delivery in the current year.
4.37. SHE Transmission has forecast an outperformance of c. £150m against its
forecast allowances over the RIIO-T1 period. We expect future annual submissions
will further explain where the efficiencies have been put in place by SHE
Transmission to achieve this.
4.38. As with NGET’s forecast, SHE Transmission’s forecast also shows expenditure
outstripping allowances from 2017 before the trend is reversed as connections
materialise.
20 TII in April 2010 to provide project-specific interim funding for investment projects that did not have
funding under TPCR4

RIIO Transmission Annual Report 2013-14
41
SPT
Figure 11: SPT actual (2013-14) and forecast expenditure vs forecast
allowances
4.39. SPT have underspent on load-related capital expenditure by c£140m against
its reassessed allowance in 2013-14. This reflects delays caused by consenting issues
but the company expect to catch up this over the remaining period of RIIO-T1.
4.40. In 2014 SPT has delivered 400MW of sole use generation connection capacity
and 240MVA of shared use generation connection capacity.
4.41. Approximately £100m of the expenditure in 2013-14 was on wider works
projects including West Coast HVDC, series compensation and East-West projects.
4.42. Two local enabling exit infrastructure schemes (Grid Supply Points (GSP)
reinforcements) have been delivered.
4.43. A few schemes that were in the baseline at RIIO-T1 have subsequently
terminated (e.g. Andershaw and Rowantree). New contracted schemes are in early-
stage development, incurring small investment in the 2013-14 period. In the south-
west of Scotland planning difficulties have necessitated a re-profiling of investment,
with an 18-month delay associated with providing the necessary 275kV and 132kV
infrastructure. Other schemes such as Moffat substation commissioned in 2013-14,
have been delivered earlier than expected with the bulk of investment having taken
place outside of the reporting period.
0
50
100
150
200
250
300
350
400
450
2014 2015 2016 2017 2018 2019 2020 2021
£m
Year
Actual+Forecast
Allowance

RIIO Transmission Annual Report 2013-14
4.44. This re-profiling of investment has led to the significant underspend in the
current year (but was identified as a possibility in the company’s business plan).
4.45. Overall SPT is forecasting an underspend of £111m compared to its revised
allowances over the RIIO-T1 period.
4.46. Renewable generation connection activity is forecast to increase to around
4GW compared to the baseline of 2.5GW. SPT expects this to result in increased
shared infrastructure assets to support the potential increase in connected
generation. Strategic Wider Works projects included in the RIIO-T1 submission such
as Dumfries and Galloway upgrade (c£320m), east coast 400kV onshore upgrade
and the Central 400kV onshore upgrade (c£110m) are also expected to be triggered.
4.47. SPT’s forecast also shows that expenditure is expected to increase above
allowances after 2016 before this trend is reversed with the bulk of connections
materialising in 2020.
4.48. All three electricity TOs have highlighted that the uncertain nature of the
generation and demand backgrounds has resulted in significant re-profiling of project
expenditure and delivery when compared with the initially submitted RIIO-T1
business plans. The revenue drivers and the corresponding uncertainty mechanisms
within the price control will automatically adjust allowances if fewer outputs are
delivered. However, the timing of this adjustment depends on when the future
output was expected to be delivered.
4.49. We will carry out in depth investigation into the claims of efficiency savings
from all TOs. To enable us to verify efficiency savings as RIIO-T1 progresses through
the eight years, we are modifying our forthcoming annual reporting processes. This
will require TOs to report further information on efficient delivery and on project
progress.
Electricity non load-related
4.50. Figures 12 and 13 show how the electricity TOs have performed in 2013-14
and their non load-related capex forecast for the RIIO-T1 period.

RIIO Transmission Annual Report 2013-14
43
Figure 12: Electricity non load related actual 2013-14 expenditure and
percentage of allowance

RIIO Transmission Annual Report 2013-14
Figure 13: Electricity non load related forecast for RIIO-T1 and percentage
of revised allowance
4.51. NGET and SHE Transmission underspent on non load-related capex in 2013-14
and are forecasting overall underspend over RIIO-T1.
4.52. As was outlined in its business plan submission SPT has taken advantage of its
early settlement of the RIIO-T1 price control arising from its fast-track status to
accelerating its replacement programme. Further acceleration has been made
possible due to delays in load related investment. This has meant a 21% over-spend
on non load-related activities (£16.1m) in 2014. However, we note that expenditure

RIIO Transmission Annual Report 2013-14
45
is forecast to drop off towards the end of RIIO-T1 resulting in total forecast
expenditure that is roughly in line with allowances.
4.53. NGET has indicated that it will achieve an estimated £831m of savings on its
non load-related programme. It expects to achieve these savings through a
combination of innovation (£375m) and delivery efficiencies (£456m). NGET
explained that the savings through innovation are related to rebalancing
refurbishment and replacement of circuit breakers, targeted partial replacement of
overhead line fittings, and using enhanced paint coating system. It also gave the
main sources of delivery efficiencies as organisational redesign and revision to its
procurement and contracting arrangements.
4.54. To help us better understand the true extent of efficiency savings and the
robustness of NGET’s business planning process, we will consider revising the
regulatory reporting requirements to provide more visility in this area. We will also
examine as part of our ongoing NOMs work the impact of revised non load-related
programme on relevant outputs.
Non load related outputs
4.55. The main non load related outputs are replacing and refurbishing Primary
Plant Type (Lead) Assets21 and are captured by the NOMs. All three ETOs claim to be
on target to deliver non load-related outputs by the end of RIIO-T1. We are
currently working with ETOs to further develop the NOMs methodology by the end of
2015. We expect the methodology to help us assess whether the companies’
replacement and refurbishment programmes deliver appropriate levels of outputs
and whether these have been delivered efficiently.
4.56. While SHE Transmission’s and SPT’s forecast expenditure on Primary Type
Assets is in line with allowances, NGET expects to underspend by approximately
£817m22 while still delivering equivalent outputs. NGET’s savings are partially offset
by a £122m forecast overspend on non primary type (non lead) assets. In our future
work we will monitor NGET’s expenditure on non-lead assets and seek evidence of
additional output delivery for the forecast overspend on non lead assets and how this
might be impacted by any savings resulting from innovation.
4.57. Figure 14 show the forecast level of capex relating to primary assets
compared to allowances.
21 Primary or lead assets are the main assets comprising the transmission network that are required for
the safe and reliable transfer of electricity from one point on the network to another. They do not include for example monitoring, telecommunications, or protection equipment (except for switchgear). For reporting purposes the following asset categories are lead assets: Switchgear (circuit breakers), overhead
lines, transformers, underground cables, cable tunnels. 22 We have adjusted submitted allocation between lead and non lead assets to provide a like for like
comparison with allowances.

RIIO Transmission Annual Report 2013-14
Figure 14: NLR capex primary plant forecast for RIIO-T1 and percentage of
revised allowance
Gas
NGGT capex
4.58. NGGT received £1281m for capex for RIIO-T1. The actual spend in the 2013-
14 year has been £122m against funding of £167m. Figure 15 below shows NGGT’s

RIIO Transmission Annual Report 2013-14
47
overall capex delivery compared against allowances23. Figure 16 shows the forecast
profile of expenditure during RIIO-T1.
Figure 15: NGGT load and non load capex against allowances 2013-14
Figure 16: NGGT forecast capex profile against RIIO-T1 allowances
Forecast performance during RIIO-T1
4.59. In light of RIIO-T1 allowances, NGGT’s forecast is to underspend its totex
allowance by approximately £111m throughout RIIO-T1 (as reflected in Figure 8
above). We are mindful of the potential revised delivery of the capex in terms of
load-related projects, such as the Avonmouth pipelines and the deferral of flexibility
expenditure, and in terms of non load-related projects, such as the compressors’
23 Excluding non-operational capex see section 4.73 below
0.0
20.0
40.0
60.0
80.0
100.0
120.0
140.0
LR NLR
£m
Allowance Actual
0.0
50.0
100.0
150.0
200.0
250.0
300.0
350.0
400.0
2014 2015 2016 2017 2018 2019 2020 2021
£m
Total capex - allowance vs actual
Allowance Actual

RIIO Transmission Annual Report 2013-14
emissions projects and continued underspend in Asset Health. Ofgem’s view is that
these could result in a total underspend of approximately £400m. We comment
further on these projects below.
NGGT load related capex
4.60. Figure 17 below shows the comparison between allowances and actual spend
for Load related capex for 2013-14.
4.61. NGGT was funded primarily to deliver the following projects:
Network capability to maintain the 1-in-20 obligation in Scotland. This
involved projects at strategic locations within the National Transmission
System (NTS), such as reverse flow modifications at compressor sites. These
projects were aimed at reversing flows of natural gas towards Scotland in
order to replace declining volumes of UKCS gas in case of a 1-in-20 demand
scenarios;
Two 900mm pipelines (‘pipeline solution’) as a replacement of the Avonmouth
LNG storage facility, which was expected to be decommissioned in 2018. This
solution was the one proposed by NGGT in its RIIO-T1 business plan as the
most appropriate one through its optioneering. In order to avoid risks relating
to security of supply, Ofgem provided funding for the two pipelines.
4.62. In its submission, NGGT has signalled that:
The projects for the 1-in-20 obligation in Scotland will be deferred. More
specifically, NGGT used updated supply and demand information to see what
physical reinforcement of the network was still required to meet the demand
obligations in Scotland. However, the forecast rate of decline of flows from
the St. Fergus terminal has reduced. As a result the required reinforcement
has been pushed back in the investment plan. No clear indication has been
given for a delivery timeline, or for which projects will be delivered. NGGT has
indicated it will identify efficiencies in delivering these projects alongside
future non-load related investment required for environmental compliance
purposes;
A different approach, eg a commercial solution, is more appropriate for
Avonmouth as a solution and NGGT will explore this further with its
stakeholders. More specifically, at the start of the RIIO-T1 period, NGGT
updated its analysis in order to review the needs case for the project before
initiating the expenditure. This involved further consideration of updated
supply and demand information and expected future customer requirements.
As a result, NGGT will engage with stakeholders to fully understand the range

RIIO Transmission Annual Report 2013-14
49
of options that will enable it to deliver the Avonmouth related outputs, ahead
of significant investment in the pipelines.
4.63. As a result of the above, NGGT is underspending on its allowances on the first
year of RIIO-T1 as can be seen in Figure 17 below.
4.64. NGGT is forecasting a significant underspend against the forecast and allowed
TPCR3 and 4 revenue drivers. This underspend will be removed at the end of RIIO-
T1 as part of the next price control review.
Figure 17: NGGT Load-related capex vs actual spend 2013-14
NGGT Non load-related capex
4.65. This area comprises expenditure from reducing the direct emissions resulting
from the operating the compressors’ fleet, and asset health (replacing assets in
danger of failing) in order to maintain the NTS.
Emissions expenditure
4.66. NGGT was primarily funded to deliver the following explicit outputs:
Two new compressor units at Aylesbury compressor station – one gas turbine
driven and one electric-driven; and
0.0
2.0
4.0
6.0
8.0
10.0
12.0
14.0
16.0
18.0
Entry Exit NetworkFlexibility
TPCR3/4Revenue Drivers
£m
Allowance Actual

RIIO Transmission Annual Report 2013-14
Two new electric-driven compressor units at Peterborough and Huntingdon
(one at each site).
4.67. NGGT has signalled (in its submission and through its recent Industrial
Emissions Directive (IED) consultation document) that:
Its current expenditure is still focused on emissions projects that were
initiated during TPCR4. The reason is that a main works contractor fell into
administration at the closing stages of TPCR4. Therefore, NGGT was forced to
prioritise the delivery of these projects in the compressor stations at St.
Fergus, Kirriemiur and Hatton. Also, NGGT has completed the final tests of
the new units. Therefore, commissioning of the stations is underway in winter
2014-15.
It will install catalytic converters at the existing compressors’ stacks to deliver
compliance.
It will install one new gas turbine-driven compressor at Huntingdon and a gas
turbine driven one in Peterborough.
4.68. However, NGGT is underspending compared to allowances and its expenditure
relates to TPCR4 emissions projects which have yet to be delivered. Also, the
allowances set for Peterborough reflect the unit cost of an electric-driven
compressor, which are higher than a gas turbine driven one.
4.69. In light of this revised approach by NGGT we will look at any approaches for
additional funding at either the mid-period review or reopener windows taking
consideration of this funding which NGGT does not now appear to require. We will
investigate further the impact of the introduction of the new compressor units in the
operation of the entire fleet, ie the resulting reduction in the operation of other
compressor units. This will be useful for avoiding future unnecessary investment.
Asset Health
4.70. Expenditure was set against historic spending levels and NGGT’s justification
of its requirements. NGGT’s current underspend reflects a different approach to
delivering the capex and prioritising in specific secondary assets. More specifically,
NGGT says that it has targeted the secondary assets with the highest priority within
the NOMs. As a result of this and the volume discounts, ie economies of scale in
focusing its efforts, it is able to deliver the works more efficiently.
4.71. Therefore, NGGT’s outperformance may be considered as one based on
efficiencies and innovation. However, we do note that NGGT’s requests for funding
Asset Health expenditure in relation to the Bacton terminal and its reconfiguration,
have not been incurred and NGGT is managing the condition of the terminal within
its existing allowances without incurring expenditure.
4.72. Additionally, although the NOMs methodology is not clearly progressed, we
have concerns that the forecast underspend will impact on the achievement of NOMs

RIIO Transmission Annual Report 2013-14
51
targets. We will work closer with NGGT to further understand this and to make the
NOMs an accurate and robust tool for future allowances requests and verification of
the NTS condition. Figure 18 below shows the comparison between allowances and
actual spend of non load-related capex.
Figure 18: Non load related capex restated allowances vs actual spend
2013-14
Non-operational capex
4.73. Non-operational capex is expenditure on assets other than network assets.
The areas of expenditure are information technology (IT), land and buildings,
vehicles and tools and equipment. For all TOs the main type of this expenditure is IT,
both hardware and software.
4.74. For SHE Transmission and SPT, non-operational capex expenditure is
comparatively small, less than £2m per year for both. In the case of NGET and NGGT
the allowances assumed they would spend on average £22m and £8m per year
respectively over the eight years of RIIO-T1. They forecast that more would be spent
in the first few years when NGET and NGGT expected to undertake two new IT
projects to assist in making efficiencies and savings within direct opex and non load-
related capex.
4.75. In 2013-14 NGET has spent £35.8m; slightly more than its allowance
(£33.2m), but has forecast to spend broadly in line with allowances over RIIO-T1.
NGGT spent almost as allowed (£12m).
0
10
20
30
40
50
60
70
80
Asset health Emissions Other
£m
Allowance Actual

RIIO Transmission Annual Report 2013-14
Operating costs (Opex) and forecasts
4.76. Operating expenditure (opex) are the costs incurred in the day to day
operation of the network. Opex can be further split into:
Direct opex
Business support costs
Closely associated indirect costs (CAI)
4.77. ‘Direct opex’ refers to inspections and maintenance of network assets.
‘Business support’ refers to costs which support the overall company such as IT,
telecoms, property management and insurance. ‘CAI’ refers to costs which are
linked, but not directly related to capex and direct opex activities. This includes
operational training, engineering management and project management costs.
4.78. The chart below shows the companies’ actual costs for 2013-14 compared to
their allowance set under the RIIO-T1 price control.
Figure 19: Opex allowances compared with actual spend – 2013-1424
24 Actuals figure excludes uncertainty mechanisms, pensions and decommissioning, but has been adjusted
for movements in provisions.
0
50
100
150
200
250
300
NGET SHE SPTL NGGT
£m
Allowance Actual

RIIO Transmission Annual Report 2013-14
53
Figure 20: SPT opex allowances compared with actual spend
4.79. SPT has spent significantly more (27%) than its allowances.
4.80. SPT business support costs have increased from the RIIO-T1 allowance of
£3m to £10m. The main reason for this increase is due to a review of the accounting
procedures for fixed assets in order to bring this into line with the rest of the
industry25. SPT states that the impact of this will result in a reduction in capex
project costs of approximately £60-65m during RIIO-T1 with a corresponding
increase in business support costs. We will continue to monitor this during RIIO-T1.
4.81. CAI costs have also decreased due to the impact of delays to some load
related projects. These are due to delays in obtaining landowner agreements and
necessary consents for wider works and other capex projects.
25 P.13 http://www.spenergynetworks.co.uk/userfiles/file/SPT_2013_14_Annual_Performance_Report.pdf
0
2
4
6
8
10
12
Business Support CAI Direct opex
£m
Allowance Actual

RIIO Transmission Annual Report 2013-14
Figure 21: SHE Transmission opex allowances compared with actual spend
4.82. SHE Transmission has underspent its allowance by -13%.
4.83. SHE Transmission CAI costs have decreased from £7m to £4m. This is due to:
a) SHE Transmission not recruiting additional staff as indicated in its RIIO-T1
business plan.
b) Lower network design and engineering and network planning costs.
4.84. SHE Transmission’s business plan had stated that additional staff would be
required to work on the EU third package, network codes, pricing and forecasting. It
has confirmed that it still intends to recruit additional staff and we will monitor this
during RIIO-T1.
4.85. Network design and engineering and network planning costs are lower than
forecast as the majority of projects are still underway and so their costs are
capitalised. Costs are expected to increase once these projects are completed.
0
1
2
3
4
5
6
7
Business Support CAI Direct opex
£m
Allowance Actual

RIIO Transmission Annual Report 2013-14
55
Figure 22: National Grid opex allowances compared with actual spend
4.86. NGET has spent 16% more than its allowance while NGGT’s expenditure is
10% above its allowance.
4.87. Business support costs have increased from their allowance of £48m to £79m
for NGET and from £17m to £23m for NGGT. These increases are partially due to an
increase in costs due to the organisational changes which are expected to lead to
0
20
40
60
80
100
120
Business Support CAI Direct opex
£m
NGET
Allowance Actual
0
5
10
15
20
25
30
35
40
45
Business Support CAI Direct opex
£m
NGGT
Allowance Actual

RIIO Transmission Annual Report 2013-14
cost savings of over £150m across both NGET and NGGT during RIIO-T1. However,
this does not fully explain the increase and we will continue to closely monitor these
costs to ensure these savings are achieved.
4.88. Direct opex actual costs are broadly comparable to allowances for both NGET
and NGGT.
Forecasts
Figure 23: RIIO opex allowance vs forecasts26
4.89. Both NGET and NGGT are forecasting lower expenditure than their allowances
over the RIIO-T1 period. Expenditure in the early years of RIIO-T1 will be high due
to the reorganisation changes before reducing in 2015-16 and remaining at this
lower level until the end of the period.
4.90. SHE Transmission is forecasting a slight overspend against its allowance. This
is due to opex costs associated with SWW projects which will be added in future
years, but which have been included at present as capex.
4.91. SPT is also forecasting an overspend on RIIO-T1 opex allowances. The main
reason for this is due to the change in accounting approach which will result in an
increase of approximately £60m over the RIIO-T1 period. However, there should also
be an equivalent fall in capex costs.
26 Forecasts include actual data for 2013-14 year.
0
200
400
600
800
1000
1200
1400
1600
1800
2000
NGET SHE SPTL NGGT
£m
Allowance Forecast

RIIO Transmission Annual Report 2013-14
57
Transmission investment for renewable generation (TIRG)
4.92. Ofgem put the TIRG mechanism in place in 2004 to provide the Transmission
Owners (TOs) with revenue allowances to connect renewable generation that was not
forecast at the time the relevant transmission price controls were set. It includes
explicit allowances and output obligations for specific projects for each of the TOs.
Given the uncertainty around the design and cost of these projects, we provided
flexibility in the mechanism for us to consider amending the revenue allowances up
or down under defined circumstances. These include:
TIRG income adjusting event (IAE) - an event or circumstance that has occurred
or is expected to occur which has materially increased or decreased the forecast
preconstruction and contingency costs for the relevant years. The TO must notify
us and provide supporting evidence where it considers that an IAE has occurred.
TIRG asset value adjusting event (AVAE) - where a relevant amendment to the
scope of construction work is expected to cause additional costs or savings to be
incurred. In order to vary their ex ante revenue allowances during the
construction period through an AVAE, the TO is required to give notice of such an
event to us as soon as is possible after it has occurred and in any event prior to
the TIRG relevant year when construction of the project begins.
4.93. Most of the TIRG projects were completed in the previous price control
(TPCR4) but there were two projects still to be completed in RIIO-T1 by SHE
Transmission and SPT. These are the Beauly-Denny and South West Scotland
projects.
4.94. The Beauly Denny upgrade of the existing 132kV transmission line to 400kV
between Beauly in the north of Scotland and Denny in central Scotland is the largest
project covered by the TIRG mechanism. SHE Transmission is responsible for
delivering the majority of the project, while SPT is constructing the final 22km, which
lie in its transmission area.
4.95. The South West Scotland project being delivered by SPT focuses on
constructing power lines and an interconnector as part of developing the
infrastructure for wind developments in south west Scotland.
4.96. In the first year of RIIO-T1 SHE Transmission spent £164m on Beauly-Denny
projects. This takes its total expenditure to date on the project to £527m. The
project is due to be completed in 2016, by which time SHE Transmission forecast it
will have spent £709m. We have so far allowed £607m in funding for this project.
4.97. SPT spent £36m on the Beauly-Denny project in 2013-14 taking its total
spend to date on the project to £70m. By 2016 SPT expects to have spent a total of
£204m. SPT has received funding of £204m.
4.98. The total cost of the completed Beauly-Denny project is expected to be
£913m, of which £597m (65%) has already been spent.

RIIO Transmission Annual Report 2013-14
4.99. SPT has spent £19m in 2013-14 on the south west Scotland project. This
takes the total expenditure to date to £26m. The project is due to be completed in
2016-17 by which time SPT expects to have spent £45m. SPTs has already received
funding of £54m for the project.

RIIO Transmission Annual Report 2013-14
59
5. Financial Performance
Chapter Summary
This chapter presents the opening and closing position of the regulatory asset value
(RAV) for RIIO-T1 and the TOs return on regulatory equity (RoRE) performance. It
evaluates the contribution of each main element of totex (ie opex and capex) to the
total RoRE. It also identifies the key RoRE performance drivers.
Regulatory Asset Value
5.1. Regulatory Asset Value (RAV) is the value of capital investment in networks
and reflects the cost of building the network assets that are used to transmit energy.
The opening RAV balance for each TO for RIIO-T1 comprises the closing RAV balance
from TPCR4, and the RAV additions represent the proportion of totex that we
remunerate over the longer term. The relevant capitalisation rates for each TO were
set at RIIO-T1 final proposals.
5.2. The price control allows licensees a return on RAV and return of money
invested in the RAV, which comprises:
Base revenue allowance which is the return to compensate the risk and
opportunity cost borne by shareholders and debt holders who fund the
capital investment (the weighted average cost of capital or ‘WACC’). The
WACC is designed to encourage licensees to enter into long-term financing
arrangements needed for efficient investment in the network.
An allowance to reflect depreciation of assets, which broadly reflects the
annualised cost of maintaining assets. Depreciation allowances are
deducted from the RAV.
5.3. Table 10 shows an increase in the opening RAV at the end of the price control
year 2013-14. The closing RAV is calculated as:
opening RAV plus RAV additions (net of disposals) less RAV depreciation.

RIIO Transmission Annual Report 2013-14
Table 10: RAV movement schedule for 2013-14 and forecast RAV27 at the
end of RIIO-T1 (excluding TIRG)
SPT SHE Transmission
Price base £m 2013/14 prices TO SO Total SPTL SHET plc TO SO Total Total
Regulatory Asset Value (RAV)
Opening RAV (before transfers) 10,140 87 10,226 1,276 795 4,684 62 4,745 17,043
Transfers - - - - - 279 - 279 279
Opening RAV (after transfers) 10,140 87 10,226 1,276 795 4,962 62 5,024 17,322
RAV additions (after disposals) 1,156 42 1,198 239 98 263 26 289 1,825
Depreciation (658) (18) (676) (94) (50) (162) (12) (174) (994)
Closing RAV 10,638 110 10,748 1,421 844 5,064 75 5,139 18,152
Forecast RAV at end of RIIO T1 13,967 137 14,104 2,700 2,883 5,987 97 6,084 25,772
NGGTNGET
5.4. Major capital infrastructure projects for electricity transmission networks e.g.
Strategic Wider Works and connecting new sources of generation have been planned
for the RIIO-T1 price control. As such, the trend of substantial increases in electricity
transmission RAV values is expected to continue until after the end of the decade.
5.5. It should be noted that the closing value of Transmission Investment in
Renewable Generation (TIRG) assets totalled £786m (SHE Transmission: £467m,
SPT: £208m, NGET: £110m) as at 31 March 2014. These asset additions are partially
reflected in the forecast RAV in Table 11 with the remainder in ‘Shadow RAV28’ until
the projects reach completion.
5.6. At the end of RIIO-T1, the remaining ‘shadow’ RAV is forecast to be NGET:
nil; SHE Transmission: £412m; SPTL: £131m.
5.7. NGGT had £367m of ‘Shadow’ RAV at 31 March 2014, which is all forecast to
enter the main RAV before the end of RIIO-T1. This balance comprises investments
funded through revenue drivers from previous price controls, which sit outside the
core base revenue allowance for RIIO-T1.
Return on Regulatory Equity (RoRE)
5.8. We use RoRE analysis to estimate the financial benefits that are available
across the network companies in RIIO-T1 from outperforming the price control
assumptions. By the same token, RoRE analysis allows us to assess the financial
penalties for underperforming the price control assumptions.
27 Forecast RAV is based upon the companies’ latest published view of totex performance. 28
Where investments are initially funded outside of the core RIIO-T1 price with a different allowed rate of
return (WACC and depreciation) than set at Final Proposals the costs will be held outside of the main RAV in Shadow RAV. Once the normal allowed rate of return becomes applicable to the investments then the costs are transferred from Shadow RAV to the main RAV in the relevant year.

RIIO Transmission Annual Report 2013-14
61
5.9. Regulatory equity represents the proportion of average annual RAV that is
funded by shareholders (also known as ‘Equity RAV’). This is based upon the notional
gearing set at Final Proposals which results in equity proportions of 40% for NGET,
37.5% for NGGT and 45% for SHE Transmission and SPTL.
5.10. Returns represent the post-tax cost of equity set at RIIO-T1 final proposals
plus revenue adjustments i.e. actual or forecast outperformance or
underperformance compared with allowances set for each year at final proposals.
5.11. The return includes these adjustments:
Totex Incentive Mechanism – The incentive strength represents the
percentage that a licensee bears for overspending against allowances or
retains for underspending against allowances.
IQI income reward/penalty – A reward / penalty set at RIIO-T1 Final
Proposals, which reflects the accuracy and quality of the business plans
submitted by the licensee. These values remained fixed for the eight year
price control period.
Output incentives – Covering stakeholder satisfaction, network reliability,
environmental performance and SO specific measures for both gas and
electricity transmission.
5.12. It is important to note that the RoRE we have calculated for each licensee at
the end of 2013-14 is an estimate of the average annual return29 that shareholders
could expect over the eight year price control period. It incorporates actual totex
incurred in the year plus the seven year forecast for 2014-15 to 2020-21. This data
is consistent with the latest expenditure figures published in the Transmission
companies annual reports, published in September 2014.
5.13. We have not calculated a separate RoRE for 2013-14 as this figure would be
skewed by the impact of capex phasing whereby an underspend/overspend in 2013-
14 may be caught up in future years of RIIO-T1 allowing the overall expected totex
profile to be maintained.
5.14. The totex forecast assumes that all related outputs will be delivered within the
eight year price control period.
29 Arithmetic Mean

RIIO Transmission Annual Report 2013-14
5.15. The eight year RoRE calculation does not incorporate forecast output incentive
performance for 2014-15 to 2020-21 as licensees currently do not have a reliable
way to work out these figures.
5.16. Transmission Investment in Renewable Generation (TIRG) has also been
excluded from the RoRE calculation both in terms of the Shadow RAV associated with
TIRG projects. This sits outside the main RAV subject to the price control until
projects are completed and the incentive performance attributable to TIRG. A future
methodology for the treatment of TIRG is still being reviewed.
5.17. Table 11 and Figure 24 shows the composition of the eight year average RoRE
for each of the TOs:
Table 11: Transmission Operators’ eight year RoRE forecast 8
year
Ro
RE
Baseli
ne R
oR
E
(P
ost-
tax c
ost
of
eq
uit
y)
To
tex I
ncen
tive
Mech
an
ism
IQ
I i
nco
me
rew
ard
/p
en
alt
y
Ou
tpu
t
In
cen
tives
Total
NGET 8.60% 7.00% 1.30% 0.23% 0.07%
SHE Transmission 8.40% 7.00% 0.98% 0.40% 0.02%
SPTL 8.10% 7.00% 0.50% 0.57% 0.03%
NGGT 7.22% 6.80% 0.26% -0.06% 0.22%

RIIO Transmission Annual Report 2013-14
63
Figure 24: Eight year RoRE forecast for RIIO T1
7.22%
8.10%
8.40%
8.60%
-1.00% 0.00% 1.00% 2.00% 3.00% 4.00% 5.00% 6.00% 7.00% 8.00% 9.00% 10.00%
NGGT
SPTL
SHE Transmission
NGET
Baseline RoRE (Post-tax cost of equity) Totex Incentive Mechanism
IQI income reward/penalty Output Incentives
5.18. The impact of forecast SO totex performance and 2013-14 incentives (market
balancing incentives) included in the eight year RoRE calculations in Table 11 and
Figure 24 is 0.06% for NGET and 0.14% for NGGT.

RIIO Transmission Annual Report 2013-14
Appendices
Index
Appendix Name of Appendix Page Number
1 System Operator Performance 65
2 Customer Bill Impact Methodology 70
RIIO Transmission Annual Report 2013-14
65
Appendix 1 – System Operator
Performance
Electricity SO incentive performance
1.1. National Grid Electricity Transmission (NGET) is the system operator (SO) in GB
and is responsible for balancing the electricity system to ensure generation and
demand are balanced on a continuous basis. To do this NGET buys and sells
electricity and procures associated services. The cost NGET incurs is recovered from
users of the system via Balancing Services Use of System (BSUoS) charges. NGET
also provide information, such as wind forecasts, to aid market participants in their
actions.
1.2. One of Ofgem’s roles as the GB Electricity regulator is to ensure that NGET
develop and maintain an economic, efficient and coordinated system of electricity
transmission. To help achieve this Ofgem has set financial and reputational
incentives which encourage NGET to meet these outcomes. These SO incentives are
outside the RIIO-T1 price control mechanism.
1.3. The current SO Electricity Incentive scheme includes:
Minimising balancing costs on the transmission network (Balancing
Services Incentive Scheme (BSIS))
Wind Forecasting Incentive
Increased Transparency
System Operator Innovation Roll-Out Mechanism
1.4. The main incentive on the SO is the Balancing Services Incentive Scheme
(BSIS). BSIS incentivises NGET on the actions it has to take in order to operate the
GB Electricity Transmission System. Under the BSIS balancing cost targets are
agreed, with NGET receiving 25 percent of any savings against the target and
incurring 25 percent of any cost above the target, subject to a cap and floor of ±
£25m. Included is a target for the costs incurred in ensuring that the system is kept
in balance, either to balance energy or to manage constraints. BSIS also incentivises
NGET on the costs of ensuring that they are able to respond to an event that would
require them to re-energise part of the transmission system if needed, known as
Black Start.
1.5. Up until 2010-11 the scheme was set on an annual basis but now it is set for
two years with the current scheme running from 2013-15. Since 2011 the incentive

RIIO Transmission Annual Report 2013-14
schemes have been based on a combination of forecast and actual data inputs over a
two year period, where the target is estimated by pre-agreed models.
1.6. Figure A1 shows actual expenditure against target costs up to the current
scheme period. Under the incentive scheme NGET retains a percentage of any
underspend against the target (subject to a cap) and is liable for a percentage of any
overspend (subject to a scheme floor).
Figure A1: Electricity out-turn costs against target costs from 2009 to 2014
(balancing activity)
1.7. Under the BSIS the target is set using two models. One model sets the target
for constraints management costs and the other derives a target for NGET’s energy
balancing actions. A rigorous monitoring framework is in place, with NGET providing
performance data to Ofgem to ensure incentives are being delivered on and to verify
the targets remain robust.
0
200
400
600
800
1000
1200
£m
Outturn Target
*includes Net Imbalance Adjustment (NIA) *Single target 2011-13. Seperated 2011-12 & 2012-13 to allow comparison

RIIO Transmission Annual Report 2013-14
67
1.8. Under the Electricity licence NGET has a condition requiring it to make
improvements to the models. These models have improved in sophistication and
accuracy over the last four years, which has increased confidence that they could
deliver robust targets. Since 2012-13 NGET have been within range (see figure 1),
even though this period has been technically challenging, which is in part down to
improvements in these models.
Gas SO incentive performance
1.9. National Grid Gas Plc (NGGT) is the gas System Operator (SO) for GB and is
responsible for balancing the system across Great Britain (GB) as well as playing a
key role in providing information to market participants, such as demand forecasting.
Under the Gas licence the SO is required to manage the system in an economic and
efficient manner.
1.10. The Gas SO incentive scheme is designed to motivate NGGT to reduce the
costs of operating the network and to promote innovation in the way the system is
run. A new incentive package was introduced on 1 April 2013 with most of the
incentives being set for an eight year period to align with the RIIO-T1 price control.
We also introduced new incentives or made significant changes to existing incentives
and as such these were set for a shorter period to assess their effectiveness before
implementing them for a longer period. The new package maintains relevant aspects
of previous incentives as well as introducing some new components.
1.11. The current incentives are as follows:
Demand Forecasting
Residual Balancing
Shrinkage
Greenhouse Gas Emissions
Maintenance
Unaccounted for Gas (UAG)
Operating Margins
1.12. The first five of the above incentives are financial, with NGGT rewarded or
penalised for over or underperformance against a target. The UAG and Operating
Margins incentives are reputation-based incentives without financial implications, due
to being license requirements.

RIIO Transmission Annual Report 2013-14
Figure A2: Summary of the performance of NGGT SO from 2005-6 to -2013-
14
1.13. In the last eight years, NGGT has outperformed the incentives each year,
receiving incentive payments ranging from less than £1.7m in 2012-13 to 9.15m in -
2013-14.
SO internal costs
1.14. The SO internal costs, made up of IT and staff costs, enables NGET and NGGT
to undertake the SO balancing activities described above. In the RIIO-T1 period both
NGET and NGGT have been granted totex allowances. We discuss below the
performance in 2013-14 and the forecast for RIIO-T1.
-4
-2
0
2
4
6
8
10
12
05/06 06/07 07/08 08/09 09/10 10/11 11/12 12/13 13/14
Shrinkage Unaccounted for gas
Residual balancing Demand forecasting
Website timeliness and availability Green house gas emissions (venting)
Operating margins Maintenance
Net Incentive Payments

RIIO Transmission Annual Report 2013-14
69
Figure A3: Actual SO internal totex for 2013-14
1.15. In the first year of RIIO-T1 both NGET and NGGT have underspent the
allowances, NGGT by 37%. In both cases this was due to underspends on capex.
Capex underspending was due to delaying spending on IT systems until future years.
1.16. Figure A4 below shows NGET and NGGT’s Totex forecast for the whole of the
RIIO-T1 period. Despite underspending in the first year both NGET and NGGT are
expecting to spend close to their totex allowances over the 8 year period. We will
monitor progress over future years.
Figure A4: Forecasted SO internal totex for RIIO-T1
0
50
100
150
200
NGET NGGT
£m
Business Plan Allowances Actuals
0
200
400
600
800
1000
1200
1400
NGET NGGT
£m
Business Plan Allowances Forecast

RIIO Transmission Annual Report 2013-14
Appendix 2 – Customer Bill Impact
Methodology
2.1 We have used the average electricity and gas transmission network charges per
household as per the TPCR4 close out report re-based from 2012-13 prices
(Electricity: £21.24 Gas: £16.22 ) to 2013-14 prices (Electricity: £21.78 Gas:
£16.63) using the average ONS RPI between April 2013 and March 2014 as a
starting point.
2.2 The network transmission charges reported in the TPCR4 close out report
represented 4% of the average household electricity bill (£534 inc. VAT) and 2% of
the average household gas bill (£811 inc. VAT) at the end of December 2012. This
information was correct as per Ofgem Factsheet 98 published in February 2013.
2.3 We calculate the movement in each component of 2013-14 actual revenue (as
set out in Figures 1 and 2) against re-based 2012-13 actual revenue based upon
information from the TOs’ Revenue RRPs submitted to Ofgem in July 2014.
2.4 The movements are calculated as a percentage of re-based 2012-13 actual
revenue and are applied to the re-based average transmission network charge to
compute the 2013/14 bill impact of each component. Therefore the effect of inflation
has not been reflected in the bill impact.
1.17. The 2013/14 bill impact calculation assumes that 100% of the increase in TOs’
actual revenues is passed on to the average household electricity and gas bills. In
actuality increases in network charges are split between generators and suppliers
who may decide the proportion to pass on to the consumer.
Related Documents