RIDERSHIP TRENDS Office of Performance Management & Innovation February 27, 2017

Welcome message from author
This document is posted to help you gain knowledge. Please leave a comment to let me know what you think about it! Share it to your friends and learn new things together.
Transcript

RIDERSHIP TRENDS Office of Performance Management &
Innovation
February 27, 2017

Summary
• FMCB is considering a ridership goal for its strategic plan
and this presentation is designed to inform that discussion
• Ridership is a key measure of our service
• Ridership trends are difficult to analyze due to changing
methodologies and the large number of internal and
external factors impacting it
• Multiple ways to analyze ridership provide useful insights
• Overall ridership is on pace with job and population growth
• The T’s ability to serve and grow ridership depends on
capacity in time and space
2
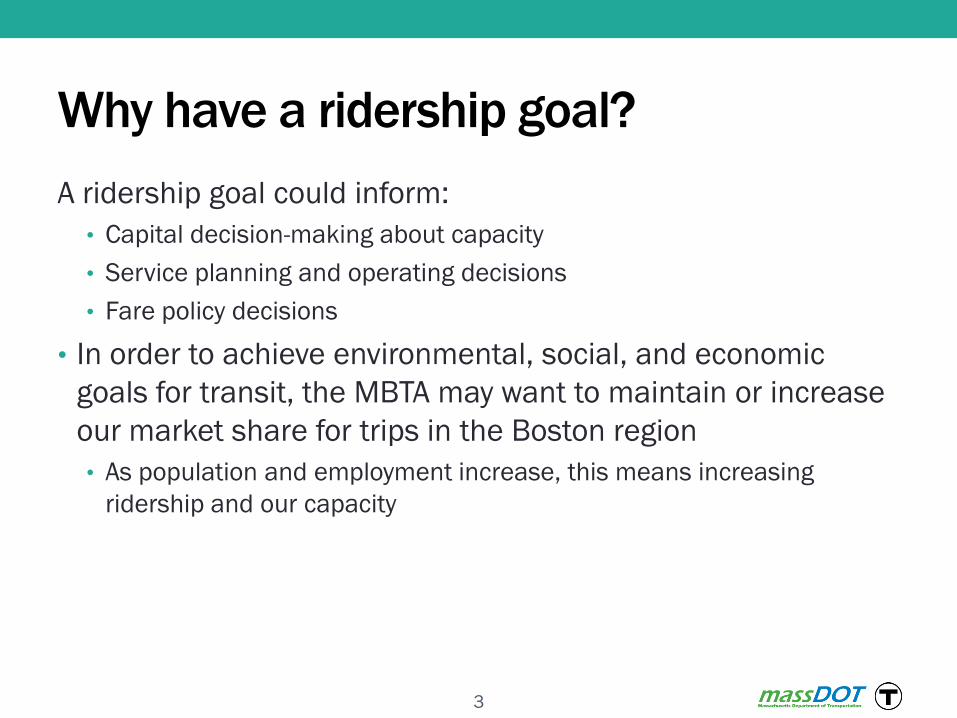
Why have a ridership goal?
A ridership goal could inform:
• Capital decision-making about capacity
• Service planning and operating decisions
• Fare policy decisions
• In order to achieve environmental, social, and economic
goals for transit, the MBTA may want to maintain or increase
our market share for trips in the Boston region
• As population and employment increase, this means increasing
ridership and our capacity
3

How do we define and measure ridership?
Ad from 1982 issue of Passenger Transport magazine
• Measure unlinked passenger
trips defined by National
Transit Database (NTD)
guidelines
• Different methods of collecting
data by mode
• Heavy/Light Rail: Automated Fare
Collection (AFC)
• Bus: AFC and Automated
Passenger Counters (APCs)
• Commuter Rail: Conductor Counts
• Methodologies have changed
over time
4

What we report • To NTD*:
• Monthly ridership, by mode, from AFC system with adjustments for
non-interaction and transfers. Non-AFC from manual counts
(Commuter Rail and Boat) or RIDE software
• Yearly ridership, by mode, by day type and overall.
• Bus collected using on-board APC scaled to total service provided.
• Other modes as above with additional checks.
• On MBTA Back on Track Dashboard:
• Average weekday ridership for the last available month, from AFC
system with above adjustments.
*An error was discovered in the FY15 bus ridership reported to NTD due to a
methodology change. This presentation includes a corrected number.
5

What affects ridership?
FY03 FY05 FY07 FY09
FY11 FY13 FY15
Charlie system
implemented
Winter
2015
Govt. Center
closed
Automated
Passenger
Counters on
buses
Late
Night
Service
National
Recession
Base fare
increase 25%
Base fare
increase 5% Base fare
increase 18%
Base fare
increase
7%
TNC adoption
rate rises
Service change
Methodology change
Fare change
External factors
6

No single analysis tells the complete story
Unlinked Passenger Trips (UPT) is an imperfect measure, but
allows comparisons to other systems
We analyze the change in Unlinked Passenger Trips
• Over different timeframes to see trends
• Compared to external factors for context
• Compared to our service levels to measure efficiency
• By mode for comparison
• By day type to see changes in peak and off peak ridership
7

TRENDS
8

Month over month 2016 weekday ridership steady
Source: MBTA AFC system with non-interaction factors applied
0
250
500
750
1,000
1,250
1,500
Jan Feb Mar Apr May Jun Jul Aug Sep Oct Nov Dec
Th
ou
sa
nd
s
Average Weekday Ridership all AFC modes 2014 2015 2016
9

2016 Saturday ridership decreasing, aligns
with the end of Late Night
Source: MBTA AFC system with non-interaction factors applied
0
250
500
750
1,000
Jan Feb Mar Apr May Jun Jul Aug Sep Oct Nov Dec
Th
ou
sa
nd
s
Average Saturday Ridership all AFC modes 2014 2015 2016
10

Sunday ridership has small fluctuations
Source: MBTA AFC system with non-interaction factors applied
0
250
500
750
Jan Feb Mar Apr May Jun Jul Aug Sep Oct Nov Dec
Th
ou
sa
nd
s
Average Sunday ridership all AFC modes 2014 2015 2016
11

Ridership growth on pace with job and population
growth
Source: NTD, BLS, US Census
Ridership is total UPT as reported to NTD
Jobs = Average total employment for the 17 inner core cities and towns
80
85
90
95
100
105
110
115
2008 2009 2010 2011 2012 2013 2014 2015
Jobs, Population and Ridership Indexed to 2008 Ridership Index - All Modes Population Index (inner core) Jobs Index (inner core)
12

Commute trip mode share is outpacing
population and job growth in the Boston region
Sources: US Census, Bureau of Labor Statistics Local Area Unemployment Statistics
80
85
90
95
100
105
110
115
2008 2009 2010 2011 2012 2013 2014 2015
Fiscal Year
Population Index (inner core) Jobs Index (inner core) Commute via Transit index
13
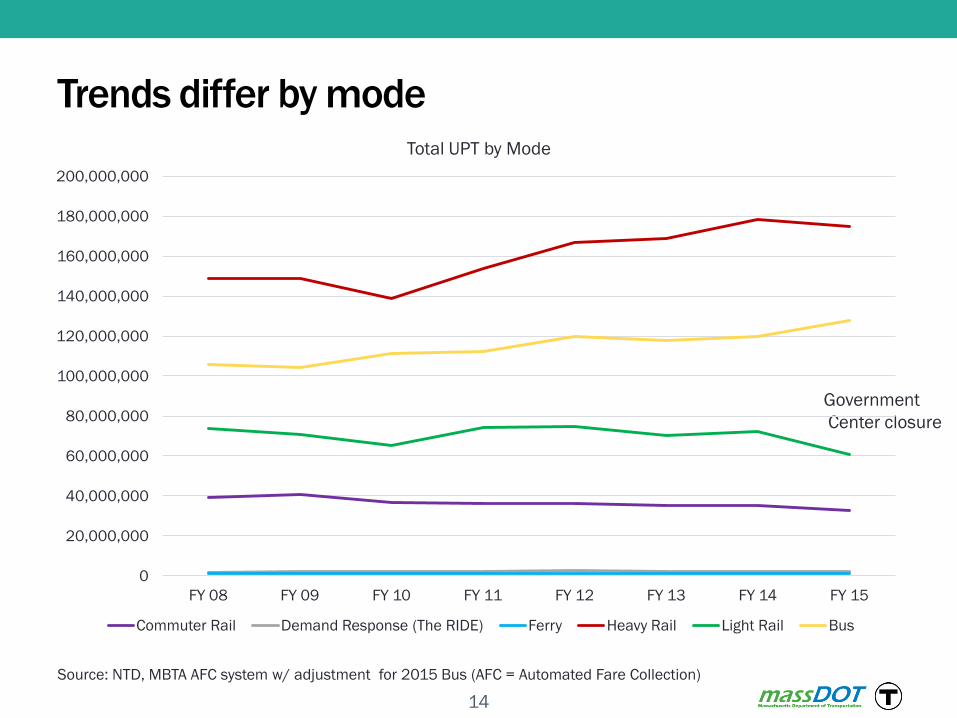
Trends differ by mode
Source: NTD, MBTA AFC system w/ adjustment for 2015 Bus (AFC = Automated Fare Collection)
14
Government
Center closure
0
20,000,000
40,000,000
60,000,000
80,000,000
100,000,000
120,000,000
140,000,000
160,000,000
180,000,000
200,000,000
FY 08 FY 09 FY 10 FY 11 FY 12 FY 13 FY 14 FY 15
Total UPT by Mode
Commuter Rail Demand Response (The RIDE) Ferry Heavy Rail Light Rail Bus

Source: NTD
0
20
40
60
80
100
120
140
2007 2008 2009 2010 2011 2012 2013 2014 2015
Nu
mb
er
of
un
lin
ke
d p
asse
nge
r tr
ips p
er
reve
nu
e
veh
icle
ho
ur
Fiscal Year
Commuter Rail Ferryboat Heavy Rail Light Rail All Bus Total Fixed Route
Ridership by service hours differs by mode
15
Government
Center
closure

CAPACITY
16

Capacity affects ability to meet demand
• Capacity constraints are spatial and temporal
• Bottlenecks (single links or stations) can reduce
capacity on entire lines
• Questions to consider:
• In the short-term, can we increase ridership where
we have capacity off-peak and lower volume routes?
• In the medium and long-term, where and when do
we need to increase capacity?
17

Time of day capacity constraints
Source: MBTA AFC system, Keolis conductor counts and train schedule
[Ridership by 15 min – weekdays fy16.xlsx]
0
5,000
10,000
15,000
20,000
25,000
30,000
35,000
3:00 AM 5:00 AM 7:00 AM 9:00 AM 11:00 AM 1:00 PM 3:00 PM 5:00 PM 7:00 PM 9:00 PM 11:00 PM 1:00 AM Bo
ard
ings
or
Stat
ion
En
trie
s b
y 1
5-m
inu
te p
eri
od
Average weekday FY16
Red Line Orange Line Blue Line Light Rail All bus Commuter Rail Notes:
• Commuter Rail boardings based on departure time of train from its origin, not actual passenger boarding time
• Commuter Rail counts average of October 3-7, 2016
• Other boardings are average weekday in FY16
• Counts are unadjusted for behind-gate transfers or non-interaction boardings, undercounts morning peak on Light Rail
18

Bottleneck capacity constraints (Focus40 analysis)
Source: MassDOT / MBTA Focus40
Map shows percent of theoretical capacity
utilized from 8:00-8:30 AM on an average
weekday
• Bottlenecks can be caused by high ridership segments, low speeds caused by dwell time or operating constraints
• Solutions depend on the cause
19

Capacity constraints also exist on the bus network
20

Discussion
• Should the MBTA have a ridership goal?
• Over what timeframe?
• How should the ridership goal inform operating, capital, and
fare policy decision-making?
21
APPENDIX
22

Heavy Rail Average UPT by Day Type
Source: NTD, MBTA AFC system w/ adjustments
0
100
200
300
400
500
600
FY 08 FY 09 FY 10 FY 11 FY 12 FY 13 FY 14 FY 15 FY 16
(prelim)
UP
T
Th
ou
sa
nd
s
Weekdays Saturdays Sundays
23

Light Rail Average UPT by Day Type
Source: NTD, MBTA AFC System w/ adjustments
0
50
100
150
200
250
300
FY 08 FY 09 FY 10 FY 11 FY 12 FY 13 FY 14 FY 15 FY 16
(prelim)
UP
T (
Th
ou
sa
nd
s)
Weekday Saturday Sunday
24
Government
Center closure
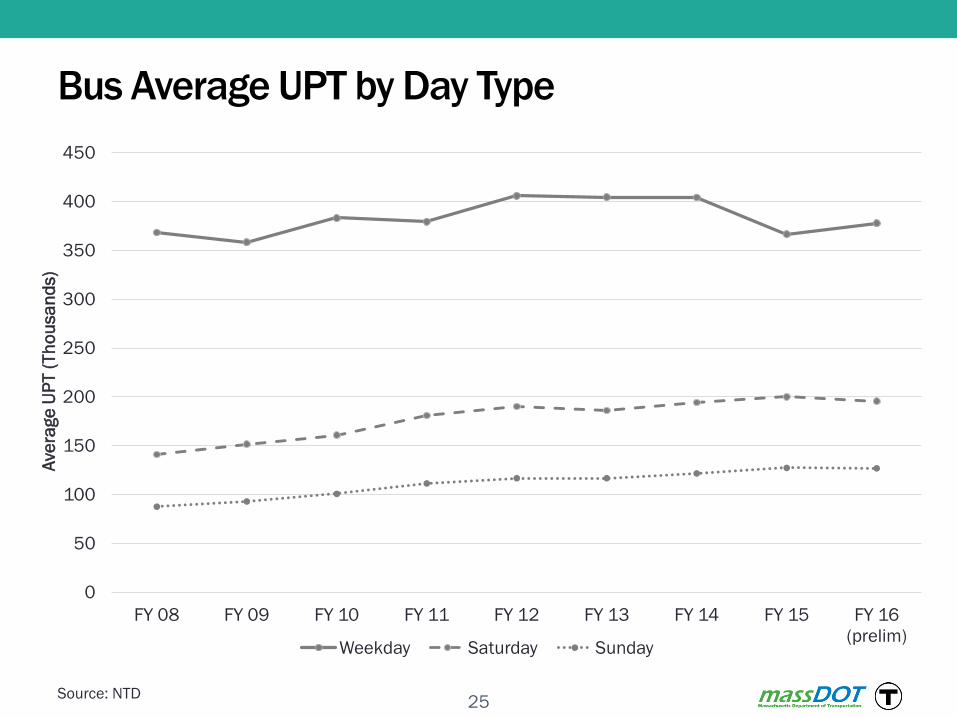
Bus Average UPT by Day Type
Source: NTD
0
50
100
150
200
250
300
350
400
450
FY 08 FY 09 FY 10 FY 11 FY 12 FY 13 FY 14 FY 15 FY 16
(prelim)
Ave
rage
UP
T (
Th
ou
sa
nd
s)
Weekday Saturday Sunday
25

Commuter Rail Average UPT by Day Type
Source: NTD
0
20
40
60
80
100
120
140
160
FY 08 FY 09 FY 10 FY 11 FY 12 FY 13 FY 14 FY 15
Ave
rage
UP
T (
Th
ou
sa
nd
s)
Weekday Saturday Sunday
26

Census Commute to Work Share
Source: US Census and American Community Survey, 17 inner core communities
52.1% 47.3%
7.3%
24.5%
27.1%
9.4%
10.7%
3.0% 4.2%
1.7% 3.4% 0%
10%
20%
30%
40%
50%
60%
2000
Census
2005-
09
2006-
10
2007-11 2008-
12
2009-
13
2010-14 2011-15
Drove Alone Carpooled Public Transit
Walked Worked from Home Other (Taxi / TNC, Bike, Motorcycle)
27
Related Documents