Richmond Public Schools Department of Curriculum and Instruction Curriculum Pacing and Resource Guide – Unit Plan Course Title/ Course #: Math Grade 7/8 Unit Title/ Marking Period # (MP): 1 Start day: Meetings (Length of Unit): 3 days Desired Results ~ What will students be learning? Standards of Learning/ Standards SOL 8.2 The student will describe orally and in writing the relationships between the subsets of the real number system. Essential Understandings/ Big Ideas All students should understand the following concepts: How are the real numbers related? Some numbers can appear in more than one subset, e.g., 4 is an integer, a whole number, a counting or natural number and a rational number. The attributes of one subset can be contained in whole or in part in another subset. Key Essential Skills and Knowledge SOL 8.2 To be successful with this standard, students are expected to: Describe orally and in writing the relationships among the sets of natural or counting numbers, whole numbers, integers, rational numbers, irrational numbers, and real numbers. Illustrate the relationships among the subsets of the real number system by using graphic organizers such as Venn diagrams. Subsets include rational numbers, irrational numbers, integers, whole numbers, and natural or counting numbers. Identify the subsets of the real number system to which a given number belongs. Determine whether a given number is a member of a particular subset of the real number system, and explain why. Describe each subset of the set of real numbers and include examples and non-examples. Recognize that the sum or product of two rational numbers is rational; that the sum of a rational number and an irrational number is irrational; and that the product of a nonzero rational number and an irrational number is irrational. Vocabulary

Welcome message from author
This document is posted to help you gain knowledge. Please leave a comment to let me know what you think about it! Share it to your friends and learn new things together.
Transcript

Richmond Public Schools
Department of Curriculum and Instruction
Curriculum Pacing and Resource Guide – Unit Plan
Course Title/ Course #: Math Grade 7/8
Unit Title/ Marking Period # (MP): 1
Start day:
Meetings (Length of Unit): 3 days
Desired Results ~ What will students be learning?
Standards of Learning/ Standards
SOL 8.2
The student will describe orally and in writing the relationships between the subsets of the real number system.
Essential Understandings/ Big Ideas
All students should understand the following concepts:
How are the real numbers related?
Some numbers can appear in more than one subset, e.g., 4 is an integer, a whole number, a counting or natural number and a
rational number. The attributes of one subset can be contained in whole or in part in another subset.
Key Essential Skills and Knowledge
SOL 8.2
To be successful with this standard, students are expected to:
Describe orally and in writing the relationships among the sets of natural or counting numbers, whole numbers, integers, rational
numbers, irrational numbers, and real numbers.
Illustrate the relationships among the subsets of the real number system by using graphic organizers such as Venn diagrams.
Subsets include rational numbers, irrational numbers, integers, whole numbers, and natural or counting numbers.
Identify the subsets of the real number system to which a given number belongs.
Determine whether a given number is a member of a particular subset of the real number system, and explain why.
Describe each subset of the set of real numbers and include examples and non-examples.
Recognize that the sum or product of two rational numbers is rational; that the sum of a rational number and an irrational number
is irrational; and that the product of a nonzero rational number and an irrational number is irrational.
Vocabulary

Academic Vocabulary Content Vocabulary
Rational Numbers
Integers
Irrational Numbers Whole Numbers
Natural Numbers or Counting Numbers
Real Numbers
Multiples
Subsets
Pi
Euler’s Number
Golden Ratio
Terminating Decimal
Non-terminating Decimal
Assessment Evidence ~ What is evidence of mastery? What did the students master & what are they missing?
Assessment/ Evidence
Interactive Achievement
Learning Plan ~ What are the strategies and activities you plan to use?
Learning Experiences/ Best Practice
Teacher Resources:
Create a foldable on different rational numbers.
Create a foldable on irrational numbers.
Have students create a Venn diagram identifying which group of numbers and where they.
Have students create a Frayer model defining all types of numbers.
Cornell Notes in interactive notebook.
Guided Practice
Text:
Virginia Math Connects, Course 3, ©2012, Price, et al, McGraw-Hill School Education Group: page(s) 130-135, 553-559, and 565.
Coach book Grade 8 Virginia Gold edition: page(s) 27-31.
Technology Integrations
Brain Pop:
Rational and Irrational
Real Number System ppt. [SMART Notebook lesson]
Quia - Rags to Riches -Real Numbers - educational review games
Resources
Virginia Department of Education:
Objective 8.2 Lesson Plans VDOE
Other Sites:
Real Number Notes

Cross Curricular Connection
Science and Technology:
Students manipulate, classify or consider the world's features.
Social Studies:
Have students develop a flow chart of the hierarchy of troops.
English:
Have students write a paper on the family tree as a comparison to the real number system.
Materials
Manipulatives:
1 inch square tiles
index cards
100 chart
graph paper
Laminated Real Number Cards
Technology Resources:
LCD Projector
Speakers
Computer w/Internet Connection and
SmartBoard Software
SmartBoard
Computer Cart
Student Supplies:
Whiteboards/Markers
Frayer Model
Student Notes
Guided Notes

Course Title/ Course #: Math Grade 7/8
Unit Title/ Marking Period # (MP): 1
Start day:
Meetings (Length of Unit): 3 days
Desired Results ~ What will students be learning?
Standards of Learning/ Standards
SOL 8.5
The student will:
a. determine whether a given number is a perfect square; and
b. find the two consecutive whole numbers between which a square root lies.
Essential Understandings/ Big Ideas
All students should understand the following concepts:
How does the area of a square relate to the square of a number?
The area determines the perfect square number. If it is not a perfect square, the area provides a means for estimation.
Why do numbers have both positive and negative roots? The square root of a number is any number which when multiplied by itself equals the number. A product, when multiplying
two positive factors, is always the same as the product when multiplying their opposites (e.g., 7 ∙ 7 = 49 and -7 ∙ -7 = 49).
Key Essential Skills and Knowledge
SOL 8.5
The student will use problem solving, mathematical communication, mathematical reasoning, connections, and representations to:
Identify the perfect squares from 0 to 400.
Identify the two consecutive whole numbers between which the square root of a given whole number from 0 to 400 lies (e.g., 57 lies between 7 and 8 since 72 = 49 and 82 = 64).
Define a perfect square.
Find the positive or positive and negative square roots of a given whole number from 0 to 400. (Use the symbol to ask for the
positive root and when asking for the negative root.)
Vocabulary
Academic Vocabulary Content Vocabulary
Squared Multiply

Square Number
Irrational Number
Radical
Perfect Square
Square Root
2nd Power
Times itself
Positive Integer
Whole Number
Assessment Evidence ~ What is evidence of mastery? What did the students master & what are they missing?
Assessment/ Evidence
Interactive Achievement
Learning Plan ~ What are the strategies and activities you plan to use?
Learning Experiences/ Best Practice
Teacher Resources:
Create a foldable on perfect squares and square roots.
Have students create a Frayer model identifying all perfect squares.
Flash card identification game.
Cornell Notes in interactive notebook.
Guided Practice
Text:
Virginia Math Connects, Course 3, ©2012, Price, et al, McGraw-Hill School Education Group: page(s) 130-135, 553-559, and 565.
Coach book Grade 8 Virginia Gold edition: page(s) 27-31.
Technology Integrations
Brain Pop:
Perfect Squares and Square Roots
Resources
Virginia Department of Education:
Objective 8.5 Lesson Plans VDOE
Cross Curricular Connection
Science and Technology:
Students can use a digital microscope to observe specimens cellular count.

Social Studies:
Have students draw diagram of different sections of troops in dimension or matrices style in columns and rows.
English:
Have students write a descriptive paper using the dimensions of the articles in their bedroom as perfect square.
Materials
Manipulatives:
Number Cubes
Base-ten material
Calculators
Numeral Cards
10-Frames
Technology Resources:
LCD Projector
Speakers
Computer w/Internet Connection and
SmartBoard Software
SmartBoard
Computer Cart
Student Supplies:
Whiteboards/Markers
Frayer Model
Student Notes
Guided Notes
Course Title/ Course #: Math Grade 7/8
Unit Title/ Marking Period # (MP): 1
Start day:
Meetings (Length of Unit): 4 days
Desired Results ~ What will students be learning?
Standards of Learning/ Standards
SOL 8.1b
The student will:
b. Compare and order decimals, fractions, percent’s, and numbers written in scientific notation.
7.1 b-c
The student will:
b. determine scientific notation for numbers greater than zero
c. compare and order fractions, decimals, percent’s, and numbers written in scientific notation.
Essential Understandings/ Big Ideas

All students should understand the following concepts:
How does the different ways rational numbers can be represented help us compare and order rational numbers?
Numbers can be represented as decimals, fractions, percent’s, and in scientific notation. It is often useful to convert numbers to be
compared and/or ordered to one representation (e.g., fractions, decimals or percent’s).
What is a rational number?
A rational number is number is any number that can be written in fraction form.
When are numbers written in scientific notation?
Scientific notation is used to represent very large and very small numbers.
Key Essential Skills and Knowledge
SOL 8.1b
To be successful with this standard, students are expected to:
Compare and order no more than five fractions, decimals, percent’s, and numbers written in scientific notation using positive
and negative exponents. Ordering may be in ascending or descending order.
Vocabulary
Academic Vocabulary Content Vocabulary
Scientific Notation
Simplify
Real Numbers
Standard Form
Positive Exponents
Negative Exponents
Place Value
Ascending
Descending
Ordering
Equivalent
Fraction
Decimal
Assessment Evidence ~ What is evidence of mastery? What did the students master & what are they missing?
Assessment/ Evidence

Interactive Achievement
Learning Plan ~ What are the strategies and activities you plan to use?
Learning Experiences/ Best Practice
Teacher Resources:
Create a foldable on changing percent’s to decimals.
Create a foldable on changing fractions to decimals.
Create a foldable on changing scientific notation to standard form.
Have students create a Frayer model defining ascending and descending order.
Cornell Notes in interactive notebook.
Guided Practice
Text:
Virginia Math Connects, Course 3, ©2012, Price, et al, McGraw-Hill School Education Group: page(s) 121-160, 335-336, 338-344, and 507-514.
Coach book Grade 7 Virginia Gold edition: page(s) 15-32.
Coach book Grade 8 Virginia Gold edition: page(s) 19-22.
Technology Integrations

Gizmo:
Fraction, Decimal, Percent (Area and Grid Models)
Ordering Percent’s, Fractions, and Decimals Greater Than 1
Brain Pop: Fractions, Decimals, Percent and Scientific Notation
Scientific Notations
Converting Fractions to Decimals
Resources
Virginia Department of Education
Objective 7.1b-c Lesson Plans VDOE
Objective 7-1c Lesson Plans VDOE
Objective 8.1b Lesson Plans VDOE
Other Sites
Fractions, Decimals and Percent's Notes
Cross Curricular Connection
Science and Technology:
Students can calculate the percentage of each different part of the cell organisms.
Students can calculate the distance of the planets from the sun scientific notation.
English:
Have a student write a paper on the comparison of changing numbers from percent’s to decimals to fractions to scientific nota tion.
Materials
Manipulatives
Algebra Blocks/Tiles
Base-ten blocks
Calculators
Numeral Cards
Percent Models,
Decimal squares,
Color tiles,
Cubes,
Geoboards,
Fraction models
Rubber Bands
Technology Resources
LCD Projector
Speakers
Computer w/Internet Connection and
SmartBoard Software
SmartBoard
Computer Cart
Student Supplies
Whiteboards/Markers
Pencil and Paper
Student Notes
Guided Notes
Course Title/ Course #: Math Grade 7/8
Unit Title/ Marking Period # (MP): 1
Start day:
Meetings (Length of Unit): 10 days
Desired Results ~ What will students be learning?
Standards of Learning/ Standards
SOL 8.1a
The student will:
a. Simplify numerical expressions involving positive exponents, using rational numbers, order of operations, and properties of
operations with real numbers.
7.13a
The student will write verbal expressions as algebraic expressions and sentences as equations and vice versa; and evaluate algebraic
expressions for given replacement values of the variables.
7.16
The student will apply the commutative and associative properties for addition and multiplication; the distributive property; the
additive and multiplicative identity properties; the additive and multiplicative inverse properties; and the multiplicative property of
zero with real numbers.
Essential Understandings/ Big Ideas
All students should understand the following concepts:
What is the role of the order of operations when simplifying numerical expressions?
The order of operations prescribes the order to use to simplify a numerical expression.
Word phrases and sentences can be used to represent algebraic expressions and equations.
Using the properties of operations with real numbers helps with understanding mathematical relationships.
Key Essential Skills and Knowledge
SOL 8.1a
To be successful with this standard, students are expected to:
Simplify numerical expressions containing:
1) exponents (where the base is a rational number and the exponent is a positive whole number);

2) fractions, decimals, integers and square roots of perfect squares; and
3) grouping symbols (no more than 2 embedded grouping symbols). Order of operations and properties of operations with real
numbers should be used.
Write verbal expressions as algebraic expressions. Expressions will be limited to no more than two operations.
Write verbal sentences as algebraic equations. Equations will contain no more than one variable term.
Identify examples of expressions and equations.
Apply the order of operations to evaluate expressions for given replacement values of the variables. Limit the number of
replacements to no more than three per expression.
Identify properties of operations used in simplifying expressions.
Apply the properties of operations to simplify expressions.
Vocabulary
Academic Vocabulary Content Vocabulary
Distributive Property
Associative Property of Addition and Multiplication
Commutative Property of Addition and Multiplication
Additive and Multiplicative Inverse Property
Numerical Expression
Expression
Order of Operations
Verbal Expression
Equations
Ordering
Operations
Variable
Simplify
Grouping Symbols
Term
Replacement Values
Identity
Reciprocal
Assessment Evidence ~ What is evidence of mastery? What did the students master & what are they missing?
Assessment/ Evidence
Interactive Achievement
Learning Plan ~ What are the strategies and activities you plan to use?
Learning Experiences/ Best Practice
Teacher Resources:
Create a foldable on descriptive words.
Create a foldable on order of operations.
Have students create a Frayer model determining expression and how to solve them.
Cornell Notes in interactive notebook.
Guided Practice

Text
Virginia Math Connects, Course 3, ©2012, Price, et al, McGraw-Hill School Education Group: page(s) 18-21, 143, 173-177 and 500-
505.
Coach book Grade 7 Virginia Gold edition: page(s) 178-183 and 192-197.
Coach book Grade 8 Virginia Gold edition: page(s) 14-18.
Technology Integrations
Gizmo:
Order of Operations [Introduction Lesson]
Smart Exchange:
Distributive Property ppt. [SMART Notebook lesson]
Simplify Algebraic Expressions ppt. [SMART Notebook lesson]
Resources
Virginia Department of Education
Objective 7.13a-b Lesson Plans VDOE
Objective 7.16a-e Lesson Plans VDOE
Objective 8.1a Lesson Plans VDOE
Other Sites
Properties Notes
Cross Curricular Connection
Science and Technology:
Students can compare the steps of solving and experiment to that of order of operations.
English:
Have students write a paper on determining the order in which operations should be done.
Materials
Manipulatives
Algebra Blocks/Tiles
Base-ten blocks
Calculators
Numeral Cards
Technology Resources
LCD Projector
Speakers
Computer w/Internet Connection and
SmartBoard Software
SmartBoard
Student Supplies
Whiteboards/Markers
Pencil and Paper
Student Notes
Guided Notes

Computer Cart

Course Title/ Course #: Math Grade 7/8
Unit Title/ Marking Period # (MP): 1
Start day:
Meetings (Length of Unit): 6 days
Desired Results ~ What will students be learning?
Standards of Learning/ Standards
SOL 8.4
The student will apply the order of operations to evaluate algebraic expressions for given replacement values of the variables.
Problems will be limited to positive exponents.
7.13b
a) The student will apply the order of operations to evaluate algebraic expressions for given replacement values of the variables.
Essential Understandings/ Big Ideas
All students should understand the following concepts:
What is the role of the order of operations when evaluating expressions?
Using the order of operations assures only one correct answer for an expression.
Key Essential Skills and Knowledge
SOL 8.4
The student will use problem solving, mathematical communication, mathematical reasoning, connections, and representations to:
Substitute numbers for variables in algebraic expressions and simplify the expressions by using the order of operations.
Exponents are positive and limited to whole numbers less than 4. Square roots are limited to perfect squares.
Apply the order of operations to evaluate formulas. Problems will be limited to positive exponents. Square roots may be included
in the expressions but limited to perfect squares.
Translate algebraic expressions and equations to verbal expressions and sentences. Expressions will be limited to no more than two operations.
Translate algebraic expressions and equations to verbal expressions and sentences. Expressions will be limited to no more than two operations.
Vocabulary
Academic Vocabulary Content Vocabulary

Expression
Order of Operations
Algebraic Expression
Verbal Expression
Variable
Simplify
Substitute
Evaluate
Replacement Values
Assessment Evidence ~ What is evidence of mastery? What did the students master & what are they missing?
Assessment/ Evidence
Interactive Achievement
Variables, Expressions, and Properties Quiz=
Learning Plan ~ What are the strategies and activities you plan to use?
Learning Experiences/ Best Practice
Teacher Resources:
Create a foldable on substituting into algebraic expressions
Create a foldable on evaluating expressions.
Cornell Notes in interactive notebook
Guided Practice
Text
Virginia Math Connects, Course 3, ©2012, Price, et al, McGraw-Hill School Education Group: page(s) 12-14, 78, 87, 93, and 483-484.
Coach book Grade 7 Virginia Gold edition: page(s) 184-191.
Coach book Grade 8 Virginia Gold edition: page(s) 45-48
Technology Integrations
Gizmo:
Order of Operations
Smart Exchange:
Order of Operations ppt. [SMART Notebook lesson]
1.3 Order of Operations ppt. [SMART Notebook lesson]
Resources
Virginia Department of Education
Objective 7.13a-b Lesson Plans

Objective 8.4 Lesson Plans VDOE
Other Sites
Math-Play: Evaluating Expressions Basketball Game-Educational Review Game
Algebraic Expressions – Instructional Resources
Cross Curricular Connection
Science and Technology:
Students can measure and mix, and then record data on the process and results. They can graph processes such as weather or plant growth.
English:
Have students write a paper on how to substitute values in variables then solve the expression for an answer .
Materials
Manipulatives
Algebra Blocks/Tiles
Base-ten blocks
Calculators
Numeral Cards
Technology Resources
LCD Projector
Speakers
Computer w/Internet Connection and
SmartBoard Software
SmartBoard
Computer Cart
Student Supplies
Whiteboards/Markers
Pencil and Paper
Student Notes
Guided Notes
Course Title/ Course #: Math Grade 7/8
Unit Title/ Marking Period # (MP): 1
Start day:
Meetings (Length of Unit): 10 days
Desired Results ~ What will students be learning?
Standards of Learning/ Standards
SOL 8.15a and c
The student will:
a. solve multistep linear equations in one variable with the variable on one or two sides of the equation;
c. identify properties of operations used to solve an equation.
Essential Understandings/ Big Ideas
All students should understand the following concepts:
How does the solution to an equation differ from the solution to an inequality?
While a linear equation has only one replacement value for the variable that makes the equation true, an inequality can have
more than one.
Key Essential Skills and Knowledge
SOL 8.15a and c
The student will use problem solving, mathematical communication, mathematical reasoning, connections, and representations to:
Solve two- to four-step linear equations in one variable using concrete materials, pictorial representations, and paper and pencil
illustrating the steps performed.
Identify properties of operations used to solve an equation from among:
the commutative properties of addition and multiplication;
the associative properties of addition and multiplication;
the distributive property;
the identity properties of addition and multiplication;
the zero property of multiplication;
the additive inverse property; and
the multiplicative inverse property.
Vocabulary
Academic Vocabulary Content Vocabulary

Equation
Inverse Operation
Two-step Equation
Multistep Equation
Solution
Variable
Replacement
Operation
Reverse
Zero Pair
Assessment Evidence ~ What is evidence of mastery? What did the students master & what are they missing?
Assessment/ Evidence
Interactive Achievement
Learning Plan ~ What are the strategies and activities you plan to use?
Learning Experiences/ Best Practice
Teacher Resources:
Create a foldable on solving addition and subtraction of equations.
Create a foldable on solving multiplication and division of equations.
Create a foldable on solving two-step equations.
Create a foldable on solving multi-step equations.
Cornell Notes in interactive notebook.
Guided Practice
Text
Virginia Math Connects, Course 3, ©2012, Price, et al, McGraw-Hill School Education Group: page(s) 186-205.
Coach book Grade 8 Virginia Gold edition: page(s) 158-161.
Technology Integrations
Gizmo:
Modeling and Solving Two-Step Equations
Solving Two-Step Equations
Brain Pop: Solving Linear Equations
Two-Step Equations
Smart Exchange:
Solving Linear Equations ppt. [SMART Notebook lesson]
Solving Two-Step Equations ppt. [SMART Notebook lesson]

Solve Multi-step Linear Equations ppt. [SMART Notebook lesson]
Resources
Virginia Department of Education
Objective 8.15a Lesson Plans VDOE
Other Sites
Solving Linear Equations in One Variable – Lesson Plan
Building and Solving Linear Equations – Lesson Plan
Multi-step Equations (Video Tutorial)
Cross Curricular Connection
Science and Technology:
Students do experiments of adding chemicals together in different order still coming up with the same outcome.
Social Studies:
Have students identify how adding the same number of troops to each side of the civil war would not change the outcome of the Civil War.
English:
Write a paper on interchanging the math properties throughout the math equation.
Materials
Manipulatives
Algebra Blocks/Tiles
Hands-On Equation
Calculators
10-Frames
2-Color Counters
Numeral Cards
Fraction Models
Decimal Squares
Technology Resources
LCD Projector
Speakers
Computer w/Internet Connection and
SmartBoard Software
SmartBoard
Computer Cart
Student Supplies
Whiteboards/Markers
Pencil and Paper
Student Notes
Guided Notes

Course Title/ Course #: Math Grade 7/8
Unit Title/ Marking Period # (MP): 2
Start day:
Meetings (Length of Unit): 5 days
Desired Results ~ What will students be learning?
Standards of Learning/ Standards
SOL 8.15b
The student will:
b. Solve two-step linear inequalities and graph the results on a number line.
SOL 7.15
The student will solve one-step inequalities in one variable and graph solutions to inequalities on the number line.
Essential Understandings/ Big Ideas
How does the solution to an equation differ from the solution to an inequality?
While a linear equation has only one replacement value for the variable that makes the equation true, an inequality can have
more than one.
The students will understand that:
The procedures are the same except for the case when an inequality is multiplied or divided on both sides by a negative number. Then the inequality sign is changed from less than to greater than, or greater than to less than.
In an inequality, there can be more than one value for the variable that makes the inequality true.
Key Essential Skills and Knowledge
SOL 8.15b
The student will use problem solving, mathematical communication, mathematical reasoning, connections, and representations to:
Solve two-step inequalities in one variable by showing the steps and using algebraic sentences.
Graph solutions to two-step linear inequalities on a number line.
Represent and demonstrate steps in solving inequalities in one variable, using concrete materials, pictorial representations, and algebraic sentences.
Graph solutions to inequalities on the number line.
Vocabulary
Academic Vocabulary Content Vocabulary
Inverse Operation
Solution
Inequality
Number Line
Variable
Replacement
Operation
Reverse
Assessment Evidence ~ What is evidence of mastery? What did the students master & what are they missing?
Assessment/ Evidence
Interactive Achievement
Inequalities Quiz=
Solving Inequalities by Adding or Subtracting Quiz=
Solving Inequalities by Multiplying or Dividing Quiz= Learning Plan ~ What are the strategies and activities you plan to use?
Learning Experiences/ Best Practice
Teacher Resources:
Create a foldable on solving addition and subtraction of inequalities.
Create a foldable on solving multiplication and division of inequalities.
Create a foldable on solving two-step inequalities.
Create a foldable on solving multi-step inequalities.
Create a foldable on graphing inequalities on a number line.
Cornell Notes in interactive notebook
Guided Practice
Text
Virginia Math Connects, Course 3, ©2012, Price, et al, McGraw-Hill School Education Group: page(s) 236-249.
Coach book Grade 7 Virginia Gold edition: page(s) 206-213.
Coach book Grade 8 Virginia Gold edition: page(s) 162-166.
Technology Integrations
Gizmo:
Solving Linear Inequalities in One Variable
Compound Inequalities
Smart Exchange:
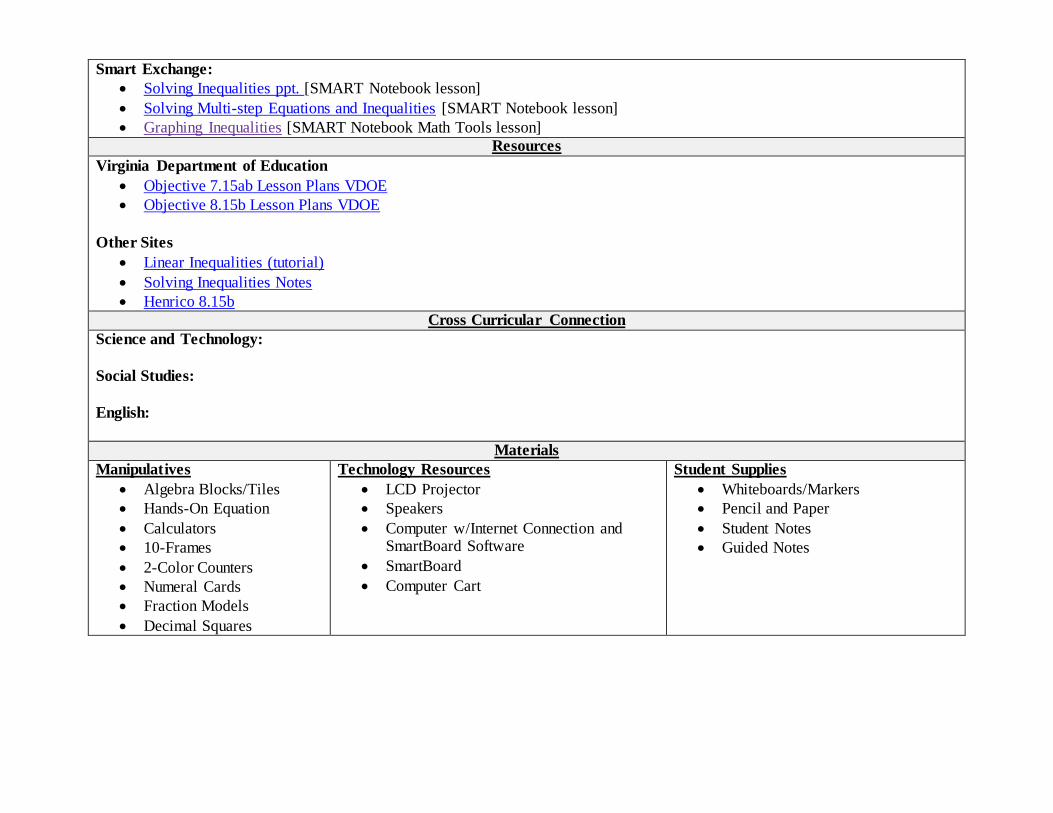
Solving Inequalities ppt. [SMART Notebook lesson]
Solving Multi-step Equations and Inequalities [SMART Notebook lesson]
Graphing Inequalities [SMART Notebook Math Tools lesson]
Resources
Virginia Department of Education
Objective 7.15ab Lesson Plans VDOE
Objective 8.15b Lesson Plans VDOE
Other Sites
Linear Inequalities (tutorial)
Solving Inequalities Notes
Henrico 8.15b
Cross Curricular Connection
Science and Technology:
Social Studies:
English:
Materials
Manipulatives
Algebra Blocks/Tiles
Hands-On Equation
Calculators
10-Frames
2-Color Counters
Numeral Cards
Fraction Models
Decimal Squares
Technology Resources
LCD Projector
Speakers
Computer w/Internet Connection and SmartBoard Software
SmartBoard
Computer Cart
Student Supplies
Whiteboards/Markers
Pencil and Paper
Student Notes
Guided Notes

Course Title/ Course #: Math Grade 7/8
Unit Title/ Marking Period # (MP): 2
Start day:
Meetings (Length of Unit): 16 days
Desired Results ~ What will students be learning?
Standards of Learning/ Standards
SOL 8.14
The student will make connections between any two representations (tables, graphs, words, and rules) of a given relationship.
SOL 8.16

The student will graph a linear equation in two variables.
SOL 8.17
The student will identify the domain, range, independent variable, or dependent variable in a given situation.
SOL 7.12
The student will represent relationships with tables, graphs, rules, and words.
Essential Understandings/ Big Ideas
What is the relationship among tables, graphs, words, and rules in modeling a given situation?
Any given relationship can be represented by all four.
What types of real life situations can be represented with linear equations? Any situation with a constant rate can be represented by a linear equation.
What are the similarities and differences among the terms domain, range, independent variable and dependent variable?
The value of the dependent variable changes as the independent variable changes. The domain is the set of all input values for
the independent variable. The range is the set of all possible values for the dependent variable
Rules that relate elements in two sets can be represented by word sentences, equations, tables of values, graphs or illustrated pictorially.
Key Essential Skills and Knowledge
SOL 8.14
The student will use problem solving, mathematical communication, mathematical reasoning, connections, and representations to:
Graph in a coordinate plane ordered pairs that represent a relation.
Describe and represent relations and functions, using tables, graphs, words, and rules. Given one representation, students will
be able to represent the relation in another form.
Relate and compare different representations for the same relation.
SOL 8.16
Construct a table of ordered pairs by substituting values for x in a linear equation to find values for y.
Plot in the coordinate plane ordered pairs (x, y) from a table.
Connect the ordered pairs to form a straight line (a continuous function).
Interpret the unit rate of the proportional relationship graphed as the slope of the graph, and compare two different
proportional relationships represented in different ways.

SOL 8.17
Apply the following algebraic terms appropriately: domain, range, independent variable, and dependent variable.
Identify examples of domain, range, independent variable, and dependent variable.
Determine the domain of a function.
Determine the range of a function.
Determine the independent variable of a relationship.
Determine the dependent variable of a relationship.
SOL 7.12
Describe and represent relations and functions, using tables, graphs, rules, and words.
Given one representation, students will be able to represent the relation in another form.
Vocabulary
Academic Vocabulary Content Vocabulary
Relations
Functions
Substitution
Rules
Origin
Plot
Constant Rate
Intersections
Independent Variable
Dependent Variable
Table of Values
Graph
Linear Equation
x-axis
y-axis
Ordered Pair
Coordinate Plane
Quadrant
Continuous Function
Domain
Range
Assessment Evidence ~ What is evidence of mastery? What did the students master & what are they missing?
Assessment/ Evidence
Interactive Achievement
Functions Quiz=
Graphing Linear Functions Quiz 2=
Domain and Range, Independent and Dependent Variables Quiz

Learning Plan ~ What are the strategies and activities you plan to use?
Learning Experiences/ Best Practice
Teacher Resources:
Create a foldable on identifying the types of graphs.
Create a foldable on the proper way to graph points.
Create a foldable on how to graph a linear equation.
Create a foldable on how to determine the domain and range of a set of points.
Create a foldable on determining independent and dependent variables.
Cornell Notes in interactive notebook
Guided Practice
Text
Virginia Math Connects, Course 3, ©2012, Price, et al, McGraw-Hill School Education Group: page(s) 27-29, 33-35, 399-404, and 410-413.
Coach book Grade 7 Virginia Gold edition: page(s) 178-183 and 192-197.
Coach book Grade 8 Virginia Gold edition: page(s) 148-157 and 167-171.
Technology Integrations
Gizmo:
Distance-Time Graphs
Linear Functions
Slope-Intercept Form of a Line
Points, Lines, and Equations
Introduction to Functions
Brain Pop: Solving Inequalities
Graphing Linear Equations
Smart Exchange: Preview of Graphs and Functions ppt.[SMART Notebook lesson]
Introduction to Functions ppt.[SMART Notebook lesson]
Resources
Virginia Department of Education
Objective 7.12 Lesson Plans VDOE

Objective 8.14 Lesson Plans VDOE
Objective 8.16 Lesson Plans VDOE
Objective 8.17 Lesson Plans VDOE
Other Sites
Regents Prep-Vocabulary Lesson
Linear & Nonlinear Functions – Instructional Resource
Illuminations-Roller Coaster Through Functions-Lesson Plan
Cross Curricular Connection
Science and Technology:
Student can arrange in order on a graph the sizes of the planets while determining the domain and range.
Social Studies:
Student can arrange in order on a graph the populations of the states while determining the domain and range.
English:
Student can write a paper on the difference of the types of graphs.
Materials
Manipulatives
Geoboards
Numeral Cards
Algebra Blocks/Tiles
Hands-On Equation
Calculators
10-Frames
2-Color Counters
Numeral Cards
Fraction Models
Decimal Squares
Technology Resources
LCD Projector
Speakers
Computer w/Internet Connection and SmartBoard Software
SmartBoard
Computer Cart
Student Supplies
Whiteboards/Markers
Pencil and Paper
Student Notes
Guided Notes

Course Title/ Course #: Math Grade 7/8
Unit Title/ Marking Period # (MP): 2
Start day:
Meetings (Length of Unit): 14 days
Desired Results ~ What will students be learning?
Standards of Learning/ Standards
SOL 8.3
The student will:
a. Solve practical problems involving rational numbers, percent’s, ratios, and proportions; and
b. Determine the percent increase or decrease for a given situation.
SOL 7.4
The student will solve single-step and multi-step practical problems, using proportional reasoning.
SOL 7.6
Essential Understandings/ Big Ideas
What is the difference between percent increase and percent decrease?
Percent increase and percent decrease are both percent’s of change measuring the percent a quantity increases or decreases.
Percent increase shows a growing change in the quantity while percent decrease shows a lessening change.
What is a percent? A percent is a special ratio with a denominator of 100.
What makes two quantities proportional? Two quantities are proportional when a change in one quantity corresponds to a predictable change in the other.
Key Essential Skills and Knowledge
SOL 8.3
To be successful with this standard, students are expected to:
Write a proportion given the relationship of equality between two ratios.
Solve practical problems by using computation procedures for whole numbers, integers, fractions, percent’s, ratios, and proportions. Some problems may require the application of a formula.
Maintain a checkbook and check registry for five or fewer transactions.
Compute a discount or markup and the resulting sale price for one discount or markup.

Compute the percent increase or decrease for a one-step equation found in a real life situation.
Compute the sales tax or tip and resulting total.
Substitute values for variables in given formulas. For example, use the simple interest formula I prt to determine the value
of any missing variable when given specific information.
Compute the simple interest and new balance earned in an investment or on a loan for a given number of years.
SOL 7.4
The student will use problem solving, mathematical communication, mathematical reasoning, connections and representations to:
Write proportions that represent equivalent relationships between two sets.
Solve a proportion to find a missing term.
Apply proportions to solve practical problems. Calculators may be used.
Apply proportions to convert units of measurement between the U.S. Customary System and the metric system. Calculators may be used.
Using 10% as a benchmark, mentally compute 5%, 10%, 15% or 20% in a practical situation such as tips, tax and discounts.
Solve problems involving tips, tax, and discounts. Limit problems to only one percent computation per problem.
Vocabulary
Academic Vocabulary Content Vocabulary
Simple Interest
Percent Increase
Deposit
Sales Tax
Percent Decrease
Markup
Discounts
Withdrawal
Balance
Ratios
Proportions
Percent’s
Cross Product
Equivalent
Unit Rate
Unit Price
Assessment Evidence ~ What is evidence of mastery? What did the students master & what are they missing?
Assessment/ Evidence
Interactive Achievement
Learning Plan ~ What are the strategies and activities you plan to use?
Learning Experiences/ Best Practice
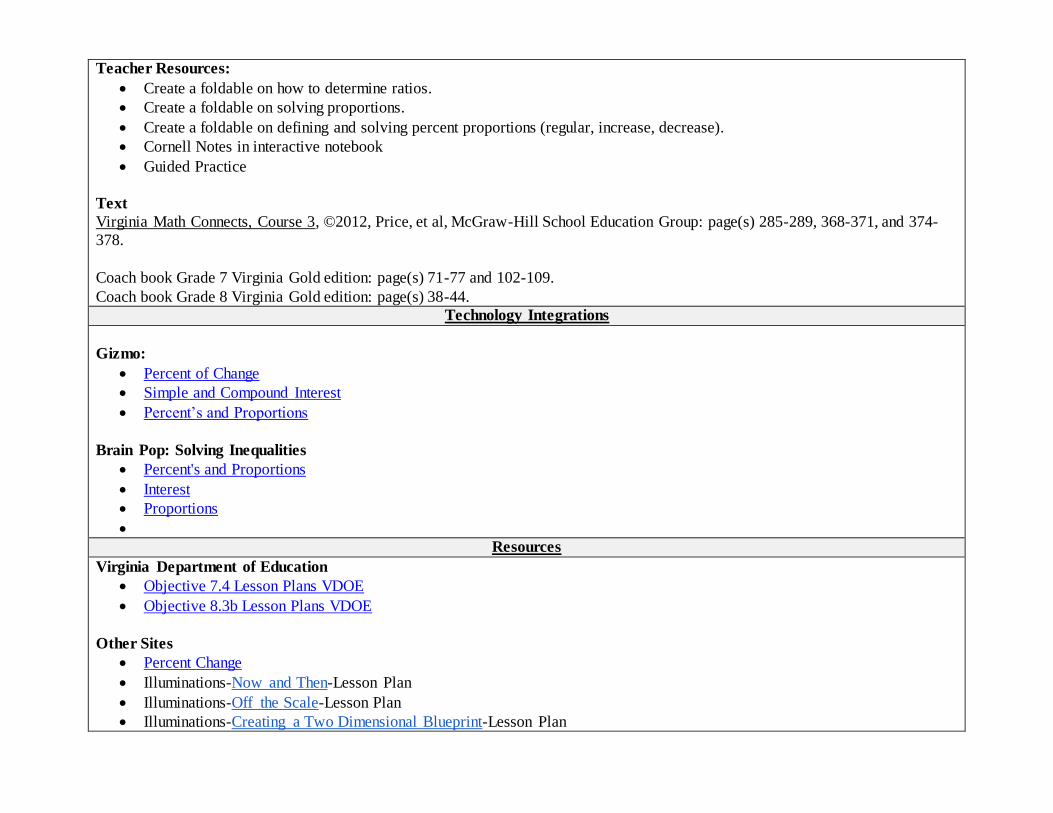
Teacher Resources:
Create a foldable on how to determine ratios.
Create a foldable on solving proportions.
Create a foldable on defining and solving percent proportions (regular, increase, decrease).
Cornell Notes in interactive notebook
Guided Practice
Text
Virginia Math Connects, Course 3, ©2012, Price, et al, McGraw-Hill School Education Group: page(s) 285-289, 368-371, and 374-
378.
Coach book Grade 7 Virginia Gold edition: page(s) 71-77 and 102-109.
Coach book Grade 8 Virginia Gold edition: page(s) 38-44.
Technology Integrations
Gizmo:
Percent of Change
Simple and Compound Interest
Percent’s and Proportions
Brain Pop: Solving Inequalities
Percent's and Proportions
Interest
Proportions
Resources
Virginia Department of Education
Objective 7.4 Lesson Plans VDOE
Objective 8.3b Lesson Plans VDOE
Other Sites
Percent Change
Illuminations-Now and Then-Lesson Plan
Illuminations-Off the Scale-Lesson Plan
Illuminations-Creating a Two Dimensional Blueprint-Lesson Plan

Illuminations-Shops at the Mall-Lesson Plan
Cross Curricular Connection
Science and Technology:
Have students compare the percentages of the gases of the different planets.
Social Studies:
Have students compare the percentages of the African-American troops in the civil war.
English:
Have students write a paper on the last time the used proportions when shopping.
Materials
Manipulatives
Color Tiles
Cubes
Cuisenaire Rods
Pattern Blocks
Tangrams
2-Color Counters
Fraction Models
Technology Resources
LCD Projector
Speakers
Computer w/Internet Connection and
SmartBoard Software
SmartBoard
Computer Cart
Student Supplies
Whiteboards/Markers
Pencil and Paper
Student Notes
Guided Notes
Course Title/ Course #: Math Grade 7/8
Unit Title/ Marking Period # (MP): 2
Start day:
Meetings (Length of Unit): 5 days
Desired Results ~ What will students be learning?
Standards of Learning/ Standards
SOL 8.12
The student will determine the probability of independent and dependent events with and without replacement.
SOL 7.9
The student will investigate and describe the difference between the experimental probability and theoretical probability of an event.
Essential Understandings/ Big Ideas
How are the probabilities of dependent and independent events similar? Different?

If events are dependent then the second event is considered only if the first event has already occurred. If events are
independent, then the second event occurs regardless of whether or not the first occurs.
The students will understand that: Theoretical probability of an event is the expected probability and can be found with a formula.
The experimental probability of an event is determined by carrying out a simulation or an experiment.
In experimental probability, as the number of trials increases, the experimental probability gets closer to the theoretical
probability
Key Essential Skills and Knowledge
SOL 8.12
The student will use problem solving, mathematical communication, mathematical reasoning, connections, and representations to :
Determine the probability of no more than three independent events.
Determine the probability of no more than two dependent events without replacement.
Compare the outcomes of events with and without replacement.
Vocabulary
Academic Vocabulary Content Vocabulary
Ratios
Proportions
Cross Product
Equivalent
Assessment Evidence ~ What is evidence of mastery? What did the students master & what are they missing?
Assessment/ Evidence
Interactive Achievement
Learning Plan ~ What are the strategies and activities you plan to use?
Learning Experiences/ Best Practice
Teacher Resources:
Create a foldable on solving independent events.
Create a foldable on solving dependent events.
Cornell Notes in interactive notebook
Guided Practice
Text
Virginia Math Connects, Course 3, ©2012, Price, et al, McGraw-Hill School Education Group: page(s) 813-818.
Coach book Grade 7 Virginia Gold edition: page(s) 140-146.
Coach book Grade 8 Virginia Gold edition: page(s) 108-111.

Technology Integrations
Gizmo:
Theoretical and Experimental Probability
Smart Exchange:
Probability and Data Analysis ppt. [SMART Notebook lesson]
Resources
Virginia Department of Education
Objective 7.9 Lesson Plans VDOE
Objective 8.12 Lesson Plans VDOE
Other Sites
Types of Events Notes
Tree Diagram Notes
Cross Curricular Connection
Science and Technology: Have students determine how chromosomes determine the sex of babies.
Social Studies:
Have students determine how the Civil War may have been different if African-American troops never got involved.
English:
Have students write how probability has effected circumstances dealing with the grades they are receiving.
Materials
Manipulatives
Color Tiles
Cubes
Cuisenaire Rods
Pattern Blocks
Tangrams
2-Color Counters
Fraction Models
Technology Resources
LCD Projector
Speakers
Computer w/Internet Connection and SmartBoard Software
SmartBoard
Computer Cart
Student Supplies
Whiteboards/Markers
Pencil and Paper
Student Notes
Guided Notes

Course Title/ Course #: Math Grade 7/8
Unit Title/ Marking Period # (MP): 3
Start day:
Meetings (Length of Unit): 5 days
Desired Results ~ What will students be learning?
Standards of Learning/ Standards
SOL 8.12
The student will determine the probability of independent and dependent events with and without replacement.
SOL 7.9
The student will investigate and describe the difference between the experimental probability and theoretical probability of an event.
Essential Understandings/ Big Ideas
How are the probabilities of dependent and independent events similar? Different? If events are dependent then the second event is considered only if the first event has already occurred. If events are
independent, then the second event occurs regardless of whether or not the first occurs.
The students will understand that:
Theoretical probability of an event is the expected probability and can be found with a formula.
The experimental probability of an event is determined by carrying out a simulation or an experiment.
In experimental probability, as the number of trials increases, the experimental probability gets closer to the theoretical
probability
Key Essential Skills and Knowledge
SOL 8.12
The student will use problem solving, mathematical communication, mathematical reasoning, connections, and representations to :
Determine the probability of no more than three independent events.
Determine the probability of no more than two dependent events without replacement.
Compare the outcomes of events with and without replacement.
Vocabulary
Academic Vocabulary Content Vocabulary
Ratios
Proportions
Cross Product
Equivalent
Assessment Evidence ~ What is evidence of mastery? What did the students master & what are they missing?
Assessment/ Evidence
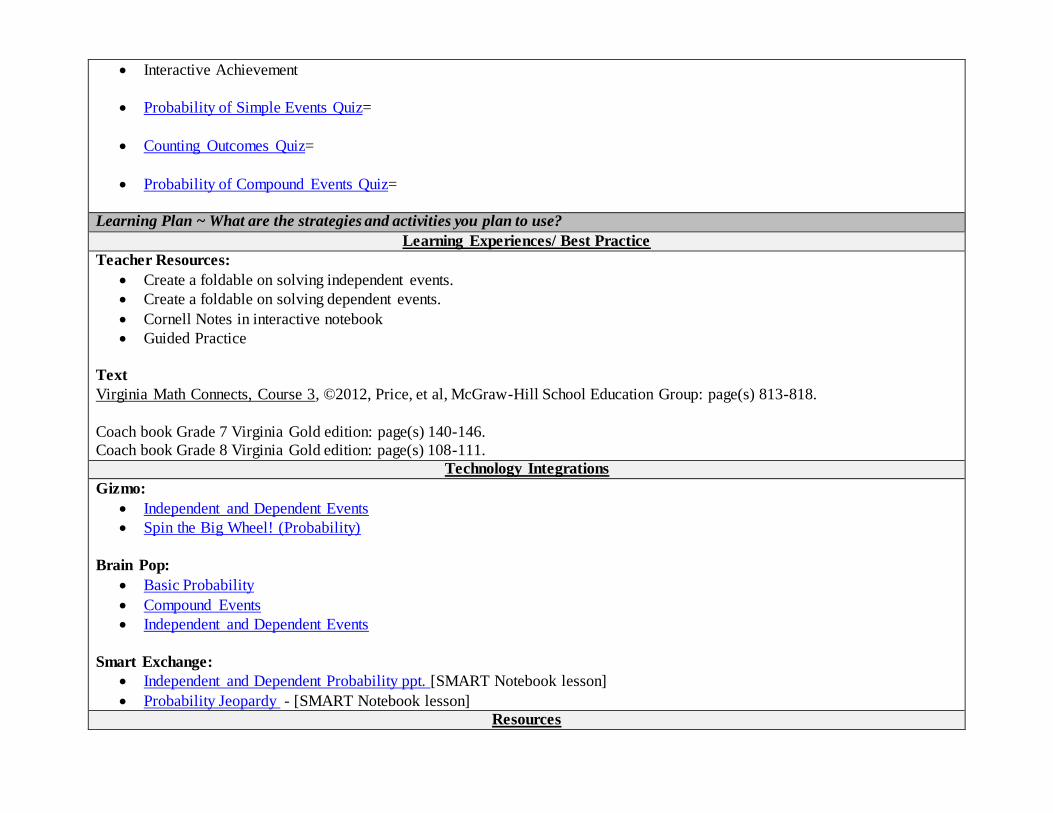
Interactive Achievement
Probability of Simple Events Quiz=
Counting Outcomes Quiz=
Probability of Compound Events Quiz=
Learning Plan ~ What are the strategies and activities you plan to use?
Learning Experiences/ Best Practice
Teacher Resources:
Create a foldable on solving independent events.
Create a foldable on solving dependent events.
Cornell Notes in interactive notebook
Guided Practice
Text
Virginia Math Connects, Course 3, ©2012, Price, et al, McGraw-Hill School Education Group: page(s) 813-818.
Coach book Grade 7 Virginia Gold edition: page(s) 140-146.
Coach book Grade 8 Virginia Gold edition: page(s) 108-111.
Technology Integrations
Gizmo:
Independent and Dependent Events
Spin the Big Wheel! (Probability)
Brain Pop:
Basic Probability
Compound Events
Independent and Dependent Events
Smart Exchange:
Independent and Dependent Probability ppt. [SMART Notebook lesson]
Probability Jeopardy - [SMART Notebook lesson]
Resources

Virginia Department of Education
Objective 7.9 Lesson Plans VDOE
Objective 8.12 Lesson Plans VDOE
Other Sites
The Learning Channel-Probability of Dependent and Independent Events-Instructional Teacher Video
Cross Curricular Connection
Science and Technology:
Have students determine chances of a frog catching a fly with his tongue on five tries.
Social Studies:
Have students determine chances of choosing one of the original thirteen colonies the did not support slavery.
English:
Have students write a paper on the different ways to find probability.
Materials
Manipulatives
Color Tiles
Cubes
Cuisenaire Rods
Pattern Blocks
Tangrams
2-Color Counters
Fraction Models
Technology Resources
LCD Projector
Speakers
Computer w/Internet Connection and
SmartBoard Software
SmartBoard
Computer Cart
Student Supplies
Whiteboards/Markers
Pencil and Paper
Student Notes
Guided Notes

Course Title/ Course #: Math Grade 7/8
Unit Title/ Marking Period # (MP): 3
Start day:
Meetings (Length of Unit): 13 days
Desired Results ~ What will students be learning?
Standards of Learning/ Standards
SOL 8.6
The student will:
a. verify by measuring and describe the relationships among vertical angles, adjacent angles, supplementary angles, and
complementary angles; and
b. measure angles of less than 360°.
SOL 8.8
The student will:
a. Apply transformations to plane figures; and
b. Identify applications of transformations.
SOL 7.8
The student, given a polygon in the coordinate plane, will represent transformations (reflections, dilations, rotations, and
translations) by graphing in the coordinate plane.
Essential Understandings/ Big Ideas
How are vertical, adjacent, complementary and supplementary angles related? Adjacent angles are any two non-overlapping angles that share a common side and a common vertex. Vertical angles will
always be nonadjacent angles. Supplementary and complementary angles may or may not be adjacent.
How does the transformation of a figure on the coordinate grid affect the congruency, orientation, location and symmetry of an
image?
Translations, rotations and reflections maintain congruence between the pre-image and image but change location. Dilations by
a scale factor other than 1 produce an image that is not congruent to the pre-image but is similar. Rotations and reflections
change the orientation of the image.
The students will understand that: translations, rotations and reflections do not change the size or shape of a figure.
a dilation of a figure and the original figure are similar.
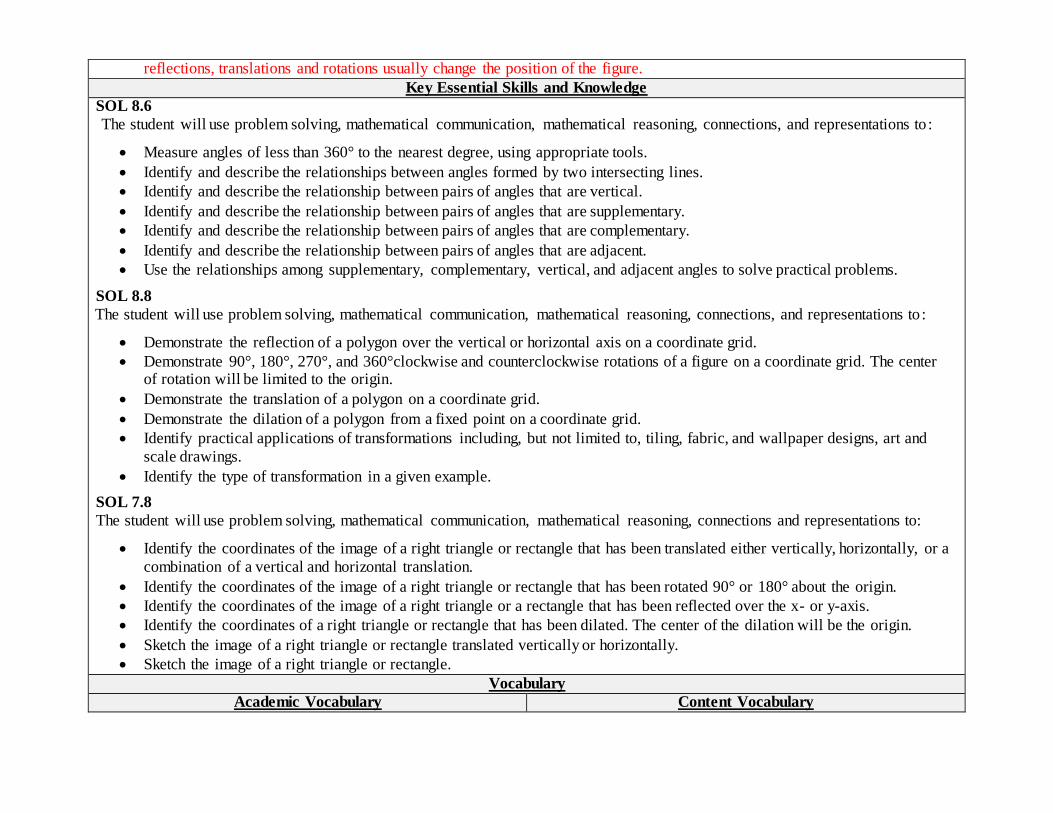
reflections, translations and rotations usually change the position of the figure.
Key Essential Skills and Knowledge
SOL 8.6
The student will use problem solving, mathematical communication, mathematical reasoning, connections, and representations to :
Measure angles of less than 360° to the nearest degree, using appropriate tools.
Identify and describe the relationships between angles formed by two intersecting lines.
Identify and describe the relationship between pairs of angles that are vertical.
Identify and describe the relationship between pairs of angles that are supplementary.
Identify and describe the relationship between pairs of angles that are complementary.
Identify and describe the relationship between pairs of angles that are adjacent.
Use the relationships among supplementary, complementary, vertical, and adjacent angles to solve practical problems.
SOL 8.8
The student will use problem solving, mathematical communication, mathematical reasoning, connections, and representations to :
Demonstrate the reflection of a polygon over the vertical or horizontal axis on a coordinate grid.
Demonstrate 90°, 180°, 270°, and 360°clockwise and counterclockwise rotations of a figure on a coordinate grid. The center of rotation will be limited to the origin.
Demonstrate the translation of a polygon on a coordinate grid.
Demonstrate the dilation of a polygon from a fixed point on a coordinate grid.
Identify practical applications of transformations including, but not limited to, tiling, fabric, and wallpaper designs, art and
scale drawings.
Identify the type of transformation in a given example.
SOL 7.8
The student will use problem solving, mathematical communication, mathematical reasoning, connections and representations to:
Identify the coordinates of the image of a right triangle or rectangle that has been translated either vertically, horizontally, or a
combination of a vertical and horizontal translation.
Identify the coordinates of the image of a right triangle or rectangle that has been rotated 90° or 180° about the origin.
Identify the coordinates of the image of a right triangle or a rectangle that has been reflected over the x- or y-axis.
Identify the coordinates of a right triangle or rectangle that has been dilated. The center of the dilation will be the origin.
Sketch the image of a right triangle or rectangle translated vertically or horizontally.
Sketch the image of a right triangle or rectangle.
Vocabulary
Academic Vocabulary Content Vocabulary

Complementary Angles
Supplementary Angles
Vertical Angles
Adjacent Angles
Line of Reflection
Scale Factor
Center of Rotation
Transformation
Translation
Horizontal
Clockwise
Counterclockwise
x-axis
y-axis
Angle
Degrees
Protractor
Linear Pair
Vertical
Reflection
Turn
Enlarge/Reduce
Rotation
Slide
Flip
Tiling
Dilate
Quadrant
Assessment Evidence ~ What is evidence of mastery? What did the students master & what are they missing?
Assessment/ Evidence
Interactive Achievement
Line and Angle Relationships Quiz=
Reflections Quiz=
Translations Quiz=
Rotations Quiz= Learning Plan ~ What are the strategies and activities you plan to use?
Learning Experiences/ Best Practice
Teacher Resources:
Create a foldable defining the different types of angles.
Create a foldable on finding angle measurements from 0 - 360.
Create a Frayer model on translations.
Create a Frayer model on rotations.
Create a Frayer model on reflections.
Create a Frayer model on dilations.
Cornell Notes in interactive notebook

Guided Practice
Text
Virginia Math Connects, Course 3, ©2012, Price, et al, McGraw-Hill School Education Group: page(s) 619-624, 103-107, 311-316, and 639-644.
Coach book Grade 7 Virginia Gold edition: page(s) 121-138.
Coach book Grade 8 Virginia Gold edition: page(s) 58-63 and 84-90.
Technology Integrations
Gizmo:
Investigating Angle Theorems
Dilations
Reflections
Rotations, Reflections, and Translations
Smart Exchange:
Angles and Angle Relationships [SMART Notebook lesson]
Vertical and Adjacent Angles [SMART Notebook lesson]
Types of Transformations[SMART Notebook lesson]
Resources
Virginia Department of Education
Objective 7.8 Translation and Reflection Lesson Plans VDOE
Objective 7.8 Dilation Lesson Plans VDOE
Objective 7.8 Rotations Lesson Plans VDOE
Objective 8.6 Lesson Plans VDOE
Objective 8.8 Lesson Plans VDOE
Other Sites
Shape Mods Game
Complementary Angles Notes
Supplementary Angles Notes
Cross Curricular Connection

Science and Technology:
Have students draw a beaker on a sheet of paper then use a transformation to move the beaker around the paper.
Social Studies:
Have students demonstrate the motion of troops of the military by transformations.
English:
Have students write a paper on how angles and transformations could help in every day life.
Materials
Manipulatives
Protractors
Compasses
Rulers
Miras
Pattern Blocks
Patty Paper
Tangrams
Color Tiles
Cubes
Capacity Containers
Geoboards
Geometric Solids
Technology Resources
LCD Projector
Speakers
Computer w/Internet Connection and
SmartBoard Software
SmartBoard
Computer Cart
Student Supplies
Whiteboards/Markers
Pencil and Paper
Student Notes
Guided Notes
Course Title/ Course #: Math Grade 7/8
Unit Title/ Marking Period # (MP): 3
Start day:
Meetings (Length of Unit): 10 days
Desired Results ~ What will students be learning?
Standards of Learning/ Standards
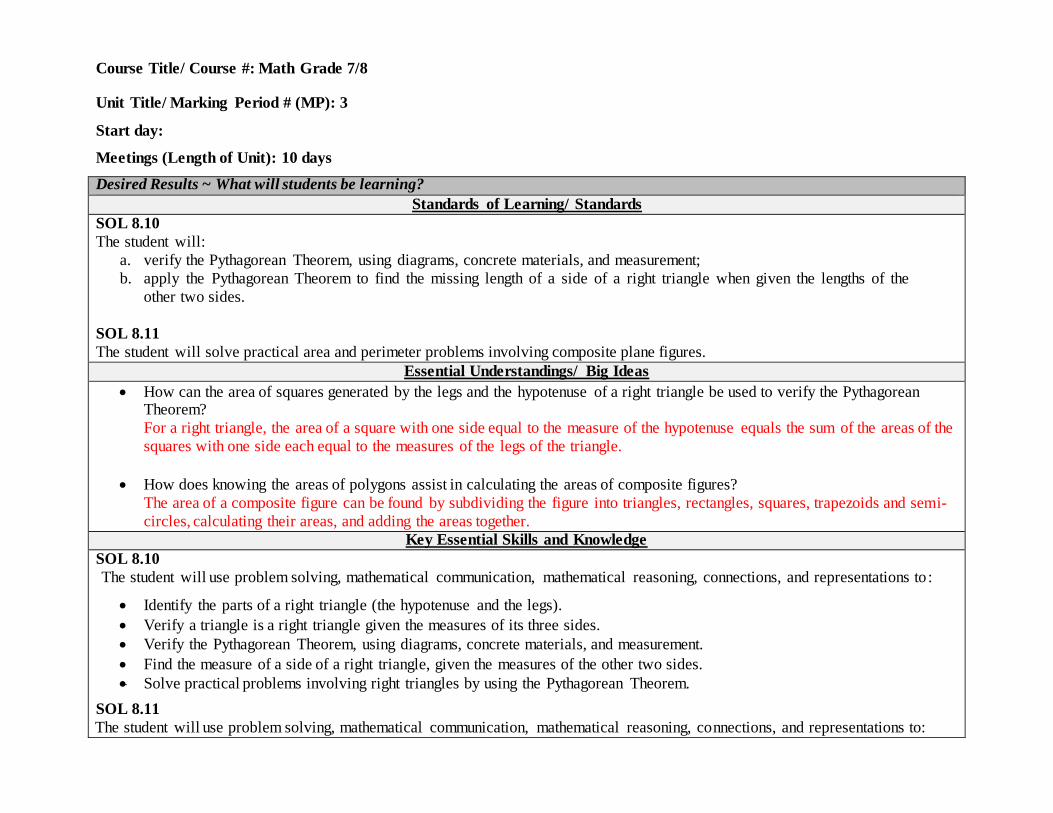
SOL 8.10
The student will:
a. verify the Pythagorean Theorem, using diagrams, concrete materials, and measurement;
b. apply the Pythagorean Theorem to find the missing length of a side of a right triangle when given the lengths of the
other two sides.
SOL 8.11
The student will solve practical area and perimeter problems involving composite plane figures.
Essential Understandings/ Big Ideas
How can the area of squares generated by the legs and the hypotenuse of a right triangle be used to verify the Pythagorean Theorem?
For a right triangle, the area of a square with one side equal to the measure of the hypotenuse equals the sum of the areas of the
squares with one side each equal to the measures of the legs of the triangle.
How does knowing the areas of polygons assist in calculating the areas of composite figures?
The area of a composite figure can be found by subdividing the figure into triangles, rectangles, squares, trapezoids and semi-
circles, calculating their areas, and adding the areas together.
Key Essential Skills and Knowledge
SOL 8.10
The student will use problem solving, mathematical communication, mathematical reasoning, connections, and representations to :
Identify the parts of a right triangle (the hypotenuse and the legs).
Verify a triangle is a right triangle given the measures of its three sides.
Verify the Pythagorean Theorem, using diagrams, concrete materials, and measurement.
Find the measure of a side of a right triangle, given the measures of the other two sides.
Solve practical problems involving right triangles by using the Pythagorean Theorem.
SOL 8.11
The student will use problem solving, mathematical communication, mathematical reasoning, connections, and representations to:

Subdivide a figure into triangles, rectangles, squares, trapezoids and semicircles. Estimate the area of subdivisions and combine to determine the area of the composite figure.
Use the attributes of the subdivisions to determine the perimeter and circumference of a figure.
Apply perimeter, circumference and area formulas to solve practical problems.
Vocabulary
Academic Vocabulary Content Vocabulary
Pythagorean Theorem
Hypotenuse
Leg
Pythagorean Triples
Composite(Complex) Figure
Subdividing
Right Triangle
Square Root
Whole Number
Altitude
Area
Perimeter
Polygon
Assessment Evidence ~ What is evidence of mastery? What did the students master & what are they missing?
Assessment/ Evidence
Interactive Achievement
The Pythagorean Theorem Quiz=
Using the Pythagorean Theorem Quiz= Learning Plan ~ What are the strategies and activities you plan to use?
Learning Experiences/ Best Practice
Teacher Resources:
Create a foldable on defining the Pythagorean Theorem.
Create a Frayer model on the area of different polygons.
Create a Frayer model on the perimeter of different polygons.
Cornell Notes in interactive notebook
Guided Practice
Text
Virginia Math Connects, Course 3, ©2012, Price, et al, McGraw-Hill School Education Group: page(s) 581-586, 223-228, and 684-
689.

Coach book Grade 8 Virginia Gold edition: page(s) 96-100.
Technology Integrations
Gizmo:
Pythagorean Theorem with a Geoboard
Pythagorean Theorem
Brain Pop:
Pythagorean Theorem
Smart Exchange:
Pythagorean Theorem ppt. [SMART Notebook lesson]
Understanding Pythagorean Theorem ppt. [SMART Notebook lesson]
Applying the Pythagorean Theorem [SMART Notebook lesson]
Composite Figures [SMART Notebook lesson]
Resources
Virginia Department of Education
Objective 8.10a-b Lesson Plans VDOE
Objective 8.11 Lesson Plans VDOE
Other Sites
Pythagorean Theorem – Lesson Planning
Regents Prep-Demonstrating the Pythagorean Theorem-
Pythagorean Theorem Notes
Cross Curricular Connection
Science and Technology:
Have students show how to determine the distance of the height of a microscope by using a triangular relationship.
Social Studies:
Have students demonstrate the trajectory of a missile shot threw the air.
English:
Have students write a paper about how Pythagorean came up with the Pythagorean Theroem.
Materials
Manipulatives Technology Resources Student Supplies

Color Tiles
Cubes
Geoboards
Rulers
LCD Projector
Speakers
Computer w/Internet Connection and SmartBoard Software
SmartBoard
Computer Cart
Whiteboards/Markers
Pencil and Paper
Student Notes
Guided Notes

Course Title/ Course #: Math Grade 7/8
Unit Title/ Marking Period # (MP): 3
Start day:
Meetings (Length of Unit): 11 days
Desired Results ~ What will students be learning?
Standards of Learning/ Standards
SOL 8.7
The student will:
a. investigate and solve practical problems involving volume and surface area of prisms, cylinders, cones,
and pyramids; and
b. describe how changing one measured attribute of a figure affects the volume and surface area.
SOL 8.9
The student will construct a three-dimensional model, given the top or bottom, side, and front views.
SOL 7.5
The student will:
a. describe volume and surface area of cylinders
b. solve practical problems involving the volume and surface area of rectangular prisms and cylinders; and
c. describe how changing one measured attribute of a rectangular prism affects its volume and surface area.
Essential Understandings/ Big Ideas
How does the volume of a three-dimensional figure differ from its surface area? Volume is the amount a container holds.
Surface area of a figure is the sum of the area on surfaces of the figure.
How are the formulas for the volume of prisms and cylinders similar?
For both formulas you are finding the area of the base and multiplying that by the height.
How are the formulas for the volume of cones and pyramids similar?
For cones you are finding 13
of the volume of the cylinder with the same size base and height.
For pyramids you are finding 13
of the volume of the prism with the same size base and height.
In general what effect does changing one attribute of a prism by a scale factor have on the volume of the prism?

When you increase or decrease the length, width or height of a prism by a factor greater than 1, the volume of the prism is a lso
increased by that factor.
How does knowledge of two-dimensional figures inform work with three-dimensional objects? It is important to know that a three-dimensional object can be represented as a two-dimensional model with views of the object
from different perspectives.
The students will:
Understand how to apply volume and surface area in real-life situations.
Understand the derivation of formulas related to volume and surface area of polygons.
Key Essential Skills and Knowledge
SOL 8.7
The student will use problem solving, mathematical communication, mathematical reasoning, connections, and representations to:
Distinguish between situations that are applications of surface area and those that are applications of volume.
Investigate and compute the surface area of a square or triangular pyramid by finding the sum of the areas of the triangular faces and the base using concrete objects, nets, diagrams and formulas.
Investigate and compute the surface area of a cone by calculating the sum of the areas of the side and the base, using concrete
objects, nets, diagrams and formulas.
Investigate and compute the surface area of a right cylinder using concrete objects, nets, diagrams and formulas.
Investigate and compute the surface area of a rectangular prism using concrete objects, nets, diagrams and formulas.
Investigate and compute the volume of prisms, cylinders, cones, and pyramids, using concrete objects, nets, diagrams, and formulas.
Solve practical problems involving volume and surface area of prisms, cylinders, cones, and pyramids.
SOL 8.9
The student will use problem solving, mathematical communication, mathematical reasoning, connections, and representations to :
Construct three-dimensional models, given the top or bottom, side, and front views.
Identify three-dimensional models given a two-dimensional perspective.
SOL 7.5
The student will use problem solving, mathematical communication, mathematical reasoning, connections and representations to:
Find the volume of a rectangular prism.
Find the surface area of a rectangular prism.
Find the volume of a cylinder.
Find the surface area of a cylinder.
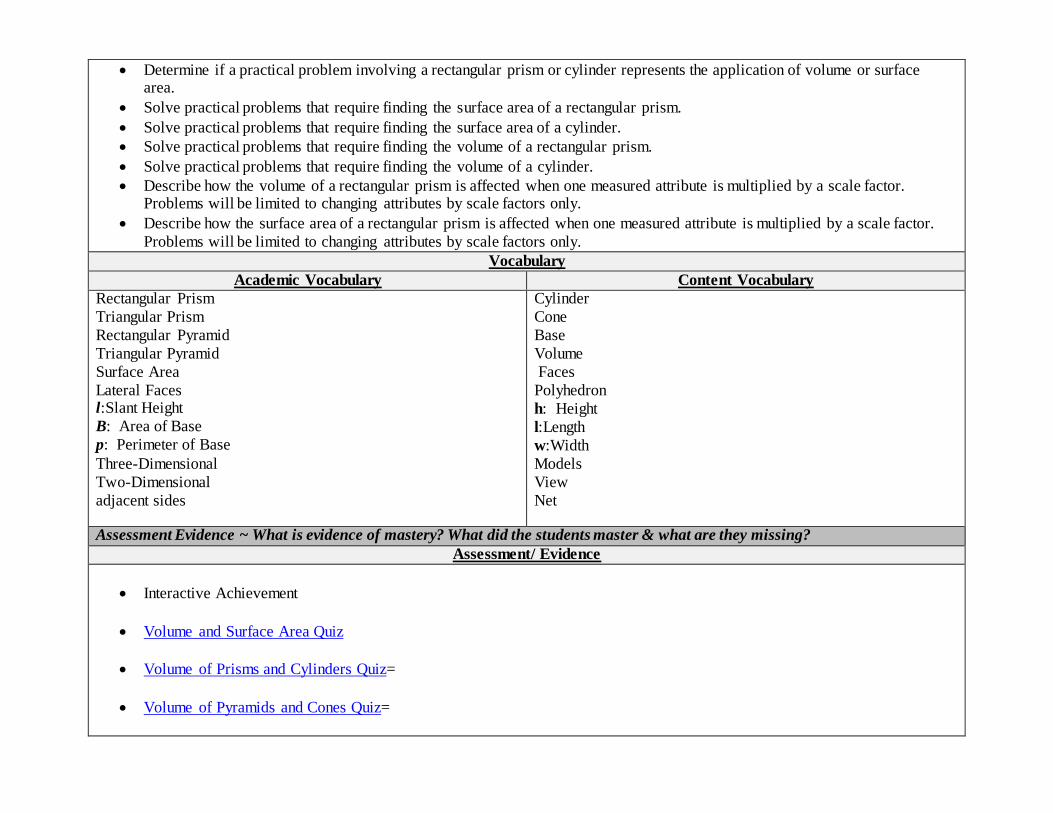
Determine if a practical problem involving a rectangular prism or cylinder represents the application of volume or surface area.
Solve practical problems that require finding the surface area of a rectangular prism.
Solve practical problems that require finding the surface area of a cylinder.
Solve practical problems that require finding the volume of a rectangular prism.
Solve practical problems that require finding the volume of a cylinder.
Describe how the volume of a rectangular prism is affected when one measured attribute is multiplied by a scale factor. Problems will be limited to changing attributes by scale factors only.
Describe how the surface area of a rectangular prism is affected when one measured attribute is multiplied by a scale factor.
Problems will be limited to changing attributes by scale factors only.
Vocabulary
Academic Vocabulary Content Vocabulary
Rectangular Prism
Triangular Prism
Rectangular Pyramid
Triangular Pyramid
Surface Area
Lateral Faces l:Slant Height
B: Area of Base
p: Perimeter of Base
Three-Dimensional
Two-Dimensional
adjacent sides
Cylinder
Cone
Base
Volume
Faces
Polyhedron
h: Height
l:Length
w:Width
Models
View
Net
Assessment Evidence ~ What is evidence of mastery? What did the students master & what are they missing?
Assessment/ Evidence
Interactive Achievement
Volume and Surface Area Quiz
Volume of Prisms and Cylinders Quiz=
Volume of Pyramids and Cones Quiz=

Surface Area of Prisms and Cylinders Quiz=
Learning Plan ~ What are the strategies and activities you plan to use?
Learning Experiences/ Best Practice
Teacher Resources:
Create a Frayer model on volume of prisms, cylinders, cones, and pyramids.
Create a Frayer model on surface area of prisms, cylinders, cones, and pyramids.
Create a Frayer model on how to draw three dimensional figures.
Cornell Notes in interactive notebook
Guided Practice
Text
Virginia Math Connects, Course 3, ©2012, Price, et al, McGraw-Hill School Education Group: page(s) 705-736.
Coach book Grade 7 Virginia Gold edition: page(s) 82-101.
Coach book Grade 8 Virginia Gold edition: page(s) 64-76 and 91-95.
Technology Integrations
Gizmo:
Prisms and Cylinders
Pyramids and Cones
Surface and Lateral Areas of Prisms and Cylinders
Surface and Lateral Areas of Pyramids and Cones
3D and Orthographic Views
Brain Pop:
Volume of Cylinders
Volume of Prisms
Smart Exchange:
Volume Surface Area ppt. [SMART Notebook lesson]
Volume Problems ppt. [SMART Notebook lesson]
Resources
Virginia Department of Education
Objective 7.5a Lesson Plans VDOE
Objective 7.5b Lesson Plans VDOE
Objective 7.5b Lesson Plans 2 VDOE

Objective 7.5c Lesson Plans VDOE
Objective 8.6 Lesson Plans VDOE
Objective 8.9 Lesson Plans VDOE
Other Sites
Radford University Lesson-Volume and Surface Area-Lesson Plan Performance Task
Cross Curricular Connection
Science and Technology:
Have students determine the volume and surface area of a science text book.
Social Studies:
Have students determine the volume and surface area a battleship.
English:
Have students write a paper on the difference between volume and surface area.
Materials
Manipulatives
Color Tiles
Cubes
Capacity Containers
Geometric Solids
Rulers
Capacity Containers
Graph Paper
Models of Solids
Boxes and cans (i.e. cereal, shoe, oatmeal, etc.)
Technology Resources
LCD Projector
Speakers
Computer w/Internet Connection and SmartBoard Software
SmartBoard
Computer Cart
Student Supplies
Whiteboards/Markers
Pencil and Paper
Student Notes
Guided Notes

Course Title/ Course #: Math Grade 7/8
Unit Title/ Marking Period # (MP): 4
Start day:
Meetings (Length of Unit): 8 days
Desired Results ~ What will students be learning?
Standards of Learning/ Standards
SOL 8.13
The student will:
a. make comparisons, predictions, and inferences, using information displayed in graphs; and
b. construct and analyze scatterplots
Essential Understandings/ Big Ideas
Why do we estimate a line of best fit for a scatterplot? A line of best fit helps in making interpretations and predictions about the situation modeled in the data set.
What are the inferences that can be drawn from sets of data points having a positive relationship, a negative relationship, and
no relationship?
Sets of data points with positive relationships demonstrate that the values of the two variables are increasing. A negative
relationship indicates that as the value of the independent variable increases, the value of the dependent variable decreases.
Key Essential Skills and Knowledge
SOL 8.13
The student will use problem solving, mathematical communication, mathematical reasoning, connections, and representations to :
Collect, organize, and interpret a data set of no more than 20 items using scatterplots. Predict from the trend an estimate of the
line of best fit with a drawing.
Interpret a set of data points in a scatterplot as having a positive relationship, a negative relationship, or no relationship.
Vocabulary
Academic Vocabulary Content Vocabulary

Bar Graph
Line Plot
Histogram
Prediction
Frequency Table
Stem-And-Leaf Plot
Scattergram (Scatterplot)
Line Graph
Box-And-Whisker Plot Range Random Sample Quartile Survey Constru
Mean
Inference
Median
Mode
Graph
Survey
Circle
Analyze
Comparison
Assessment Evidence ~ What is evidence of mastery? What did the students master & what are they missing?
Assessment/ Evidence
Interactive Achievement
Histograms Quiz=
Learning Plan ~ What are the strategies and activities you plan to use?
Learning Experiences/ Best Practice
Teacher Resources:
Create a Frayer model on the different types of graphs.
Cornell Notes in interactive notebook
Guided Practice
Text
Virginia Math Connects, Course 3, ©2012, Price, et al, McGraw-Hill School Education Group: page(s) P20-P21, 380-385, and 798-
810.
.
Coach book Grade 8 Virginia Gold edition: page(s) 118-135.
Technology Integrations
Gizmo:
Histograms
Trends in Scatterplots-Interactive Instructional Resource
Stem and Leaf Plot-Interactive Instructional Resource
Brain Pop:
Graphs

Smart Exchange:
Graphs, Charts, and Analysis of Data Part 1 [SMART Notebook lesson]
Graphs, Charts, and Analysis of Data Part 2 [SMART Notebook lesson]
Resources
Virginia Department of Education
Objective 8.13a Lesson Plans VDOE
Objective 8.13b Lesson Plans VDOE
Other Sites
Interactive Scatterplot
Practice with Scatter Plots and More
Histogram Notes
Thatquiz.org-Graphs-Interactive Skills Practice
Cross Curricular Connection
Science and Technology:
Have students define the steps of an experiment.
Social Studies:
Have students define the strategy Lincoln took on determining how to abolish slavery.
English:
Have students write a paper explaining how to analyze a graph.
Materials
Manipulatives
Color Tiles
Number Cubes
Spinners
Fraction Models
2-Color Counters
Graph Paper
Technology Resources
LCD Projector
Speakers
Computer w/Internet Connection and
SmartBoard Software
SmartBoard
Computer Cart
Student Supplies
Whiteboards/Markers
Pencil and Paper
Student Notes
Guided Notes
Related Documents