Welcome message from author
This document is posted to help you gain knowledge. Please leave a comment to let me know what you think about it! Share it to your friends and learn new things together.
Transcript


Richland Community College FY2003
Environmental Scan
Prepared by: Strategic Planning Taskforce
Members: Faith Brenner, Business and Technology Division
Gail Crookshank, Public Information Dan Dunphy, Business and Technology Division
Fred Ellis, Math and Sciences Division Dr. Meeta Goel, Institutional Effectiveness
Sandy Harmison, Administrative Information Systems Molly Kondritz, Human Resources
Tim Taylor, Business and Technology Division Shiney Thomas-Jacob, Student and Academic Services
Melinda Westwater, Business Services Teena Zindel-McWilliams, Student and Academic Services
Richland Community College 2003
Environmental Scan
Table of Contents
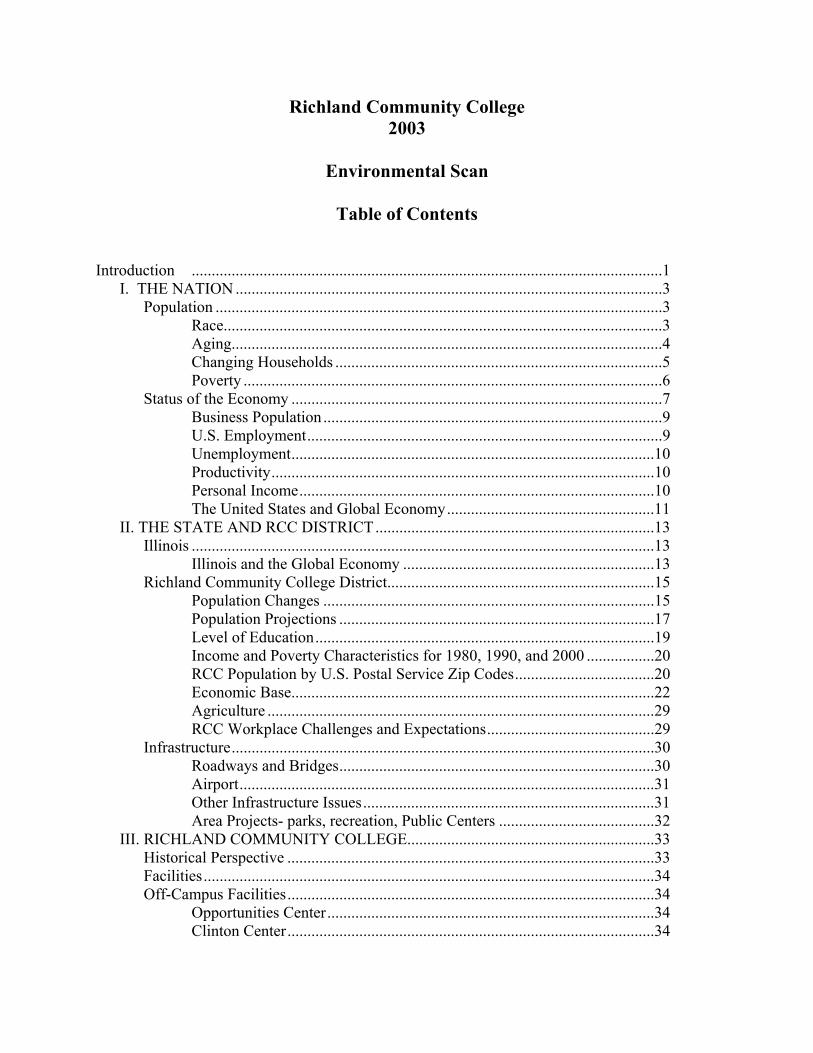
Introduction ......................................................................................................................1
I. THE NATION ...........................................................................................................3 Population ................................................................................................................3 Race..............................................................................................................3 Aging............................................................................................................4 Changing Households ..................................................................................5 Poverty .........................................................................................................6 Status of the Economy .............................................................................................7 Business Population .....................................................................................9 U.S. Employment.........................................................................................9 Unemployment...........................................................................................10 Productivity................................................................................................10 Personal Income.........................................................................................10 The United States and Global Economy....................................................11 II. THE STATE AND RCC DISTRICT......................................................................13 Illinois ....................................................................................................................13 Illinois and the Global Economy ...............................................................13 Richland Community College District...................................................................15 Population Changes ...................................................................................15 Population Projections ...............................................................................17 Level of Education.....................................................................................19 Income and Poverty Characteristics for 1980, 1990, and 2000 .................20 RCC Population by U.S. Postal Service Zip Codes...................................20 Economic Base...........................................................................................22 Agriculture .................................................................................................29 RCC Workplace Challenges and Expectations..........................................29 Infrastructure..........................................................................................................30 Roadways and Bridges...............................................................................30 Airport........................................................................................................31 Other Infrastructure Issues.........................................................................31 Area Projects- parks, recreation, Public Centers .......................................32 III. RICHLAND COMMUNITY COLLEGE..............................................................33 Historical Perspective ............................................................................................33 Facilities.................................................................................................................34 Off-Campus Facilities............................................................................................34 Opportunities Center..................................................................................34 Clinton Center............................................................................................34

Other off-Campus Sites..............................................................................35 Administrative Structure........................................................................................35 Board Challenges ...................................................................................................36 Governance ............................................................................................................36 Accreditation..........................................................................................................37 College Purpose and Mission.................................................................................38 Core Values............................................................................................................38 Credit Enrollment...................................................................................................39 Student Profile .......................................................................................................39 Baccalaureate/Transfer Programs ..........................................................................40 Occupational Programs..........................................................................................40 Business and Technology Division............................................................41 Mathematics and Sciences Division ..........................................................43 Communication, Education, Humanities and Fine Arts Division..............43 Health Professions Division.......................................................................45 Alternative Delivery Methods................................................................................46 Adult Education .....................................................................................................47 Continuing Education ............................................................................................48 Academic and Student Support Services ...............................................................49 Kitty Lindsay Learning Resources Center.................................................49 Technology Services..................................................................................49 Developmental Education..........................................................................50 Student Learning Center ............................................................................50 Assessment Center .....................................................................................50 Disability Accommodation Services..........................................................51 Title III Federal Grant Projects .............................................................................51 Personnel Profile of Faculty and Staff ...................................................................52 Employee Issues.....................................................................................................53 Financial Resources ...............................................................................................54 Financial Profile.........................................................................................54 Financial Aid..............................................................................................55 College Research ...................................................................................................56 All-College Survey ....................................................................................56 Student Satisfaction Survey .......................................................................56 Faces of the Future Survey ........................................................................57 Planning Papers Focus Groups ..................................................................58 Bibliography ..........................................................................................................62 Appendix................................................................................................................67
Tables
Table 1 Resident Population: actual 1980, 1990 and 2000
with Projections for 2005...................................................................................3 Table 2 Total Resident Population and Percent of Total Population by Race................4 Table 3 Resident Population by Age, shown as a percent of the total population
for 1980, 1990 and 2000 ....................................................................................5

Table 4 Types and Percent of Households for Census Years 1980, 1990 and 2000.............................................................................................................5
Table 5 Poverty by Family Size and Weighted Income Thresholds for 1980, 1990 and 2000....................................................................................................6
Table 6 Number of Individuals Living in Poverty for 1980, 1990 and 2000 .................7 Table 7 Key Economic Indicators for 1980, 1990 and 2000 ..........................................8 Table 8 Employment by Classification for 1980, 1990, and 2000 .................................9 Table 9 Distribution of Personal Income for 1999 .......................................................11 Table 10 Distribution of Income, by Quintile and Top 5%, for 1980, 1990
and 1999...........................................................................................................11 Table 11 Top 10 Countries for Illinois Exports in 2001.................................................14 Table 12 Selected Demographics for DeWitt and Macon Counties, Illinois, and the
United States for 1980, 1990, and 2000...........................................................16 Table 13 Population for Counties within the Richland Community College
District, for 1980, 1990, 2000..........................................................................17 Table 14 Population Projections for Counties within the Richland Community
College District in 2005...................................................................................17 Table 15 Land Areas and Persons per square mile in Illinois, and DeWitt and
Macon Counties in 2000 ..................................................................................18 Table 16 Educational Attainment for DeWitt and Macon Counties, Illinois,
and the United States as a Percent of the Population for 1990 and 2000 ........19 Table 17 Personal Per Capita Income and Poverty Figures for 1980,
1990, and 2000.................................................................................................20 Table 18 Student Population by Zip Code, % of Student Population,
and Total Population ........................................................................................21 Table 19 15 Major Employers by Employment for Macon County, Illinois..................22 Table 20 14 Major Employers by Employment for DeWitt County, Illinois .................23 Table 21 Employment Figures for DeWitt and Macon Counties by Industry
for 2000............................................................................................................24 Table 22 Top 20 Industries expected to have the largest increase in jobs
in the RCC District from 1998 to 2008............................................................25 Table 23 Top 10 Industries with the greatest decrease in jobs
in the RCC District from 1998 to 2008............................................................26 Table 24 Unemployment Rates for the United States, Illinois, Macon and DeWitt
Counties, for 1980, 1990 and 2000..................................................................26 Table 25 Employment and Wage Projections for Graduates with an
Associate’s Degree...........................................................................................27 Table 26 Employment and Wage Projections for Graduates with a
Bachelor’s Degree............................................................................................28 Table 27 Farm Data for Illinois and DeWitt County and Macon County,
for years 1987, 1992 and 1997.........................................................................29


Richland Community College May 2003
Introduction
In September of 2002, Dr. Gayle Saunders gathered a group of College employees to begin working on a new Strategic Plan for the College. This plan was to be based on research and would provide the direction for the institution for the next several years. In 1996, an Environmental Scan was done to assess and understand the environment and its effect on Richland Community College. This process was an effective tool for gathering information that could affect the work of the College. The Strategic Planning Taskforce that was formed in the fall of 2002 chose to use the 1996 Environmental Scan as a model for gathering data relevant to the College. The Environmental Scan, according to authors Freidel and Lapin, is “a kind of radar to scan the world systematically and signify the new, unexpected the major, and the minor.” As community colleges are highly influenced by changes in the external environment, this method of gathering data is an effective tool to provide a foundation of planning. The Environmental Scan was divided into two areas: an internal scan and an external scan. The internal scan looked at information already gathered by the College: surveys, statistics, opinions, reports, focus groups, and other documentation. The external scan focused on the 2000 Census and a multitude of professional journals, web sites, periodicals, newspapers, and personal interviews. The information was gathered and grouped into similar topics. Trends and issues emerged and from these ten Planning Papers were written. College-wide focus groups were organized for the Planning Papers. Each College employee was assigned a focus group to attend in January 2003. Two focus groups were held per paper. Participants were asked to brainstorm strategies based on the information in the Planning Papers. The information gathered from this activity, along with the themes and issues from the Environmental Scan became the basis for the Strategic Plan. The Environmental Scan consists of three major areas of study: national, state and Richland Community College district, and the College itself. The first two reflect the external scan, and the third is the internal scan. As reflected in the table of contents, numerous topics are covered in each of the three areas. One recommendation has come forward from the Taskforce that concerns the scanning process. It is recommended that a system be put in place that provides ongoing scanning within the institution. This action could be housed in the Learning Resources Center, under the guidance of the Institutional Effectiveness Office, and would be useful as the Strategic Plan is updated yearly.
1

Members of the Strategic Planning Taskforce would like to express their appreciation to all members of the College community for their participation in this process through discussion, focus groups, scanning support and other activities.
2

I. THE NATION Population The rate of resident growth in the United States increased 13.2% from 1990 to 2000. In comparison, the 1980 to 1990 population increased 9.8%. The U.S. Census Bureau’s five-year population projection (middle-series growth rate) is 4.8%, or a population of 294,930,000 in 2005. Table 1 shows actual and projected resident populations and percentage growth rates from 1980 through 2005. Table 1. Resident Population: Actual 1980, 1990 and 2000 with Projection for 2005.
Census Year 1980 1990 2000 2005
(Projected) Population 226,542,199 248,718,301 281,421,906 294,930,000
% Increase ---- 9.8 13.2 4.8
Sources: U.S. Census Bureau, Current Population Reports 2000: Profile of General Demographic Characteristics, and Population Projections of the United States by Age, Sex, Race, and Hispanic Origin: 1995 to 2050, Washington, DC, 2000.
Race With the increase in resident population, the U.S. will undergo significant demographic changes. These changes will be attributable to factors including growing racial and ethnic populations, aging of the country's citizens, increasing immigrant populations, and changing households. Table 2 includes the U.S. population and the percent of the total population by race, for census years 1980, 1990 and 2000. From 1980 to 2000, the makeup of the population decreased by about 13% for the white population, while the African-American population increased by about 4%, the American Indian and Alaska Native population increased by 50%, and the Asian and Pacific Islanders increased by 138%. Not shown in the table are the classifications “Some Other Race” and “Two or More Races” represented about 8% of the 2000 population.
3

Table 2. Total Resident Population and Percent of Total Population by Race.
Year
Total Population
White % of
Population
African American
% of Population
American Indian and
Alaska Native % of
Population
Asian/Pacific Islander a
% of Population
1980 226,546,199 85.9 11.8 0.6 1.6
1990 248,718,301 83.9 12.3 0.8 3.0
2000 281,421,906 75.1 12.3 0.9 3.8
a. Includes Asian, Native Hawaiian and Other Pacific Islander, and Other Pacific Islander. Source: U.S. Census Bureau, Profile of General Demographic Characteristics, Census Years 1980, 1990 and 2000.
As the makeup of the population continues to change, minority groups will constitute a growing proportion of the labor force. According to the U.S. Bureau of Labor Statistics, the “percentage of African American and non-Hispanics will grow by 15% between 1983 and 2004, while the percentage of Hispanic workers will increase by 35%. In 2004 it is projected that 11% [of the labor force] will be African American and non-Hispanics; 11% will be Hispanic; and 4% will be Asian and other non-Hispanics.” Aging A major factor for the increased percentage of the population over the age of 65 is that the population's life expectancies are increasing. While the current life expectancy for whites is 77, this age is expected to increase to 84 by 2050. Similarly, the life expectancy is projected to increase from 79 to 87 years for Hispanics, from 69 to 74 for African-Americans, from 82 to 86 for Asians, and from 76 to 82 for Native Americans. Along with the increased percentage of the population over the age of 65, the median age of the U.S. resident population will continue to increase. In 1980 the median age was 30; in 1990, 32.8; and in 2000, 35.3. This figure is projected to increase to 38.1 by the year 2050. In 1991, life expectancy at birth was 80 years for white females, 74 years for African-American females, 73 years for white males, and 65 years for African-American males (“Waves of Grey”). As illustrated in Table 3, the United States population is aging; the number of Americans 100 years or older has more than doubled since 1980 (“Waves of Grey”). In 1980, citizens over the age of 65 constituted 11.3% of the population; this figure rose to 12.5% of the population in 1990 and represents 12.4% of the population in 2000.
4

Table 3. Resident Population by Age, shown as a percent of the total population for 1980, 1990 and 2000.
Year
5-14 years
15-24 years
25-34 years
35-44 years
45-54 years
55-64 years
65-74 years
75-84 years
85 and
older 1980 13.8 % 20.5 % 16.4 % 11.4 % 10.1 % 9.6 % 6.9 % 3.4 % 1.0 %
1990 12.8 % 16.2 % 17.4 % 15.1 % 10.0 % 8.5 % 7.3 % 4.0 % 1.2 %
2000 14.6 % 13.9 % 14.2 % 16.0 % 13.4 % 8.6 % 6.5 % 4.4 % 1.5 %
Sources: U.S. Census Bureau, Statistical Abstract of the United States, Washington, D.C., 2001, and Profile of General Demographic Characteristics for 2000.
Changing Households In addition to adjustments in the composition of the resident population, the makeup of U.S. households is changing as well. The percent of households that consist of married couples has decreased from 61% of the population in 1980 to about 52% of the population in 2000. In 2000, the percent of households that had children under the age of 18 was 36%, the percent of householders living alone was 25.8%, while the percent of householders 65 years and older was 23%. The average household size was 2.6 persons. Table 4 provides a breakdown of the population by household unit. The data is shown as a percent of the total number of households for 1980, 1990, and 2000. In 2000, 68% of households consist of a family unit, 52% of households consist of married families, 12% of households consist of a female householder with no spouse present, 32% of households consist of non-family members, and 26% of households live alone. Comparing the 2000 data to the 1980 data, family households have dropped by 6% and non-family households have increased by 6%. Table 4. Types and Percent of Households for Census Years 1980, 1990 and 2000. Percent Distribution 1980 1990 2000 Family households..................................................... 74 71 68 With own children under 18........................... 38 35 33 Married-couple family........................................... 61 56 52 With own children under 18........................... 31 26 24 Female householder, no spouse present ................ 11 12 12 With own children under 18............................. 7 7 7 Nonfamily households............................................... 26 29 32 Living alone ................................................... 23 25 26
Sources: U.S. Census Bureau, Profile of General Demographic Characteristics for 2000, and Statistical Abstract of the United States 2001, Washington, D.C.
5
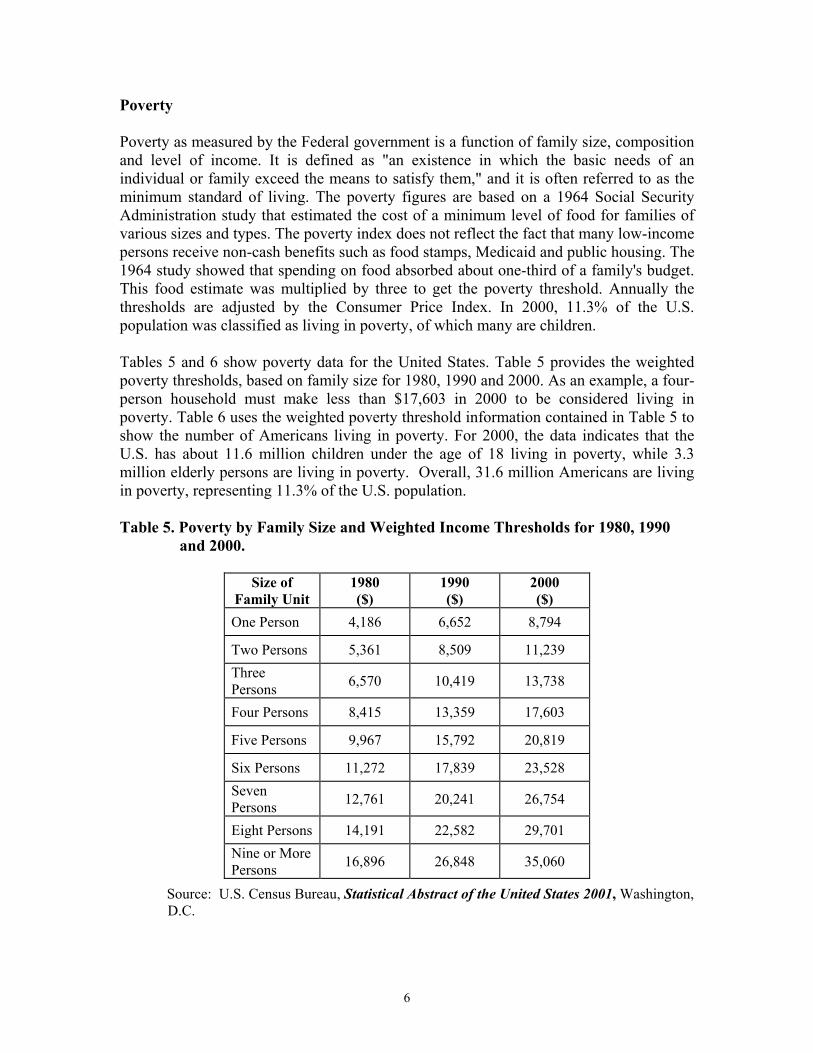
Poverty Poverty as measured by the Federal government is a function of family size, composition and level of income. It is defined as "an existence in which the basic needs of an individual or family exceed the means to satisfy them," and it is often referred to as the minimum standard of living. The poverty figures are based on a 1964 Social Security Administration study that estimated the cost of a minimum level of food for families of various sizes and types. The poverty index does not reflect the fact that many low-income persons receive non-cash benefits such as food stamps, Medicaid and public housing. The 1964 study showed that spending on food absorbed about one-third of a family's budget. This food estimate was multiplied by three to get the poverty threshold. Annually the thresholds are adjusted by the Consumer Price Index. In 2000, 11.3% of the U.S. population was classified as living in poverty, of which many are children. Tables 5 and 6 show poverty data for the United States. Table 5 provides the weighted poverty thresholds, based on family size for 1980, 1990 and 2000. As an example, a four-person household must make less than $17,603 in 2000 to be considered living in poverty. Table 6 uses the weighted poverty threshold information contained in Table 5 to show the number of Americans living in poverty. For 2000, the data indicates that the U.S. has about 11.6 million children under the age of 18 living in poverty, while 3.3 million elderly persons are living in poverty. Overall, 31.6 million Americans are living in poverty, representing 11.3% of the U.S. population. Table 5. Poverty by Family Size and Weighted Income Thresholds for 1980, 1990
and 2000.
Size of Family Unit
1980 ($)
1990 ($)
2000 ($)
One Person 4,186 6,652 8,794
Two Persons 5,361 8,509 11,239 Three Persons 6,570 10,419 13,738
Four Persons 8,415 13,359 17,603
Five Persons 9,967 15,792 20,819
Six Persons 11,272 17,839 23,528 Seven Persons 12,761 20,241 26,754
Eight Persons 14,191 22,582 29,701 Nine or More Persons 16,896 26,848 35,060
Source: U.S. Census Bureau, Statistical Abstract of the United States 2001, Washington, D.C.
6

Table 6. Number of Individuals Living in Poverty for 1980, 1990 and 2000.
Classification 1980 1990 2000 Children- under 18 years of age
11,223,000 12,715,000 11,587,000
Elderly- over 65 years of age 3,871,000 3,658,000 3,323,000
All Other 16,728,000 17,212,000 16,671,000
Sources: U.S. Census Bureau, Profile of General Demographic Characteristics for 2000, and Poverty in the United States, Washington, D.C.
Status of the U.S. Economy From July 1990 through February 1991, the economy went into a mild recession that caused an increase in unemployment of 2.5 million workers. For this period the unemployment rate increased from 5.5% to 6.7%. (A recession is defined as a period of significant decline in total output, income, employment and trade, usually lasting from 6 to 12 months.) Because the economic recovery was sluggish, the unemployment rate continued to grow to 7.4% in 1992 and did not fall to the pre-recession level until 1995-1996. Beginning in 1992, the unemployment rate decreased from a little more than 7% to 5.5%. Of the 8.4 million jobs created between 1992 and 1995, over 3 million were high-wage jobs. Such an increase in this type of employment necessitates the need to educate and train the workforce. In 1996 the 10 million low-wage earners saw the minimum wage rate increase from $4.25 to $4.75 per hour; in 1998 it increased to $5.15 per hour. These increases were implemented to offset the decline in purchasing power that resulted from inflation. In March 1991 the economy began the longest expansion in U.S. economic history, lasting 10 years. During this expansion phase, nearly 19 million jobs were created. In 2000, the unemployment rate declined to 3.9%. In March 2001 the economy returned to recession. Coupled with the terrorist attack on September 11th, the economy became more sluggish. Consumer confidence declined, which caused further erosion in spending—it must be noted that consumers continue to buy at discounted prices that cause business profits to decline. Also impacted by the economic slowdown and perceived financial corruption in “Corporate America,” the stock market has been negatively impacted. As of September 2002, the stock market has lost about $7 trillion from the previous base high-year. Two positive aspects of the U.S. economy are the vast quantity of goods that are available at reasonable prices. The Consumer Price Index (CPI), the most widely used index for measuring inflation, has shown stability throughout the 1990s and early 2000s. Since 1991, the CPI has ranged from 1.6% to 3.4%, with a 10-year average of 2.7%.
7

Data contained in Table 7 shows some of the key economic indicators for the U.S. economy for 1980, 1990, and 2000. The data indicates that real Gross Domestic Product (rGDP) has doubled from 1980 to 2000. Real GDP is defined as “the inflation adjusted value of actual production of goods and services produced in an economy in one year.” Positive features of the strong economy include a labor force that has grown by nearly 32%, an unemployment rate that has fallen from 7% to 4%, and an inflation rate that has decreased from 13.5% to 3.4%. However, the U.S. faces two major economic problems—international trade deficits and the national debt. Both have created financial problems for the U.S. economy. Annual trade deficits have grown from nearly $15 billion in 1980, to $71 billion in 1990, to $370 billion in 2000. The global trading system has made the U.S. the number one debtor nation at a cost of about 20,000 U.S. jobs per $1 billion in negative trade. The national debt has also grown from $0.9 trillion in 1980 to $5.6 trillion in 2000. Table 7. Key Economic Indicators for 1980, 1990 and 2000.
Economic Indicators 1980 1990 2000
rGDP a $4,611.9 $6,138.7 $9,191.4
% Inflation 13.5 5.4 3.4
Labor Force 106,900,000 124,800,000 140,863,000 % Unemployed 7.1 5.5 4.0
Trade Deficit a
($14.9) ($71.3) ($370.4)
National Debt a
$909.1 $3,206.6 $5,629.0
a Shown in Billions. Source: Federal Reserve Board, Federal Reserve Bulletin, Washington, D.C.
The strength or weakness of the U.S. economy (measured by GDP) is a function of four variables: consumer spending, investments, government spending, and net exports. From an historical perspective, the U.S. economy has been driven by consumer spending at about 65% of GDP, private sector investment at 15%, and government spending at 20%. As previously mentioned, net exports (trade deficits) have a negative impact on the economy, thus reducing GDP. Future U.S. growth rates will be influenced by what the federal government does with taxes, spending, and international trade policies. Prior to 2001, marginal tax rates ranged from 15% to 39.6%. In 2001, a 10-year tax reduction program was passed into law with a goal to reduce the range of marginal tax rates from 10% to about 35%. However, with the return of federal budget deficits there appears to be a movement toward revising the 10-year program. Government spending (post 9/11) will increase due to homeland security costs and the possibility of military conflict with nations that harbor terrorist groups. Lastly, as other nations show signs of economic growth the U.S. should see an increase in the demand for U.S.-manufactured
8
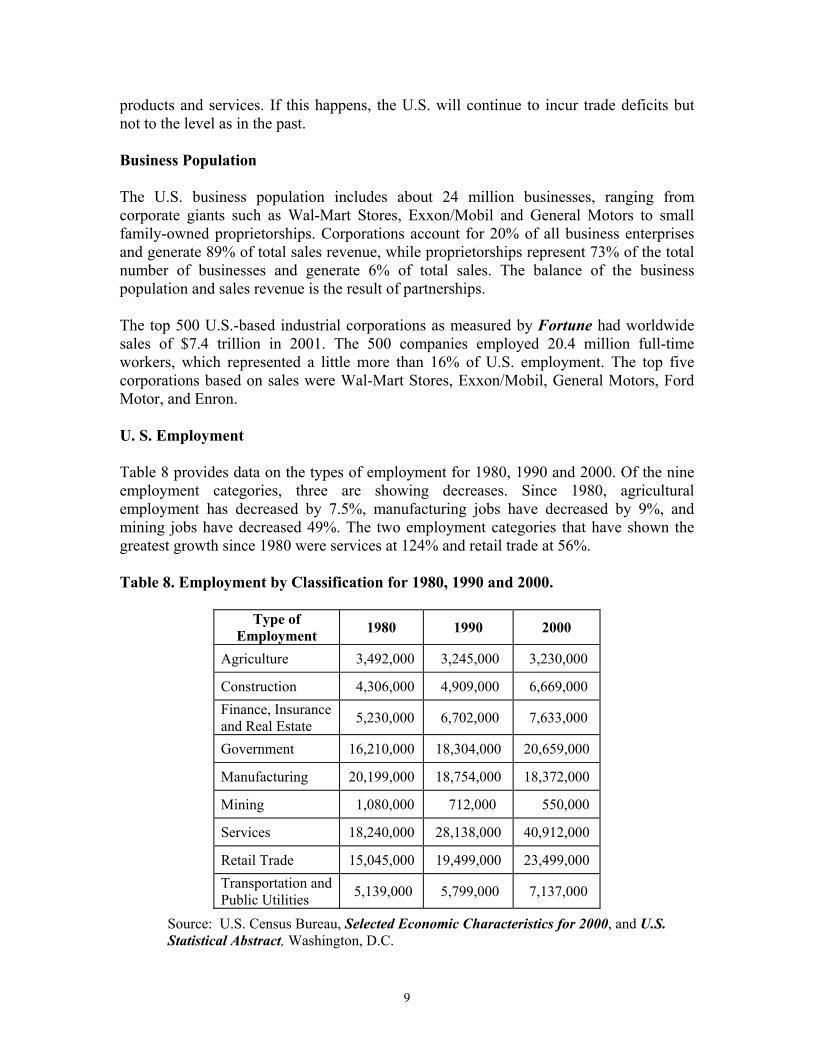
products and services. If this happens, the U.S. will continue to incur trade deficits but not to the level as in the past. Business Population The U.S. business population includes about 24 million businesses, ranging from corporate giants such as Wal-Mart Stores, Exxon/Mobil and General Motors to small family-owned proprietorships. Corporations account for 20% of all business enterprises and generate 89% of total sales revenue, while proprietorships represent 73% of the total number of businesses and generate 6% of total sales. The balance of the business population and sales revenue is the result of partnerships. The top 500 U.S.-based industrial corporations as measured by Fortune had worldwide sales of $7.4 trillion in 2001. The 500 companies employed 20.4 million full-time workers, which represented a little more than 16% of U.S. employment. The top five corporations based on sales were Wal-Mart Stores, Exxon/Mobil, General Motors, Ford Motor, and Enron. U. S. Employment Table 8 provides data on the types of employment for 1980, 1990 and 2000. Of the nine employment categories, three are showing decreases. Since 1980, agricultural employment has decreased by 7.5%, manufacturing jobs have decreased by 9%, and mining jobs have decreased 49%. The two employment categories that have shown the greatest growth since 1980 were services at 124% and retail trade at 56%. Table 8. Employment by Classification for 1980, 1990 and 2000.
Type of Employment 1980 1990 2000
Agriculture 3,492,000 3,245,000 3,230,000
Construction 4,306,000 4,909,000 6,669,000 Finance, Insurance and Real Estate 5,230,000 6,702,000 7,633,000
Government 16,210,000 18,304,000 20,659,000
Manufacturing 20,199,000 18,754,000 18,372,000
Mining 1,080,000 712,000 550,000
Services 18,240,000 28,138,000 40,912,000
Retail Trade 15,045,000 19,499,000 23,499,000 Transportation and Public Utilities 5,139,000 5,799,000 7,137,000
Source: U.S. Census Bureau, Selected Economic Characteristics for 2000, and U.S. Statistical Abstract, Washington, D.C.
9
Unemployment Unemployment is defined by the U.S. Census Bureau as involving “those individuals actively seeking employment.” In 1980, the number of unemployed represented 7.1% of the labor force, or about 7.6 million people. In 1990, the unemployment rate dropped to 5.5%, or about 6.9 million individuals. The 2000 unemployment rate was 4% and represented 5.6 million Americans. Of the unemployed, the classifications most impacted are persons between the ages of 16 and 19, female head of households, and minorities. Productivity Clearly, the U.S. economy is the most productive economy in the world. Productivity is defined as “output per unit of input, or the efficiency with which resources are used.” Quite often it is referenced as “output per labor hour.” From 1980 to 1990, the non-farm business sector increased productivity by 16.2%, or 1.5% per year. From 1990 to 2000 productivity increased 21.9%, or 2% per year. These figures show that the U.S. was utilizing fewer resources per hour to produce more goods and services. The use of computer driven technologies was the primary reason for this growth factor. Future U.S. productivity will be influenced by two key variables: the quantity of money invested for technological upgrades and how much is invested in education and training of the labor force. The U.S. Department of Labor estimates that future job creation will occur in small to medium sized companies as the global economy becomes more competitive. Often this is referenced as “outsourcing.” A business that wants to compete in the global economy must become more efficient and lower its cost of production, generally implying a reduction in the size of a company’s labor force. As workers are terminated, they may need to be re-educated and re-trained for new occupations, most likely at a community college. Personal Income For 1999, 9.2% of families had personal income of less than $10,000, 59.1% received less than $50,000, 18.4% had income between $50,000 and $75,000, and 22.6% made more than $75,000. Referenced another way, the data indicates that for every 100 families, 59 families receive less than $50,000, while 41 families receive more than $50,000. Table 9 breaks down personal income by percent of families.
10

Table 9. Distribution of Personal Income for 1999.
Personal Income % of Families
Under $10,000 9.2
10,000 - $14,999 7.3
$15,000 - $24,999 14.1
$25,000 - $34,999 12.7
$35,000 - $49,999 15.8
$50,000 - $74,999 18.4
$75,000 and Over 22.6
Source: U.S. Census Bureau, Statistical Abstract of the United States 2001, Washington, D.C. Table 10 provides personal income data by quintile, and for the top 5% of the population for 1980, 1990 and 1999. Since 1980 the lowest quintile has decreased from 5.1% to 4.3%, while the highest quintile has increased from 41.6% to 47.2%. The top 5% of families have grown from 14.6% to 20.3%. The drop in the lowest quintile and the increases in the highest quintile and top 5% were influenced by the two economic expansions that occurred in the 1980’s and 1990’s. Table 10. Distribution of Income, by Quintile and Top 5%, for 1980, 1990 and 1999.
Quintile 1980 1990 2000
Lowest 20% 5.1 4.6 4.3
Second 20% 11.6 10.8 9.9
Third 20% 17.5 16.6 15.6
Fourth 20% 24.3 23.8 23.0
Highest 20% 41.6 44.3 47.2
Top 5% 14.6 17.4 20.3
Source: U.S. Census Bureau, Statistical Abstract of the United States 2001, Washington, D.C. The United States and the Global Economy The movement toward a global economy affects Americans on a daily basis. With global production and consumption of goods and services, the citizenry of the world is interwoven with other economic systems. The spectrum covers the movement of goods and services in and out of an economic system, the production of goods and services by transnational corporations located around the globe, joint ventures among the world’s largest firms, and direct links among the world’s largest financial institutions. This new configuration is so complex that determining what is and what is not a U.S.-manufactured
11

product is almost impossible to determine. The reality is that many products consumed in the United States were made from component parts manufactured around the world. Consumers want the best quality products at the lowest prices, with minimal concern about where they were manufactured. This trend will ultimately increase the demand for service-related jobs. Today, the seven largest economic systems, often referred to as the “G-7 Nations,” account for about 50% of the world’s exports. Of these, the United States, Germany, and Japan are the world’s largest exporters, with about $1.2 trillion in merchandise trade. The U.S. accounts for about 40% of this total and further represents about 13% of the world’s total exports. The United States
1. is the world’s largest exporter and importer of goods and services; 2. has nearly 15% of its Gross Domestic Product from exports; 3. has the majority of its trade with other advanced economic systems; 4. includes among its primary exports chemicals, computers, household
durable goods, and airplanes; 5. includes among its primary imports vehicles, crude petroleum,
computers, and textiles; 6. has trade deficits of $200-$400 billion annually; and 7. has become the number one debtor nation due to cumulative trade
deficits. With the movement to a global arena, the leading economies of the world are aligning themselves into regional alliances or regional trading blocs. Throughout the world, three major trading blocs are developing. The first is the North American Free Trade Agreement (NAFTA) consisting of the United States, Canada and Mexico. This bloc is a market of 400 million consumers, with the potential of growing to 800 million people. Any increase in size would include the Latin America and Caribbean regions. The fourth member of NAFTA will likely be Chile. The second major trading center is the European Union (EU), consisting of 15 nations. This bloc has 400 million people. In the future, the EU will attempt to bring an additional 15 nations from eastern Europe and possibly Russia into the union. This market could grow to 800 million people. Of the three major trading blocs, the EU has moved the closest to attaining “Economic Union” status. This allows member nations the free flow of goods and services, the free flow of economic resources (including workers), unified monetary and fiscal policies, and mutual trade policies within the bloc. The third major bloc is the Pacific Rim that consists of 18 countries. These countries extend from China, through South Korea, Japan, Taiwan, the Philippines, Indonesia, and Australia. The market has approximately 2.1 billion consumers. Eventually, India is likely to join the bloc, adding another one billion consumers to the market. (This region represents 50% of the world’s population.) The United States and Canada, through the 21-member Asian Pacific Economic Cooperation (APEC), are negotiating trade agreements with the Pacific Rim region. This regional economy is expected to increase its share of imports by 40% by the year 2010.
12

Ultimately, nations need to guarantee that all trading partners are using the same rules, standards, and regulations. These goals will be accomplished through the General Agreement on Tariffs and Trade (GATT). GATT presently has 143 member nations. China, the most recent member, was admitted in November 2001. GATT eliminates most trade barriers, promotes the free flow of goods and services, and protects intellectual property. In 1995 the World Trade Organization (WTO) was given the responsibility of resolving trade disputes. Today GATT is referenced as the WTO. When the WTO policies are fully implemented, it is estimated that the world’s total output of goods and services will increase by about 25%.
II. THE STATE AND RCC DISTRICT Illinois With a 2000 population of 12,419,292, Illinois is the fifth most populous state in the nation. Chicago, with a population of nearly 3 million, is the third largest city in the United States. Illinois is a study in contrasts—most of the state consists of fertile, level plains with more than 275 rivers. Although agriculture and agribusiness play important roles in the state’s economy, almost 85% of the people reside in an urban environment. Illinois is the third largest state based on Gross State Product (GSP), ranking behind California and Texas. In 2000 the state’s GSP was $441.5 billion, representing nearly 5% of U.S. Gross Domestic Product. Since 1990, the state’s economy grew by $123.6 billion, or 39%. For this same time period, the U. S. economy grew by 40.5%. Illinois is recognized for its highly productive economy and labor force. The economic base consists of agriculture, manufacturing, machinery, electrical and electronic equipment, steel and other metals, chemicals, and finance. Illinois is also a major agricultural producer of soybeans, corn, pork, and ethanol. According to Fortune, 36 of the 500 largest industrial corporations are headquartered in Illinois. These 36 corporations have annual sales of more than $500 billion. Caterpillar, Inc., headquartered in Peoria, is the 98th largest corporation with annual sales of $20.5 billion and is the largest employer in Illinois with 24,000 employees. Archer Daniels Midland Corporation, headquartered in Decatur, is the 100th largest corporation with annual sales of $20.1 billion and is the 7th largest employer in Illinois with 8,500 employees. A. E. Staley Manufacturing Company (not included in the Fortune 500) is headquartered in Decatur and has annual sales of more than $1 billion. Although the Illinois economy is known for its productivity, wide variations in local economies and property values exist. Communities in the Chicago area have some of the highest property values, while some communities in central and southern Illinois struggle with low property values and economic hard times. Illinois and the Global Economy Illinois Department of Commerce and Community Affairs (DCCA) data show that in 2001 Illinois exported nearly $32 billion in goods and services. The top five industries
13
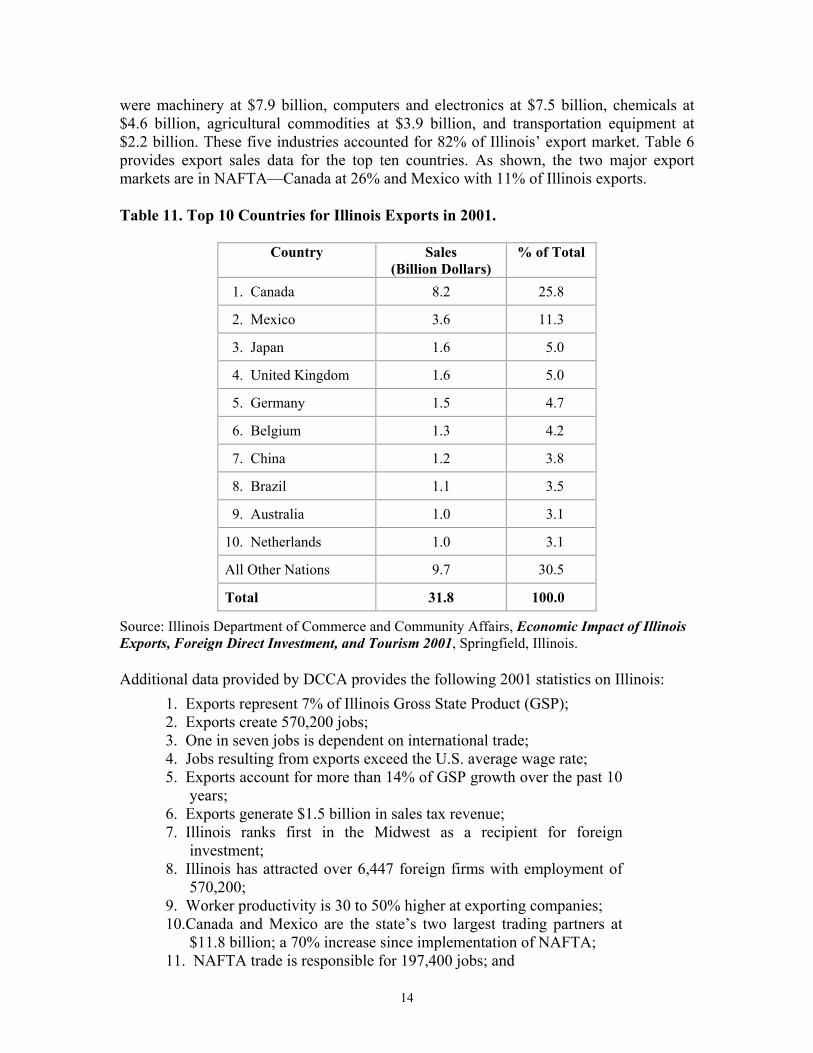
were machinery at $7.9 billion, computers and electronics at $7.5 billion, chemicals at $4.6 billion, agricultural commodities at $3.9 billion, and transportation equipment at $2.2 billion. These five industries accounted for 82% of Illinois’ export market. Table 6 provides export sales data for the top ten countries. As shown, the two major export markets are in NAFTA—Canada at 26% and Mexico with 11% of Illinois exports. Table 11. Top 10 Countries for Illinois Exports in 2001.
Country Sales (Billion Dollars)
% of Total
1. Canada 8.2 25.8
2. Mexico 3.6 11.3
3. Japan 1.6 5.0
4. United Kingdom 1.6 5.0
5. Germany 1.5 4.7
6. Belgium 1.3 4.2
7. China 1.2 3.8
8. Brazil 1.1 3.5
9. Australia 1.0 3.1
10. Netherlands 1.0 3.1
All Other Nations 9.7 30.5
Total 31.8 100.0
Source: Illinois Department of Commerce and Community Affairs, Economic Impact of Illinois Exports, Foreign Direct Investment, and Tourism 2001, Springfield, Illinois. Additional data provided by DCCA provides the following 2001 statistics on Illinois:
1. Exports represent 7% of Illinois Gross State Product (GSP); 2. Exports create 570,200 jobs; 3. One in seven jobs is dependent on international trade; 4. Jobs resulting from exports exceed the U.S. average wage rate; 5. Exports account for more than 14% of GSP growth over the past 10
years; 6. Exports generate $1.5 billion in sales tax revenue; 7. Illinois ranks first in the Midwest as a recipient for foreign
investment; 8. Illinois has attracted over 6,447 foreign firms with employment of
570,200; 9. Worker productivity is 30 to 50% higher at exporting companies; 10.Canada and Mexico are the state’s two largest trading partners at
$11.8 billion; a 70% increase since implementation of NAFTA; 11. NAFTA trade is responsible for 197,400 jobs; and
14

12. Illinois hosted nearly two million foreign visitors, primarily from Canada, Mexico, United Kingdom, and Germany.
Richland Community College District Richland Community College #537 (RCC) serves an eight-county district in central Illinois. The RCC District includes all of Macon County and most of DeWitt County. RCC boundaries also extend into the counties of Christian, Logan, Moultrie, Piatt, Sangamon, and Shelby. RCC was formed by referendum in 1971 and included the Decatur Public School Unit District #61. Over the next few years, RCC solicited adjoining school districts to join and by 1974, they did. In 1990, Wapella was annexed to the RCC district. RCC serves a population of about 140,000 and covers approximately 1,114 square miles. Even though RCC includes eight counties, more than 90% of the District’s tax base and population are located in Macon and DeWitt Counties. The following sections will compare various demographic characteristics between Macon and DeWitt Counties, the state of Illinois, and the United States. Population Changes From 1980 to 2000 the United States population increased by 23%, while the population of Illinois increased by nearly 8.7%. During this same time period, both Macon and DeWitt Counties experienced decreases in population of -12.9% and -7.1% respectively. The loss of 17,979 people is generally attributed to the loss of employment in the region. The reductions in population were felt by municipalities, schools, and other public and private entities. RCC was no exception, with declines in 10th day headcount enrollment from the early 1990s to 2000. As a reference, in 1992 the headcount enrollment peaked at 4,110 and declined to 3,090 in 1999, a 25% decrease in enrollment. In terms of population characteristics, the age distribution in Illinois mirrors that of the United States. With a few minor exceptions, the age distribution in DeWitt and Macon counties is similar to that of the state and country. In the two-county area, about 33% of the population is under 25, about 40% is between the ages of 25 and 55, and 27% is age 55 or older. Based on gender per 100 individuals, about 49 are male and 51 are female at the county, state, and national levels. Both Macon and DeWitt Counties are predominantly white, although DeWitt County is well above the national average. In DeWitt County, whites account for 97.8% of the population, while in Macon County whites represent 83.5% of the population. Illinois has a slightly higher percentage of African-Americans (14.8%) than the United States as a whole (12.1%). In Macon County, African-Americans represent 12.1% of the population, while in DeWitt County, African-Americans account for 0.5%. Asian, American Indian/Alaska Native and other ethnicities represent 0.9% of the population in DeWitt County and 2.4% of the population in Macon County. Based on the data, the RCC District 3537 is less racially diverse than both the state and country. Table 12 provides selected demographic data for DeWitt and Macon Counties, the state of Illinois and the United States for 1980, 1990 and 2000.
15

Table 12. Selected Demographics for DeWitt and Macon Counties, Illinois, and the United States for 1980, 1990, and 2000.
DeWitt
County Macon County
Illinois
United States
Population:
2000 16,798 114,706 12,419,293 281,421,906
1990 16,516 117,206 11,430,602 248,709,873
1980 18,108 131,375 11,427,409 226,542,199
% Change (1980 to 1990) -8.8 -10.8 0.0 9.8 % Change (1990 to 2000) 1.7 -2.1 8.6 13.2
% Age Distribution in 2000
Under 5 6.2 6.4 7.1 6.8
5 – 9 6.9 6.9 7.5 7.3
10 – 14 7.0 7.1 7.3 7.3
15 – 19 6.9 7.3 7.2 7.2
20 – 24 5.2 6.7 6.9 6.7
25 – 34 12.3 11.6 14.6 14.2
35 – 44 16.0 14.8 16.0 16.0
45 – 54 13.2 14.4 13.1 13.4
55 – 59 5.6 5.3 4.7 4.8
60 – 64 4.7 4.3 3.7 3.8
Over 65 15.8 15.3 12.0 12.4
% Males to Females in 2000 48.9 47.7 49.0 49.1
Population by Race in 2000
White 97.8 83.5 73.5 75.1
African American 0.5 14.1 15.1 12.3
Asian 0.3 0.6 3.4 3.6
Am. Indian / Alaska Native 0.2 0.2 0.2 0.9
Other 0.2 1.6 7.8 8.1
Sources: U.S. Census Bureau, Profile of General Demographic Characteristics for 2000, and Census data for 1980 and 1990.
16

Table 13 provides population data on the county and portion of the counties that make up the RCC district for 1980, 1990 and 2000. Of the 8 counties, 7 show decreases in population from 1980 to 2000, while Sangamon County shows an increase. Overall, the 8 counties have seen a 1.85% decrease in population. (It must be noted, that over 90% of the RCC district is composed of DeWitt and Macon counties.) Table 13. Population for Counties within the Richland Community College District
for 1980, 1990, 2000.
County 1980 1990 2000 Christian 36,446 34,418 35,372 DeWitt 18,106 16,516 16,798 Logan 31,802 30,798 31,183 Macon 131,375 117,206 114,706 Moultrie 14,546 13,930 14,287 Piatt 16,581 15,548 16,365 Sangamon 176,070 178,386 188,951 Shelby 23,923 22,261 22,893 Total 448,849 429,063 440,555
Sources: U.S. Census Bureau, Profile of General Demographic Characteristics for 2000 and Census data for 1980 and 1990.
Population Projections Table 14 shows population data for the eight counties in the RCC District. Based on the data contained in the table, Macon County will see an increase in population of 2.9% from 2000 to 2005. DeWitt County’s population is estimated to decrease by -3.1% for this same period. Most of the remaining counties will have an increase in population, but determining if the increases are in those areas that are part of the RCC District is difficult. Overall, the 8-county area may have a 3.3% increase in population.
Table 14. Population Projections for Counties within the Richland Community College District in 2005.
County 2000 2005 % Change
Christian 35,372 35,054 -0.9 DeWitt 16,798 16,282 -3.1 Logan 31,183 32,994 5.8 Macon 114,706 118,073 2.9 Moultrie 14,287 14,223 -0.4 Piatt 16,365 16,478 0.7 Sangamon 188,951 198,677 5.1 Shelby 22,893 23,101 0.9 Total 440,555 454,882 3.3
Sources: U.S. Census Bureau, Profile of General Demographic Characteristics for 2000, and Census data for 1980 and 1990.
17
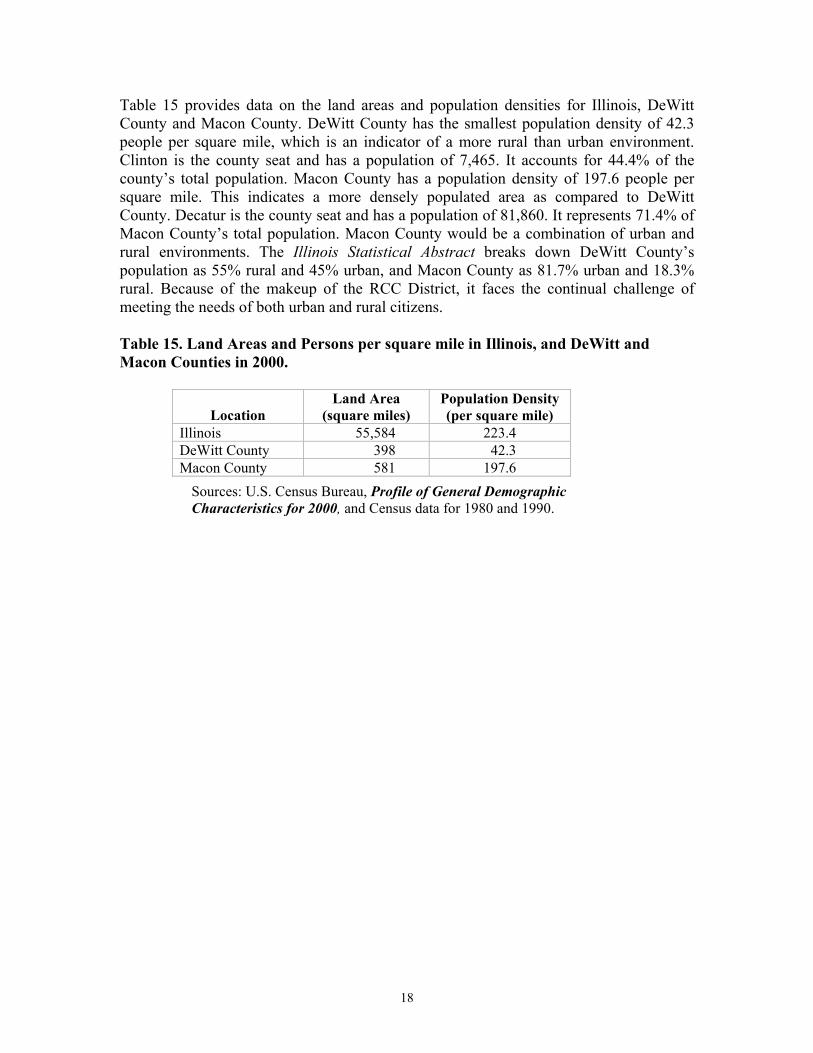
Table 15 provides data on the land areas and population densities for Illinois, DeWitt County and Macon County. DeWitt County has the smallest population density of 42.3 people per square mile, which is an indicator of a more rural than urban environment. Clinton is the county seat and has a population of 7,465. It accounts for 44.4% of the county’s total population. Macon County has a population density of 197.6 people per square mile. This indicates a more densely populated area as compared to DeWitt County. Decatur is the county seat and has a population of 81,860. It represents 71.4% of Macon County’s total population. Macon County would be a combination of urban and rural environments. The Illinois Statistical Abstract breaks down DeWitt County’s population as 55% rural and 45% urban, and Macon County as 81.7% urban and 18.3% rural. Because of the makeup of the RCC District, it faces the continual challenge of meeting the needs of both urban and rural citizens. Table 15. Land Areas and Persons per square mile in Illinois, and DeWitt and Macon Counties in 2000.
Location
Land Area (square miles)
Population Density (per square mile)
Illinois 55,584 223.4 DeWitt County 398 42.3 Macon County 581 197.6
Sources: U.S. Census Bureau, Profile of General Demographic Characteristics for 2000, and Census data for 1980 and 1990.
18

Level of Education Table 16 provides data on educational achievement in DeWitt and Macon Counties, the state of Illinois and the United States for 1990 and 2000. In 1990, DeWitt and Macon Counties’ educational attainment at the high school level is comparable to the state and national levels, while individuals with bachelor’s degrees or higher show a difference from national and state norms. Among adults 25 years of age and older, at the national and state levels, 20.3% and 21% respectively have earned a bachelor’s degree or more. In Macon and DeWitt counties, the figures are much lower at 14.8% and 11.8%, respectively. Possible reasons for these differentials include the lower level of educational skills traditionally required in a manufacturing environment and the possibility that college graduates leave the area after earning their degrees. In 2000, the percentage increase in high school graduates was higher in DeWitt and Macon Counties as compared to Illinois and the United States. For college graduates, the percentage increased at the county, state and national levels, but it was more significant at the state and national levels. Whatever the reasons for the differentials in education, the data suggests there is a growing pool of adults in the RCC District that could benefit from further education. Table 16. Educational Attainment for DeWitt and Macon Counties, Illinois, and the United States as a Percent of the Population for 1990 and 2000.
Location
High School Graduate in
1990
Bachelor’s or Higher in 1990
High School Graduate in
2000
Bachelor’s or Higher in 2000
DeWitt County 74.6% 11.8% 83.5% 13.4% Macon County 76.2% 14.8% 83.2% 16.9% Illinois 76.2% 21.0% 81.4% 26.1% United States 75.2% 20.3% 80.4% 24.4%
Sources: U.S. Census Bureau, Profile of General Demographic Characteristics for 2000, and Census data for 1990.
19
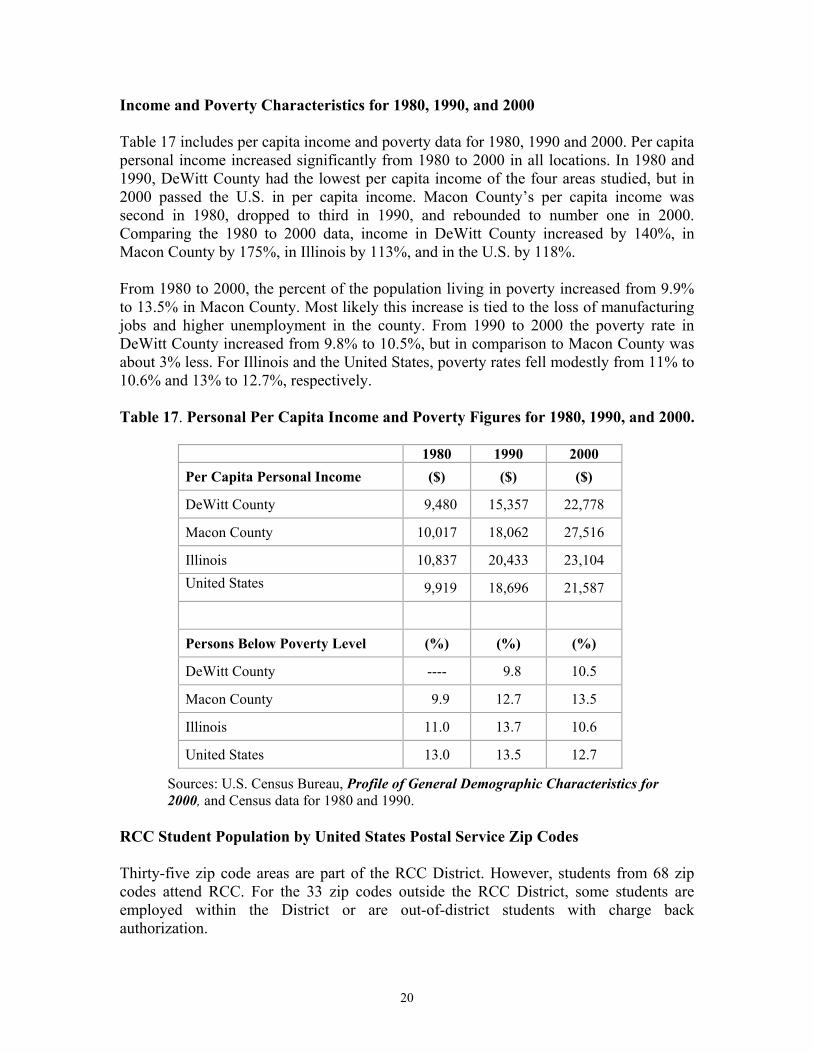
Income and Poverty Characteristics for 1980, 1990, and 2000 Table 17 includes per capita income and poverty data for 1980, 1990 and 2000. Per capita personal income increased significantly from 1980 to 2000 in all locations. In 1980 and 1990, DeWitt County had the lowest per capita income of the four areas studied, but in 2000 passed the U.S. in per capita income. Macon County’s per capita income was second in 1980, dropped to third in 1990, and rebounded to number one in 2000. Comparing the 1980 to 2000 data, income in DeWitt County increased by 140%, in Macon County by 175%, in Illinois by 113%, and in the U.S. by 118%. From 1980 to 2000, the percent of the population living in poverty increased from 9.9% to 13.5% in Macon County. Most likely this increase is tied to the loss of manufacturing jobs and higher unemployment in the county. From 1990 to 2000 the poverty rate in DeWitt County increased from 9.8% to 10.5%, but in comparison to Macon County was about 3% less. For Illinois and the United States, poverty rates fell modestly from 11% to 10.6% and 13% to 12.7%, respectively. Table 17. Personal Per Capita Income and Poverty Figures for 1980, 1990, and 2000.
1980 1990 2000 Per Capita Personal Income ($) ($) ($)
DeWitt County 9,480 15,357 22,778
Macon County 10,017 18,062 27,516
Illinois 10,837 20,433 23,104 United States 9,919 18,696 21,587
Persons Below Poverty Level (%) (%) (%)
DeWitt County ---- 9.8 10.5
Macon County 9.9 12.7 13.5
Illinois 11.0 13.7 10.6
United States 13.0 13.5 12.7
Sources: U.S. Census Bureau, Profile of General Demographic Characteristics for 2000, and Census data for 1980 and 1990.
RCC Student Population by United States Postal Service Zip Codes Thirty-five zip code areas are part of the RCC District. However, students from 68 zip codes attend RCC. For the 33 zip codes outside the RCC District, some students are employed within the District or are out-of-district students with charge back authorization.
20
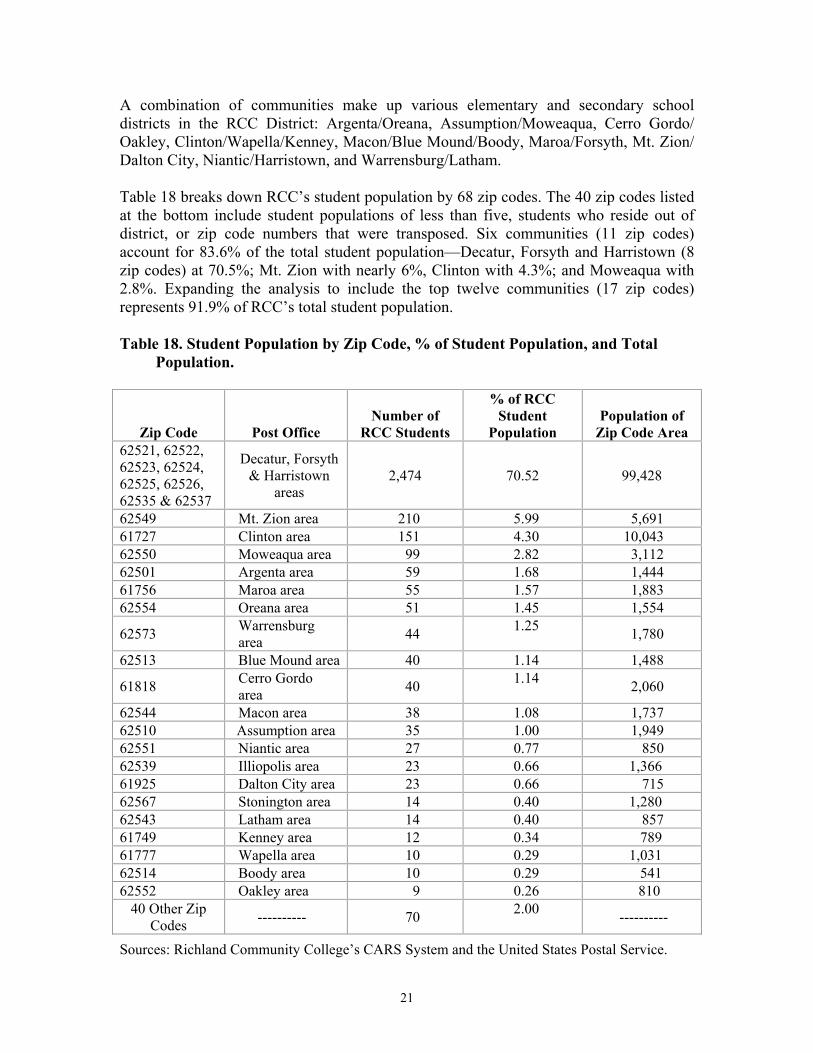
A combination of communities make up various elementary and secondary school districts in the RCC District: Argenta/Oreana, Assumption/Moweaqua, Cerro Gordo/ Oakley, Clinton/Wapella/Kenney, Macon/Blue Mound/Boody, Maroa/Forsyth, Mt. Zion/ Dalton City, Niantic/Harristown, and Warrensburg/Latham. Table 18 breaks down RCC’s student population by 68 zip codes. The 40 zip codes listed at the bottom include student populations of less than five, students who reside out of district, or zip code numbers that were transposed. Six communities (11 zip codes) account for 83.6% of the total student population—Decatur, Forsyth and Harristown (8 zip codes) at 70.5%; Mt. Zion with nearly 6%, Clinton with 4.3%; and Moweaqua with 2.8%. Expanding the analysis to include the top twelve communities (17 zip codes) represents 91.9% of RCC’s total student population. Table 18. Student Population by Zip Code, % of Student Population, and Total
Population.
Zip Code
Post Office
Number of
RCC Students
% of RCC Student
Population
Population of
Zip Code Area 62521, 62522, 62523, 62524, 62525, 62526, 62535 & 62537
Decatur, Forsyth & Harristown
areas 2,474 70.52 99,428
62549 Mt. Zion area 210 5.99 5,691 61727 Clinton area 151 4.30 10,043 62550 Moweaqua area 99 2.82 3,112 62501 Argenta area 59 1.68 1,444 61756 Maroa area 55 1.57 1,883 62554 Oreana area 51 1.45 1,554
62573 Warrensburg area 44 1.25 1,780
62513 Blue Mound area 40 1.14 1,488
61818 Cerro Gordo area 40 1.14 2,060
62544 Macon area 38 1.08 1,737 62510 Assumption area 35 1.00 1,949 62551 Niantic area 27 0.77 850 62539 Illiopolis area 23 0.66 1,366 61925 Dalton City area 23 0.66 715 62567 Stonington area 14 0.40 1,280 62543 Latham area 14 0.40 857 61749 Kenney area 12 0.34 789 61777 Wapella area 10 0.29 1,031 62514 Boody area 10 0.29 541 62552 Oakley area 9 0.26 810
40 Other Zip Codes ---------- 70 2.00 ----------
Sources: Richland Community College’s CARS System and the United States Postal Service.
21
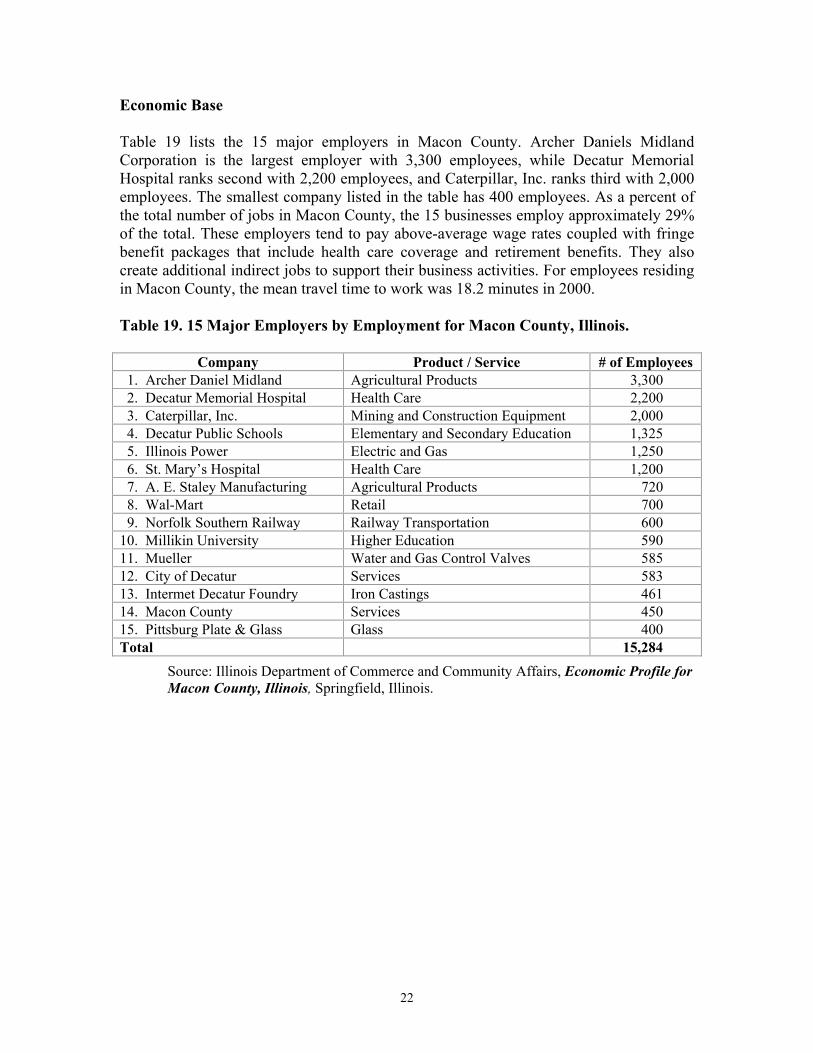
Economic Base Table 19 lists the 15 major employers in Macon County. Archer Daniels Midland Corporation is the largest employer with 3,300 employees, while Decatur Memorial Hospital ranks second with 2,200 employees, and Caterpillar, Inc. ranks third with 2,000 employees. The smallest company listed in the table has 400 employees. As a percent of the total number of jobs in Macon County, the 15 businesses employ approximately 29% of the total. These employers tend to pay above-average wage rates coupled with fringe benefit packages that include health care coverage and retirement benefits. They also create additional indirect jobs to support their business activities. For employees residing in Macon County, the mean travel time to work was 18.2 minutes in 2000. Table 19. 15 Major Employers by Employment for Macon County, Illinois.
Company Product / Service # of Employees 1. Archer Daniel Midland Agricultural Products 3,300 2. Decatur Memorial Hospital Health Care 2,200 3. Caterpillar, Inc. Mining and Construction Equipment 2,000 4. Decatur Public Schools Elementary and Secondary Education 1,325 5. Illinois Power Electric and Gas 1,250 6. St. Mary’s Hospital Health Care 1,200 7. A. E. Staley Manufacturing Agricultural Products 720 8. Wal-Mart Retail 700 9. Norfolk Southern Railway Railway Transportation 600 10. Millikin University Higher Education 590 11. Mueller Water and Gas Control Valves 585 12. City of Decatur Services 583 13. Intermet Decatur Foundry Iron Castings 461 14. Macon County Services 450 15. Pittsburg Plate & Glass Glass 400 Total 15,284
Source: Illinois Department of Commerce and Community Affairs, Economic Profile for Macon County, Illinois, Springfield, Illinois.
22

Table 20 lists the 14 major employers in DeWitt County. AmerGen Energy Corporation (formerly Illinois Power Company) is the largest employer with 750 workers. Clinton Public Schools ranks second with 329 employees. The smallest employer is Miller Container with 35 workers. These 14 employers provide jobs for about 28% of all employment in the county, and they further create additional indirect jobs that support their business activities. Much like Macon County, some employers tend to pay above-average wage rates coupled with fringe benefit packages that include health care coverage and retirement benefits. For employees residing in DeWitt County, the mean travel time to work was 21.4 minutes. Table 20. 14 Major Employers by Employment for DeWitt County, Illinois.
Company Product / Service # of Employees 1. AmerGen Energy Electric 750 2. Clinton Public Schools Elementary and Secondary Education 329 3. Wallace Computer Services Printed Business Forms 215 4. DeWitt County Services 200 5. Blue Ridge Public Schools Elementary and Secondary Education 180 6. Warner Hospital Health Care 180 7. Wal-Mart Retail 90 8. Action Technology Plastic Extrusion 85 9. Wackenhut Security 84 10. McElroy Metal Mill Fabrication 75 11. DeWitt County Nursing Home Health Care 70 12. McDonald’s Retail 46 13. BFI Stericycle Medical Waste Disposal 35 14. Miller Container Cardboard Boxes 35 Total 2,369
Source: Illinois, Department of Commerce and Community Affairs, Economic Profile for DeWitt County, Illinois, Springfield, Illinois.
23
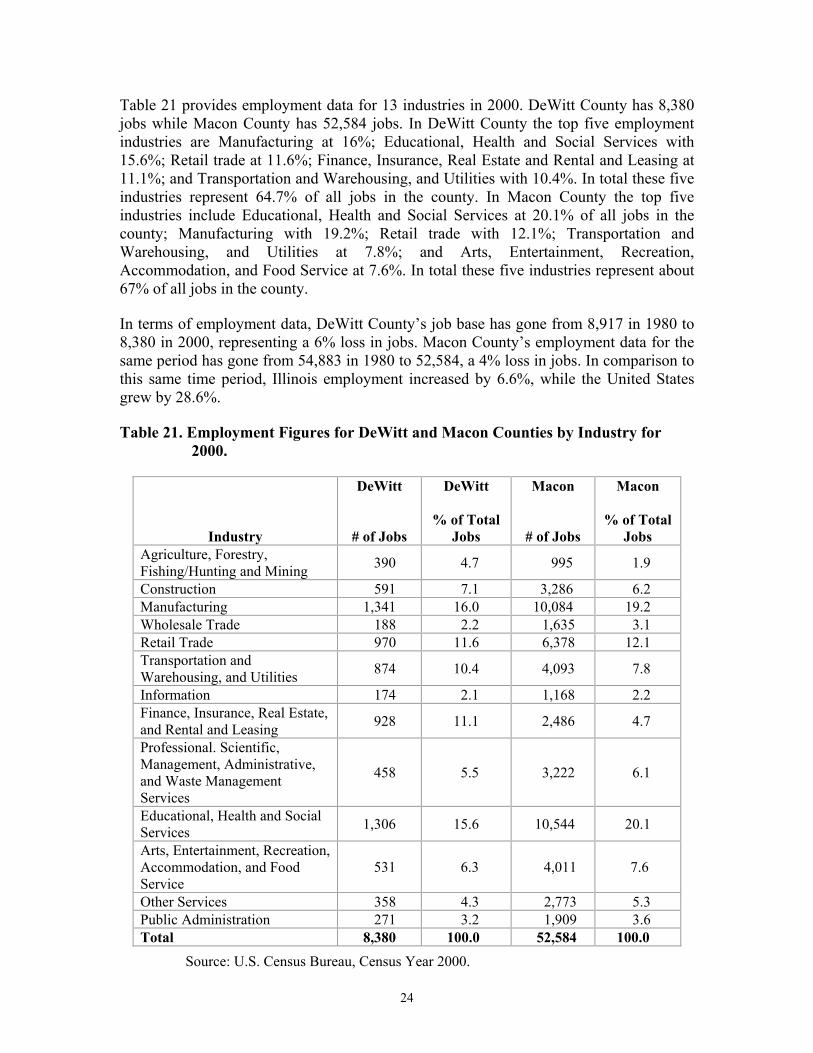
Table 21 provides employment data for 13 industries in 2000. DeWitt County has 8,380 jobs while Macon County has 52,584 jobs. In DeWitt County the top five employment industries are Manufacturing at 16%; Educational, Health and Social Services with 15.6%; Retail trade at 11.6%; Finance, Insurance, Real Estate and Rental and Leasing at 11.1%; and Transportation and Warehousing, and Utilities with 10.4%. In total these five industries represent 64.7% of all jobs in the county. In Macon County the top five industries include Educational, Health and Social Services at 20.1% of all jobs in the county; Manufacturing with 19.2%; Retail trade with 12.1%; Transportation and Warehousing, and Utilities at 7.8%; and Arts, Entertainment, Recreation, Accommodation, and Food Service at 7.6%. In total these five industries represent about 67% of all jobs in the county. In terms of employment data, DeWitt County’s job base has gone from 8,917 in 1980 to 8,380 in 2000, representing a 6% loss in jobs. Macon County’s employment data for the same period has gone from 54,883 in 1980 to 52,584, a 4% loss in jobs. In comparison to this same time period, Illinois employment increased by 6.6%, while the United States grew by 28.6%. Table 21. Employment Figures for DeWitt and Macon Counties by Industry for
2000.
Industry
DeWitt
# of Jobs
DeWitt
% of Total Jobs
Macon
# of Jobs
Macon
% of Total Jobs
Agriculture, Forestry, Fishing/Hunting and Mining 390 4.7 995 1.9
Construction 591 7.1 3,286 6.2 Manufacturing 1,341 16.0 10,084 19.2 Wholesale Trade 188 2.2 1,635 3.1 Retail Trade 970 11.6 6,378 12.1 Transportation and Warehousing, and Utilities 874 10.4 4,093 7.8
Information 174 2.1 1,168 2.2 Finance, Insurance, Real Estate, and Rental and Leasing 928 11.1 2,486 4.7
Professional. Scientific, Management, Administrative, and Waste Management Services
458 5.5 3,222 6.1
Educational, Health and Social Services 1,306 15.6 10,544 20.1
Arts, Entertainment, Recreation, Accommodation, and Food Service
531 6.3 4,011 7.6
Other Services 358 4.3 2,773 5.3 Public Administration 271 3.2 1,909 3.6 Total 8,380 100.0 52,584 100.0
Source: U.S. Census Bureau, Census Year 2000.
24

Table 22 lists the 20 industries projected to have the largest number of job openings in the RCC District. The table includes the occupation, number of annual job openings, and the percentage change in employment. The data estimates that 6,460 jobs could be created per year. The top five areas include eating and drinking places at 929 job openings per year, health services with 796 jobs, special trade contractors with 399 jobs, social services with 376 jobs, and educational services with 357 jobs. Table 22. Top 20 Industries Expected to Have the Largest Increase in Jobs in the
RCC District from 1998 to 2008.
Occupation
Annual Job
Openings
%
Change
1. Eating & Drinking Places 929 24.23 2. Health Services 796 14.66 3. Special Trade Contractors 399 18.37 4. Social Services 376 26.27 5. Educational Services 357 8.18 6. Merchandise Retail Trade 312 14.93 7. Local Government 260 8.22 8. Food Stores 240 15.41 9. Membership Organizations 191 13.25 10. Engineering, Accounting & Management Services 150 26.31 11. General Building Contractors 148 9.38 12. Personal Services 135 17.83 13. Automobile Repair 121 22.94 14. Miscellaneous Retail Stores 111 9.78 15. Hotels and Lodging 108 24.30 16. Amusement & Recreation 79 19.24 17. Food and Kindred Products 74 1.76 18. Durable Goods Wholesale Trade 74 5.18 19. Insurance Carriers 63 20.63 20. Nondurable Goods Wholesale Trade 58 5.05 Annual Jobs Created 6,460
Source: Illinois Department of Employment Security, Economic Information and Analysis Division, “Industry Projections 1998-2008 for Richland Community College District,” Springfield, Illinois, 2002.
25

Table 23 lists the ten industries that are projected to have the most job losses in the RCC district from 1998 to 2008. Total annual job losses could be about 700, with utilities and sanitary service losing 216, agricultural production losing 178, and durable goods manufacturing losing 132. Table 23. Top 10 Industries with the Greatest Decrease in Jobs in the RCC District
from 1998 to 2008.
Occupation
Annual Job Losses
% Change
1. Utilities and Sanitary Services - 216 - 8.55 2. Agriculture Production - 178 - 8.94 3. Durable Goods Manufacturing - 132 - 1.77 4. Apparel & Accessories Stores - 37 - 8.22 5. Machinery - 36 - 0.94 6. Private Household Services - 30 - 4.95 7. Printing & Publishing - 23 - 2.78 8. Railroad Transportation - 22 - 3.69 9. Depository Institutions - 20 - 1.76 10. Federal Government - 8 - 8.69 Annual Jobs Lost 702
Source: Illinois Department of Employment Security, Economic Information and Analysis Division, Industry Projections 1998-2008 for Richland Community College District, Springfield, Illinois, 2002.
Table 24 shows unemployment data for DeWitt and Macon Counties, Illinois and the United States for 1980, 1990, and 2000. Comparing unemployment data for 1980 and 1990 indicates that Macon County has had higher unemployment rates than at the state and national levels. Since 1980, Macon County has reduced its unemployment rate from 11.1% to 5.1%. This change most likely resulted from a combination of new job openings and individuals moving out of Macon County to accept new jobs. In 1980 and 1990, DeWitt County’s unemployment rates have been comparable to the state’s levels. In 2000, the county’s unemployment rate increased to 7.4%, which is 3% above the state’s average. Since 1980, the county has reduced its unemployment rate from 8.4% to 7.4%. Table 24. Unemployment Rates for the United States, Illinois, Macon and DeWitt Counties, for 1980, 1990 and 2000.
1980 Unemployment
Rate
1990 Unemployment
Rate
2000 Unemployment
Rate DeWitt 8.4% 6.1% 7.4% Macon 11.1% 7.1% 5.1% Illinois 8.3% 6.2% 4.4% United States 7.1% 5.5% 4.0%
Source: U.S. Census Bureau, Census Years 1980, 1990 and 2000.
26

Table 25 provides annual job openings and hourly wage rates for 12 occupations for community college graduates with an Associate’s degree. The most job openings (6,427) will occur in 7 health professions such as registered nurses, technicians, hygienists, and practitioners. Depending on the type of health profession chosen, the entry-level hourly wage rate is $7.81 and increases to an experienced level rate of $27.69 per hour. Computer support specialists will have 1,743 job openings per year with an hourly wage range from $11.57 to $23.60. The third growth area with 343 jobs per year is electrical and electronic engineering technicians’ with an hourly wage range of $13.09 to $21.80. The dental hygienists profession has the highest hourly wage rate at $27.69, followed by civil engineering technicians at $24.76, and registered nurses at $24.54. Table 25. Employment and Wage Projections for Graduates with an Associate’s
Degree.
Occupation
Annual
Openings
Hourly Wage Rates Entry – Experienced
1. Registered Nurses 4,151 $16-29 - $24.54 2. Computer Support Specialists 1,743 $11.57 - $23.60 3. Health Diagnosis & Treatment Technicians 624 $7.81 - $19.79 4. Medical Records & Health Information Technicians 624 $7.81 - $19.79 5. Electrical & Electronic Engineering Technicians 343 $13.09 – $21.80 6. Dental Hygienists 337 $16.66 - $27.69 7. Medical & Clinical Lab Technicians 249 $10.23 - $15.64 8. AO Drafters, Engineers & Mapping Technicians 247 $12.81 - $22.71 9. Radiological Technologists and Technicians 243 $12.81 - $19.13 10. Life, Physical & Social Science Technicians 225 $8.72 - $20.48 11. Civil Engineering Technicians 218 $14.20 - $24.76 12. Healthcare Practitioners & Technical Workers 199 Not Available
Source: Illinois Department of Employment Security, Economic Information and Analysis Division, Illinois Job Outlook, Springfield, Illinois, 2002.
27

Table 26 provides annual job openings and hourly wage rates for 24 occupations for college graduates with a Bachelor’s degree. The most job openings (6,785) will occur in the teaching profession with an entry-level hourly wage rate of $12.65. Teachers with experience can expect to make $29.39 per hour. Registered nurses will be needed to fill 4,151 job openings per year with an hourly wage rate from $16.29 to $24.54. The third growth area with 3,169 jobs per year is business operations specialists with an hourly wage range of $14.71 to $28.59. The highest hourly wage rate is found in the securities, communication and financial services sales markets at $46.48; followed by computer software engineers at $39.19; and computer systems analysts at $37.01. Table 26. Employment and Wage Projections for Graduates with a Bachelor’s
Degree.
Occupation
Annual
Openings
Hourly Wage Rates Entry - Experienced
Registered Nurses 4,151 $16-29 - $24.54 Business Operations Specialists 3,169 $14.71 - $28.59 Elementary School Teachers 2,245 $12.65 - $23.13 Secondary School Teachers 1,818 $13.53 - $29.39 Computer Software Engineers 1,778 $24.33 - $36.01 Computer Systems Analysts 1,581 $21.62 - $37.01 AO Teachers, Primary, Secondary Adult 1,429 $9.18 - $22.60 Accountants and Auditors 1,330 $13.93 - $25.92 Computer Programmers 835 $18.28 - $31.63 Middle School Teachers 834 $13.21 - $23.22 Network & Computer Systems Administrators 787 $17.90 - $31.61 AO Counselors, Social & Religious Workers 557 $8.64 - $17.23 Computer Software Engineers 551 $22.44 - $39.19 Financial Specialists 518 $13.57 - $27.90 Child, Family & School Social Workers 486 $11.91 - $19.79 Insurance Sales Agents 474 $11.17 - $25.74 Special Ed Teachers, Preschool, Kindergarten & Elementary 459 $12.96 - $23.45
Securities, Communication & Financial Services Sales Agents 421 $14.82 - $46.48
Mechanical Engineers 414 $20.61 - $32.10 Cost Estimators 370 $12.69 - $27.00 Database Administrators 337 $15.33 - $30.27 Training & Development Specialists 333 $15.33 - $30.27 Public Relations Specialists 332 $11.66 - $22.65 Network Systems & Data Analysis 321 $18.89 - $31.58
Source: Illinois Department of Employment Security, Economic Information and Analysis Division, Illinois Job Outlook, Springfield, Illinois, 2002.
28

Agriculture Table 27 compares farm data for 1987, 1992, and 1997 for DeWitt and Macon Counties and for Illinois. Between 1987 and 1997, the number of farms in Illinois decreased by 17.7%, while in Macon County they decreased by 21.8% and in DeWitt County by 18.1%. As the number of farms declines the average size of a farm increases. The average farm size in Illinois went from 321 acres in 1987 to 372 acres in 1997, a 16% increase. For Macon County the average size in 1987 was 387, and it increased to 486 in 1997, a 26% increase; for DeWitt County the figures were 393 acres in 1987 to 443 acres in 1997, a 13% increase. The primary crops grown in Illinois and in Macon and DeWitt counties are corn and soybeans. As a percent of the total sales, crops accounted for 77% in Illinois, while in DeWitt county it represented 94% and in Macon County it was 96%. Livestock sales made up the balance of sales. Table 27. Farm Data for Illinois and DeWitt County and Macon County, for years
1987, 1992 and 1997.
Year
DeWitt
# Farms
DeWitt
Average Size in Acres
Macon
# Farms
Macon
Average Size in Acres
Illinois
# Farms
Illinois
Average Size in Acres
1987 565 393 850 387 88,786 321 1992 496 416 771 403 77,610 351 1997 463 443 665 486 73,051 372
Source: Illinois Department of Agriculture, Illinois Agricultural Statistics Service, 1997 Census of Agriculture, Springfield, Illinois, 1999.
RCC Workplace Challenges and Expectations An employee may work 12 hour shifts on a rotating basis, may have a work schedule that is 3 days on and 3 days off, may work a swing shift where the hours and days change every week, or a combination of these. Many of these workers find it difficult to continue their education. For the United States to maintain a competitive advantage in the global marketplace, employees must have the education and training to adapt to new and innovative technologies. With the advent of the “technology age,” a well-educated labor force is most important. As workplace changes occur, business and industry have increasingly found community colleges to be a valuable resource for workforce development. Given the changes in the workplace, a community college can no longer expect all students to attend classes on a regular basis. As such, colleges can no longer just provide the traditional day and evening classes to meet students’ needs. In some cases, the college must provide courses via distance learning, online, and hybrid, a course taught using two or more types of delivery. An example is an online science course where the students attend sessions on campus to complete laboratory assignments.
29

Community colleges can provide the necessary education and training, but it must be offered through alternatives that meet the needs of students and businesses. This approach may involve RCC staff discussing the issues with the business community, becoming familiar with students’ needs, and providing the necessary education and training. Throughout the United States, community colleges are taking a more active role in these alternatives and options. Infrastructure Roadways and Bridges Roadway and bridge improvements within the Richland Community College District impact students’ abilities to access the campus and the expansion of economic development. Improvements to roads near the College have resulted in quicker access to the College for students. Within the last two years, Mound Road has been expanded from a two lane to a four-lane road between the Decatur Correctional Center and Route 48, and Mound Road between Route 48 and Brush College Road has been expanded to a three-lane cross section. The expansion of Martin Luther King, Jr., Drive from Pershing Road north to Sam’s Club has been completed, allowing better flow of north-south traffic and the ability to connect with Mound Road. In the fall of 2002, Reas Bridge Road was extended as Huston Drive from Brush College Road west to Route 48. This new section of road runs between Caterpillar and land owned by ADM and allows an alternate route to the College for students and staff that is not on a railroad line. Future projects that would impact traffic flow to Richland and/or economic development for the region include a South and East Beltway that would connect Route 51 south of Decatur near Elwin to Interstate 72 near the exit for Richland Community College. It is possible that the Beltway may intersect with Reas Bridge Road or pass through land just north of the College to intersect with Brush College Road. A specific alignment has not yet been chosen but is expected to be presented to the Macon County Board in August or September 2003. Engineers would then be hired to fine tune the plan. Construction of the actual Beltway is expected to be 8-10 years away. The Illinois Department of Transportation (IDOT) is continuing to work on the expansion of Route 51 South from a two-lane to four-lane highway between Macon and Moweaqua. State funding issues continue to hold up this project. Many local projects have been identified and funded by IDOT for the next several years. Most of these projects involve resurfacing of local highways, including sections of US 36, IL 48/IL 121, IL128, and I72/US36. These projects have been identified for 2003 and 2004. Bridge replacements and rehabilitation for IL105 in Long Creek, Wyckles Road at
30
the Sangamon River, and I72 Bloomington Road under US51 north of Decatur are scheduled for 2006-2007. Airport The Decatur Airport is owned and operated by the Decatur Park District. The facility includes three runways and covers just under 2,000 acres. American Connection Service provides service through St. Louis. Authorities are continuing work to re-establish service through Chicago. The airport has an on-airport U.S. Customs Office to provide an international arrival point for primarily corporate aircraft and other customs services. In late 2000, the Decatur Park District was granted authority as Foreign Trade Zone (FTZ) #245 for international commerce. This is one of six sites in Illinois. The airport also serves as a “mini-hub” for United Parcel Service and an aviation support facility for the Illinois National Guard. 125 aircraft are based at the airport, which has approximately 70 employees. The estimated economic impact of the Decatur Airport was $38 million in 2000. Future plans are to increase commercial use of the airport and expand airline service. (Source: Gene Marcinkowski, Manager of Decatur Airport, February 3, 2003.) Other Infrastructure Issues Infrastructure is defined as the basic physical systems and facilities that allow a municipality to function. For purposes of this report, infrastructure is limited to the city of Decatur and includes road, sewer, and water systems. In 1995, the City of Decatur Department of Public Works published a report titled Public Works Infrastructure: Value, Condition, and Priority Needs. The study of sewers, storm sewers, bridges, streets, emergency warning sirens, traffic signals and signs, and other subjects includes a detailed assessment of public works, analyzing the general condition and priority needs. At the time the study was done, the public works infrastructure was considered to be in fair to good condition. Specific needs cited within the study included local streets, emergency warning sirens, traffic signs, dams, and the North water Treatment Plant. No report has been created since 1995, although a new summary was created in 1999. From the 1999 update, the overall condition of the infrastructure remains as fair to good condition and is comparable to other cities of Decatur’s age and size. The report cites a lack of information on the condition of several infrastructure systems including major trunk sanitary sewers, other sanitary sewers, storm sewers, stormwater management systems, and curbs. During 1999, the City experienced significant real decline in the condition of the following facilities: local streets, traffic signs, street name signs, water mains, industrial water meters, and residential water meters. Approximately 40% of the infrastructure categories had critical needs in the fall of 1999 and 14 areas will continue to have critical needs in 2000. The value of the existing public works infrastructure is estimated at over $1 billion. Funding issues continue to be roadblocks for infrastructure needs. Current funding level
31
for rehabilitation and replacement for most areas was adequate for 1999-2000. The expenditure level for the streets system was inadequate. According to the report, while the City has committed significant resources to public works infrastructure rehabilitation and replacement in the past year, the overall condition of all systems has remained essentially the same. (Source: City of Decatur, “Illinois Infrastructure Inventory Summary Report,” 1999.) In addition, with the Hope VI Project in the near north side, significant infrastructure repairs and renovation must be completed. Area Projects- Parks, Recreation, Public Centers The Decatur Park District will be working on the following projects for the area:
- Expansion of the bike trail along Lincoln Park Drive to connect the west side of Decatur to Nelson Park.
- Build a skate park in Fairview Park in the spring of 2003 - Begin expansion of the bike trail north from Fairview Park to Pershing Road - Upgrade and renovate community parks and their infrastructure - Continue to expand Scovill Zoo; install a carousel - Build a Horticulture Center in Sportsman’s Park (summer 2003), which will
have display areas, a classroom, and eventually will house the greenhouse operations of the Park District
Other projects for the area:
- Decatur Area Arts Council is completing fund raising efforts to relocate the Arts Council to a building they have purchased in downtown Decatur. The new facility will feature a variety of rooms for multiple uses.
- The Senior Center has recently purchased the former Burks Pumps administrative building and will be relocating following renovations.
- A Water Park will be built near the Holiday Inn. New roadwork began fall 2002 to prepare for the park.
32

III. RICHLAND COMMUNITY COLLEGE
Historical Perspective Citizens of Decatur and the immediate surrounding area approved the creation of the Community College of Decatur on September 25, 1971. Classes began for 1,119 students on September 8, 1972, in the former Millikin National Bank Building at 100 N. Water Street, Decatur, Illinois. In 1973, the Illinois Community College Board recommended that fifteen high school districts be annexed to the College District. In order to reflect its new, wider constituency, the College chose “Richland” as its new name in February 1975. After voters turned down bond referenda to build a permanent campus in 1976 and again in 1978, Richland moved to a rented warehouse complex in an industrial park called Park 101 located at 2425 Federal Drive, Decatur. A third vigorous referendum campaign followed in March 1984, and voters finally approved a $5.8 million bond referendum. When added to state funds, these local monies allowed construction of a permanent campus to begin on the 115-acre site on Brush College Road. Governor James Thompson led the College’s groundbreaking ceremony on July 16, 1986. Classes at the current site began on September 6, 1988, and the campus was formally dedicated on November 12, 1988. The Weidenbacher Greenhouse opened in the spring of 1991, and the Shilling Community Education Center was dedicated on April 8, 1993. In 2001, the State of Illinois appropriated nearly $10 million for the addition of two new wings onto the building. The College provided matching funds of nearly $2.5 million. On August 14, 2002, the Industrial Technology Center was dedicated and opened for classes. The Industrial Technology Center houses the Mechanical tech, Computer Integrated manufacturing, Drafting/Computer Aided Drafting, Heating, Ventilation, Air-Conditioning and Refrigeration, Electronics and Welding programs. On January 11, 2003, the Schrodt Health Education Center, named for Dr. Joseph and Martha Schrodt, was dedicated and opened for classes. The Schrodt Center contains all the health professions programs including Nursing, Nurse Assistant, Practical Nursing, Phlebotomy, Pharmacy Technician, Surgical Technology, Radiologic Technology, and Emergency Medical Technology. The Richland Community College Foundation purchased two parcels of land, 40 acres, to the north of the College in 2001 and 2002. The College now owns all land north of the College on the east side of Brush College to Mound Road. In December 2002, the Macon County Soil and Water Conservation District built an office building that it shares with the US Department of Agriculture on land leased to it by the College. This was the second partnership of its kind in the nation. In 2003, the College was approved to receive nearly $2.5 million from the State of Illinois to construct a 12,800-square-foot Agriculture Occupational Tech Building and 1,600-square-foot green house. This would replace the temporary classroom space for
33

programs located in the Maintenance Building. The College will be responsible for an additional 25% of the State’s portion of the money. The project is temporarily on hold as Governor Blagojevich waits for approval of the State’s budget. Facilities Richland Community College’s main campus, located at One College Park, Decatur, is comprised of several facilities. Assigned acreage, or the land on which the College sits, consists of landscaped grounds, 43 acres; parking, 9 acres, potential athletic fields, 6 acres; buildings and attached structures, 5 acres; other instructional areas, 49 acres; and roadways, 3 acres. The Richland Foundation owns 40 acres adjacent to existing college property. The campus buildings measure 247,400 square feet and include the main campus building measuring 191,000 square feet, including the new Schrodt Health Education Center and the Industrial Technology Center; the Shilling Community Education Center, measuring 44,600 square feet; and the Agricultural/Maintenance Building, measuring 12,800 square feet. Future building plans include an Occupational Trade Building of 12,000 square feet and a 1,600-square-foot Greenhouse. The State of Illinois has approved funds for this building, which is in the planning stage. Also located on the Richland campus is a 7,000-square-foot building opened in December 2002, which houses the Macon County Soil and Water Conservation District (MCSWCD) and the U.S. Dept. of Agriculture. The MCSWCD built the building on 2 acres of land leased from Richland Community College. Off-Campus Facilities Richland Opportunities Center Located at 1500 E. Condit, Decatur, the Opportunities Center serves students in the Options/Opportunities Program. Classes, workshops and a newly equipped computer lab are available on site to provide services for homemakers who are widowed, divorced, or separated, as well as Public Assistance clients who need assistance finding employment. Also located in this building is Project READ, the College’s adult literacy program. Office space and a small lending library are dedicated to this program. Richland’s Clinton Center The RCC Clinton Center, located at 1200 Rt. 54 West, Clinton, offers admissions, registration, and financial aid services to Richland students. Credit, Lifelong Learning, and adult education classes are scheduled through the Center in Clinton and neighboring communities by the Extension Coordinator. Leisure Learning classes for senior citizens over 55 years of age also meet at various locations in the Clinton community and are listed in the College class schedules.
34

Other Off-Campus Sites In addition, some college credit and non-credit classes are conducted in various community sites throughout the District. A number of adult education courses meet off-campus in the following locations: Decatur Public Library, Decatur Housing Authority, Central Christian Church, Boys and Girls Club, Old King’s Orchard Community Center, and Millikin University. Administrative Structure The Board of Trustees, made up of seven members elected by the community and one Student Trustee by Richland students, is responsible for hiring the College’s president and creating and enforcing College policies. Under Section 1.1 (Legal Basis) of the Board of Trustees Policy Manual, “As the policy making group of a public governmental institution, regulated by laws of the State of Illinois, and more precisely by the Illinois Public Community College Act of 1965, as amended, the Board of Trustees is subject to certain restrictions set forth in the aforementioned act under the classifications of Duties and Authority. “The Board has the powers enumerated in Sections 3-30 through 3-43 of the Illinois Public Community College Act. The list of powers set forth is not exclusive, and the Board may exercise all other powers not inconsistent with the Illinois Public Community College Act that may be required and appropriate for the maintenance, operation, and development of any College under the jurisdiction of the Board.” According to Section 1.2 (Entity-Procedural capacity) of the Policy Manual, “The College District is a body politic and corporate known as ‘Community College District No. 537, Counties of Macon, Christian, DeWitt, Logan, Moultrie, Piatt, Sangamon, Shelby, and State of Illinois,’ and by that name may sue and be sued in all courts and places where judicial proceedings are held.” As outlined in Section 1.3 (Authority of Board Members), “Members of the Board of Trustees have authority when acting as a Board in legal session. The Board will not be bound in any manner by any action(s) or statement(s) of an individual Board member or employee, unless such action(s) or statement(s) is pursuant to specific instruction by the Board when legally in session. Action of such member or members must be confirmed by the Board.” The College is divided into two general areas: Finance and Administration, and Student and Academic Affairs. Each of these areas has its own vice president, who reports directly to the president. In addition, the executive assistant to the president, the executive director of the Foundation, the executive director of institutional effectiveness, and the executive director of public information report directly to the president. Each of the general areas of the College has numerous related offices that report to a specific vice president. All academic deans, faculty, adjunct faculty, Dean of Enrollment
35

Services, Dean of Retention, Admissions and Records, Career Counseling, Student Life, Student Learning Center and Assessment Services, Child Care, Academic Advisement, Financial Aid and Veterans’ Affairs, Recruiting, Options/Opportunities, and Lifelong Learning programs report to the Vice President of Student and Academic Services. Human Resource, Operations and Technical Services, Custodial, Security, Auxiliary Services, Administrative Information Systems, and Business Services report to the Vice President of Finance and Administration. The Graphics Center, Copy Center and Shilling Center report to the Executive Director of Public Information. Each of these general areas revolves around Richland students and their educational needs. The full-time and adjunct faculty are represented by the American and Illinois Federation of Teachers, while all other college employees are non-union. Board Challenges The Board of Trustees has identified several priorities they feel are important in the strategic planning process. These include:
1. Mission and Core Values 2. AQIP Process 3. Construction 4. Technology 5. Student Success and Retention 6. Professional Development 7. Marketing and Publicity 8. Community Awareness and Image 9. Communication/Organizational Decision-Making
Many of these issues are incorporated into the work of several college projects, including the Strategic Plan and the Continuous Improvement Teams. Marketing, publicity, community awareness and image are woven into all functions of the College. During the scanning process, most of these priorities surfaced as themes. White papers were written specifically on Technology, Student Success and retention, Professional Development, and Communication. At a Board retreat in March 2003, Board members discussed the mission/vision of the College, budgeting and financial projections, academic quality of programs, and community engagement. Governance An eight-member Board of Trustees governs Richland Community College. Seven of the members are elected at large by the citizens of Community College District #537 to six-year terms. The eighth member is a student trustee elected annually by Richland’s student body. The student trustee may cast an advising vote to show position and can make and second motions. The Trustees meet the third Tuesday of every month in the College’s Board Room. Special meetings are also called as required. All meetings of the Board and its
36

committees are open to the public except for discussion of certain exempt matters including those relating to certain personnel matters, matters of commercial or financial sensitivity, certain matters relating to education, or legal matters. The general public is invited to attend all Board meetings, and time is set aside during these meetings for citizen to address the Board and to make their opinions known. A Governance System was created in 1997 to engage faculty and staff college-wide in policy-making through a participative structure. Under this structure, every member of the Richland community may serve on one of the sub-councils or the College Council and participate in the decision-making process. Sub-councils have been set up for Academic issues, Planning and Budget issues, Student Affairs, and Human Resources. Issues needing to be addressed by any of these sub-councils can come from anyone in the organization. Policies developed through the various sub-councils are moved on to the College Council, and following approval, are forwarded on to the President for action by the Board of Trustees. In 2002, a Continuous Improvement Process Steering Committee was established to provide leadership for processes within the College that need to be developed or modified through Continuous Improvement Process (CIP) Project Teams. The Steering Committee is representative of all employees of the College and has rotating membership among faculty, Deans, and classified staff. Small CIP Project Teams are established by the Steering Committee to address specific issues affecting students and staff. Participants are trained in CIP principles using Academic Quality Improvement Program (AQIP) tools. A CIP Project Team, in the summer of 2003, will address the current Governance system and make suggestions to change or modify it. Accreditation Richland Community College was first granted correspondent status accreditation from the North Central Association of Colleges and Schools in July 1972, became a candidate for accreditation in 1975 and again in 1977. Following a comprehensive visit in 1977, the College was granted accreditation at the associate degree granting level in April 1978. Another comprehensive evaluation occurred in 1992-93 in which NCA granted accreditation for a period of ten years. In 2002, the College was granted the opportunity to engage in a new accreditation option with NCA called the Academic Quality Improvement Project (now called the Academic Quality Improvement Program). Rather than traditional self-evaluation and site visit from NCA, the AQIP process allows the community college to self assess and identify opportunities for comprehensive improvement. The AQIP model allows the date of the next reaffirmation of accreditation to be set ahead seven years and is based on the institution’s commitment to quality processes and performance results of those processes as evidenced through AQIP interactions. Once accepted into the AQIP system, the community college must complete a Strategy Forum and a Systems Portfolio. The college is asked to identify a “vital few” action projects to focus on during the seven-year period which exhibit dynamic opportunities for improvements within the institution and engages its employees.
37

Richland has selected the following “vital few” projects for the first years of the process: 1) building effective high school partnerships within the Richland District, 2) developmental education, and 3) organizational development. Each year the College is required to submit a report on the progress it has made towards these vital projects. College Purpose and Mission The primary purpose of Richland Community College is to improve the quality of life in Central Illinois by actively serving the educational needs of the people, organizations, and institutions it serves. The College pledges to provide equal access to education and training for all citizens regardless of race, age, gender, religion, national origin, ethnic background, or disability. Richland’s Mission has not changed since the last Environmental Scan. However, with the recent shift to a Continuous Improvement Process, the Board of Trustees and the College community will soon be examining whether the current mission and purpose accurately show the direction in which the College is moving, one with student-centered process in mind, and in which the core values have a prominent position. Currently, the Mission of Richland Community College is to offer educational programs that enable students to achieve their potential through higher education by obtaining the abilities, attitudes, and skills needed for personal and professional growth. Richland Community College achieves its mission and purpose by offering the following programs: ■The first two years of a baccalaureate education; ■Technical courses, certificates, and degrees designed to provide job training,
retraining, and upgrading of skills; ■Basic educational skills designed to prepare students to engage in college-level
study; ■Continuing and community education courses and programs designed to provide
and encourage opportunities for lifelong learning; ■Student development programs and services designed to help students identify
educational and career goals, set realistic career paths, and develop skills necessary to achieve intellectual and personal growth;
■Academic programs and services that provide supplemental support to both teaching and learning;
■Community education activities and programs that complement, enhance, and contribute to the growth and enrichment of students and the community, both inside and outside of the classroom; and
■Community service activities and programs that promote linkages with business, industry, and governmental agencies designed to meet the changing needs of the market place and promote economic growth in Central Illinois.
Core Values Richland has also endeavored to identify its Core Values through a series of reflective activities conducted initially through College-wide evaluations and more recently through the work of a Continuous Improvement Process team. In Spring 2003, five values were
38

identified as those the College has always upheld and will continue to strive to uphold and be accountable to: Commitment, Respect, Excellence, Accountability, and Diversity. Credit Enrollment Since the previous Environmental Scan in 1998, the College, as well as all community colleges in Illinois, has experienced a rapid change in enrollment. The state and local economic picture has affected Richland’s growth, and the addition of new health profession programs has also impacted the College’s credit enrollment. In the Fall Semester 1995, the student headcount on the tenth day of the semester was 3,384, and Fall 2002 enrollment on the tenth day was 3,569. Student Profile Richland Community College District 537 draws its student primarily from 8 counties, which include 11 public high schools, an alternative high school, an area vocational center, and 2 private high schools. In addition, the District has seen an increase in enrolled students who indicate that their secondary education has come from a home schooling environment, a phenomenon that is affecting state and national figures as well. In Fall 2002, 361 graduates, or 26%, of District high schools enrolled at Richland. A small percentage of students outside the District also attend Richland, a response to cooperative agreements with a number of community colleges in the area and to the rise in health professions programs now available at Richland. Annual baseline data for student enrollment information is established at the 10th day of each fall semester. Fall enrollment data is submitted annually to the Illinois Community College Board. A state- wide enrollment report for Illinois community colleges is distributed in the spring of each year. Richland enrolled 3569 students in the Fall 2002 semester. Of the total student population, approximately 37.5% were male and 62.5% were female; 83.8% were white, 14.4% were African American, and 1.8% were Asian, Hispanic, or American Indian. The average age of Fall 2002 students was 28. The College’s student population consisted of 62.6% part-time and 37.4% full-time students. 90.8% attended classes on the main campus, and 9.2% attended classes at off campus-sites. 37.4% of these students were enrolled in 12 or more hours; 12% were enrolled in 9-11 hours; 25.4% were enrolled in 5-8 hours; 25.2% were enrolled in 1-4 credit hours. 87.6% of the students attended classes during the day; 12.3% attended evening classes, and .1% attended Saturday classes. Approximately 50% of the students were enrolled in a baccalaureate transfer program, and 38.7% were enrolled in an occupational/technical program. The remaining 11.3% of Richland students were enrolled in Adult Education or other non degree-seeking programs.
39

During FY 2002, 476 students graduated with a certificate or degree. Approximately 34% graduated with a transfer degree, and 28% graduated from an occupational/technical program. The remaining graduates completed basic and advanced certificates. The increase in occupational/technical degrees occurred with the increase in number of health professions. Baccalaureate/Transfer Programs In FY 2002, Richland’s opening fall headcount in baccalaureate and transfer programs was 1789. In FY 2002, 96 students graduated with A.A. degrees, 65 with A.S. degrees, 0 with A.F.A. degrees, and 2 with A.E.S. degrees. The total, 163, represents an increase of 3 from the 160 graduates the previous year. While this “graduation rate” might appear small, the fact that many Richland transfer students enter four-year schools before graduating is important to note. As of December 2002, Richland offers transfer degrees in 32 areas of concentration (majors): accounting, African-American studies, agriculture, anthropology, art, biology, business, international business, chemistry, computer science, earth science, economics, engineering, English, foreign language, general science, history, journalism, mathematics, philosophy, physics, political science/pre-law, pre-dentistry, pre-forestry, pre-medicine, pre-veterinary, psychology, sociology, speech and drama, and three types of teacher education—elementary education, secondary education, and special education. Institutions to which Richland’s students transfer include the following: U of I Springfield, Eastern Illinois University, SIU Carbondale, Illinois State University, Millikin, SIU Edwardsville, U of I Urbana/Champaign, Northern Illinois, Western Illinois, U of I Chicago, Northeastern Illinois, National Louis University, Greenville College, and Franklin University. Occupational Programs In 2002, the College was reorganized, affecting the placement of some of the occupational programs. While most of the occupational programs are in the Business and Technology Division, Fire Science and Criminal Justice are in the Math & Sciences Division and Child Care, Education, and Graphic Arts are in the Communications, Education, Humanities, and Fine Arts Division. During the Fall 02 semester, occupational programming represent 39% of students enrolled at Richland compared to 50% of the students enrolled in Baccalaureate/Transfer programming. In FY 01, the percentages were 42% Occupational and 44% Baccalaureate/Transfer. In FY 00, the percentages were 45% Occupational and 38% Baccalaureate/Transfer. Over the last ten years, 37% of the students have been Occupational and 41% of the students have been Baccalaureate transfer. Recent enrollment trends deviate around these percentages but are not statistically different. Therefore, growth in most of the occupational programs is consistent with the overall growth of the institution.
40

Business and Technology Division In the years since the last Environmental Scan, this division has undergone significant change. The Dean of this division has worked with faculty to create strategic plans for each department/program area. In these plans, department/programs have defined individual missions, visions, program goals and objectives. The plans are aimed at building on strengths, resolving threats, exploiting opportunities, and avoiding/ minimizing threats. The addition of the new Industrial Technology Center to the campus has provided high tech classrooms and much-needed lab space for several programs. Division-wide, the programs as an aggregate show an increase in the number of students and credit hours for the past three years. Several program areas that have shown the most growth include Accounting/Business, Agribusiness, Automotive, Electronics, Horticulture, Heating, Ventilation, Air Conditioning and Refrigeration, Mechanical Technology, and Welding. Within just the last year, all the programs listed above plus Electronics Systems have seen significant growth. Other programs have experienced some shifting in enrollments and number of credit hours. Within the last two years, several key programs have been restructured. The Information Technology department now offers several new programs and certificates, including eCommerce/eBusiness, aimed at diversifying the types of programs we offer. These new programs and certificates provide training opportunities for professionals in the field looking for updated skills or for individuals looking for a specialized skill set. The Horticulture department has also diversified its programming and now includes two specialty areas, floriculture and ornamental horticulture, to its AAS degree programming. The Office Technology department has recently changed the name of its AAS degree to Administrative Assistant and will offer three concentrations of General Office, Legal Office, and Accounting Assistant. In addition, new programming will also be offered in the Medical Office Assistant area. Future program restructuring is planned in FY04 for the Business and Accounting, CIM/Manufacturing, and Electronic departments.
In order to facilitate program development that is relevant both to local industries and for students, existing programs and potential programs have undergone or will undergo a comprehensive process known as DACUM (Developing a Curriculum) analysis which has been funded through the College’s Title III grant. The DACUM process brings in employers and employees in specific occupational areas to meet with College personnel and discuss the need for specific programs and training. During this process specific knowledge, skills, attitudes, and habits required for these jobs are identified. The DACUM initiatives coupled with the integration of National and State Skill Standards into RCC’s curriculum have assisted the College with maintaining and upgrading the relevance and diversity of our occupational programming. Occupational enrollments have fluctuated significantly over the last several years. Although we cannot absolutely identify reasons for this, we speculate that recent changes in the workforce (e.g. plant closings a within the last two years) have helped increase our enrollments. Because of these economic conditions, many dislocated workers are able to receive assistance to pay for training/education for selected certificate or degree
41

programs. When we track enrollment patterns with economic indicators such as unemployment figures, we find a high correlation between the two indicators. Also, we speculate that our new program development activities, which have resulted in a mix of short and long term training/education opportunities for students, may have helped increase enrollments by providing career laddering opportunities that allow people to return to the workforce quickly while continuing to their education and training. The concept of “career laddering” has been introduced to improve flexibility, accessibility, and relevance for all programming. To accomplish this, the division has begun to build certificate and degree programs that are integrated between departments and aligned with National and State Skill standards. By doing this a student can earn a certificate and be assured of attaining relevant workforce skills in a short amount of time. The student can then build on these skills with another certificate program and continue on until he or she achieves a degree. Other concepts that have been integrated into the programs are tiered programming options, consistent general education requirements, and dual-track programming. All recent program modifications were built using the tier-program design methodology. The tiered model consists of a series of common core courses, while the second tier features more specialized courses, and the third tier features the “capstone” courses that combine all the knowledge and skills of the program that the student has learned. This tiered approach sets the stage for the development of a comprehensive student outcomes assessment model. Delivery methods for some of the occupational classes have changed to make classes more accessible for students. Several online classes have been developed over the past three years, along with a few compressed video classes (distance learning classes). Future plans include developing web-enhanced courses/programs and offering more Dual Credit courses. Statewide, the Bureau of Labor Statistics predicts that positions such as computer support specialist, health information specialist, electronics and electrical engineering technicians, drafters, civil engineering technicians, automotive technicians, and welders will be high growth and “best bet” occupations for Illinois. Locally, the need for machine operators, automotive technicians, civil engineering technicians, and truck drivers top the list. To respond to these trends current program offerings are being revamped and new programming is being developed (e.g. the CIM/Manufacturing area may be redesigned to reflect an engineering technology focus). Ongoing challenges for the Business and Technology Division remain finding appropriate funding for equipment and software for the programs and finding qualified teachers who are willing to work for less than what they could earn in industry. The teaching issue concerns both full- and part-time faculty and was not resolved with recent union contract negotiations. In addition, occupational programs have had loyal adjunct faculty who have taught for many years and are ready for retirement. With the reorganization, the Lifelong Learning Division has been collapsed and its components have been assigned to various areas of the College. Under the umbrella of the Business and Technology Division, the Business and Industry corporate training, the Occupational Safety Training (OST), and the Commercial Drivers License (CDL) are
42
being merged into what will be known as the Business and Industry Institute. The CDL area has experienced strong growth, and projections are strong for qualified drivers. The addition of a CDL Simulator will provide additional teaching and training opportunities through the Business and Industry Institute. The mission of the Institute is to create a world-class workforce through the development of strong partnerships using cost effective, high quality training solutions. The Institute seeks to be recognized as a leader in providing quality training and services to its clients. The Business and Industry Institute has developed a departmental strategic plan that will focus on three goals:
1. Increase and strengthen internal and external partnerships 2. Increase the effectiveness and quality of its programs and services 3. Implement innovative, accessible, and cost effective training and service solutions
These goals will involve a new operational structure, stepping up partnership initiatives with professional organizations and businesses, and looking at new markets such as accounting, finance, insurance, agribusiness, natural resources, and health industries. In addition, the Business and Industry Institute plans to offer more business-oriented public programming for credit. An integrated marketing/communications plan will be developed for the Institute. Mathematics and Science Division Two occupational programs are housed in the Math and Science Division: Fire Science, and Criminal Justice. Both programs have experienced a steady increase in enrollment over the past two to three years. Both programs have undergone curriculum changes that adjusted the programs to meet the changing needs of these life-service occupations. The 9-11 attack in September 2001 has identified additional training needs for individuals engaged in these programs, and has attracted many individuals who want to serve their communities. Communications, Education, Humanities and Fine Arts Occupational programs found in this division include Child Care & Education and Graphic Arts. Child Care & Education will likely be renamed Child Care Education this year. This program has been growing over the past several years, and much of this growth is due to changes in state regulations for licensing and certifications. New requirements from the state are driving the addition of sections of existing courses to meet deadlines for new education requirements for childcare workers. Currently, attention at the federal level is focusing on early childhood. President Bush is an advocate for a strong and highly qualified day care and early childhood program. In addition to other changes in the program, the existing Child Care and Education program is now attempting to address the potential for graduates of this program to transfer into Early Childhood degree programs at the four-year level. RCC is working with Millikin University, Eastern Illinois University, and Illinois State University to ensure a smooth transfer for its students.
43

The Child Care and Education program has undergone other significant changes. In the past, the program trained students to become day care workers. The coursework involved a great deal of hands-on training. Today, the academic rigor of the program has substantially increased due to the state requirements. The program must now go beyond licensure and certification and hands-on training; it must meet state standards established by the No Child Left Behind Law. The Child Care Education program is using a career lattice, or vertical approach, being designed by a statewide committee, to facilitate a clear pathway for early childhood students to transition from a certificate program into an AAS or AA degree program. The new degree programs that will be proposed this year in alignment with the statewide plan will include a common core of courses that are transferable to a four-year college/ university program. Individuals will be able to enter the career lattice at any point in their growth as professionals and exit at the level of education desired. The Dean reports that challenges for this program include meeting State standards, modulation in the program (what can be transitioned into early childhood courses from our current curricula), and finding qualified faculty to help expand the program. One of the biggest challenges for the Dean is to determine how to move from a standard day care program to the early childhood education program. Determinations are being made at this time as to whether the two can become blended into one large program or remain separate. The Child Care Education program, similar to other occupational programs, is looking for ways to provide classes to students who may already be working full time through virtual classes and additional evening sections. The issue of how to deal with incoming students who already have work experience in the field but do not meet state requirements also presents a challenge. The department is looking at proficiency credits and independent study as ways to transition these types of students into the program. Timelines imposed by State standards have increased the request for independent studies, which impacts the time commitment of faculty. At present, the Graphic Arts Program offers both an AAS degree and several certificates. The program is fully enrolled based on the current space and equipment. The program is currently being modified to offer specializations in web design, 3-D animation, and graphic design. In 2002-03, the Graphic Arts program has been the focus for Activity 2 of the College's Title III grant. Support from the grant has provided upgraded computers and curriculum development. The Dean and faculty are working with the Information Technology area to expand the College's web design courses, offering curriculum to include both the artistic elements and the technical programming. The Dean also is working with universities to articulate the AAS Graphic Art program as a transfer program. Several challenges have been identified for this program. First, determining the job market is difficult, particularly at the local level, because many graphic art jobs are imbedded into companies and those responsibilities are often combined with other duties. There are significant numbers of freelance and part-time graphic designers. Required
44
skill levels are hard to determine, and as a result, putting together a program that is flexible enough to address a wide range of design needs is a challenge. This program requires the College to look beyond the local market to assess needs. Another challenge for this program is the difficulty in finding internships for our students because of the limited number of dedicated graphic arts businesses in the region. Software and equipment are challenges due to cost and the nature of change for this industry. Space on the campus is another issue for the program. The lab originally created for the program is now overcrowded. Despite the obstacles, the program continues to thrive without a full-time instructor. The need for a full-time instructor and space issues must be addressed this year. Health Professions Division The health professions programs at RCC exploded in 2002-03 with the addition of the new Schrodt Health Education Center. The addition provided dedicated classroom and laboratory space for the growing programs. Programs include Registered Nursing Program, Practical Nursing, Nurse Assistant, Pharmacy Technician, Radiologic Technology, Surgical Technology, Phlebotomy, and Emergency Medical Technology. The demand for more graduates of these programs has been driven by area hospitals. The nursing program has tripled in size due to demand and the ability to provide classroom space on campus. Because of this increase in student demand, many new faculty have been added. State law mandates the ratio of students to teaching faculty during clinicals. The College also added a mid-year class of nursing students, which will provide graduates in December and May. Practical Nursing was added to the division after the College agreed to take over the program from the Decatur Area Technical Academy last year. The Certified Nurse Assistant Program (CNA) offers RCC students who want to go into nursing the option to enter at one of three levels. The Radiologic Tech program was added in the summer of 2002 and has already doubled in size. Surgical Technology has gone from a class of seven students to a class of twenty-one. Costs for health professions programs are high, and the College has partnered with an area hospital to help provide funding for two of the faculty salaries. The hospital balances the cost to support the salary with the increased number of graduates the College is able to provide. Finding qualified teaching faculty is a challenge for the Health Professions. The nationwide shortage of teaching faculty is reflected in this area. Many community colleges and universities have competed for the same pool of candidates over the past two years. Supporting new faculty with competitive salaries is another challenge. Salaries are dictated by a union pay schedule, and this may not stack up well against the salaries master-degree nurses can earn in private industry. The cost of technology and the cost of health programming in general continue to be a challenge for the division. While the labs are currently equipped with new technology, replacing equipment or adding new equipment as technology changes in the next few years may prove to be difficult. New programs must be carefully analyzed for costs to
45

start-up and maintain. The cost can impact the decision to begin a new program. The College is dependent on gifts of equipment from local hospitals, doctors, or equipment manufacturers, and financial gifts from loyal donors. Looking ahead, the College will look for ways to deliver less expensive quality programs to its constituents. New programs will be evaluated for high revenue abilities and low expenditures. One area that the College will explore is offering continuing education courses, which involve fewer clinical classes, to health professionals in the community. Alternative Delivery Methods Technology-based education, also known as distance learning, is emerging as an increasingly important component of higher education. Typically, five different delivery methods of distance learning are used: Internet, TV/Video, Open Broadcast TV, Stored Media (CDs and Tapes), and Correspondence. Richland began offering distance learning classes through interactive TV/Video in 1995 and by 2003 had 8 off-campus sites and 3 on-campus sites to offer the technology. In the fall of 1998, Richland offered 3 virtual classes via the Internet. That number has grown to the current offering of 53 classes. Enrollments for Summer 2003 will be over 400 students. This number reflects the largest number of virtual students to date. Challenges educators face with alternative delivery methods include the need for creating alternative models of teaching and learning. Some features of the traditional classroom lacking in virtual classes include the opportunity to work together in teams, the inability of the student to be exposed to other thoughts and ideas of classmates, and the isolation of the students. The challenge for the institution is to use current ideas of learning and an understanding of educational technologies to design learning experiences that promote a deep, understanding of the subject content, to analyze data and information, and to develop creative thinking and good communication skills. Keeping pace with the expanding technological change is demanding for colleges. Factors reported that keep an institution from expanding their distance education course offerings are program development costs (43%), limited technological infrastructure to support distance education (31%), and equipment failures and costs of maintaining equipment (23%). For courses offered online, many students suffer the “digital divide” resulting from lack of appropriate computer equipment or software required for completing coursework, not to mention a lack of academic maturity needed to complete coursework without an instructor standing in front of a classroom. The distance learning technologies also require ongoing training for faculty and a support system on campus. Recently, due to low enrollment, the distance learning equipment has been removed from the Decatur Public Library. Also, budget problems have caused high schools to discontinue distance learning classes beginning Summer 2003. Equipment will be maintained at those sites for the time being. With the statewide network, Richland has also been able to work with Parkland College to offer on-site coursework for the Respiratory Technology Program, a cooperative agreement program. Students have
46

finished their second semester in the program by attending classes at Richland, including testing through Assessment Services. Dual Credit The Dual Credit program offers District high school students the opportunity to take courses that earn them both high school and college credit. Students may enroll in classes on Richland’s campus or at their home high schools, depending on the arrangement with the high school. Some courses are “stand alone” courses, meaning that the only students enrolled are high school students; other students attend courses on campus and are never identified to the instructor as dual credit students. Students must meet admission and prerequisite requirements for courses, and they must also have signed permission forms from the high school principal and their parents. Dual credit is offered only for college-level courses; developmental courses may not be taken for dual credit. The dual credit program has been the focus of a recent CIP Team’s efforts, and this Team has made recommendations regarding marketing, admission, and evaluation of dual credit courses. In Fall 2002, 163 students from 11 high schools enrolled in courses for dual credit. These high schools included Argenta-Oreana, Central A&M, Clinton, Decatur Christian, Eisenhower, MacArthur, Meridian, Mt. Zion, Niantic-Harristown, St. Teresa, Warrensburg-Latham, and home study students. Adult Education The Adult Education program continues to grow and provide educational programming for a number of constituents in the District. On- and off-campus adult basic education and GED preparation courses are taught in various locations throughout the District each semester. In 2002, this program served 730 students, in Adult Basic Education, Adult Secondary Education, and English as a Second Language. Since the change in the structure of the GED test, programming has also changed to meet the needs of the students. At 15 teaching sites, a total of 83 courses were offered during day and evening sections. Recent research shows that completing a GED will decrease reliance on public assistance. As a result of the Richland Adult Education program, for example, in 2000 22 people were removed from public assistance roles due to course work for a total savings of $75,680. The Adult Education Department also provides community, family, and workplace literacy programming. In FY 2002, Project READ, the adult literacy program, 308 volunteers provided 19,030 hours of tutoring in the District. This program is operated by one full-time employee and two part-time coordinators and is currently housed at the Opportunities Center, although plans are in place to move Project READ to the Decatur Public Library. Another literacy program coordinated by the Adult Education Department is the Even Start Program, supporting young children and their parents in preparation for grade school activities. In 1998 the program served 42 families with 52
47
children, while in 2002, 72 families were enrolled with 119 child participants, a 58% increase in families and 43% increase in children served. English as a Second Language (ESL) students also benefit from the programming offered through the Adult Education Department. A part-time coordinator works with other departments in the College as well as with community agencies to assist a growing ESL population. Students who are currently enrolled in college-level courses and those who have expressed an interest have been able to enroll in a transition course specifically designed for them, and a new classroom has been equipped with materials and computer software dedicated to their use. In 1998, 55 students were served in on- and off-campus courses. In 2002, 67 students participated in daytime, evening, or Clinton ESL class. Also, students enrolled in Applied Learning Skills modules designed for ESL students to assist in transitioning to college-level courses. In FY02, adult education programs were funded by a number of grants. ●Illinois Community College Board—Main funding source for adult education $313,505 ●Secretary of State—Community Literacy—Penny Severns Literacy Grant $4,800 (new) ●Secretary of State—Family Literacy--$35,000 (same funding as FY01) ●Secretary of State—Project Read--$69,000 (increase from FY01) ●Illinois State Board of Education—Even Start Grant/Family Literacy--$215,000 The total funding from these sources is $637,303. The State has suspended the Special Populations Grant, and in total the Adult Education program is operating with approximately $100,000 less in the budget than last year. Continuing Education Public programming continues to serve the residents of the District with programs for all ages, from the Summer College for Youth to Education for Seniors. In FY01, 3109 students were served in Public Seminars and Workshops, generating $152,201 in revenue. Among the programs offered is the Dance program, initiated in 1999 and enrolling approximately 160 individuals of all ages in 2002. Additional courses are offered in a variety of areas, including computer training, leisure activities, and personal development. These courses are offered both on and off campus, allowing District citizens to attend in their own communities. Information about these programs is distributed through a schedule developed three times a year through the Herald and Review. Some of the technical training previously offered through Public Programming is now offered through the Business and Technology Center in the Business and Technology Division. Training from the former SHORE site has been moved to campus, and College employees also deliver workshops and other training at business and industries in the District. Since the last Environmental Scan, an AAS in Automotive Technology has been reinstated and moved to the Business and Technology Division, and students are able to complete ASE certification on campus in testing done two times a year.
48
The Shilling Center continues to be a location of choice for external groups to meet. Revenue of $9,851 was generated with 4,588 students served. In the recent reorganization, the Fitness Center coordination was moved from Lifelong Learning to Business Services. A total of 388 students participated in a variety of Fitness Center activities, generating revenue of $22,506 from Physical Education 100 and non-credit Fitness Center enrollment. New methods of marketing initiated this year are geared to involve more College employees in fitness activities. Academic and Student Support Services Kitty Lindsay Learning Resources Center The Kitty Lindsay Learning Resources Center (LRC) continues to provide critical academic support to students, faculty, staff, and community. The integration of technology into the LRC has continued, making it a “user” friendly place for patrons. Since the remodeling completed in 2001 with funds from the Kitty Lindsay Endowment, computer access for research, e-mail, and on-line courses has literally come to the front of the LRC. Many sources, such as the online public access catalog (DRA), allows patrons to access 50 area libraries from computers not only in the LRC but from home computers as well. Even though online sources are readily available, the LRC staff continues to purchase necessary materials not available or accessible online. In addition, the LRC continues to offer databases such as NewsBank and online periodical searching tools EBSCOHost and FirstSearch. Students are able to sign up for a free e-mail account and may access it from several terminals inside and outside the LRC. When remodeling of the Mueller Student Center is complete, a cyber café will be available with computers supplied by the Title III grant, enhancing accessibility. Technology Service In the past two years, 30 classrooms have been transformed to “smart” classrooms with the installation of a computer projection system connected to the Local Area Network. Faculty are able to incorporate PowerPoint presentations, online access, and more traditional videos into lectures and classwork without having to request the technology from AV. Work will continue in this area until all classrooms and labs are updated. A shift in use of the LAN for College administrative activities has also taken place. More regularly needed documents have been placed in a public access folder, allowing access and reducing paper use. Individuals may access the College Catalog, for example, to make changes as they arise; this information is then available for the Graphics Department to use when creating the next year’s catalog. The College community may also access Continuous Improvement Process Team Project information, minutes from various committees, and the Strategic Plan. Use of computer technology will only
49

increase in the future; the College must ensure that all employees have the same level of accessibility with appropriate computers and software. Developmental Education In 2001, Developmental Education was chosen as one of the Vital Few projects of AQIP; it was also designated as an important component of the Title III Grant, received in 1998. A large portion of Richland students continue to require coursework in reading, mathematics, and writing before they are able to enroll in College-level courses. Recent high school graduates as well as non-traditional students need to bridge the skills gap; 82% of students must take at least one developmental course. The retention rate for developmental courses is still at about 55-60%. Student Learning Center The Student Learning Center continues to serve students needing extra assistance in classes. Faculty and peer tutors work in small groups or one on one with students. Students may seek assistance by appointment or on a walk-in basis. Faculty tutors have degrees in specific content areas and often teach at the College or in a District high school. Peer tutors are recommended by faculty, have received an A or B in a course, and have a GPA of at least 3.0. Tutors work with students to help them in study skills and learning techniques for specific content areas. Computers with a variety of software programs are also available for students on a walk-in basis. In calendar year 2002, 3434 students (duplicated headcount) utilized the services of the Student Learning Center. Approximately 30 faculty tutors and 25 peer tutors work in the SLC, with one full-time director and one full-time and one part-time secretary. Assessment Services In Assessment Services, students may complete placement testing, make-up testing, and a variety of other tests. Assessment Services, also under the director of the Student Learning Center, is available 6 days a week for a total of 56 hours in the fall and spring semesters; no Saturday hours are available in the summer and between semesters. With the change to a full-time proctor from student proctors, traffic in Assessment Services has increased. In addition, testing for virtual courses often is administered in Assessment Services. Students also are able to leave and collect homework assignments, a convenience for both faculty and students in online courses. Placement testing is currently done online using ACCUPLACER a national placement test utilized by community colleges and four-year universities across the country. Eight computers are available in Assessment Services. This format allows for easier administration and reporting of placement scores to students and advisors. Off-campus placement testing is done at the Clinton Extension Center and at area high schools when advisors conduct scheduled registration.
50
In 2001, Assessment Services also became a certified VUE (Virtual University Examination) site, allowing students to complete certification in a variety of Information Technology areas. This program will continue to grow as more District citizens discover that they do not have to drive to Bloomington or Springfield to complete this testing. Disability Accommodation Services The Disability Accommodation Services Office, recently moved to the Student Life office suite, directly supports students with disabilities by offering a variety of services. In an effort to serve self-identified students with disabilities, the full-time professional works with faculty to assure that reasonable accommodations are available for students to complete the requirements of the course. In order to be served by the program, students must present appropriate documentation indicating their disability or work with the DAS Office to secure appropriate documentation from community agencies. Services provided can include screen readers, enlarged textbooks or books on tape, note takers, computer software and computer adaptations, and special instructional materials. This program is partially funded by the Tort Liability Fund and works to maintain compliance to the Adults with Disabilities Act. In the Spring 2002 semester 132 students were enrolled, in Summer 2002 56 students were enrolled, and in Fall 2002 153 students were enrolled, with 52 of these being newly enrolled students. This program will continue to grow as outreach to local high schools continues. Student Support Services/TRIO Program With the awarding of a Federal TRIO grant in 1997, Richland established the Student Support Services/TRIO program on campus. This program is designed to offer academic support to 150 individuals in three target student populations: first-generation, low-income, or students with disabilities, or some combination. These students may be enrolled full or part time. A director, two advisors, an academic support specialist, and secretary, all full time, offer counseling and academic support services as well as cultural opportunities through workshops, cultural trips, individual assistance. The goal of the program is to assist students in reaching their graduation goals and preparing to transfer or enter the workplace. For 2002, the graduation rate of TRIO participants was 83%, compared to 21% for TRIO eligible students, and 16% non-eligible students. The grant was renewed in 2001 for 5 years at $216,327 per year. Title III Federal Grant Projects In 1998 Richland was awarded a five-year grant under Part A of the Title III program. Richland’s proposal was divided into two parts: Activity 1, Student Services—Critical Intervention to Increase Student Success, and Activity 2, Improvement of Academic Programs and Equipment. An additional component allows for a Project Manager and Secretary to support grant operations. Activity 1 was designed to develop and implement new intervention strategies to increase and support student retention and success at Richland. Activities supported by Title III included Assessment and Placement, Early Alert, Faculty Advising, Career Planning and Placement, Tutor Certification, and Developmental Education. Faculty and staff were
51

involved in a number of enterprises that worked on strategies to improve and enhance these areas. Activity 2 allowed the College to focus on five high priority technical areas and develop competency-based curricula with the utilization of the DACUM process, where experts were brought in for day-long sessions on core competencies for specific occupations. In addition, faculty development activities included technology training, syllabus building, and tactics for dealing with non-traditional students. Title III funding will end in September 2003, and the College will have received $973,127 in federal dollars over the length of the Project. Personnel Profile of Faculty and Staff RCC has 199 full-time employees broken into eight job classifications. Of these eight categories, Faculty represent 31% of the total, followed by Clerical at 28%, Professional/Technical and Administrative at 15% each, and Other at 7%. The remaining 4% consists of Custodial/Maintenance, Supervisory, and Academic Support. Ethnicity is 90% White, 7.5% Black, with the balance as Asian American, Native American and Hispanic. By gender, 67.8% of full-time employees are female and 32.2% are male. For the Faculty 54.1% are male and 45.9% are female; Clerical consists of 7.3% male and 92.7% female; Professional/Technical with 10.3% male and 89.7% female; Administration with 35.7% male and 64.3% female; Other with 42.9% male and 47.1% female; Maintenance with 100% male; Supervisory with 25% male and 75% female; and Academic Support with 67% male and 33% female. The average age of full-time employees is 47.4 years, with females at 46.8 and males at 48.7. By classification, the average age of the Administration is 49.3 years, followed by the Faculty at 49.2 years, Clerical at 48.2 years, Maintenance at 46.5 years, Supervisory at 45 years, Professional/Technical at 43.8 years, and Academic Support at 42 years. As a percent of total full-time employees, 23% are under age 40, 47% are from 40 through 59 years of age, and 5% are 60 and older. The average length of service for full-time employees is 8.2 years. Of these, 30% have less than 5 years of service, 12% have from 6 through 10 years, 10% have from 11 through 15 years, 3% have 16 through 20 years, and 17% have 21 or more years. For the 171 full-time employees with college degrees the breakdown includes 7% with Doctorates, 41.5% with Masters/Professional degrees, 24.6% with Bachelor degrees, and 26.9% with Associate degrees. RCC has 206 part-time employees, of which 170 (82.5%) are Adjunct Faculty and 36 (17.5%) are classified as Staff. For the staff, 52.8% are classified as Other, 27.8% as Professional/Technical, 16.7% as Administration, and 2.8% as Maintenance. Ethnicity is 88.8% White, 5.8% Black, and 0.5% Asian American. For the balance of part-time employees, no ethnicity was provided.
52
By gender, 53.4% of part-time employees are female and 46.9% are male. For the Faculty 50.6% are male and 49.4% are female; Professional/Technical with 30% male and 70% female; Administration with 16.7% male and 83.3% female; Other with 26.3% male and 73.7% female; and Maintenance with 100% male. The average age of part-time employees is 48 years, with females at 48 and males at 47.9. By classification, the average age of the Administration is 54.2 years, followed by Maintenance at 49, Faculty at 48.3 years, Professional/Technical at 45.8 years, and Other at 44.4 years. As a percent of total part-time employees, 22.3% are under age 40, 64.1% are from 40 through 59 years of age, and 13.6% are 60 and older. For the 190 part-time employees with college degrees, the breakdown includes 3.7% with Doctorates, 48.4% with Masters/Professional degrees, 37.9% with Bachelor degrees, and 3.7% with Associate degrees. The remaining 6.3% of part-time employees have degrees classified as Other. During the past five years, the College has experienced a somewhat high rate of turnover. 30% of the employees have less than 5 years of service at the College. The turnover can be attributed to a large number of retirements, the addition of new positions on campus, and the movement of some administrators to other positions at other institutions. Of the 199 employees, 10% are minorities, 68% are female and 32% are male. Although male employees comprise only 32% of the College’s full-time employees, they outnumber females in faculty, academic support and maintenance positions. The College continues to look for ways to actively recruit underrepresented groups when vacancies occur, and has adapted job descriptions/workloads/building accommodations to allow disabled employees to obtain employment. Qualifications for full-time instructors at Richland include completion of at least a master’s degree or, in the case of an occupational program instructor, equivalent training and experience. The educational credentials of all full-time employees includes 7% with Doctorates, 41.5% with Masters/Professional degrees, 24.6% with Bachelor degrees, and 26.9% with Associate degrees. Employee Issues Diversity has been a long-term goal of the College, and one strategy to support diversity has been to offer diversity training for all employees. Several years ago, the College initiated a procedure that required any employee serving on a search committee for a new employee to have been through diversity training. To date, 58 full-time faculty (representing 90.6% of the faculty) and 113 full-time staff (representing 83.1% of total staff) have completed the diversity training. The College has made a strong effort to increase awareness of job openings in diverse markets and to make accommodations that will enable persons with disabilities to feel comfortable working and attending class at Richland. The College has piloted a “grow your own” internship program for hard to replace faculty positions. The program recruits individuals who are pursuing master’s degrees and interested in teaching at the community college level. Recent focus groups suggested that while the College is doing a fair job with diversity issues, the College needs to increase awareness of diversity for students, increase its understanding of
53

student needs with respect to diversity, help students become more aware of the wide range of services available, and expand recruiting efforts of employees and students. The issue of training is of vital importance to College employees. Employees have indicated that focused modules of training/development are needed on Staff Development days and throughout the year. Employees appear to be satisfied with the training opportunities available for the use of computer programs such as Word, Excel, Outlook, and Access. Faculty would like to see the development and training of new faculty and adjunct faculty, and staff members are requesting supervisory and customer service training. A current trend at Richland and other community colleges is the high number of retiring faculty and senior staff members who will take with them an extensive subject knowledge and college history. There is interest in finding ways for these experienced faculty and staff to share their expertise with newer college faculty and staff. Communication continues to be a focus of attention. Employees seek information about various divisions, progress reports on College initiatives, employee contributions and successes, decision-making, and continuous improvement processes. As continuous improvement initiatives are grafted into the College operations, improved communication should naturally follow. In addition, specific activities are being developed that will make renewed efforts to make employees feel valued and involved in the College. Financial Resources Financial Profile Richland Community College receives operating revenue from four primary sources: local property taxes, state sources, tuition and fees, and other sources. Operating revenue is accounted for in the General Fund, which consists of the Education Fund and the Operations & Maintenance Fund. The College operates on a fiscal year that begins July 1 and concludes on the following June 30. For FY2002-03, budgeted revenue for the General Operating Fund includes the following:
Local Sources $4,357,500 State Sources 2,941,807 Tuition & Fees 3,205,487 Other Sources 402,100
________ $10,906,894
The General Operating Fund revenue for FY03 is 40% Local Revenue, 29.4% Tuition and Fees, 27% State Revenue, and 3.7% Other Sources. The Education Fund is used to account for all educational activities of the College, including all instructional, administrative, and related support expenditures. Total revenue and expenditures budgeted for the Education Fund for FY03 are $9,807,640. The Operations & Maintenance Fund is used to account for transactions related to the improvement, maintenance, repair, or benefit of buildings and property, utilities, supplies, equipment, and staffing related to those activities. The FY03 budget for the Operations & Maintenance Fund is $2,958,011.
54

Local sources of revenue include property taxes, chargebacks, and interest earned on property taxes. Property taxes constitute the largest single source of revenue. In 2001, the College District has an equalized valuation (EAV) of $1,717,217,812 which reflects an increase of 3.2% from the prior year. FY2003 budgeted property tax revenue for the Educational Fund is $3,657,000, an increase of over $122,000. State sources of funding include credit hour based apportionment and Replacement Taxes. In addition to credit-hour apportionment, the College receives numerous restricted categorical grants from the Illinois Community College Board (ICCB). The Base Operating Grant remains flat with the prior year. However, the College’s eligibility for the state’s Equalization Grant will kick in for FY2003, netting the College an additional $500,000. Tuition and fees include tuition for credit and non-credit classes and various fees. The current tuition rate is $48 per credit hour, plus a $4.00 per credit hour Academic/Technology Fee. Fees for FY2004 will include an increase in tuition to $49 per credit hour and $4.50 per credit hour for the Academic/Technology Fee. The College has experienced an increase in enrollment over the past two years, which in turn is reflected in increased revenue from student tuition. The Operations & Maintenance Fund receives revenue from two major sources: property taxes and student tuition and fees. The property tax rate for this fund is fixed at .05 cents per $100 in EAV. For FY 2003, revenue from property taxes is budgeted at $683,500. Revenue from credit tuition ($351,109) is also allocated to this fund to meet ongoing building maintenance and operation needs. Financial Aid Annually, two-thirds of Richland students receive some type of federal, state, institutional, foundation, or local financial assistance. In 2001-02, 853 students received a federal Pell Grant award. Amounts of the award varied but nearly $1.2 million was awarded overall. State funded Illinois Monetary Awards were given to 744 students for a total of nearly $592,000. Students also received funding from the federal work-study program, guaranteed student loans, and other scholarships, grants, and tuition waivers. The College projects an increase in the number of students who will receive federal and state dollars as a result of a soft economy, high unemployment for this region, and the rising cost of tuition at post-secondary schools. 2001-02 saw a large increase in the number of students receiving funds from the Job Training Partnership Act (now called the Workforce Investment Act or WIA). The number nearly doubled from 156 on 2000-01 to 294 in 2001-02 due to several plant closings and workforce reductions in this area. The Richland Foundation continues to provide funding for students through scholarships. The types of different scholarships available to students has increased each year although funding from the endowed scholarship funds has decreased in the last two years due to
55

changes in the stock market. In FY2003, $115,000 was available for scholarships but in FY2004, only $66,000 will be available. In 2002, the Richland Board of Trustees approved an RCC Trustees Scholarship, which is a tuition waiver for up to two years of college for high school graduates in the top 10% of their class or with an earned grade point average of 3.5 on a 4.0 scale who attend Richland the fall immediately following graduation. In the first year of the program, 43 high school graduates took advantage of this scholarship program. College Research All-College Survey A College Climate Survey was created at the beginning of the Fall 2002 semester and conducted among employees who attended an All College Meeting held in August. The purpose of the survey was to gather information on employee experiences at Richland. All employees were invited to attend and approximately 75-80% of the College’s full-time employees and 25% of the part-time employees attended. Nearly all of the administrators and professional/technical, 50% of the classified staff, and 40% of the faculty, mostly full-time, attended the meeting. The survey indicated that overall Richland’s employees feel they are part of a culture that promotes learning, offers a variety of courses/programs, has good facilities, and often fulfills its mission. Employees feel the College has a good reputation within the community and makes a valuable contribution to the local economy. Employees feel that improvements are needed in the areas of communication, as relates to being informed regarding College operations and that they need more involvement. Other areas for improvement include the guidance/mentoring of new employees, integration of core values, effective use of data for decision-making and to improve College functions, collaboration of departments/divisions in meeting College goals, and the aligning of department/division goals with College goals. The evaluation of the All College Meeting was generally positive with 42% of the employees stating they were “very satisfied” or “satisfied”, and another 25% stating they were “somewhat satisfied” with the meeting. Written comments generally reflected satisfaction with the meeting as well. Employees found the greatest strengths of the Meeting to be communication of information; including/involving everyone; meeting new employees; Dr. Jensen’s presentation on AQIP and sense of humor; the president’s address and vision for the College; emphasis on teamwork; positive, affirming tone, and the evening/morning attendance option. Employees felt the meeting could have been improved by providing breaks; closing the College so everyone could attend; having the meeting during work hours; giving more advance notice; providing a full meal; and improving the readability of the slides. Student Satisfaction Survey 2002 graduates were asked to complete a satisfaction survey. Of 367 students surveyed, 157 responses were received. 70% were female and 30% were male. Over 40% of the
56
students were 24 years of age or younger, over 30% were between 25 and 39, and 28% of the respondents were 40 or older. 60% of the students who responded were full-time and 40% were part-time. Students expressed very high satisfaction with the usefulness of course content and instructor’s interest in the progress of students. Some dissatisfaction was shown for course scheduling patterns, although 89% of the students were satisfied. 91% of the students felt the Student Services staff was responsive to their needs and 97% were satisfied with registration procedures. The Learning Resource Center received high marks for both the helpfulness of its staff and the materials found in the LRC. The physical facilities of the campus received 94% satisfaction for the campus building, classrooms, and parking areas, and 91% satisfaction for the availability of study areas on campus. The Business Office received very high marks (97%) for students’ satisfaction with procedures and the helpfulness of the staff. In other areas, 99% of the students were satisfied with the readability of the class schedule and student handbook, and 97% were satisfied with the overall quality of the College. Faces of the Future Survey In the fall of 2002, a Faces of the Future survey was conducted to measure student expectations and experiences at Richland Community College. Of the 630 students identified (random stratified sample) to take the survey, 438 students completed the survey. Of these, 44 students were non-credit students. Of the credit students completing the survey, 75% reported they were very satisfied to satisfied with Richland overall. Compared to a 1999 Faces of the Future survey, this number represents an increase of 66%. For both surveys, less than 5% of the students were dissatisfied, and the remaining students were either neutral or left the question blank. Overall, the results from both the 1999 and 2002 survey were very similar. The results that were different are noted below. The most notable finding and change from fall 1999 stemmed from computer use and related items not addressed in the earlier survey. Students in the 2002 survey used the Internet substantially more than those from 1999. Over 80% of the students now have Web access and an email address at home, but nearly three-fourths did not have a Richland email address. However, 67% had Web access through the College. Over 50 % of the students surveyed were full-time students, under the age of 25, had parents whose highest level of education was high school or less, and the majority of the students were employed at least part-time. With respect to goals, students felt it was most important to have a steady, secure job; time for personal/family interests; be self-reliant; be a parent; and help others who are in need. The major source of funds to pay for classes was their own income and financial aid. No significant problems were encountered while taking classes, but some minor ones were related to personal finances, cost of course materials, and family/job related responsibilities. In 2002, the cost of a computer was less of a concern to students than in 1999.
57

The students reported taking courses needed for their future job, for transfer, and to earn a degree/certificate. The majority of the students responding had been at Richland one year or less. The most useful sources of information about the College came from a catalog/brochure/flier, family member/friend, and high school teacher or counselor. The more important factors in the students’ decision to attend Richland were distance from home, cost, a particular program, variety of courses, availability of financial aid/scholarships, and the academic reputation of the College. Planning Papers Focus Groups In January 2003, the Strategic Planning Taskforce held focus groups to discuss the contents of several Planning Papers written by Strategic Planning Taskforce Members based on information gathered during the Internal and External Scans. All full-time and part-time employees, including faculty and adjunct faculty, were requested to attend an assigned session. Two focus groups per topic paper were held. The focus groups were given a specific paper to read during the session, along with a demographics paper (designated as Paper 1). Focus group participants were asked to help form strategies for RCC related to the Planning Papers. The following notes represent the comments provided by the College employees. Strategic Themes from Focus Groups
Planning Paper Planning Paper #2: Student and Employee Diversity • Required diversity training for all employees (as a part of the employee orientation process) • Increase recruiting efforts in general, not just for diverse groups e.g. increase student awareness of available services through orientation, booklet, faculty/staff as important sources of information • Increase awareness of diversity for students, employees via email, newsletter, etc. • Increase participation in student life events • Increase awareness of student needs (with respect to diversity)
Planning Paper #3: Financial Resources • Evaluate cost-effectiveness of alternate programs and on-ground class size • Evaluate marketing of scholarships and tap into more local organizations for scholarship money and marketing • Increase access to grant writing opportunities • Encourage in-house cost cutting • Evaluate energy use and other maintenance costs • Use in-house experts for training to reduce costs
Planning Paper #4: College Preparation • High School Contacts Transitional programs to support SCANS competencies
58

Upper-level courses offered at RCC rather than high schools (increased dual credit offerings) Regular articulation with faculty in disciplines Organize job shadowing for high school students Design program brochures with high school students as target audiences (including required competencies) • Dislocated Workers Regular articulation with external agencies, including regular cross training Specific program liaison with regular contact with external agencies Cohorts established for program majors and peer counseling • Mandatory orientation for all students, including LASSI Perhaps gear orientations for different groups (recent graduates, dislocated workers, returning adults) • Increased mentoring programs, with designated places to meet • Marketing of College programs targeted to cohorts
Planning Paper #5: Student Outcomes Assessment • Involve local businesses in planning programs • Education of College community on institutional effectiveness (staff development topic) • Improve communication about IE and outcomes, including vocabulary. • Increase visibility of information pieces like Institutional Data Book • Involve students in “marketing” IE and Outcomes Assessment • Relate IE and Outcomes to all areas of the College
Planning Paper #6: Alternative Delivery Systems • Increase training opportunities for faculty and staff • Improve screening for students in virtual classes • Maintain contact with business and industry on current technology so that training and tools used on campus will be worthwhile for students • Evaluate current alternate delivery systems to make sure they are still worthwhile • Increase technology training for students—mandatory for some delivery systems like virtual courses • Develop methods to keep all course content and outcomes consistent, regardless of delivery methods
Planning Paper #7: Technology Technology concerns ▪Communication from outside business/partnerships •Determine current and future needs •Company influence- Careful not to jump on a “band” wagon too quickly Conducting research before buying new technology to determine quality as well as actual need Technology education in and out of classroom Model technology. “Practice what we preach” • Find out if what they learned here prepared them for their career. Technology Training
59

▪Ongoing Workshops for students, staff and community • Workshops for word, navigation of the “net” - Short and targeted. •Teaching applications on a non-site licensed product and expecting the respective divisions to purchase the application although they were not given a choice. i.e. Dreamweaver (web development application) •Dial-up access for students •Provide incentives •Getting a minimum definition of computer competency and determining ways to establish minimum competencies •Technology competency for new staff Technology funding ▪ Company partnerships • Keep in touch with employers ▪ Technology Grants
Planning Paper #8: Training & Internal Communications Training Opportunities ▪Adjunct faculty needs
time, facilitator, orientation , web tutorials, mentoring ▪Other needs
communication, orientation, emergency training, customer service, phone etiquette, etc.
Effective Communication ▪User-friendly ▪Communicate themes College deems important to all levels ▪Current, centralized, consistent easily-accessible information communicated Other needs ▪Staff Development Day
Planning Paper #9: Advising & Counseling Definition of advising/counseling Improved consistency and correctness in information and advice Evaluation of need for more advisors or different ways of advising students Need for dedicated advisor for each student Need counseling by department/career Training is key to good advising and counseling Examine use of current career interest instruments Advisor training for customer service, program information, services availability Need for orientation offered in a number of ways Learning styles training
Planning Paper #10: Emerging & Diverging Job Trends Strengthen & build partnerships with area business, industry, government, and educational entities ▪increase promotion of RCC
60

▪communication of contacts & needs of businesses ▪Funding initiatives-increase contacts, training e.g. grants, legislators ▪Use of advisory Relevant occupational programs (allied health, hospitality services, landscaping, teaching assistant) to bring in high-wage not minimum-wage jobs
61
BIBLIOGRAPHY “America’s Largest 500 Corporations 2002.” Fortune April 15, 2002: N.p. Armas, Genaro C. “Poverty Rises, Income Falls.” Decatur [IL] Herald & Review Sept.
25, 2002: A1. Avila, Oscar. “Hispanics’ Collegiate Challenge Is Full Time.” Chicago Tribune Sept. 6,
2002: 1. Banchero, Stephanie. “Everyone’s into ACT, and It Shows.” Chicago Tribune Aug. 21,
2002: N.p. Board of Governors of the Federal Reserve System. Federal Reserve Bulletin.
Washington, D.C.: GPO, October 2002. Burd, Stephen. “Lack of Aid Keeps 170,000 from College, Report Says.” Chronicle of
Higher Education July 5, 2002: N.p. Burleson, Robin J. “Nursing Shortage Sparks Local Enrollment.” The Argus [Rock
Island, IL] Aug. 19, 2002: N.p. Caperton, Gaston. Letter to Dr. Saunders regarding cost of tuition and fees and trends in
financial aid. (President, The College Board, New York, NY) October 15, 2002. Carter, Patricia, Leatha Terwilliger, Richard L. Alfred, David Hartleb, and Beverly
Simone. “Developing Strategic Leaders.” Community College Journal Aug/Sept 2002: 22-25.
“Center of the Workforce Development.” Community College Journal N.d. Chesley, Nancy. “Overhaul of School Funding Endorsed.” Decatur [IL] Herald &
Review Sept. 4, 2002: N.p. ---. “Higher Education Takes Funding Hit.” Decatur [IL] Herald & Review May 28,
2002: N.p. Chronicle of Higher Education Almanac, 2002-03: Roll Call of the States. October
2001. Churchill, Theresa. “Education on the Rise.” Decatur [IL] Herald & Review 2002 N.d. City of Decatur, Illinois. Department of Community Development. Comprehensive
Plan: Decatur, IL. Decatur: City of Decatur, 1991. ---. Department of Public Works. Public Works Infrastructure: Value, Condition, and
Priority Needs. City of Decatur, 1995. Yearly Update for 2001.
62

“Colleges and Universities.” Illinois Board of Higher Education. July 2, 2002.
www.ibhe.org “Colleges Leading Charge in Battle to Recruit Nurses.” Chicago Tribune July 14, 2002:
N.p. Darling, Dr. Linda. “Teacher Quality and Student Achievement: A Review of State
Policy Evidence.” Journal of Education and Policy Analysis 2000: N.p. “Defining Quality.” Community College Journal Aug/Sept. 2001: N.p. Dell’Angela, Tracy. “Illinois’ Brightest Boost SAT Scores, Ranking.” Chicago Tribune
Aug. 28, 2002: N.p. Dudek, Virginia. “Skills Shortages Survive in Slow Economy.” Decatur [IL] Herald &
Review Sept. 22, 2002: N.p. Evelyn, Jamilah. “Community Colleges Play Too Small a Role in Teacher Education,
Report Concludes.” Chronicle of Higher Education Oct. 24, 2002: N.p. Frazier, Mike. “Working for a Living.” Decatur [IL] Herald & Review Sept. 1, 2002:
N.p. Freidel, Janice Nahra, and Joel D. Lapin. “Environmental Scanning Practices for Rural
Colleges.” Portrait of the Rural Community College. New York: Jossey Bass, 1995. N.p.
“Funding Lifelong Learning.” Community College Journal December/January 2002:
N.p. “Giving Credit Where Credit Is Due.” Community College Journal Aug/Sept 2001: N.p. Gottlieb, Karla. “Sept. 11 Inspires New Focuses in Service Learning.” Community
College Times July 9, 2002: N.p. “Health Benefits Shrink as Costs Rise.” Decatur [IL] Herald & Review Sept. 6, 2002:
N.p. “Help for Learning Disabilities Varies at Colleges.” Chicago Tribune July 14, 2002: N.p. “Illinois ACT Scores Drop.” Decatur [IL] Herald & Review Aug. 21, 2002: N.p. Illinois Department of Agriculture, Illinois Agricultural Statistics Service. 1997 Census
of Agriculture. 1999. Sept. 20, 2002. http://www.agstats.state.il.us/website/reports.htm
63

Illinois Department of Commerce and Community Affairs. Economic Impact of Illinois Exports, Foreign Direct Investment, and Tourism 2001. 2001. Sept. 10, 2002. http://www.commerce.state.il.us/bus/ito/statistics.html
---. Economic Profile for DeWitt County, Illinois. 2002. Sept. 10, 2002.
http://www.commerce.state.il.us/bus/research/index.html ---. Economic Profile for Macon County, Illinois. Sept. 10, 2002.
http://www.commerce.state.il.us/bus/research/index.html Illinois Department of Employment Security, Economic Information and Analysis
Division. Illinois Job Outlook. Springfield, IL: State of Illinois, 2002. ---. Industry Projections 1998-2008 for Richland Community College District.
Springfield, IL: State of Illinois, 2002. Illinois Department of Transportation. Decatur Transportation Improvement Project
(TIP). Contact: Jody Rooney. 2002. Illinois State Board of Education. “2001-02 School Year Report Card District
Summary. 2003. Distributed in Decatur Herald & Review. “International Programs Require Adequate Funding, Ward Tells Congress.” Higher
Education and National Affairs, American Council on Education, April 29, 2002: N.p.
Kent, Evelyn L. “Colleges Find Ways to Graduate More Nurses.” Community College
Times July 23, 2002: N.p. ---. “Programs to Promote Articulation.” Community College Times July 9, 2002: N.p. Kent, Evelyn L., and Katherine Shek. “Education Responds to IT Security Training
Needs.” Community College Times July 9, 2002: N.p. Kleiman, Carol. “A Pat on the Back Helps.” Decatur [IL] Herald & Review Aug. 18,
2002: N.p. Kulp, Jim. “LCCC Board Oks Five-year Strategic Plan.” The Telegraph [Alton, IL] Jan.
10, 2002: N.p. Lawrence, Curtis. “Blagojevich Wants Tuition Fix.” Chicago Sun Times Sept. 4, 2002:
N.p. Levine, Arthur E. “The Future of Colleges: 9 Inevitable Changes.” Chronicle of Higher
Education Oct. 27, 2000: N.p. Little, George W. “Resolving the Leadership Crisis.” Community College Journal
Aug/Sept 2002: 33.
64
“Living the Campus High Life.” Editorial. Chicago Tribune Sept. 1, 2002: N.p. Marcinkowski, Gene. Personal Interview. February 2003. Merrow, John. “Taking the Measure of a School.” New York Times: Education Life
Jan. 13, 2002: N.p. “More Students Are Now Prepared for College But Gains in Other Areas Are Slight.”
Measuring Up 2002: The National Picture. Prepared by The National Center for Public Policy and Higher Education, 2002.
Nelson, P.L. “Off to College? Wash Your Hands and Get Ready to Be Homesick.”
Chicago Tribune Aug. 25, 2002: N.p. “Overview and Highlights of NCLB.” Illinois State Board of Education. 2002. Sept. 24,
2002. www.isbe.net “Question of Ambition.” Chicago Tribune Sept. 1, 2002: N.p. Reid, Tony. “Hard Times Ahead.” Decatur [IL] Herald & Review Sept. 22, 2002: N.p. Richland Community College. “Breakdown of Student Population by Community and
Zip Code, Academic Year 2001-2002.” Sept. 15, 2002. (Accessed from CARS.) ---. Environmental Scan FY 1996-97, FY 1997-98. Institutional and Financial Planning
Committee, 1997. ---. High School Follow-up Report Fall 2002. Decatur, IL: RCC, 2003. ---. Institutional Data Book 2003. Decatur, IL: RCC, 2003. Schemo, Diana Jean. “Report Finds Minority Ranks Rise Sharply on Campuses.” New
York Times Sept. 23, 2002. “Special Report: Funding Community Colleges.” Community College Week July 22,
2002: N.p. “13,000 Chicago students to repeat grade.” Decatur [IL] Herald & Review Sept. 15,
2002: N.p. “2-year Campus Residential Facilities.” Community College Journal April/May 2002:
N.p. Toppo, Greg. ”Corporate Cutbacks Mean Gains for Schools.” Decatur [IL] Herald &
Review Aug. 18, 2002: N.p.
65

U.S. Postal Service. U. S. Gazetter, Tiger Map Browser Zip Code and Population Database. October 1, 2002. <Servicehttp://www.census.gov/cgi-bin/gazetteer>
U.S. Census Bureau. Current Population Reports 2000: Profile of General
Demographic Characteristics, and Population Projections of the United States by Age, Sex, Race, and Hispanic Origin: 1995 to 2050. 2001. Sept. 28, 2002. <http://factfinder.census.gov/servlet/BasicFactsServlet>
---. Poverty in the United States. 2002. Sept. 10, 2002.
http://factfinder.census.gov/servlet/BasicFactsServlet ---. Profile of General Demographic Characteristics, Census Years 1980, 1990 and
2000. 2002. Sept. 10, 2002. http://factfinder.census.gov/servlet/BasicFactsServlet ---. Selected Economic Characteristics for 2000. 2002. Sept. 10, 2002.
http://factfinder.census.gov/servlet/BasicFactsServlet ---. Statistical Abstract of the United States 2001. 2002. Sept. 20, 2002.
http://www.census.gov/prod/www/statistical-abstract-02.html Von Bergen, Jane M. “Job Hunt Proves Fruitless for Many.” Decatur [IL] Herald &
Review Sept. 15, 2002: F1. Wells, Valerie. “RCC Opens ‘Technicollege.’” Decatur [IL] Herald & Review Aug. 15,
2002: N.p. Wessel, Harry. “Research: 50 Percent of Meeting Time Unproductive.” Decatur [IL]
Herald & Review Aug. 18, 2002: F1. Wheeler, Charles N., III. “Huge Revenue Hurdle Awaits Next Governor.” Illinois Tax
Facts (Taxpayers Federation of Illinois) October 2002: 1-8. Young, Jeffrey. “The 24-hour Professor.” Chronicle of Higher Education May 31,
2002: N.p.
66

APPENDIX
67

Evolving Demographics RCC Planning Paper #1
The purpose of this paper is to examine evolving population demographics with the Richland Community College (RCC) District #537. An understanding of population trends will enhance RCC’s ability to respond to changing community needs. RCC serves an eight-county district in central Illinois. It includes all of Macon County and most of DeWitt County, and also extends into the counties of Christian, Logan, Moultrie, Piatt, Sangamon, and Shelby. RCC serves a population of 140,000 and covers 1,114 square miles. Even though RCC includes eight counties, more than 90% of the District’s tax base and population are located in Macon and DeWitt Counties. From 1980 to 1990, Macon County had a decline in population of about 11% and DeWitt County had negative growth of nearly 9%. In comparison, Illinois population growth was flat, while the U.S. grew by about 10%. For the period 1990 to 2000, DeWitt County had growth of less than 2%, while Macon County showed a further decline of nearly 2%. For this same period, Illinois grew by nearly 9% and the U.S. growth rate was a little more than 13%. Macon and DeWitt Counties’ populations are predominantly white, although DeWitt is well above the national average. In DeWitt County, whites account for 97.8% of the population, while in Macon County whites represent 83.5% of the population. In Macon County, African-Americans represent 12.1% of the population while in DeWitt County, African-Americans account for 0.5% of the population. Asian, American Indian/Alaska Native and Other ethnicities represent 2.4% of the population in Macon County and 0.9% of the population in DeWitt County. Included in the Other category is Hispanic which represents less than 0.2% of the population in DeWitt County and less than 1.6% of the population in Macon County. In comparison to the state and nation, the RCC District is less racially diverse. Table 1 provides selected demographic data for DeWitt and Macon Counties, the state of Illinois and the United States for 1980, 1990 and 2000. Other demographic data shows that for the four areas surveyed, males represent 48% to 49% of the population, with females making up the balance of 51% to 52%. Based on age distribution, 27% to 29.1% of the population is less than 20; 33.1% to 37.5% of the population is 20 through 44; 17.8% to 19.7% of the population is 45 through 59; and 15.7% to 20.5% of the population is 60 and older. Comparing Illinois and U.S. data to DeWitt and Macon Counties, the two counties have smaller proportions of their population in the less than 20 age category and in the 20 through 44 age category. For the proportion of the population 60 and over, the two counties have greater proportions of their population in this age category as compared to Illinois and the U.S. Table 1 provides a detailed analysis of the population characteristics for DeWitt and Macon Counties, Illinois and the United States.
68

Table 1. Selected Demographics for DeWitt and Macon Counties, Illinois, and the United States for 1980, 1990, and 2000.
DeWitt
County Macon County
Illinois
United States
Population: 2000 16,798 114,706 12,419,293 281,421,9061990 16,516 117,206 11,430,602 248,709,8731980 18,108 131,375 11,427,409 226,542,199% Change (1980 to 1990) -8.8 -10.8 0.0 9.8 % Change (1990 to 2000) 1.7 -2.1 8.6 13.2 % Age Distribution in 2000
Under 5 6.2 6.4 7.1 6.8 5 – 9 6.9 6.9 7.5 7.3 10 – 14 7.0 7.1 7.3 7.3 15 – 19 6.9 7.3 7.2 7.2 20 – 24 5.2 6.7 6.9 6.7 25 – 34 12.3 11.6 14.6 14.2 35 – 44 16.0 14.8 16.0 16.0 45 – 54 13.2 14.4 13.1 13.4 55 – 59 5.6 5.3 4.7 4.8 60 – 64 4.7 4.3 3.7 3.8 Over 65 15.8 15.3 12.0 12.4 % Males to Females in 2000 48.9 47.7 49.0 49.1
Population by Race in 2000
White 97.8 83.5 73.5 75.1 African American 0.5 14.1 15.1 12.3 Asian 0.3 0.6 3.4 3.6 Am. Indian / Alaska Native 0.2 0.2 0.2 0.9 Other 0.2 1.6 7.8 8.1
Sources: U.S. Census Bureau, Profile of General Demographic Characteristics for 2000,
and Census data for 1980 and 1990.
69
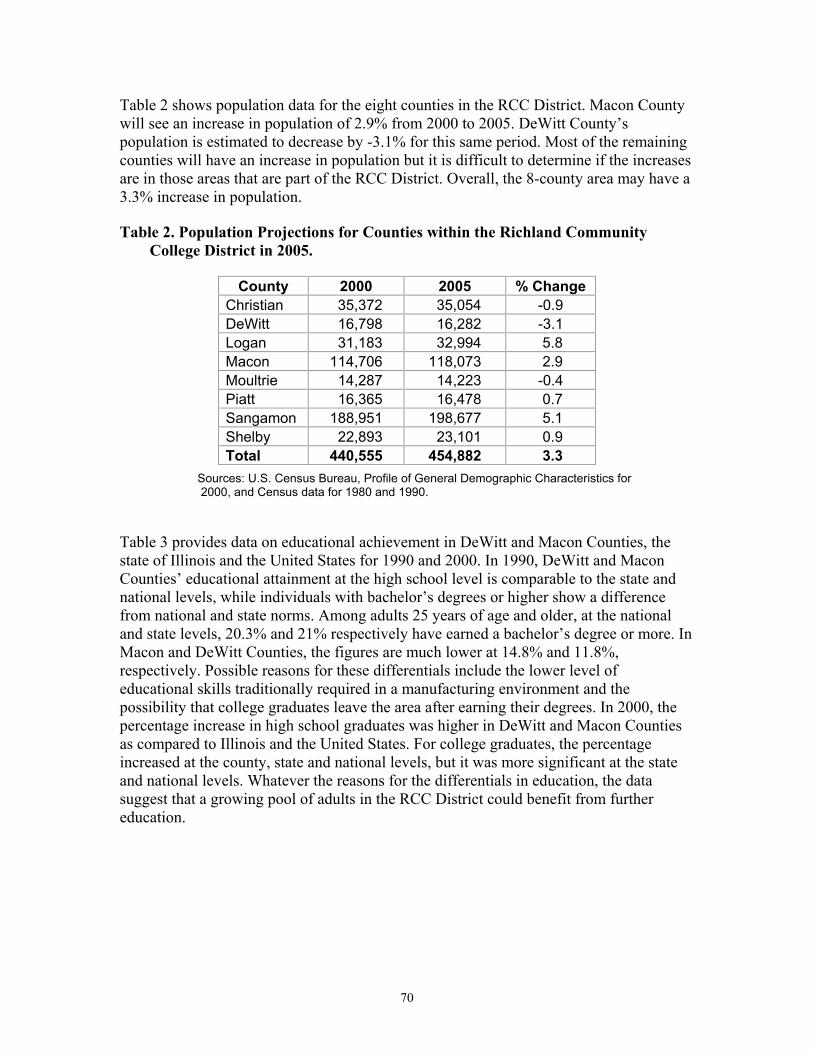
Table 2 shows population data for the eight counties in the RCC District. Macon County will see an increase in population of 2.9% from 2000 to 2005. DeWitt County’s population is estimated to decrease by -3.1% for this same period. Most of the remaining counties will have an increase in population but it is difficult to determine if the increases are in those areas that are part of the RCC District. Overall, the 8-county area may have a 3.3% increase in population. Table 2. Population Projections for Counties within the Richland Community
College District in 2005.
County 2000 2005 % Change Christian 35,372 35,054 -0.9 DeWitt 16,798 16,282 -3.1 Logan 31,183 32,994 5.8 Macon 114,706 118,073 2.9 Moultrie 14,287 14,223 -0.4 Piatt 16,365 16,478 0.7 Sangamon 188,951 198,677 5.1 Shelby 22,893 23,101 0.9 Total 440,555 454,882 3.3
Sources: U.S. Census Bureau, Profile of General Demographic Characteristics for 2000, and Census data for 1980 and 1990.
Table 3 provides data on educational achievement in DeWitt and Macon Counties, the state of Illinois and the United States for 1990 and 2000. In 1990, DeWitt and Macon Counties’ educational attainment at the high school level is comparable to the state and national levels, while individuals with bachelor’s degrees or higher show a difference from national and state norms. Among adults 25 years of age and older, at the national and state levels, 20.3% and 21% respectively have earned a bachelor’s degree or more. In Macon and DeWitt Counties, the figures are much lower at 14.8% and 11.8%, respectively. Possible reasons for these differentials include the lower level of educational skills traditionally required in a manufacturing environment and the possibility that college graduates leave the area after earning their degrees. In 2000, the percentage increase in high school graduates was higher in DeWitt and Macon Counties as compared to Illinois and the United States. For college graduates, the percentage increased at the county, state and national levels, but it was more significant at the state and national levels. Whatever the reasons for the differentials in education, the data suggest that a growing pool of adults in the RCC District could benefit from further education.
70
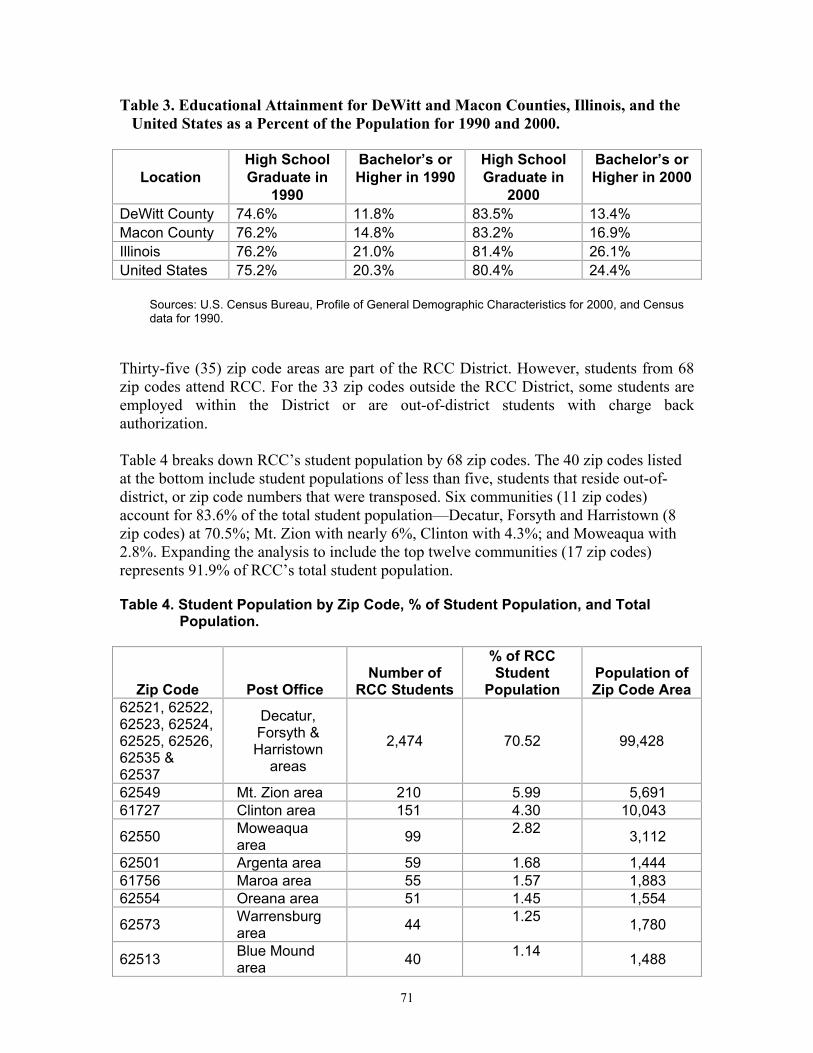
Table 3. Educational Attainment for DeWitt and Macon Counties, Illinois, and the United States as a Percent of the Population for 1990 and 2000.
Location
High School Graduate in
1990
Bachelor’s or Higher in 1990
High School Graduate in
2000
Bachelor’s or Higher in 2000
DeWitt County 74.6% 11.8% 83.5% 13.4% Macon County 76.2% 14.8% 83.2% 16.9% Illinois 76.2% 21.0% 81.4% 26.1% United States 75.2% 20.3% 80.4% 24.4%
Sources: U.S. Census Bureau, Profile of General Demographic Characteristics for 2000, and Census data for 1990.
Thirty-five (35) zip code areas are part of the RCC District. However, students from 68 zip codes attend RCC. For the 33 zip codes outside the RCC District, some students are employed within the District or are out-of-district students with charge back authorization. Table 4 breaks down RCC’s student population by 68 zip codes. The 40 zip codes listed at the bottom include student populations of less than five, students that reside out-of-district, or zip code numbers that were transposed. Six communities (11 zip codes) account for 83.6% of the total student population—Decatur, Forsyth and Harristown (8 zip codes) at 70.5%; Mt. Zion with nearly 6%, Clinton with 4.3%; and Moweaqua with 2.8%. Expanding the analysis to include the top twelve communities (17 zip codes) represents 91.9% of RCC’s total student population. Table 4. Student Population by Zip Code, % of Student Population, and Total
Population.
Zip Code
Post Office
Number of
RCC Students
% of RCC Student
Population
Population of Zip Code Area
62521, 62522, 62523, 62524, 62525, 62526, 62535 & 62537
Decatur, Forsyth & Harristown
areas
2,474 70.52 99,428
62549 Mt. Zion area 210 5.99 5,691 61727 Clinton area 151 4.30 10,043
62550 Moweaqua area 99 2.82 3,112
62501 Argenta area 59 1.68 1,444 61756 Maroa area 55 1.57 1,883 62554 Oreana area 51 1.45 1,554
62573 Warrensburg area 44 1.25 1,780
62513 Blue Mound area 40 1.14 1,488
71
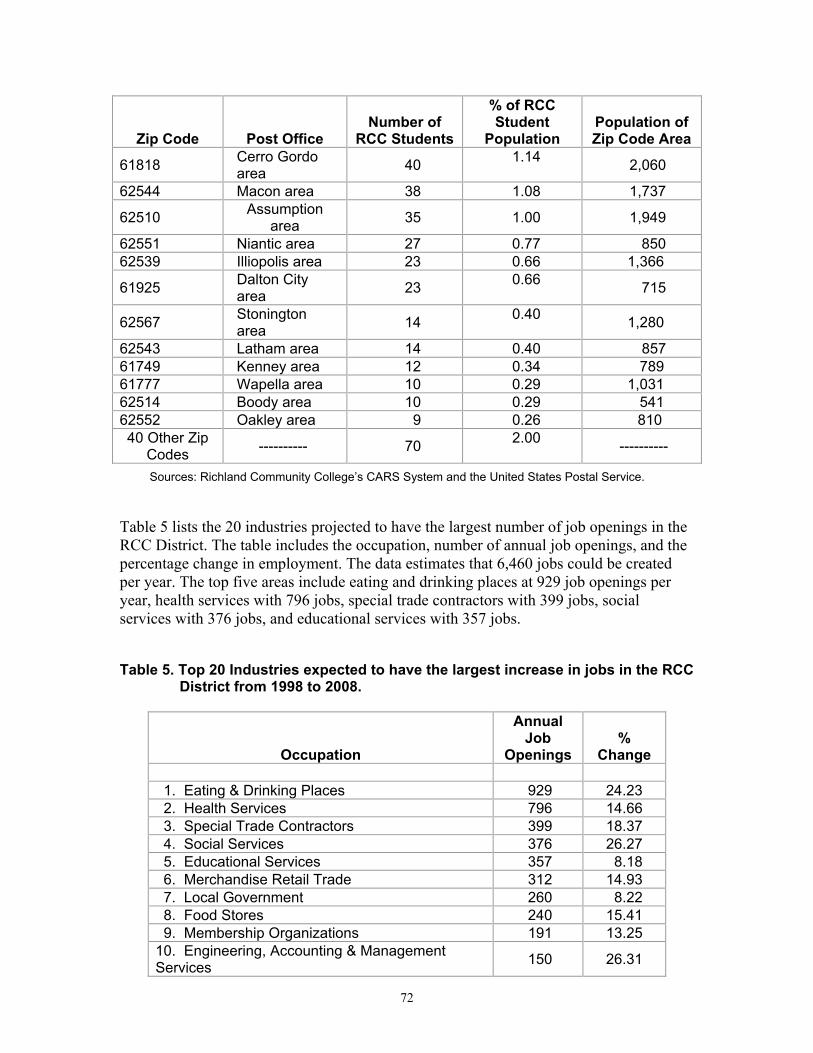
Zip Code
Post Office
Number of
RCC Students
% of RCC Student
Population
Population of Zip Code Area
61818 Cerro Gordo area 40 1.14 2,060
62544 Macon area 38 1.08 1,737
62510 Assumption area 35 1.00 1,949
62551 Niantic area 27 0.77 850 62539 Illiopolis area 23 0.66 1,366
61925 Dalton City area 23 0.66 715
62567 Stonington area 14 0.40 1,280
62543 Latham area 14 0.40 857 61749 Kenney area 12 0.34 789 61777 Wapella area 10 0.29 1,031 62514 Boody area 10 0.29 541 62552 Oakley area 9 0.26 810 40 Other Zip
Codes ---------- 70 2.00 ----------
Sources: Richland Community College’s CARS System and the United States Postal Service. Table 5 lists the 20 industries projected to have the largest number of job openings in the RCC District. The table includes the occupation, number of annual job openings, and the percentage change in employment. The data estimates that 6,460 jobs could be created per year. The top five areas include eating and drinking places at 929 job openings per year, health services with 796 jobs, special trade contractors with 399 jobs, social services with 376 jobs, and educational services with 357 jobs. Table 5. Top 20 Industries expected to have the largest increase in jobs in the RCC
District from 1998 to 2008.
Occupation
Annual Job
Openings
%
Change
1. Eating & Drinking Places 929 24.23 2. Health Services 796 14.66 3. Special Trade Contractors 399 18.37 4. Social Services 376 26.27 5. Educational Services 357 8.18 6. Merchandise Retail Trade 312 14.93 7. Local Government 260 8.22 8. Food Stores 240 15.41 9. Membership Organizations 191 13.25 10. Engineering, Accounting & Management Services 150 26.31
72

Occupation
Annual Job
Openings
%
Change 11. General Building Contractors 148 9.38 12. Personal Services 135 17.83 13. Automobile Repair 121 22.94 14. Miscellaneous Retail Stores 111 9.78 15. Hotels and Lodging 108 24.30 16. Amusement & Recreation 79 19.24 17. Food and Kindred Products 74 1.76 18. Durable Goods Wholesale Trade 74 5.18 19. Insurance Carriers 63 20.63 20. Nondurable Goods Wholesale Trade 58 5.05 Annual Jobs Created 6,460
Source: Illinois Department of Employment Security, Economic Information and Analysis Division, “Industry Projections 1998-2008 for Richland Community College District,” Springfield, Illinois, 2002.
Table 6 lists the ten industries that are projected to have the most job losses in the RCC district from 1998 to 2008. Total annual job losses could be about 700, with utilities and sanitary service losing 216, agricultural production losing 178, and durable goods manufacturing losing 132. Table 6. Top 10 Industries with the Greatest Decrease in Jobs in the RCC District
from 1998 to 2008.
Occupation
Annual Job Losses
% Change
1. Utilities and Sanitary Services - 216 - 8.55 2. Agriculture Production - 178 - 8.94 3. Durable Goods Manufacturing - 132 - 1.77 4. Apparel & Accessories Stores - 37 - 8.22 5. Machinery - 36 - 0.94 6. Private Household Services - 30 - 4.95 7. Printing & Publishing - 23 - 2.78 8. Railroad Transportation - 22 - 3.69 9. Depository Institutions - 20 - 1.76 10. Federal Government - 8 - 8.69 Annual Jobs Lost 702
Source: Illinois Department of Employment Security, Economic Information and Analysis Division, “Industry Projections 1998-2008 for Richland Community College District,” Springfield, Illinois, 2002.
73

Workplace Challenges and Expectations An employee may work 12 hour shifts on a rotating basis, may have a work schedule that is 3 days on and 3 days off, may work a swing shift where the hours and days change every week, or may work a combination of these. Many of these workers find it difficult to continue their education. For the United States to maintain a competitive advantage in the global marketplace, employees must have the education and training to adapt to new and innovative technologies. With the advent of the “technology age,” a well-educated labor force is most important. As workplace changes occur, business and industry have increasingly found community colleges to be a valuable resource for workforce development. Given the changes in the workplace, a community college can no longer expect all students to attend classes on a regular basis. As such, colleges can no longer just provide the traditional day and evening classes to meet students’ needs. In some cases, the college must provide courses via distance learning, online, and hybrid, a course that is taught using two or more types of delivery. An example is an online science course where the students attend sessions on campus to complete laboratory assignments. Community colleges can provide the necessary education and training, but it must be offered through alternatives that meet the needs of students and businesses. This approach may involve RCC staff discussing the issues with the business community, becoming familiar with students’ needs, and providing the necessary education and training. Throughout the United States, community colleges are taking a more active role in these alternatives and options.
Richland Community College Faculty and Staff Demographics RCC has 199 full-time employees broken into eight job classifications. Of these eight categories, Faculty represent 31% of the total, followed by Clerical at 28%, Professional/Technical and Administrative at 15% each, and Other at 7%. The remaining 4% consists of Custodial/Maintenance, Supervisory, and Academic Support. Ethnicity is 90% White, 7.5% Black, with the balance as Asian American, Native American and Hispanic. By gender, 67.8% of full-time employees are female and 32.2% are male. For the Faculty 54.1% are male and 45.9% are female; Clerical consists of 7.3% male and 92.7% female; Professional/Technical with 10.3% male and 89.7% female; Administration with 35.7% male and 64.3% female; Other with 42.9% male and 47.1% female; Maintenance with 100% male; Supervisory with 25% male and 75% female; and Academic Support with 67% male and 33% female. The average age of full-time employees is 47.4 years, with females at 46.8 and males at 48.7. By classification, the average age of the Administration is 49.3 years, followed by the Faculty at 49.2 years, Clerical at 48.2 years, Maintenance at 46.5 years, Supervisory at 45 years, Professional/Technical at 43.8 years, and Academic Support at 42 years. As
74
a percent of total full-time employees, 23% are under age 40, 47% are from 40 through 59 years of age, and 5% are 60 and older. The average length of service for full-time employees is 8.2 years. Of these, 30% have less than 5 years of service, 12% have from 6 through 10 years, 10% have from 11 through 15 years, 3% have 16 through 20 years, and 17% have 21 or more years. For the 171 full-time employees with college degrees the breakdown includes 7% with Doctorates, 41.5% with Masters/Professional degrees, 24.6% with Bachelor degrees, and 26.9% with Associate degrees. RCC has 206 part-time employees, of which 170 (82.5%) are Adjunct Faculty and 36 (17.5%) are classified as Staff. For the staff, 52.8% are classified as Other, 27.8% as Professional/Technical, 16.7% as Administration, and 2.8% as Maintenance. Ethnicity is 88.8% White, 5.8% Black, and 0.5% Asian American. For the balance of part-time employees, no ethnicity was provided. By gender, 53.4% of part-time employees are female and 46.9% are male. For the Faculty 50.6% are male and 49.4% are female; Professional/Technical with 30% male and 70% female; Administration with 16.7% male and 83.3% female; Other with 26.3% male and 73.7% female; and Maintenance with 100% male. The average age of part-time employees is 48 years, with females at 48 and males at 47.9. By classification, the average age of the Administration is 54.2 years, followed by Maintenance at 49, Faculty at 48.3 years, Professional/Technical at 45.8 years, and Other at 44.4 years. As a percent of total part-time employees, 22.3% are under age 40, 64.1% are from 40 through 59 years of age, and 13.6% are 60 and older. For the 190 part-time employees with college degrees, the breakdown includes 3.7% with Doctorates, 48.4% with Masters/Professional degrees, 37.9% with Bachelor degrees, and 3.7% with Associate degrees. The remaining 6.3% of part-time employees have degrees classified as Other. Students The 10th day headcount for Fall is 3,261, of which 32.1% are full-time and 67.9% are part-time. 28.5% of students take between 1-4 hours, 27% take 5-8 hours and 32.2% take 12 or more hours. 68.6% of students attend during the day taking 78% of total credit hours, 31% attend during the evening taking 21.8% of total credit hours, and 0.4% attend during the weekend taking 0.2% of total credit hours. 85.2% are White, 12.9% African American, 1% Hispanic, 0.7% Asian American, with the balance American Indian/Alaskan Native and Non-resident. 37.2% are male with females representing 62.8%. 22.6% of students are new, 57.7% are returning and 19.7% are re-entering. 39.4% of students work 30 or more hours per week, 30.6% work 29 or less hours per week, 30% are not employed. The average courseload for all students was 8.3 credit hours, with day students averaging 9.4, evening students at 5.8, and weekend students with 3.8. Of the
75

day students 42.4% are full-time and 57.6% are part-time. Of the fulltime students, 90.5% are day, 9.5% are evening. For part-time students, 58.2% are day, 41.2% are evening, and 0.6% are weekend. The average age for all students is 26, with day students at 25 and evening students at 28. Students attending weekend classes had an average age of 37. 32.6% are 15-19 years old, 34.1% are 20-29, 16.1% are 30-3912.5% are 40-49, 3.7% are 50-59 and 1% is 60 and older. For transfer students, UIS receives 29%, Millikin at 21%, Eastern at 15%, Illinois State at 14%, SIU-C at 13%, with the balance attending SIU-E, Northern, UI-Chicago, UI-UC, and Western.
76
Student and Employee Diversity RCC Planning Paper #2
Recognizing and respecting differences in thought, people, practices and needs are essential in creating an educational environment that is dedicated to developing students and employees both personally and professionally. As an institution that recognizes and embraces the importance diversity contributes to achieving its mission, Richland Community College has designated diversity/inclusiveness as one of several core values in which the institution practices. As a “community” college whose vision is to help people build a better community, the student population of Richland Community College should be representative of the College’s surrounding community. The College should offer programs and services that meet the needs of an ethnically, socio-economically and culturally diverse community. Consideration needs to be given to investing in an educational infrastructure that supports and educates a diverse student population. In addition, educational programs offered must promote diversity enrichment. Richland Community College has been successful in creating enrichment opportunities campus-wide through several clubs/organizations such as N.A.A.C.P College Chapter, P.R.I.D.E., Spanish Club, Le Cercle Francais, Black Student Association and Students Unlimited. Existing programs/services at the College which meet the needs of a diverse student population include, Disability Accommodation Services, Student Learning Center, Options/Opportunities Program, TRIO, Perkins Program, Project Read, Adult Education, Child Care Services and Student Life. Recent data on student demographics at Richland Community College indicate that the majority of students attending the College are ethnically White, Non-Hispanic. Underrepresented student groups include, Black, Asian, Hispanic and American Indian. Although the majority of students at the College are White, Non-Hispanic, the number of Black, Non-Hispanic students have continued to increase over the last seven years. In addition, given recent economic downturns in Decatur and surrounding communities within the past several years, the College will likely see a change in student age distribution. More older, non-traditional students are/will be attending the College seeking retraining or to pursue an advanced degree. In addition, specifically in the State of Illinois, there as been a marked increase in the number of Hispanic students in post-secondary education, most notably attending on a part-time basis. Discouraging is the fact that national data has indicated that while minority student enrollment is increasing graduation rates are decreasing. As the College seeks to recruit and retain underrepresented or non-traditional students, it also must develop new and refine existing programs, services and academic coursework to meet students’ needs. Diversity among employees within Richland Community College is an additional area that needs attention. Faculty and staff demographics within Richland Community College indicate the College lacks in diversity among its employee population. Female staff outnumbers male staff by a 2:1 ratio. In addition, an overwhelming majority of staff and faculty at Richland are White, non-Hispanic. Similar to the College’s student
77

population, underrepresented groups of employees include, Black, Asian, Hispanic and American Indian. Of specific concern to the College, as well as other post-secondary institutions nationally, is the increased need to recruit, hire and retain culturally diverse and minority faculty. In addition to employee demographic information, interviews and survey responses have concluded that Richland Community College employees themselves recognize that the College lacks diversity in both student, faculty and staff groups. A perceived obstacle within the College are groups of inflexible employees who have a “fear of change” and do not embrace diversity, but rather view differences in thoughts, people, practices and needs as unfamiliar or as a threat. Given these perceptions, Richland Community College continues to educate the College community on the importance of diversity. In order to overcome these obstacles, further efforts need to be implemented to educate the College’s employee population. The College needs to create a welcoming and inclusive climate and culture for diverse and minority faculty/staff. What specific strategies can Richland implement to increase diversity awareness within the College community? How can Richland better meet the needs of a diverse student population? How can Richland improve its efforts to recruit and retain students from underrepresented groups? How can Richland improve its efforts to recruit and retain faculty and staff from underrepresented groups?
78

Financial Resources RCC Planning Paper #3
Decreasing state funding and economic uncertainty, in general, are posing many challenges for higher education. Colleges and universities, including Richland, cannot afford to waste scarce resources on campuses. Higher education needs to demonstrate that it can be fiscally responsible with other people’s money. Accountability is increasingly being closely linked with higher education and there is an increasing emphasis on student outcomes assessment. For example, even though distance learning is a vital component in the future of education, many colleges have jumped on the bandwagon, at great cost, with insufficient research. Under these circumstances, colleges need to come up with creative funding sources, as well as be able to conserve available funds. Some commonly used cost-cutting methods stemming from decreased funding tend to be related to salaries, lay-offs, leaving positions unfilled, travel, shutting down of facilities, and postponing major construction projects. Some colleges are choosing to do things differently, e.g. doing away with “spend it or lose it” and allowing departments to give back unused funds without penalty; cutting back on lighting, heating, cooling, and water usage; asking businesses to fund part-time instructors; administrators teaching without pay; and increasing the use of electronic information. Students at Richland are receiving financial aid from a number of sources. The funding streams are sometimes unstable, particularly those depending on state and federal monies. Table 1. Richland students who receive some type of financial aid during the past six years, separated by category and percent.
Year 01/02 00/01 99/00 98/99 97/98 96/97 10th Day 5108 5087 5047 5248 5187 5105 Tuition Waiver
1% 1% 1% 1% 1% 2%
Private 9% 6% 8% 9% 9% 11% Fin Aid 26% 24% 24% 21% 21% 21% Grants 3% 2% 2% 3% 4% 3%
The new governor proposes to look at skyrocketing tuition and the need for cutting administrative costs. This increasing tuition, particularly at the university level, is making community colleges the more affordable choice. This is an opportunity community colleges can capitalize on by providing quality, affordable education with as much financial aid as possible, helping students meet their educational goals, and thereby continuing to contribute to the economy in a significant way. The future of higher education is directly related to the return on investment it provides its stakeholders, the students; otherwise, they will begin to look to other means of obtaining that education.
79

How can RCC continue to fund quality programs and services in light of changes in funding? How can RCC assist students in accessing sufficient funds for their education?
80

College Preparation RCC Planning Paper #4
Richland Community College, like other community colleges across the country, has an open door policy—Individuals with the desire to better themselves, regardless of ability, come to college as long as they meet certain basic requirements such as high school graduation or a General Education Diploma (GED). However, also like other colleges, Richland recognizes that not all individuals are equally equipped academically, emotionally, or economically, to be successful in college. Nationally and locally, the following issues impact individuals’ initial entrance into college:
1. An increased number of adults are returning to work for training and retraining. Locally, plant closings have increased the number of registrations in both occupational and baccalaureate programs. These students are unprepared for the rigors of academic work, including missing study skills, test anxiety, limited exposure to the “vocabulary” and “society” of college, and the perception of lower abilities than classmates who are younger. Many of these students attend under the direction of agencies such as Workforce Investment Solutions, which are interested in completion of a degree within a short time, regardless of the students’ academic abilities.
2. Returning adults are uncertain about degree requirements, so their enrollment in
developmental courses seems a waste of time for them.
3. The skills of some recent high school graduates do not meet the requirements for college work. Standardized test scores for the verbal portion of the SAT have dropped since 1992, for example, because college prep students are not challenged in many high school English courses (US News & World Report). In District 61, only 51% of students met the state averages in the 2002 standardized tests.
4. Many high school students take only those courses required for graduation since
their intent was not to attend college. When they arrive at Richland and complete the placement test sequence, they are then required to take developmental courses to make up their deficiencies. According to an article in Time, “600,000 freshmen at U.S. colleges—29% of the total—now need at least one remedial course.” Many colleges are including English as a Second Language courses as remedial.
5. An increasing number of high school students are completing dual credit and
credit in escrow courses. According to The Community College Times, approximately 8% of high school students are enrolled in college while still in high school.
6. An increasing number of high school students are opting to attend summer school
courses rather than work. This increase may impact the way summer school courses are delivered.
81

7. The impact on education from the “No Child Left Behind” Act has yet to be determined. About 13,000 in Illinois will repeat grades 3, 6, and 8, doubled from last year.
8. An increased shortage in teachers for K-12 may change teacher education
programs and impact the education programs at colleges.
9. A change in Illinois high school demographics will impact needs of minority students attending Richland.
All of these issues require that the College look at strategies to work with the District high schools and Workforce agencies to assist in preparing students for the rigors of college work. How can Richland establish viable relationships with District school systems to support their work in preparing students for college? What strategies can Richland develop to work with other agencies such as Workforce Investments Solutions to smooth the transition of displaced workers? What strategies can Richland develop to smooth the transition for returning adult students? How can Richland educate potential students about the requirements for college work?
82

Institutional Effectiveness and Student Outcomes Assessment RCC Planning Paper #5
Background As early as 1985, the term “Institutional Effectiveness” (IE) was beginning to emerge in response to public demand for accountability in higher education. The U.S. Congress responded by encouraging the regional accrediting agencies to incorporate the evaluation of “assessment processes” in their accreditation visits. By 1995, all six regional accrediting agencies had integrated components of IE into their accrediting process. Even though each accrediting agency developed criteria for IE, independently, there is not a universally recognized definition of IE to date. However, the literature suggests that IE (also known as “outcomes assessment”) has at least four common elements, including:
1. A sharpened statement of institutional mission and objectives; 2. Identification of intended outcomes or results at all levels of the institution; 3. Establishment of effective means for assessing outcome accomplishments; 4. The use of the assessment results to improve College programs and services to
enhance student learning. As an example of this assertion, the Southern Association of Colleges and Schools created the following criteria for IE that must be addressed by each unit (instructional and administrative) during the accreditation process. Each unit must: Establish a clearly defined purpose that supports the institution’s purpose and goals (a link to the college's mission). Formulate goals that support the purpose of each unit (administrative objectives and student learning outcomes). Develop and implement procedures to evaluate the extent to which these goals are being achieved in each unit. Use the results of the evaluations to improve programs and services. Further, in describing IE our local accrediting institution, the Higher Learning Commission (formerly North Central Association), states, “measuring effectiveness examines how your institution collects, analyzes, and uses information to manage itself and to drive performance improvement.” When the Higher Learning Commission (HLC) accredits institutions, they examine how the institution’s processes and systems relate to:
• Collection, storage, management, and use of information and data – at the institutional and departmental/unit levels
• Institutional measures of effectiveness • Information and data alignment with institutional needs and directions • Comparative information and data (a.k.a. benchmarking) • Analysis of information and data • Effectiveness of information system and processes • Measures • Analysis of results • Improvement efforts
83

Data from these elements, when appropriately examined, should be used to shape the educational experience for students. There is an emerging body of research that suggests that data from these elements should be used to improve all facets of the college including marketing/promotion, partnerships development (both internal and external), finance/budgeting, organizational climate, equity, public satisfaction, and student learning. The evaluation of student learning is of primary importance to all constituencies and is known more formally as Student Outcome Assessment (SOA). Over the last ten years, SOA has been a focus for many higher education institutions – particularly those seeking reaccredidation. The largest component of IE is SOA, which is well documented. Even though SOA is well documented in the literature, it should be noted that there are as many implementations of this process as there are schools engaged in it. However, some recurrent themes have emerged in what institutions examine. These themes can be lumped into two categories: Indirect measures of student learning and direct measures of student learning. Indirect measures of student learning are typically characterized by data that shows how the institution improves performance with student satisfaction, student retention/persistence, student goal attainment, rate of placement in employment, rate of student transfer success, performance of transfer students after transfer, employer satisfaction with graduates, and community satisfaction with programming. Direct measures of student learning are typically characterized by data that shows how the institution improves student performance in capstone experiences; portfolios; standardized tests; performance on recognized licensure/certification tests; locally developed tests; essay exams scored by faculty across a division/department/school; projects; externally reviewed exhibitions and performances; and performance on internships/externships. Typically, all areas of the institution are responsible for developing, monitoring, and evaluating IE and SOA measures. It is common practice in colleges throughout the nation that institutional outcomes, school/college/divisional outcomes, cross-divisional outcomes, program/departmental level outcomes, and course level outcomes are assessed each year. The data from this assessment are then used to shape continuous program and service improvement efforts with the ultimate goal of increasing student learning. Finally, SOA has evolved to the point that is has begun to have a significant impact on other areas that impact teaching and learning (e.g. funding, teacher preparation training, policy analysis, educational law, etc.). Strengths The RCC community has several experts on IE and SOA. An institutional SOA task force was established in the spring of 2001 for the purpose of developing a recommended implementation plan for SOA. Many of the people from this task force are still employed at the college and could be valuable resources during the implementation. Additionally, many of the Title III Activity 2 initiatives have been aimed at addressing SOA concerns and are providing a framework for systems development for related to student outcomes assessment and institutional effectiveness.
84

Weaknesses RCC is behind many peer institutions in the implementation of SOA and IE. To complicate this issue, there is little institutional awareness – let alone understanding – about what IE or SOA really is. Additionally, no action was ever taken on the initial SOA plan presented by the task force in June 01. The numbers of program graduates, including AAS, AS, and AA programs, have declined in the last two years – in spite of rising enrollments. It has been suggested that an effective implementation of an SOA plan, coupled with an effective method for program evaluation, could begin to explain and address this phenomenon. Opportunities The environment for process-oriented improvements is paramount right now at RCC. SOA is a vital process through which many institutions have been able to address program improvement and overall institutional effectiveness. Further, we have a prime opportunity to link elements of IE and SOA with institutional project improvement teams. In constructing a new SOA plan we can learn from the successes and the failures of our peer institutions. The literature and viable research on this issue are becoming very accessible. We should be able to modify and implement a Student Outcomes Assessment plan much more quickly and effectively than several years ago. Challenges As is true of any significant change, there are a few challenges for implementing SOA at RCC. One of the most difficult challenges will be overcoming preconceived notions about assessment. Another critical challenge will be to gain institutional “buy-in” on outcomes assessment. People within the institution must realize that SOA is relevant for everybody in the institution as well as for the many stakeholders outside these institutional walls. Also, the implementation of SOA requires an enormous institutional commitment – both from a human resource and financial perspective. In these times of rising enrollment, lower public funding support, and increased workloads, it will be crucial that we manage our human resources and finances wisely so that we don’t ‘burn-out’ our good people. The Target We need to aim for the following:
• Promote the concept, where appropriate, that programs and services should have established and well-defined educational outcomes and objectives and that these outcomes and objectives should be rigorously assessed to determine whether pre-determined standards are being met.
• Put practices into place for using assessment results to improve programs and services through modifications, including the allocation and reallocation of resources.
• Promote the concept, where appropriate, that programs and services have selected or designed administrative performance levels or benchmarks.
• Use evaluative data to initiate program and service improvements, including the allocation and reallocation of resources.
85

• Identify and share with the College’s leadership information about global, national, and regional projections for the future that have potential impact for the College.
• Communicate to constituencies the College’s planning process, its initiatives, and its assessment and evaluation efforts.
• Seek to determine the expectations of the College’s constituencies, the extent to which the College meets these expectations, and the identification of ways in which the College can achieve these expectations.
• Provide accurate and timely information to meet all constituent, state, and federal reporting requirements.
What does Richland need to do with the original SOA plan that was presented to the College in June 2001? How should Richland engage people in the SOA process? How should program evaluation be tied to SOA? How should Richland inform people about institutional effectiveness?
86

Alternative Delivery Of Education RCC Planning Paper #6
With the growing role that computers, the Internet, and other information technologies play in our daily lives, educational institutions must prepare for the inevitable integration and utilization of these technologies into education. Businesses have been rapidly utilizing more of the new information technology into how they operate. The impact of computers and telecommunications has been compared to that of radio and television in the 20th Century. Information technologies have drastically increased the dissemination of information. However, the truly revolutionary aspect of information technologies is that users are allowed to be publishers of information as well as consumers as they interact with vast numbers of people. The most progressive schools will use new technologies to make education more effective, affordable, and accessible. Typically, 5 different delivery modes are used for distance education: Internet, Interactive TV/Video, Open Broadcast TV, Stored Media (CDs and Tapes), and Correspondence. Schools cannot afford to ignore this technology. It is no longer a question of whether or not we need to use the current information technologies in delivering coursework but how we can appropriately utilize these technologies and to what extent. Some of the challenges educators face with distance education are the need for creating alternative models of teaching and learning. How can we reconcile the apparent gap between the traditional "face to face" classrooms and the “virtual” classroom? Some features of traditional classrooms that may lack in “virtual” classrooms are the ability to provide students opportunities to work together in teams on group projects and to allow students to interact with other students. These types of experiences in the classroom help to develop skills in teamwork and communication, which may be critical in the workforce. When considering alternative methods of delivery, instructional technology should be employed to do more than simply access or transfer information. The challenge for educational institutions, then, is to use the current ideas of learning and an understanding of educational technologies to design learning experiences that promote a deep understanding of the subject content, to analyze data and information, and to develop creative thinking and good communication skills. Faculty must learn to assess, reevaluate, and restructure their traditional teaching methodologies and transition into an online or other “high-tech” environment. Change and refinement are necessary in any organization for improvement to happen. This point is particularly true in a distance education program where knowledge is expanding and changing exponentially. Keeping pace with the expanding knowledge base and technological change demands innovative practices. It also requires a commitment of resources and time. Factors frequently reported as keeping the institution from starting or expanding their distance education course offerings to a major extent were program development costs (43%), limited technological infrastructure to support distance education (31%), and equipment failures and costs of maintaining equipment (23%). For those courses offered online, institutions should also determine the impact on students when they have inadequate technological resources to fully take advantage of these courses (the “digital divide” – lack of appropriate computer equipment or software required for completing coursework).
Technology-based distance education is emerging as an increasingly important component of higher education. Distance or online learning requires the right students
87

and teachers with computer training and enthusiasm for new teaching methodologies. This type of delivery system works well for those students who find themselves with busy schedules but would like to advance their skills by taking coursework. With the use of technology they may already have available with their job, they find they can utilize this technology to take courses, even when they are away from home, especially those professionals whose positions require frequent business trips. Telecommuting is becoming more commonplace in the workforce, and a natural extension of that trend might be to use the same technology to complete coursework. Many educational institutions are offering online courses for those professionals who want to pursue certificates while continuing to work full-time, people for whom going to an on-campus class on a regular basis is not feasible. The need for continuous training also makes this type of delivery system appealing to busy professionals. An estimated 50% of all employees' skills become outdated within 3 to 5 years, and online delivery systems can fill their need for continued training. There has been a shift to the use of web-based training for workers in corporate training for the purpose of keeping employees current in their skills.
Use of information technologies also works well for those students who may live in remote areas from campus or who have transportation difficulties. For some students with disabilities, having the ability to take classes remotely may allow them to complete coursework from their home, where the environment (including the technology needed to take classes) may already be set up to accommodate their needs. Other students take online classes to fit more conveniently into their busy schedules, with flexibility to study late at night and on weekends. Increasing student access was an important goal for most distance education programs, with making courses available at convenient locations rated as very important by 82% of institutions, and reducing time constraints for course taking rated as very important by 63% of institutions.
Some key elements of success of alternative delivery methods of education (especially online classes) were discussed. It was recommended that online class sizes be small enough that the teachers could get to know students and stay on top of their assignments – communicating routinely by e-mail, fax, and phone and through mentors assigned to the students. A disadvantage is that students with less self-motivation, less discipline, and with poorer writing skills have more trouble with these types of courses. Written communication is the primary means of communication in many of these courses. In order to succeed, this new medium requires demanding coursework in an exciting format that is easy to access and requires enthusiastic instructors who are computer-savvy and know how to engage students they will never meet. Orientation of students before they take online classes was also seen as a key to student success. One suggested option was a “hybrid” class that might meet the needs of students who opt for these alternative delivery methods and the need to ensure that some elements of education that might get lost outside a traditional classroom (such as face to face contact, mentoring, and group interaction) are available. This “hybrid” class is a blend of traditional and online methods of delivery, which might consist of use of information technologies for most of the coursework and scheduled meeting times periodically throughout a term.
Three themes seem to emerge. The first is that distance education is a growing phenomenon in higher education. Second, it is big business. Billions of dollars are being
88

spent on developing, implementing, modifying, and evaluating distance education programs and courses. Finally, it looks like the rapid growth will continue into the foreseeable future.
The number of courses and type of courses offered at Richland has continued to increase over the years since they were first introduced and the number of students successfully completing their coursework using alternative delivery methods has increased. Now may be the time to ask questions such as
Are courses utilizing alternative delivery methods at RCC meeting the needs of students? What can Richland do to make the courses more effective and ensure that the students are receiving a ‘high quality’ education within these alternative delivery systems? What can be done to further decrease the withdrawal rate for Richland’s virtual classes since the withdrawal rate in virtual classes is still about 10% higher than for courses taught in the classroom? With such a fast-growing, rapidly changing area of technology (distance learning technologies), how should Richland meet the challenge of staying current in this area? What are the advantages and disadvantages of each alternative delivery method?
89

Technology RCC Planning Paper #7
Issues in technology and its application to colleges include evaluation, planning, implementation, and funding. In all aspects of life, technology has taken an increasingly important role. The last decade has seen astronomical growth in the internet, cell phones, microwave ovens, personal computing devices and many other technologies too numerous to list. In this technology revolution, choosing which technologies to implement is quite a challenge. With changes happening every day, the investment in a new technology has become quite complicated. The evaluation process has to include viability, compatibility, flexibility, and durability by answering these questions: Will this technology meet our needs? Is it compatible with technologies already in place? Will it change with future initiatives? Will the technology be around for a long enough time span to contribute to the health of the organization?
These questions and more need to be addressed for each technology considered. Planning for a new technology is key in its success for the organization. These plans need to include all phases of the implementation and all individuals involved with specific goals and responsible parties identified. These plans need to be put in place well in advance of the purchase and implementation of the technology. Communication is essential and needs to involve individuals in all levels of the organization. Implementing the technology must include training as a key component. Continuous training will help insure the success of any project and is often overlooked or treated lightly. Many organizations consider a project complete with no provisions made for training the users initially or for continued training of new employees. In order to use a technology to its full potential, users need to be trained not only in initial implementation phase but throughout the life of the technology. Lastly, funding these technologies is always an issue. Nationally, about 10-15% of higher education budgets are used to fund technology. This percentage has grown during the last decade and will continue to grow. While costs of technology declines the overall use is increasing and, thus, the total cost is increasing.
How can Richland identify those technologies that are key to student and staff success? How can Richland train students and staff to use current technologies? How can Richland fund these technologies?
90

EMPLOYEE SUPPORT SYSTEMS: Training and Internal Communications RCC Planning Paper #8
Through a variety of means, employees of Richland Community College have indicated that staff development/training and internal communication issues need to be addressed to improve the quality of employment at the College and to allow staff to better serve students. The nurturing and development of the College’s human resources are essential to retain and engage employees and to develop future leaders. Large numbers of retirements and a high percentage of employees who have been at the College for one to five years have created a situation that would benefit from employee support systems. Improved communication for employees involves sharing information about various divisions within the College, reporting progress on College-wide initiatives, involving employees in decision-making, creating meetings with purpose, recognizing employee contributions and successes, and engaging employees in continuous improvement processes. As the College continues to grow and change, care must be taken to make each employee feel part of the team and to be consistent in the information shared with employees, students, and external audiences. The issue of training is of vital importance to college employees and has been an issue for several years. Days set aside for staff development have received mixed reviews, but most attendees agree that focused modules of training/development are needed. In addition, while technology training for specific programs such as Word, Excel, or Outlook have been provided to employees, supervisory training, ongoing technology training, and continuous improvement training continue to be areas of need. An aging population of employees and upcoming retirements will cause an accelerated need to train existing employees for leadership positions and to mentor newer faculty. Richland has a strong history of teaching excellence by faculty who are extremely knowledgeable in their fields. This knowledge extends beyond the field of study to include student relations, curriculum development, knowledge of the college culture, and governance issues. Employees with an eye toward advancement need to be nurtured and apprenticed by current leaders, and a process needs to be developed to provide the experiences and skills to prepare employees to move into more challenging positions. The cost of attracting qualified faculty and staff can be justified by providing ongoing training that will encourage the retention of these employees. Richland is at a point where employees are optimistic that changes can be made to strengthen employee relations and provide growth opportunities within the organization. The College needs to identify ways to improve communications and training to support change. What types of training can RCC provide to facilitate organizational communication? What types of training can RCC provide to facilitate teaching and learning? How should Richland provide training opportunities for its employees? What types of training opportunities do Richland employees want?
91

Advising and Counseling RCC Planning Paper #9
Going to college has become a popular trend; this is evident in the increase in enrollment at 4-year colleges and universities. A large number of 18-year-olds are facing a weak or unpredictable economy, making higher education an even more appealing option. Richland Community College and other community colleges have also seen this rise in popularity as observed from increased enrollment. In a recent study released by the Illinois Community College System (9/24/02), “investing in the completion of an Associate Degree can translate to more than $345,000 in additional income over the remainder of a person’s career” (The Socioeconomic Benefits Generated by 39 Community College Districts in Illinois). This data reinforces the need and value of higher education. Businesses that assist in educating the local workforce find that this is in the best interest of the company, as well as the community. When businesses and industry help academia stay current in technology and encourage their workforce to become educated, the end result will be a more skillful workforce. Thus, partnerships with business, industry, and even high schools assist community colleges in creating supportive services and programs for the entire community.
Community colleges realize that they hold some responsibility in making sure that students are prepared to easily transition into 4-year institutions as well as into the job market. This is where advising becomes essential. Major researchers on student involvement and retention (Tinto, Astin, Kuh, Pascarella, & Terenzini) affirm that students who fail to gain goal clarification are likely to question why they are in college and are at risk for dropping out. The advising process provides an opportunity to guide students in setting and achieving their goals by working with counselors and advisors on exploring where they are in the process, what they want, and what are the options available to them. Students come to community colleges for a variety of reasons: to achieve a degree/certificate, to transfer to another school, for personal skill building, to enhance job skills, and to pursue other personal and educational opportunities. Although all faculty, staff, and student service professionals serve an integral role in student retention, advisors are usually in the best positions to assist students in making quality academic decisions. Research literature on student retention and attrition suggests that contact with a significant person within an institution of higher education is a crucial factor in a student’s decision to remain in college. In order to assist students in goal identification and clarification, community college staff need the appropriate tools. However, as research suggests, each tool should be goal-oriented and, therefore, needs to be as individualized as each student. According to a Richland Community College Climate Survey, some clearly identified strengths at RCC center around our variety of programs offer, our good reputation locally, our contributions to the local economy, and our ability to meet community expectations. This survey represented the opinions of faculty and staff. To gain insight from a student perspective, the USA Group/Noel Levitz Student Satisfaction Survey was
92
given to a sample of RCC students to distinguish strengths and weaknesses of our college. Generally, students were satisfied with facilities (labs, library, support services), faculty knowledge, and college commitment to them. However, the areas where our students identified weaknesses were in academic advising and counseling, financial aid, and areas/channels where complaints could be expressed. This data indicates that more of an emphasis needs to be placed on goal clarification with our students. We want them to be satisfied with the education they receive at our institution. How can Richland improve advising and counseling throughout the College? How can Richland help students identify and clarify their goals?
93

Emerging & Diverging Job Trends RCC Planning Paper #10
Rapid technological change, employment rates (e.g. decreasing demand for manual labor), and changing demographics (e.g. increasing minority population) are only some of the driving forces behind the need for program development and job retraining at colleges. Changing laws are another force; for example, telecommunications laws requiring closed captioning led to an increased demand for “closed captioners/ stenocaptioners.” Also, rising university tuition is making community colleges an affordable source for this training and retraining. The future of RCC’s service area depends on whether its workforce has the required skills for emerging and diverging occupations. RCC will need to demonstrate great agility and flexibility if it is to provide training for these in demand occupations. In order to accomplish this, the College has to be able to distinguish between long-term job trends that can be difficult to predict versus transient ones, so developing new programs can be particularly risky. It may take years for a field to grow; e.g., massage therapy, though created 60 years ago, was not officially classified until 2000. If an occupation centers on a new technology, it may no longer be needed once employees acquire those skills (e.g., Internet research technicians). With the budget crunch, organizations may decide they can function without a job classification, making it important for employees to diversify their skills and increase their marketability. Thus, partnerships with business, industry, government, and educational agencies are becoming increasingly important. New and emerging occupations are ones that are either just developing or expected to grow rapidly in the future. Most new occupations grow out of old ones, so those returning to college after working for many years can identify with them. All occupations are changing to some degree, but diverging ones are doing so at a significantly greater rate, e.g., animation, which has gone from paper drawing to computer animation. Some emerging occupations include multimedia specialist, video server technician, computer and information scientist, wireless communication technician, direct broadcast satellite services technician, massage therapist, GIS specialist, desk top publisher, and fuel cell technician. Some evolving occupations include computer security technician, fiber optics manager, warehouse manager, grants specialist, quality assurance manager, information technology, and biotechnology. The fastest job growth is in computer-related fields e.g. computer software engineers, computer and information systems managers, and database administrators, professional and related fields, and service fields. With the aging population, personal and home care aides/medical assistants will also be in demand. Some other occupations with the largest projected increases in employment during this decade will be teaching (e.g. substitute teaching becoming alternate career for many unemployed), nursing, radiologists and technicians, medical service and health information technicians (stemming from changes in Medicaid regulations), pharmacy technicians, dental assistants/hygienists, customer service representatives, semiconductor processors, and line installers/repairers. There is also an increasing trend toward telecommuting or working from home, and training may help facilitate this change.
94

95
RCC is poised to play a significant role in training and retraining and thereby make a valuable contribution to the local economy. Developing partnerships with area entities will help us develop new programs, restructure existing ones, and phase out others. How can RCC strengthen and build partnerships with area business, industry, government, and educational entities? Which occupational programs are the most relevant for RCC’s future? Why? How can Richland determine long-term job trends?
Related Documents