Richard Hollinger, Ph.D. Security Research Project 2005 2005 National National Retail Retail Security Security Survey: Survey: Preliminary Preliminary Report Report

Welcome message from author
This document is posted to help you gain knowledge. Please leave a comment to let me know what you think about it! Share it to your friends and learn new things together.
Transcript
Richard Hollinger, Ph.D.Security Research Project
2005 2005 National National
Retail Retail Security Security Survey:Survey:
Preliminary Preliminary ReportReport
Bird Flu Hits Florida!

Inventory Shrinkage as % of Sales
1.791.91 1.88 1.95
1.83 1.871.77 1.72 1.69
1.81.7
1.651.54
1.6
0
0.2
0.4
0.6
0.8
1
1.2
1.4
1.6
1.8
2
1991 1992 1993 1994 1995 1996 1997 1998 2000 2001 2002 2003 2004 2005

Shinkage levels by Category
• Average or above:• Accessories = 4.7 (4)• Home Center, etc. = 3.2 (9)• Crafts/Hobbies = 2.6 (1)• Supermarket = 2.4 (11)• Drug / pharmacy = 2.2 (8)• Women’s apparel= 1.6 (11)• Men & Women’s app = 1.6 (13)
• Below Average:• Department store = 1.5 (18)• Household furnishings = 1.5 (6)• Children’s apparel = 1.4 (3)• Cards, gifts, etc = 1.4 (6)• Discount/Mass merchandise = 1.3 (15)• Sporting Goods = 1.3 (6)• Jewelry/Watches = 1.2 (5)• Entertain, media, games, etc = 1.1 (4)• Shoes = 1.1 (7)• Men’s apparel= 1.1 (2)• Optical = .74 (1)• Office Supplies = .83 (2)• Consumer Electronics, appliance = .81
(4)• Books, Mags & Music = .67 (1)• Liquor, wine, beer, tobacco = .58 (2)• Warehouse, club, etc. = .55 (2)• Furniture = .21 (3)• Cameras/Photo = .03 (1)
146 retail chains responded146 retail chains responded
136 = gave valid shrinkage %136 = gave valid shrinkage %
(All presented numbers may change slightly in the (All presented numbers may change slightly in the Final ReportFinal Report))
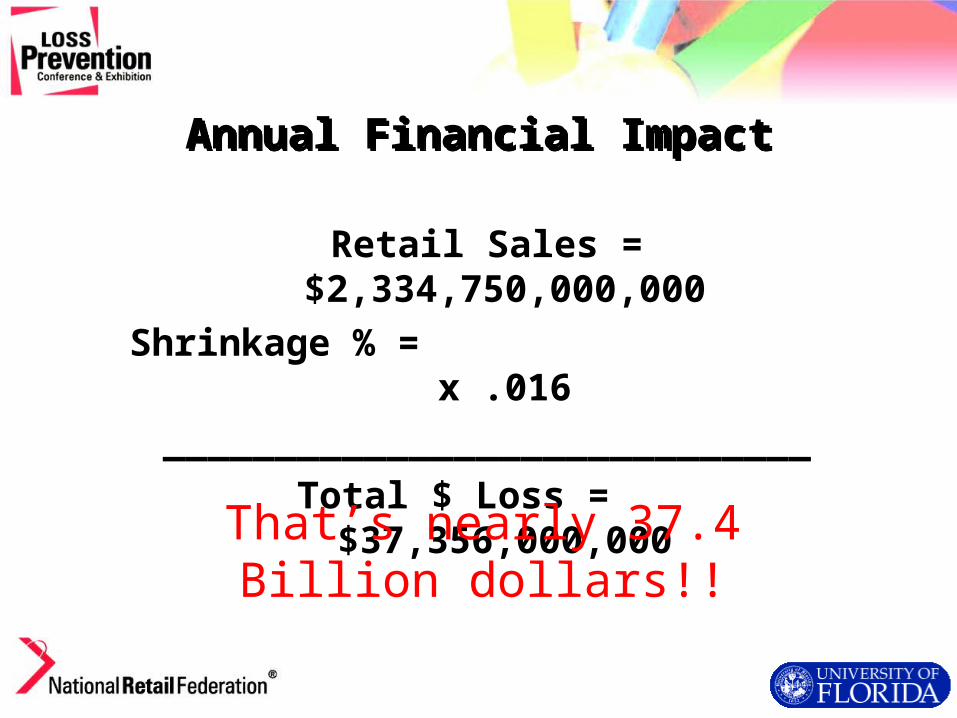
Annual Financial ImpactAnnual Financial Impact
Retail Sales = $2,334,750,000,000
Shrinkage % = x .016
_____________________________
Total $ Loss = $37,356,000,000
That’s nearly 37.4 Billion dollars!!
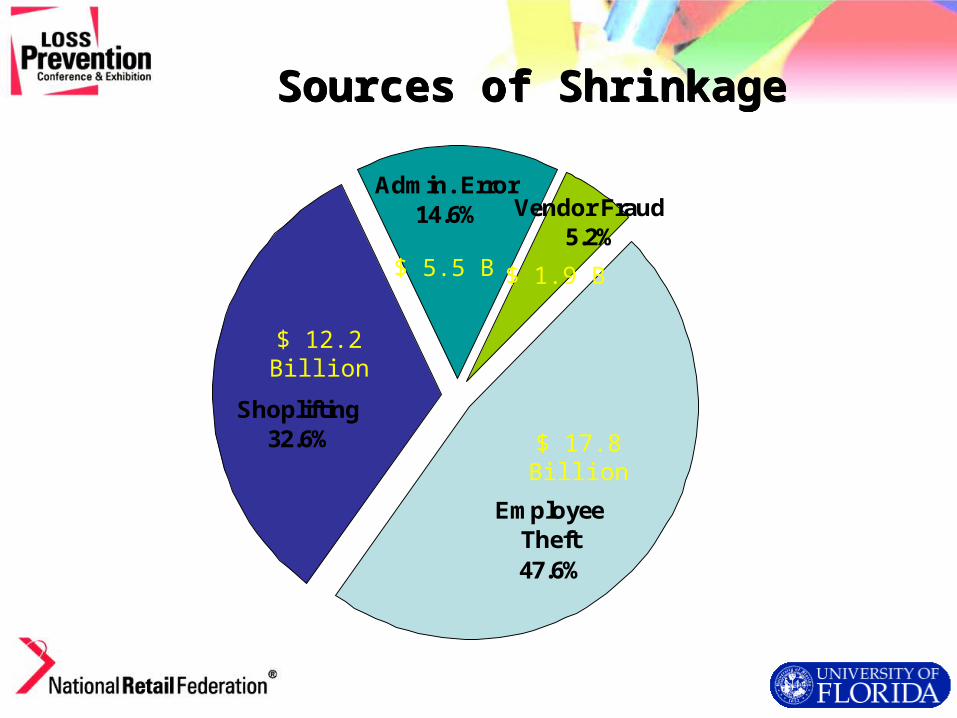
Sources of ShrinkageSources of Shrinkage
Employee Theft47.6%
Shoplifting32.6%
Vendor Fraud5.2%
Admin. Error14.6%
$ 12.2 Billion
$ 17.8 Billion
$ 5.5 B $ 1.9 B

$265.40
$1,762
$621.67
$1,238.27
$854.83
$1,053.24
Shoplifting
Employee Theft
2005
2004
2003
Average $ Loss Per Case

Organized Retail Crime Statistics
• Only one-third are tracking ORC data• Averaged 23.2 cases per $100 M in sales• $46,353 dollar loss per case on average
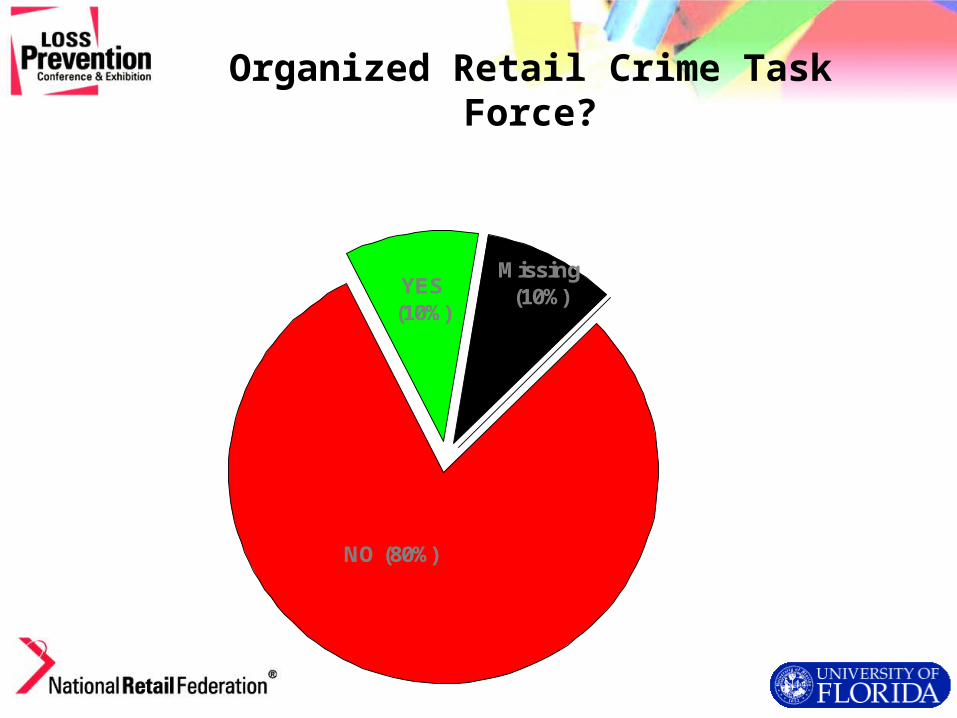
Organized Retail Crime Task Force?
NO (80%)
YES (10%)
Missing(10%)
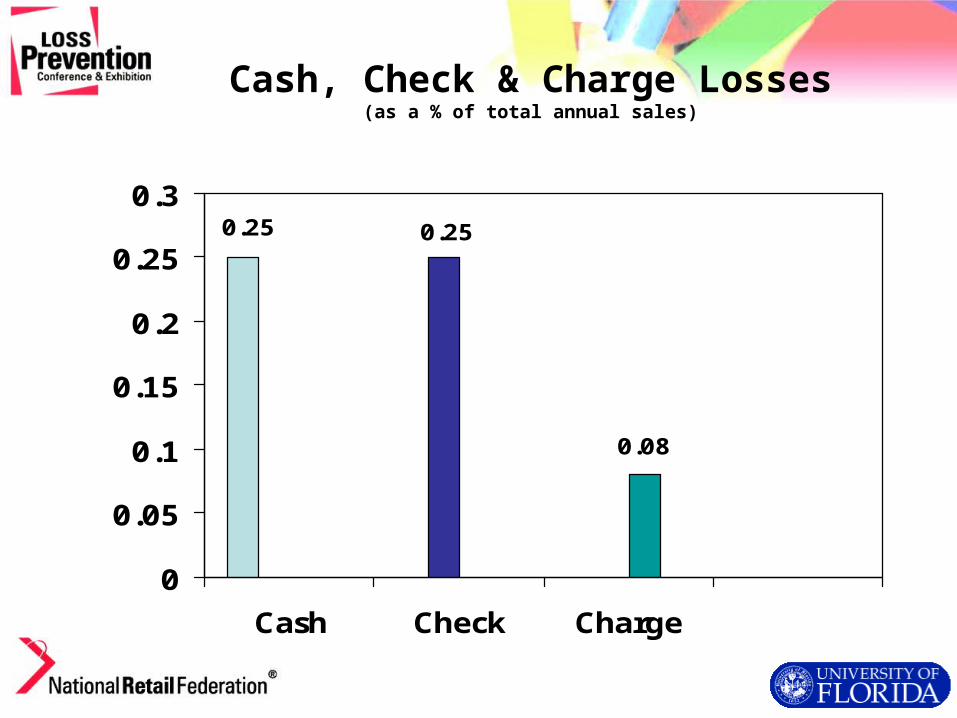
Cash, Check & Charge Losses(as a % of total annual sales)
0.25 0.25
0.08
0
0.05
0.1
0.15
0.2
0.25
0.3
Cash Check Charge
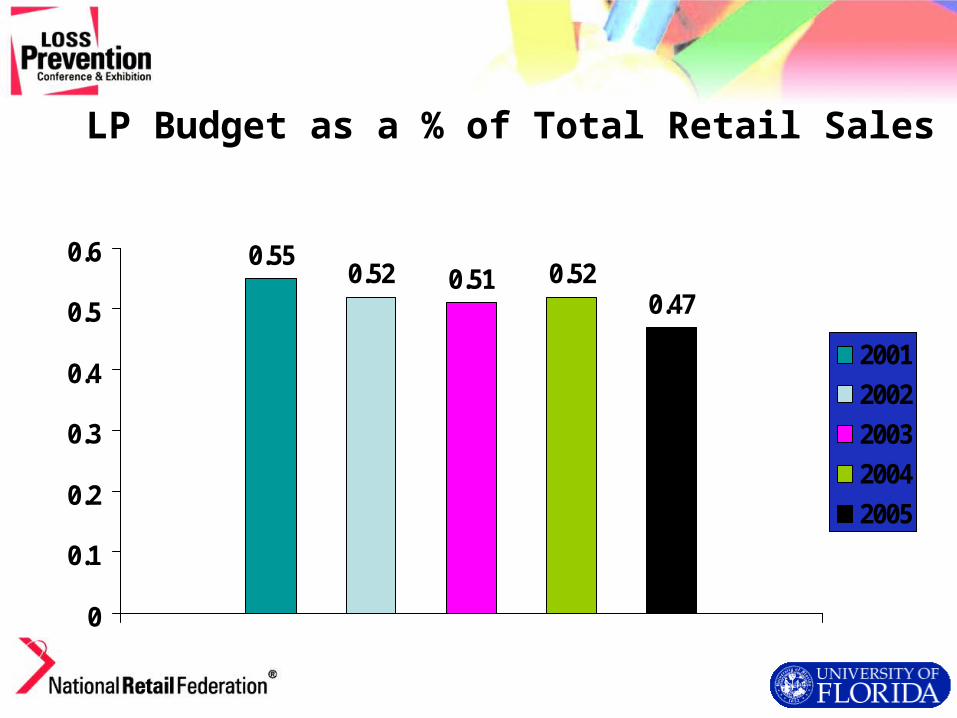
LP Budget as a % of Total Retail Sales
0.550.52 0.51 0.52
0.47
0
0.1
0.2
0.3
0.4
0.5
0.6
2001
2002
2003
2004
2005

Loss Prevention Strategies
1. Integrity Screening2. Awareness Programs3. Asset Control Policies4. L.P. Systems
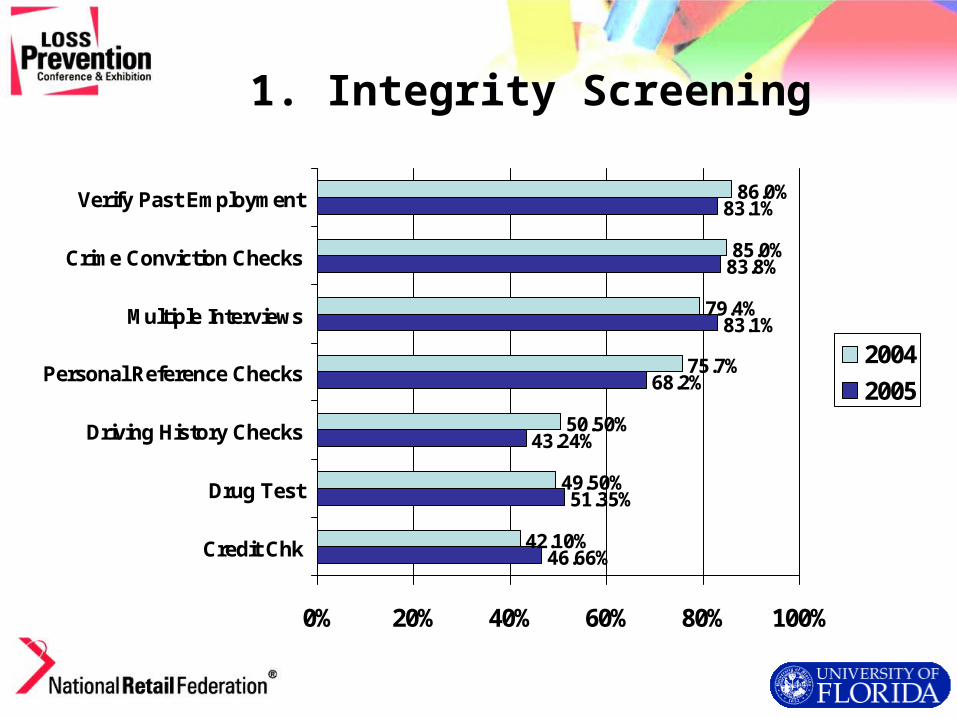
1. Integrity Screening
46.66%
51.35%
43.24%
68.2%
83.1%
83.8%
83.1%
42.10%
49.50%
50.50%
75.7%
79.4%
85.0%
86.0%
0% 20% 40% 60% 80% 100%
Credit Chk
Drug Test
Driving History Checks
Personal Reference Checks
Multiple Interviews
Crime Conviction Checks
Verify Past Employment
2004
2005
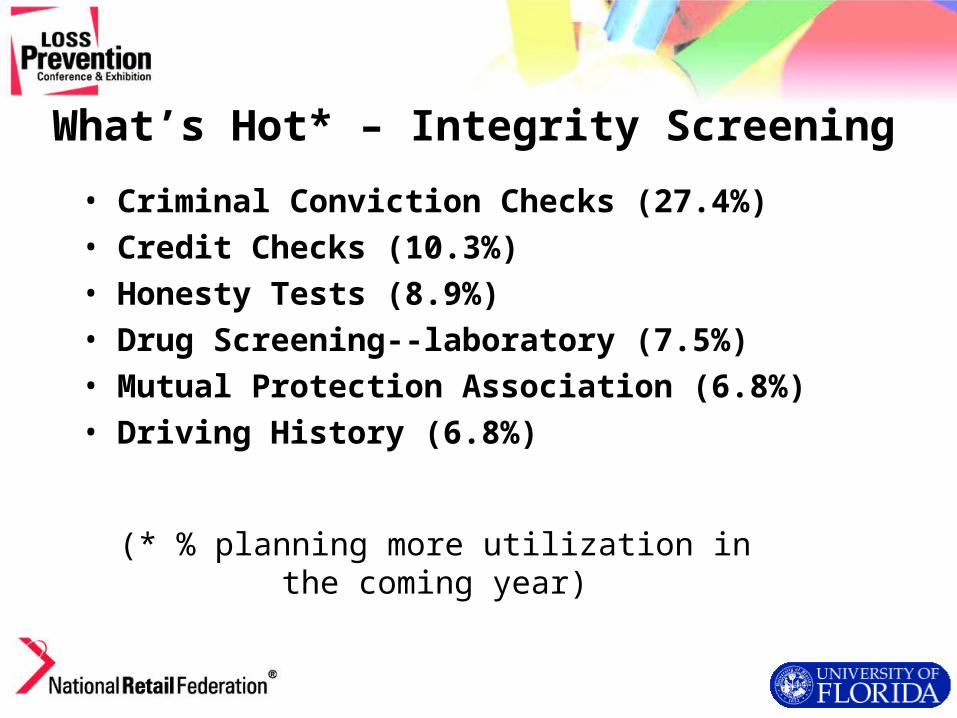
What’s Hot* – Integrity Screening
• Criminal Conviction Checks (27.4%)• Credit Checks (10.3%)• Honesty Tests (8.9%)• Drug Screening--laboratory (7.5%)• Mutual Protection Association (6.8%)• Driving History (6.8%)
(* % planning more utilization in the coming year)

2. Awareness Programs
58.0%
66.0%
82.0%
81.0%
90.0%
92.0%
90.0%
57.9%
66.4%
79.4%
80.4%
85.0%
87.9%
89.7%
0% 20% 40% 60% 80% 100%
Newsletters
Training Video Tapes
Code of Conduct
Periodic Programs
Bulletin Board/Posters
Hotlines
Orientation Discussion
2004
2005

What’s Hot* – Awareness Programs
• CD-ROM Interactive Training (28.8%)• Orientation Discussion (25.3%)• Training Video Tapes (24.7%)• Bulletin Board Posters (23.3%)• Web-based Communication (19.9%)• Surveys about LP issues (17.8%)
(* % planning more utilization in the coming year)

3. Asset Control
73.0%
75.0%
83.0%
82.0%
83.0%
87.0%
94.0%
75.7%
83.2%
77.6%
83.2%
79.4%
86.9%
89.7%
0% 20% 40% 60% 80% 100%
Interstore Transfers
Trash Removal
Employee Package Checks
Exception Reporting
POS Bar Coding & Scanning
Void Controls
Refund Controls
2004
2005
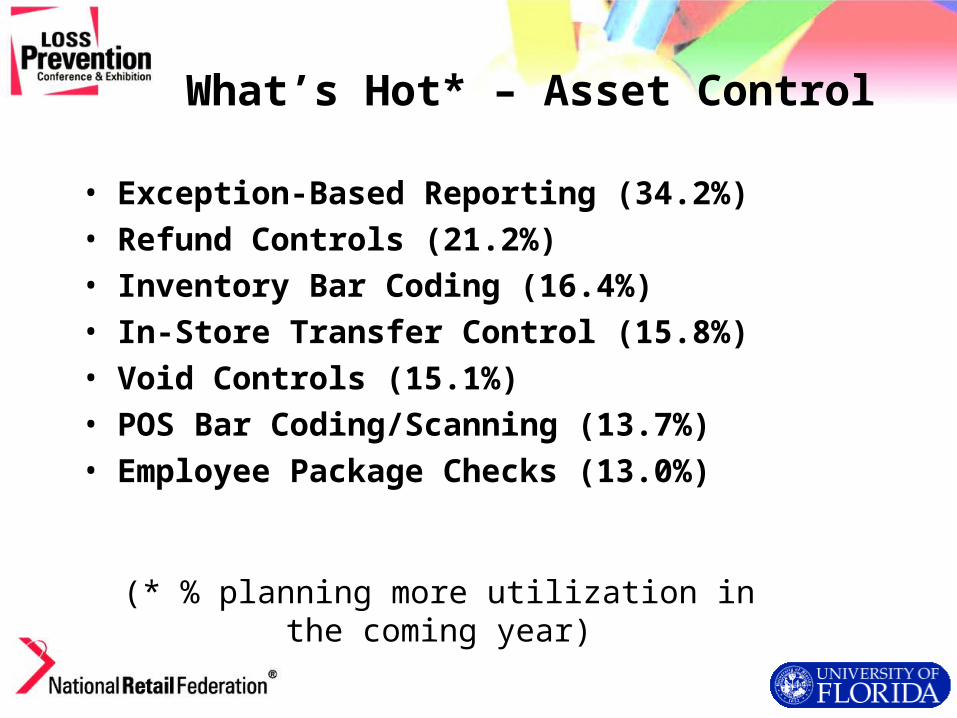
What’s Hot* – Asset Control
• Exception-Based Reporting (34.2%)• Refund Controls (21.2%)• Inventory Bar Coding (16.4%)• In-Store Transfer Control (15.8%)• Void Controls (15.1%)• POS Bar Coding/Scanning (13.7%)• Employee Package Checks (13.0%)
(* % planning more utilization in the coming year)

4. L.P. Systems
57.0%
62.0%
69.0%
66.0%
82.0%
83.0%
94.0%
57.9%
55.1%
66.4%
59.8%
78.5%
82.2%
95.3%
0% 20% 40% 60% 80% 100% 120%
Hidden CCTV
POS Data MiningSoftware
Armored Car
Check ScreeningSystems
Digital Video
Visible CCTV
Burglar Alarms
2004
2005

What’s Hot* – LP Systems
• Digital Video Recording Systems (39.7%)• Video Monitoring over Internet (39.7%)• Live, Visible CCTV (28.8%)• POS Data Mining Software (19.9%)• Web-Based Case Management (15.8%)• Live, Hidden CCTV (15.1%)• POS exception-based CCTV (15.1%)
(* % planning more utilization in the coming year)

Supporting Partners
Security Research Project Website
http://www.crim.ufl.edu/research/srp/srp.htmDr. Hollinger’s Email is [email protected]
Related Documents


![The Handbook of Security [Sample Pages 203-228 Employee Theft and Staff Dishonesty by Richard C. Hollinger]](https://static.cupdf.com/doc/110x72/55cf9472550346f57ba20a9c/the-handbook-of-security-sample-pages-203-228-employee-theft-and-staff-dishonesty.jpg)


![User Equipage Costs (Hollinger).ppt [Read-Only]](https://static.cupdf.com/doc/110x72/623c024ed8ef4029da21a607/user-equipage-costs-hollingerppt-read-only.jpg)