Rice–shrimp farming in the Mekong Delta: biophysical and socioeconomic issues Editors: Nigel Preston and Helena Clayton Australian Centre for International Agricultural Research Canberra, 2003 Rice–shrimp farming in the Mekong Delta: biophysical and socioeconomic issues edited by Nigel Preston and Helena Clayton ACIAR Technical Reports No. 52e (printed version published in 2003)

Welcome message from author
This document is posted to help you gain knowledge. Please leave a comment to let me know what you think about it! Share it to your friends and learn new things together.
Transcript
Rice–shrimp farming in the Mekong Delta:
biophysical andsocioeconomic issues
Editors:
Nigel Preston and Helena Clayton
Australian Centre for International Agricultural ResearchCanberra, 2003
Rice–shrimp farming in the Mekong Delta: biophysical and socioeconomic issuesedited by Nigel Preston and Helena Clayton
ACIAR Technical Reports No. 52e(printed version published in 2003)
The Australian Centre for International Agricultural Research (ACIAR) wasestablished in June 1982 by an Act of the Australian Parliament. Its mandate is tohelp identify agricultural problems in developing countries and to commissioncollaborative research between Australian and developing country researchers in fieldswhere Australia has special research competence.
Where trade names are used this does not constitute endorsement of nordiscrimination against any product by the Centre.
© Australian Centre for International Agricultural Research,GPO Box 1571, Canberra, ACT 2601
N. Preston & H. Clayton (eds) 2003. Rice–shrimp farming in the Mekong Delta:biophysical and socioeconomic issues. ACIAR Technical Reports No. 52e, 170 p.
ISBN 1 86320 360 5 (online)
Editor: Carol McDonald, BrisbaneTypesetting and layout: Sun Photoset Pty Ltd, Brisbane
ACIAR TECHNICAL REPORT SERIES
This series of publications contains technical information resultingfrom ACIAR-supported programs, projects and workshops (for whichproceedings are not published), reports on Centre-supported fact-finding studies, or reports on other useful topics resulting fromACIAR activities. Publications in the series are distributedinternationally to selected individuals and scientific institutions.
Rice–shrimp farming in the Mekong Delta: biophysical and socioeconomic issuesedited by Nigel Preston and Helena Clayton
ACIAR Technical Reports No. 52e(printed version published in 2003)
3
Rice–shrimp farming in the Mekong Delta: biophysical and socioeconomic issuesedited by Nigel Preston and Helena Clayton
ACIAR Technical Reports No. 52e(printed version published in 2003)
Contents
Preface
5
A. Overview
Chapter 1.
An overview of the project research
Nigel Preston, Donna Brennan and Helena Clayton 7
Chapter 2.
Socioeconomic characteristics of rice–shrimp farms in the study region
Tran Thanh Be, Helena Clayton and Donna Brennan 15
B. Shrimp production in the integrated rice–shrimp system
Chapter 3.
The shrimp pond environment: factors affecting shrimp production
Part A:
Growth and survival of
Penaeus monodon
in relation to the physical conditions in rice–shrimp ponds in the Mekong Delta
Truong Hoang Minh, Christopher J. Jackson, Tran Thi Tuyet Hoa, Le Boa Ngoc,Nigel Preston and Nguyen Thanh Phuong 27
Part B:
Preliminary observations of the effects of water exchange on water quality, sedimentation rates and the growth and yields of
Penaeus monodon
in the rice–shrimp culture system
Tran Thi Tuyet Hoa,
Truong Hoang Minh and Ta Van Phuong 35
Chapter 4.
Dominant sources of dietary carbon and nitrogen for shrimp reared in extensive rice–shrimp ponds
Michele Burford, Nigel Preston, Truong Hoang Minh, Tran Thi Tuyet Hoa and Stuart Bunn 39
Chapter 5.
Shrimp hatchery production in two coastal provinces of the Mekong Delta
Tran Ngoc Hai, Nigel Preston and Donna Brennan 44
C. Rice production in saline-affected environments
Chapter 6.
Selection of suitable rice varieties for monoculture and rice–shrimp farming systems in the Mekong Delta of Vietnam
Nguyen Ngoc De, Le Xuan Thai and Pham Thi Phan 53
Chapter 7.
Salinity dynamics and its implications for cropping patterns and rice performance in rice–shrimp farming systems in My Xuyen and Gia Rai
Ngo Dang Phong, Tran Van My, Nguyen Duy Nang, To Phuc Tuong, Tran Ngoc Phuoc and Nguyen Hieu Trung 70
Chapter 8.
Phenological and physiological responses of a rice cultivar to level and timing of salinity stress
Ernesto Castillo, To Phuc Tuong, Huynh Thi Thuy Trang, Thai Nguyen Quynh Thu and Tran Thi Ku Phuong 89
Chapter 9.
Assessing rice yield in rice–shrimp systems in the Mekong Delta, Vietnam: a modelling approach
To Phuc Tuong, Ngo Dang Phong and B.A.M. Bouman 102
4
Rice–shrimp farming in the Mekong Delta: biophysical and socioeconomic issuesedited by Nigel Preston and Helena Clayton
ACIAR Technical Reports No. 52e(printed version published in 2003)
D. Farm risk and farm management in the rice-shrimp systemChapter 10.
Factors affecting farm financial risk: observations from a bioeconomic model
Donna Brennan 111
Chapter 11.
Bioeconomic factors in sedimentation related land loss in the natural rice–shrimp system
Helena Clayton 127
E. Land planning and development of rice-shrimp farmingChapter 12.
Land evaluation and land use planning of the area for rice–shrimp systems, Gia Rai District of Bac Lieu Province
Le Quang Tri
, Vo Quang Minh and Vo Tong Xuan 142
Appendix.
Recommended best management practices for the shrimp component ofthe rice–shrimp farming system
162
5
Rice–shrimp farming in the Mekong Delta: biophysical and socioeconomic issuesedited by Nigel Preston and Helena Clayton
ACIAR Technical Reports No. 52e(printed version published in 2003)
Preface
In the coastal areas of the Mekong Delta the extensive tidal incursion of seawater during the dryseason increases the salinity in the lower reaches of the Delta. This saline intrusion means thatagricultural crops, including rice, cannot be grown during the dry season. Over the past 30 to40 years many rice farmers in the saline affected areas have adapted to the natural conditions bygrowing rice in the wet season, then using the rice fields for growing shrimp in the dry season.This farming practice, known as the rice–shrimp system, has allowed farmers to generate a sourceof income that was not previously possible in the dry season.
The adoption of the rice–shrimp system in the Mekong Delta has increased substantially overthe past two decades with around 40,000 ha under production in 2000. By the mid 1990sconcerns were being raised about the environmental and economic sustainability of therice–shrimp system. These concerns included land loss through sedimentation, salinisation of ricegrowing areas, shortages of shrimp postlarvae (seedstock), and the financial implications ofwidespread crop mortalities. These issues, coupled with the poor environmental performance onshrimp farming elsewhere in Asia, meant that the scale and speed of the adoption of therice–shrimp farming practice was of increasing interest to local policy makers and scientists. In1997, after a request from the Vietnamese government, the Australian Centre for InternationalAgricultural Research commissioned an interdisciplinary research project to investigate thesesustainability concerns. The project was designed to address the biophysical and socioeconomicissues surrounding rice–shrimp farming in the Mekong Delta. The research focused on developinga better definition of the farming system and of the factors that impact on its sustainability. Theaim was to identify farm management and policy options for improving the sustainability of thesystem. The multidisciplinary project included economic farm surveys, resource surveys,bioeconomic analysis, analysis of the rice and shrimp production environments and controlledfield experiments.
The papers presented in this report are the proceedings of the project’s final review workshop,held in December 2000 at Can Tho University, Vietnam. The twelve papers describe the resultsof the various components of the project. The first two chapters provide an overview of theresearch components and the socioeconomic characteristics of rice–shrimp farms in the studyregion. Chapters 3 to 5 examine the key factors influencing the sustainability of the shrimpproduction cycle; the growth and survival of shrimp in relation to physical conditions in therice–shrimp production ponds; shrimp diet and shrimp hatchery production. Chapters 6 to 9focus on the rice production system including: the suitability of different rice varieties for use inthe rice–shrimp system; salinity dynamics and cropping; the response of rice to the timing ofsalinity stress and the application of a simulation model to quantify the response of rice to salinitystress and to quantify the yield variability in response to different sowing dates.
In chapters 10 and 11 observations from a bioeconomic model of the rice–shrimp system areexamined in relation to factors affecting farm financial risk and the loss of rice–shrimp land dueto sedimentation.
The final chapter (12) examines the suitability of land under different farmingpractices, particularly rice–shrimp farming, and recommendations are made for land use planningincluding zoning areas as suitable only for rice–shrimp farming. An appendix to the study summarisesthe best management practices for the shrimp farming component and these practices have been
6
Rice–shrimp farming in the Mekong Delta: biophysical and socioeconomic issuesedited by Nigel Preston and Helena Clayton
ACIAR Technical Reports No. 52e(printed version published in 2003)
incorporated into an extension video and CD-ROM that has been widely distributed to farmers andextension officers in the region
. The results of this study have provided new insights into the key factors affecting the
sustainability of rice–shrimp farming in the Mekong Delta. The integration of dry season shrimpfarming into rice fields has raised incomes for many farmers in the region over several consecutiveseasons. However, a number of key constraints still need to be addressed in order improve theenvironmental and economic sustainability of this system. The study revealed that the traditionalpractice of recruiting native shrimp is not sustainable because of the loss of land from pondsedimentation due to the high water exchange required for natural recruitment. The morerecently developed system of stocking with hatchery-reared postlarvae combined with low waterexchange is promising, but limited by the availability of healthy postlarvae and episodicoutbreaks of disease. The current lack of investment in technology for improved health screeningand domesticated postlarval production techniques are critical constraints to the sustainabilityof all forms of shrimp farming, including rice–shrimp farming, in the Mekong Delta region.
The study showed that, even with current poor shrimp survival rates, many rice–shrimpfarmers are managing their financial risks well by maintaining a generally high level of incomediversification at the household level. This diversification of income means that farm householdshave alternative sources of income in the event of high shrimp mortality. Moreover, the farmingsystem allows for the production of rice and other staple items for household consumption,further insuring against the risks associated with shrimp production. The results of the studyindicate that rice yields are not adversely affected by using the same fields for shrimp production.Heavy rains at the beginning of the wet season effectively leach salts in the rice–shrimp fields.There was no evidence of a long term build up in salts or that soil salinisation from shrimp cultureadversely affects subsequent rice yields. However, the study has resulted in recommendationsabout the most appropriate rice varieties to use and the timing of rice planting in the rice–shrimpsystem.
An emerging sustainability issue is the trend towards intensification. As rice–shrimp farmersare becoming more experienced they have tended to intensify their practices. Some farmers areabandoning the rice crop cycle and transforming their rice–shrimp polders into conventionalshrimp ponds. Concern over the environmental implications and financial risks of moreintensive monoculture systems has induced local policy makers to try to regulate land practices.In some areas land has been zoned as suitable only for integrated rice–shrimp farms. The resultsof this study have indicated that the rice–shrimp system is a more ecologically and economicallysustainable approach than intensive shrimp monoculture, particularly in the low land areas ofthe study region that are affected by daily tidal flooding in the later part of the year. As detailedin the final chapter of this study, the implementation of zoning of land as suitable only forrice–shrimp farms, together with the adoption of the recommended improvements of rice–shrimpfarming practices, should significantly improve the economic and environmental sustainabilityof rice–shrimp farming in the Mekong Delta.
Further details about the project research are provided at the following websites:http://www.reap.com.au/RiceShrimp.htmhttp://www.enaca.org/Shrimp/Consortium.htm##Case Studies - Asia-Pacific Region
7
Rice–shrimp farming in the Mekong Delta: biophysical and socioeconomic issuesedited by Nigel Preston and Helena Clayton
ACIAR Technical Reports No. 52e(printed version published in 2003)
CHAPTER 1
An overview of the project research
Nigel Preston
1
, Donna Brennan
2
and Helena Clayton
2
1
CSIRO Marine Research, Cleveland, QLD 4163, Australia,
2
Faculty of Agriculture, University of Sydney, NSW 2001, AustraliaEmail Nigel Preston: [email protected]
R
ICE
–
SHRIMP
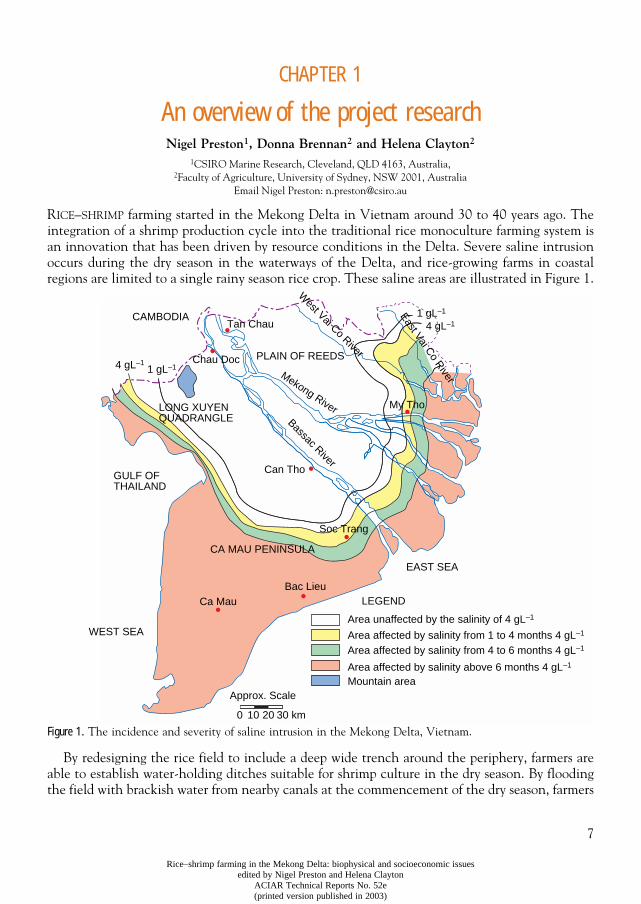
farming started in the Mekong Delta in Vietnam around 30 to 40 years ago. Theintegration of a shrimp production cycle into the traditional rice monoculture farming system isan innovation that has been driven by resource conditions in the Delta. Severe saline intrusionoccurs during the dry season in the waterways of the Delta, and rice-growing farms in coastalregions are limited to a single rainy season rice crop. These saline areas are illustrated in Figure 1.
Figure 1.
The incidence and severity of saline intrusion in the Mekong Delta, Vietnam.
By redesigning the rice field to include a deep wide trench around the periphery, farmers areable to establish water-holding ditches suitable for shrimp culture in the dry season. By floodingthe field with brackish water from nearby canals at the commencement of the dry season, farmers
CAMBODIA
LEGEND
Area unaffected by the salinity of 4 gL–1
Area affected by salinity from 1 to 4 months 4 gL–1
Area affected by salinity from 4 to 6 months 4 gL–1
Area affected by salinity above 6 months 4 gL–1
Mountain area
EAST SEA
GULF OFTHAILAND
WEST SEA
Approx. Scale
0 30 km10 20
CA MAU PENINSULA
Ca MauBac Lieu
Soc Trang
Can Tho
PLAIN OF REEDS
Mekong River My Tho
1 gL–1
4 gL–1
4 gL–11 gL–1
LONG XUYENQUADRANGLE Bassac River
East Vai Co R
iver
Tan Chau
Chau Doc
West Vai Co River
8
Rice–shrimp farming in the Mekong Delta: biophysical and socioeconomic issuesedited by Nigel Preston and Helena Clayton
ACIAR Technical Reports No. 52e(printed version published in 2003)
are able to raise shrimp. Traditionally by practising frequent tidal water exchange, farmers havebeen able to capture naturally abundant shrimp postlarvae (largely
Penaeus merguiensis
,
P. indicus
and
Metapenaeus ensis)
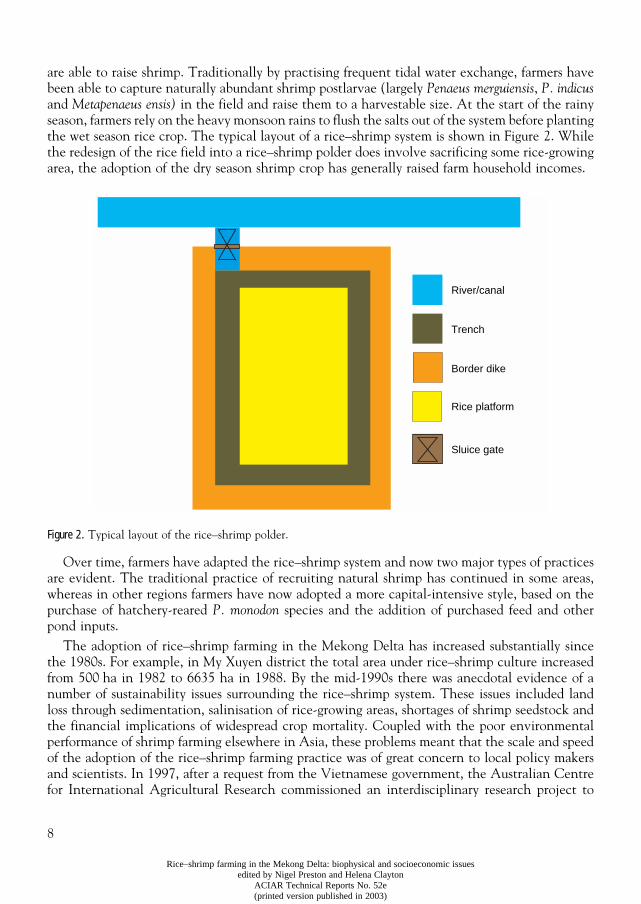
in the field and raise them to a harvestable size. At the start of the rainyseason, farmers rely on the heavy monsoon rains to flush the salts out of the system before plantingthe wet season rice crop. The typical layout of a rice–shrimp system is shown in Figure 2. Whilethe redesign of the rice field into a rice–shrimp polder does involve sacrificing some rice-growingarea, the adoption of the dry season shrimp crop has generally raised farm household incomes.
Figure 2.
Typical layout of the rice–shrimp polder.
Over time, farmers have adapted the rice–shrimp system and now two major types of practicesare evident. The traditional practice of recruiting natural shrimp has continued in some areas,whereas in other regions farmers have now adopted a more capital-intensive style, based on thepurchase of hatchery-reared
P. monodon
species and the addition of purchased feed and otherpond inputs.
The adoption of rice–shrimp farming in the Mekong Delta has increased substantially sincethe 1980s. For example, in My Xuyen district the total area under rice–shrimp culture increasedfrom 500 ha in 1982 to 6635 ha in 1988. By the mid-1990s there was anecdotal evidence of anumber of sustainability issues surrounding the rice–shrimp system. These issues included landloss through sedimentation, salinisation of rice-growing areas, shortages of shrimp seedstock andthe financial implications of widespread crop mortality. Coupled with the poor environmentalperformance of shrimp farming elsewhere in Asia, these problems meant that the scale and speedof the adoption of the rice–shrimp farming practice was of great concern to local policy makersand scientists. In 1997, after a request from the Vietnamese government, the Australian Centrefor International Agricultural Research commissioned an interdisciplinary research project to
River/canal
Trench
Border dike
Rice platform
Sluice gate
9
Rice–shrimp farming in the Mekong Delta: biophysical and socioeconomic issuesedited by Nigel Preston and Helena Clayton
ACIAR Technical Reports No. 52e(printed version published in 2003)
investigate these sustainability concerns. The results of this research project are reported in thisvolume.
The research project and study region
The research project was designed to cover the biophysical and socioeconomic issues surroundingrice–shrimp farming, and to identify farm management and policy options for improving thesustainability of the system. Four main sub-projects were undertaken: socioeconomic and physicalresources characterisation and analysis; investigation of the rice-growing phase of the system,with particular emphasis on salinity issues; and investigation of the shrimp pond conditions, withemphasis on the shrimp pond environment. Bioeconomic modelling tools were then used toinvestigate the implications of various sustainability issues on farm household income.
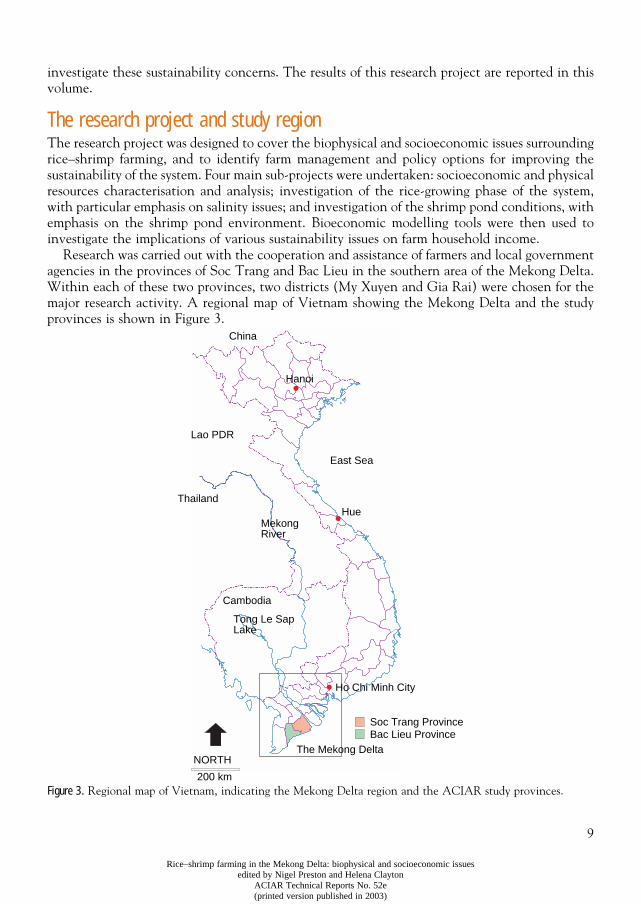
Research was carried out with the cooperation and assistance of farmers and local governmentagencies in the provinces of Soc Trang and Bac Lieu in the southern area of the Mekong Delta.Within each of these two provinces, two districts (My Xuyen and Gia Rai) were chosen for themajor research activity. A regional map of Vietnam showing the Mekong Delta and the studyprovinces is shown in Figure 3.
Figure 3.
Regional map of Vietnam, indicating the Mekong Delta region and the ACIAR study provinces.
China
East Sea
Hue
Lao PDR
MekongRiver
Thailand
Cambodia
Tong Le SapLake
Hanoi
Ho Chi Minh City
NORTH
200 km
The Mekong Delta
Soc Trang ProvinceBac Lieu Province
10
Rice–shrimp farming in the Mekong Delta: biophysical and socioeconomic issuesedited by Nigel Preston and Helena Clayton
ACIAR Technical Reports No. 52e(printed version published in 2003)
Sustainability concerns
Salinisation
Saline intrusion is a naturally occurring phenomenon that affects land productivity even in theabsence of shrimp culture. In general, the saline intrusion problem means there is only sufficienttime to grow one rice crop per year, when farmers rely principally on wet season rainfall. Farmersmay also use fresh water from canals to provide supplementary irrigation where required,although in years when saline water intrusion occurs early, this option is not possible.
Two concerns regarding the potential effect of the rice–shrimp farming system on rice yieldswere raised during the development of the project. These were that the inundation of brackishwater onto the rice fields during the dry season may lead to a build up of soil salinity over time;and that the delay in planting the rice crop under the rice–shrimp system (because of the needto flush salts from the system at the start of the rainy season) may reduce yields because of theincreased risk of end-of-season salinity damage resulting from saline intrusion.
There is scant evidence on the effects of soil salinisation from shrimp culture on subsequentrice yields. While Tran et al. (1999) concluded that salt leaching into neighbouring rice fieldscaused significant damage to the rice fields, comparisons between rice yields in rice–shrimp andrice monoculture fields can be confounded by spatial factors affecting the choice of farmingsystem. In a study of soil–water dynamics in rice monoculture and rice–shrimp fields, Phong etal. (this Report)
observed that soil salinity was generally lower in rice–shrimp fields than in ricemonoculture fields. They explained this observation in terms of the relative position of ricemonoculture and rice–shrimp fields in the system. Rice–shrimp fields are generally located nearbycanals and are engineered to allow effective water exchange. Farmers can take advantage of thisto leach the salts from the system at the beginning of the rainy season. In contrast, the salinitythat builds up in some rice monoculture fields due to capillary rise during the dry season couldnot be flushed away in areas that did not have good access to canal water. Phong et al. (thisReport) also concluded that the heavy rains that occurred at the beginning of the wet seasonwere effective in leaching salts in the rice–shrimp fields, and suggested that there was no long-term build-up in salts from the practice. They did, however, make recommendations aboutappropriate timing of rice planting for such systems, to ensure that the crop was not planted tooearly.
Nguyen Ngoc De et al. (this Report) report on the promising performance of new rice varietiesthat are short duration (115–120 day) and relatively salt tolerant. They recommended the use ofMTL119, which performed better in the field trials they conducted compared to the mostcommonly used variety. They also noted that yields were relatively higher in the ricemonoculture system compared to the rice–shrimp system, which provides contrasting evidenceto the conclusions of Phong et al. about salt leaching. A possible explanation for this is the widespatial variation in soil salinity, as reported by Phong et al.
The rapid changes in pond salinity that occur during the transition between wet and dryseasons (see Phong et al.
this Report) have implications for risk management of the brackishwater shrimp crops. The precise physiological tolerances to variations in salinity levels are notwell understood for the species of shrimp farmed in the rice–shrimp system. In common withother
Penaeus
species,
P. monodon, P. merguiensis
and
P. indicus
are euyrhaline species capable ofactively osmoregulating their body fluids when exposed to a wide range of external salinities(Dall et al. 1990). However, studies of osmoregulatory ability indicate that
P. monodon
has a
11
Rice–shrimp farming in the Mekong Delta: biophysical and socioeconomic issuesedited by Nigel Preston and Helena Clayton
ACIAR Technical Reports No. 52e(printed version published in 2003)
limited ability to survive in very low salinities (Ferraris et al. 1987). Field studies of the growthand survival of
P. monodon
in rice–shrimp ponds have recorded complete stock losses followingrapid falls in pond salinity (Truong Hoang Minh et al. this Report). However, field observationsalso indicated that the
P. monodon
were infected with white spot syndrome virus, which wassubsequently confirmed by PCR analysis. Whilst the precise cause of the shrimp deaths couldnot be determined, these observations are consistent with previous observations that rapidchanges in pond salinity increase the risk of mass mortalities in shrimp ponds (Chanratchakoolet al
.
1998).
Land degradation
The choice between tidal recruitment of wild shrimp postlarvae and ‘artificial’ stocking ofhatchery-purchased postlarvae is critical to the problem of sedimentation-related landdegradation. This is due to the differing water exchange practices between the two methods ofshrimp recruitment. The technology for hatchery-based systems involves low water exchangerates, whereas tidal recruitment systems are characterised by a higher water exchange rate thatis necessary for shrimp postlarvae recruitment. The frequency of water exchange is a significantfactor in land loss — the exchange and inundation of turbid water throughout the shrimp-raisingseason results in suspended sediment settling to the floor of the rice–shrimp polder.
The build-up of sediment throughout the year in the already shallow rice–shrimp polder needsto be removed at least once per year to maintain a pond depth necessary for a healthy pondenvironment for culturing shrimp. Some farmers have been able to flush the sediment back intothe river or canal, but due to the potential environmental impacts and canal managementproblems with this kind of disposal, local and provincial governments in many areas have policiesthat prohibit flushing. In the absence of other options, farmers have been depositing thesediment on top of existing border dikes and on non-productive land. However, as the capacityof these areas is exhausted, new dikes have been constructed on productive land (inside thepolder) for the deposition of the sediment. In some areas where natural shrimp recruitment hasbeen practised over the long term, the land loss arising from sedimentation is a very pressing issueand has important implications for the long-term productivity of land.
The advantage of the natural shrimp-based rice–shrimp system is that very little cash risk isimposed on the farmer; however, the loss of farmland draws the sustainability of the system intoquestion (Tran et al
.
1999; Clayton this Report). Clayton shows that the high water exchangenatural shrimp system, which results in land degradation, may be privately optimal from the pointof view of the typical Gia Rai farmer. Further analysis of the land degradation in the rice–shrimpsystem also demonstrated that as
P. monodon
survival improves so does the incentive forpreserving farmland (Clayton 2002). This analysis highlighted the importance of improving theprofitability, and reducing the risk, of low water exchange
P. monodon
farming practices in therice–shrimp system for achieving a farming system that is sustainable over the longer term.
Poor farming practices
While farmers have been traditional rice growers, shrimp farming is a relatively new technology,not only within the local region but more generally throughout the world. Most of the rice–shrimp farming development occurred in the late 1980s and comprised natural shrimp culture;the emergence of
P. monodon
culture within the rice–shrimp system has only occurred over thelast decade. Because
P. monodon
farming generally involves more ‘technology’ (i.e. man-made
12
Rice–shrimp farming in the Mekong Delta: biophysical and socioeconomic issuesedited by Nigel Preston and Helena Clayton
ACIAR Technical Reports No. 52e(printed version published in 2003)
inputs) and because there is farming experience elsewhere in the world, there was potential forachieving productivity gains simply by extending current best-practice technology to farmers inthe region. The farm survey conducted during the project (Tran Ngoc Hai et al. this Report)documented current farming characteristics and helped to identify areas where extension of bestpractice could improve productivity.
The isotope analysis conducted by Burford et al
.
(this Report) found that a large proportionof the feed (low-quality homemade feeds) that is commonly used is likely to have very littleimpact on shrimp yield. In contrast, there is evidence from the isotope that returns from high-quality commercial feed inputs are high. These high quality feeds are mostly imported atcomparatively high costs, which is why farmers have been using cheaper, locally made orhomemade feed. Further analysis of the differences between locally made and imported feed couldprovide an indication of the extent to which locally made feeds can replace imported feeds inorder to reduce input costs.
Quantity and quality issues in seedstock supply
The extreme shortages in
P. monodon
seedstock supply (postlarvae) throughout the MekongDelta shrimp farming regions is discussed in Tran Ngoc Hai et al. (this Report). Most of the
P. monodon
postlarvae used to stock shrimp farms in the Mekong Delta have to be transportedfor several hours by road from hatcheries in central Vietnam. These postlarvae are usually in poorcondition when they arrive in the Delta, and efforts to acclimatise the postlarvae to the lowsalinity conditions of the rice–shrimp ponds, while highly variable, are often unsuccessful. Thehigh levels of viral infection in postlarvae (see Walker et al. 2002) further exacerbate themortalities that occur when the shrimp experience physical stress.
The extreme shortage of postlarvae in the peak stocking period is reflected in the pricepremiums paid for seedstock in the early months of the dry season. Brennan et al. (1999) reporteda doubling of prices in the peak period. They also noted a significant premium in the price ofnursed stock compared to postlarvae that are sold directly from the trucks that import them fromNha Trang.
Financial sustainability
Farmers pay very high prices for seedstock and if losses occur, they can have serious financialproblems, especially if they have borrowed money to finance their operation. For example, thecost of stocking a shrimp pond in My Xuyen in 1997
1
was 3.6 million dong, which is three timesthe net cash income earned from the rice crop. This implies that financial sustainability is amajor concern for rice–shrimp farmers.
While good survival is critical to the success of shrimp farming, Brennan et al. (1999) pointout that the relatively low input costs of the rice–shrimp system mean that survival does not haveto be very high to break even. For example, survival rates only need to be 8 per cent to recoverseedstock costs if no feeding is used; and 17 per cent to cover the typical costs of stocking withhigher quality seed and the typical feed costs observed on farms. Many farmers (50%) in theproject survey made very large profits (in excess of 10 million dong) through good survival, whilemany others (16%) failed to achieve the break-even survival rate and lost significant cash fromshrimp farming.
1
Based on mean stocking rate of 1.8 postlarvae per square metre and a price of 200 dong per postlarvae (Brennan et al. 1999).
13
Rice–shrimp farming in the Mekong Delta: biophysical and socioeconomic issuesedited by Nigel Preston and Helena Clayton
ACIAR Technical Reports No. 52e(printed version published in 2003)
Brennan (this Report) examined the consequences of risky shrimp yield on household incomeand explored some of the strategies that can be employed to reduce the income risk. The role ofincome diversification for risk spreading was investigated. The rice and other cropping activitiesobserved in the rice–shrimp farming system in combination with the significant level of off-farmincome were shown to provide the farm with both subsistence needs and cash for the household.This diversification of farm income explains why, despite variable performance in survival,farmers practising the rice–shrimp farming system have, in general, managed to achieve financialsustainability.
Another risk-spreading strategy that was explored in Brennan (2002) is to save (or invest) inyears of good production, to provide a source of cash in years of shrimp crop failure. The use ofsavings, either in terms of cash, gold or household assets, was an observed strategy against riskon shrimp farms in the Mekong Delta. This practice could be encouraged more widely throughextension. The strengthening of microcredit schemes could provide farmers with a good returnon savings, and if these funds were used to provide seasonal loans to other shrimp farmers, theywould provide a means of cross-sectional ‘risk pooling’. However, managers of credit servicesneed to be fully aware of the high risks associated with lending and should encourage farmers toundertake sensible financial management, including income diversification and selectingstocking rates that they can afford.
In coming years, as shrimp technology based on pathogen-free shrimp postlarvae becomesavailable to farmers in the Mekong Delta, there will be choices to be made between investing inhigh-input ‘quarantined’ systems and the current extensive diversified system. The investmentin pathogen-free postlarvae is likely to involve the removal of all potential sources of pathogenssuch as crabs and naturally recruited shrimp species, the income from which is currently widelyused by rice–shrimp farmers as insurance against the risks of
P. monodon
stocking. Brennan (thisReport) raises a potential policy issue that may need to be addressed with the introduction ofhigh-quality disease-free
P. monodon
. Farmers who are able to access pathogen-free stock arelikely to want to follow a ‘
monodon
only’ stocking strategy. However, efforts by these farmers toestablish a disease-free production environment may be inhibited as their poorer neighbours, forwhom cultivation of mixed species systems may continue to provide important risk insurance,would provide an unwanted potential viral source to neighbouring ponds.
Emerging issues
Over the course of the project, concerns have been raised about the expansion andintensification of shrimp farming in the Mekong Delta. These concerns, which have been raisedby policy makers as well as farmers at project workshops, relate in part to the on-going farm levelproblems that have been discussed in this chapter, such as the shrimp disease, effects of salinityon rice productivity, and problems with shrimp postlarvae quality and supply. The concerns arealso raised in the context of the uncontrolled shrimp monoculture development in areas of theMekong Delta where the local government is keen to encourage integrated rice–shrimp systems.The local governments, in the study region, are investigating the role that land zoning can playin planning and regulating the development of rice–shrimp and other farming systems in thebrackish-water areas. In Le Quang Tri et al. (this Report) results are presented of an evaluationof land suitability in the Gia Rai District for the development of farming systems, particularlyrice–shrimp systems. The purpose of this study was to provide assistance to local governments indeveloping sustainable land-use planning and infrastructure investment.
14
Rice–shrimp farming in the Mekong Delta: biophysical and socioeconomic issuesedited by Nigel Preston and Helena Clayton
ACIAR Technical Reports No. 52e(printed version published in 2003)
Throughout the project, local people have also emphasised the importance of disseminatingthe research findings from the project to farmers. In response to this need, there has been on-going work during a twelve-month project extension phase, which has detailed the bestmanagement practices arising from the research findings presented in the appendix of thisReport. With assistance from DANIDA, the Mariculture Department at Can Tho Universityhave developed an extension video and CD-ROM that details best management practices —from pond preparation and postlarvae selection through pond management during growout.These products have been widely distributed to farmers and extension officers in the region.
References
Brennan, D., Clayton, H., Tran Thanh Be and Tran The Nhu Hiep 1999. Economic and social characteristicsand farm management practices of farms in the brackish water region of Soc Trang and Bac Lieu provinces,Mekong Delta, Vietnam: Results of a 1997 survey, www.reap.com.au/riceshrimp/survey97.html
Brennan, D. 2002. Risk and the rational farmer. Australian Journal of Agricultural Economics, 46 (4), pp 1–13
.
Chanratchakool, P., Turnbull, J., Funge-Smith, S.J., MacRae, I.H. and Limsuwan, C. 1998. Health managementin shrimp ponds. Bangkok, Aquatic Animal Health Research Institute, Department of Fisheries, KasetsartUniversity.
Clayton, H. 2002. The Economics of Land Degradation in the Rice–shrimp System in the Mekong Delta,Vietnam. University of Sydney, unpublished Masters of Agricultural Economics Thesis, Department ofAgricultural Economics.
Dall, W., Hill, B.J., Rothlisberg, P.C. and Staples, D.J. 1990. The biology of the Penaeidea. Advances in MarineBiology Volume 27.
Ferraris, R.P., Parado-Estepa, F.D., De Jesus, E.G. and Ladja, J.M. 1987. Osmotic and chloride regulation in thehaemolymph of the tiger prawn
Penaeus monodon
during moulting in various salinities. Marine Biology, 95,377–38.
Tran T.B., Le, C.D., and Brennan, D. 1999. Environmental costs of shrimp culture in the rice-growing regionsof the Mekong Delta. Aquaculture Economics and Management, 3(1): 31–42.
Walker, P.J., Phan, T., Hodgson, R.A.J., Cowley, J.A., Flegel, T.W., Boonsaeng, V. and Withyachumnarnkul, B.2002. Yellow head complex viruses occur commonly in healthy
P. monodon
in Asia and Australia. WorldAquaculture Society Book of Abstracts. Beijing, China, April 2002, 773.
15
Rice–shrimp farming in the Mekong Delta: biophysical and socioeconomic issuesedited by Nigel Preston and Helena Clayton
ACIAR Technical Reports No. 52e(printed version published in 2003)
CHAPTER 2
Socioeconomic characteristics of rice–shrimp farms in the study region
Tran Thanh Be
1
, Helena Clayton
1
and Donna Brennan
1
1
Faculty of Agriculture, University of Sydney, NSW 2001, AustraliaEmail Tran Thanh Be: [email protected]
Abstract
In this paper the results from the project’s farm household survey are drawn upon in a discussionof the socioeconomic and production characteristics of farms in the study area. In this discussionan overview is provided on the household characteristics, the farm cropping activities, farmproduction practices and performance, and household income of the survey farms. The paperplaces particular emphasis on the shrimp farming practices and performance on the survey farms.Two types of shrimp farming practice were observed, one based on natural recruitment of shrimpseedstock with few supplementary inputs, and the other based on relatively high cashinvestments in
Penaeus monodon
seedstock and other inputs. The higher input systems wereobserved to be more prevalent in My Xuyen district compared to Gia Rai. The householdspracticing the higher input system made significantly more income, but faced high risk associatedwith shrimp mortality. The results from the survey reported here, along with more detailedinformation from the survey that have not been reported in this overview paper, have provideduseful insights into the sustainability issues in the rice-shrimp system in the study area. Thisinformation has been used in the project either directly in developing extension material forfarmers or in modifying the planned experimental work during the project.
I
N
THE
FIRST
year of the project, a cross-sectional farm household survey was undertaken withfarmers from four villages in the project districts of My Xuyen and Gia Rai. The purpose of thesurvey was to document the main economic and social characteristics of the farm systems inthe region and to identify farm management practices used in the principle farming systems. Theresults of this survey are reported in Brennan et al. (1999) and Brennan et al. (2000), and aredrawn on here to present an overview of the socioeconomic characteristics of farm householdsand farming systems in the study region. The initial survey was followed up by a smaller surveyof a subset of the initial farmers, and observed trends in some of the major variables are alsoreported in this chapter.
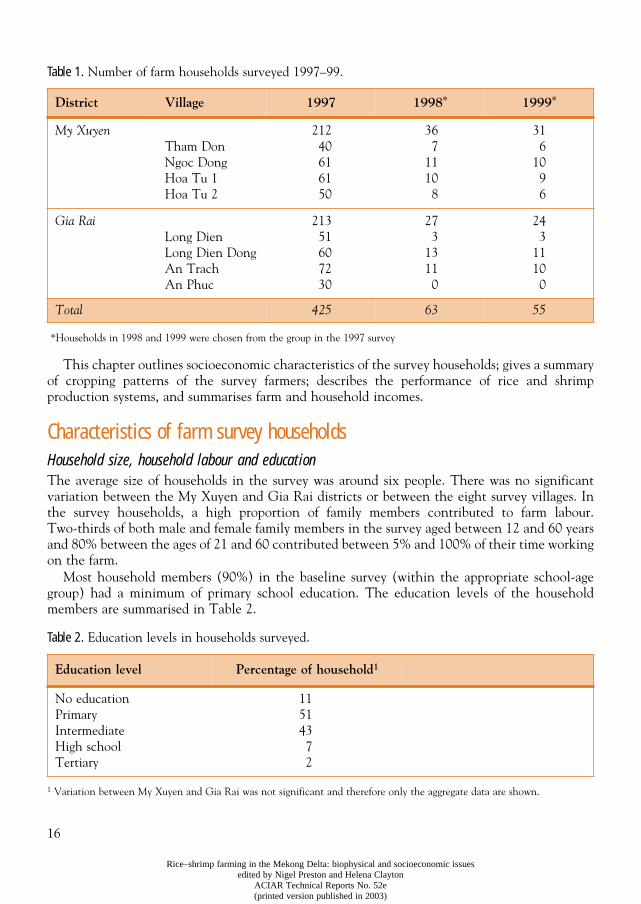
The four villages selected for the survey were chosen in consultation with provincialgovernment and local commune officials. The farms within the chosen villages were randomlyselected. In total, 425 farms were surveyed using a detailed questionnaire to gain anunderstanding of farm management practices. The survey relied upon farmers’ recall of practicesused in the 1997 dry and wet seasons. A smaller group of farmers who were selected from theoriginal survey group participated in a logbook survey in the two years following the initialsurvey. The number of farmers interviewed for each district and village over the three years from1997 to 1999 is summarised in Table 1.
16
Rice–shrimp farming in the Mekong Delta: biophysical and socioeconomic issuesedited by Nigel Preston and Helena Clayton
ACIAR Technical Reports No. 52e(printed version published in 2003)
Table 1.
Number of farm households surveyed 1997–99.
*Households in 1998 and 1999 were chosen from the group in the 1997 survey
This chapter outlines socioeconomic characteristics of the survey households; gives a summaryof cropping patterns of the survey farmers; describes the performance of rice and shrimpproduction systems, and summarises farm and household incomes.
Characteristics of farm survey households
Household size, household labour and education
The average size of households in the survey was around six people. There was no significantvariation between the My Xuyen and Gia Rai districts or between the eight survey villages. Inthe survey households, a high proportion of family members contributed to farm labour.Two-thirds of both male and female family members in the survey aged between 12 and 60 yearsand 80% between the ages of 21 and 60 contributed between 5% and 100% of their time workingon the farm.
Most household members (90%) in the baseline survey (within the appropriate school-agegroup) had a minimum of primary school education. The education levels of the householdmembers are summarised in Table 2.
Table 2.
Education levels in households surveyed.
1
Variation between My Xuyen and Gia Rai was not significant and therefore only the aggregate data are shown.
District Village 1997 1998
*
1999
*
My Xuyen
Tham DonNgoc DongHoa Tu 1Hoa Tu 2
21240616150
367
11108
316
1096
Gia Rai
Long DienLong Dien DongAn TrachAn Phuc
21351607230
273
13110
243
11100
Total 425 63 55
Education level Percentage of household
1
No educationPrimaryIntermediateHigh schoolTertiary
11514372
17
Rice–shrimp farming in the Mekong Delta: biophysical and socioeconomic issuesedited by Nigel Preston and Helena Clayton
ACIAR Technical Reports No. 52e(printed version published in 2003)
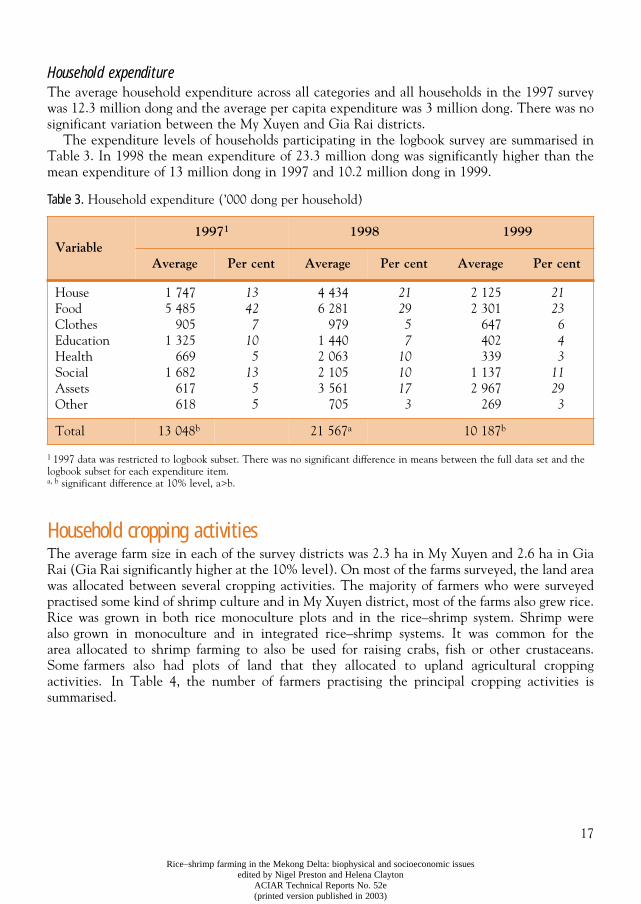
Household expenditure
The average household expenditure across all categories and all households in the 1997 surveywas 12.3 million dong and the average per capita expenditure was 3 million dong. There was nosignificant variation between the My Xuyen and Gia Rai districts.
The expenditure levels of households participating in the logbook survey are summarised inTable 3. In 1998 the mean expenditure of 23.3 million dong was significantly higher than themean expenditure of 13 million dong in 1997 and 10.2 million dong in 1999.
Table 3.
Household expenditure (’000 dong per household)
1
1997 data was restricted to logbook subset. There was no significant difference in means between the full data set and the logbook subset for each expenditure item.
a, b
significant difference at 10% level, a>b.
Household cropping activities
The average farm size in each of the survey districts was 2.3 ha in My Xuyen and 2.6 ha in GiaRai (Gia Rai significantly higher at the 10% level). On most of the farms surveyed, the land areawas allocated between several cropping activities. The majority of farmers who were surveyedpractised some kind of shrimp culture and in My Xuyen district, most of the farms also grew rice.Rice was grown in both rice monoculture plots and in the rice–shrimp system. Shrimp werealso grown in monoculture and in integrated rice–shrimp systems. It was common for thearea allocated to shrimp farming to also be used for raising crabs, fish or other crustaceans.Some farmers also had plots of land that they allocated to upland agricultural croppingactivities. In Table 4, the number of farmers practising the principal cropping activities issummarised.
Variable1997
1
1998 1999
Average Per cent Average Per cent Average Per cent
HouseFoodClothesEducationHealthSocialAssetsOther
1 7475 485
9051 325
6691 682
617618
13427
105
1355
4 4346 281
9791 4402 0632 1053 561
705
212957
1010173
2 1252 301
647402339
1 1372 967
269
2123643
11293
Total 13 048
b
21 567
a
10 187
b
18
Rice–shrimp farming in the Mekong Delta: biophysical and socioeconomic issuesedited by Nigel Preston and Helena Clayton
ACIAR Technical Reports No. 52e(printed version published in 2003)
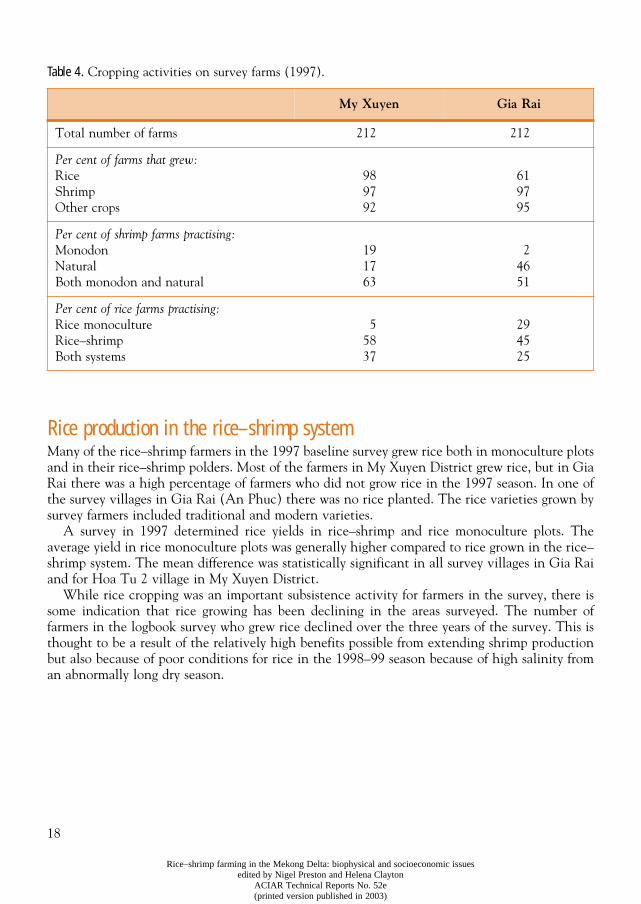
Table 4.
Cropping activities on survey farms (1997).
Rice production in the rice–shrimp system
Many of the rice–shrimp farmers in the 1997 baseline survey grew rice both in monoculture plotsand in their rice–shrimp polders. Most of the farmers in My Xuyen District grew rice, but in GiaRai there was a high percentage of farmers who did not grow rice in the 1997 season. In one ofthe survey villages in Gia Rai (An Phuc) there was no rice planted. The rice varieties grown bysurvey farmers included traditional and modern varieties.
A survey in 1997 determined rice yields in rice–shrimp and rice monoculture plots. Theaverage yield in rice monoculture plots was generally higher compared to rice grown in the rice–shrimp system. The mean difference was statistically significant in all survey villages in Gia Raiand for Hoa Tu 2 village in My Xuyen District.
While rice cropping was an important subsistence activity for farmers in the survey, there issome indication that rice growing has been declining in the areas surveyed. The number offarmers in the logbook survey who grew rice declined over the three years of the survey. This isthought to be a result of the relatively high benefits possible from extending shrimp productionbut also because of poor conditions for rice in the 1998–99 season because of high salinity froman abnormally long dry season.
My Xuyen Gia Rai
Total number of farms 212 212
Per cent of farms that grew:
RiceShrimpOther crops
989792
619795
Per cent of shrimp farms practising:
MonodonNatural Both monodon and natural
191763
24651
Per cent of rice farms practising:
Rice monocultureRice–shrimpBoth systems
55837
294525
19
Rice–shrimp farming in the Mekong Delta: biophysical and socioeconomic issuesedited by Nigel Preston and Helena Clayton
ACIAR Technical Reports No. 52e(printed version published in 2003)
Shrimp farming practices and trends
Shrimp stocking practices
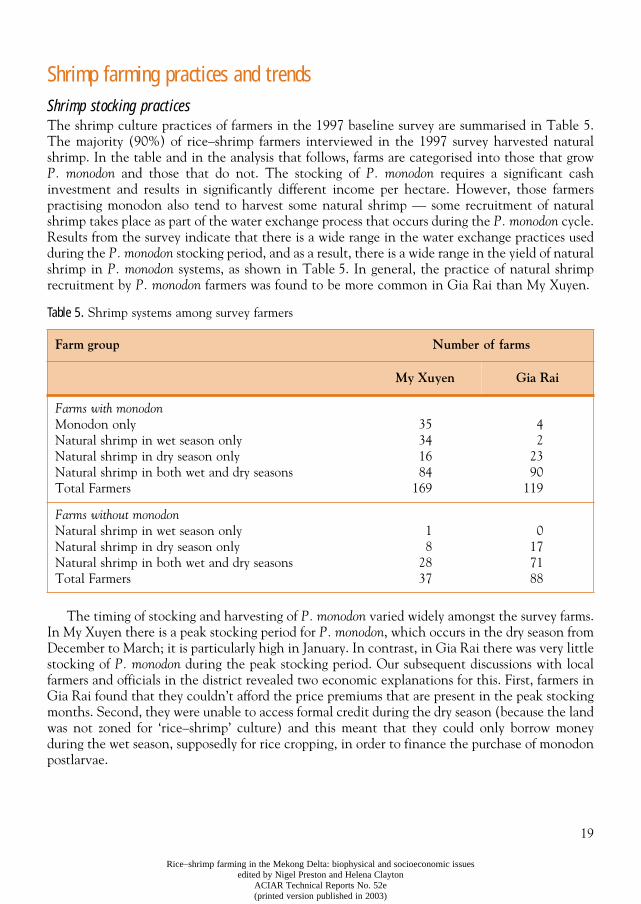
The shrimp culture practices of farmers in the 1997 baseline survey are summarised in Table 5.The majority (90%) of rice–shrimp farmers interviewed in the 1997 survey harvested naturalshrimp. In the table and in the analysis that follows, farms are categorised into those that grow
P. monodon
and those that do not. The stocking of
P. monodon
requires a significant cashinvestment and results in significantly different income per hectare. However, those farmerspractising monodon also tend to harvest some natural shrimp — some recruitment of naturalshrimp takes place as part of the water exchange process that occurs during the
P. monodon
cycle.Results from the survey indicate that there is a wide range in the water exchange practices usedduring the
P. monodon
stocking period, and as a result, there is a wide range in the yield of naturalshrimp in
P. monodon
systems, as shown in Table 5. In general, the practice of natural shrimprecruitment by
P. monodon
farmers was found to be more common in Gia Rai than My Xuyen.
Table 5.
Shrimp systems among survey farmers
The timing of stocking and harvesting of
P. monodon
varied widely amongst the survey farms.In My Xuyen there is a peak stocking period for
P. monodon
, which occurs in the dry season fromDecember to March; it is particularly high in January. In contrast, in Gia Rai there was very littlestocking of
P. monodon
during the peak stocking period. Our subsequent discussions with localfarmers and officials in the district revealed two economic explanations for this. First, farmers inGia Rai found that they couldn’t afford the price premiums that are present in the peak stockingmonths. Second, they were unable to access formal credit during the dry season (because the landwas not zoned for ‘rice–shrimp’ culture) and this meant that they could only borrow moneyduring the wet season, supposedly for rice cropping, in order to finance the purchase of monodonpostlarvae.
Farm group Number of farms
My Xuyen Gia Rai
Farms with monodon
Monodon onlyNatural shrimp in wet season onlyNatural shrimp in dry season onlyNatural shrimp in both wet and dry seasonsTotal Farmers
35341684
169
42
2390
119
Farms without monodon
Natural shrimp in wet season onlyNatural shrimp in dry season onlyNatural shrimp in both wet and dry seasonsTotal Farmers
18
2837
0177188
20
Rice–shrimp farming in the Mekong Delta: biophysical and socioeconomic issuesedited by Nigel Preston and Helena Clayton
ACIAR Technical Reports No. 52e(printed version published in 2003)
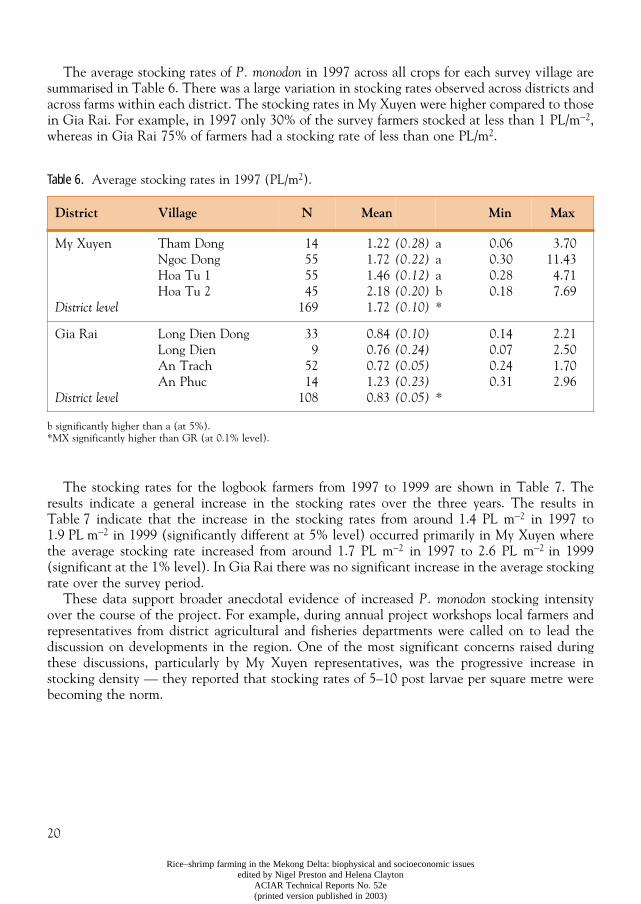
The average stocking rates of
P. monodon
in 1997 across all crops for each survey village aresummarised in Table 6. There was a large variation in stocking rates observed across districts andacross farms within each district. The stocking rates in My Xuyen were higher compared to thosein Gia Rai. For example, in 1997 only 30% of the survey farmers stocked at less than 1 PL/m
−
2
,whereas in Gia Rai 75% of farmers had a stocking rate of less than one PL/m
2
.
Table 6.
Average stocking rates in 1997 (PL/m
2
).
b significantly higher than a (at 5%).*MX significantly higher than GR (at 0.1% level).
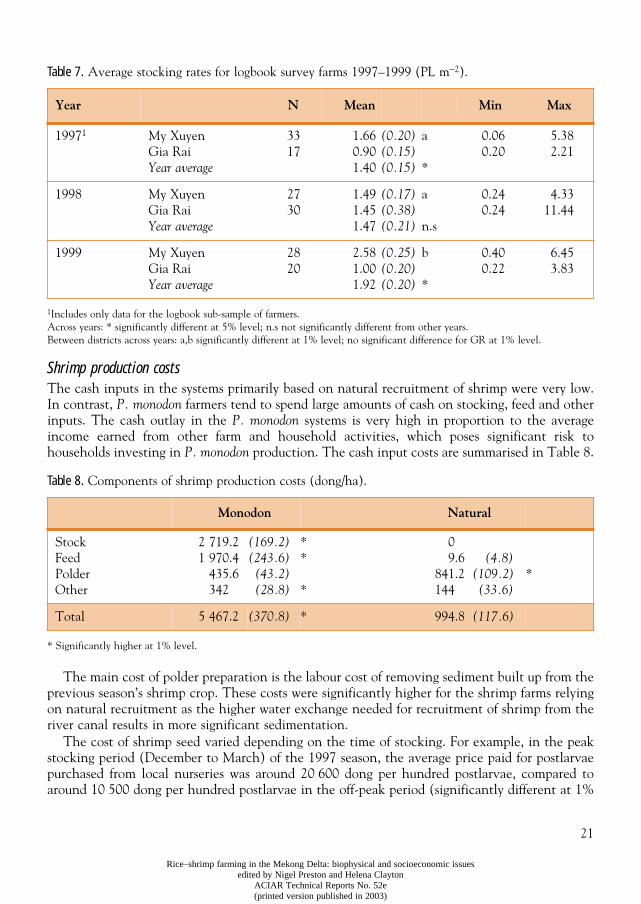
The stocking rates for the logbook farmers from 1997 to 1999 are shown in Table 7. Theresults indicate a general increase in the stocking rates over the three years. The results inTable 7 indicate that the increase in the stocking rates from around 1.4 PL m
−
2
in 1997 to1.9 PL m
−
2
in 1999 (significantly different at 5% level) occurred primarily in My Xuyen wherethe average stocking rate increased from around 1.7 PL m
−
2
in 1997 to 2.6 PL m
−
2
in 1999(significant at the 1% level). In Gia Rai there was no significant increase in the average stockingrate over the survey period.
These data support broader anecdotal evidence of increased
P. monodon
stocking intensityover the course of the project. For example, during annual project workshops local farmers andrepresentatives from district agricultural and fisheries departments were called on to lead thediscussion on developments in the region. One of the most significant concerns raised duringthese discussions, particularly by My Xuyen representatives, was the progressive increase instocking density — they reported that stocking rates of 5–10 post larvae per square metre werebecoming the norm.
District Village N Mean Min Max
My Xuyen
District level
Tham DongNgoc DongHoa Tu 1Hoa Tu 2
14555545
169
1.221.721.462.181.72
(0.28)(0.22)(0.12)(0.20)(0.10)
a aab*
0.060.300.280.18
3.7011.434.717.69
Gia Rai
District level
Long Dien DongLong DienAn TrachAn Phuc
339
5214
108
0.840.760.721.230.83
(0.10)(0.24)(0.05)(0.23)(0.05)
*
0.140.070.240.31
2.212.501.702.96
21
Rice–shrimp farming in the Mekong Delta: biophysical and socioeconomic issuesedited by Nigel Preston and Helena Clayton
ACIAR Technical Reports No. 52e(printed version published in 2003)
Table 7.
Average stocking rates for logbook survey farms 1997–1999 (PL m
−
2
).
1
Includes only data for the logbook sub-sample of farmers.Across years: * significantly different at 5% level; n.s not significantly different from other years.Between districts across years: a,b significantly different at 1% level; no significant difference for GR at 1% level.
Shrimp production costs
The cash inputs in the systems primarily based on natural recruitment of shrimp were very low.In contrast,
P. monodon
farmers tend to spend large amounts of cash on stocking, feed and otherinputs. The cash outlay in the
P. monodon
systems is very high in proportion to the averageincome earned from other farm and household activities, which poses significant risk tohouseholds investing in
P. monodon
production. The cash input costs are summarised in Table 8.
Table 8.
Components of shrimp production costs (dong/ha).
* Significantly higher at 1% level.
The main cost of polder preparation is the labour cost of removing sediment built up from theprevious season’s shrimp crop. These costs were significantly higher for the shrimp farms relyingon natural recruitment as the higher water exchange needed for recruitment of shrimp from theriver canal results in more significant sedimentation.
The cost of shrimp seed varied depending on the time of stocking. For example, in the peakstocking period (December to March) of the 1997 season, the average price paid for postlarvaepurchased from local nurseries was around 20 600 dong per hundred postlarvae, compared toaround 10 500 dong per hundred postlarvae in the off-peak period (significantly different at 1%
Year N Mean Min Max
1997
1
My XuyenGia Rai
Year average
3317
1.660.901.40
(0.20)(0.15)(0.15)
a
*
0.060.20
5.382.21
1998 My XuyenGia Rai
Year average
2730
1.491.451.47
(0.17)(0.38)(0.21)
a
n.s
0.240.24
4.3311.44
1999 My XuyenGia Rai
Year average
2820
2.581.001.92
(0.25)(0.20)(0.20)
b
*
0.400.22
6.453.83
Monodon Natural
StockFeedPolderOther
2 719.21 970.4
435.6342
(169.2)(243.6)(43.2)(28.8)
**
*
09.6
841.2144
(4.8)(109.2)(33.6)
*
Total 5 467.2 (370.8) * 994.8 (117.6)
22
Rice–shrimp farming in the Mekong Delta: biophysical and socioeconomic issuesedited by Nigel Preston and Helena Clayton
ACIAR Technical Reports No. 52e(printed version published in 2003)
level). A significant price premium also applies to nursed stock versus seed stock purchaseddirectly from a truck. In the 1997 season, the premium paid for nursed stock was around 7 800dong per hundred postlarvae in the peak season and 5 200 dong per hundred postlarvae in theoff peak season in My Xuyen.
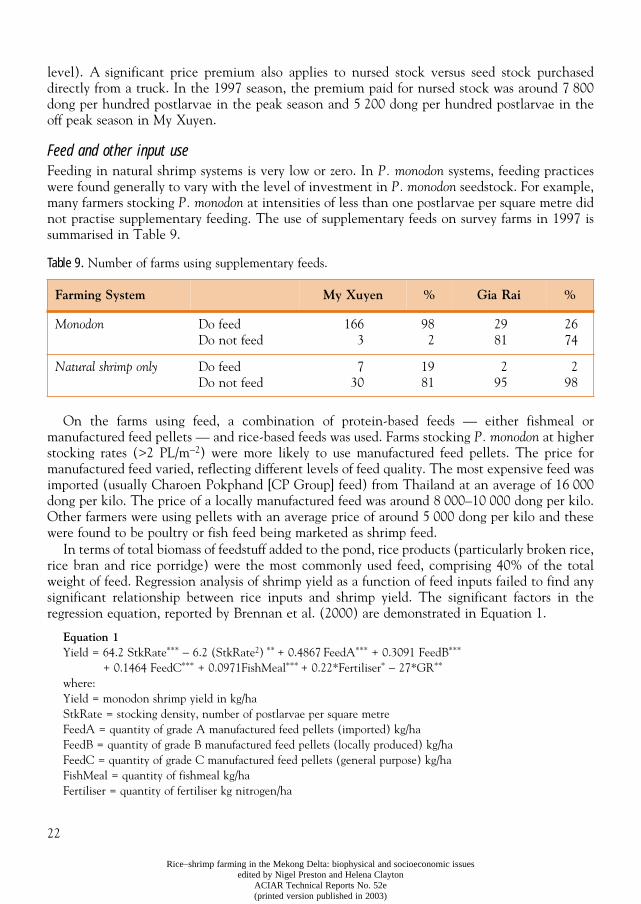
Feed and other input useFeeding in natural shrimp systems is very low or zero. In P. monodon systems, feeding practiceswere found generally to vary with the level of investment in P. monodon seedstock. For example,many farmers stocking P. monodon at intensities of less than one postlarvae per square metre didnot practise supplementary feeding. The use of supplementary feeds on survey farms in 1997 issummarised in Table 9.
Table 9. Number of farms using supplementary feeds.
On the farms using feed, a combination of protein-based feeds — either fishmeal ormanufactured feed pellets — and rice-based feeds was used. Farms stocking P. monodon at higherstocking rates (>2 PL/m−2) were more likely to use manufactured feed pellets. The price formanufactured feed varied, reflecting different levels of feed quality. The most expensive feed wasimported (usually Charoen Pokphand [CP Group] feed) from Thailand at an average of 16 000dong per kilo. The price of a locally manufactured feed was around 8 000–10 000 dong per kilo.Other farmers were using pellets with an average price of around 5 000 dong per kilo and thesewere found to be poultry or fish feed being marketed as shrimp feed.
In terms of total biomass of feedstuff added to the pond, rice products (particularly broken rice,rice bran and rice porridge) were the most commonly used feed, comprising 40% of the totalweight of feed. Regression analysis of shrimp yield as a function of feed inputs failed to find anysignificant relationship between rice inputs and shrimp yield. The significant factors in theregression equation, reported by Brennan et al. (2000) are demonstrated in Equation 1.
Equation 1Yield = 64.2 StkRate*** − 6.2 (StkRate2) ** + 0.4867 FeedA*** + 0.3091 FeedB***
+ 0.1464 FeedC*** + 0.0971FishMeal*** + 0.22*Fertiliser* − 27*GR**
where:Yield = monodon shrimp yield in kg/haStkRate = stocking density, number of postlarvae per square metreFeedA = quantity of grade A manufactured feed pellets (imported) kg/haFeedB = quantity of grade B manufactured feed pellets (locally produced) kg/haFeedC = quantity of grade C manufactured feed pellets (general purpose) kg/haFishMeal = quantity of fishmeal kg/haFertiliser = quantity of fertiliser kg nitrogen/ha
Farming System My Xuyen % Gia Rai %
Monodon Do feedDo not feed
1663
982
2981
2674
Natural shrimp only Do feed Do not feed
730
1981
295
298
23
Rice–shrimp farming in the Mekong Delta: biophysical and socioeconomic issuesedited by Nigel Preston and Helena Clayton
ACIAR Technical Reports No. 52e(printed version published in 2003)
GR = dummy variable representing shrimp ponds in Gia Rai district
Significance: *** 0.1% level, ** 5% level, * 10% level
Equation 2
R2 = 0.79, 159 observations
The lack of significance of rice inputs is supported by isotope analysis conducted on shrimpselected from the project’s experimental ponds, reported in Burford et al. (this Report), whichfound that rice feeds provide little or no nutritional value to shrimp. These results imply thatfarmers are wasting resources by adding rice-based feeds to the pond, while also jeopardising waterquality by adding useless organic matter to the pond.
Other commonly used inputs to production include derris, a natural piscicide which is usedon the majority of farms in all districts. Lime was widely used in My Xuyen (75% of farmers),but in Gia Rai it was less common. Direct application of fertiliser in the shrimp pond is notcommon on the farms, although fertiliser application during the rice crop may provide an indirectsource of fertiliser to the shrimp pond.
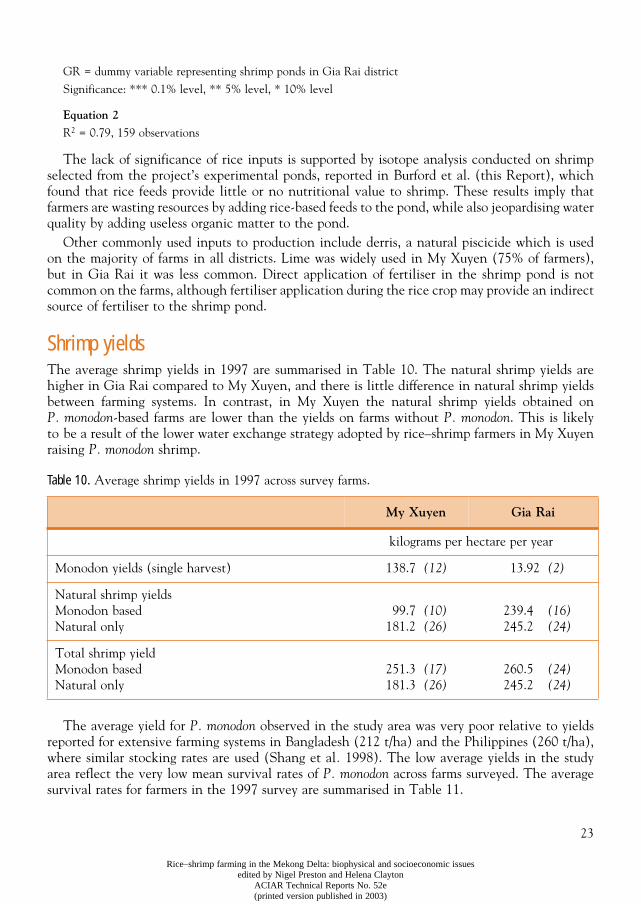
Shrimp yieldsThe average shrimp yields in 1997 are summarised in Table 10. The natural shrimp yields arehigher in Gia Rai compared to My Xuyen, and there is little difference in natural shrimp yieldsbetween farming systems. In contrast, in My Xuyen the natural shrimp yields obtained onP. monodon-based farms are lower than the yields on farms without P. monodon. This is likelyto be a result of the lower water exchange strategy adopted by rice–shrimp farmers in My Xuyenraising P. monodon shrimp.
Table 10. Average shrimp yields in 1997 across survey farms.
The average yield for P. monodon observed in the study area was very poor relative to yieldsreported for extensive farming systems in Bangladesh (212 t/ha) and the Philippines (260 t/ha),where similar stocking rates are used (Shang et al. 1998). The low average yields in the studyarea reflect the very low mean survival rates of P. monodon across farms surveyed. The averagesurvival rates for farmers in the 1997 survey are summarised in Table 11.
My Xuyen Gia Rai
kilograms per hectare per year
Monodon yields (single harvest) 138.7 (12) 13.92 (2)
Natural shrimp yieldsMonodon basedNatural only
99.7181.2
(10)(26)
239.4245.2
(16)(24)
Total shrimp yieldMonodon basedNatural only
251.3181.3
(17)(26)
260.5245.2
(24)(24)
24
Rice–shrimp farming in the Mekong Delta: biophysical and socioeconomic issuesedited by Nigel Preston and Helena Clayton
ACIAR Technical Reports No. 52e(printed version published in 2003)
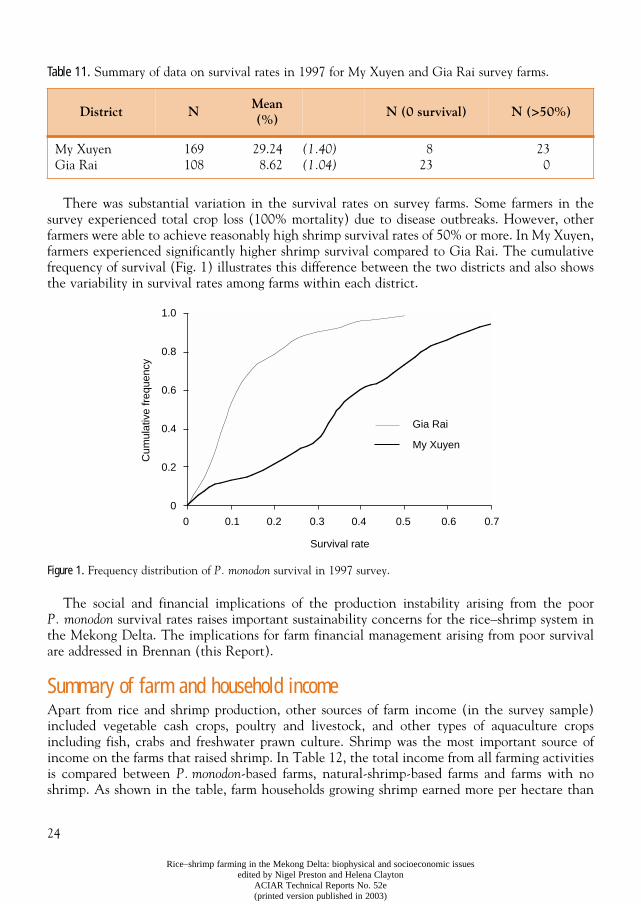
Table 11. Summary of data on survival rates in 1997 for My Xuyen and Gia Rai survey farms.
There was substantial variation in the survival rates on survey farms. Some farmers in thesurvey experienced total crop loss (100% mortality) due to disease outbreaks. However, otherfarmers were able to achieve reasonably high shrimp survival rates of 50% or more. In My Xuyen,farmers experienced significantly higher shrimp survival compared to Gia Rai. The cumulativefrequency of survival (Fig. 1) illustrates this difference between the two districts and also showsthe variability in survival rates among farms within each district.
Figure 1. Frequency distribution of P. monodon survival in 1997 survey.
The social and financial implications of the production instability arising from the poorP. monodon survival rates raises important sustainability concerns for the rice–shrimp system inthe Mekong Delta. The implications for farm financial management arising from poor survivalare addressed in Brennan (this Report).
Summary of farm and household incomeApart from rice and shrimp production, other sources of farm income (in the survey sample)included vegetable cash crops, poultry and livestock, and other types of aquaculture cropsincluding fish, crabs and freshwater prawn culture. Shrimp was the most important source ofincome on the farms that raised shrimp. In Table 12, the total income from all farming activitiesis compared between P. monodon-based farms, natural-shrimp-based farms and farms with noshrimp. As shown in the table, farm households growing shrimp earned more per hectare than
District NMean(%)
N (0 survival) N (>50%)
My XuyenGia Rai
169108
29.248.62
(1.40)(1.04)
823
230
Gia Rai
My Xuyen
Cum
ulat
ive
freq
uenc
y
Survival rate
0 0.1 0.2 0.3 0.4 0.5 0.6 0.7
1.0
0.8
0.6
0.4
0.2
0
25
Rice–shrimp farming in the Mekong Delta: biophysical and socioeconomic issuesedited by Nigel Preston and Helena Clayton
ACIAR Technical Reports No. 52e(printed version published in 2003)
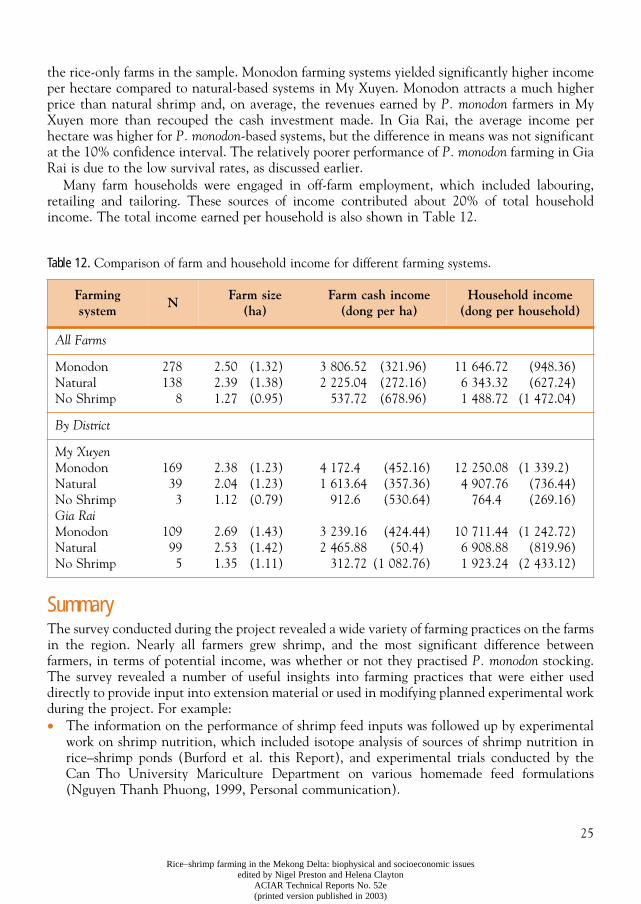
the rice-only farms in the sample. Monodon farming systems yielded significantly higher incomeper hectare compared to natural-based systems in My Xuyen. Monodon attracts a much higherprice than natural shrimp and, on average, the revenues earned by P. monodon farmers in MyXuyen more than recouped the cash investment made. In Gia Rai, the average income perhectare was higher for P. monodon-based systems, but the difference in means was not significantat the 10% confidence interval. The relatively poorer performance of P. monodon farming in GiaRai is due to the low survival rates, as discussed earlier.
Many farm households were engaged in off-farm employment, which included labouring,retailing and tailoring. These sources of income contributed about 20% of total householdincome. The total income earned per household is also shown in Table 12.
Table 12. Comparison of farm and household income for different farming systems.
SummaryThe survey conducted during the project revealed a wide variety of farming practices on the farmsin the region. Nearly all farmers grew shrimp, and the most significant difference betweenfarmers, in terms of potential income, was whether or not they practised P. monodon stocking.The survey revealed a number of useful insights into farming practices that were either useddirectly to provide input into extension material or used in modifying planned experimental workduring the project. For example:• The information on the performance of shrimp feed inputs was followed up by experimental
work on shrimp nutrition, which included isotope analysis of sources of shrimp nutrition inrice–shrimp ponds (Burford et al. this Report), and experimental trials conducted by theCan Tho University Mariculture Department on various homemade feed formulations(Nguyen Thanh Phuong, 1999, Personal communication).
Farming system
NFarm size
(ha)Farm cash income
(dong per ha)Household income
(dong per household)
All Farms
MonodonNatural No Shrimp
278138
8
2.502.391.27
(1.32)(1.38)(0.95)
3 806.522 225.04
537.72
(321.96)(272.16)(678.96)
11 646.726 343.321 488.72
(948.36)(627.24)
(1 472.04)
By District
My XuyenMonodonNatural No ShrimpGia RaiMonodonNaturalNo Shrimp
169393
109995
2.382.041.12
2.692.531.35
(1.23)(1.23)(0.79)
(1.43)(1.42)(1.11)
4 172.41 613.64
912.6
3 239.162 465.88
312.72
(452.16)(357.36)(530.64)
(424.44)(50.4)
(1 082.76)
12 250.084 907.76
764.4
10 711.446 908.881 923.24
(1 339.2)(736.44)(269.16)
(1 242.72)(819.96)
(2 433.12)
26
Rice–shrimp farming in the Mekong Delta: biophysical and socioeconomic issuesedited by Nigel Preston and Helena Clayton
ACIAR Technical Reports No. 52e(printed version published in 2003)
• The very high water exchange rates being practised on some farms during monodon cycleswas considered to be poor practice by the scientific team, and experiments were subsequentlydesigned to demonstrate the effect of water exchange on pond water quality, as reported inTran Thi Tuyet Hoa et al. (this Report).
• The information on the very poor survival rates of P. monodon in the study area, andparticularly Gia Rai, helped to highlight the extent of the seedstock supply and health-screening problems. Subsequently, extra emphasis was placed on the study of health andsurvival issues and seedstock supply problems during project workshops. Bioeconomic analysisof the implications of poor survival on farm income risk was also undertaken (Brennan thisReport).Some of the results that were of direct use to the project included detailed information about
shrimp-farming practices that are not reported in this overview. For example, poor hygiene wasobserved on a number of farms in the study (where farmers were restocking after shrimp diseaseoutbreaks without disinfecting the pond), and this indicated an urgency for extension materialon simple pond hygiene practices. Farmers’ lack of knowledge about how to identify good qualitypostlarvae was identified and subsequently information on simple visual screening methods wasprovided in extension leaflets.
The survey also provided the necessary background for much of the bioeconomic analysis thatwas conducted during the project. For example, Clayton (this Report) explores the underlyingeconomic incentives that have driven the land degradation (land loss through sedimentation)that was observed in Gia Rai.
ReferencesAhmed, F. 1997. In defense of land and livelihood: coastal communities and the shrimp industry in Asia.
Consumers’ Association of Penang, CUSO, Inter Pares, Sierra Club of Canada.Barraclough, S. and Finger-Stich, A. 1996. Some Ecological and Social Implications of Commercial Shrimp
Farming in Asia. UNRISD Discussion Paper, United Nations.Brennan, D., Clayton, H., Tran Thanh Be and Tran The Nhu Hiep 1999. Economic and social characteristics
and farm management practices of farms in the brackish water region of Soc Trang and Bac Lieu provinces,Mekong Delta, Vietnam: results of a 1997 survey, www.reap.com.au/riceshrimpsurvey97.pdf
Brennan, D., Clayton, H., Tran Than Be 2000. Economic characteristics of extensive shrimp farms in theMekong Delta, Aquaculture Economics and Management, 4 (3/4).
Funge-Smith, S. and Briggs, M. 1998. Nutrient budgets in intensive shrimp ponds: implications for sustainability.Aquaculture, 164, 117–133.
Le Xuan Sinh 2001. The situation of the shrimp industry in the Mekong Delta (2000–2001). Unpublished reportsubmitted to the ACIAR Rice–Shrimp Project, University of Sydney.
Phillips, M.J., Kwei, L.C., Beveridge, M.C.M. 1993. Shrimp culture and the environment: lessons from theworld’s most rapidly expanding warmwater aquaculture sector. In: Pullin, R., Rosenthal, H. and Maclean, J.,eds, Environment and Aquaculture in Developing Countries. Manila, ICLARM.
Primavera, J.H. 1998. Tropical shrimp farming and its sustainability. In: De Silva, S., ed., Tropical Aquaculture.London, Academic Press, 257–289.
Quarto, A., Cissna, and Taylor 1998. A perspective on the global consequences of shrimp aquaculture: realproblems, potential solutions. In: de Silva, S., ed., Tropical Aquaculture. London, Academic Press.
Shang, Y., Leung, P. and Ling, B. 1998. Comparative economics of shrimp farming in Asia. Aquaculture(164): 183–200.
Tran T.B., Le, C.D. and Brennan, D. 1999. Environmental costs of shrimp culture in the rice-growing regions ofthe Mekong Delta. Aquaculture Economics and Management, 3(1), 31–42.
27
Rice–shrimp farming in the Mekong Delta: biophysical and socioeconomic issuesedited by Nigel Preston and Helena Clayton
ACIAR Technical Reports No. 52e(printed version published in 2003)
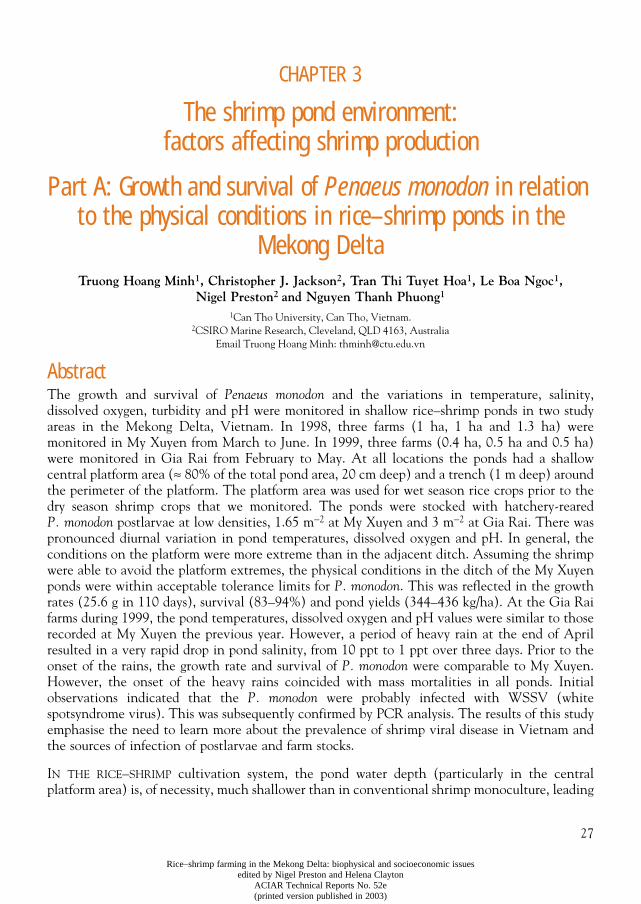
CHAPTER 3
The shrimp pond environment: factors affecting shrimp production
Part A: Growth and survival of
Penaeus monodon
in relation to the physical conditions in rice–shrimp ponds in the
Mekong Delta
Truong Hoang Minh
1
, Christopher J. Jackson
2
, Tran Thi Tuyet Hoa
1
, Le Boa Ngoc
1
, Nigel Preston
2
and Nguyen Thanh Phuong
1
1
Can Tho University, Can Tho, Vietnam.
2
CSIRO Marine Research, Cleveland, QLD 4163, AustraliaEmail Truong Hoang Minh: [email protected]
Abstract
The growth and survival of
Penaeus monodon
and the variations in temperature, salinity,dissolved oxygen, turbidity and pH were monitored in shallow rice–shrimp ponds in two studyareas in the Mekong Delta, Vietnam. In 1998, three farms (1 ha, 1 ha and 1.3 ha) weremonitored in My Xuyen from March to June. In 1999, three farms (0.4 ha, 0.5 ha and 0.5 ha)were monitored in Gia Rai from February to May. At all locations the ponds had a shallowcentral platform area (
≈
80% of the total pond area, 20 cm deep) and a trench (1 m deep) aroundthe perimeter of the platform. The platform area was used for wet season rice crops prior to thedry season shrimp crops that we monitored. The ponds were stocked with hatchery-reared
P. monodon
postlarvae at low densities, 1.65 m
−
2
at My Xuyen and 3 m
−
2
at Gia Rai. There waspronounced diurnal variation in pond temperatures, dissolved oxygen and pH. In general, theconditions on the platform were more extreme than in the adjacent ditch. Assuming the shrimpwere able to avoid the platform extremes, the physical conditions in the ditch of the My Xuyenponds were within acceptable tolerance limits for
P. monodon
. This was reflected in the growthrates (25.6 g in 110 days), survival (83–94%) and pond yields (344–436 kg/ha). At the Gia Raifarms during 1999, the pond temperatures, dissolved oxygen and pH values were similar to thoserecorded at My Xuyen the previous year. However, a period of heavy rain at the end of Aprilresulted in a very rapid drop in pond salinity, from 10 ppt to 1 ppt over three days. Prior to theonset of the rains, the growth rate and survival of
P. monodon
were comparable to My Xuyen.However, the onset of the heavy rains coincided with mass mortalities in all ponds. Initialobservations indicated that the
P. monodon
were probably infected with WSSV (whitespotsyndrome virus). This was subsequently confirmed by PCR analysis. The results of this studyemphasise the need to learn more about the prevalence of shrimp viral disease in Vietnam andthe sources of infection of postlarvae and farm stocks.
I
N
THE
RICE
–
SHRIMP
cultivation system, the pond water depth (particularly in the centralplatform area) is, of necessity, much shallower than in conventional shrimp monoculture, leading
28
Rice–shrimp farming in the Mekong Delta: biophysical and socioeconomic issuesedited by Nigel Preston and Helena Clayton
ACIAR Technical Reports No. 52e(printed version published in 2003)
to more extreme physical conditions. It is possible that these extremes might, at times,compromise shrimp survival. It was therefore of critical interest to farmers and environmentalmanagers to determine the key factors responsible for shrimp mortalities in this system. So far,most of the quantitative information on the physical factors that affect the growth and survivalof farmed shrimp have come from studies of intensive shrimp-farming systems. For example,studies of intensive systems have shown that survival and growth of
Penaeus monodon
are affectedby variations in key physical factors including pond temperature (Jackson and Wang 1998),salinity and dissolved oxygen.
However, the relationship between variations in these parameters on the growth and survivalof
P. monodon
in the rice–shrimp farming systems has not been determined. Accordingly, theobjective of this study was to determine quantitatively the physical conditions in the pond duringthe shrimp production system and assess the influence of variations in these conditions on thegrowth and survival of
P. monodon
.
Materials and methods
The study area was in My Xuyen District (Soc Trang Province) in 1998 and Gia Rai District(Bac Lieu Province) in 1999 (see Figure 3, Chapter 1 this Report). The study sites were threerice–shrimp farms (1 ha, 1 ha and 1.3 ha) in My Xuyen which were monitored from March toJune 1998, and three rice–shrimp farms in Gia Rai (0.4 ha, 0.5 ha and 0.5 ha) which weremonitored from February to May 1999. The farm ponds all had a central platform area (80% ofthe total pond area, approximately 20 cm deep) where a wet season rice crop was grown prior tothe dry season shrimp crop. The platform was surrounded by a ditch approximately 1 m deep.Prior to stocking, ponds were prepared by removal of sedimented material in the ditches, dryingthe platform, liming the entire pond and killing predators with rotenone.
Pond stocking management and monitoring
The ponds were stocked with
P. monodon
postlarvae (mean total length: 18 mm) that had beentransported by road from a hatchery in Nha Trang. The postlarvae were only selected for stockingif they survived a stress test of ten minutes immersion in 150 ppm formalin. Postlarvae wereacclimated to ambient ditch conditions for about one hour before stocking. The mean stockingdensity was 1.65 m
−
2
at the My Xuyen farms and 3 m
−
2
at the Gia Rai farms. The My Xuyenfarms were stocked in February 1998. The Gia Rai farms were stocked in March 1999 — this wasthe second crop for that year.
At the My Xuyen farms the shrimp were fed a commercial pelleted feed for the first month.The shrimp were then fed a home-made food including: rice (30%), rice bran (15%), fish meal(50%), premix (2.5%), vitamin C (2.5%) and trash fish. At the Gia Rai farm, the shrimp werefed with commercial pelleted feeds.
Sampling
During the experimental period, temperature, salinity, turbidity, dissolved oxygen and pH weremonitored daily at three sites on both the platform and the ditch in the early morning and lateafternoon using a datalogger (YEOKAL). Twice per month, on every spring tide, the sameparameters were monitored in the supply canal.
29
Rice–shrimp farming in the Mekong Delta: biophysical and socioeconomic issuesedited by Nigel Preston and Helena Clayton
ACIAR Technical Reports No. 52e(printed version published in 2003)
Samples of shrimp were taken every two weeks using a cast net. The minimum number ofshrimp collected was 100 for small shrimp (<2 g) or 50 for larger shrimp (>2 g). The mean weightwas calculated as the total weight divided by the number of individuals.
Results
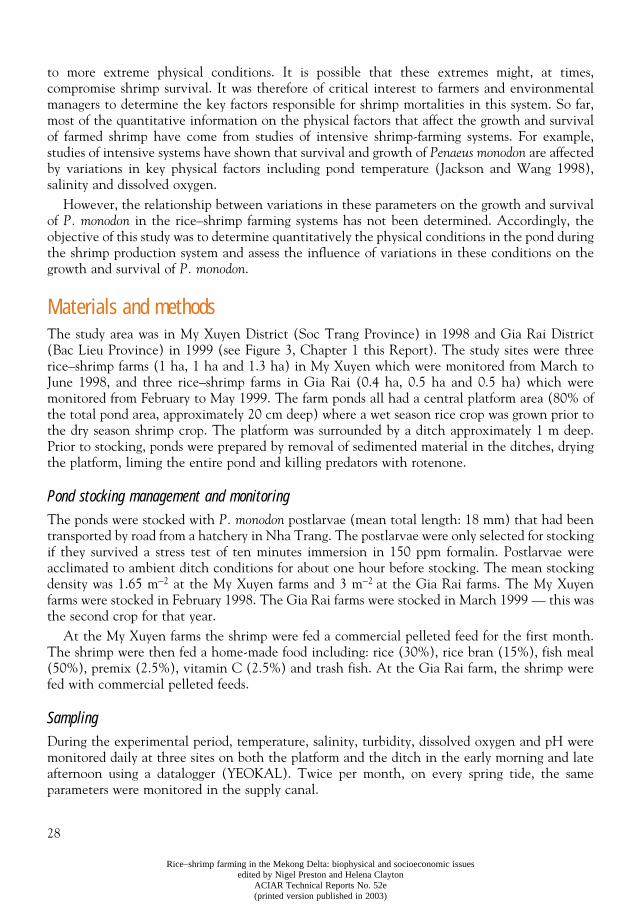
Diurnal and spatial variability
There was pronounced diurnal variation in pond temperatures, dissolved oxygen (DO) and pH.For example, at the ponds in My Xuyen province the mean daily difference in temperature was5.5°C; in pH it was 0.75; and in DO it was 5.3 mg.l
−
1
(Fig. 1). Occasionally, the diurnaldifference was much greater than these averages; for example, early in the season the daily pHvariation was 1 unit or more for several days. Afternoon surface temperature reached 37°C onone occasion and was frequently above 34°C (Fig. 1).
Figure 1.
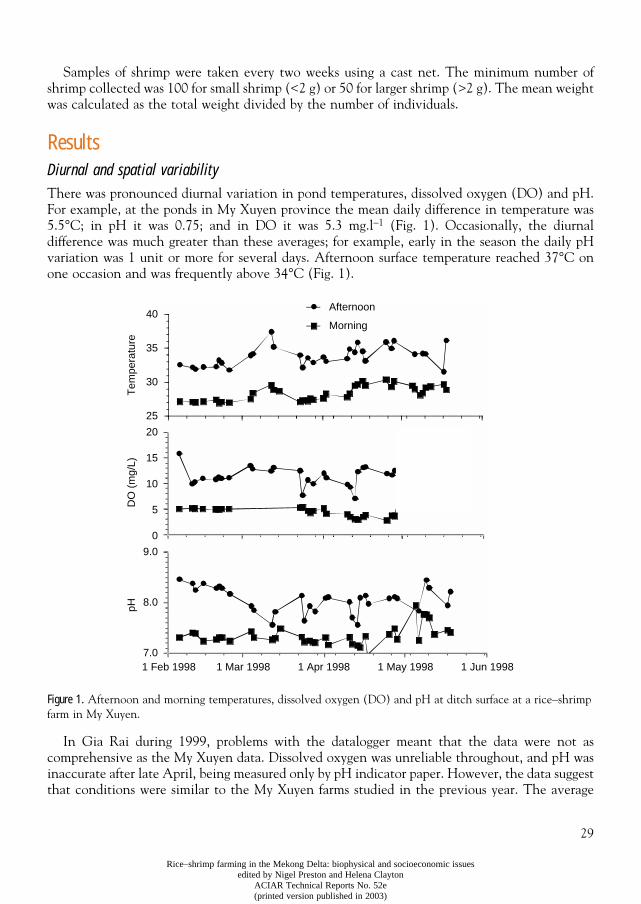
Afternoon and morning temperatures, dissolved oxygen (DO) and pH at ditch surface at a rice–shrimp farm in My Xuyen.
In Gia Rai during 1999, problems with the datalogger meant that the data were not ascomprehensive as the My Xuyen data. Dissolved oxygen was unreliable throughout, and pH wasinaccurate after late April, being measured only by pH indicator paper. However, the data suggestthat conditions were similar to the My Xuyen farms studied in the previous year. The average
Tem
pera
ture
Afternoon
Morning
DO
(m
g/L)
pH
40
35
30
25
20
15
10
5
0
9.0
8.0
7.01 Feb 1998 1 Mar 1998 1 Apr 1998 1 May 1998 1 Jun 1998
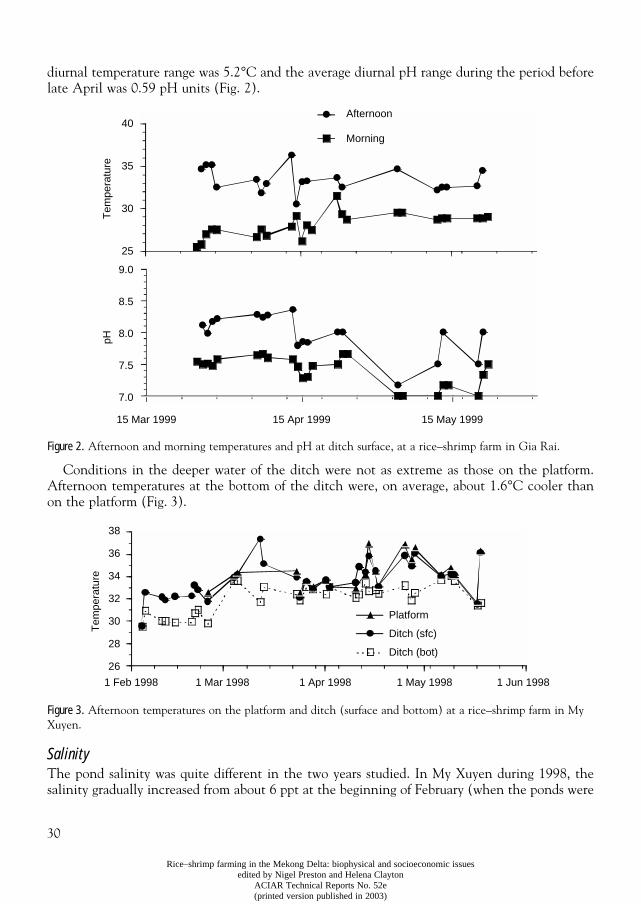
30
Rice–shrimp farming in the Mekong Delta: biophysical and socioeconomic issuesedited by Nigel Preston and Helena Clayton
ACIAR Technical Reports No. 52e(printed version published in 2003)
diurnal temperature range was 5.2°C and the average diurnal pH range during the period beforelate April was 0.59 pH units (Fig. 2).
Figure 2.
Afternoon and morning temperatures and pH at ditch surface, at a rice–shrimp farm in Gia Rai.
Conditions in the deeper water of the ditch were not as extreme as those on the platform.Afternoon temperatures at the bottom of the ditch were, on average, about 1.6°C cooler thanon the platform (Fig. 3).
Figure 3.
Afternoon temperatures on the platform and ditch (surface and bottom) at a rice–shrimp farm in My Xuyen.
Salinity
The pond salinity was quite different in the two years studied. In My Xuyen during 1998, thesalinity gradually increased from about 6 ppt at the beginning of February (when the ponds were
Afternoon
Morning
Tem
pera
ture
pH
15 Mar 1999 15 Apr 1999 15 May 1999
40
35
30
25
9.0
8.5
8.0
7.5
7.0
Tem
pera
ture
Platform
Ditch (sfc)
Ditch (bot)
1 Feb 1998 1 Mar 1998 1 Apr 1998 1 May 1998 1 Jun 1998
38
36
34
32
30
28
26
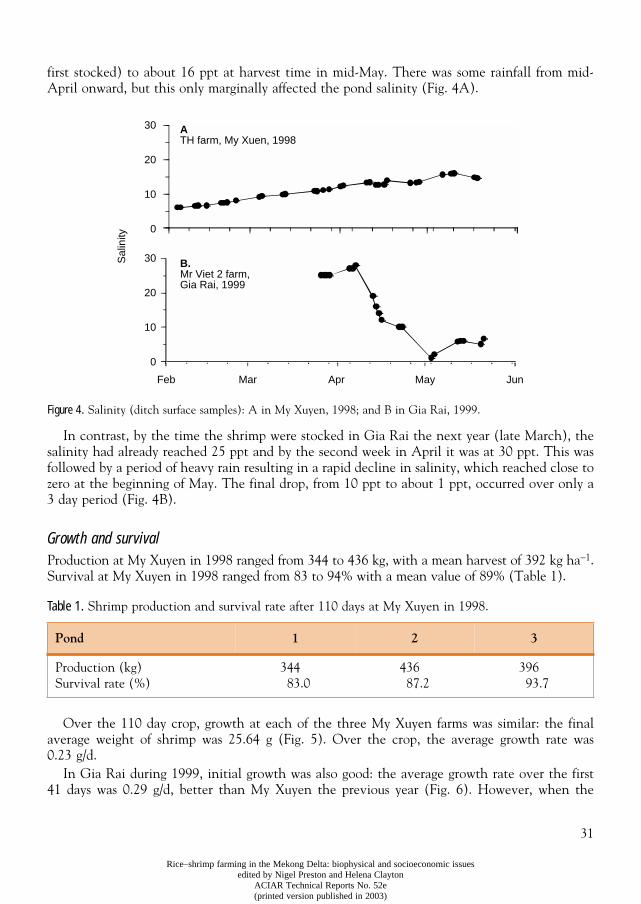
31
Rice–shrimp farming in the Mekong Delta: biophysical and socioeconomic issuesedited by Nigel Preston and Helena Clayton
ACIAR Technical Reports No. 52e(printed version published in 2003)
first stocked) to about 16 ppt at harvest time in mid-May. There was some rainfall from mid-April onward, but this only marginally affected the pond salinity (Fig. 4A).
Figure 4.
Salinity (ditch surface samples): A in My Xuyen, 1998; and B in Gia Rai, 1999.
In contrast, by the time the shrimp were stocked in Gia Rai the next year (late March), thesalinity had already reached 25 ppt and by the second week in April it was at 30 ppt. This wasfollowed by a period of heavy rain resulting in a rapid decline in salinity, which reached close tozero at the beginning of May. The final drop, from 10 ppt to about 1 ppt, occurred over only a3 day period (Fig. 4B).
Growth and survival
Production at My Xuyen in 1998 ranged from 344 to 436 kg, with a mean harvest of 392 kg ha
−
1
.Survival at My Xuyen in 1998 ranged from 83 to 94% with a mean value of 89% (Table 1).
Table 1.
Shrimp production and survival rate after 110 days at My Xuyen in 1998.
Over the 110 day crop, growth at each of the three My Xuyen farms was similar: the finalaverage weight of shrimp was 25.64 g (Fig. 5). Over the crop, the average growth rate was0.23 g/d.
In Gia Rai during 1999, initial growth was also good: the average growth rate over the first41 days was 0.29 g/d, better than My Xuyen the previous year (Fig. 6). However, when the
Pond 1 2 3
Production (kg)Survival rate (%)
34483.0
43687.2
39693.7
Sal
inity
A
B.
Gia Rai, 1999
Feb Mar Apr May Jun
30
20
10
0
30
20
10
0
TH farm, My Xuen, 1998
Mr Viet 2 farm,
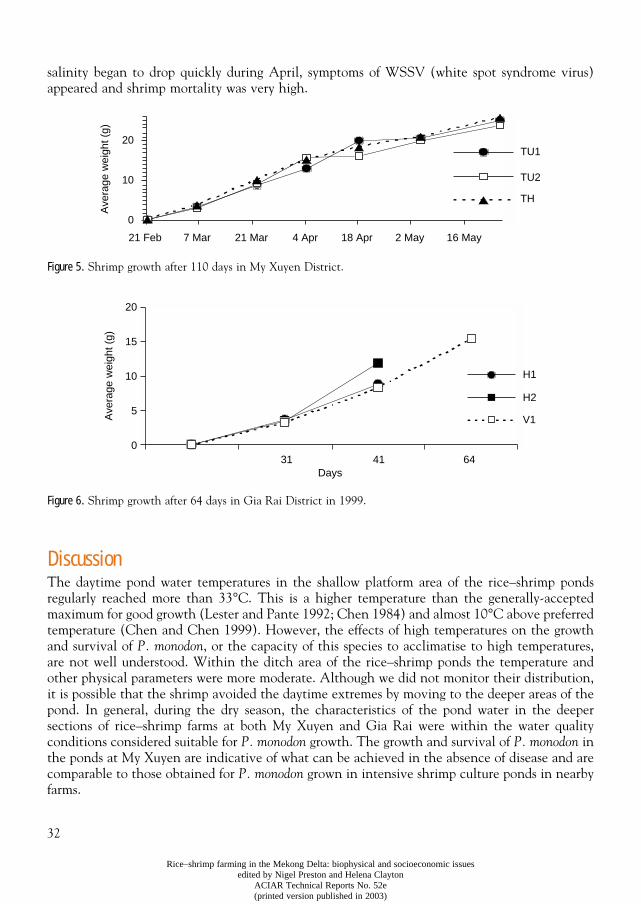
32
Rice–shrimp farming in the Mekong Delta: biophysical and socioeconomic issuesedited by Nigel Preston and Helena Clayton
ACIAR Technical Reports No. 52e(printed version published in 2003)
salinity began to drop quickly during April, symptoms of WSSV (white spot syndrome virus)appeared and shrimp mortality was very high.
Figure 5.
Shrimp growth after 110 days in My Xuyen District.
Figure 6.
Shrimp growth after 64 days in Gia Rai District in 1999.
Discussion
The daytime pond water temperatures in the shallow platform area of the rice–shrimp pondsregularly reached more than 33°C. This is a higher temperature than the generally-acceptedmaximum for good growth (Lester and Pante 1992; Chen 1984) and almost 10°C above preferredtemperature (Chen and Chen 1999). However, the effects of high temperatures on the growthand survival of
P. monodon
, or the capacity of this species to acclimatise to high temperatures,are not well understood. Within the ditch area of the rice–shrimp ponds the temperature andother physical parameters were more moderate. Although we did not monitor their distribution,it is possible that the shrimp avoided the daytime extremes by moving to the deeper areas of thepond. In general, during the dry season, the characteristics of the pond water in the deepersections of rice–shrimp farms at both My Xuyen and Gia Rai were within the water qualityconditions considered suitable for
P. monodon
growth. The growth and survival of
P. monodon
inthe ponds at My Xuyen are indicative of what can be achieved in the absence of disease and arecomparable to those obtained for
P. monodon
grown in intensive shrimp culture ponds in nearbyfarms.
Ave
rage
wei
ght (
g)
TU1
TU2
TH
21 Feb 7 Mar 21 Mar 4 Apr 18 Apr 2 May 16 May
20
10
0
Ave
rage
wei
ght (
g)
H1
H2
V1
31 41 64Days
20
15
10
5
0
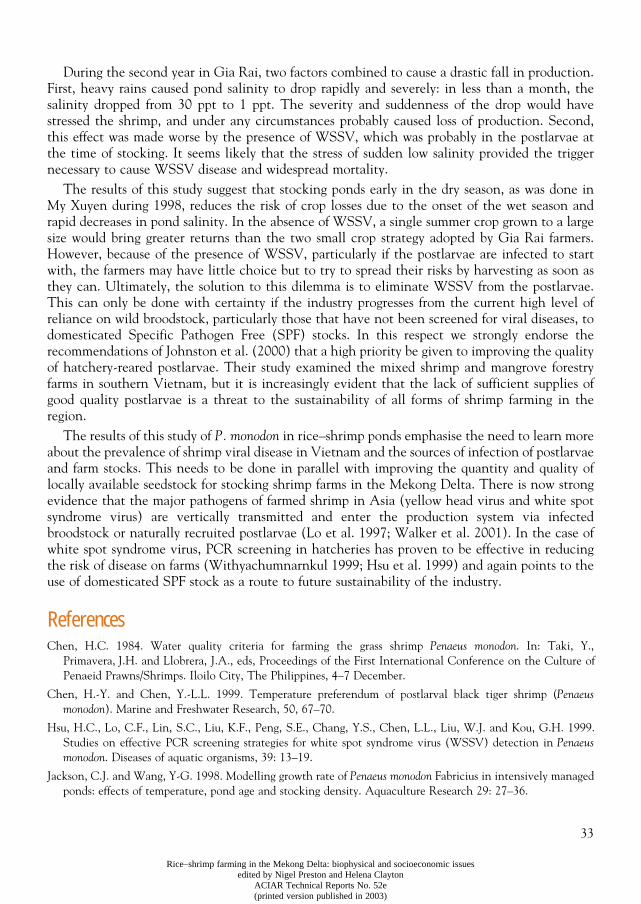
33
Rice–shrimp farming in the Mekong Delta: biophysical and socioeconomic issuesedited by Nigel Preston and Helena Clayton
ACIAR Technical Reports No. 52e(printed version published in 2003)
During the second year in Gia Rai, two factors combined to cause a drastic fall in production.First, heavy rains caused pond salinity to drop rapidly and severely: in less than a month, thesalinity dropped from 30 ppt to 1 ppt. The severity and suddenness of the drop would havestressed the shrimp, and under any circumstances probably caused loss of production. Second,this effect was made worse by the presence of WSSV, which was probably in the postlarvae atthe time of stocking. It seems likely that the stress of sudden low salinity provided the triggernecessary to cause WSSV disease and widespread mortality.
The results of this study suggest that stocking ponds early in the dry season, as was done inMy Xuyen during 1998, reduces the risk of crop losses due to the onset of the wet season andrapid decreases in pond salinity. In the absence of WSSV, a single summer crop grown to a largesize would bring greater returns than the two small crop strategy adopted by Gia Rai farmers.However, because of the presence of WSSV, particularly if the postlarvae are infected to startwith, the farmers may have little choice but to try to spread their risks by harvesting as soon asthey can. Ultimately, the solution to this dilemma is to eliminate WSSV from the postlarvae.This can only be done with certainty if the industry progresses from the current high level ofreliance on wild broodstock, particularly those that have not been screened for viral diseases, todomesticated Specific Pathogen Free (SPF) stocks. In this respect we strongly endorse therecommendations of Johnston et al. (2000) that a high priority be given to improving the qualityof hatchery-reared postlarvae. Their study examined the mixed shrimp and mangrove forestryfarms in southern Vietnam, but it is increasingly evident that the lack of sufficient supplies ofgood quality postlarvae is a threat to the sustainability of all forms of shrimp farming in theregion.
The results of this study of
P. monodon
in rice–shrimp ponds emphasise the need to learn moreabout the prevalence of shrimp viral disease in Vietnam and the sources of infection of postlarvaeand farm stocks. This needs to be done in parallel with improving the quantity and quality oflocally available seedstock for stocking shrimp farms in the Mekong Delta. There is now strongevidence that the major pathogens of farmed shrimp in Asia (yellow head virus and white spotsyndrome virus) are vertically transmitted and enter the production system via infectedbroodstock or naturally recruited postlarvae (Lo et al. 1997; Walker et al. 2001). In the case ofwhite spot syndrome virus, PCR screening in hatcheries has proven to be effective in reducingthe risk of disease on farms (Withyachumnarnkul 1999; Hsu et al. 1999) and again points to theuse of domesticated SPF stock as a route to future sustainability of the industry.
References
Chen, H.C. 1984. Water quality criteria for farming the grass shrimp
Penaeus monodon
. In: Taki, Y.,Primavera, J.H. and Llobrera, J.A., eds, Proceedings of the First International Conference on the Culture ofPenaeid Prawns/Shrimps. Iloilo City, The Philippines, 4–7 December.
Chen, H.-Y. and Chen, Y.-L.L. 1999. Temperature preferendum of postlarval black tiger shrimp (
Penaeusmonodon
). Marine and Freshwater Research, 50, 67–70.
Hsu, H.C., Lo, C.F., Lin, S.C., Liu, K.F., Peng, S.E., Chang, Y.S., Chen, L.L., Liu, W.J. and Kou, G.H. 1999.Studies on effective PCR screening strategies for white spot syndrome virus (WSSV) detection in
Penaeusmonodon
. Diseases of aquatic organisms, 39: 13–19.
Jackson, C.J. and Wang, Y-G. 1998. Modelling growth rate of
Penaeus monodon
Fabricius in intensively managedponds: effects of temperature, pond age and stocking density. Aquaculture Research 29: 27–36.
34
Rice–shrimp farming in the Mekong Delta: biophysical and socioeconomic issuesedited by Nigel Preston and Helena Clayton
ACIAR Technical Reports No. 52e(printed version published in 2003)
Johnston D., Trong, N.V., Tien, D.V., Xuan, T.T. 2000. Shrimp yields and harvest characteristics of mixedshrimp-mangrove forestry farms in southern Vietnam: factors affecting production. Aquaculture 188: 263
–
284.Lester, L.J. and Pante, M.J.R. 1992. Penaeid temperature and salinity responses. In: Fast, A.W. and Lester, L.J.,
eds, Marine Shrimp Culture: Principles and Practises. Amsterdam, Elsevier, 513–534.Lo, C.F., Ho, C.H., Chen, C.H., Liu, K.F., Chiu, Y.L., Yeh, P.Y., Peng, S.E., Hsu, H.C., Liu, H.C., Chang, C.F.,
Wang, C.H. and Kou, G.H. 1997. Detection and tissue tropism of white spot syndrome baculovirus (WSBV)in captured brooders of
Penaeus monodon
with a special emphasis on reproductive organs. Diseases of aquaticorganisms, 30: 53–72.
Withyachumnarnkul, B. 1999. Results from black tiger shrimp
Penaeus monodon
culture ponds stocked withpostlarvae PCR-positive or -negative for white spot syndrome virus. Diseases of aquatic organisms, 39: 21–27.
Walker, P.J., Cowley, J.A., Spann, K.M., Hodgson, R.A.J., Hall, M.R. and Withychumnarnkul, B. 2001. Yellowhead complex viruses: transmission cycles and topographical distribution in the Asia-Pacific region. In:Browdy, C.L. and Jory, D.E., eds, The New Wave: Proceedings of the Special Session on Sustainable ShrimpCulture, Aquaculture 2001. Baton Rouge, LA, The World Aquaculture Society, 227–237.
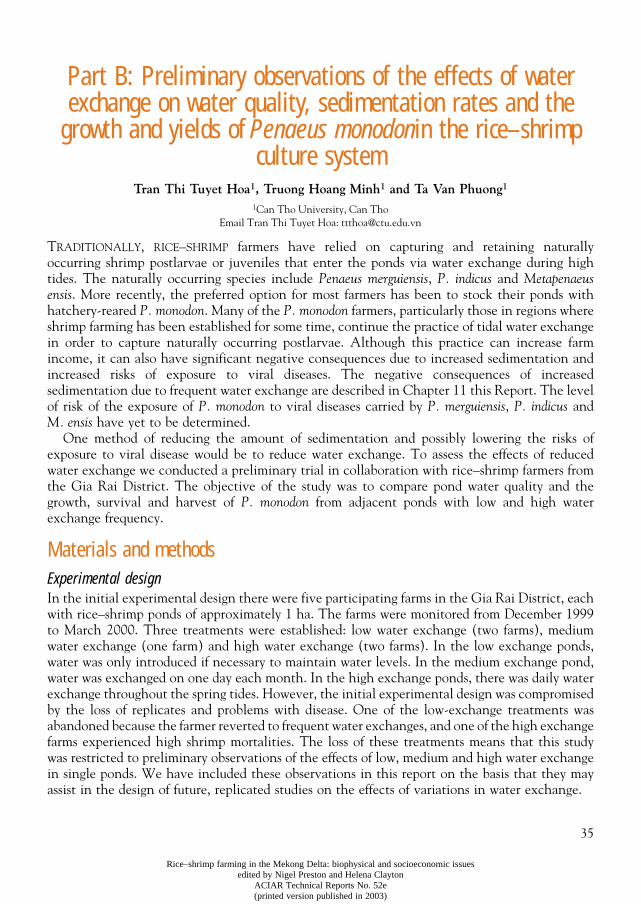
35
Rice–shrimp farming in the Mekong Delta: biophysical and socioeconomic issuesedited by Nigel Preston and Helena Clayton
ACIAR Technical Reports No. 52e(printed version published in 2003)
Part B: Preliminary observations of the effects of water exchange on water quality, sedimentation rates and the
growth and yields of
Penaeus monodon
in the rice–shrimp culture system
Tran Thi Tuyet Hoa
1
, Truong Hoang Minh
1
and Ta Van Phuong
1
1
Can Tho University, Can ThoEmail Tran Thi Tuyet Hoa: [email protected]
T
RADITIONALLY
,
RICE
–
SHRIMP
farmers have relied on capturing and retaining naturallyoccurring shrimp postlarvae or juveniles that enter the ponds via water exchange during hightides. The naturally occurring species include
Penaeus merguiensis
,
P. indicus
and
Metapenaeusensis
. More recently, the preferred option for most farmers has been to stock their ponds withhatchery-reared
P. monodon
. Many of the
P. monodon farmers, particularly those in regions whereshrimp farming has been established for some time, continue the practice of tidal water exchangein order to capture naturally occurring postlarvae. Although this practice can increase farmincome, it can also have significant negative consequences due to increased sedimentation andincreased risks of exposure to viral diseases. The negative consequences of increasedsedimentation due to frequent water exchange are described in Chapter 11 this Report. The levelof risk of the exposure of P. monodon to viral diseases carried by P. merguiensis, P. indicus andM. ensis have yet to be determined.
One method of reducing the amount of sedimentation and possibly lowering the risks ofexposure to viral disease would be to reduce water exchange. To assess the effects of reducedwater exchange we conducted a preliminary trial in collaboration with rice–shrimp farmers fromthe Gia Rai District. The objective of the study was to compare pond water quality and thegrowth, survival and harvest of P. monodon from adjacent ponds with low and high waterexchange frequency.
Materials and methodsExperimental designIn the initial experimental design there were five participating farms in the Gia Rai District, eachwith rice–shrimp ponds of approximately 1 ha. The farms were monitored from December 1999to March 2000. Three treatments were established: low water exchange (two farms), mediumwater exchange (one farm) and high water exchange (two farms). In the low exchange ponds,water was only introduced if necessary to maintain water levels. In the medium exchange pond,water was exchanged on one day each month. In the high exchange ponds, there was daily waterexchange throughout the spring tides. However, the initial experimental design was compromisedby the loss of replicates and problems with disease. One of the low-exchange treatments wasabandoned because the farmer reverted to frequent water exchanges, and one of the high exchangefarms experienced high shrimp mortalities. The loss of these treatments means that this studywas restricted to preliminary observations of the effects of low, medium and high water exchangein single ponds. We have included these observations in this report on the basis that they mayassist in the design of future, replicated studies on the effects of variations in water exchange.
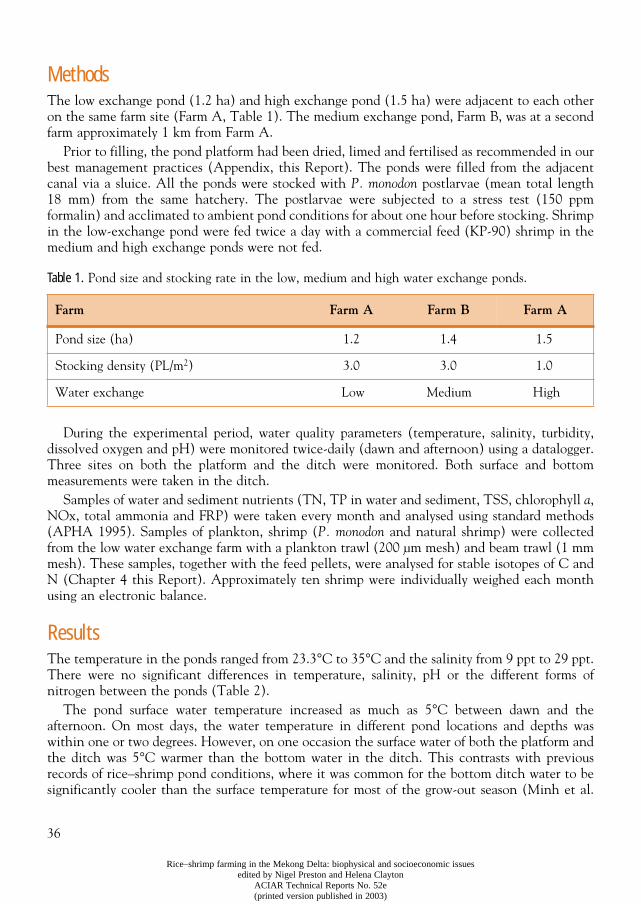
36
Rice–shrimp farming in the Mekong Delta: biophysical and socioeconomic issuesedited by Nigel Preston and Helena Clayton
ACIAR Technical Reports No. 52e(printed version published in 2003)
Methods The low exchange pond (1.2 ha) and high exchange pond (1.5 ha) were adjacent to each otheron the same farm site (Farm A, Table 1). The medium exchange pond, Farm B, was at a secondfarm approximately 1 km from Farm A.
Prior to filling, the pond platform had been dried, limed and fertilised as recommended in ourbest management practices (Appendix, this Report). The ponds were filled from the adjacentcanal via a sluice. All the ponds were stocked with P. monodon postlarvae (mean total length18 mm) from the same hatchery. The postlarvae were subjected to a stress test (150 ppmformalin) and acclimated to ambient pond conditions for about one hour before stocking. Shrimpin the low-exchange pond were fed twice a day with a commercial feed (KP-90) shrimp in themedium and high exchange ponds were not fed.
Table 1. Pond size and stocking rate in the low, medium and high water exchange ponds.
During the experimental period, water quality parameters (temperature, salinity, turbidity,dissolved oxygen and pH) were monitored twice-daily (dawn and afternoon) using a datalogger.Three sites on both the platform and the ditch were monitored. Both surface and bottommeasurements were taken in the ditch.
Samples of water and sediment nutrients (TN, TP in water and sediment, TSS, chlorophyll a,NOx, total ammonia and FRP) were taken every month and analysed using standard methods(APHA 1995). Samples of plankton, shrimp (P. monodon and natural shrimp) were collectedfrom the low water exchange farm with a plankton trawl (200 µm mesh) and beam trawl (1 mmmesh). These samples, together with the feed pellets, were analysed for stable isotopes of C andN (Chapter 4 this Report). Approximately ten shrimp were individually weighed each monthusing an electronic balance.
Results The temperature in the ponds ranged from 23.3°C to 35°C and the salinity from 9 ppt to 29 ppt.There were no significant differences in temperature, salinity, pH or the different forms ofnitrogen between the ponds (Table 2).
The pond surface water temperature increased as much as 5°C between dawn and theafternoon. On most days, the water temperature in different pond locations and depths waswithin one or two degrees. However, on one occasion the surface water of both the platform andthe ditch was 5°C warmer than the bottom water in the ditch. This contrasts with previousrecords of rice–shrimp pond conditions, where it was common for the bottom ditch water to besignificantly cooler than the surface temperature for most of the grow-out season (Minh et al.
Farm Farm A Farm B Farm A
Pond size (ha) 1.2 1.4 1.5
Stocking density (PL/m2) 3.0 3.0 1.0
Water exchange Low Medium High
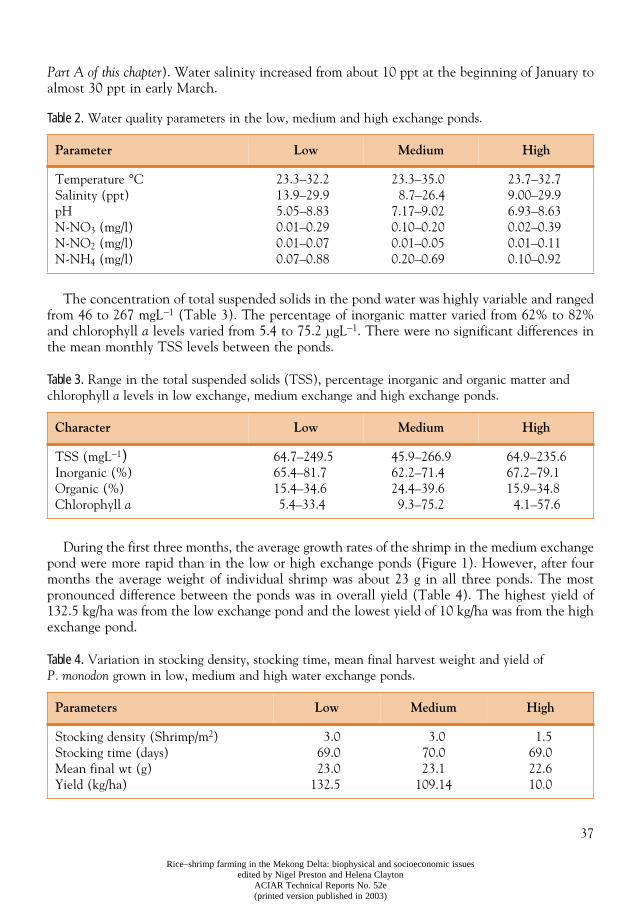
37
Rice–shrimp farming in the Mekong Delta: biophysical and socioeconomic issuesedited by Nigel Preston and Helena Clayton
ACIAR Technical Reports No. 52e(printed version published in 2003)
Part A of this chapter). Water salinity increased from about 10 ppt at the beginning of January toalmost 30 ppt in early March.
Table 2. Water quality parameters in the low, medium and high exchange ponds.
The concentration of total suspended solids in the pond water was highly variable and rangedfrom 46 to 267 mgL−1 (Table 3). The percentage of inorganic matter varied from 62% to 82%and chlorophyll a levels varied from 5.4 to 75.2 µgL−1. There were no significant differences inthe mean monthly TSS levels between the ponds.
Table 3. Range in the total suspended solids (TSS), percentage inorganic and organic matter and chlorophyll a levels in low exchange, medium exchange and high exchange ponds.
During the first three months, the average growth rates of the shrimp in the medium exchangepond were more rapid than in the low or high exchange ponds (Figure 1). However, after fourmonths the average weight of individual shrimp was about 23 g in all three ponds. The mostpronounced difference between the ponds was in overall yield (Table 4). The highest yield of132.5 kg/ha was from the low exchange pond and the lowest yield of 10 kg/ha was from the highexchange pond.
Table 4. Variation in stocking density, stocking time, mean final harvest weight and yield of P. monodon grown in low, medium and high water exchange ponds.
Parameter Low Medium High
Temperature °CSalinity (ppt)pHN-NO3 (mg/l)N-NO2 (mg/l)N-NH4 (mg/l)
23.3–32.213.9–29.95.05–8.830.01–0.290.01–0.070.07–0.88
23.3–35.08.7–26.4
7.17–9.020.10–0.200.01–0.050.20–0.69
23.7–32.79.00–29.96.93–8.630.02–0.390.01–0.110.10–0.92
Character Low Medium High
TSS (mgL−1)Inorganic (%)Organic (%)Chlorophyll a
64.7–249.565.4–81.715.4–34.65.4–33.4
45.9–266.962.2–71.424.4–39.69.3–75.2
64.9–235.667.2–79.115.9–34.8
4.1–57.6
Parameters Low Medium High
Stocking density (Shrimp/m2)Stocking time (days)Mean final wt (g)Yield (kg/ha)
3.069.023.0
132.5
3.070.023.1
109.14
1.569.022.610.0
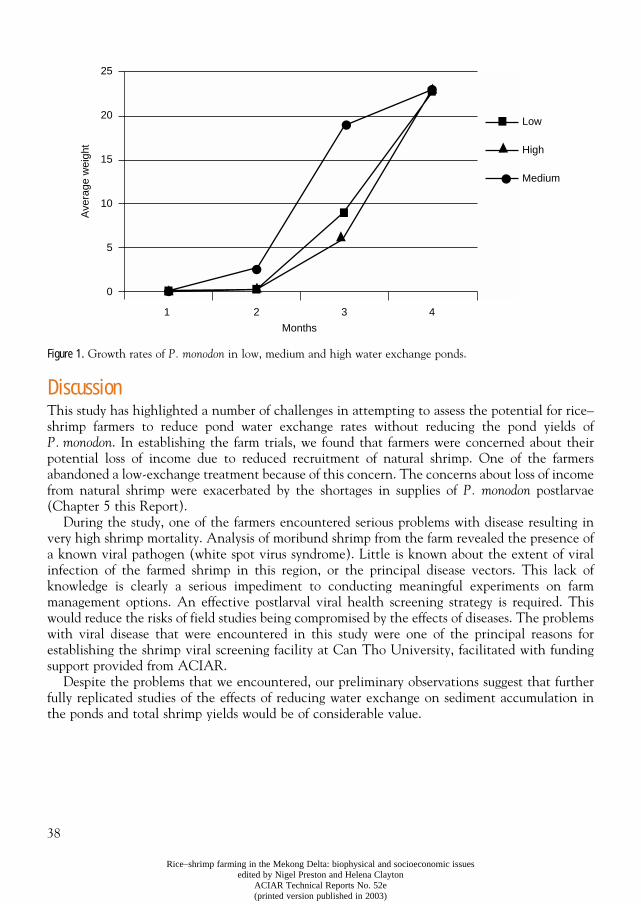
38
Rice–shrimp farming in the Mekong Delta: biophysical and socioeconomic issuesedited by Nigel Preston and Helena Clayton
ACIAR Technical Reports No. 52e(printed version published in 2003)
Figure 1. Growth rates of P. monodon in low, medium and high water exchange ponds.
DiscussionThis study has highlighted a number of challenges in attempting to assess the potential for rice–shrimp farmers to reduce pond water exchange rates without reducing the pond yields ofP. monodon. In establishing the farm trials, we found that farmers were concerned about theirpotential loss of income due to reduced recruitment of natural shrimp. One of the farmersabandoned a low-exchange treatment because of this concern. The concerns about loss of incomefrom natural shrimp were exacerbated by the shortages in supplies of P. monodon postlarvae(Chapter 5 this Report).
During the study, one of the farmers encountered serious problems with disease resulting invery high shrimp mortality. Analysis of moribund shrimp from the farm revealed the presence ofa known viral pathogen (white spot virus syndrome). Little is known about the extent of viralinfection of the farmed shrimp in this region, or the principal disease vectors. This lack ofknowledge is clearly a serious impediment to conducting meaningful experiments on farmmanagement options. An effective postlarval viral health screening strategy is required. Thiswould reduce the risks of field studies being compromised by the effects of diseases. The problemswith viral disease that were encountered in this study were one of the principal reasons forestablishing the shrimp viral screening facility at Can Tho University, facilitated with fundingsupport provided from ACIAR.
Despite the problems that we encountered, our preliminary observations suggest that furtherfully replicated studies of the effects of reducing water exchange on sediment accumulation inthe ponds and total shrimp yields would be of considerable value.
Months
1 2 3 4
Low
High
Medium
Ave
rage
wei
ght
25
20
15
10
5
0
39
Rice–shrimp farming in the Mekong Delta: biophysical and socioeconomic issuesedited by Nigel Preston and Helena Clayton
ACIAR Technical Reports No. 52e(printed version published in 2003)
CHAPTER 4
Dominant sources of dietary carbon and nitrogen for shrimp reared in extensive rice–shrimp ponds
Michele Burford
1
, Nigel Preston
1
, Truong Hoang Minh
2
, Tran Thi Tuyet Hoa
2
and Stuart Bunn
3
1
CSIRO Marine Research, Cleveland, QLD 4163, Australia
2
Can Tho University, Can Tho, Vietnam
3
Griffith University, Nathan, QLD 4111, AustraliaEmail Michele Burford: [email protected]
Abstract
Stable isotope analysis was used to determine the sources of dietary nitrogen and carbon forshrimp in rice–shrimp farms in the My Xuyen and Gia Rai districts, Vietnam. Most of the carboninput to the ponds in the My Xuyen District was in the form of homemade feed, comprising rice,rice bran, cornmeal and fishmeal. The homemade feed had low nitrogen levels and contributedlittle to the protein requirements of the shrimp at all three farms. In contrast, the commercialfeed (CF1) used at My Xuyen farms was more nutritionally balanced than the homemade feed,but was only added to ponds in low quantities early in the growth season. Two of the three farmsin the Gia Rai District used commercial feed (CF2); the third relied solely on the natural biotato supply the nutritional requirements of the shrimp. The commercial feed appeared tocontribute little to the nutritional needs of the shrimp. In contrast, the biota caught with beamtrawls in the second half of the season at My Xuyen farms and the seston at Gia Rai farms hadC:N ratios and
δ
13
C values similar to the shrimp, and may have contributed to shrimp nutrition.The C:N ratios of the sediment were high relative to the shrimp, and it is unlikely that biota inthe sediment contributed significantly to shrimp nutrition. In terms of management implications,this study suggests that there is little nutritional value in feeding shrimp homemade feed withthe current formulations. The natural biota appeared to contribute significantly to shrimpnutrition, and there is potential for a greater contribution by the addition of fertiliser high innitrogen to increase the microalgal biomass and subsequently natural feeds available for shrimp.However, this would be more effective if the turbidity in the water column were decreased,providing more light for phytoplankton, periphyton and benthic microalgal growth.
I
N
SALINE
-
AFFECTED
areas of the Mekong Delta, the traditional wet season rice crop is oftensupplemented with a dry season crop of farmed shrimp (Tran et al
.
1999). The adoption ofshrimp as a second crop in the dry season has resulted in significant income gains for somefarmers (Tran et al
.
1999; Brennan et al. 2000).In the rice–shrimp system, the shrimp farmers use a variety of different feeding practices and
diets. These range from relying on the natural biota as the only food source, to feeding withhomemade formulations or feeding with expensive commercial feeds. A recent economic analysisof representative rice–shrimp farms has indicated that the addition of homemade feeds,particularly if the main ingredients are rice and rice bran, has little impact on production(Brennan et al. 2000). One implication of these results is that the dietary requirements of theshrimp may be met by natural pond biota rather than the homemade feeds.
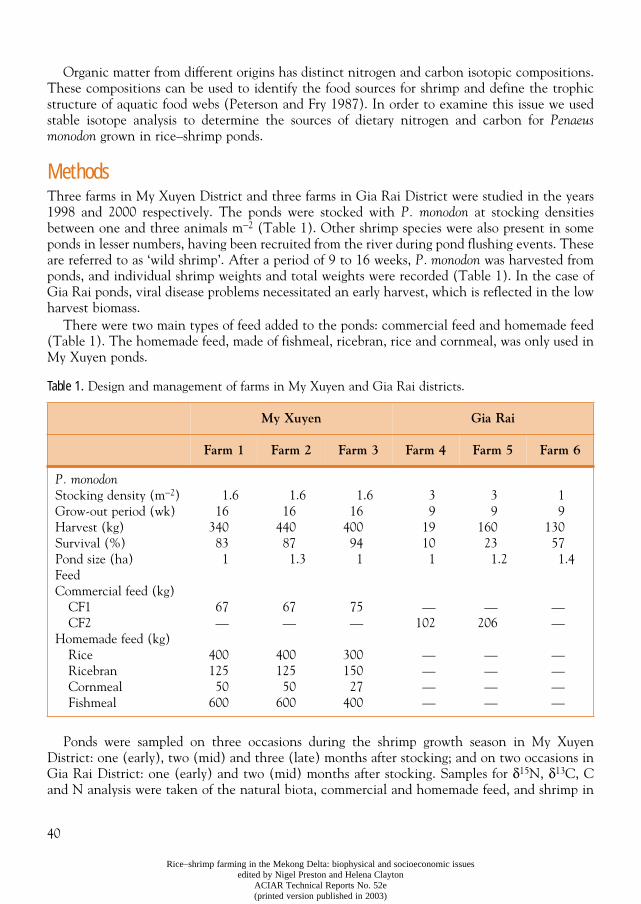
40
Rice–shrimp farming in the Mekong Delta: biophysical and socioeconomic issuesedited by Nigel Preston and Helena Clayton
ACIAR Technical Reports No. 52e(printed version published in 2003)
Organic matter from different origins has distinct nitrogen and carbon isotopic compositions.These compositions can be used to identify the food sources for shrimp and define the trophicstructure of aquatic food webs (Peterson and Fry 1987). In order to examine this issue we usedstable isotope analysis to determine the sources of dietary nitrogen and carbon for
Penaeusmonodon
grown in rice–shrimp ponds.
Methods
Three farms in My Xuyen District and three farms in Gia Rai District were studied in the years1998 and 2000 respectively. The ponds were stocked with
P. monodon
at stocking densitiesbetween one and three animals m
−
2
(Table 1). Other shrimp species
were also present in someponds in lesser numbers, having been recruited from the river during pond flushing events. Theseare referred to as ‘wild shrimp’. After a period of 9 to 16 weeks,
P. monodon
was harvested fromponds, and individual shrimp weights and total weights were recorded (Table 1). In the case ofGia Rai ponds, viral disease problems necessitated an early harvest, which is reflected in the lowharvest biomass.
There were two main types of feed added to the ponds: commercial feed and homemade feed(Table 1). The homemade feed, made of fishmeal, ricebran, rice and cornmeal, was only used inMy Xuyen ponds.
Table 1.
Design and management of farms in My Xuyen and Gia Rai districts.
Ponds were sampled on three occasions during the shrimp growth season in My XuyenDistrict: one (early), two (mid) and three (late) months after stocking; and on two occasions inGia Rai District: one (early) and two (mid) months after stocking. Samples for
δ
15
N,
δ
13
C, Cand N analysis were taken of the natural biota, commercial and homemade feed, and shrimp in
My Xuyen Gia Rai
Farm 1 Farm 2 Farm 3 Farm 4 Farm 5 Farm 6
P. monodon
Stocking density (m
−
2
)Grow-out period (wk)Harvest (kg)Survival (%)Pond size (ha)FeedCommercial feed (kg)
CF1CF2
Homemade feed (kg)RiceRicebranCornmealFishmeal
1.616
340831
67—
40012550
600
1.616
440871.3
67—
40012550
600
1.616
400941
75—
30015027
400
39
19101
—102
————
39
160231.2
—206
————
19
130571.4
——
————
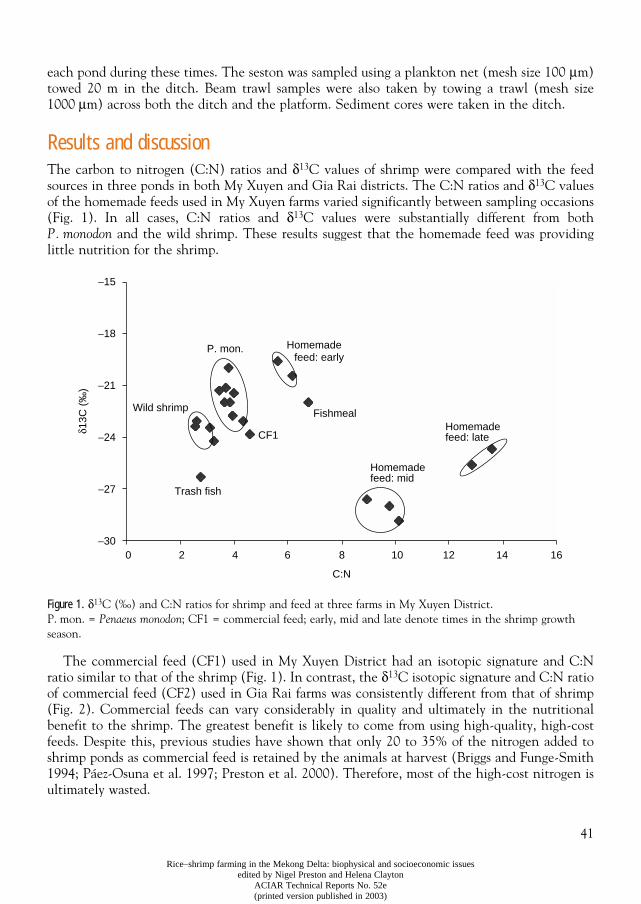
41
Rice–shrimp farming in the Mekong Delta: biophysical and socioeconomic issuesedited by Nigel Preston and Helena Clayton
ACIAR Technical Reports No. 52e(printed version published in 2003)
each pond during these times. The seston was sampled using a plankton net (mesh size 100
µ
m)towed 20 m in the ditch. Beam trawl samples were also taken by towing a trawl (mesh size1000
µ
m) across both the ditch and the platform. Sediment cores were taken in the ditch.
Results and discussion
The carbon to nitrogen (C:N) ratios and
δ
13
C values of shrimp were compared with the feedsources in three ponds in both My Xuyen and Gia Rai districts. The C:N ratios and
δ
13
C valuesof the homemade feeds used in My Xuyen farms varied significantly between sampling occasions(Fig. 1). In all cases, C:N ratios and
δ
13
C values were substantially different from both
P. monodon
and the wild shrimp. These results suggest that the homemade feed was providinglittle nutrition for the shrimp.
Figure 1.
δ
13
C (‰) and C:N ratios for shrimp and feed at three farms in My Xuyen District. P. mon. =
Penaeus monodon
; CF1 = commercial feed; early, mid and late denote times in the shrimp growth season.
The commercial feed (CF1) used in My Xuyen District had an isotopic signature and C:Nratio similar to that of the shrimp (Fig. 1). In contrast, the
δ
13
C isotopic signature and C:N ratioof commercial feed (CF2) used in Gia Rai farms was consistently different from that of shrimp(Fig. 2). Commercial feeds can vary considerably in quality and ultimately in the nutritionalbenefit to the shrimp. The greatest benefit is likely to come from using high-quality, high-costfeeds. Despite this, previous studies have shown that only 20 to 35% of the nitrogen added toshrimp ponds as commercial feed is retained by the animals at harvest (Briggs and Funge-Smith1994; Páez-Osuna et al. 1997; Preston et al. 2000). Therefore, most of the high-cost nitrogen isultimately wasted.
Homemadefeed: early
FishmealHomemadefeed: late
Homemadefeed: mid
CF1
P. mon.
Wild shrimp
Trash fish
0 2 4 6 8 10 12 14 16
δ13C
(‰
)
−15
−18
−21
−24
−27
−30
C:N
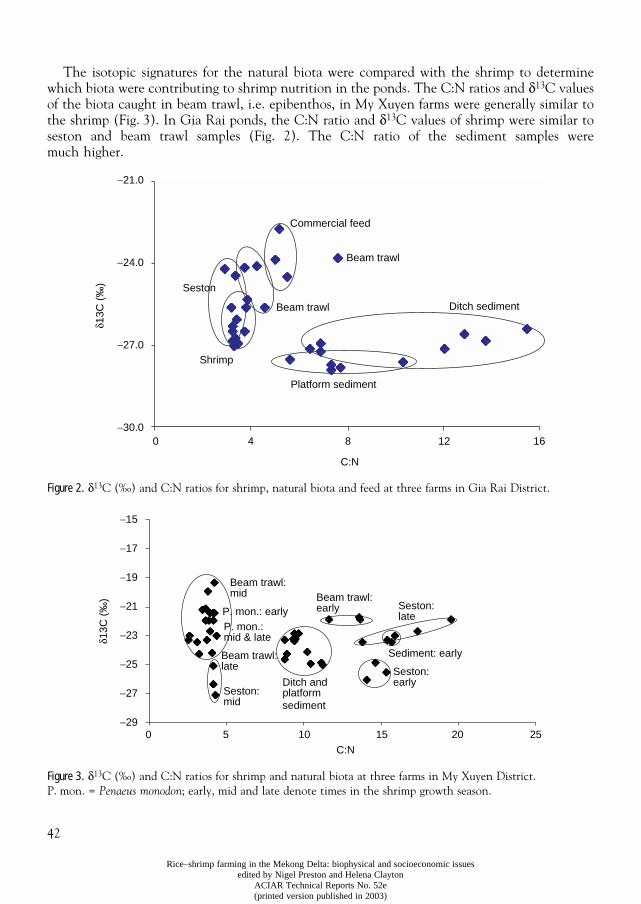
42
Rice–shrimp farming in the Mekong Delta: biophysical and socioeconomic issuesedited by Nigel Preston and Helena Clayton
ACIAR Technical Reports No. 52e(printed version published in 2003)
The isotopic signatures for the natural biota were compared with the shrimp to determinewhich biota were contributing to shrimp nutrition in the ponds. The C:N ratios and
δ
13
C valuesof the biota caught in beam trawl, i.e. epibenthos, in My Xuyen farms were generally similar tothe shrimp (Fig. 3). In Gia Rai ponds, the C:N ratio and
δ
13
C values of shrimp were similar toseston and beam trawl samples (Fig. 2). The C:N ratio of the sediment samples weremuch higher.
Figure 2.
δ
13
C (‰) and C:N ratios for shrimp, natural biota and feed at three farms in Gia Rai District.
Figure 3.
δ
13
C (‰) and C:N ratios for shrimp and natural biota at three farms in My Xuyen District. P. mon. =
Penaeus monodon
; early, mid and late denote times in the shrimp growth season.
Commercial feed
Beam trawl
Ditch sedimentBeam trawl
Platform sediment
Shrimp
Seston
C:N
0 4 8 12 16
δ13C
(‰
)
−21.0
−24.0
−27.0
−30.0
δ13C
(‰
)
Beam trawl:mid Beam trawl:
earlyP. mon.: earlyP. mon.:mid & late
Beam trawl:late
Seston:mid
Ditch andplatformsediment
Seston:late
Seston:early
Sediment: early
C:N
0 5 10 15 20 25
−15
−17
−19
−21
−23
−25
−27
−29
43
Rice–shrimp farming in the Mekong Delta: biophysical and socioeconomic issuesedited by Nigel Preston and Helena Clayton
ACIAR Technical Reports No. 52e(printed version published in 2003)
The results suggest that the natural biota was playing a major nutritional role in shrimpnutrition. This is further verified by the fact that the shrimp production was as high at the farmwith no feed addition as at the farms with feed addition. The significant contribution by thenatural biota could be further promoted by the addition of nitrogen fertiliser, since the biota hada high C:N ratio early in the season. However, the high turbidity in these ponds, due to inorganicparticles in the water (Truong et al. this Report, Tran Thi Tuget Hoa et al. this Report), waslikely to be inhibiting the growth of algae and hence the natural biota. Therefore, the additionof fertilisers to stimulate the growth of the algal community, and hence the higher trophic levels,would be more effective if turbidity levels in the ponds were reduced.
The use of homemade feeds to feed either shrimp or the natural biota does not appear to beworthwhile unless the formulations are changed significantly. Even if this were done, the waterstability of these feeds is likely to be low compared with commercial feeds, resulting in the releaseof significant amounts of nutrients. This is an inefficient use of resources and impacts on theadjacent waterways.
In conclusion, the natural biota appeared to provide the bulk of the dietary nitrogen andcarbon requirements of
P. monodon
in rice–shrimp ponds. Commercial feeds also provided anutritional source; however, the benefits depended on the formulation used. Homemade feedswere of limited value.
References
Brennan, D.C., Clayton, H. and Tran, T.B. 2000. Economic characteristics of rice–shrimp farms in the MekongDelta, Vietnam. Journal of Aquaculture Economics and Management, 4, 127–139.
Briggs, M.R.P. and Funge-Smith, S.J. 1994. A nutrient budget of some intensive marine shrimp ponds inThailand. Aquaculture and Fisheries Management, 5, 89–811.
Páez-Osuna, F., Guerrero-Galván, S.R., Ruiz-Fernándex, A.C. and Espinoza-Angulo, R. 1997. Fluxes and massbalances of nutrients in a semi-intensive shrimp farm in north-western Mexico. Marine Pollution Bulletin,34, 290–297.
Peterson, B.J. and Fry, B., 1987. Stable isotopes in ecosystem studies. Annual Reviews of Ecological Systematics,18, 293–320.
Preston, N.P., Jackson, C.J., Thompson, P., Austin, M. and Burford, M.A. 2000. Prawn farm effluent:composition, origin and treatment. Fisheries Research and Development Corporation final report, ProjectNo. 95/162. FRDC, Canberra, Australia, 64pp.
Tran, T.B., Le, C.D. and Brennan, D.C. 1999. Environmental costs of shrimp culture in the rice growing regionsof the Mekong Delta.
Journal of Aquaculture Economics and Management, 3, 31–43.
44
Rice–shrimp farming in the Mekong Delta: biophysical and socioeconomic issuesedited by Nigel Preston and Helena Clayton
ACIAR Technical Reports No. 52e(printed version published in 2003)
CHAPTER 5
Shrimp hatchery production in two coastal provincesof the Mekong Delta
Tran Ngoc Hai
1
1
Can Tho University, Can Tho, VietnamEmail: [email protected]
Abstract
The status of shrimp hatchery production in the coastal provinces of the Mekong Delta,Vietnam, was investigated in late 1997. The survey showed that the three species of shrimp usedas broodstock were
Penaeus monodon
,
P. merguiensis
, and
P. indicus
. The survey also revealed thatthe number of hatcheries had increased very rapidly over the previous decade. In 1997, therewere 134 hatcheries that produced a total of 217.5 million postlarvae. A further 1.7 billionpostlarvae were imported from the central provinces to the region. The dominant source ofpostlarvae was from wild
P. monodon
broodstock. Local wild-harvest
P. monodon
,
P. merguiensis
,and
P. indicus
broodstock were a significant source of postlarvae. Local pond-reared
P. monodon
,
P. merguiensis
, and
P. indicus
broodstock were a minor source, with lower reproductive outputthan wild broodstock. The annual average production of postlarvae from local hatcheries rangedfrom 2.6 million (in Bac Lieu) to 3.6 million (in Ca Mau) for
P. monodon
; and from 7.6 million(in Ca Mau) to 9.8 million (in Bac Lieu) for
P. merguiensis
and
P. indicus
. Average net incomeof 23.9 million dong and 130.2 million dong were obtained for each hatchery in Bac Lieu andCa Mau provinces respectively. The results of the survey revealed a critical shortage in suppliesof postlarvae for stocking shrimp farms in the Mekong Delta region.
T
RADITIONALLY
,
SHRIMP
FARMERS
in the Mekong Delta have used extensive shrimp-farmingmethods. However, over the past decade, there has been rapid expansion of shrimp farmingcoupled with a diversification of farming systems. The farming systems now includeimproved–extensive culture, semi-intensive culture, intensive culture, mangrove–shrimp,rice–shrimp and artemia–shrimp systems. Improved–extensive shrimp culture is the most widelypractised, with average productivity of 200–600 kg/ha/year. In 1997, the total area of shrimpponds in the Mekong Delta was estimated to be 185 700 ha with a total production of 48 665tonnes. Rice–shrimp farming comprised a significant component of this production. The natureof the rice–shrimp system is described elsewhere in this report.
The first shrimp reproduction and hatchery trials in Vietnam were conducted in the northernprovinces from 1971 to 1974. Commercial-scale hatchery production commenced in the centralprovinces in 1985. The first reproduction and hatchery trials within the Mekong Delta wereconducted at Can Tho University in 1988. These trials facilitated the development of thehatchery industry in the region. The objective of the current study was to quantify hatcheryproduction in the two principal shrimp-hatchery provinces in the Mekong Delta region and toidentify the key factors affecting the sustainability of postlarval supplies to the region.
45
Rice–shrimp farming in the Mekong Delta: biophysical and socioeconomic issuesedited by Nigel Preston and Helena Clayton
ACIAR Technical Reports No. 52e(printed version published in 2003)
Data and methods
This study was conducted in late 1997 in the provinces of Bac Lieu and Ca Mau where most ofthe shrimp hatcheries in the Mekong Delta region were located. A survey of 18 hatcheries inBac Lieu and 16 hatcheries in Ca Mau was conducted. This involved direct interviews with thehatcheries workers, technicians and managers. Additional information on shrimp hatcheries andshrimp production in the Mekong Delta was also collected from annual reports of the provincialDepartment of Fisheries.
Results
Shrimp culture and shrimp seed production in the Mekong Delta
The total annual shrimp production from the seven coastal provinces of the Mekong Delta was47 095 tonnes from 167 824 ha in 1993; 38 795 tonnes from 212 689 ha in 1995 and48 665 tonnes from 185 700 ha in 1997. Ca Mau (formerly known as Minh Hai) and Bac Lieuprovinces were the main production areas.
In 1992, Ca Mau Province had 15 hatcheries producing 140 million postlarvae; by 1997 thishad increased to 110 hatcheries producing 200 million postlarvae, making postlarval productionan important industry in the region. Tien Giang, Ben Tre, Soc Trang and Kien Giang provinceswere minor production areas with only one to four hatcheries in each province in 1997. Thedemand for postlarvae could not be met by local supplies and most postlarvae were imported fromthe central provinces to local nursery stations. Most of the nursery stations were located in CaMau, which collectively imported 1.4 million postlarvae in 1997. The central provinces ofKhanh Hoa, Binh Thuan, Ninh Thuan, Vung Tau, Da Nang, Phan Rang and Phan Thiet werethe main suppliers of postlarvae to the Mekong Delta.
Hatchery ownership and staffing
Almost all of the hatcheries surveyed belonged to private households or joint stockholders. Allthe hatcheries were operated by those with either tertiary education or previous technicalexperience. In Ca Mau and Bac Lieu survey hatcheries, 25% and 39% respectively, were operatedby those with tertiary training (BSc). The rest were run by technicians who had previouslyworked with tertiary-trained hatchery managers or had attended short training courses inhatchery techniques. The results also showed that the hatchery operators in Bac Lieu had workedin hatcheries for an average of 6.5 years (ranging from 3 to 16 years), compared to an average of3 years in Ca Mau (ranging from 1 to 10 years). This is probably a reflection of the fact thatmany of the hatcheries surveyed in Bac Lieu had been there since the early 1990s, whereas thehatcheries in Ca Mau started operating from 1994.
Technical aspects
Hatchery location
The majority of hatcheries surveyed in Bac Lieu province were in Gan Hao town, on the bankof the river mouth about 2 km from the sea. The advantages of this location included easy accessfor broodstock delivery via river or road, electricity supply and telephones. The disadvantageswere the risks of water pollution, particularly from ships, boats and domestic sewage. In the rainyseason, very turbid water and low salinity (10–15 ppt) were a major impediment to hatchery
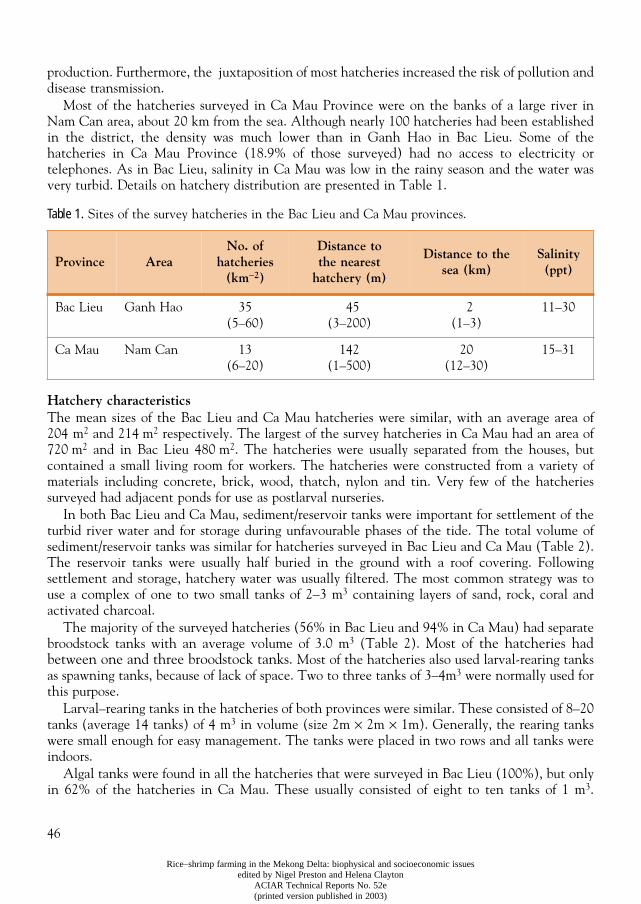
46
Rice–shrimp farming in the Mekong Delta: biophysical and socioeconomic issuesedited by Nigel Preston and Helena Clayton
ACIAR Technical Reports No. 52e(printed version published in 2003)
production. Furthermore, the juxtaposition of most hatcheries increased the risk of pollution anddisease transmission.
Most of the hatcheries surveyed in Ca Mau Province were on the banks of a large river inNam Can area, about 20 km from the sea. Although nearly 100 hatcheries had been establishedin the district, the density was much lower than in Ganh Hao in Bac Lieu. Some of thehatcheries in Ca Mau Province (18.9% of those surveyed) had no access to electricity ortelephones. As in Bac Lieu, salinity in Ca Mau was low in the rainy season and the water wasvery turbid. Details on hatchery distribution are presented in Table 1.
Table 1.
Sites of the survey hatcheries in the Bac Lieu and Ca Mau provinces.
Hatchery characteristics
The mean sizes of the Bac Lieu and Ca Mau hatcheries were similar, with an average area of204 m
2
and 214 m
2
respectively. The largest of the survey hatcheries in Ca Mau had an area of720 m
2
and in Bac Lieu 480 m
2
. The hatcheries were usually separated from the houses, butcontained a small living room for workers. The hatcheries were constructed from a variety ofmaterials including concrete, brick, wood, thatch, nylon and tin. Very few of the hatcheriessurveyed had adjacent ponds for use as postlarval nurseries.
In both Bac Lieu and Ca Mau, sediment/reservoir tanks were important for settlement of theturbid river water and for storage during unfavourable phases of the tide. The total volume ofsediment/reservoir tanks was similar for hatcheries surveyed in Bac Lieu and Ca Mau (Table 2).The reservoir tanks were usually half buried in the ground with a roof covering. Followingsettlement and storage, hatchery water was usually filtered. The most common strategy was touse a complex of one to two small tanks of 2–3 m
3
containing layers of sand, rock, coral andactivated charcoal.
The majority of the surveyed hatcheries (56% in Bac Lieu and 94% in Ca Mau) had separatebroodstock tanks with an average volume of 3.0 m
3
(Table 2). Most of the hatcheries hadbetween one and three broodstock tanks. Most of the hatcheries also used larval-rearing tanksas spawning tanks, because of lack of space. Two to three tanks of 3–4m
3
were normally used forthis purpose.
Larval–rearing tanks in the hatcheries of both provinces were similar. These consisted of 8–20tanks (average 14 tanks) of 4 m
3
in volume (size 2m
×
2m
×
1m). Generally, the rearing tankswere small enough for easy management. The tanks were placed in two rows and all tanks wereindoors.
Algal tanks were found in all the hatcheries that were surveyed in Bac Lieu (100%), but onlyin 62% of the hatcheries in Ca Mau. These usually consisted of eight to ten tanks of 1 m
3
.
Province AreaNo. of
hatcheries (km
−
2
)
Distance to the nearest
hatchery (m)
Distance to the sea (km)
Salinity (ppt)
Bac Lieu Ganh Hao 35(5–60)
45(3–200)
2(1–3)
11–30
Ca Mau Nam Can 13(6–20)
142(1–500)
20(12–30)
15–31
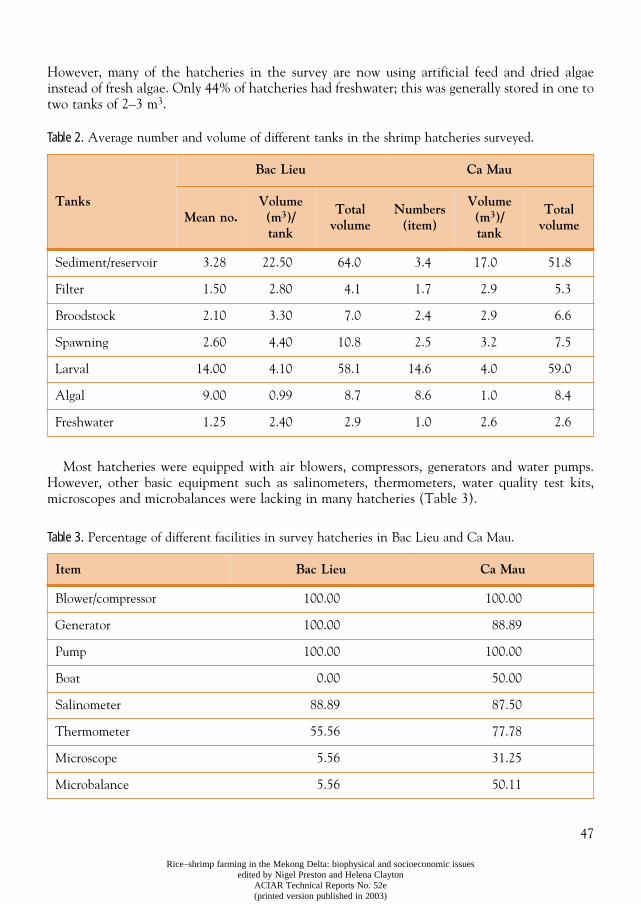
47
Rice–shrimp farming in the Mekong Delta: biophysical and socioeconomic issuesedited by Nigel Preston and Helena Clayton
ACIAR Technical Reports No. 52e(printed version published in 2003)
However, many of the hatcheries in the survey are now using artificial feed and dried algaeinstead of fresh algae. Only 44% of hatcheries had freshwater; this was generally stored in one totwo tanks of 2–3 m
3
.
Table 2.
Average number and volume of different tanks in the shrimp hatcheries surveyed.
Most hatcheries were equipped with air blowers, compressors, generators and water pumps.However, other basic equipment such as salinometers, thermometers, water quality test kits,microscopes and microbalances were lacking in many hatcheries (Table 3).
Table 3.
Percentage of different facilities in survey hatcheries in Bac Lieu and Ca Mau.
Tanks
Bac Lieu Ca Mau
Mean no.Volume (m
3
)/ tank
Total volume
Numbers (item)
Volume (m
3
)/ tank
Total volume
Sediment/reservoir 3.28 22.50 64.0 3.4 17.0 51.8
Filter 1.50 2.80 4.1 1.7 2.9 5.3
Broodstock 2.10 3.30 7.0 2.4 2.9 6.6
Spawning 2.60 4.40 10.8 2.5 3.2 7.5
Larval 14.00 4.10 58.1 14.6 4.0 59.0
Algal 9.00 0.99 8.7 8.6 1.0 8.4
Freshwater 1.25 2.40 2.9 1.0 2.6 2.6
Item Bac Lieu Ca Mau
Blower/compressor 100.00 100.00
Generator 100.00 88.89
Pump 100.00 100.00
Boat 0.00 50.00
Salinometer 88.89 87.50
Thermometer 55.56 77.78
Microscope 5.56 31.25
Microbalance 5.56 50.11
48
Rice–shrimp farming in the Mekong Delta: biophysical and socioeconomic issuesedited by Nigel Preston and Helena Clayton
ACIAR Technical Reports No. 52e(printed version published in 2003)
Broodstock culture
In the past, the shrimp farming industry in the Mekong Delta relied mainly on locally captured,mature
P. merguiensis
and
P. indicus
wild broodstock. However, at the time of this survey mostfarmers had switched to
P. monodon
,
principally because of the higher prices received for thisspecies.
The results of the survey in Ca Mau and Bac Lieu showed that
P. monodon
females reared inproduction ponds had an average size of between 120 g and 150 g, whereas the average size ofwild broodstock was between 250 g and 300 g (Table 4). Banana shrimp (
P. merguiensis
) andIndian shrimp (
P. indicus
) were mainly from local fishing grounds. The average size of females ofthese species was between 30g and 100g.
Most hatcheries initially treated broodstock with formalin at a concentration of between15 ppt and 20 ppt. The broodstock were usually maintained in cement tanks with an averagedensity of 4 m
−
2
, and with a ratio of one male to three to five females. In some cases, the operatorsof the hatcheries surveyed maintained males and females separately. Where sexes weremaintained separately, artificial insemination was used. The spermatophores were transferredfrom males to females when the female had just moulted. Various methods of eyestalk ablationwere applied in order to induce spawning.
The broodstock were fed with squid, shrimp, blood cockle, hermit crab and pig liver. Feedingfrequency was every 3–4 hours. The daily feeding rate averaged of 9.8% of body weight in CaMau hatcheries and 12.73% of body weight in Bac Lieu. After four to seven days of culture, thebroodstock are ready to spawn. The average survival rate of the broodstock was between 44%and 55%. The spawning rate was between 52% and 57%. The average number of naupliiproduced per spawner ranged from over one million from wild-caught
P. monodon
broodstock to200 000 from wild-caught
P. merguiensis
and
P. indicus
.
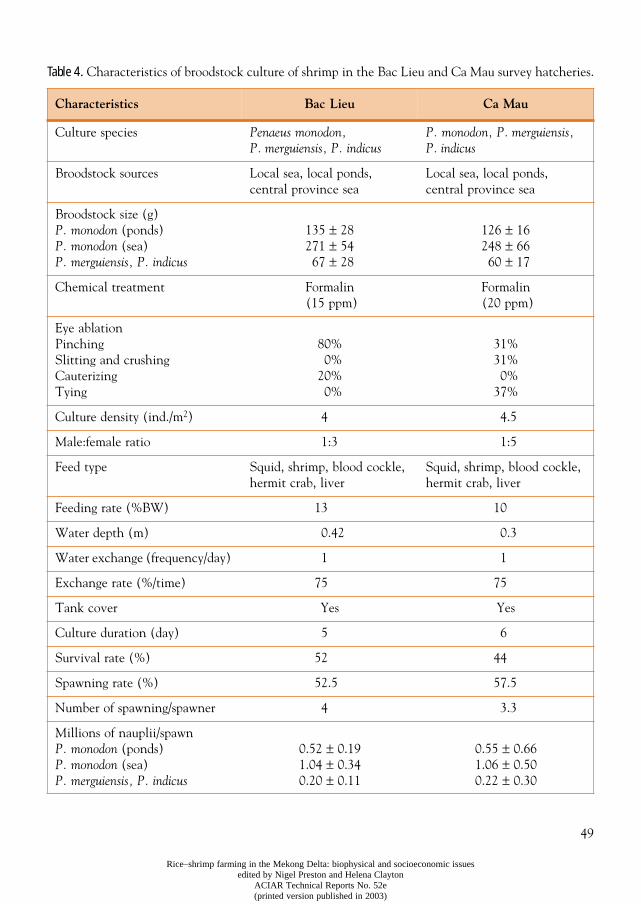
49
Rice–shrimp farming in the Mekong Delta: biophysical and socioeconomic issuesedited by Nigel Preston and Helena Clayton
ACIAR Technical Reports No. 52e(printed version published in 2003)
Table 4.
Characteristics of broodstock culture of shrimp in the Bac Lieu and Ca Mau survey hatcheries.
Characteristics Bac Lieu Ca Mau
Culture species
Penaeus monodon, P. merguiensis, P. indicus
P. monodon, P. merguiensis, P. indicus
Broodstock sources Local sea, local ponds, central province sea
Local sea, local ponds, central province sea
Broodstock size (g)
P. monodon
(ponds)
P. monodon
(sea)
P. merguiensis, P. indicus
135
±
28271
±
5467
±
28
126
±
16248
±
6660
±
17
Chemical treatment Formalin (15 ppm)
Formalin (20 ppm)
Eye ablationPinchingSlitting and crushingCauterizingTying
80%0%
20%0%
31%31%0%
37%
Culture density (ind./m
2
) 4 4.5
Male:female ratio 1:3 1:5
Feed type Squid, shrimp, blood cockle, hermit crab, liver
Squid, shrimp, blood cockle, hermit crab, liver
Feeding rate (%BW) 13 10
Water depth (m) 0.42 0.3
Water exchange (frequency/day) 1 1
Exchange rate (%/time) 75 75
Tank cover Yes Yes
Culture duration (day) 5 6
Survival rate (%) 52 44
Spawning rate (%) 52.5 57.5
Number of spawning/spawner 4 3.3
Millions of nauplii/spawn
P. monodon
(ponds)
P. monodon
(sea)
P. merguiensis, P. indicus
0.52
±
0.191.04
±
0.340.20
±
0.11
0.55
±
0.661.06
±
0.500.22
±
0.30
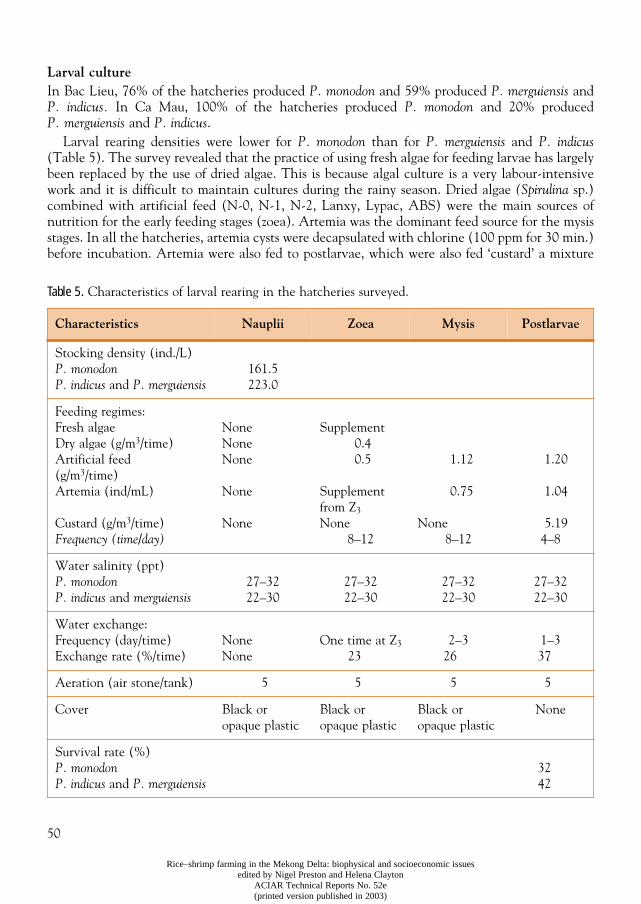
50
Rice–shrimp farming in the Mekong Delta: biophysical and socioeconomic issuesedited by Nigel Preston and Helena Clayton
ACIAR Technical Reports No. 52e(printed version published in 2003)
Larval culture
In Bac Lieu, 76% of the hatcheries produced
P. monodon
and 59% produced
P. merguiensis andP. indicus. In Ca Mau, 100% of the hatcheries produced P. monodon and 20% producedP. merguiensis and P. indicus.
Larval rearing densities were lower for P. monodon than for P. merguiensis and P. indicus(Table 5). The survey revealed that the practice of using fresh algae for feeding larvae has largelybeen replaced by the use of dried algae. This is because algal culture is a very labour-intensivework and it is difficult to maintain cultures during the rainy season. Dried algae (Spirulina sp.)combined with artificial feed (N-0, N-1, N-2, Lanxy, Lypac, ABS) were the main sources ofnutrition for the early feeding stages (zoea). Artemia was the dominant feed source for the mysisstages. In all the hatcheries, artemia cysts were decapsulated with chlorine (100 ppm for 30 min.)before incubation. Artemia were also fed to postlarvae, which were also fed ‘custard’ a mixture
Table 5. Characteristics of larval rearing in the hatcheries surveyed.
Characteristics Nauplii Zoea Mysis Postlarvae
Stocking density (ind./L)P. monodonP. indicus and P. merguiensis
161.5223.0
Feeding regimes:Fresh algaeDry algae (g/m3/time)Artificial feed (g/m3/time)Artemia (ind/mL)
Custard (g/m3/time)Frequency (time/day)
NoneNoneNone
None
None
Supplement0.40.5
Supplement from Z3
None8–12
1.12
0.75
None8–12
1.20
1.04
5.194–8
Water salinity (ppt)P. monodonP. indicus and merguiensis
27–3222–30
27–3222–30
27–3222–30
27–3222–30
Water exchange:Frequency (day/time)Exchange rate (%/time)
NoneNone
One time at Z3
232–3
261–337
Aeration (air stone/tank) 5 5 5 5
Cover Black or opaque plastic
Black or opaque plastic
Black or opaque plastic
None
Survival rate (%) P. monodonP. indicus and P. merguiensis
3242
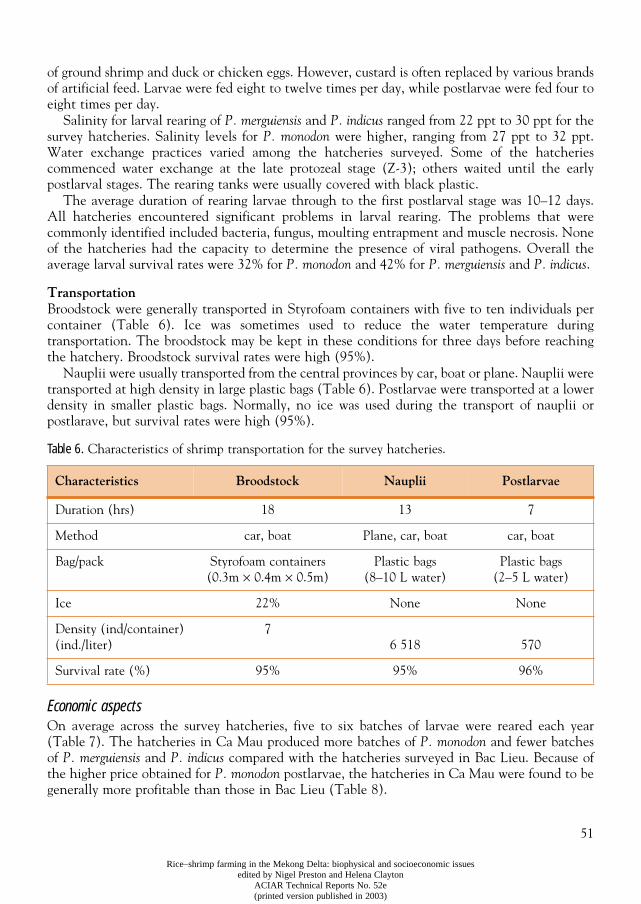
51
Rice–shrimp farming in the Mekong Delta: biophysical and socioeconomic issuesedited by Nigel Preston and Helena Clayton
ACIAR Technical Reports No. 52e(printed version published in 2003)
of ground shrimp and duck or chicken eggs. However, custard is often replaced by various brandsof artificial feed. Larvae were fed eight to twelve times per day, while postlarvae were fed four toeight times per day.
Salinity for larval rearing of P. merguiensis and P. indicus ranged from 22 ppt to 30 ppt for thesurvey hatcheries. Salinity levels for P. monodon were higher, ranging from 27 ppt to 32 ppt.Water exchange practices varied among the hatcheries surveyed. Some of the hatcheriescommenced water exchange at the late protozeal stage (Z-3); others waited until the earlypostlarval stages. The rearing tanks were usually covered with black plastic.
The average duration of rearing larvae through to the first postlarval stage was 10–12 days.All hatcheries encountered significant problems in larval rearing. The problems that werecommonly identified included bacteria, fungus, moulting entrapment and muscle necrosis. Noneof the hatcheries had the capacity to determine the presence of viral pathogens. Overall theaverage larval survival rates were 32% for P. monodon and 42% for P. merguiensis and P. indicus.
TransportationBroodstock were generally transported in Styrofoam containers with five to ten individuals percontainer (Table 6). Ice was sometimes used to reduce the water temperature duringtransportation. The broodstock may be kept in these conditions for three days before reachingthe hatchery. Broodstock survival rates were high (95%).
Nauplii were usually transported from the central provinces by car, boat or plane. Nauplii weretransported at high density in large plastic bags (Table 6). Postlarvae were transported at a lowerdensity in smaller plastic bags. Normally, no ice was used during the transport of nauplii orpostlarave, but survival rates were high (95%).
Table 6. Characteristics of shrimp transportation for the survey hatcheries.
Economic aspectsOn average across the survey hatcheries, five to six batches of larvae were reared each year(Table 7). The hatcheries in Ca Mau produced more batches of P. monodon and fewer batchesof P. merguiensis and P. indicus compared with the hatcheries surveyed in Bac Lieu. Because ofthe higher price obtained for P. monodon postlarvae, the hatcheries in Ca Mau were found to begenerally more profitable than those in Bac Lieu (Table 8).
Characteristics Broodstock Nauplii Postlarvae
Duration (hrs) 18 13 7
Method car, boat Plane, car, boat car, boat
Bag/pack Styrofoam containers(0.3m × 0.4m × 0.5m)
Plastic bags (8–10 L water)
Plastic bags(2–5 L water)
Ice 22% None None
Density (ind/container)(ind./liter)
76 518 570
Survival rate (%) 95% 95% 96%
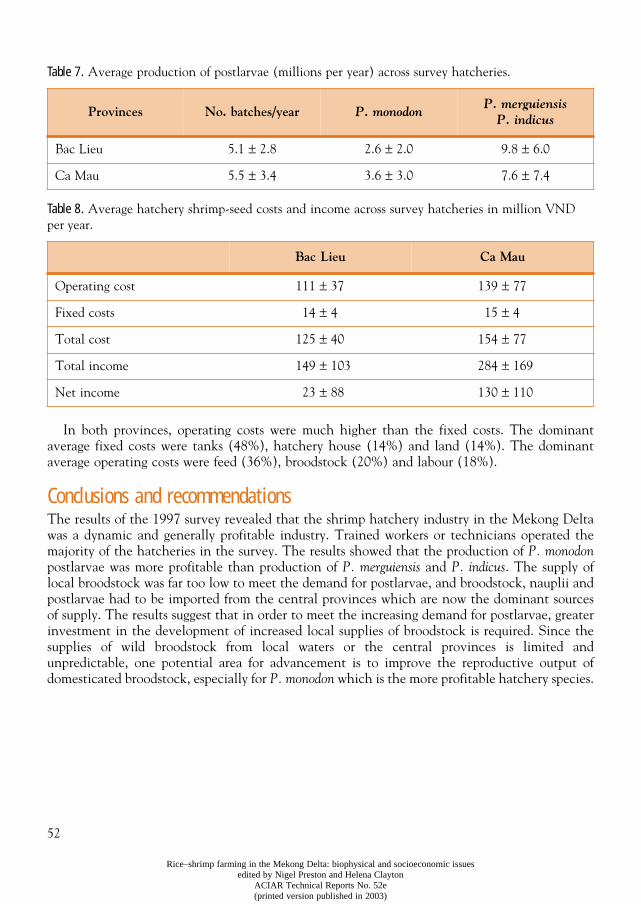
52
Rice–shrimp farming in the Mekong Delta: biophysical and socioeconomic issuesedited by Nigel Preston and Helena Clayton
ACIAR Technical Reports No. 52e(printed version published in 2003)
Table 7. Average production of postlarvae (millions per year) across survey hatcheries.
Table 8. Average hatchery shrimp-seed costs and income across survey hatcheries in million VND per year.
In both provinces, operating costs were much higher than the fixed costs. The dominantaverage fixed costs were tanks (48%), hatchery house (14%) and land (14%). The dominantaverage operating costs were feed (36%), broodstock (20%) and labour (18%).
Conclusions and recommendationsThe results of the 1997 survey revealed that the shrimp hatchery industry in the Mekong Deltawas a dynamic and generally profitable industry. Trained workers or technicians operated themajority of the hatcheries in the survey. The results showed that the production of P. monodonpostlarvae was more profitable than production of P. merguiensis and P. indicus. The supply oflocal broodstock was far too low to meet the demand for postlarvae, and broodstock, nauplii andpostlarvae had to be imported from the central provinces which are now the dominant sourcesof supply. The results suggest that in order to meet the increasing demand for postlarvae, greaterinvestment in the development of increased local supplies of broodstock is required. Since thesupplies of wild broodstock from local waters or the central provinces is limited andunpredictable, one potential area for advancement is to improve the reproductive output ofdomesticated broodstock, especially for P. monodon which is the more profitable hatchery species.
Provinces No. batches/year P. monodonP. merguiensis
P. indicus
Bac Lieu 5.1 ± 2.8 2.6 ± 2.0 9.8 ± 6.0
Ca Mau 5.5 ± 3.4 3.6 ± 3.0 7.6 ± 7.4
Bac Lieu Ca Mau
Operating cost 111 ± 37 139 ± 77
Fixed costs 14 ± 4 15 ± 4
Total cost 125 ± 40 154 ± 77
Total income 149 ± 103 284 ± 169
Net income 23 ± 88 130 ± 110
53
Rice–shrimp farming in the Mekong Delta: biophysical and socioeconomic issuesedited by Nigel Preston and Helena Clayton
ACIAR Technical Reports No. 52e(printed version published in 2003)
CHAPTER 6
Selection of suitable rice varieties for monocultureand rice–shrimp farming systems in
the Mekong Delta of Vietnam
Nguyen Ngoc De
1
, Le Xuan Thai
1
and Pham Thi Phan
1
1
Mekong Delta Farming Systems R&D Institute, Can Tho University, Vietnam Email Nguyen Ngoc De: [email protected]
Abstract
The purpose of this paper was to identify suitable rice varieties and compare rice growth and yieldin rice monoculture and rice–shrimp systems in the rain-fed saline areas of the Mekong Delta.A series of farm trials was conducted in rice fields in Soc Trang and Bac Lieu provinces duringthe rainy seasons of 1997 and 1998. The growth and yield results from the experiments provideda measure of the performance of these rice varieties in the rice monoculture and rice–shrimpfarming systems. In the 1997 wet season, 12 rice varieties were tested, of which 3 were checkvarieties. Based on the results from 1997, two promising rice varieties were selected andinvestigated in the 1998 wet season. A pot experiment was also conducted to test the salinitytolerance of five rice varieties. The field results showed that rice crops performed better in themonoculture system. In the 1997 trials, MTL119 was the best rice variety in both systems,followed by MTL204, MTL205, MTL207 and MTL209. The MTL119 variety performed best inall aspects, including tiller and panicle development, Leaf Area Index (LAI), biomass, nutrientcontent in leaf, stem and grain, and good grain yield. The short growth duration of 115–117 daysof MTL119 also makes it very well suited in rain-fed saline environments. In the 1998 potexperiments, MTL119 grew well in the culture solution with salinity of 3–6 grams per litre. Thissupports the results from field trials
.
The MTL195 variety also grew well at the salinity level of3–6 grams per litre. Both MT119 and IR64 were selected for the 1998 field trials. Severalvarieties out-yielded IR64; however, this variety was selected for the 1998 trials because of itswidespread use in the study area.
O
NE
OF
THE
main factors leading to instability in rice cropping in the rain-fed saline areas of theMekong Delta is the use of long-duration and low-yielding rice varieties that have not been wellsuited to the saline conditions. In this study, varietal trials were conducted with the aim ofidentifying more appropriate varieties for the local ecological conditions in the study area.Results from such research can assist in raising the income and living standards of local farmhouseholds in the areas affected by seasonal saline intrusion.
The objectives of this research were to:• compare the growth and yield of rice in rice monoculture and rice–shrimp systems in rain-fed
saline areas of the Mekong Delta• identify suitable rice varieties for rice monoculture and rice–shrimp systems in the rain-fed
saline areas of the Mekong Delta.
54
Rice–shrimp farming in the Mekong Delta: biophysical and socioeconomic issuesedited by Nigel Preston and Helena Clayton
ACIAR Technical Reports No. 52e(printed version published in 2003)
Research methods
Field trials
Field trials were conducted in 1997 and 1998 in the districts of My Xuyen in Soc Trang provinceand Gia Rai in Bac Lieu province. In 1997, 12 rice varieties were tested. This included 9 newvarieties and 3 check varieties (Table 1). Varieties selected for trials had short growth durationof 105–120 days. In 1998, field trials were conducted again in both districts with two of the mostpromising varieties (MTL119 and IR64) from the 1997 trials. MTL119 was selected because ofits superior yield performance over the other varieties across sites, and IR64 was used as checkbecause of its wide use by farmers in the project areas. The details of the field trials are outlinedin Table 1.
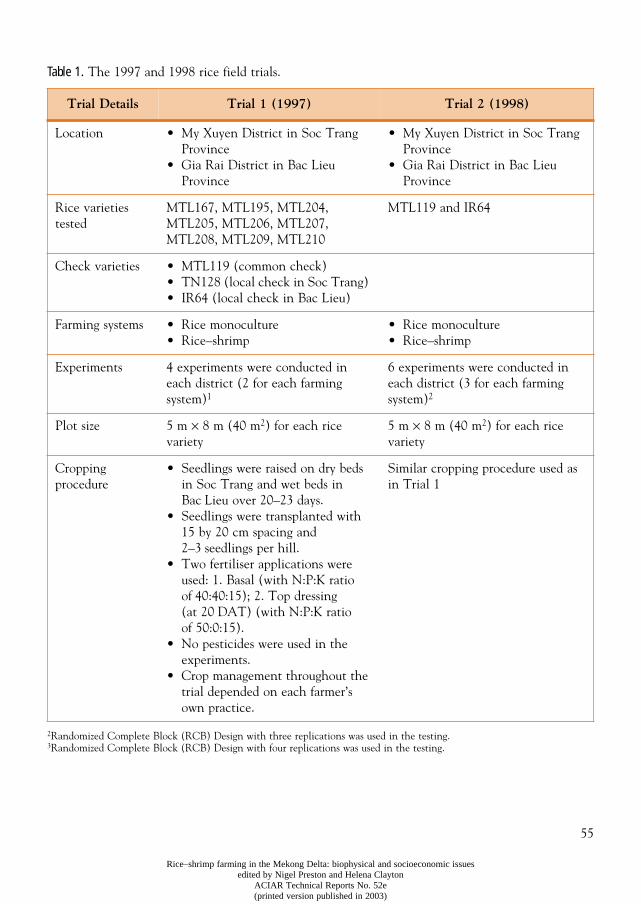
55
Rice–shrimp farming in the Mekong Delta: biophysical and socioeconomic issuesedited by Nigel Preston and Helena Clayton
ACIAR Technical Reports No. 52e(printed version published in 2003)
Table 1.
The 1997 and 1998 rice field trials.
2
Randomized Complete Block (RCB) Design with three replications was used in the testing.
3
Randomized Complete Block (RCB) Design with four replications was used in the testing.
Trial Details Trial 1 (1997) Trial 2 (1998)
Location • My Xuyen District in Soc Trang Province
• Gia Rai District in Bac Lieu Province
• My Xuyen District in Soc Trang Province
• Gia Rai District in Bac Lieu Province
Rice varieties tested
MTL167, MTL195, MTL204, MTL205, MTL206, MTL207, MTL208, MTL209, MTL210
MTL119 and IR64
Check varieties • MTL119 (common check) • TN128 (local check in Soc Trang) • IR64 (local check in Bac Lieu)
Farming systems • Rice monoculture• Rice–shrimp
• Rice monoculture• Rice–shrimp
Experiments 4 experiments were conducted in each district (2 for each farming system)
1
6 experiments were conducted in each district (3 for each farming system)
2
Plot size 5 m
×
8 m (40 m
2
) for each rice variety
5 m
×
8 m (40 m
2
) for each rice variety
Cropping procedure
• Seedlings were raised on dry beds in Soc Trang and wet beds in Bac Lieu over 20–23 days.
• Seedlings were transplanted with 15 by 20 cm spacing and 2–3 seedlings per hill.
• Two fertiliser applications were used: 1. Basal (with N:P:K ratio of 40:40:15); 2. Top dressing (at 20 DAT) (with N:P:K ratio of 50:0:15).
• No pesticides were used in the experiments.
• Crop management throughout the trial depended on each farmer’s own practice.
Similar cropping procedure used as in Trial 1
56
Rice–shrimp farming in the Mekong Delta: biophysical and socioeconomic issuesedited by Nigel Preston and Helena Clayton
ACIAR Technical Reports No. 52e(printed version published in 2003)
Pot experiment
Pot experiments were conducted to test the salinity tolerance of various rice varieties. Five ricevarieties — MTL119, MTL167, MTL195, MTL205 and IR64 — were used for testing. MTL167and MTL195 were selected as representative of low-yielding varieties and MTL205 and MTL119were selected as representative for high-yielding varieties. Salinity solutions were made at fivedifferent concentrations (control (0), 3, 6, 9, 12 g/L). Rice seedlings were planted in eachsolution at two weeks after germination. Completed Random Design with three replications wasused. The plant height and root length were measured at 15 days after treatment and the salinitytolerance was scored based criteria outlined in Table 2.
Table 2.
Salinity tolerance rating.
1997 field trial results
The results from the 1997 experiments are a summary of the full set of results from the paperpresented at the final ACIAR project workshop in 2000. Note also that in 1997 typhoon Linda(2 November 1997) caused some damage to the rice crops in the experiments, especially in GiaRai District. The impacts from typhoon Linda pushed saline water into rice fields in therice–shrimp plots in Bac Lieu at the critical ripening stage, which caused complete crop loss.
Soil and water conditions
The results from the soil analysis showed that the soil quality was generally good at allexperiment sites. Relative to the rice monoculture plots, the soil in the rice–shrimp plots hadhigh electroconductivity (EC) values and also had high amounts of available phosphate (P
2
O
5
).The chemical properties of soils at the experiment sites are summarised in Table 3. In Table 4,the water pH and EC levels at three important stages of rice growth (transplanting, 20 days aftertransplanting and panicle initiation) are summarised.
Score Description
1 Normal plant growth and tillering
3 Plant growth near normal but some reduction in tillering, some leaves discoloured/whitish and rolled
5 Plant growth and tillering reduced, most leaves discoloured or rolled; only a few leaves emerged
7 Plant growth completely ceased; most leaves dry, some plants dying
9 Almost all plants dead or dying
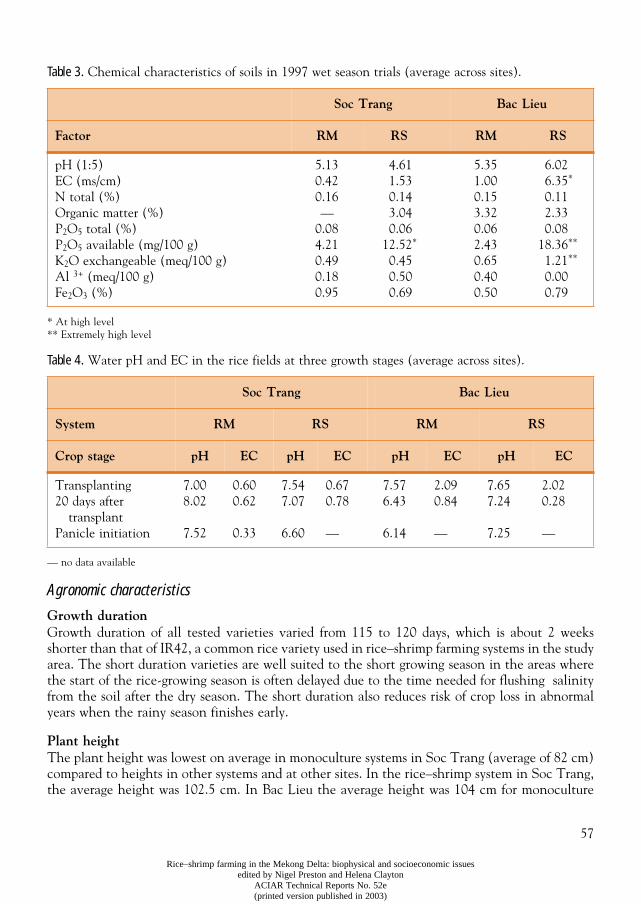
57
Rice–shrimp farming in the Mekong Delta: biophysical and socioeconomic issuesedited by Nigel Preston and Helena Clayton
ACIAR Technical Reports No. 52e(printed version published in 2003)
Table 3.
Chemical characteristics of soils in 1997 wet season trials (average across sites).
* At high level** Extremely high level
Table 4.
Water pH and EC in the rice fields at three growth stages (average across sites).
—
no data available
Agronomic characteristics
Growth duration
Growth duration of all tested varieties varied from 115 to 120 days, which is about 2 weeksshorter than that of IR42, a common rice variety used in rice–shrimp farming systems in the studyarea. The short duration varieties are well suited to the short growing season in the areas wherethe start of the rice-growing season is often delayed due to the time needed for flushing salinityfrom the soil after the dry season. The short duration also reduces risk of crop loss in abnormalyears when the rainy season finishes early.
Plant height
The plant height was lowest on average in monoculture systems in Soc Trang (average of 82 cm)compared to heights in other systems and at other sites. In the rice–shrimp system in Soc Trang,the average height was 102.5 cm. In Bac Lieu the average height was 104 cm for monoculture
Soc Trang Bac Lieu
Factor RM RS RM RS
pH (1:5)EC (ms/cm)N total (%)Organic matter (%)P
2
O
5
total (%)P
2
O
5
available (mg/100 g)K
2
O exchangeable (meq/100 g)Al
3+
(meq/100 g)Fe
2
O
3
(%)
5.130.420.16—
0.084.210.490.180.95
4.611.530.143.040.06
12.52
*
0.450.500.69
5.351.000.153.320.062.430.650.400.50
6.026.35
*
0.112.330.08
18.36
**
1.21
**
0.000.79
Soc Trang Bac Lieu
System RM RS RM RS
Crop stage pH EC pH EC pH EC pH EC
Transplanting20 days after
transplantPanicle initiation
7.008.02
7.52
0.600.62
0.33
7.547.07
6.60
0.670.78
—
7.576.43
6.14
2.090.84
—
7.657.24
7.25
2.020.28
—
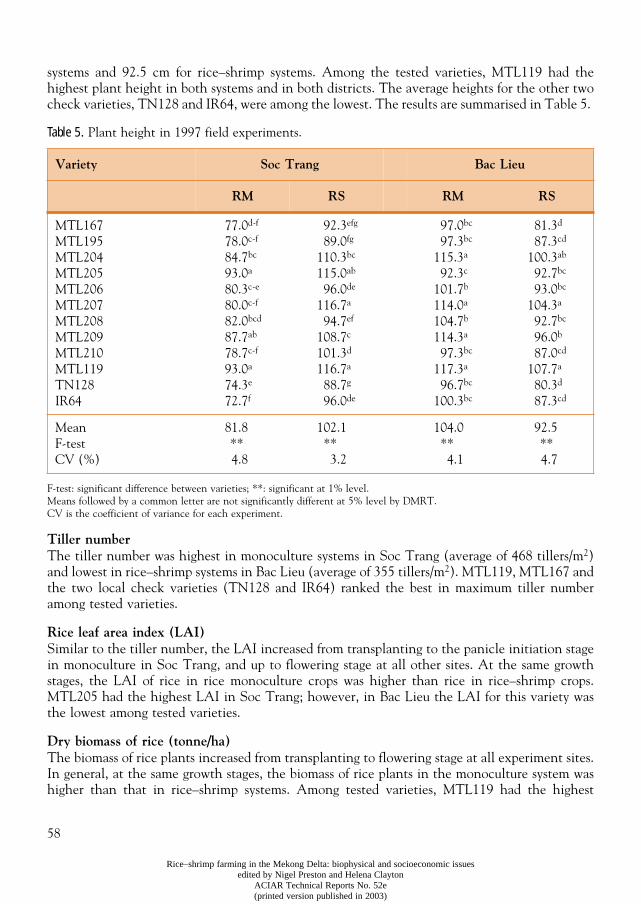
58
Rice–shrimp farming in the Mekong Delta: biophysical and socioeconomic issuesedited by Nigel Preston and Helena Clayton
ACIAR Technical Reports No. 52e(printed version published in 2003)
systems and 92.5 cm for rice–shrimp systems. Among the tested varieties, MTL119 had thehighest plant height in both systems and in both districts. The average heights for the other twocheck varieties, TN128 and IR64, were among the lowest. The results are summarised in Table 5.
Table 5.
Plant height in 1997 field experiments.
F-test: significant difference between varieties; **: significant at 1% level.Means followed by a common letter are not significantly different at 5% level by DMRT. CV is the coefficient of variance for each experiment.
Tiller number
The tiller number was highest in monoculture systems in Soc Trang (average of 468 tillers/m
2
)and lowest in rice–shrimp systems in Bac Lieu (average of 355 tillers/m
2
). MTL119, MTL167 andthe two local check varieties (TN128 and IR64) ranked the best in maximum tiller numberamong tested varieties.
Rice leaf area index (LAI)
Similar to the tiller number, the LAI increased from transplanting to the panicle initiation stagein monoculture in Soc Trang, and up to flowering stage at all other sites. At the same growthstages, the LAI of rice in rice monoculture crops was higher than rice in rice–shrimp crops.MTL205 had the highest LAI in Soc Trang; however, in Bac Lieu the LAI for this variety wasthe lowest among tested varieties.
Dry biomass of rice (tonne/ha)
The biomass of rice plants increased from transplanting to flowering stage at all experiment sites.In general, at the same growth stages, the biomass of rice plants in the monoculture system washigher than that in rice–shrimp systems. Among tested varieties, MTL119 had the highest
Variety Soc Trang Bac Lieu
RM RS RM RS
MTL167MTL195MTL204MTL205MTL206MTL207MTL208MTL209MTL210MTL119TN128IR64
77.0
d-f
78.0
c-f
84.7
bc
93.0
a
80.3
c-e
80.0
c-f
82.0
bcd
87.7
ab
78.7
c-f
93.0
a
74.3
e
72.7
f
92.3
efg
89.0
fg
110.3
bc
115.0
ab
96.0
de
116.7
a
94.7
ef
108.7
c
101.3
d
116.7
a
88.7
g
96.0
de
97.0
bc
97.3
bc
115.3
a
92.3
c
101.7
b
114.0
a
104.7
b
114.3
a
97.3
bc
117.3
a
96.7
bc
100.3
bc
81.3
d
87.3
cd
100.3
ab
92.7
bc
93.0
bc
104.3
a
92.7bc
96.0b
87.0cd
107.7a
80.3d
87.3cd
MeanF-testCV (%)
81.8**4.8
102.1**3.2
104.0**4.1
92.5**4.7
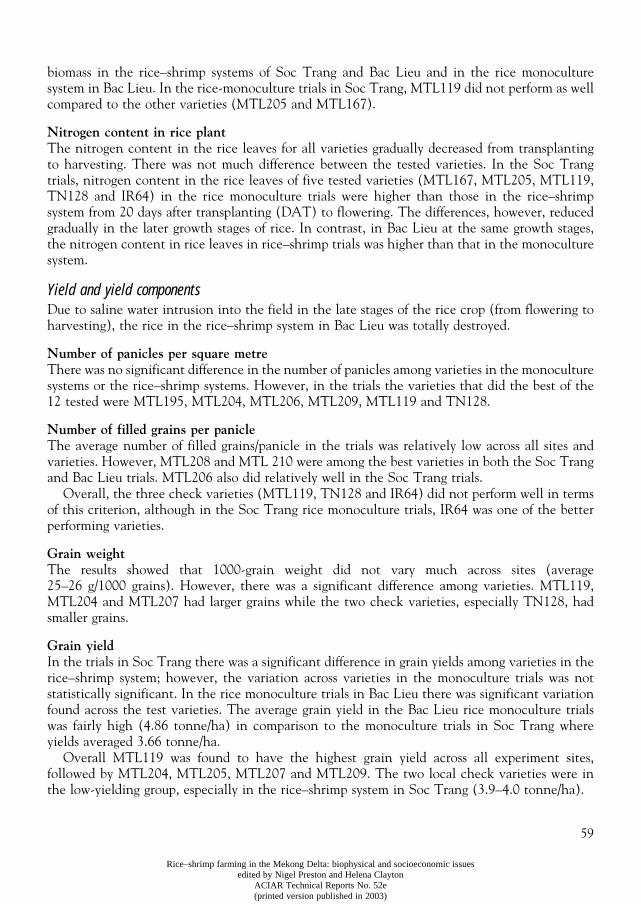
59
Rice–shrimp farming in the Mekong Delta: biophysical and socioeconomic issuesedited by Nigel Preston and Helena Clayton
ACIAR Technical Reports No. 52e(printed version published in 2003)
biomass in the rice–shrimp systems of Soc Trang and Bac Lieu and in the rice monoculturesystem in Bac Lieu. In the rice-monoculture trials in Soc Trang, MTL119 did not perform as wellcompared to the other varieties (MTL205 and MTL167).
Nitrogen content in rice plantThe nitrogen content in the rice leaves for all varieties gradually decreased from transplantingto harvesting. There was not much difference between the tested varieties. In the Soc Trangtrials, nitrogen content in the rice leaves of five tested varieties (MTL167, MTL205, MTL119,TN128 and IR64) in the rice monoculture trials were higher than those in the rice–shrimpsystem from 20 days after transplanting (DAT) to flowering. The differences, however, reducedgradually in the later growth stages of rice. In contrast, in Bac Lieu at the same growth stages,the nitrogen content in rice leaves in rice–shrimp trials was higher than that in the monoculturesystem.
Yield and yield componentsDue to saline water intrusion into the field in the late stages of the rice crop (from flowering toharvesting), the rice in the rice–shrimp system in Bac Lieu was totally destroyed.
Number of panicles per square metreThere was no significant difference in the number of panicles among varieties in the monoculturesystems or the rice–shrimp systems. However, in the trials the varieties that did the best of the12 tested were MTL195, MTL204, MTL206, MTL209, MTL119 and TN128.
Number of filled grains per panicleThe average number of filled grains/panicle in the trials was relatively low across all sites andvarieties. However, MTL208 and MTL 210 were among the best varieties in both the Soc Trangand Bac Lieu trials. MTL206 also did relatively well in the Soc Trang trials.
Overall, the three check varieties (MTL119, TN128 and IR64) did not perform well in termsof this criterion, although in the Soc Trang rice monoculture trials, IR64 was one of the betterperforming varieties.
Grain weightThe results showed that 1000-grain weight did not vary much across sites (average25–26 g/1000 grains). However, there was a significant difference among varieties. MTL119,MTL204 and MTL207 had larger grains while the two check varieties, especially TN128, hadsmaller grains.
Grain yieldIn the trials in Soc Trang there was a significant difference in grain yields among varieties in therice–shrimp system; however, the variation across varieties in the monoculture trials was notstatistically significant. In the rice monoculture trials in Bac Lieu there was significant variationfound across the test varieties. The average grain yield in the Bac Lieu rice monoculture trialswas fairly high (4.86 tonne/ha) in comparison to the monoculture trials in Soc Trang whereyields averaged 3.66 tonne/ha.
Overall MTL119 was found to have the highest grain yield across all experiment sites,followed by MTL204, MTL205, MTL207 and MTL209. The two local check varieties were inthe low-yielding group, especially in the rice–shrimp system in Soc Trang (3.9–4.0 tonne/ha).
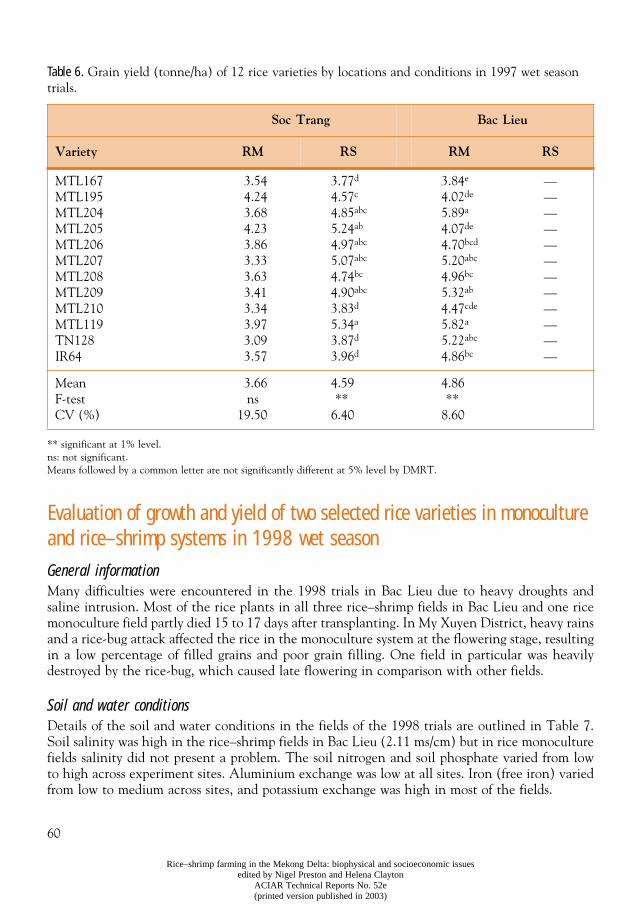
60
Rice–shrimp farming in the Mekong Delta: biophysical and socioeconomic issuesedited by Nigel Preston and Helena Clayton
ACIAR Technical Reports No. 52e(printed version published in 2003)
Table 6. Grain yield (tonne/ha) of 12 rice varieties by locations and conditions in 1997 wet season trials.
** significant at 1% level.ns: not significant.Means followed by a common letter are not significantly different at 5% level by DMRT.
Evaluation of growth and yield of two selected rice varieties in monoculture and rice–shrimp systems in 1998 wet seasonGeneral information Many difficulties were encountered in the 1998 trials in Bac Lieu due to heavy droughts andsaline intrusion. Most of the rice plants in all three rice–shrimp fields in Bac Lieu and one ricemonoculture field partly died 15 to 17 days after transplanting. In My Xuyen District, heavy rainsand a rice-bug attack affected the rice in the monoculture system at the flowering stage, resultingin a low percentage of filled grains and poor grain filling. One field in particular was heavilydestroyed by the rice-bug, which caused late flowering in comparison with other fields.
Soil and water conditionsDetails of the soil and water conditions in the fields of the 1998 trials are outlined in Table 7.Soil salinity was high in the rice–shrimp fields in Bac Lieu (2.11 ms/cm) but in rice monoculturefields salinity did not present a problem. The soil nitrogen and soil phosphate varied from lowto high across experiment sites. Aluminium exchange was low at all sites. Iron (free iron) variedfrom low to medium across sites, and potassium exchange was high in most of the fields.
Soc Trang Bac Lieu
Variety RM RS RM RS
MTL167MTL195MTL204MTL205MTL206MTL207MTL208MTL209MTL210MTL119TN128IR64
3.544.243.684.233.863.333.633.413.343.973.093.57
3.77d
4.57c
4.85abc
5.24ab
4.97abc
5.07abc
4.74bc
4.90abc
3.83d
5.34a
3.87d
3.96d
3.84e
4.02de
5.89a
4.07de
4.70bcd
5.20abc
4.96bc
5.32ab
4.47cde
5.82a
5.22abc
4.86bc
————————————
MeanF-testCV (%)
3.66ns
19.50
4.59**
6.40
4.86**
8.60
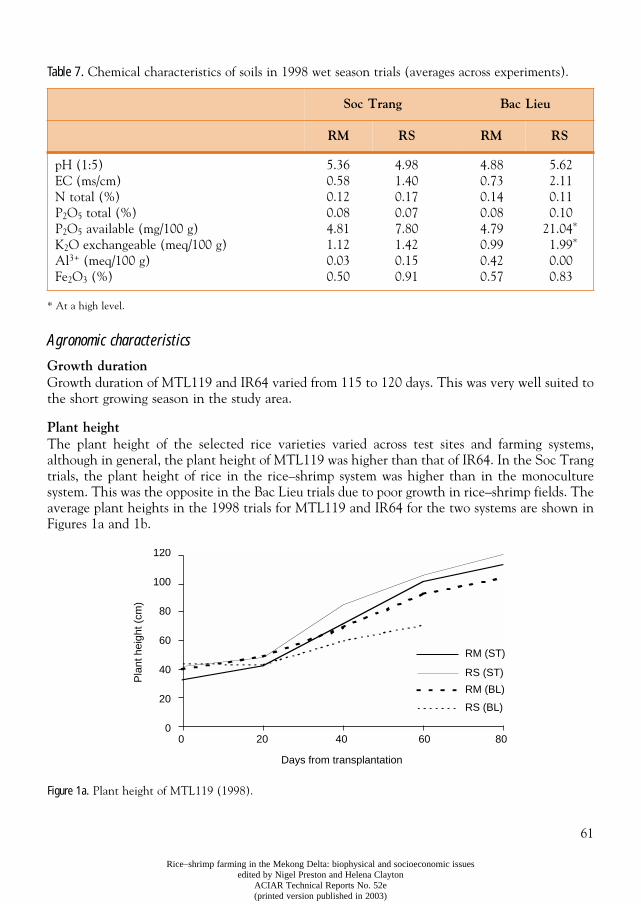
61
Rice–shrimp farming in the Mekong Delta: biophysical and socioeconomic issuesedited by Nigel Preston and Helena Clayton
ACIAR Technical Reports No. 52e(printed version published in 2003)
Table 7. Chemical characteristics of soils in 1998 wet season trials (averages across experiments).
* At a high level.
Agronomic characteristics
Growth durationGrowth duration of MTL119 and IR64 varied from 115 to 120 days. This was very well suited tothe short growing season in the study area.
Plant heightThe plant height of the selected rice varieties varied across test sites and farming systems,although in general, the plant height of MTL119 was higher than that of IR64. In the Soc Trangtrials, the plant height of rice in the rice–shrimp system was higher than in the monoculturesystem. This was the opposite in the Bac Lieu trials due to poor growth in rice–shrimp fields. Theaverage plant heights in the 1998 trials for MTL119 and IR64 for the two systems are shown inFigures 1a and 1b.
Figure 1a. Plant height of MTL119 (1998).
Soc Trang Bac Lieu
RM RS RM RS
pH (1:5)EC (ms/cm)N total (%)P2O5 total (%)P2O5 available (mg/100 g)K2O exchangeable (meq/100 g)Al3+ (meq/100 g)Fe2O3 (%)
5.360.580.120.084.811.120.030.50
4.981.400.170.077.801.420.150.91
4.880.730.140.084.790.990.420.57
5.622.110.110.10
21.04*
1.99*
0.000.83
RM (ST)
RS (ST)
RM (BL)
RS (BL)
Pla
nt h
eigh
t (cm
)
Days from transplantation
0 20 40 60 80
120
100
80
60
40
20
0
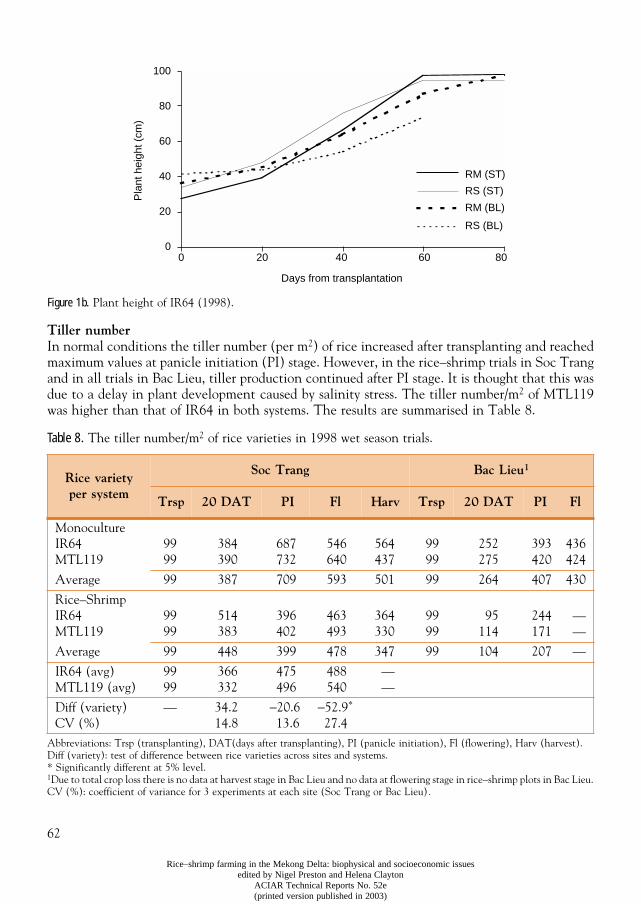
62
Rice–shrimp farming in the Mekong Delta: biophysical and socioeconomic issuesedited by Nigel Preston and Helena Clayton
ACIAR Technical Reports No. 52e(printed version published in 2003)
Figure 1b. Plant height of IR64 (1998).
Tiller number In normal conditions the tiller number (per m2) of rice increased after transplanting and reachedmaximum values at panicle initiation (PI) stage. However, in the rice–shrimp trials in Soc Trangand in all trials in Bac Lieu, tiller production continued after PI stage. It is thought that this wasdue to a delay in plant development caused by salinity stress. The tiller number/m2 of MTL119was higher than that of IR64 in both systems. The results are summarised in Table 8.
Table 8. The tiller number/m2 of rice varieties in 1998 wet season trials.
Abbreviations: Trsp (transplanting), DAT(days after transplanting), PI (panicle initiation), Fl (flowering), Harv (harvest).Diff (variety): test of difference between rice varieties across sites and systems.* Significantly different at 5% level.1Due to total crop loss there is no data at harvest stage in Bac Lieu and no data at flowering stage in rice–shrimp plots in Bac Lieu.CV (%): coefficient of variance for 3 experiments at each site (Soc Trang or Bac Lieu).
Rice variety per system
Soc Trang Bac Lieu1
Trsp 20 DAT PI Fl Harv Trsp 20 DAT PI Fl
MonocultureIR64MTL119
9999
384390
687732
546640
564437
9999
252275
393420
436424
Average 99 387 709 593 501 99 264 407 430
Rice–ShrimpIR64MTL119
9999
514383
396402
463493
364330
9999
95114
244171
——
Average 99 448 399 478 347 99 104 207 —
IR64 (avg)MTL119 (avg)
9999
366332
475496
488540
——
Diff (variety)CV (%)
— 34.214.8
−20.613.6
−52.9*
27.4
RM (ST)
RS (ST)
RM (BL)
RS (BL)
Pla
nt h
eigh
t (cm
)
Days from transplantation
0 20 40 60 80
100
80
60
40
20
0
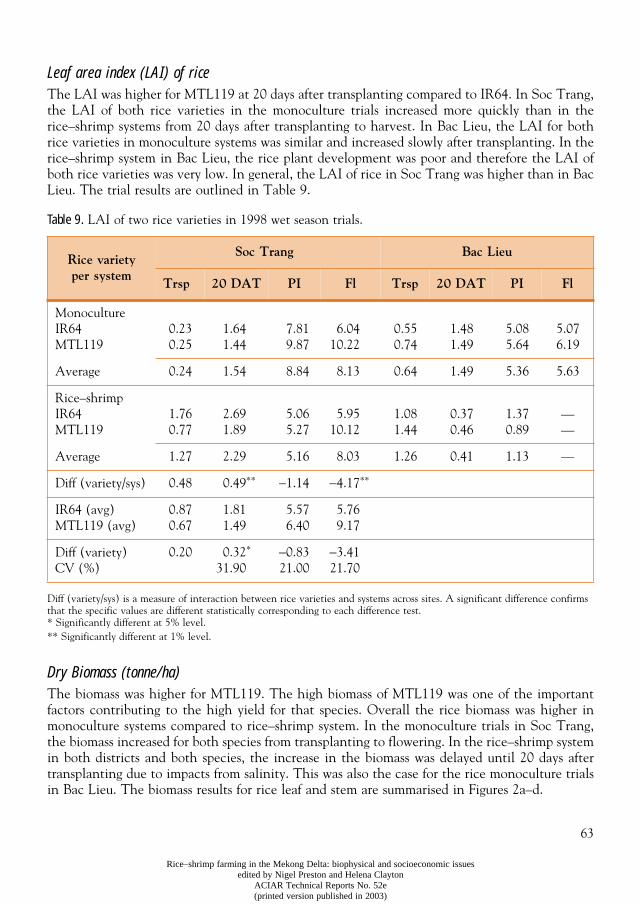
63
Rice–shrimp farming in the Mekong Delta: biophysical and socioeconomic issuesedited by Nigel Preston and Helena Clayton
ACIAR Technical Reports No. 52e(printed version published in 2003)
Leaf area index (LAI) of riceThe LAI was higher for MTL119 at 20 days after transplanting compared to IR64. In Soc Trang,the LAI of both rice varieties in the monoculture trials increased more quickly than in therice–shrimp systems from 20 days after transplanting to harvest. In Bac Lieu, the LAI for bothrice varieties in monoculture systems was similar and increased slowly after transplanting. In therice–shrimp system in Bac Lieu, the rice plant development was poor and therefore the LAI ofboth rice varieties was very low. In general, the LAI of rice in Soc Trang was higher than in BacLieu. The trial results are outlined in Table 9.
Table 9. LAI of two rice varieties in 1998 wet season trials.
Diff (variety/sys) is a measure of interaction between rice varieties and systems across sites. A significant difference confirms that the specific values are different statistically corresponding to each difference test.* Significantly different at 5% level.** Significantly different at 1% level.
Dry Biomass (tonne/ha)The biomass was higher for MTL119. The high biomass of MTL119 was one of the importantfactors contributing to the high yield for that species. Overall the rice biomass was higher inmonoculture systems compared to rice–shrimp system. In the monoculture trials in Soc Trang,the biomass increased for both species from transplanting to flowering. In the rice–shrimp systemin both districts and both species, the increase in the biomass was delayed until 20 days aftertransplanting due to impacts from salinity. This was also the case for the rice monoculture trialsin Bac Lieu. The biomass results for rice leaf and stem are summarised in Figures 2a–d.
Rice variety per system
Soc Trang Bac Lieu
Trsp 20 DAT PI Fl Trsp 20 DAT PI Fl
MonocultureIR64MTL119
0.230.25
1.641.44
7.819.87
6.0410.22
0.550.74
1.481.49
5.085.64
5.076.19
Average 0.24 1.54 8.84 8.13 0.64 1.49 5.36 5.63
Rice–shrimpIR64MTL119
1.760.77
2.691.89
5.065.27
5.9510.12
1.081.44
0.370.46
1.370.89
——
Average 1.27 2.29 5.16 8.03 1.26 0.41 1.13 —
Diff (variety/sys) 0.48 0.49** −1.14 −4.17**
IR64 (avg)MTL119 (avg)
0.870.67
1.811.49
5.576.40
5.769.17
Diff (variety)CV (%)
0.20 0.32*
31.90−0.8321.00
−3.4121.70
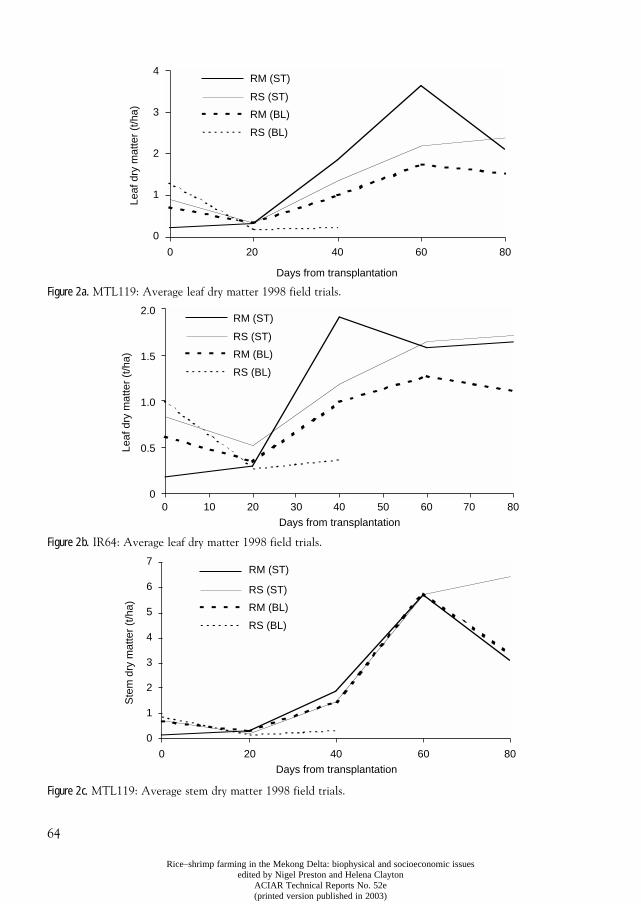
64
Rice–shrimp farming in the Mekong Delta: biophysical and socioeconomic issuesedited by Nigel Preston and Helena Clayton
ACIAR Technical Reports No. 52e(printed version published in 2003)
Figure 2a. MTL119: Average leaf dry matter 1998 field trials.
Figure 2b. IR64: Average leaf dry matter 1998 field trials.
Figure 2c. MTL119: Average stem dry matter 1998 field trials.
RM (ST)
RS (ST)
RM (BL)
RS (BL)Le
af d
ry m
atte
r (t
/ha)
Days from transplantation
0 20 40 60 80
4
3
2
1
0
RM (ST)
RS (ST)
RM (BL)
RS (BL)
Leaf
dry
mat
ter
(t/h
a)
Days from transplantation
0 20 40 60 80
2.0
1.5
1.0
0.5
010 30 50 70
RM (ST)
RS (ST)
RM (BL)
RS (BL)
Ste
m d
ry m
atte
r (t
/ha)
Days from transplantation
0 20 40 60 80
7
6
5
4
3
2
1
0
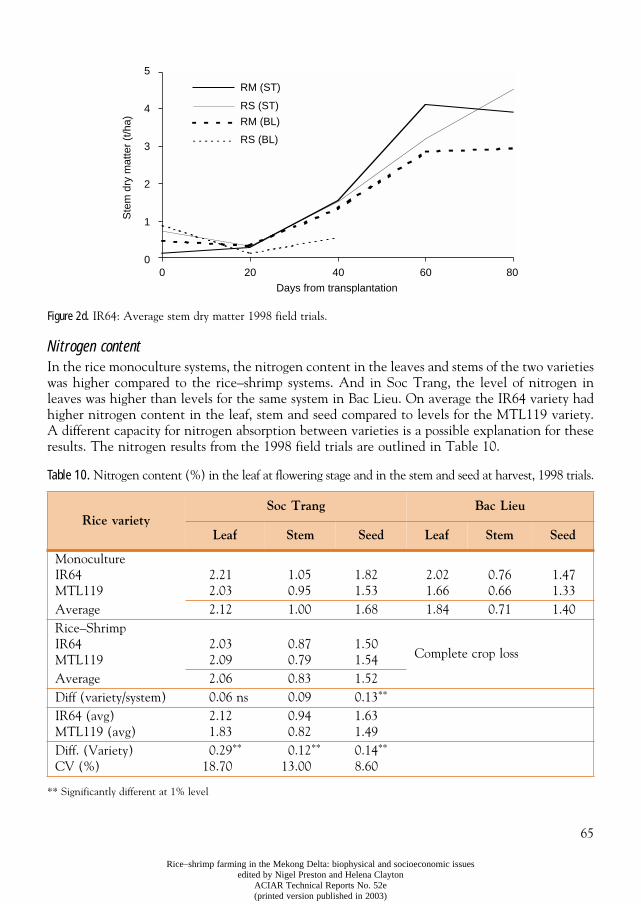
65
Rice–shrimp farming in the Mekong Delta: biophysical and socioeconomic issuesedited by Nigel Preston and Helena Clayton
ACIAR Technical Reports No. 52e(printed version published in 2003)
Figure 2d. IR64: Average stem dry matter 1998 field trials.
Nitrogen contentIn the rice monoculture systems, the nitrogen content in the leaves and stems of the two varietieswas higher compared to the rice–shrimp systems. And in Soc Trang, the level of nitrogen inleaves was higher than levels for the same system in Bac Lieu. On average the IR64 variety hadhigher nitrogen content in the leaf, stem and seed compared to levels for the MTL119 variety.A different capacity for nitrogen absorption between varieties is a possible explanation for theseresults. The nitrogen results from the 1998 field trials are outlined in Table 10.
Table 10. Nitrogen content (%) in the leaf at flowering stage and in the stem and seed at harvest, 1998 trials.
** Significantly different at 1% level
Rice varietySoc Trang Bac Lieu
Leaf Stem Seed Leaf Stem Seed
MonocultureIR64MTL119
2.212.03
1.050.95
1.821.53
2.021.66
0.760.66
1.471.33
Average 2.12 1.00 1.68 1.84 0.71 1.40Rice–ShrimpIR64MTL119
2.032.09
0.870.79
1.501.54 Complete crop loss
Average 2.06 0.83 1.52Diff (variety/system) 0.06 ns 0.09 0.13**
IR64 (avg)MTL119 (avg)
2.121.83
0.940.82
1.631.49
Diff. (Variety)CV (%)
0.29**
18.700.12**
13.000.14**
8.60
RM (ST)
RS (ST)
RM (BL)
RS (BL)S
tem
dry
mat
ter
(t/h
a)
Days from transplantation
0 20 40 60 80
5
4
3
2
1
0
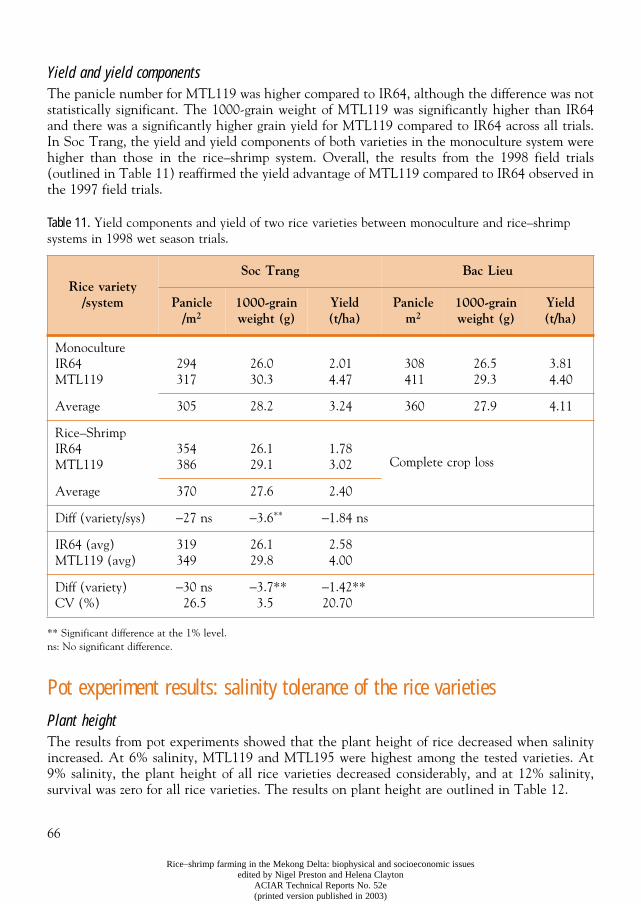
66
Rice–shrimp farming in the Mekong Delta: biophysical and socioeconomic issuesedited by Nigel Preston and Helena Clayton
ACIAR Technical Reports No. 52e(printed version published in 2003)
Yield and yield componentsThe panicle number for MTL119 was higher compared to IR64, although the difference was notstatistically significant. The 1000-grain weight of MTL119 was significantly higher than IR64and there was a significantly higher grain yield for MTL119 compared to IR64 across all trials.In Soc Trang, the yield and yield components of both varieties in the monoculture system werehigher than those in the rice–shrimp system. Overall, the results from the 1998 field trials(outlined in Table 11) reaffirmed the yield advantage of MTL119 compared to IR64 observed inthe 1997 field trials.
Table 11. Yield components and yield of two rice varieties between monoculture and rice–shrimp systems in 1998 wet season trials.
** Significant difference at the 1% level.ns: No significant difference.
Pot experiment results: salinity tolerance of the rice varieties Plant heightThe results from pot experiments showed that the plant height of rice decreased when salinityincreased. At 6% salinity, MTL119 and MTL195 were highest among the tested varieties. At9% salinity, the plant height of all rice varieties decreased considerably, and at 12% salinity,survival was zero for all rice varieties. The results on plant height are outlined in Table 12.
Rice variety /system
Soc Trang Bac Lieu
Panicle/m2
1000-grain weight (g)
Yield(t/ha)
Paniclem2
1000-grain weight (g)
Yield (t/ha)
MonocultureIR64MTL119
294317
26.030.3
2.014.47
308411
26.529.3
3.814.40
Average 305 28.2 3.24 360 27.9 4.11
Rice–ShrimpIR64MTL119
354386
26.129.1
1.783.02 Complete crop loss
Average 370 27.6 2.40
Diff (variety/sys) −27 ns −3.6** −1.84 ns
IR64 (avg)MTL119 (avg)
319349
26.129.8
2.584.00
Diff (variety)CV (%)
−30 ns26.5
−3.7**3.5
−1.42**20.70
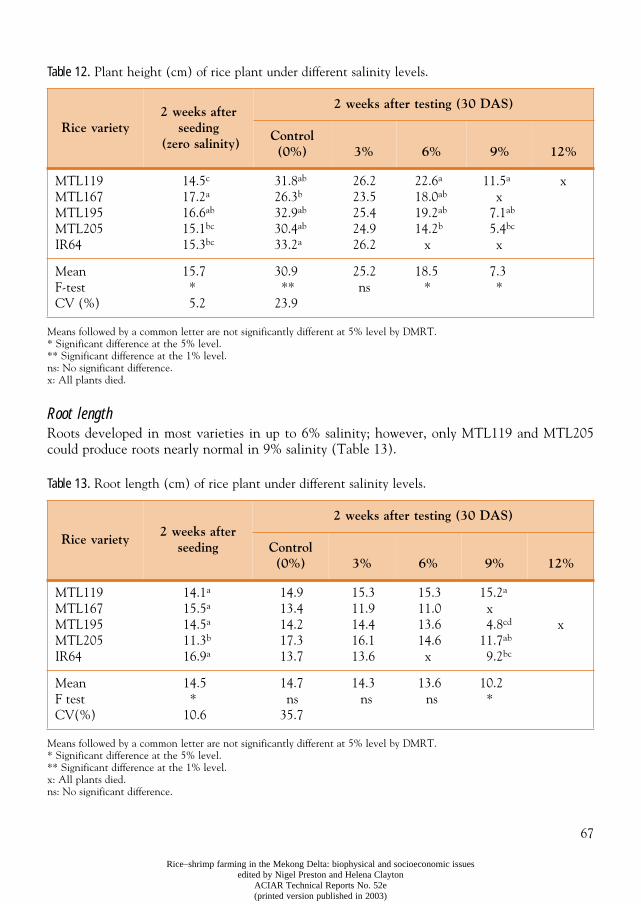
67
Rice–shrimp farming in the Mekong Delta: biophysical and socioeconomic issuesedited by Nigel Preston and Helena Clayton
ACIAR Technical Reports No. 52e(printed version published in 2003)
Table 12. Plant height (cm) of rice plant under different salinity levels.
Means followed by a common letter are not significantly different at 5% level by DMRT.* Significant difference at the 5% level.** Significant difference at the 1% level.ns: No significant difference.x: All plants died.
Root lengthRoots developed in most varieties in up to 6% salinity; however, only MTL119 and MTL205could produce roots nearly normal in 9% salinity (Table 13).
Table 13. Root length (cm) of rice plant under different salinity levels.
Means followed by a common letter are not significantly different at 5% level by DMRT.* Significant difference at the 5% level.** Significant difference at the 1% level.x: All plants died.ns: No significant difference.
Rice variety2 weeks after
seeding (zero salinity)
2 weeks after testing (30 DAS)
Control(0%) 3% 6% 9% 12%
MTL119MTL167MTL195MTL205IR64
14.5c
17.2a
16.6ab
15.1bc
15.3bc
31.8ab
26.3b
32.9ab
30.4ab
33.2a
26.223.525.424.926.2
22.6a
18.0ab
19.2ab
14.2b
x
11.5a
x7.1ab
5.4bc
x
x
MeanF-testCV (%)
15.7*5.2
30.9**
23.9
25.2ns
18.5*
7.3*
Rice variety2 weeks after
seeding
2 weeks after testing (30 DAS)
Control (0%) 3% 6% 9% 12%
MTL119MTL167MTL195MTL205IR64
14.1a
15.5a
14.5a
11.3b
16.9a
14.913.414.217.313.7
15.311.914.416.113.6
15.311.013.614.6x
15.2a
x4.8cd
11.7ab
9.2bc
x
MeanF testCV(%)
14.5*
10.6
14.7ns
35.7
14.3ns
13.6ns
10.2*
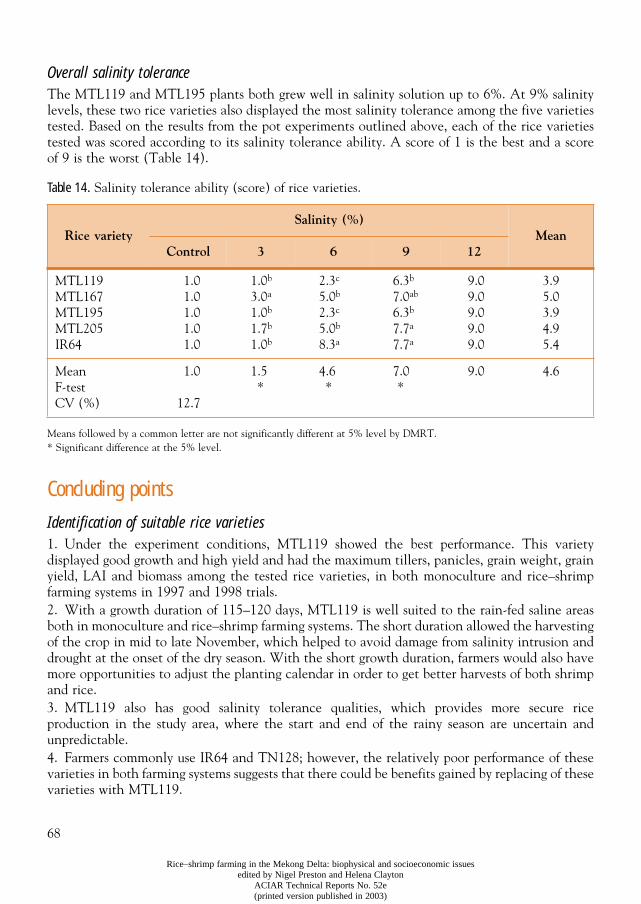
68
Rice–shrimp farming in the Mekong Delta: biophysical and socioeconomic issuesedited by Nigel Preston and Helena Clayton
ACIAR Technical Reports No. 52e(printed version published in 2003)
Overall salinity toleranceThe MTL119 and MTL195 plants both grew well in salinity solution up to 6%. At 9% salinitylevels, these two rice varieties also displayed the most salinity tolerance among the five varietiestested. Based on the results from the pot experiments outlined above, each of the rice varietiestested was scored according to its salinity tolerance ability. A score of 1 is the best and a scoreof 9 is the worst (Table 14).
Table 14. Salinity tolerance ability (score) of rice varieties.
Means followed by a common letter are not significantly different at 5% level by DMRT.* Significant difference at the 5% level.
Concluding pointsIdentification of suitable rice varieties1. Under the experiment conditions, MTL119 showed the best performance. This varietydisplayed good growth and high yield and had the maximum tillers, panicles, grain weight, grainyield, LAI and biomass among the tested rice varieties, in both monoculture and rice–shrimpfarming systems in 1997 and 1998 trials. 2. With a growth duration of 115–120 days, MTL119 is well suited to the rain-fed saline areasboth in monoculture and rice–shrimp farming systems. The short duration allowed the harvestingof the crop in mid to late November, which helped to avoid damage from salinity intrusion anddrought at the onset of the dry season. With the short growth duration, farmers would also havemore opportunities to adjust the planting calendar in order to get better harvests of both shrimpand rice.3. MTL119 also has good salinity tolerance qualities, which provides more secure riceproduction in the study area, where the start and end of the rainy season are uncertain andunpredictable.4. Farmers commonly use IR64 and TN128; however, the relatively poor performance of thesevarieties in both farming systems suggests that there could be benefits gained by replacing of thesevarieties with MTL119.
Rice varietySalinity (%)
MeanControl 3 6 9 12
MTL119MTL167MTL195MTL205IR64
1.01.01.01.01.0
1.0b
3.0a
1.0b
1.7b
1.0b
2.3c
5.0b
2.3c
5.0b
8.3a
6.3b
7.0ab
6.3b
7.7a
7.7a
9.09.09.09.09.0
3.95.03.94.95.4
MeanF-testCV (%)
1.0
12.7
1.5*
4.6*
7.0*
9.0 4.6
69
Rice–shrimp farming in the Mekong Delta: biophysical and socioeconomic issuesedited by Nigel Preston and Helena Clayton
ACIAR Technical Reports No. 52e(printed version published in 2003)
Comparison of growth and yield of rice between the two systems5. The growth and yield components of the rice crop in the monoculture system were alwaysbetter compared to the rice–shrimp system. 6. The LAI, biomass and nitrogen content of rice in the monoculture system were also highercompared to the rice–shrimp system. The LAI of rice in the monoculture systems increased fromtransplanting and reached maximum values at the panicle initiation stage, while in therice–shrimp system increases in the LAI were delayed until the flowering stage due to salinityeffects. The nitrogen content in rice leaves decreased gradually from transplanting to harvesting.Nitrogen had a direct effect on growth of rice through the development of stems and leaves. Lessnitrogen stored in rice leaves might be the cause of poorer development of leaves (low LAI). LowLAI at the panicle initiation stage of rice resulted in low photosynthesis and grain yields. 7. There was a relationship between rice growth and yield and the content of phosphate,potassium and sodium in the rice plant. Further research into these relationships in rain-fedsaline environments is suggested.8. Overall, based on observations throughout the experimental period, water management wasfound to be very important in rice–shrimp farming. Good field and land preparation was observedto be important in developing appropriate water management for ensuring successful harvest ofrice and shrimp. In particular, the construction of dikes, trenches, water gates, the levelling ofland and timing of water exchange between the canal and the field were observed to be veryimportant.
70
Rice–shrimp farming in the Mekong Delta: biophysical and socioeconomic issuesedited by Nigel Preston and Helena Clayton
ACIAR Technical Reports No. 52e(printed version published in 2003)
CHAPTER 7
Salinity dynamics and its implication on cropping patterns and rice performance in rice–shrimp farming systems
in My Xuyen and Gia Rai
Ngo Dang Phong
1,2
, Tran Van My
1
, Nguyen Duy Nang
1
, To Phuc Tuong
2
, Tran Ngoc Phuoc
3
and Nguyen Hieu Trung
3
1
College of Agriculture and Forestry, National University, Ho Chi Minh City, Vietnam.
2
International Rice Research Institute, Los Baños, Laguna, Philippines.
3
Can Tho University, Can Tho, Vietnam.Email Ngo Dang Phong: [email protected] or [email protected]
Abstract
The aim of this study was to quantify the temporal and spatial variability of salinity in therice–shrimp fields in My Xuyen and Gia Rai districts. The quantification of on-farm salinityprovides an essential input for assessing the potential for rice growing in the rainy season in therice–shrimp (RS) fields along the coast of the Mekong Delta. Monitoring of the electricconductivity (EC) of the root zone soil solution, field water and water in the adjacent canals wasundertaken from May 1998 to January 2000 in three rice–shrimp fields and three monoculturerice fields in each of the two districts. At both of the study sites, the wet-season desalinisationperiod began when the 10-day rainfall exceeded 40 mm. There was a rapid decline in EC levelsin the first two months of the rainy season. In My Xuyen this was followed by a period (Augustto December) of reasonably constant EC values in the topsoil of 3 to 5 dS m
−
1
. In Gia Rai theEC levels in the topsoil attained a reasonably constant value of around 10 dS m
−
1
only fromOctober to December. Salinity was found to increase sharply (salinisation period) at the recessionof the rainy season. The salinity of the soil solution increased with the depth of sampling,especially in Gia Rai where the salinity increased by 10 dS m
−
1
with an increase of 10 cm in thesampling depth. Salinity also increased with distance from the field ditch. In My Xuyen, the rootzone salinity in rice monoculture fields was higher than in rice–shrimp fields, while in Gia Rai,one out of three rice monoculture fields had lower EC compared to the rice–shrimp fields.
In this study the EC data collected on farms were used in combination with cumulative rainfalldata to estimate time series functions of on-farm EC levels. These functions simulated on-farmEC for My Xuyen and Gia Rai sites with a high degree of confidence (p < 0.001). Based on thesimulated long-term on-farm salinity, the rice-cropping ‘window’ was determined for differentsalinity probabilities. The cropping window in My Xuyen was wide enough to give farmersflexibility to successfully grow a rice crop in the rainy season. However, in Gia Rai the high EClevels means that rice planting may have to be delayed until September, and therefore floweringwould not be possible before the onset of the salinisation phase. The findings in this study canprovide a basis from which to select the most appropriate and profitable farming systems underdifferent saline environmental conditions.
I
T
IS
GENERALLY
accepted that the dynamics of salinity in the rice–shrimp (RS) field isdependent on environmental conditions such as rainfall and salinity of the surrounding canal
71
Rice–shrimp farming in the Mekong Delta: biophysical and socioeconomic issuesedited by Nigel Preston and Helena Clayton
ACIAR Technical Reports No. 52e(printed version published in 2003)
network; however, quantitative information of these relationships is limited. The quantificationof salinity dynamics and the time ‘window’ for rice cropping in saline-affected areas of the Deltais an important step for predicting rice performance and yield, selecting suitable rice varieties andplanning cropping systems in RS systems at different localities.
In this study, temporal changes in salinity in RS and rice monoculture fields in My Xuyen andGia Rai during the 1998 rice phase were quantified. Variations in soil salinity were explored withrespect to soil depth and location in the field. The study also aimed to quantify the relationshipbetween salinity in the RS fields and surrounding environmental factors, such as rainfall andsalinity of the surrounding canal network. This study focused on understanding the implicationsof the findings in terms of rice cultivation, rice variety and cropping system selection.
The hypotheses in this study are: (a) The salinity in RS fields is higher compared to rice monoculture fields during the wet season
rice-growing period.(b) There is a negative relationship between root-zone salinity and cumulative rainfall.
Materials and methods
Study sites
The study was carried out in three villages where rice–shrimp systems are widely practised: NgocDong, My Xuyen District (from May 1998 to February 2000), Long Dien K, Gia Rai District(May 1998 to December 1999) and Thanh Thuong B, Gia Rai District (June 1999 to December2000). Monitoring was conducted in three RS fields and three monoculture rice fields in bothdistricts.
At the study sites more than 80% of the annual rainfall (average 2000 mm for Gia Rai and1750 mm for My Xuyen) occurred in the rainy season (from May to November). According tothe United States Department of Agriculture (USDA) classification, soil at the My Xuyen siteis of typic tropaquepts and at Gia Rai sufic tropaquepts. More detail of the study sites is outlinedin Brennan (1998) and Thanh (1998).
Monitoring salinity and water level
At each of the rice–shrimp and rice monoculture field sites, the following factors were monitored: (a) salinity of the root-zone soil solution, ground water, field surface water and adjacent canal
water in rice–shrimp and rice monoculture fields(b) water levels in the canal, field and ground water in the RS fields.
Of the three RS fields monitored, one field (field A) was selected as the main field where theroot zone salinity was monitored at four points in My Xuyen and three points in Gia Rai alonga transect perpendicular to the longer sides of the field. In field A at My Xuyen, these pointswere at 0.2, 1.2, 3.3 and 7.7 m from the edge of the field trench. The corresponding values forfield A at Gia Rai were 0.5, 1.7 and 3.7 m. In the other two RS fields (Fields B and C) and inthe three rice monoculture fields (Fields D, E and F), the root zone salinity was monitored at1.5 m from the edge of the field trench.
At each measuring point, a battery was installed of soil solution tubes at various depths (5,15, 35, 45 cm in My Xuyen and 10, 20, 35 cm in Gia Rai). The sampling depths were at thecentre of each major layer of the soil profile. The bottom end of the soil solution tubes wasequipped with a 5-cm long by 2-cm diameter porous cup (air entry suction =
−
70 kPa) made ofinert polymer. At the time of sampling (twice a week during the rainy season and once a week
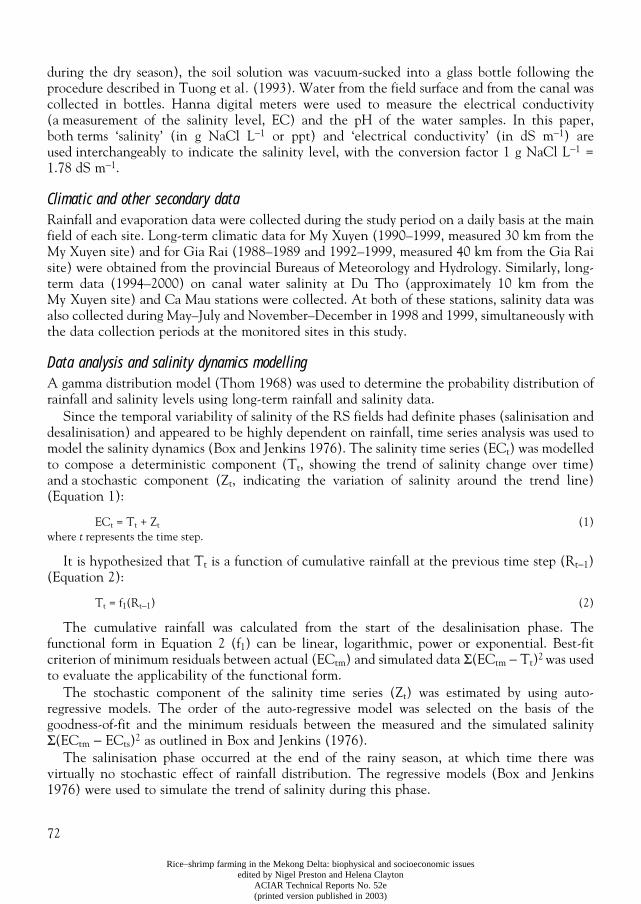
72
Rice–shrimp farming in the Mekong Delta: biophysical and socioeconomic issuesedited by Nigel Preston and Helena Clayton
ACIAR Technical Reports No. 52e(printed version published in 2003)
during the dry season), the soil solution was vacuum-sucked into a glass bottle following theprocedure described in Tuong et al
.
(1993). Water from the field surface and from the canal wascollected in bottles. Hanna digital meters were used to measure the electrical conductivity(a measurement of the salinity level, EC) and the pH of the water samples. In this paper,both terms ‘salinity’ (in g NaCl L
−
1
or ppt) and ‘electrical conductivity’ (in dS m
−
1
) areused interchangeably to indicate the salinity level, with the conversion factor 1 g NaCl L
−
1
=1.78 dS m
−
1
.
Climatic and other secondary data
Rainfall and evaporation data were collected during the study period on a daily basis at the mainfield of each site. Long-term climatic data for My Xuyen (1990–1999, measured 30 km from theMy Xuyen site) and for Gia Rai (1988–1989 and 1992–1999, measured 40 km from the Gia Raisite) were obtained from the provincial Bureaus of Meteorology and Hydrology. Similarly, long-term data (1994–2000) on canal water salinity at Du Tho (approximately 10 km from theMy Xuyen site) and Ca Mau stations were collected. At both of these stations, salinity data wasalso collected during May–July and November–December in 1998 and 1999, simultaneously withthe data collection periods at the monitored sites in this study.
Data analysis and salinity dynamics modelling
A gamma distribution model (Thom 1968) was used to determine the probability distribution ofrainfall and salinity levels using long-term rainfall and salinity data.
Since the temporal variability of salinity of the RS fields had definite phases (salinisation anddesalinisation) and appeared to be highly dependent on rainfall, time series analysis was used tomodel the salinity dynamics (Box and Jenkins 1976). The salinity time series (EC
t
) was modelledto compose a deterministic component (T
t
, showing the trend of salinity change over time)and a stochastic component (Z
t
, indicating the variation of salinity around the trend line)(Equation 1):
EC
t
= T
t
+ Z
t
(1)where
t
represents the time step.
It is hypothesized that T
t
is a function of cumulative rainfall at the previous time step (R
t
−
1
)(Equation 2):
T
t
= f
1
(R
t
−
1
) (2)
The cumulative rainfall was calculated from the start of the desalinisation phase. Thefunctional form in Equation 2 (f
1
) can be linear, logarithmic, power or exponential. Best-fitcriterion of minimum residuals between actual (EC
tm
) and simulated data
Σ
(EC
tm
−
T
t
)
2
was usedto evaluate the applicability of the functional form.
The stochastic component of the salinity time series (Z
t
) was estimated by using auto-regressive models. The order of the auto-regressive model was selected on the basis of thegoodness-of-fit and the minimum residuals between the measured and the simulated salinity
Σ
(EC
tm
−
EC
ts
)
2
as outlined in Box and Jenkins (1976). The salinisation phase occurred at the end of the rainy season, at which time there was
virtually no stochastic effect of rainfall distribution. The regressive models (Box and Jenkins1976) were used to simulate the trend of salinity during this phase.
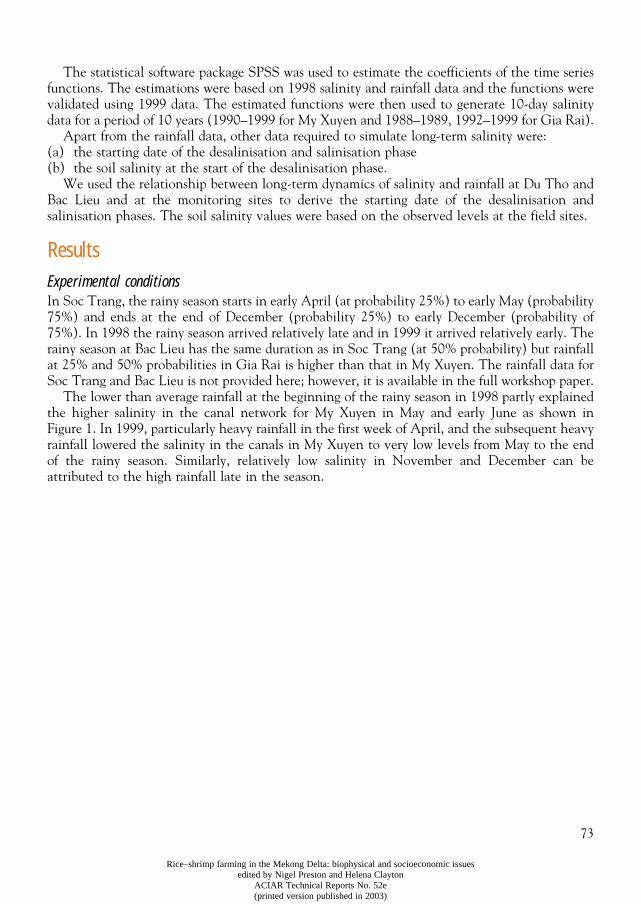
73
Rice–shrimp farming in the Mekong Delta: biophysical and socioeconomic issuesedited by Nigel Preston and Helena Clayton
ACIAR Technical Reports No. 52e(printed version published in 2003)
The statistical software package SPSS was used to estimate the coefficients of the time seriesfunctions. The estimations were based on 1998 salinity and rainfall data and the functions werevalidated using 1999 data. The estimated functions were then used to generate 10-day salinitydata for a period of 10 years (1990–1999 for My Xuyen and 1988–1989, 1992–1999 for Gia Rai).
Apart from the rainfall data, other data required to simulate long-term salinity were:(a) the starting date of the desalinisation and salinisation phase(b) the soil salinity at the start of the desalinisation phase.
We used the relationship between long-term dynamics of salinity and rainfall at Du Tho andBac Lieu and at the monitoring sites to derive the starting date of the desalinisation andsalinisation phases. The soil salinity values were based on the observed levels at the field sites.
Results
Experimental conditions
In Soc Trang, the rainy season starts in early April (at probability 25%) to early May (probability75%) and ends at the end of December (probability 25%) to early December (probability of75%). In 1998 the rainy season arrived relatively late and in 1999 it arrived relatively early. Therainy season at Bac Lieu has the same duration as in Soc Trang (at 50% probability) but rainfallat 25% and 50% probabilities in Gia Rai is higher than that in My Xuyen. The rainfall data forSoc Trang and Bac Lieu is not provided here; however, it is available in the full workshop paper.
The lower than average rainfall at the beginning of the rainy season in 1998 partly explainedthe higher salinity in the canal network for My Xuyen in May and early June as shown inFigure 1. In 1999, particularly heavy rainfall in the first week of April, and the subsequent heavyrainfall lowered the salinity in the canals in My Xuyen to very low levels from May to the endof the rainy season. Similarly, relatively low salinity in November and December can beattributed to the high rainfall late in the season.
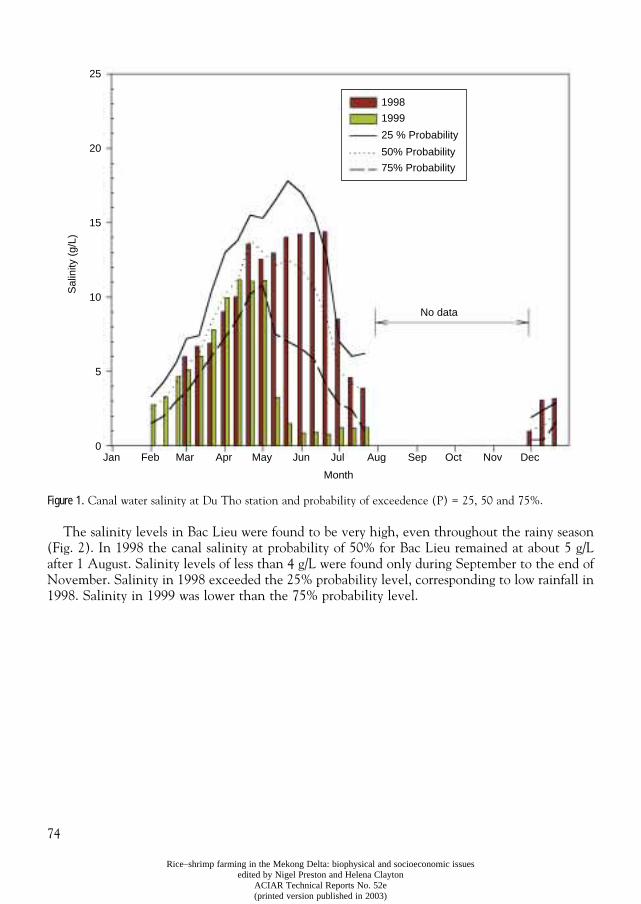
74
Rice–shrimp farming in the Mekong Delta: biophysical and socioeconomic issuesedited by Nigel Preston and Helena Clayton
ACIAR Technical Reports No. 52e(printed version published in 2003)
Figure 1.
Canal water salinity at Du Tho station and probability of exceedence (P) = 25, 50 and 75%.
The salinity levels in Bac Lieu were found to be very high, even throughout the rainy season(Fig. 2). In 1998 the canal salinity at probability of 50% for Bac Lieu remained at about 5 g/Lafter 1 August. Salinity levels of less than 4 g/L were found only during September to the end ofNovember. Salinity in 1998 exceeded the 25% probability level, corresponding to low rainfall in1998. Salinity in 1999 was lower than the 75% probability level.
Month
Jan Feb Mar Apr May Jun Jul Aug Sep Oct Nov Dec
25
20
15
10
5
0
Sal
inity
(g/
L)
No data
1998
1999
25 % Probability
50% Probability
75% Probability
75
Rice–shrimp farming in the Mekong Delta: biophysical and socioeconomic issuesedited by Nigel Preston and Helena Clayton
ACIAR Technical Reports No. 52e(printed version published in 2003)
Figure 2.
Canal water salinity in Ca Mau station and probability of exceedence (P) = 25, 50 and 75%
1
.
1
Data source: Bac Lieu Provincial Bureau of Meteorology and Hydrology.
Temporal variability of the monitored salinity
Figures 3 (for My Xuyen) and 4 (for Gia Rai) show the changes in EC that took place in theroot-zone soil solution, the field water, and the adjacent canal water at the monitoring sites forRS fields. In My Xuyen the EC of the soil solution was measured at depths of 5, 15 and35 centimetres. In Gia Rai the soil EC was measured at depths of 10, 20 and 35 centimetres.
Month
Jan Feb Mar Apr May Jun Jul Aug Sep Oct Nov Dec
40
35
30
25
20
15
10
5
0
Sal
inity
(g/
L)
No data
1998
1999
25% Probability
50% Probability
75% Probability
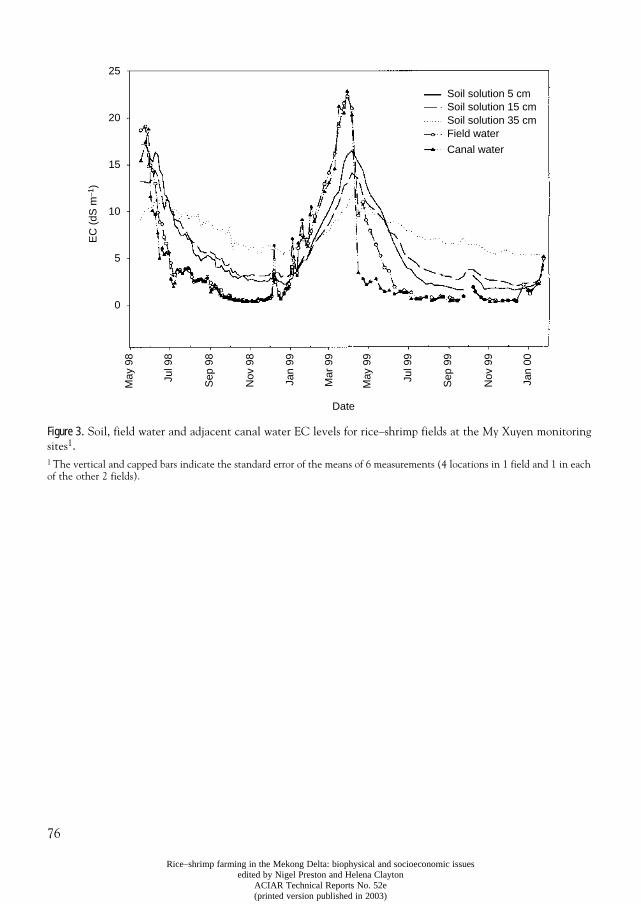
76
Rice–shrimp farming in the Mekong Delta: biophysical and socioeconomic issuesedited by Nigel Preston and Helena Clayton
ACIAR Technical Reports No. 52e(printed version published in 2003)
Figure 3.
Soil, field water and adjacent canal water EC levels for rice–shrimp fields at the My Xuyen monitoring sites
1
.
1
The vertical and capped bars indicate the standard error of the means of 6 measurements (4 locations in 1 field and 1 in each of the other 2 fields).
Soil solution 5 cmSoil solution 15 cmSoil solution 35 cmField water
Canal water
Date
May
98
Jul 9
8
Sep
98
Nov
98
Jan
99
Mar
99
May
99
Jul 9
9
Sep
99
Nov
99
Jan
00
EC
(dS
m−1
)
25
20
15
10
5
0
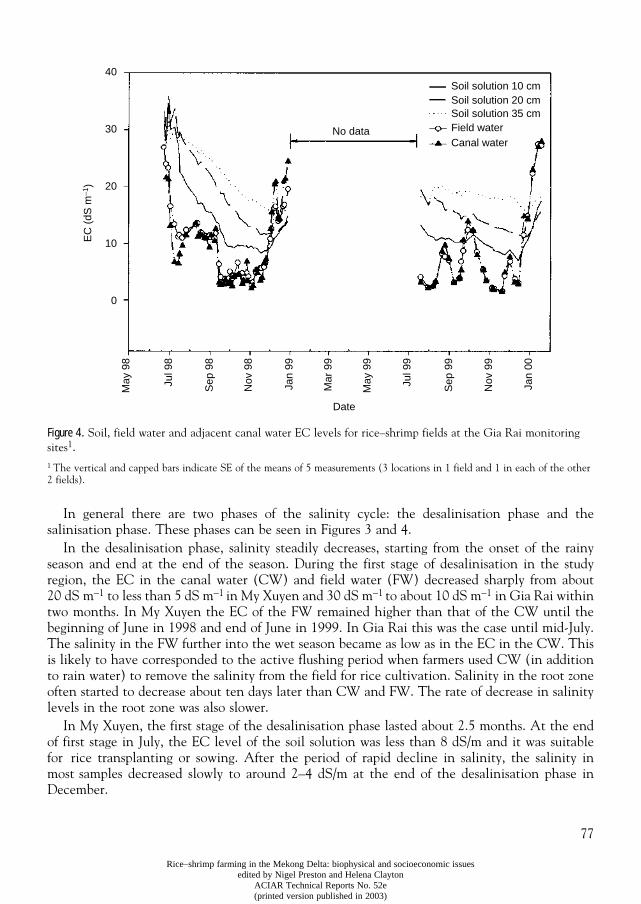
77
Rice–shrimp farming in the Mekong Delta: biophysical and socioeconomic issuesedited by Nigel Preston and Helena Clayton
ACIAR Technical Reports No. 52e(printed version published in 2003)
Figure 4.
Soil, field water and adjacent canal water EC levels for rice–shrimp fields at the Gia Rai monitoring sites
1
.
1
The vertical and capped bars indicate SE of the means of 5 measurements (3 locations in 1 field and 1 in each of the other 2 fields).
In general there are two phases of the salinity cycle: the desalinisation phase and thesalinisation phase. These phases can be seen in Figures 3 and 4.
In the desalinisation phase, salinity steadily decreases, starting from the onset of the rainyseason and end at the end of the season. During the first stage of desalinisation in the studyregion, the EC in the canal water (CW) and field water (FW) decreased sharply from about20 dS m
−
1
to less than 5 dS m
−
1
in My Xuyen and 30 dS m
−
1
to about 10 dS m
−
1
in Gia Rai withintwo months. In My Xuyen the EC of the FW remained higher than that of the CW until thebeginning of June in 1998 and end of June in 1999. In Gia Rai this was the case until mid-July.The salinity in the FW further into the wet season became as low as in the EC in the CW. Thisis likely to have corresponded to the active flushing period when farmers used CW (in additionto rain water) to remove the salinity from the field for rice cultivation. Salinity in the root zoneoften started to decrease about ten days later than CW and FW. The rate of decrease in salinitylevels in the root zone was also slower.
In My Xuyen, the first stage of the desalinisation phase lasted about 2.5 months. At the endof first stage in July, the EC level of the soil solution was less than 8 dS/m and it was suitablefor rice transplanting or sowing. After the period of rapid decline in salinity, the salinity inmost samples decreased slowly to around 2–4 dS/m at the end of the desalinisation phase inDecember.
Date
May
98
Jul 9
8
Sep
98
Nov
98
Jan
99
Mar
99
May
99
Jul 9
9
Sep
99
Nov
99
Jan
00
Soil solution 10 cmSoil solution 20 cmSoil solution 35 cmField waterCanal water
No data
EC
(dS
m−1
)
40
30
20
10
0
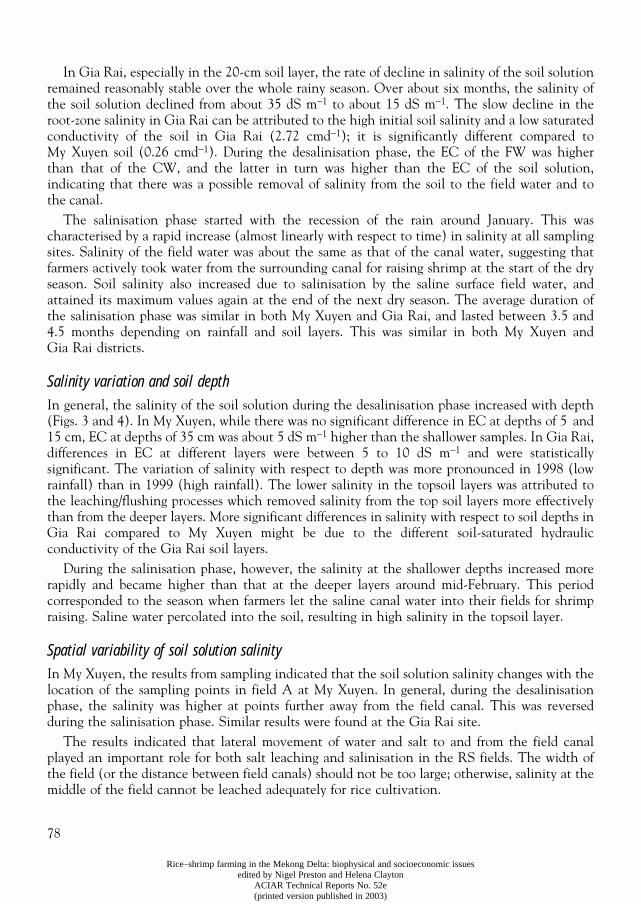
78
Rice–shrimp farming in the Mekong Delta: biophysical and socioeconomic issuesedited by Nigel Preston and Helena Clayton
ACIAR Technical Reports No. 52e(printed version published in 2003)
In Gia Rai, especially in the 20-cm soil layer, the rate of decline in salinity of the soil solutionremained reasonably stable over the whole rainy season. Over about six months, the salinity ofthe soil solution declined from about 35 dS m
−
1
to about 15 dS m
−
1
. The slow decline in theroot-zone salinity in Gia Rai can be attributed to the high initial soil salinity and a low saturatedconductivity of the soil in Gia Rai (2.72 cmd
−
1
); it is significantly different compared toMy Xuyen soil (0.26 cmd
−
1
). During the desalinisation phase, the EC of the FW was higherthan that of the CW, and the latter in turn was higher than the EC of the soil solution,indicating that there was a possible removal of salinity from the soil to the field water and tothe canal.
The salinisation phase started with the recession of the rain around January. This wascharacterised by a rapid increase (almost linearly with respect to time) in salinity at all samplingsites. Salinity of the field water was about the same as that of the canal water, suggesting thatfarmers actively took water from the surrounding canal for raising shrimp at the start of the dryseason. Soil salinity also increased due to salinisation by the saline surface field water, andattained its maximum values again at the end of the next dry season. The average duration ofthe salinisation phase was similar in both My Xuyen and Gia Rai, and lasted between 3.5 and4.5 months depending on rainfall and soil layers. This was similar in both My Xuyen andGia Rai districts.
Salinity variation and soil depth
In general, the salinity of the soil solution during the desalinisation phase increased with depth(Figs. 3 and 4). In My Xuyen, while there was no significant difference in EC at depths of 5 and15 cm, EC at depths of 35 cm was about 5 dS m
−
1
higher than the shallower samples. In Gia Rai,differences in EC at different layers were between 5 to 10 dS m
−
1
and were statisticallysignificant. The variation of salinity with respect to depth was more pronounced in 1998 (lowrainfall) than in 1999 (high rainfall). The lower salinity in the topsoil layers was attributed tothe leaching/flushing processes which removed salinity from the top soil layers more effectivelythan from the deeper layers. More significant differences in salinity with respect to soil depths inGia Rai compared to My Xuyen might be due to the different soil-saturated hydraulicconductivity of the Gia Rai soil layers.
During the salinisation phase, however, the salinity at the shallower depths increased morerapidly and became higher than that at the deeper layers around mid-February. This periodcorresponded to the season when farmers let the saline canal water into their fields for shrimpraising. Saline water percolated into the soil, resulting in high salinity in the topsoil layer.
Spatial variability of soil solution salinity
In My Xuyen, the results from sampling indicated that the soil solution salinity changes with thelocation of the sampling points in field A at My Xuyen. In general, during the desalinisationphase, the salinity was higher at points further away from the field canal. This was reversedduring the salinisation phase. Similar results were found at the Gia Rai site.
The results indicated that lateral movement of water and salt to and from the field canalplayed an important role for both salt leaching and salinisation in the RS fields. The width ofthe field (or the distance between field canals) should not be too large; otherwise, salinity at themiddle of the field cannot be leached adequately for rice cultivation.
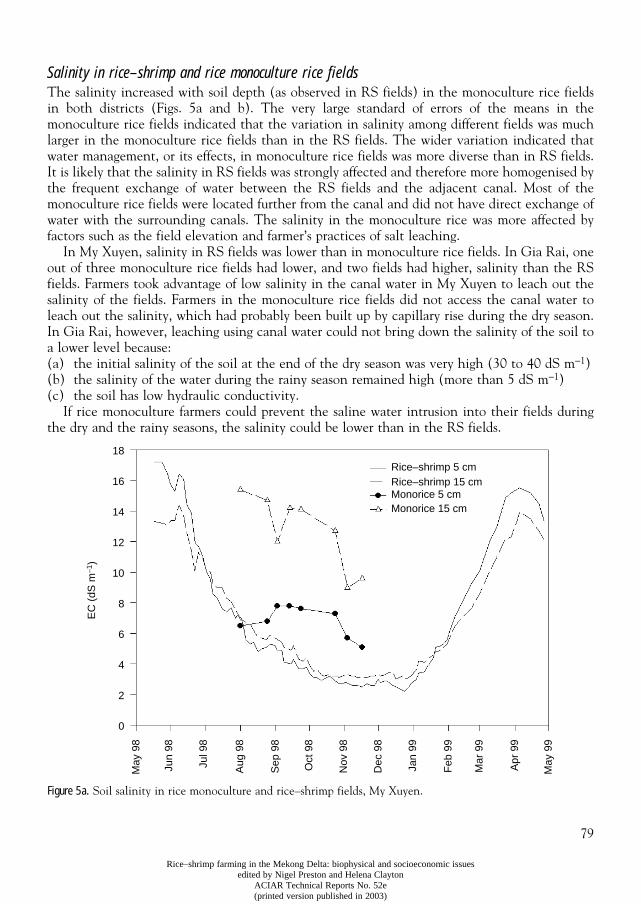
79
Rice–shrimp farming in the Mekong Delta: biophysical and socioeconomic issuesedited by Nigel Preston and Helena Clayton
ACIAR Technical Reports No. 52e(printed version published in 2003)
Salinity in rice–shrimp and rice monoculture rice fieldsThe salinity increased with soil depth (as observed in RS fields) in the monoculture rice fieldsin both districts (Figs. 5a and b). The very large standard of errors of the means in themonoculture rice fields indicated that the variation in salinity among different fields was muchlarger in the monoculture rice fields than in the RS fields. The wider variation indicated thatwater management, or its effects, in monoculture rice fields was more diverse than in RS fields.It is likely that the salinity in RS fields was strongly affected and therefore more homogenised bythe frequent exchange of water between the RS fields and the adjacent canal. Most of themonoculture rice fields were located further from the canal and did not have direct exchange ofwater with the surrounding canals. The salinity in the monoculture rice was more affected byfactors such as the field elevation and farmer’s practices of salt leaching.
In My Xuyen, salinity in RS fields was lower than in monoculture rice fields. In Gia Rai, oneout of three monoculture rice fields had lower, and two fields had higher, salinity than the RSfields. Farmers took advantage of low salinity in the canal water in My Xuyen to leach out thesalinity of the fields. Farmers in the monoculture rice fields did not access the canal water toleach out the salinity, which had probably been built up by capillary rise during the dry season.In Gia Rai, however, leaching using canal water could not bring down the salinity of the soil toa lower level because:(a) the initial salinity of the soil at the end of the dry season was very high (30 to 40 dS m−1)(b) the salinity of the water during the rainy season remained high (more than 5 dS m−1)(c) the soil has low hydraulic conductivity.
If rice monoculture farmers could prevent the saline water intrusion into their fields duringthe dry and the rainy seasons, the salinity could be lower than in the RS fields.
Figure 5a. Soil salinity in rice monoculture and rice–shrimp fields, My Xuyen.
Rice–shrimp 5 cmRice–shrimp 15 cmMonorice 5 cmMonorice 15 cm
May
98
Jun
98
Jul 9
8
Aug
98
Sep
98
Oct
98
Nov
98
Dec
98
Jan
99
Feb
99
Mar
99
Apr
99
May
99
18
16
14
12
10
8
6
4
2
0
EC
(dS
m−1
)
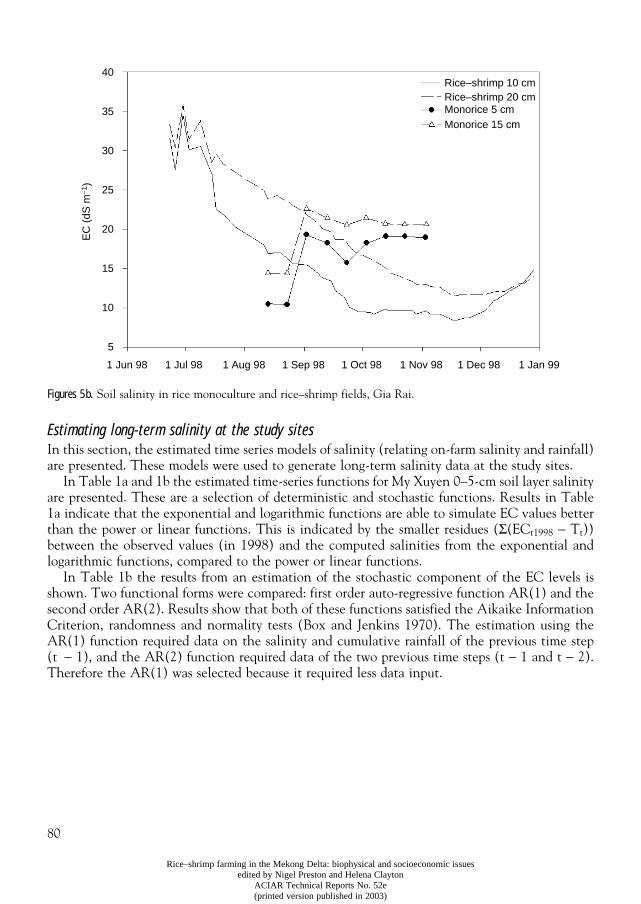
80
Rice–shrimp farming in the Mekong Delta: biophysical and socioeconomic issuesedited by Nigel Preston and Helena Clayton
ACIAR Technical Reports No. 52e(printed version published in 2003)
Figures 5b. Soil salinity in rice monoculture and rice–shrimp fields, Gia Rai.
Estimating long-term salinity at the study sitesIn this section, the estimated time series models of salinity (relating on-farm salinity and rainfall)are presented. These models were used to generate long-term salinity data at the study sites.
In Table 1a and 1b the estimated time-series functions for My Xuyen 0–5-cm soil layer salinityare presented. These are a selection of deterministic and stochastic functions. Results in Table1a indicate that the exponential and logarithmic functions are able to simulate EC values betterthan the power or linear functions. This is indicated by the smaller residues (Σ(ECt1998 − Tt))between the observed values (in 1998) and the computed salinities from the exponential andlogarithmic functions, compared to the power or linear functions.
In Table 1b the results from an estimation of the stochastic component of the EC levels isshown. Two functional forms were compared: first order auto-regressive function AR(1) and thesecond order AR(2). Results show that both of these functions satisfied the Aikaike InformationCriterion, randomness and normality tests (Box and Jenkins 1970). The estimation using theAR(1) function required data on the salinity and cumulative rainfall of the previous time step(t − 1), and the AR(2) function required data of the two previous time steps (t − 1 and t − 2).Therefore the AR(1) was selected because it required less data input.
Rice–shrimp 10 cmRice–shrimp 20 cmMonorice 5 cmMonorice 15 cm
EC
(dS
m−1
)
1 Jun 98 1 Jul 98 1 Aug 98 1 Sep 98 1 Oct 98 1 Nov 98 1 Dec 98 1 Jan 99
40
35
30
25
20
15
10
5
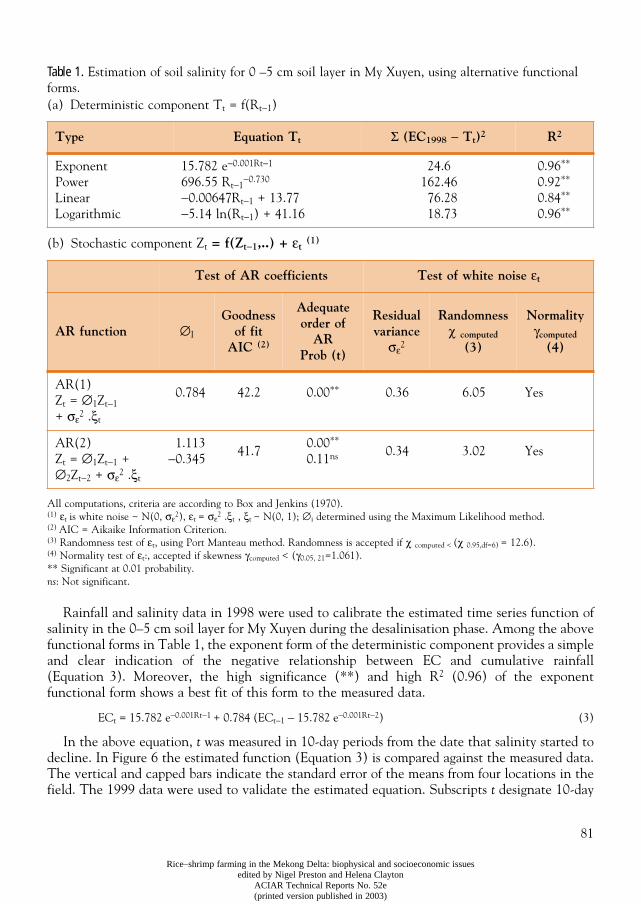
81
Rice–shrimp farming in the Mekong Delta: biophysical and socioeconomic issuesedited by Nigel Preston and Helena Clayton
ACIAR Technical Reports No. 52e(printed version published in 2003)
Table 1. Estimation of soil salinity for 0 –5 cm soil layer in My Xuyen, using alternative functional forms.(a) Deterministic component Tt = f(Rt−1)
(b) Stochastic component Zt = f(Zt−1,..) + εt (1)
All computations, criteria are according to Box and Jenkins (1970).(1) εt is white noise ~ N(0, σε2), εt = σε2 .ξt , ξt ~ N(0, 1); ∅i determined using the Maximum Likelihood method.(2) AIC = Aikaike Information Criterion.(3) Randomness test of εt, using Port Manteau method. Randomness is accepted if χ computed < (χ 0.95,df=6) = 12.6).(4) Normality test of εt:, accepted if skewness γcomputed < (γ0.05, 21=1.061).** Significant at 0.01 probability.ns: Not significant.
Rainfall and salinity data in 1998 were used to calibrate the estimated time series function ofsalinity in the 0–5 cm soil layer for My Xuyen during the desalinisation phase. Among the abovefunctional forms in Table 1, the exponent form of the deterministic component provides a simpleand clear indication of the negative relationship between EC and cumulative rainfall(Equation 3). Moreover, the high significance (**) and high R2 (0.96) of the exponentfunctional form shows a best fit of this form to the measured data.
ECt = 15.782 e−0.001Rt−1 + 0.784 (ECt−1 − 15.782 e−0.001Rt−2) (3)
In the above equation, t was measured in 10-day periods from the date that salinity started todecline. In Figure 6 the estimated function (Equation 3) is compared against the measured data.The vertical and capped bars indicate the standard error of the means from four locations in thefield. The 1999 data were used to validate the estimated equation. Subscripts t designate 10-day
Type Equation Tt Σ (EC1998 − Tt)2 R2
ExponentPowerLinearLogarithmic
15.782 e−0.001Rt−1
696.55 Rt−1−0.730
−0.00647Rt−1 + 13.77−5.14 ln(Rt−1) + 41.16
24.6162.4676.2818.73
0.96**
0.92**
0.84**
0.96**
Test of AR coefficients Test of white noise εt
AR function ∅I
Goodness of fit
AIC (2)
Adequate order of
ARProb (t)
Residual variance
σε2
Randomnessχ computed
(3)
Normalityγcomputed
(4)
AR(1)Zt = ∅1Zt−1 + σε2 .ξt
0.784 42.2 0.00** 0.36 6.05 Yes
AR(2)Zt = ∅1Zt−1 + ∅2Zt−2 + σε2 .ξt
1.113−0.345
41.70.00**
0.11ns 0.34 3.02 Yes
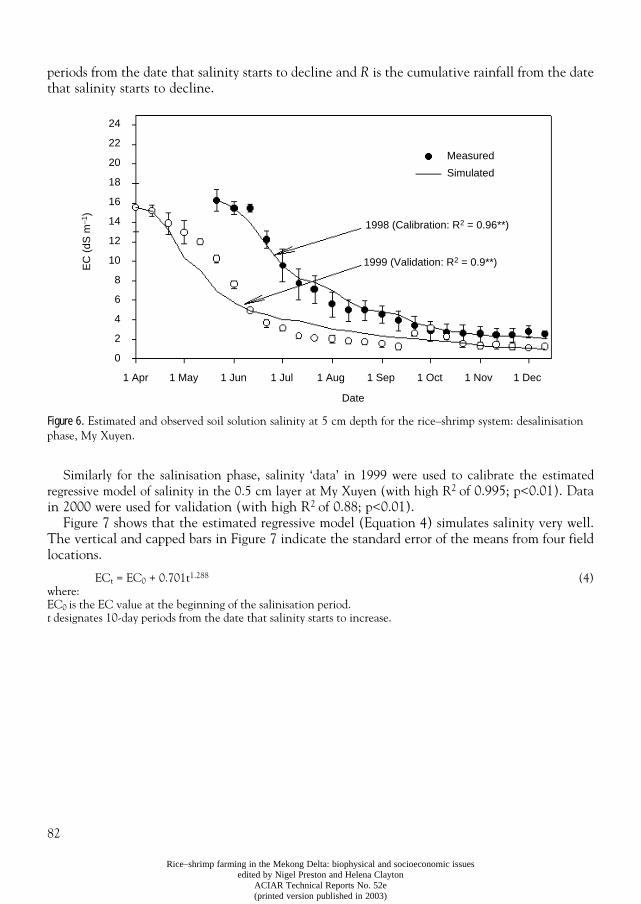
82
Rice–shrimp farming in the Mekong Delta: biophysical and socioeconomic issuesedited by Nigel Preston and Helena Clayton
ACIAR Technical Reports No. 52e(printed version published in 2003)
periods from the date that salinity starts to decline and R is the cumulative rainfall from the datethat salinity starts to decline.
Figure 6. Estimated and observed soil solution salinity at 5 cm depth for the rice–shrimp system: desalinisation phase, My Xuyen.
Similarly for the salinisation phase, salinity ‘data’ in 1999 were used to calibrate the estimatedregressive model of salinity in the 0.5 cm layer at My Xuyen (with high R2 of 0.995; p<0.01). Datain 2000 were used for validation (with high R2 of 0.88; p<0.01).
Figure 7 shows that the estimated regressive model (Equation 4) simulates salinity very well.The vertical and capped bars in Figure 7 indicate the standard error of the means from four fieldlocations.
ECt = EC0 + 0.701t1.288 (4)where:EC0 is the EC value at the beginning of the salinisation period.t designates 10-day periods from the date that salinity starts to increase.
Measured
Simulated
1 Apr 1 May 1 Jun 1 Jul 1 Aug 1 Sep 1 Oct 1 Nov 1 Dec
Date
EC
(dS
m−1
)
24
22
20
18
16
14
12
10
8
6
4
2
0
1998 (Calibration: R2 = 0.96**)
1999 (Validation: R2 = 0.9**)
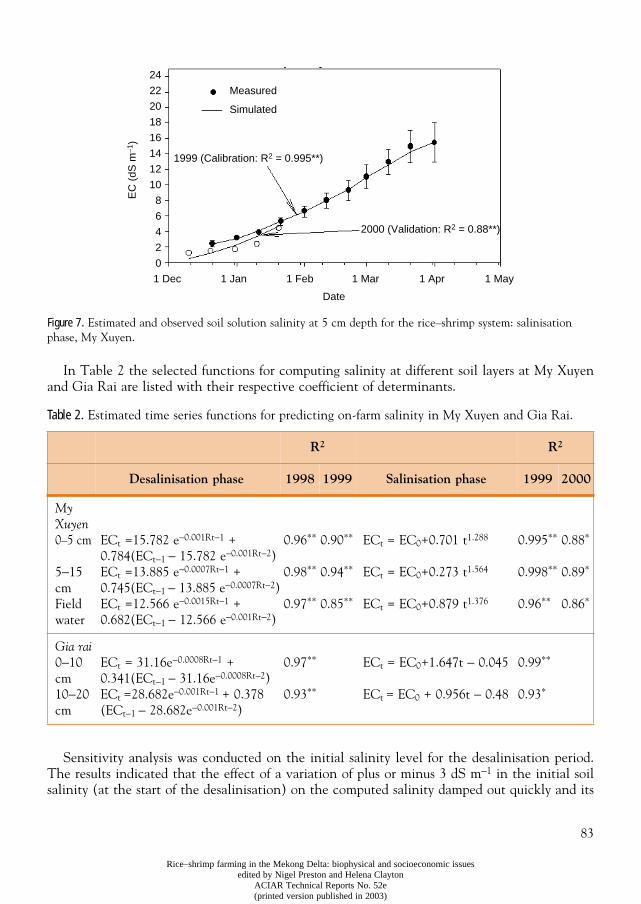
83
Rice–shrimp farming in the Mekong Delta: biophysical and socioeconomic issuesedited by Nigel Preston and Helena Clayton
ACIAR Technical Reports No. 52e(printed version published in 2003)
Figure 7. Estimated and observed soil solution salinity at 5 cm depth for the rice–shrimp system: salinisation phase, My Xuyen.
In Table 2 the selected functions for computing salinity at different soil layers at My Xuyenand Gia Rai are listed with their respective coefficient of determinants.
Table 2. Estimated time series functions for predicting on-farm salinity in My Xuyen and Gia Rai.
Sensitivity analysis was conducted on the initial salinity level for the desalinisation period.The results indicated that the effect of a variation of plus or minus 3 dS m−1 in the initial soilsalinity (at the start of the desalinisation) on the computed salinity damped out quickly and its
R2 R2
Desalinisation phase 1998 1999 Salinisation phase 1999 2000
My Xuyen0–5 cm
5−15 cmField water
ECt =15.782 e−0.001Rt−1 + 0.784(ECt−1 − 15.782 e−0.001Rt−2)ECt =13.885 e−0.0007Rt−1 + 0.745(ECt−1 − 13.885 e−0.0007Rt−2)ECt =12.566 e−0.0015Rt−1 + 0.682(ECt−1 − 12.566 e−0.001Rt−2)
0.96**
0.98**
0.97**
0.90**
0.94**
0.85**
ECt = EC0+0.701 t1.288
ECt = EC0+0.273 t1.564
ECt = EC0+0.879 t1.376
0.995**
0.998**
0.96**
0.88*
0.89*
0.86*
Gia rai0−10 cm 10−20 cm
ECt = 31.16e−0.0008Rt−1 + 0.341(ECt−1 − 31.16e−0.0008Rt−2)ECt =28.682e−0.001Rt−1 + 0.378 (ECt−1 − 28.682e−0.001Rt−2)
0.97**
0.93**
ECt = EC0+1.647t − 0.045
ECt = EC0 + 0.956t − 0.48
0.99**
0.93*
Measured
Simulated
1 Dec 1 Jan 1 Feb 1 Mar 1 Apr 1 May
Date
EC
(dS
m−1
)
24
22
20
18
16
14
12
10
8
6
4
2
0
1999 (Calibration: R2 = 0.995**)
2000 (Validation: R2 = 0.88**)
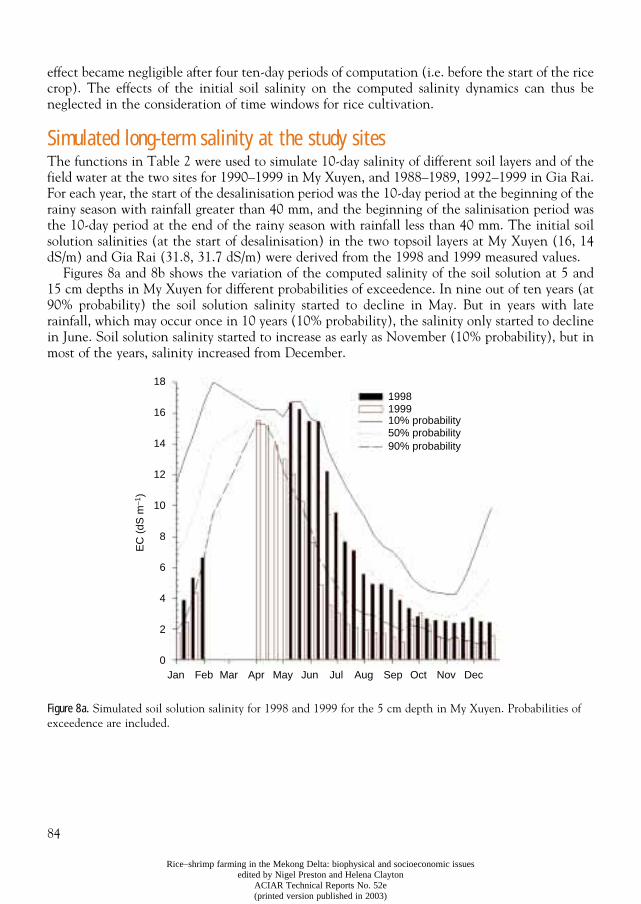
84
Rice–shrimp farming in the Mekong Delta: biophysical and socioeconomic issuesedited by Nigel Preston and Helena Clayton
ACIAR Technical Reports No. 52e(printed version published in 2003)
effect became negligible after four ten-day periods of computation (i.e. before the start of the ricecrop). The effects of the initial soil salinity on the computed salinity dynamics can thus beneglected in the consideration of time windows for rice cultivation.
Simulated long-term salinity at the study sitesThe functions in Table 2 were used to simulate 10-day salinity of different soil layers and of thefield water at the two sites for 1990–1999 in My Xuyen, and 1988–1989, 1992–1999 in Gia Rai.For each year, the start of the desalinisation period was the 10-day period at the beginning of therainy season with rainfall greater than 40 mm, and the beginning of the salinisation period wasthe 10-day period at the end of the rainy season with rainfall less than 40 mm. The initial soilsolution salinities (at the start of desalinisation) in the two topsoil layers at My Xuyen (16, 14dS/m) and Gia Rai (31.8, 31.7 dS/m) were derived from the 1998 and 1999 measured values.
Figures 8a and 8b shows the variation of the computed salinity of the soil solution at 5 and15 cm depths in My Xuyen for different probabilities of exceedence. In nine out of ten years (at90% probability) the soil solution salinity started to decline in May. But in years with laterainfall, which may occur once in 10 years (10% probability), the salinity only started to declinein June. Soil solution salinity started to increase as early as November (10% probability), but inmost of the years, salinity increased from December.
Figure 8a. Simulated soil solution salinity for 1998 and 1999 for the 5 cm depth in My Xuyen. Probabilities of exceedence are included.
1998199910% probability50% probability90% probability
Jan Feb Mar Apr May Jun Jul Aug Sep Oct Nov Dec
18
16
14
12
10
8
6
4
2
0
EC
(dS
m−1
)
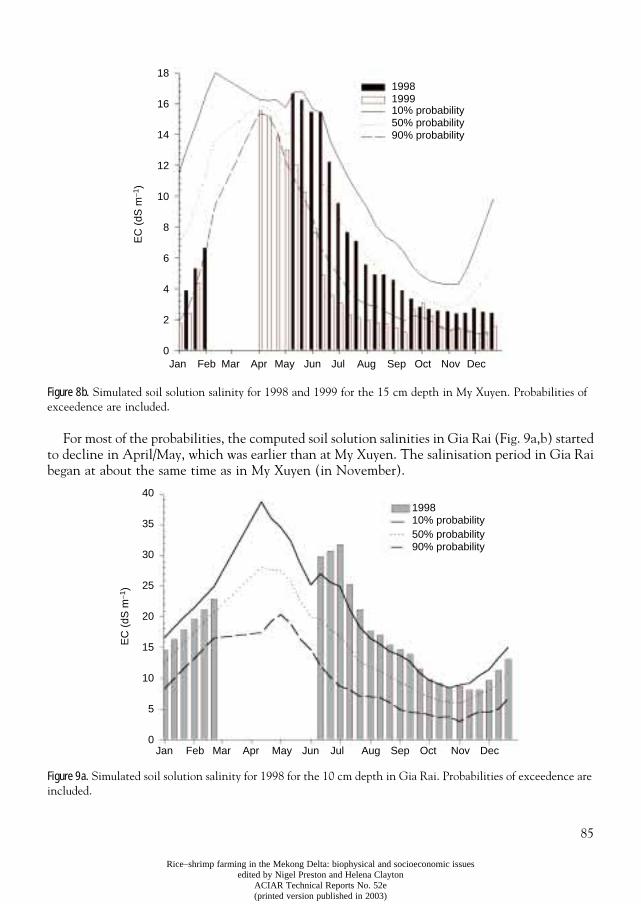
85
Rice–shrimp farming in the Mekong Delta: biophysical and socioeconomic issuesedited by Nigel Preston and Helena Clayton
ACIAR Technical Reports No. 52e(printed version published in 2003)
Figure 8b. Simulated soil solution salinity for 1998 and 1999 for the 15 cm depth in My Xuyen. Probabilities of exceedence are included.
For most of the probabilities, the computed soil solution salinities in Gia Rai (Fig. 9a,b) startedto decline in April/May, which was earlier than at My Xuyen. The salinisation period in Gia Raibegan at about the same time as in My Xuyen (in November).
Figure 9a. Simulated soil solution salinity for 1998 for the 10 cm depth in Gia Rai. Probabilities of exceedence are included.
1998
10% probability50% probability90% probability
1999
Jan Feb Mar Apr May Jun Jul Aug Sep Oct Nov Dec
EC
(dS
m−1
)
18
16
14
12
10
8
6
4
2
0
199810% probability50% probability90% probability
Jan Feb Mar Apr May Jun Jul Aug Sep Oct Nov Dec
EC
(dS
m−1
)
40
35
30
25
20
15
10
5
0
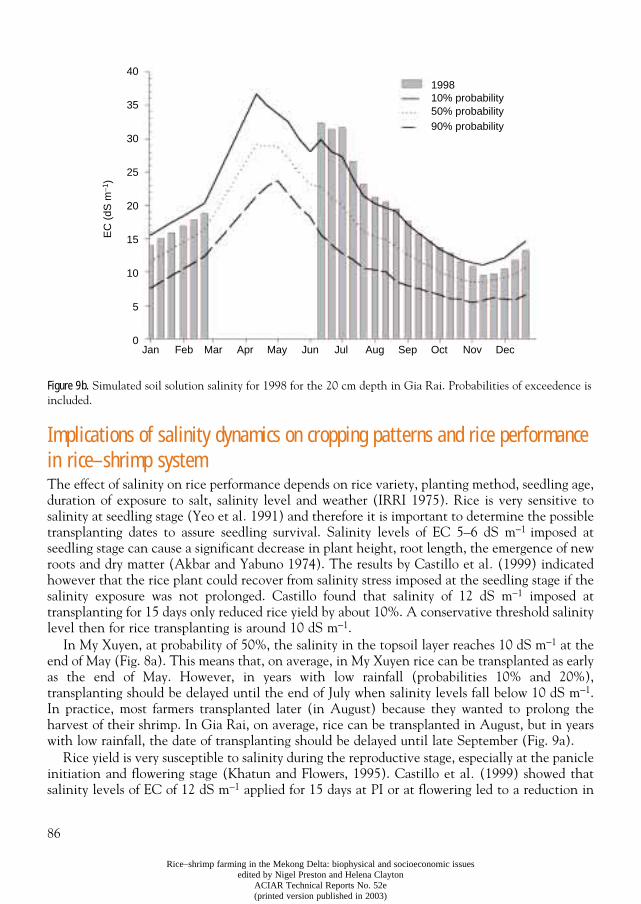
86
Rice–shrimp farming in the Mekong Delta: biophysical and socioeconomic issuesedited by Nigel Preston and Helena Clayton
ACIAR Technical Reports No. 52e(printed version published in 2003)
Figure 9b. Simulated soil solution salinity for 1998 for the 20 cm depth in Gia Rai. Probabilities of exceedence is included.
Implications of salinity dynamics on cropping patterns and rice performance in rice–shrimp systemThe effect of salinity on rice performance depends on rice variety, planting method, seedling age,duration of exposure to salt, salinity level and weather (IRRI 1975). Rice is very sensitive tosalinity at seedling stage (Yeo et al. 1991) and therefore it is important to determine the possibletransplanting dates to assure seedling survival. Salinity levels of EC 5–6 dS m−1 imposed atseedling stage can cause a significant decrease in plant height, root length, the emergence of newroots and dry matter (Akbar and Yabuno 1974). The results by Castillo et al. (1999) indicatedhowever that the rice plant could recover from salinity stress imposed at the seedling stage if thesalinity exposure was not prolonged. Castillo found that salinity of 12 dS m−1 imposed attransplanting for 15 days only reduced rice yield by about 10%. A conservative threshold salinitylevel then for rice transplanting is around 10 dS m−1.
In My Xuyen, at probability of 50%, the salinity in the topsoil layer reaches 10 dS m−1 at theend of May (Fig. 8a). This means that, on average, in My Xuyen rice can be transplanted as earlyas the end of May. However, in years with low rainfall (probabilities 10% and 20%),transplanting should be delayed until the end of July when salinity levels fall below 10 dS m−1.In practice, most farmers transplanted later (in August) because they wanted to prolong theharvest of their shrimp. In Gia Rai, on average, rice can be transplanted in August, but in yearswith low rainfall, the date of transplanting should be delayed until late September (Fig. 9a).
Rice yield is very susceptible to salinity during the reproductive stage, especially at the panicleinitiation and flowering stage (Khatun and Flowers, 1995). Castillo et al. (1999) showed thatsalinity levels of EC of 12 dS m−1 applied for 15 days at PI or at flowering led to a reduction in
199810% probability50% probability90% probability
Jan Feb Mar Apr May Jun Jul Aug Sep Oct Nov Dec
40
35
30
25
20
15
10
5
0
EC
(dS
m−1
)
87
Rice–shrimp farming in the Mekong Delta: biophysical and socioeconomic issuesedited by Nigel Preston and Helena Clayton
ACIAR Technical Reports No. 52e(printed version published in 2003)
the grain yield by about 40–60%. Prolonged salinity stress during the reproduction stage of thecrop may also cause further reductions in yield. To maintain rice yields at about 50% of the yieldin non-saline conditions, rice plants should reach flowering before the soil solution salinity ofthe topsoil reaches 10 dS m−1. In My Xuyen at probability of 50%, this salinity level correspondsto about the middle of January. In years with early recession of rainfall, rice should be in theflowering stage by mid-December to avoid significant salinity damage. In Gia Rai, in an averageyear, rice should reach the flowering stage by about mid-December, and in years with highsalinity, results show that rice should flower before the middle of November to avoid heavy losses.
The results indicate that My Xuyen has a wide ‘cropping window’ for rice cultivation. Riceyield is, however, reduced compared with the salinity-free condition. The degree of reductionwill vary with the date of transplanting. It is important to determine which cropping calendarwill produce the highest combined income from rice and shrimp. The ‘window’ for ricecultivation in Gia Rai is much smaller. In high salinity years (probability 10–20%), the possibleduration from transplanting to flowering is only about one month (middle of September tomiddle of November) and therefore selection of very short duration varieties is necessary.Furthermore, the salinity of the root zone is likely to be higher than 6 dS/m anytime (Fig. 9a and9b), which means that even if rice plants survive after transplantation, heavy yield loss wouldoccur due to prolonged salinity stress.
Concluding commentsIt was observed that salinity in the canal systems surrounding the rice–shrimp fields declinedsharply when 10-day rainfall exceeded 40 mm. Daily exchange of field water with canal water atthe beginning of the rainy season was found to help expedite the leaching and flushing of thesalinity from the root zone of the rice–shrimp field, which may help to advance the date ofplanting. This water management meant that the salinity in rice–shrimp fields was not higherthan the levels in monoculture fields.
This study illustrated the usefulness of time series models and regressive analyses in generatinglong-term salinity data from the rainfall. It is important to note, however, that these models arevalid only for the same management and at the same sites as in the study. There is significantscope to use the model to explore the salinity effects of other management factors, such asminimising the exchange between field and canal water.
The study identified the time window for growing rice at the two sites, but it did not givequantitative data on rice yields and how yields may change under various management scenarios,such as the planting date, within the time window. Other detailed crop growth models, such asORYZA (Kropff et al. 1994; Wopereis et al. 1996) are needed to help answer these questions. InTuong et al. (this Report) further analysis is conducted using ORYZA where rice yields aresimulated under different planting dates. This analysis can provide greater accuracy in identifyingsuitable time window in order to achieve high rice yields.
ReferenceAkbar, M., Jena, K.K. and Seshu, D.V. Salt tolerance in wild rices. International-Rice-Research-Newsletter.
1987; 12(5): 15.Brennan, D. 1998. First annual report of the ACIAR Rice–Shrimp project. University of Sydney and Can Tho
University.Box, G.E.P. and Jenkins, G.M. 1976. Time series Analysis forecasting and control. Hoden-day, Inc. California.
88
Rice–shrimp farming in the Mekong Delta: biophysical and socioeconomic issuesedited by Nigel Preston and Helena Clayton
ACIAR Technical Reports No. 52e(printed version published in 2003)
Castillo, E., Huynh Thi Thuy Trang, Thai Nguyen Quynh Thu and To Phuc Tuong. 1999. Phenological andphysiological responses of a rice cultivar to level and timing of salinity stress. Paper presented at 2nd AnnualWorkshop of the ACIAR Rice–Shrimp Project. Can Tho University, 20–22 September 1999.
IRRI, 1975. Annual Report for 1974. International Rice Research Institute, Los Baños, Laguna, Philippines.Khatun, S., Rizzo, C.A. and Flowers, T.J. Genotypic variation in the effect of salinity on fertility in rice. Plant
and Soil. 1995; 173(2): 239–250; ISSN: 0032-079X.Kropff, M.J., van Laar, H.H. and Matthews, R. 1994. ORYZA1, an ecophysiological model for irrigated rice
production. SARP Research Proceedings. Wageningen (The Netherlands): AB-DLO. 110 pages.Thanh, L.V. 1998. Soil properties. Report to ACIAR Rice–Shrimp project. Southern Institute of Water
Resources Research, 2A Nguyen Bieu, Dist. 5, Ho Chi Minh City.Thom, H.C.S. 1968. Direct and inverse tables of the gamma distribution. US Department of Commerce.To Phuc Tuong,, Du, L.V. and Luan, N.N. 1993. Effect of land preparation on leaching of an acid sulphate soil
at Cu Chi, Vietnam. p. 281–289. In Dent, D.L. and van Mensvoort, M.E.F., eds, Selected papers of the HoChi Minh Symposium on Acid Sulphate Soil, Ho Chi Minh City, 2–6 March 1992. International Institutefor Land Reclamation and Improvement) P.O. Box 45, 6700 AA Wageningen, The Netherlands.
Wopereis, M.C.S., Bouman, B.A.M., To Phuc Tuong, Berge, H.F.M. and Kropff, M.J. ORYZA_W, 1996. Ricegrowth model for irrigated and rainfed environments. Simulation and System Analysis for Rice ProductionProceedings. Wageningen University, Wageningen, Netherlands and International Rice Research Institute,P.O. Box 933, Manila, Philippines. 159 pages.
Yeo, A.R., Lee, K.S., Izard, P., Boursier, P.J. and Flowers, T.J. Short- and long-term effects of salinity on leafgrowth in rice (Oryza sativa L.). Journal-of-Experimental-Botany. 1991; 42(240): 881–889; 23 ref.
89
Rice–shrimp farming in the Mekong Delta: biophysical and socioeconomic issuesedited by Nigel Preston and Helena Clayton
ACIAR Technical Reports No. 52e(printed version published in 2003)
CHAPTER 8
Phenological and physiological responses of a rice cultivar to level and timing of salinity stress
Ernesto Castillo
1
, To Phuc Tuong
1
, Huynh Thi Thuy Trang
2
, Thai Nguyen Quynh Thu
2
and Tran Thi Ku Phuong
2
1
International Rice Research Institute, Los Baños, Laguna, Philippines.
2
University of Agriculture and Forestry, Ho Chi Minh City, Vietnam.Email Ernesto Castillo: [email protected]
Abstract
Process-based understanding of the response of rice to salinity stress is crucial for being able toassess rice performance in saline conditions and also for developing models that can simulate ricedevelopment when it is subjected to salinity. In this paper results are presented from twogreenhouse experiments in Vietnam and one experiment in the phytroton at IRRI that wereconducted to quantify the response of rice cv. IR64 to salinity. In the experiments, the rice plantswere subjected to salinity levels varying from EC 4 to 18 dS m
−
1
for 14 days at three growth stages(transplanting (TP), panicle initiation (PI) and flowering (FL)). The results showed that salinitystress at TP and PI delayed the flowering and maturity date of rice. A positive relationship wasfound between the delay of the flowering and maturity date (from five to ten days) and salinitylevels. Salinity stress at FL increased leaf senescence and reduced the grain-filling period,especially at salinity stress level 18 dS m
−
1
. Treatments with EC 6 dS m
−
1
, and EC 12 dS m
−
1
imposed at TP, did not reduce grain yields significantly compared to the control treatment. Mostseedlings died after three to eight days of imposition of salinity levels of EC 18 dS m
−
1
attransplanting. However, if stress was relieved before death of seedlings, they recovered andresulted in about 20% yield reduction. Salinity of EC 12 and 18 dS m
−
1
imposed at PI reducedthe number of spikelets, created sink limitation during the grain-filling period and yielded only80% (for 12 dS m
−
1
) and 35% (18 dS m
−
1
) of the yield of the control treatment. Salinity ofEC 12 and 18 dS m
−
1
imposed at FL reduced 1000-grain weight and produced about 40% and80% of yield of the control treatment. These findings support our hypothesis that rice responsesto short-term salinity stress are similar to drought-stress responses.
S
EVERAL
STUDIES
HAVE
been conducted to investigate the effects of salinity on rice crops(Pearson et al. 1966; Akbar and Yabuno 1974; Flowers and Yeo 1981; Aslam 1987; Alamgir etal. 1989; Dubey and Sharma 1989; Azam 1992; Khatun and Flowers 1994a,b; Katun et al. 1995).In some experiments, low salinity at the early growth phase has been found to stimulate plantgrowth; however, all studies have found that high salinity levels at all growth phases inhibit thegrowth and yield of rice.
The impacts from salinity have been shown to vary at different growth phases. For example,the rice grain yield tends to be more sensitive to salinity at the later stages of vegetative growth,although very young seedlings are also particularly sensitive to salinity stress. However, researchto understand the effects of salinity at various crop growth stages and the varying effects fordifferent timing of salinity stress is very limited. Such research is important to enable the
90
Rice–shrimp farming in the Mekong Delta: biophysical and socioeconomic issuesedited by Nigel Preston and Helena Clayton
ACIAR Technical Reports No. 52e(printed version published in 2003)
development of crop growth models to understand, simulate and predict the response of rice tosalinity stress.
The aim of this study was to quantify the interactive effects of salinity level and timing onrice-growth and yield. A series of experiments were conducted to evaluate the interaction ofsalinity levels and timing of application, and to quantify the effects of salinity on phenology,biomass accumulation, yield and yield parameters for IR64, as a basis for developing a modelassessing rice response to salinity. It was hypothesised that the responses of rice plants to short-term salinity stress are similar to drought-stress responses.
Materials and Methods
Experiment set-up
Rice response to salinity was tested in the following three experiments:
Experiment 1:
Greenhouse experiments at the University of Agriculture and Forestry, Ho ChiMinh City (UAF) — November 1998 to February 1999
Experiment 2:
Greenhouse experiments at UAF — May to August 1999
Experiment 3:
Controlled environment experiments in a phytotron facility at the InternationalRice Research Institute — March to June 1999.
In each experiment, the interaction of salinity levels and timing of salinity application wasevaluated in a split-plot design experiment with four replications.
The main plots were three salinity (C) levels: 4, 8 and 12 dS m
−
1
(Experiment 1), and 6, 12and 18 dS m
−
1
(Experiments 2 and 3). The sub-plots were three salinity application timings (T)at different crop growth stages of transplanting (four days after transplantation in experiment 1and 2, and one day after transplanting for experiment 3), panicle initiation and flowering.
At each application time, the stress imposition lasted for 15 days or until leaf-rolling score 5was reached. This degree of leaf rolling was scored by visual observation of the leaf cross-sectionalcurvature following the method describe in O’Toole et al. 1979. Score 5 is attained when theleaf is completely rolled. Apart from the nine stressed treatments, one control treatment wasincluded where plants were grown in optimal conditions throughout the crop season.
Materials and culture management
Soils and planting material
Pre-germinated rice cv. IR64 seeds were grown in seedling trays at one seedling per 1 cm
3
sectionof the tray filled with soil. Fourteen-day-old seedlings were transplanted into 25-cm height
×
20-cm diameter PVC pots, which contained about 8.5 kg of 0.5–1-mm sand, one seedling perpot, with the soil intact during transplanting. One hole was cored at the bottom of each pot fordrainage and leaching purposes. The holes were covered with a fine screen cloth to avoid loss ofsand particles during the frequent drainage and leaching processes.
Nutrient solutions
Macro and micro-nutrients were supplied to the pots by nutrient solutions prepared according tothe procedure described by Yoshida et al. (1996). Nutrient solution was maintained at 3 cm abovesand surface, by adding de-mineralised water. Daily monitoring of the pH of the nutrient solutionwas conducted and maintained using 1N hydrochloric acid (HCl) or 1N sodium hydroxide(NaOH) so that the pH did not deviate from the level of 5.5, which is critical in order to maintain
91
Rice–shrimp farming in the Mekong Delta: biophysical and socioeconomic issuesedited by Nigel Preston and Helena Clayton
ACIAR Technical Reports No. 52e(printed version published in 2003)
the balance of available nutrients. The nutrient solution was changed every week during thevegetative stage of the crop up to flowering and thereafter every four days up to full maturity.
Salinity imposition
The experiment salinity levels were prepared by adding table salt (NaCl) to the nutrient solutionuntil it reached the specified EC value. For example, approximately 4.5g NaCl was added to 1 Lof the nutrient solution to give an EC of 8 dS m
−
1
. After adjusting the desired salinity, the pHof the entire culture solution was again adjusted to 5.5 before being added to the respective pots.
At the start of the stress period, the nutrient solution was drained off the pot to be replacedby the specified salinised nutrient solution. EC values were measured at the surface water, in themiddle of the pot (approx. 5–8 cm from the surface) and at the bottom (approx. 15–18 cm fromsurface). If the specified EC was not attained, soil solution in the pot was again drained andreplaced by salinised solution. This process was repeated until the desired EC was recordedthroughout the depth of the sand layer.
To maintain the desired level of nutrient, the soil solution in the stressed pot was also changedat the same frequency as those not undergoing stress. In the experiments, salinity stress wasstopped when the first sign of senescence was observed. This was done until the plant reachedmaturity to investigate the effect of stress during the recovery. After the completion of the stressperiod, the stressed pots were drained and soil solution was replaced by the normal nutrientsolution. This process of leaching was repeated several times until the EC of the soil solution inthe (previously stressed) pots was similar to the EC of water used in preparing nutrient solution.
Plant sampling and yield parameters
We recorded the date of PI, FL and physiological maturity (PM) of all treatments. Sequentialplant samplings were taken at transplanting, active tillering, PI, FL, grain filling (GF) and at PM,for biomass and its partitioning (leaves, culm and panicle), tiller number and leaf areadetermination. At each salinity application, plants were sampled at 7 and 14 days after impositionof salinity. Leaf length and number, tiller number and plant height were measured twice a weekin non-stressed plants and daily in stressed plants.
At PM, straw yield and grain yield and yield components were determined per pot. Grain yieldwas adjusted to 14% moisture. The total straw weight and partitioned parts were determined forconstant oven drying at 70
o
C. Roots were also taken from each pot, washed and cleaned, andthe total dry weight was recorded.
Results
Crop mortality
At the salinity level of 18 dS m
−
1
imposed at the transplanting stage, the rice plants attained leafscores of 5 and senescence was observed after three days in experiment 2 and seven days inexperiment 3. Prolonged salinity stress after the initial stress at the time of transplanting resultedin further crop mortality. Stress imposed at PI and FL did not result in mortality.
Phenology
A delayed flowering and maturity, compared with the control, was observed in all treatments forall salinity levels imposed at TP and PI (Table 1). The application of salinity stress at TP delayedflowering and PM on average by five days for 6 dS m
−
1
and seven to ten days for both 12 and18 dS m
−
1
treatments.
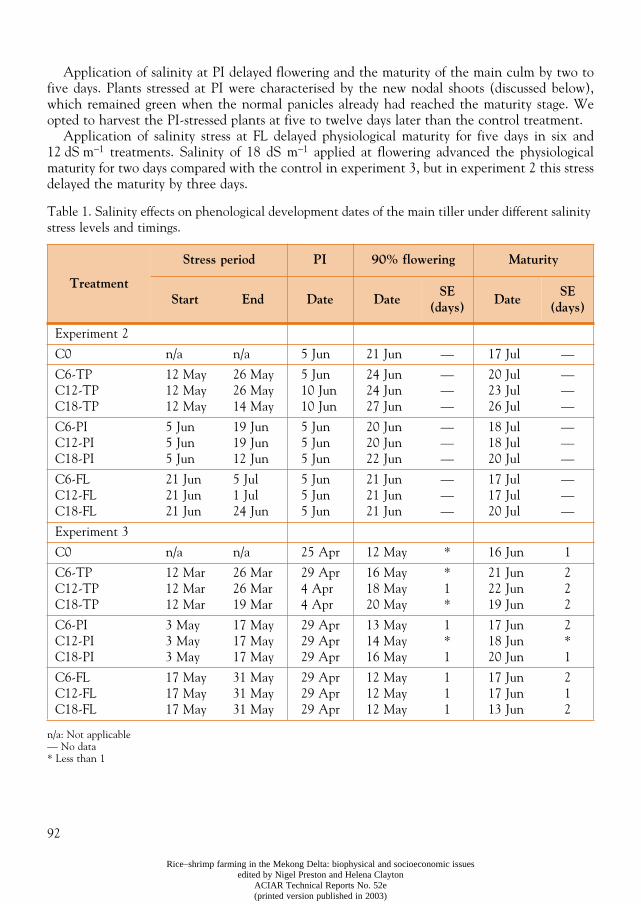
92
Rice–shrimp farming in the Mekong Delta: biophysical and socioeconomic issuesedited by Nigel Preston and Helena Clayton
ACIAR Technical Reports No. 52e(printed version published in 2003)
Application of salinity at PI delayed flowering and the maturity of the main culm by two tofive days. Plants stressed at PI were characterised by the new nodal shoots (discussed below),which remained green when the normal panicles already had reached the maturity stage. Weopted to harvest the PI-stressed plants at five to twelve days later than the control treatment.
Application of salinity stress at FL delayed physiological maturity for five days in six and12 dS m
−
1
treatments. Salinity of 18 dS m
−
1
applied at flowering advanced the physiologicalmaturity for two days compared with the control in experiment 3, but in experiment 2 this stressdelayed the maturity by three days.
Table 1. Salinity effects on phenological development dates of the main tiller under different salinity stress levels and timings.
n/a: Not applicable— No data* Less than 1
Treatment
Stress period PI 90% flowering Maturity
Start End Date DateSE
(days)Date
SE (days)
Experiment 2
C0 n/a n/a 5 Jun 21 Jun — 17 Jul —
C6-TPC12-TPC18-TP
12 May12 May12 May
26 May26 May14 May
5 Jun10 Jun10 Jun
24 Jun24 Jun27 Jun
———
20 Jul23 Jul26 Jul
———
C6-PIC12-PIC18-PI
5 Jun5 Jun5 Jun
19 Jun19 Jun12 Jun
5 Jun5 Jun5 Jun
20 Jun20 Jun22 Jun
———
18 Jul18 Jul20 Jul
———
C6-FLC12-FLC18-FL
21 Jun21 Jun21 Jun
5 Jul1 Jul24 Jun
5 Jun5 Jun5 Jun
21 Jun 21 Jun21 Jun
———
17 Jul17 Jul20 Jul
———
Experiment 3
C0 n/a n/a 25 Apr 12 May * 16 Jun 1
C6-TPC12-TPC18-TP
12 Mar12 Mar12 Mar
26 Mar26 Mar19 Mar
29 Apr4 Apr4 Apr
16 May18 May20 May
*1*
21 Jun22 Jun19 Jun
222
C6-PIC12-PIC18-PI
3 May3 May3 May
17 May17 May17 May
29 Apr29 Apr29 Apr
13 May14 May16 May
1*1
17 Jun18 Jun20 Jun
2*1
C6-FLC12-FLC18-FL
17 May17 May17 May
31 May31 May31 May
29 Apr29 Apr29 Apr
12 May12 May12 May
111
17 Jun17 Jun13 Jun
212
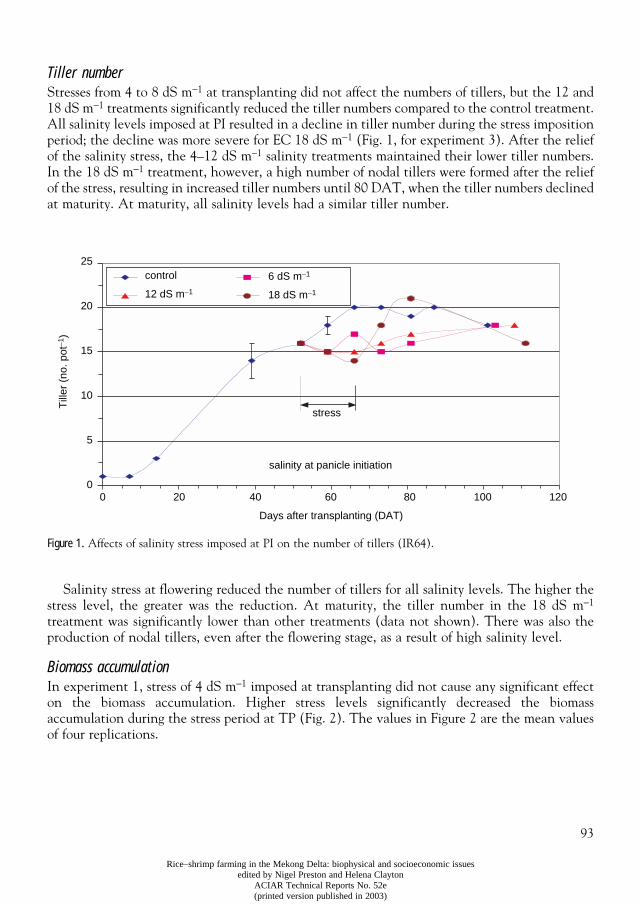
93
Rice–shrimp farming in the Mekong Delta: biophysical and socioeconomic issuesedited by Nigel Preston and Helena Clayton
ACIAR Technical Reports No. 52e(printed version published in 2003)
Tiller number
Stresses from 4 to 8 dS m
−
1
at transplanting did not affect the numbers of tillers, but the 12 and18 dS m
−
1
treatments significantly reduced the tiller numbers compared to the control treatment.All salinity levels imposed at PI resulted in a decline in tiller number during the stress impositionperiod; the decline was more severe for EC 18 dS m
−
1
(Fig. 1, for experiment 3). After the reliefof the salinity stress, the 4–12 dS m
−
1
salinity treatments maintained their lower tiller numbers.In the 18 dS m
−
1
treatment, however, a high number of nodal tillers were formed after the reliefof the stress, resulting in increased tiller numbers until 80 DAT, when the tiller numbers declinedat maturity. At maturity, all salinity levels had a similar tiller number.
Figure 1.
Affects of salinity stress imposed at PI on the number of tillers (IR64).
Salinity stress at flowering reduced the number of tillers for all salinity levels. The higher thestress level, the greater was the reduction. At maturity, the tiller number in the 18 dS m
−
1
treatment was significantly lower than other treatments (data not shown). There was also theproduction of nodal tillers, even after the flowering stage, as a result of high salinity level.
Biomass accumulation
In experiment 1, stress of 4 dS m
−
1
imposed at transplanting did not cause any significant effecton the biomass accumulation. Higher stress levels significantly decreased the biomassaccumulation during the stress period at TP (Fig. 2). The values in Figure 2 are the mean valuesof four replications.
Till
er (
no. p
ot−1
)
control
12 dS m−1
6 dS m−1
18 dS m−1
stress
Days after transplanting (DAT)
0 20 40 60 80 100 120
25
20
15
10
5
0
salinity at panicle initiation
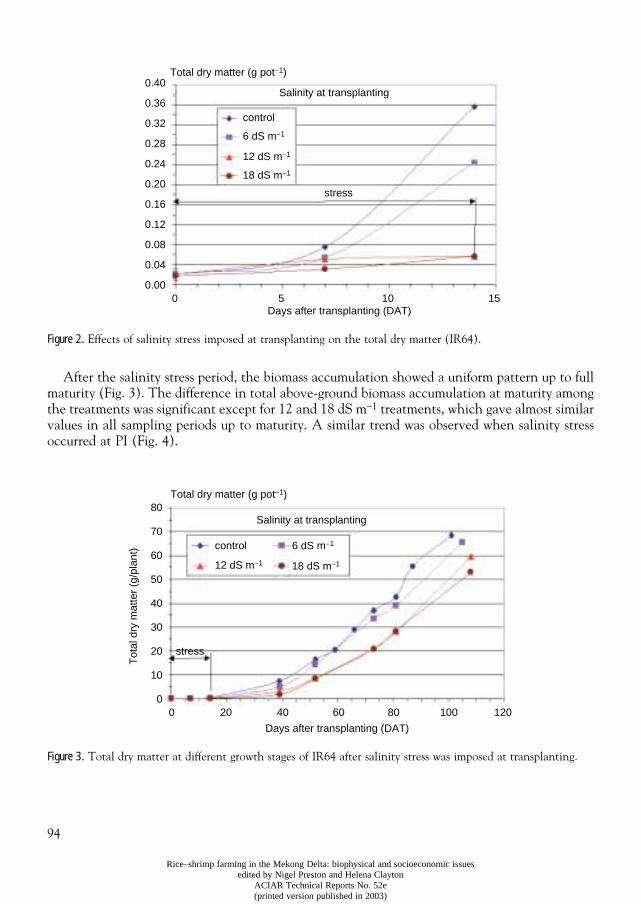
94
Rice–shrimp farming in the Mekong Delta: biophysical and socioeconomic issuesedited by Nigel Preston and Helena Clayton
ACIAR Technical Reports No. 52e(printed version published in 2003)
Figure 2.
Effects of salinity stress imposed at transplanting on the total dry matter (IR64).
After the salinity stress period, the biomass accumulation showed a uniform pattern up to fullmaturity (Fig. 3). The difference in total above-ground biomass accumulation at maturity amongthe treatments was significant except for 12 and 18 dS m
−
1
treatments, which gave almost similarvalues in all sampling periods up to maturity. A similar trend was observed when salinity stressoccurred at PI (Fig. 4).
Figure 3.
Total dry matter at different growth stages of IR64 after salinity stress was imposed at transplanting.
Total dry matter (g pot−1)
control
6 dS m−1
12 dS m−1
18 dS m−1
stress
Days after transplanting (DAT)0 5 10 15
0.40
0.36
0.32
0.28
0.24
0.20
0.16
0.12
0.08
0.04
0.00
Salinity at transplanting
Total dry matter (g pot−1)
control
12 dS m−1
6 dS m−1
18 dS m−1
stress
Days after transplanting (DAT)
Salinity at transplanting
0 20 40 60 80 100 120
Tot
al d
ry m
atte
r (g
/pla
nt)
80
70
60
50
40
30
20
10
0
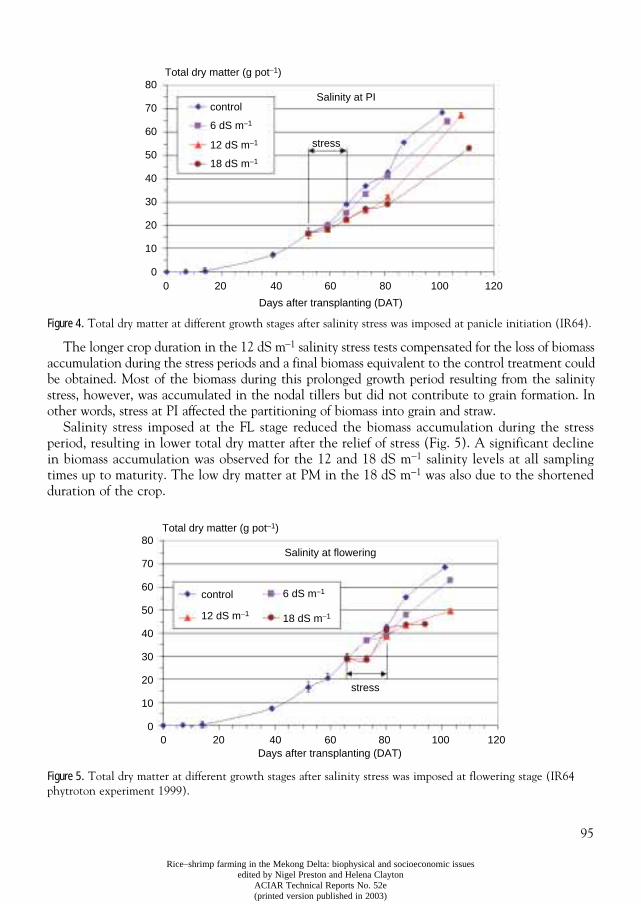
95
Rice–shrimp farming in the Mekong Delta: biophysical and socioeconomic issuesedited by Nigel Preston and Helena Clayton
ACIAR Technical Reports No. 52e(printed version published in 2003)
Figure 4.
Total dry matter at different growth stages after salinity stress was imposed at panicle initiation (IR64).
The longer crop duration in the 12 dS m
−
1
salinity stress tests compensated for the loss of biomassaccumulation during the stress periods and a final biomass equivalent to the control treatment couldbe obtained. Most of the biomass during this prolonged growth period resulting from the salinitystress, however, was accumulated in the nodal tillers but did not contribute to grain formation. Inother words, stress at PI affected the partitioning of biomass into grain and straw.
Salinity stress imposed at the FL stage reduced the biomass accumulation during the stressperiod, resulting in lower total dry matter after the relief of stress (Fig. 5). A significant declinein biomass accumulation was observed for the 12 and 18 dS m
−
1
salinity levels at all samplingtimes up to maturity. The low dry matter at PM in the 18 dS m
−
1
was also due to the shortenedduration of the crop.
Figure 5. Total dry matter at different growth stages after salinity stress was imposed at flowering stage (IR64 phytroton experiment 1999).
Total dry matter (g pot−1)
control
6 dS m−1
12 dS m−1
18 dS m−1
Salinity at PI
stress
Days after transplanting (DAT)
0 20 40 60 80 100 120
80
70
60
50
40
30
20
10
0
Salinity at flowering
Total dry matter (g pot−1)
control
12 dS m−1
6 dS m−1
18 dS m−1
stress
Days after transplanting (DAT)0 20 40 60 80 100 120
80
70
60
50
40
30
20
10
0
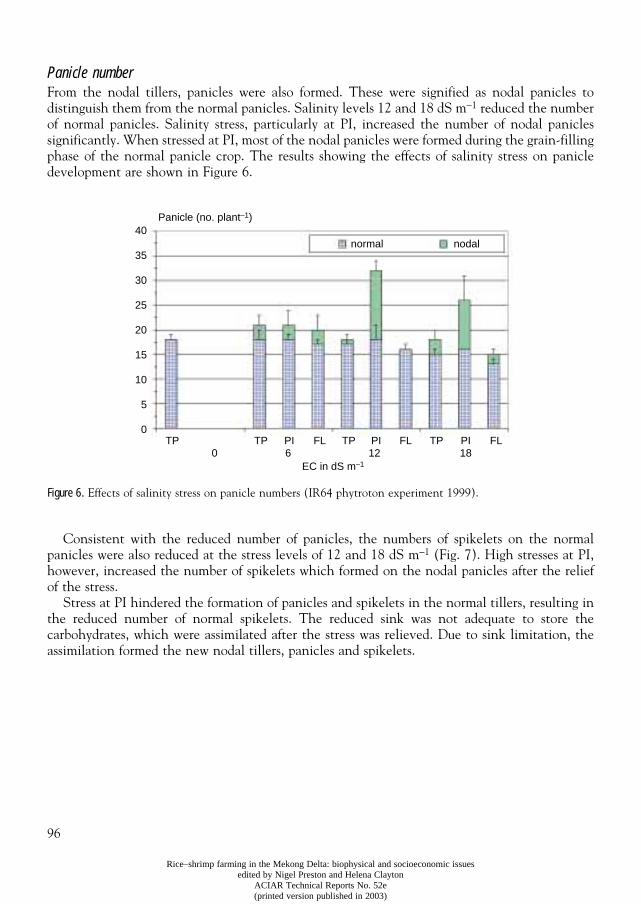
96
Rice–shrimp farming in the Mekong Delta: biophysical and socioeconomic issuesedited by Nigel Preston and Helena Clayton
ACIAR Technical Reports No. 52e(printed version published in 2003)
Panicle numberFrom the nodal tillers, panicles were also formed. These were signified as nodal panicles todistinguish them from the normal panicles. Salinity levels 12 and 18 dS m−1 reduced the numberof normal panicles. Salinity stress, particularly at PI, increased the number of nodal paniclessignificantly. When stressed at PI, most of the nodal panicles were formed during the grain-fillingphase of the normal panicle crop. The results showing the effects of salinity stress on panicledevelopment are shown in Figure 6.
Figure 6. Effects of salinity stress on panicle numbers (IR64 phytroton experiment 1999).
Consistent with the reduced number of panicles, the numbers of spikelets on the normalpanicles were also reduced at the stress levels of 12 and 18 dS m−1 (Fig. 7). High stresses at PI,however, increased the number of spikelets which formed on the nodal panicles after the reliefof the stress.
Stress at PI hindered the formation of panicles and spikelets in the normal tillers, resulting inthe reduced number of normal spikelets. The reduced sink was not adequate to store thecarbohydrates, which were assimilated after the stress was relieved. Due to sink limitation, theassimilation formed the new nodal tillers, panicles and spikelets.
Panicle (no. plant−1)
normal nodal
EC in dS m−1
TP TP TP TPPI PI PIFL FL FL0 6 12 18
40
35
30
25
20
15
10
5
0
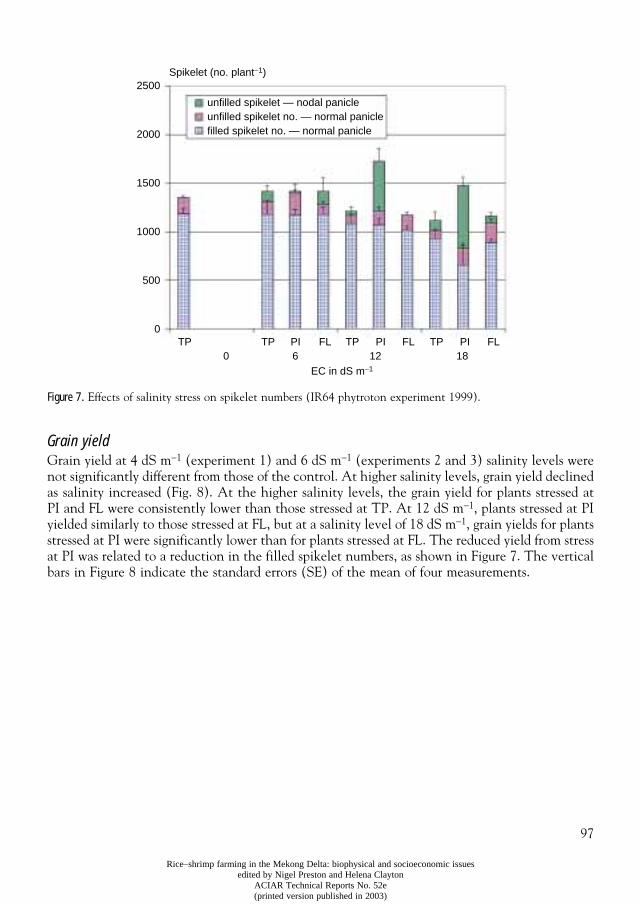
97
Rice–shrimp farming in the Mekong Delta: biophysical and socioeconomic issuesedited by Nigel Preston and Helena Clayton
ACIAR Technical Reports No. 52e(printed version published in 2003)
Figure 7. Effects of salinity stress on spikelet numbers (IR64 phytroton experiment 1999).
Grain yieldGrain yield at 4 dS m−1 (experiment 1) and 6 dS m−1 (experiments 2 and 3) salinity levels werenot significantly different from those of the control. At higher salinity levels, grain yield declinedas salinity increased (Fig. 8). At the higher salinity levels, the grain yield for plants stressed atPI and FL were consistently lower than those stressed at TP. At 12 dS m−1, plants stressed at PIyielded similarly to those stressed at FL, but at a salinity level of 18 dS m−1, grain yields for plantsstressed at PI were significantly lower than for plants stressed at FL. The reduced yield from stressat PI was related to a reduction in the filled spikelet numbers, as shown in Figure 7. The verticalbars in Figure 8 indicate the standard errors (SE) of the mean of four measurements.
Spikelet (no. plant−1)
unfilled spikelet — nodal panicleunfilled spikelet no. — normal paniclefilled spikelet no. — normal panicle
TP TP TP TPPI PI PIFL FL FL0 6 12 18
EC in dS m−1
2500
2000
1500
1000
500
0
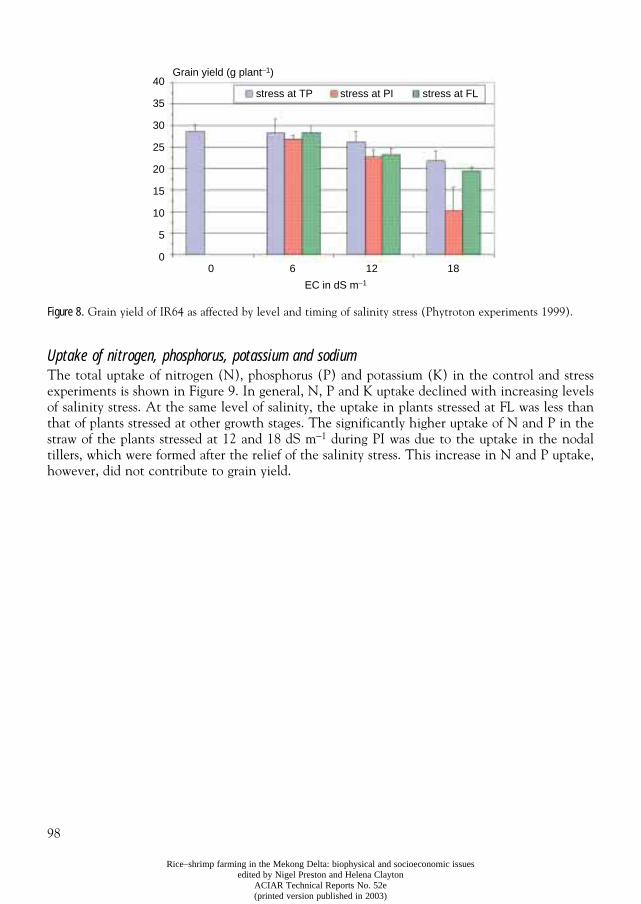
98
Rice–shrimp farming in the Mekong Delta: biophysical and socioeconomic issuesedited by Nigel Preston and Helena Clayton
ACIAR Technical Reports No. 52e(printed version published in 2003)
Figure 8. Grain yield of IR64 as affected by level and timing of salinity stress (Phytroton experiments 1999).
Uptake of nitrogen, phosphorus, potassium and sodiumThe total uptake of nitrogen (N), phosphorus (P) and potassium (K) in the control and stressexperiments is shown in Figure 9. In general, N, P and K uptake declined with increasing levelsof salinity stress. At the same level of salinity, the uptake in plants stressed at FL was less thanthat of plants stressed at other growth stages. The significantly higher uptake of N and P in thestraw of the plants stressed at 12 and 18 dS m−1 during PI was due to the uptake in the nodaltillers, which were formed after the relief of the salinity stress. This increase in N and P uptake,however, did not contribute to grain yield.
stress at TP stress at PI stress at FL
EC in dS m−1
Grain yield (g plant−1)
0 6 12 18
40
35
30
25
20
15
10
5
0
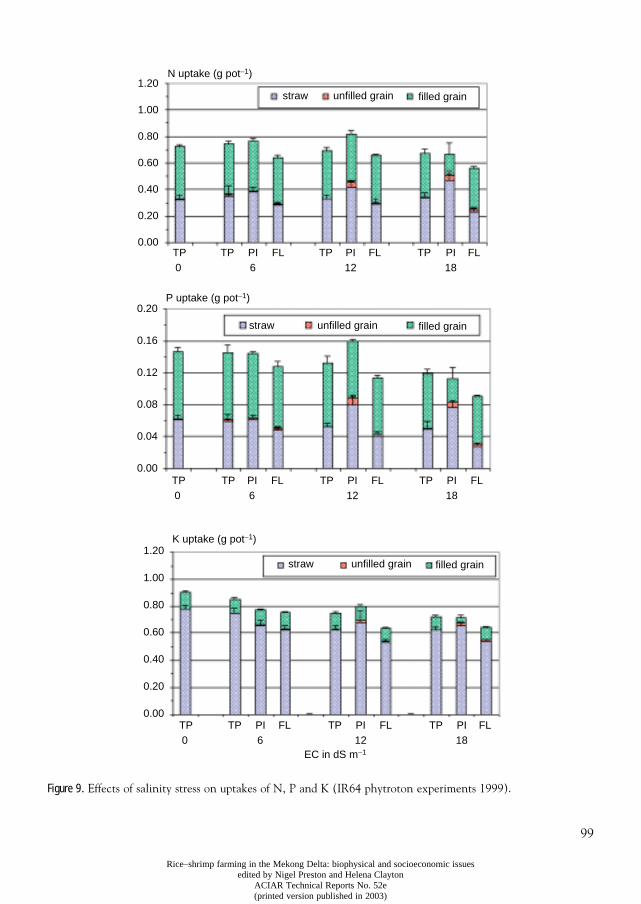
99
Rice–shrimp farming in the Mekong Delta: biophysical and socioeconomic issuesedited by Nigel Preston and Helena Clayton
ACIAR Technical Reports No. 52e(printed version published in 2003)
Figure 9. Effects of salinity stress on uptakes of N, P and K (IR64 phytroton experiments 1999).
N uptake (g pot−1)
straw unfilled grain filled grain
TP TP TP TPPI PI PIFL FL FL0 6 12 18
1.20
1.00
0.80
0.60
0.40
0.20
0.00
P uptake (g pot−1)
straw unfilled grain filled grain
TP TP TP TPPI PI PIFL FL FL0 6 12 18
0.20
0.16
0.12
0.08
0.04
0.00
K uptake (g pot−1)
straw unfilled grain filled grain
TP TP TP TPPI PI PIFL FL FL0 6 12 18
1.20
1.00
0.80
0.60
0.40
0.20
0.00
EC in dS m−1
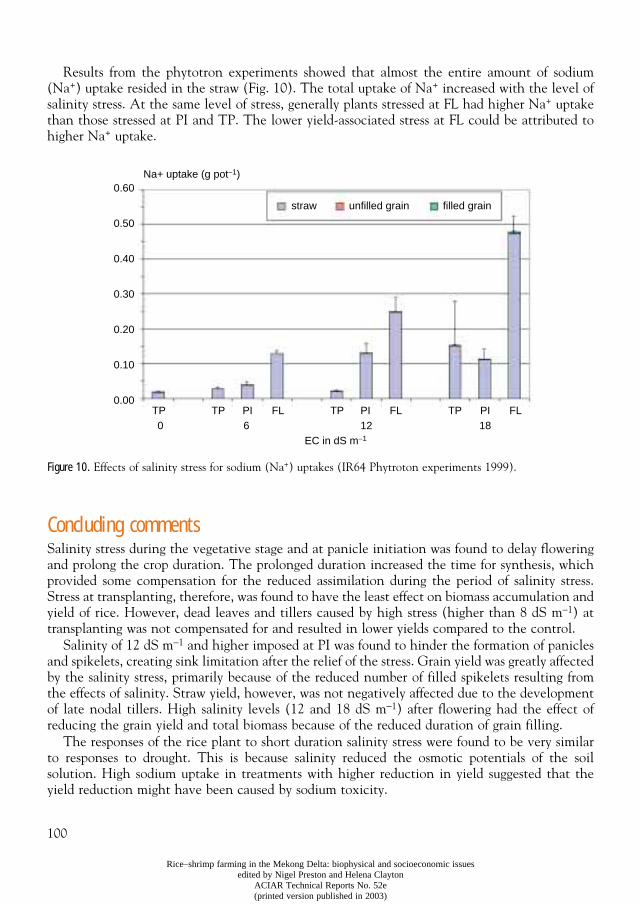
100
Rice–shrimp farming in the Mekong Delta: biophysical and socioeconomic issuesedited by Nigel Preston and Helena Clayton
ACIAR Technical Reports No. 52e(printed version published in 2003)
Results from the phytotron experiments showed that almost the entire amount of sodium(Na+) uptake resided in the straw (Fig. 10). The total uptake of Na+ increased with the level ofsalinity stress. At the same level of stress, generally plants stressed at FL had higher Na+ uptakethan those stressed at PI and TP. The lower yield-associated stress at FL could be attributed tohigher Na+ uptake.
Figure 10. Effects of salinity stress for sodium (Na+) uptakes (IR64 Phytroton experiments 1999).
Concluding commentsSalinity stress during the vegetative stage and at panicle initiation was found to delay floweringand prolong the crop duration. The prolonged duration increased the time for synthesis, whichprovided some compensation for the reduced assimilation during the period of salinity stress.Stress at transplanting, therefore, was found to have the least effect on biomass accumulation andyield of rice. However, dead leaves and tillers caused by high stress (higher than 8 dS m−1) attransplanting was not compensated for and resulted in lower yields compared to the control.
Salinity of 12 dS m−1 and higher imposed at PI was found to hinder the formation of paniclesand spikelets, creating sink limitation after the relief of the stress. Grain yield was greatly affectedby the salinity stress, primarily because of the reduced number of filled spikelets resulting fromthe effects of salinity. Straw yield, however, was not negatively affected due to the developmentof late nodal tillers. High salinity levels (12 and 18 dS m−1) after flowering had the effect ofreducing the grain yield and total biomass because of the reduced duration of grain filling.
The responses of the rice plant to short duration salinity stress were found to be very similarto responses to drought. This is because salinity reduced the osmotic potentials of the soilsolution. High sodium uptake in treatments with higher reduction in yield suggested that theyield reduction might have been caused by sodium toxicity.
Na+ uptake (g pot−1)
straw unfilled grain filled grain
TP TP TP TPPI PI PIFL FL FL0 6 12 18
EC in dS m−1
0.60
0.50
0.40
0.30
0.20
0.10
0.00
101
Rice–shrimp farming in the Mekong Delta: biophysical and socioeconomic issuesedited by Nigel Preston and Helena Clayton
ACIAR Technical Reports No. 52e(printed version published in 2003)
References Akbar, M. and Yabuno, T. 1974. Breeding for saline-resistant varieties for rice. II. Comparative performance of
some rice varieties to salinity during early development stage. Japanese Journal of Breeding, 24, 176–181.Alamgir, A.N.M., Baset, G.A. and Acharjee, J.S. 1989. Effect of salinity on growth, leaf pigments, nutrient
levels and yield attributes of rice (Oryza sativa L.). Chittagong Univ. Stud. Pt. II Sci., 13(1), 87–98.Aslam, M. 1987. Mechanism of salt tolerance in rice (Oryza sativa L.). Ph D. Thesis, Department of Soil
Science, University of Agriculture, Faisalabad, Pakistan.Azam, F. 1992. Alleviation of salt effects on flooded rice (Oryza sativa L.) by nitrogen fertilization. Pakistan
Journal of Scientific and Industrial Research, 35(5), 195–198.Dubey, R.S. and Sharma, N.K. 1989. Taga Acid and alkaline phosphatases in rice seedlings growing under
salinity stress. Indian Journal of Plant Physiology, 32(3), 217–223.Flowers, T.J. and Yeo, A.R. 1981. Variability in the resistance of sodium chloride salinity within rice (Oryza
sativa L.) New Phytologist, 88, 363–373.Khatun, S. and Flowers, T.J. 1994a. The estimation of pollen viability in rice. Journal of Experimental Botany,
46, 151–154.Khatun, S. and Flowers, T. J. 1994b. Effects of salinity on seed set in rice. Plant, Cell and Environment, 18, 61–67.Khatun, S., Rizzo, C.A. and Flowers, T.J. 1995. Genotypic variation in the effect of salinity on fertility in rice.
Plant Soil, 173, 239–250.O’Toole, J.C., Cruz, R.T. and Singh, T.N. 1979. Leaf rolling and transpiration Plant Science Letters, 16(1),
111–114.Pearson, G.A., Ayers, S.D. and Eberhard, D.L. 1966. Relative salt tolerance of rice during germination and early
seedling development. Soil Science, 102, 151–156.Yoshida, S., Forno, D.A., Cock, J.H. and Gomez, K.A. 1996. Laboratory manual for physiological studies of rice,
3rd edition. International Rice Research Institute. Los Banos, Laguna, Philippines.
102
Rice–shrimp farming in the Mekong Delta: biophysical and socioeconomic issuesedited by Nigel Preston and Helena Clayton
ACIAR Technical Reports No. 52e(printed version published in 2003)
CHAPTER 9
Assessing rice yield in rice–shrimp systems in theMekong Delta, Vietnam: a modelling approach
To Phuc Tuong
1
, Ngo Dang Phong
1,2
and B.A.M. Bouman
1
1
International Rice Research Institute, Los Baños, Laguna, Philippines.
2
College of Agriculture and Forestry, National University, Ho Chi Minh City, Vietnam.Email To Phuc Tuong: [email protected]
Abstract
The aim of this study was, by adapting the ORYZA2000 model, to quantify the response of riceto salinity stress and to quantify the yield variability in response to different sowing dates at thestudy sites of the ACIAR rice–shrimp project. The quantification of long-term rice yield inresponse to alternative management and salinity scenarios provides important information forselecting optimal rice-crop management options in rice–shrimp systems in the Mekong Delta. Inthe model it was hypothesised that the primary effect of salinity is similar to the water stress effectbecause salinity reduces the osmotic potential of the soil solution. The model converted the rootzone salinity into osmotic potential and calculated the total potential of the soil solution. Usingthe known crop response to reduced potential (i.e. drought stress), the ORYZA2000 modelcalculated the effects of salinity on phenological, morphological and physiological development,biomass accumulation and grain yield of rice. The validation of the simulation results using datafrom the controlled phytotron and greenhouse experiments found that the model is able tosimulate satisfactorily the effects of salinity on phenological development, biomass and yieldreduction of rice cv IR64. The model was also able to explain yield differences of IR64 found atdifferent locations from the rice variety field experiments conducted as part of the ACIARrice–shrimp project. Using 10-year climatic and root zone salinity data for My Xuyen and GiaRai, the model simulated the grain yields for different sowing dates (varying from 1 June to1 September) and compared them with yields under salinity-free conditions. The simulatedsalinity-free yields ranged from about 5 to 6.3 tonnes ha
−
1
(with mean values from 5.3 to5.8 tonnes ha
−
1
) at both My Xuyen and Gia Rai and declined slightly with late sowing dates. Thesimulated rice yield in rice–shrimp fields at My Xuyen ranged from 2.1 to 3.7 tonnes ha
−
1
and atGia Rai from 1.1 to 2.5 tonnes ha
−
1
. The simulated mean yields for My Xuyen (2.8 to 3 tonnesha
−
1
) did not change very much with the sowing dates. The results for Gia Rai suggest that thesowing date should be later than 1 August to avoid the risk of very low yield in years with lowrainfall and high salinity.
T
O
EVALUATE
THE
economics of the rice–shrimp system and compare it with other land uses, itis important to assess the effect of salinity on rice performance in the rice–shrimp system in theMekong Delta, Vietnam. Experiments can help evaluate the performance of rice in the system(Nguyen Ngoc De et al. this Report). Experiments are, however, site and time specific. It will beexpensive to repeat the experiments at many sites (with different salinity dynamics),corresponding to various management options (such as changing the transplanting date).Furthermore, experiments will have to be carried out in many years to capture the long-term
103
Rice–shrimp farming in the Mekong Delta: biophysical and socioeconomic issuesedited by Nigel Preston and Helena Clayton
ACIAR Technical Reports No. 52e(printed version published in 2003)
variation in rice yield in the saline-affected fields. The above difficulties can be overcome by asystems approach, using simulation models. Such an approach has been widely used to investigatethe long-term yields in highly variable rain-fed environments, and in response to variousmanagement options (Wopereis et al. 1995; Boling et al. 1999).
Previous researchers have attempted to use models to simulate the salinity effect on rice yield.Most earlier researchers (e.g. Walker et al. 1993; Singh et al. 1996) used the simple relationshipthat rice yield was not affected if the soil salinity was below a threshold value, and linearlydecreased with salinity when it exceeded the threshold value. More sophisticated modellingapproaches (e.g. Grand 1995; Beltrao and Asher 1997) used for other crops have not beendeveloped for rice. Furthermore, most simulation studies for rice have assumed a constant salinitythroughout the cropping season. Such conditions do not exist in the rice–shrimp fields in thecoastal area of the Mekong Delta (Phong et al. this Report). The variation in salinity stressthroughout the growing season and the variation in physiological response to salinity at differentgrowth stages imply that we need a model that can predict rice performance (development,growth and yield) in response to the variable salinity in the rice–shrimp fields of the MekongDelta.
The aim of this study was to adapt the ORYZA2000 model (Bouman et al. 2001) forsimulating the effects of varying levels of salinity stress on the growth and development of ricecrop and to use the model to assess the effect of the transplant date on long term rice yield inrice–shrimp fields in My Xuyen and Gia Rai in the Mekong Delta, Vietnam.
Materials and methods
Simulation approach
Salinity reduces the soil osmotic potential (Chhabra 1996) and therefore reduces wateravailability for crops. One of the primary effects of increased salinity in the root zone is thus thewater stress, similar to the drought effects (Grant 1995). We hypothesised that salinity effects ongrowth of rice can be simulated by the same water stress functions relating the crop growth anddevelopment to reduced soil potential (Wopereis et al. 1996b; Tuong et al. 1996).
The ORYZA2000 model
ORYZA2000 (Bouman et al. 2001) is an updated and integrated version of the ecophysiologicalmodels ORYZA1 (Kropff et al. 1994) and ORYZA_W (Wopereis et al 1996a). ORYZA2000simulates crop growth and development of lowland rice in potential and water-limitedproduction situations. Under potential situations, water and nutrients are in ample supply andgrowth rates are determined by weather conditions only (radiation and temperature). Underwater-limited production, growth is limited by water shortage in at least part of the growingperiod, but nutrients are still considered to be in ample supply.
ORYZA2000 consists of separate modules to calculate growth and development of the crop,evapotranspiration and effects of reduced soil potential (water stress) on growth anddevelopment. The crop module is a photosynthesis-driven model with daily time step. The dailycanopy assimilation rate is calculated by integrating the calculated photosynthesis of single leavesover the height of the canopy and over the day. After subtracting respiration requirements andaccounting for losses from the conversion of carbohydrates into structural dry matter, the netdaily growth rate is obtained. The dry matter produced is partitioned among the various plant
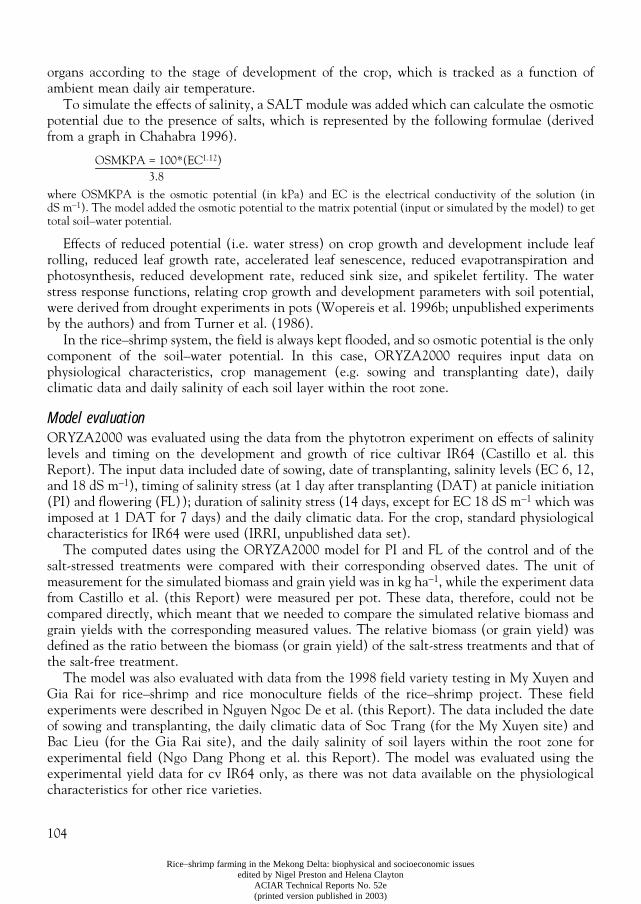
104
Rice–shrimp farming in the Mekong Delta: biophysical and socioeconomic issuesedited by Nigel Preston and Helena Clayton
ACIAR Technical Reports No. 52e(printed version published in 2003)
organs according to the stage of development of the crop, which is tracked as a function ofambient mean daily air temperature.
To simulate the effects of salinity, a SALT module was added which can calculate the osmoticpotential due to the presence of salts, which is represented by the following formulae (derivedfrom a graph in Chahabra 1996).
OSMKPA = 100*(EC
1.12
)3.8
where OSMKPA is the osmotic potential (in kPa) and EC is the electrical conductivity of the solution (indS m
−
1
). The model added the osmotic potential to the matrix potential (input or simulated by the model) to gettotal soil–water potential.
Effects of reduced potential (i.e. water stress) on crop growth and development include leafrolling, reduced leaf growth rate, accelerated leaf senescence, reduced evapotranspiration andphotosynthesis, reduced development rate, reduced sink size, and spikelet fertility. The waterstress response functions, relating crop growth and development parameters with soil potential,were derived from drought experiments in pots (Wopereis et al. 1996b; unpublished experimentsby the authors) and from Turner et al. (1986).
In the rice–shrimp system, the field is always kept flooded, and so osmotic potential is the onlycomponent of the soil–water potential. In this case, ORYZA2000 requires input data onphysiological characteristics, crop management (e.g. sowing and transplanting date), dailyclimatic data and daily salinity of each soil layer within the root zone.
Model evaluation
ORYZA2000 was evaluated using the data from the phytotron experiment on effects of salinitylevels and timing on the development and growth of rice cultivar IR64 (Castillo et al. thisReport). The input data included date of sowing, date of transplanting, salinity levels (EC 6, 12,and 18 dS m
−
1
), timing of salinity stress (at 1 day after transplanting (DAT) at panicle initiation(PI) and flowering (FL)); duration of salinity stress (14 days, except for EC 18 dS m
−
1
which wasimposed at 1 DAT for 7 days) and the daily climatic data. For the crop, standard physiologicalcharacteristics for IR64 were used (IRRI, unpublished data set).
The computed dates using the ORYZA2000 model for PI and FL of the control and of thesalt-stressed treatments were compared with their corresponding observed dates. The unit ofmeasurement for the simulated biomass and grain yield was in kg ha
−
1
, while the experiment datafrom Castillo et al. (this Report) were measured per pot. These data, therefore, could not becompared directly, which meant that we needed to compare the simulated relative biomass andgrain yields with the corresponding measured values. The relative biomass (or grain yield) wasdefined as the ratio between the biomass (or grain yield) of the salt-stress treatments and that ofthe salt-free treatment.
The model was also evaluated with data from the 1998 field variety testing in My Xuyen andGia Rai for rice–shrimp and rice monoculture fields of the rice–shrimp project. These fieldexperiments were described in Nguyen Ngoc De et al. (this Report). The data included the dateof sowing and transplanting, the daily climatic data of Soc Trang (for the My Xuyen site) andBac Lieu (for the Gia Rai site), and the daily salinity of soil layers within the root zone forexperimental field (Ngo Dang Phong et al. this Report). The model was evaluated using theexperimental yield data for cv IR64 only, as there was not data available on the physiologicalcharacteristics for other rice varieties.
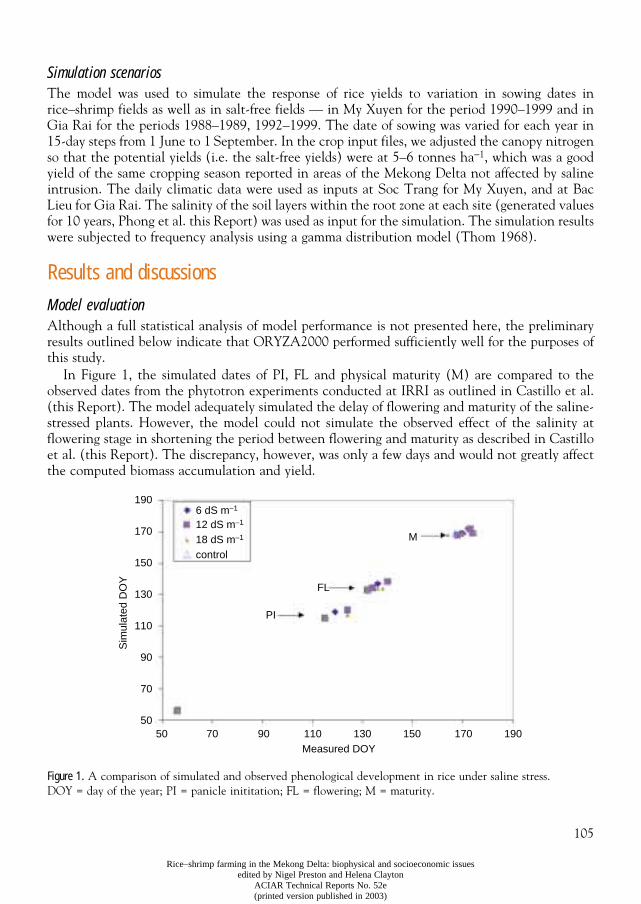
105
Rice–shrimp farming in the Mekong Delta: biophysical and socioeconomic issuesedited by Nigel Preston and Helena Clayton
ACIAR Technical Reports No. 52e(printed version published in 2003)
Simulation scenarios
The model was used to simulate the response of rice yields to variation in sowing dates inrice–shrimp fields as well as in salt-free fields — in My Xuyen for the period 1990–1999 and inGia Rai for the periods 1988–1989, 1992–1999. The date of sowing was varied for each year in15-day steps from 1 June to 1
September. In the crop input files, we adjusted the canopy nitrogenso that the potential yields (i.e. the salt-free yields) were at 5–6 tonnes ha
−
1
, which was a goodyield of the same cropping season reported in areas of the Mekong Delta not affected by salineintrusion. The daily climatic data were used as inputs at Soc Trang for My Xuyen, and at BacLieu for Gia Rai. The salinity of the soil layers within the root zone at each site (generated valuesfor 10 years, Phong et al. this Report) was used as input for the simulation. The simulation resultswere subjected to frequency analysis using a gamma distribution model (Thom 1968).
Results and discussions
Model evaluation
Although a full statistical analysis of model performance is not presented here, the preliminaryresults outlined below indicate that ORYZA2000 performed sufficiently well for the purposes ofthis study.
In Figure 1, the simulated dates of PI, FL and physical maturity (M) are compared to theobserved dates from the phytotron experiments conducted at IRRI as outlined in Castillo et al.(this Report). The model adequately simulated the delay of flowering and maturity of the saline-stressed plants. However, the model could not simulate the observed effect of the salinity atflowering stage in shortening the period between flowering and maturity as described in Castilloet al. (this Report). The discrepancy, however, was only a few days and would not greatly affectthe computed biomass accumulation and yield.
Figure 1.
A comparison of simulated and observed phenological development in rice under saline stress. DOY = day of the year; PI = panicle inititation; FL = flowering; M = maturity.
Measured DOY
6 dS m−1
12 dS m−1
18 dS m−1
control
50 70 90 110 130 150 170 190
M
FL
PI
Sim
ulat
ed D
OY
190
170
150
130
110
90
70
50
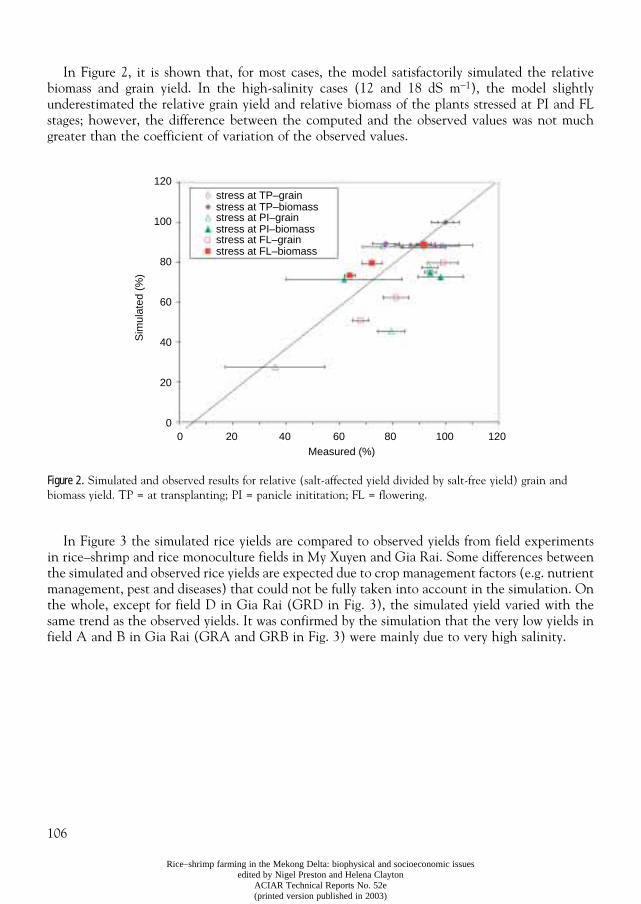
106
Rice–shrimp farming in the Mekong Delta: biophysical and socioeconomic issuesedited by Nigel Preston and Helena Clayton
ACIAR Technical Reports No. 52e(printed version published in 2003)
In Figure 2, it is shown that, for most cases, the model satisfactorily simulated the relativebiomass and grain yield. In the high-salinity cases (12 and 18 dS m
−
1
), the model slightlyunderestimated the relative grain yield and relative biomass of the plants stressed at PI and FLstages; however, the difference between the computed and the observed values was not muchgreater than the coefficient of variation of the observed values.
Figure 2.
Simulated and observed results for relative (salt-affected yield divided by salt-free yield) grain and biomass yield. TP = at transplanting; PI = panicle inititation; FL = flowering.
In Figure 3 the simulated rice yields are compared to observed yields from field experimentsin rice–shrimp and rice monoculture fields in My Xuyen and Gia Rai. Some differences betweenthe simulated and observed rice yields are expected due to crop management factors (e.g. nutrientmanagement, pest and diseases) that could not be fully taken into account in the simulation. Onthe whole, except for field D in Gia Rai (GRD in Fig. 3), the simulated yield varied with thesame trend as the observed yields. It was confirmed by the simulation that the very low yields infield A and B in Gia Rai (GRA and GRB in Fig. 3) were mainly due to very high salinity.
Sim
ulat
ed (
%)
stress at TP–grainstress at TP–biomassstress at PI–grainstress at PI–biomassstress at FL–grainstress at FL–biomass
Measured (%)0 20 40 60 80 100 120
120
100
80
60
40
20
0
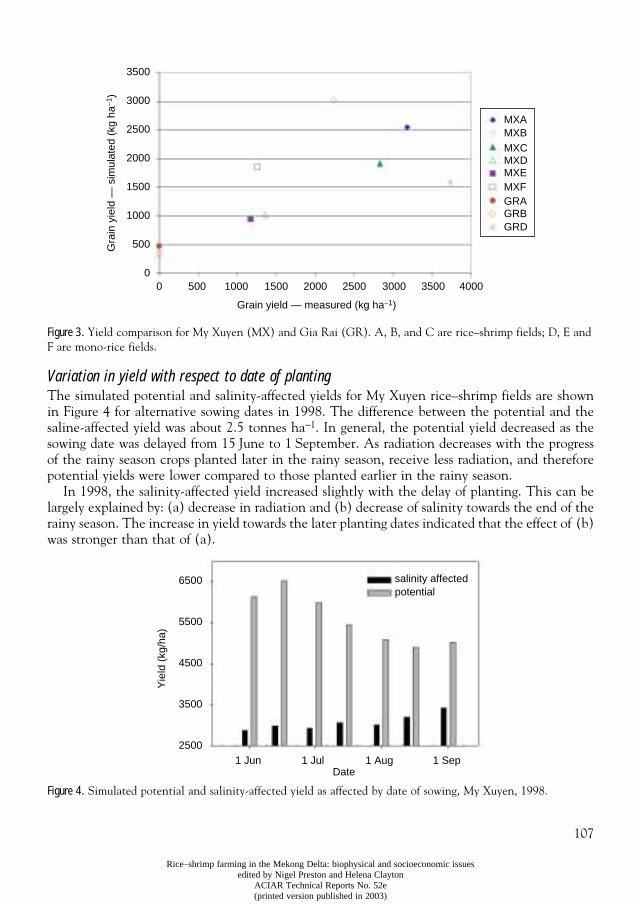
107
Rice–shrimp farming in the Mekong Delta: biophysical and socioeconomic issuesedited by Nigel Preston and Helena Clayton
ACIAR Technical Reports No. 52e(printed version published in 2003)
Figure 3.
Yield comparison for My Xuyen (MX) and Gia Rai (GR). A, B, and C are rice–shrimp fields; D, E and F are mono-rice fields.
Variation in yield with respect to date of planting
The simulated potential and salinity-affected yields for My Xuyen rice–shrimp fields are shownin Figure 4 for alternative sowing dates in 1998. The difference between the potential and thesaline-affected yield was about 2.5 tonnes ha
−
1
. In general, the potential yield decreased as thesowing date was delayed from 15
June to 1
September. As radiation decreases with the progressof the rainy season crops planted later in the rainy season, receive less radiation, and thereforepotential yields were lower compared to those planted earlier in the rainy season.
In 1998, the salinity-affected yield increased slightly with the delay of planting. This can belargely explained by: (a) decrease in radiation and (b) decrease of salinity towards the end of therainy season. The increase in yield towards the later planting dates indicated that the effect of (b)was stronger than that of (a).
Figure 4.
Simulated potential and salinity-affected yield as affected by date of sowing, My Xuyen, 1998.
Grain yield — measured (kg ha−1)
MXAMXBMXCMXDMXEMXFGRAGRBGRD
0 500 1000 1500 2000 2500 3000 3500 4000
Gra
in y
ield
— s
imul
ated
(kg
ha−1
)
3500
3000
2500
2000
1500
1000
500
0
salinity affectedpotential
Date1 Jun 1 Jul 1 Aug 1 Sep
Yie
ld (
kg/h
a)
6500
5500
4500
3500
2500
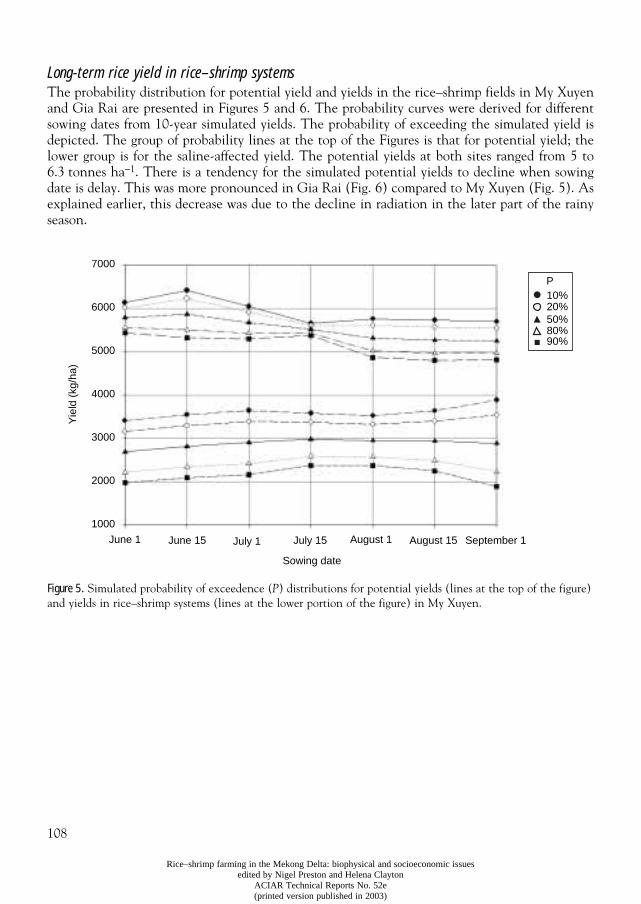
108
Rice–shrimp farming in the Mekong Delta: biophysical and socioeconomic issuesedited by Nigel Preston and Helena Clayton
ACIAR Technical Reports No. 52e(printed version published in 2003)
Long-term rice yield in rice–shrimp systems
The probability distribution for potential yield and yields in the rice–shrimp fields in My Xuyenand Gia Rai are presented in Figures 5 and 6. The probability curves were derived for differentsowing dates from 10-year simulated yields. The probability of exceeding the simulated yield isdepicted. The group of probability lines at the top of the Figures is that for potential yield; thelower group is for the saline-affected yield. The potential yields at both sites ranged from 5 to6.3 tonnes ha
−
1
. There is a tendency for the simulated potential yields to decline when sowingdate is delay. This was more pronounced in Gia Rai (Fig. 6) compared to My Xuyen (Fig. 5). Asexplained earlier, this decrease was due to the decline in radiation in the later part of the rainyseason.
Figure 5.
Simulated probability of exceedence (
P
) distributions for potential yields (lines at the top of the figure) and yields in rice–shrimp systems (lines at the lower portion of the figure) in My Xuyen.
P10%20%50%80%90%
June 1 June 15 July 1 July 15 August 1 August 15 September 1
Sowing date
Yie
ld (
kg/h
a)
7000
6000
5000
4000
3000
2000
1000
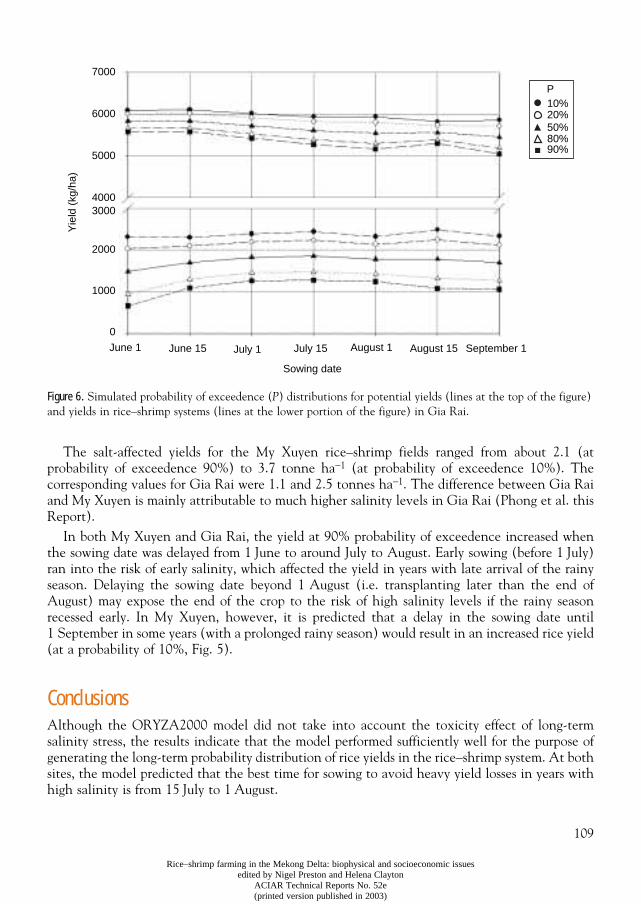
109
Rice–shrimp farming in the Mekong Delta: biophysical and socioeconomic issuesedited by Nigel Preston and Helena Clayton
ACIAR Technical Reports No. 52e(printed version published in 2003)
Figure 6.
Simulated probability of exceedence (
P
) distributions for potential yields (lines at the top of the figure) and yields in rice–shrimp systems (lines at the lower portion of the figure) in Gia Rai.
The salt-affected yields for the My Xuyen rice–shrimp fields ranged from about 2.1 (atprobability of exceedence 90%) to 3.7 tonne ha
−
1
(at probability of exceedence 10%). Thecorresponding values for Gia Rai were 1.1 and 2.5 tonnes ha
−
1
. The difference between Gia Raiand My Xuyen is mainly attributable to much higher salinity levels in Gia Rai (Phong et al. thisReport).
In both My Xuyen and Gia Rai, the yield at 90% probability of exceedence increased whenthe sowing date was delayed from 1
June to around July to August. Early sowing (before 1
July)ran into the risk of early salinity, which affected the yield in years with late arrival of the rainyseason. Delaying the sowing date beyond 1
August (i.e. transplanting later than the end ofAugust) may expose the end of the crop to the risk of high salinity levels if the rainy seasonrecessed early. In My Xuyen, however, it is predicted that a delay in the sowing date until1 September in some years (with a prolonged rainy season) would result in an increased rice yield(at a probability of 10%, Fig. 5).
Conclusions
Although the ORYZA2000 model did not take into account the toxicity effect of long-termsalinity stress, the results indicate that the model performed sufficiently well for the purpose ofgenerating the long-term probability distribution of rice yields in the rice–shrimp system. At bothsites, the model predicted that the best time for sowing to avoid heavy yield losses in years withhigh salinity is from 15
July to 1
August.
P10%20%50%80%90%
June 1 June 15 July 1 July 15 August 1 August 15 September 1
Sowing date
Yie
ld (
kg/h
a)7000
6000
5000
40003000
2000
1000
0
110
Rice–shrimp farming in the Mekong Delta: biophysical and socioeconomic issuesedited by Nigel Preston and Helena Clayton
ACIAR Technical Reports No. 52e(printed version published in 2003)
The simulation results are valid only for the variety that the model was developed andevaluated for (cv. IR64) and for the locations where salinity data were measured or derived. Themethodology presented, however, was generic and is applicable for other varieties and locations.
References
Beltrao, J. and Asher, J.B. 1997. The effect of salinity on corn yield using the CERES-maize model. Irrigationand Drainage Systems, 11(1), 15–28.
Boling, A., Tuong, T.P., Bouman, B.A.M., Murty, M.V.R. and Jatmiko, S.Y. 1999. Effect of climate,agrohydrology, and management on rainfed rice production in Central Java, Indonesia: a modelling approach.In: Tuong, T.P., Kam, S.P., Wade, L., Pandey, S., Bouman, B.A.M., Hardy, B., eds. Characterizing andUnderstanding Rainfed Environments. Proceedings of the International Workshop on Characterizing andUnderstanding Rainfed Environments, 5–9 December 1999, Bali, Indonesia. Los Baños (Philippines),International Rice Research Institute, 57–74.
Bouman, B.A.M., Kropff, M.J., Tuong, T.P., Wopereis, M.C.S. and van Laar, H.H. 2001. ORYZA2000:Modeling Lowland Rice. Los Baños (Philippines), International Rice Research Institute, and Wageningen,Wageningen University and Research Centre.
Chhabra, R. 1996. Soil salinity and water quality. Brookfield, Vt.: A.A. Balkema.Grant, R.F. 1995. Salinity, water use and yield of maize: testing of the mathematical model ecosys. Plant and
Soil, 172(2), 309–322.Kropff, M.J., van Laar, H.H. and Matthews, R. 1994. ORYZA1, an ecophysiological model for irrigated rice
production. SARP Research Proceedings. Wageningen (The Netherlands), AB-DLO.Singh, C.S., Gupta, S.K. and Ram, S. 1996. Assessment and management of poor quality waters for crop
production: a simulation model (SWAM). Agricultural Water Management, 30(1), 25–40.Thom, H.C.S. 1968. Direct and inverse tables of the gamma distribution. US Department of Commerce.Tuong, T.P., Boling, A., Singh, A.K. and Wopereis, M.C.S. 1996. Transpiration of lowland rice in response to
drought. In Camp, C.R., Sadler, E.J. and Yoder, R.E., eds, Evaporation and Irrigation Scheduling. Proceedingsof the International Conference, November 3–6, San Antonio, Texas, American Society of AgriculturalEngineers, 1071–1077.
Turner, N.C., O’Toole, J.C., Cruz, R.T., Namuco, O.S. and Ahmad, S. 1986. Responses of seven diverse ricecultivars to water deficits. I. Stress development, canopy temperature, leaf rolling and growth. Field CropsResearch, 13, 257–271.
Walker, W.R., Prajamwong, S., Allen, R.G., Merkley, G.P., Pereira, L.S. (ed.), van den Broek, B.J. (ed.),Kabat, P. (ed.) and Allen, R.G. 1993. USU command area decision support model — CADSM.Crop-water-simulation models in practice: selected papers of the 2nd workshop. The Hague, Netherlands,15th Congress of the International Commission on Irrigation and Drainage (ICID) 1993, 231–271.
Wopereis, M.C.S, Tuong, T.P. and Kropff, M.J. 1995. Challenges and advances in simulation modeling ofrainfed lowland rice systems. In: Tuong, T.P., ed. Fragile lives in fragile ecosystems. Proceedings ofInternational Rice Research Conference, 13–17 February, 1995. Manila, International Rice ResearchInstitute.
Wopereis, M.C.S., Bouman, B.A.M., Tuong, T.P., Berge, H.F.M. and Kropff, M.J. ORYZA_W, 1996a. Ricegrowth model for irrigated and rainfed environments. Simulation and System Analysis for Rice ProductionProceedings. Wageningen University, Wageningen, Netherlands and International Rice Research Institute,Manila, Philippines. 159 pages.
Wopereis, M.C.S, Kropff, M.J. and Tuong, T.P
.
1996b. Drought responses of two lowland rice cultivars to soilwater status. Field Crops Research, 46, 21–39.
111
Rice–shrimp farming in the Mekong Delta: biophysical and socioeconomic issuesedited by Nigel Preston and Helena Clayton
ACIAR Technical Reports No. 52e(printed version published in 2003)
CHAPTER 10
Factors affecting farm financial risk: observations from a bioeconomic model
Donna Brennan
1
1
University of Sydney, Faculty of AgricultureEmail: [email protected]
Abstract
In this paper, a bioeconomic model is used to examine the consequences of risky shrimp yield onhousehold income. The model depicts the production and farm management characteristics ofthe farm household, and accounts for risky yield of shrimp and rice. The consequences ofdownside yield risk on income include reduced household consumption and low level of workingcapital to finance the subsequent season’s production. The model is used to calculate theprobability distribution of income for different scenarios, to illustrate the importance of variousfactors on farm household income risk. These factors include shrimp survival, shrimp-stockingdensity, income diversification and obtaining credit to supply working capital in the event of ashrimp-crop failure. Also examined are issues relating to the choice of species, such as mixedversus monodon-only systems, and alternatives to monodon. Results indicate that the choice ofstocking density, of whether to use credit and of whether to adopt recommended managementpractices depend on the circumstances of the individual farmer, including risk preferences, othersources of income and expected shrimp survival.
I
N
THIS
PAPER
, bioeconomic modelling tools are used to assess the impact of various factors onfarm financial risk and farm performance. Bioeconomic modelling involves mathematicalrepresentation of the physical and economic factors affecting farm income. These tools aregenerally used to provide economic assessment of farm management options, where therelationship between physical inputs and outputs are represented from underlying biophysicalmodels. These biophysical models can vary in their degree of sophistication from simple modelsof relationships based on ‘expert opinion’ to detailed mechanistic models of biophysical processes.Bioeconomic models generally use either optimisation techniques to solve to the ‘best farmmanagement choice’, or simulation techniques to assess the sensitivity of farm income to variousfarm management options. Simulation techniques are normally used where the emphasis is onincome risk, which is the case in this study.
The outline of the paper is as follows. First, the components of the bioeconomic model,including growth, survival and yield relationships, and farm management assumptions areoutlined. Then results of monte carlo simulations of farm income risk are presented, whichanalyse the effect of various factors on income risk. These factors include shrimp survival,shrimp-stocking density, income diversification and obtaining credit to supply working capital inthe event of a shrimp crop failure. Also examined are issues relating to the choice of species, suchas mixed versus monodon-only systems, and alternatives to monodon.
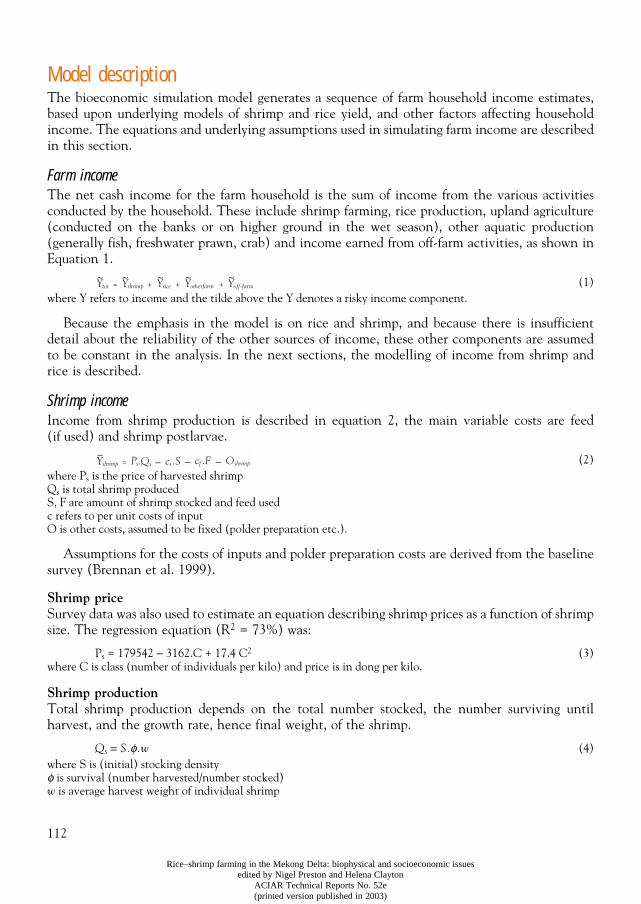
112
Rice–shrimp farming in the Mekong Delta: biophysical and socioeconomic issuesedited by Nigel Preston and Helena Clayton
ACIAR Technical Reports No. 52e(printed version published in 2003)
Model description
The bioeconomic simulation model generates a sequence of farm household income estimates,based upon underlying models of shrimp and rice yield, and other factors affecting householdincome. The equations and underlying assumptions used in simulating farm income are describedin this section.
Farm income
The net cash income for the farm household is the sum of income from the various activitiesconducted by the household. These include shrimp farming, rice production, upland agriculture(conducted on the banks or on higher ground in the wet season), other aquatic production(generally fish, freshwater prawn, crab) and income earned from off-farm activities, as shown inEquation 1.
(1)where Y refers to income and the tilde above the Y denotes a risky income component.
Because the emphasis in the model is on rice and shrimp, and because there is insufficientdetail about the reliability of the other sources of income, these other components are assumedto be constant in the analysis. In the next sections, the modelling of income from shrimp andrice is described.
Shrimp income
Income from shrimp production is described in equation 2, the main variable costs are feed(if used) and shrimp postlarvae.
(2)where P
s
is the price of harvested shrimpQ
s
is total shrimp producedS, F are amount of shrimp stocked and feed usedc refers to per unit costs of inputO is other costs, assumed to be fixed (polder preparation etc.).
Assumptions for the costs of inputs and polder preparation costs are derived from the baselinesurvey (Brennan et al. 1999).
Shrimp price
Survey data was also used to estimate an equation describing shrimp prices as a function of shrimpsize. The regression equation (R
2
= 73%) was:
P
s
= 179542
−
3162.C + 17.4 C
2
(3)where C is class (number of individuals per kilo) and price is in dong per kilo.
Shrimp production
Total shrimp production depends on the total number stocked, the number surviving untilharvest, and the growth rate, hence final weight, of the shrimp.
Q
s
= S.
φ
.w
(4)where S is (initial) stocking density
φ
is survival (number harvested/number stocked)
w
is average harvest weight of individual shrimp
Ytot~
= Yshrimp~
+ Yrice~
+ Yotherfarm~
+ Yoff-farm~
=Yshrimp~ Ps.Qs − cs.S − cf.F − Oshrimp
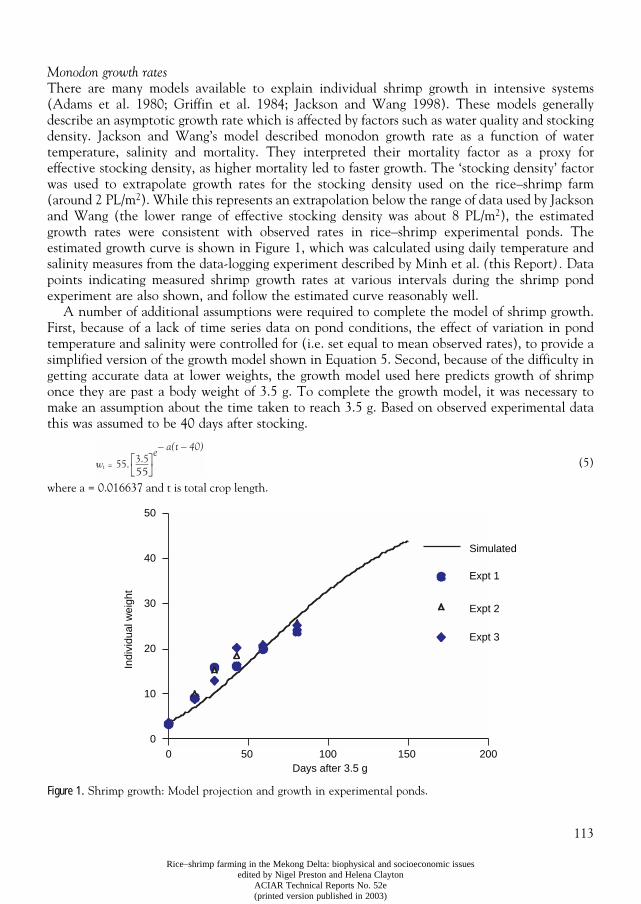
113
Rice–shrimp farming in the Mekong Delta: biophysical and socioeconomic issuesedited by Nigel Preston and Helena Clayton
ACIAR Technical Reports No. 52e(printed version published in 2003)
Monodon growth rates
There are many models available to explain individual shrimp growth in intensive systems(Adams et al. 1980; Griffin et al. 1984; Jackson and Wang 1998). These models generallydescribe an asymptotic growth rate which is affected by factors such as water quality and stockingdensity. Jackson and Wang’s model described monodon growth rate as a function of watertemperature, salinity and mortality. They interpreted their mortality factor as a proxy foreffective stocking density, as higher mortality led to faster growth. The ‘stocking density’ factorwas used to extrapolate growth rates for the stocking density used on the rice–shrimp farm(around 2 PL/m
2
). While this represents an extrapolation below the range of data used by Jacksonand Wang (the lower range of effective stocking density was about 8 PL/m
2
), the estimatedgrowth rates were consistent with observed rates in rice–shrimp experimental ponds. Theestimated growth curve is shown in Figure 1, which was calculated using daily temperature andsalinity measures from the data-logging experiment described by Minh et al.
(
this Report
).
Datapoints indicating measured shrimp growth rates at various intervals during the shrimp pondexperiment are also shown, and follow the estimated curve reasonably well.
A number of additional assumptions were required to complete the model of shrimp growth.First, because of a lack of time series data on pond conditions, the effect of variation in pondtemperature and salinity were controlled for (i.e. set equal to mean observed rates), to provide asimplified version of the growth model shown in Equation 5. Second, because of the difficulty ingetting accurate data at lower weights, the growth model used here predicts growth of shrimponce they are past a body weight of 3.5 g. To complete the growth model, it was necessary tomake an assumption about the time taken to reach 3.5 g. Based on observed experimental datathis was assumed to be 40 days after stocking.
(5)
where a = 0.016637 and t is total crop length.
Figure 1.
Shrimp growth: Model projection and growth in experimental ponds.
=wt 55. 3.5__55
e− a(t − 40)
Simulated
Expt 1
Expt 2
Expt 3
Days after 3.5 g
Indi
vidu
al w
eigh
t
0 50 100 150 200
50
40
30
20
10
0
114
Rice–shrimp farming in the Mekong Delta: biophysical and socioeconomic issuesedited by Nigel Preston and Helena Clayton
ACIAR Technical Reports No. 52e(printed version published in 2003)
Survival
Poor shrimp survival is one of the main factors affecting income from shrimp production. Whilequantitative scientific evidence of the importance of various factors affecting shrimp survival isscant, animal health experts have developed ‘best management practice’ advice that summarisesthe current state of knowledge. The main cause of poor survival in Asian farming systems isbelieved to be disease, and one of the most devastating of these is white spot disease. White spotdisease has been verified as a problem in the Mekong Delta. Best management practices areaimed at reducing the pathogen load in the pond and reducing the expression of the disease bygrowing the shrimp under optimum environmental conditions.
The best opportunity for reducing pathogen load is to use new DNA-testing techniques thatcan test for the presence of the white spot virus. Withyachumnarnkul (1999) provided evidenceto support the reduced risk associated with exclusion of white-spot-infected postlarvae. In a studyof intensive shrimp ponds in Thailand, he found that only 5% of intensive ponds stocked withone-step PCR-positive postlarvae reached a profitable harvest, compared with 69% for pondsstocked with one-step PCR-negative postlarvae. In the longer term, such testing strategies willhelp to reduce the risk associated with shrimp stocking, but at present these technologies are notavailable to farmers in the Mekong Delta.
At present, technology for eliminating white spot from stocked shrimp is not widely availablein the Mekong Delta. However, even if it were possible to stock with disease-free shrimp, thereare other components to the ‘best management practice’ recommendations that need to beconsidered, which focus on reducing pathogen load from other sources. In particular, it isrecommended that intake of disease carriers (particularly other crustaceans) should be minimisedby appropriate management. Recommended practices aimed at reducing pathogen load arereduced water exchange and construction of fences to exclude crabs from the pond. However, itcan be noted that farmers rely quite significantly on diverse income sources as a means ofmanaging risk, and one important source of other income is the harvest of other crustaceans.This practice is not consistent with the ‘best management practice’ of minimising pathogen loadby removing other crustaceans. This issue is explored below in ‘Monodon production underquarantining strategies’.
Because of the lack of quantitative data on the effect of farm management on shrimp survivalin Mekong Delta conditions, survival in this analysis is treated as a random factor, outside controlof management. Survival in a particular season is obtained by taking a random number betweenzero and one and looking up the survival corresponding to an assumed cumulative probabilitydistribution. Observed cross-sectional data on shrimp survival from the 1997 farm survey wasused to represent the probability distribution of survival. Because of the significant differencebetween the performance of farms in My Xuyen and Gia Rai, these data are treated separately inthe analysis and used to represent relatively ‘good’ and ‘poor’ survival in different model runs.The probability distributions are shown in Table 1.
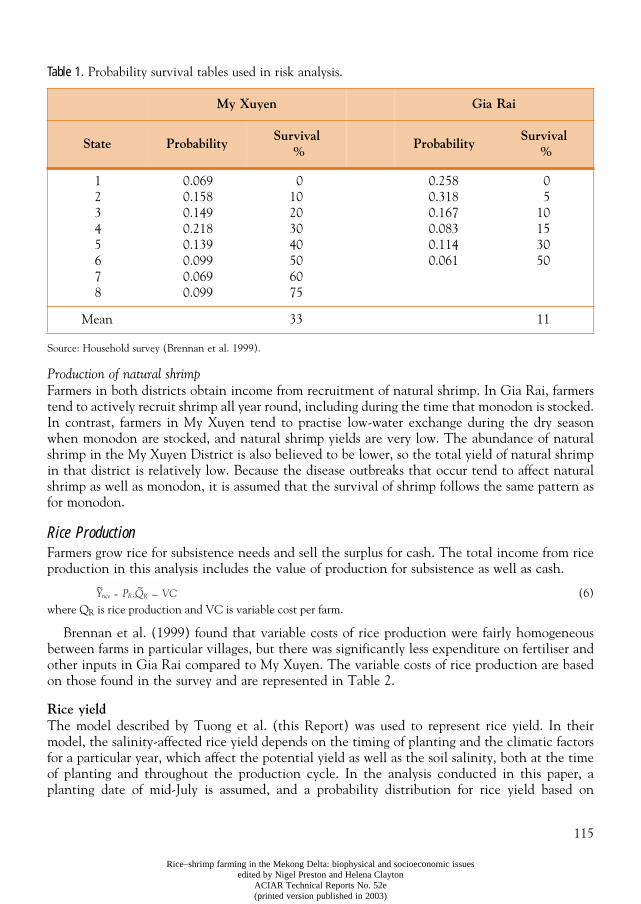
115
Rice–shrimp farming in the Mekong Delta: biophysical and socioeconomic issuesedited by Nigel Preston and Helena Clayton
ACIAR Technical Reports No. 52e(printed version published in 2003)
Table 1.
Probability survival tables used in risk analysis.
Source: Household survey (Brennan et al. 1999).
Production of natural shrimp
Farmers in both districts obtain income from recruitment of natural shrimp. In Gia Rai, farmerstend to actively recruit shrimp all year round, including during the time that monodon is stocked.In contrast, farmers in My Xuyen tend to practise low-water exchange during the dry seasonwhen monodon are stocked, and natural shrimp yields are very low. The abundance of naturalshrimp in the My Xuyen District is also believed to be lower, so the total yield of natural shrimpin that district is relatively low. Because the disease outbreaks that occur tend to affect naturalshrimp as well as monodon, it is assumed that the survival of shrimp follows the same pattern asfor monodon.
Rice Production
Farmers grow rice for subsistence needs and sell the surplus for cash. The total income from riceproduction in this analysis includes the value of production for subsistence as well as cash.
(6)where Q
R
is rice production and VC is variable cost per farm.
Brennan et al. (1999) found that variable costs of rice production were fairly homogeneousbetween farms in particular villages, but there was significantly less expenditure on fertiliser andother inputs in Gia Rai compared to My Xuyen. The variable costs of rice production are basedon those found in the survey and are represented in Table 2.
Rice yield
The model described by Tuong et al.
(this Report) was used to represent rice yield. In theirmodel, the salinity-affected rice yield depends on the timing of planting and the climatic factorsfor a particular year, which affect the potential yield as well as the soil salinity, both at the timeof planting and throughout the production cycle. In the analysis conducted in this paper, aplanting date of mid-July is assumed, and a probability distribution for rice yield based on
My Xuyen Gia Rai
State ProbabilitySurvival
%Probability
Survival %
12345678
0.0690.1580.1490.2180.1390.0990.0690.099
010203040506075
0.2580.3180.1670.0830.1140.061
05
10153050
Mean 33 11
=Yrice~ PR.QR − VC
~
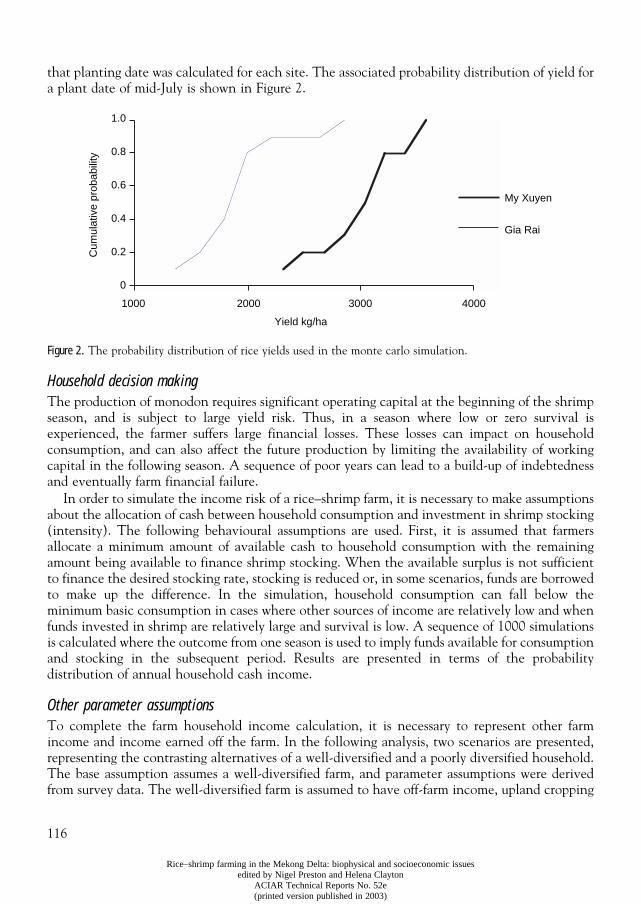
116
Rice–shrimp farming in the Mekong Delta: biophysical and socioeconomic issuesedited by Nigel Preston and Helena Clayton
ACIAR Technical Reports No. 52e(printed version published in 2003)
that planting date was calculated for each site. The associated probability distribution of yield fora plant date of mid-July is shown in Figure 2.
Figure 2.
The probability distribution of rice yields used in the monte carlo simulation.
Household decision making
The production of monodon requires significant operating capital at the beginning of the shrimpseason, and is subject to large yield risk. Thus, in a season where low or zero survival isexperienced, the farmer suffers large financial losses. These losses can impact on householdconsumption, and can also affect the future production by limiting the availability of workingcapital in the following season. A sequence of poor years can lead to a build-up of indebtednessand eventually farm financial failure.
In order to simulate the income risk of a rice–shrimp farm, it is necessary to make assumptionsabout the allocation of cash between household consumption and investment in shrimp stocking(intensity). The following behavioural assumptions are used. First, it is assumed that farmersallocate a minimum amount of available cash to household consumption with the remainingamount being available to finance shrimp stocking. When the available surplus is not sufficientto finance the desired stocking rate, stocking is reduced or, in some scenarios, funds are borrowedto make up the difference. In the simulation, household consumption can fall below theminimum basic consumption in cases where other sources of income are relatively low and whenfunds invested in shrimp are relatively large and survival is low. A sequence of 1000 simulationsis calculated where the outcome from one season is used to imply funds available for consumptionand stocking in the subsequent period. Results are presented in terms of the probabilitydistribution of annual household cash income.
Other parameter assumptions
To complete the farm household income calculation, it is necessary to represent other farmincome and income earned off the farm. In the following analysis, two scenarios are presented,representing the contrasting alternatives of a well-diversified and a poorly diversified household.The base assumption assumes a well-diversified farm, and parameter assumptions were derivedfrom survey data. The well-diversified farm is assumed to have off-farm income, upland cropping
Yield kg/ha
1000 2000 3000 4000
Cum
ulat
ive
prob
abili
ty
My Xuyen
Gia Rai
1.0
0.8
0.6
0.4
0.2
0
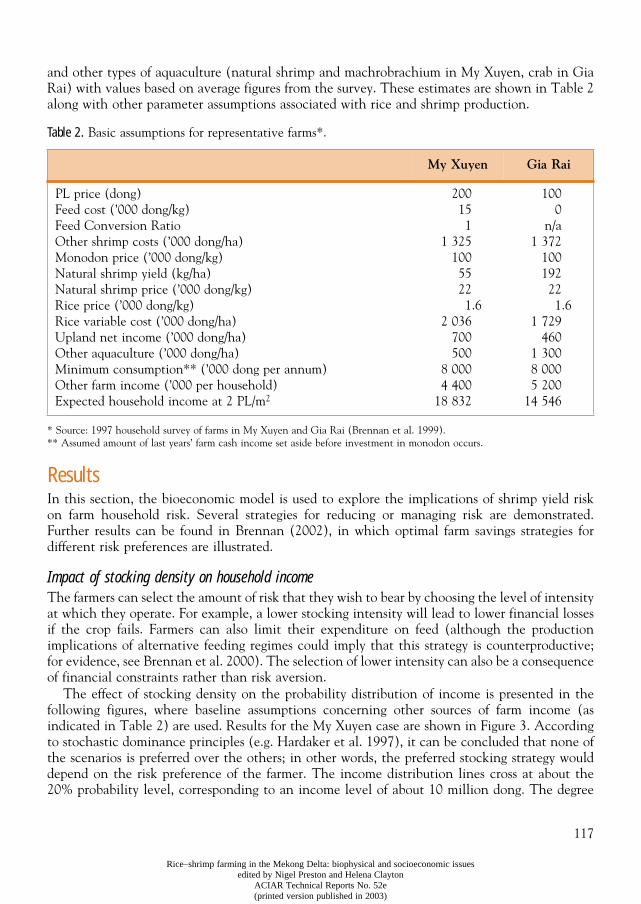
117
Rice–shrimp farming in the Mekong Delta: biophysical and socioeconomic issuesedited by Nigel Preston and Helena Clayton
ACIAR Technical Reports No. 52e(printed version published in 2003)
and other types of aquaculture (natural shrimp and machrobrachium in My Xuyen, crab in GiaRai) with values based on average figures from the survey. These estimates are shown in Table 2along with other parameter assumptions associated with rice and shrimp production.
Table 2.
Basic assumptions for representative farms*.
* Source: 1997 household survey of farms in My Xuyen and Gia Rai (Brennan et al. 1999).** Assumed amount of last years’ farm cash income set aside before investment in monodon occurs.
Results
In this section, the bioeconomic model is used to explore the implications of shrimp yield riskon farm household risk. Several strategies for reducing or managing risk are demonstrated.Further results can be found in Brennan (2002), in which optimal farm savings strategies fordifferent risk preferences are illustrated.
Impact of stocking density on household income
The farmers can select the amount of risk that they wish to bear by choosing the level of intensityat which they operate. For example, a lower stocking intensity will lead to lower financial lossesif the crop fails. Farmers can also limit their expenditure on feed (although the productionimplications of alternative feeding regimes could imply that this strategy is counterproductive;for evidence, see Brennan et al.
2000). The selection of lower intensity can also be a consequenceof financial constraints rather than risk aversion.
The effect of stocking density on the probability distribution of income is presented in thefollowing figures, where baseline assumptions concerning other sources of farm income (asindicated in Table 2) are used. Results for the My Xuyen case are shown in Figure 3. Accordingto stochastic dominance principles (e.g. Hardaker et al. 1997), it can be concluded that none ofthe scenarios is preferred over the others; in other words, the preferred stocking strategy woulddepend on the risk preference of the farmer. The income distribution lines cross at about the20% probability level, corresponding to an income level of about 10 million dong. The degree
My Xuyen Gia Rai
PL price (dong)Feed cost (’000 dong/kg)Feed Conversion RatioOther shrimp costs (’000 dong/ha)Monodon price (’000 dong/kg)Natural shrimp yield (kg/ha)Natural shrimp price (’000 dong/kg)Rice price (’000 dong/kg)Rice variable cost (’000 dong/ha)Upland net income (’000 dong/ha)Other aquaculture (’000 dong/ha)Minimum consumption** (’000 dong per annum)Other farm income (’000 per household)Expected household income at 2 PL/m
2
200151
1 32510055221.6
2 036700500
8 0004 400
18 832
1000
n/a1 372
100192221.6
1 729460
1 3008 0005 200
14 546
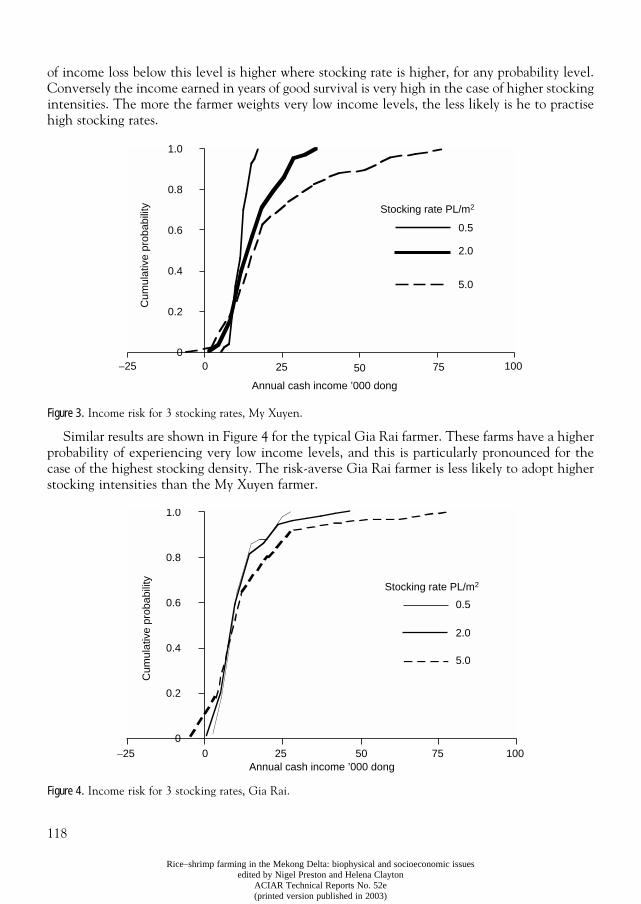
118
Rice–shrimp farming in the Mekong Delta: biophysical and socioeconomic issuesedited by Nigel Preston and Helena Clayton
ACIAR Technical Reports No. 52e(printed version published in 2003)
of income loss below this level is higher where stocking rate is higher, for any probability level.Conversely the income earned in years of good survival is very high in the case of higher stockingintensities. The more the farmer weights very low income levels, the less likely is he to practisehigh stocking rates.
Figure 3.
Income risk for 3 stocking rates, My Xuyen.
Similar results are shown in Figure 4 for the typical Gia Rai farmer. These farms have a higherprobability of experiencing very low income levels, and this is particularly pronounced for thecase of the highest stocking density. The risk-averse Gia Rai farmer is less likely to adopt higherstocking intensities than the My Xuyen farmer.
Figure 4.
Income risk for 3 stocking rates, Gia Rai.
Stocking rate PL/m2
0.5
2.0
5.0
−25 0 25 50 75 100
Annual cash income ’000 dong
Cum
ulat
ive
prob
abili
ty1.0
0.8
0.6
0.4
0.2
0
Stocking rate PL/m2
0.5
2.0
5.0
Annual cash income ’000 dong−25 0 25 50 75 100
Cum
ulat
ive
prob
abili
ty
1.0
0.8
0.6
0.4
0.2
0
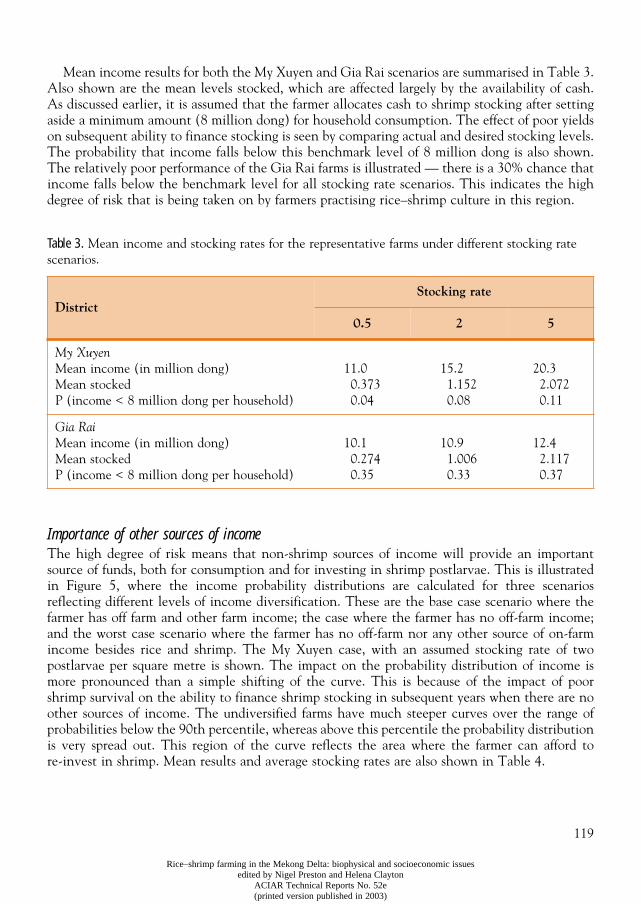
119
Rice–shrimp farming in the Mekong Delta: biophysical and socioeconomic issuesedited by Nigel Preston and Helena Clayton
ACIAR Technical Reports No. 52e(printed version published in 2003)
Mean income results for both the My Xuyen and Gia Rai scenarios are summarised in Table 3.Also shown are the mean levels stocked, which are affected largely by the availability of cash.As discussed earlier, it is assumed that the farmer allocates cash to shrimp stocking after settingaside a minimum amount (8 million dong) for household consumption. The effect of poor yieldson subsequent ability to finance stocking is seen by comparing actual and desired stocking levels.The probability that income falls below this benchmark level of 8 million dong is also shown.The relatively poor performance of the Gia Rai farms is illustrated — there is a 30% chance thatincome falls below the benchmark level for all stocking rate scenarios. This indicates the highdegree of risk that is being taken on by farmers practising rice–shrimp culture in this region.
Table 3.
Mean income and stocking rates for the representative farms under different stocking rate scenarios.
Importance of other sources of income
The high degree of risk means that non-shrimp sources of income will provide an importantsource of funds, both for consumption and for investing in shrimp postlarvae. This is illustratedin Figure 5, where the income probability distributions are calculated for three scenariosreflecting different levels of income diversification. These are the base case scenario where thefarmer has off farm and other farm income; the case where the farmer has no off-farm income;and the worst case scenario where the farmer has no off-farm nor any other source of on-farmincome besides rice and shrimp. The My Xuyen case, with an assumed stocking rate of twopostlarvae per square metre is shown. The impact on the probability distribution of income ismore pronounced than a simple shifting of the curve. This is because of the impact of poorshrimp survival on the ability to finance shrimp stocking in subsequent years when there are noother sources of income. The undiversified farms have much steeper curves over the range ofprobabilities below the 90th percentile, whereas above this percentile the probability distributionis very spread out. This region of the curve reflects the area where the farmer can afford tore-invest in shrimp. Mean results and average stocking rates are also shown in Table 4.
DistrictStocking rate
0.5 2 5
My Xuyen
Mean income (in million dong)Mean stocked P (income < 8 million dong per household)
11.00.3730.04
15.21.1520.08
20.32.0720.11
Gia Rai
Mean income (in million dong)Mean stockedP (income < 8 million dong per household)
10.10.2740.35
10.91.0060.33
12.42.1170.37
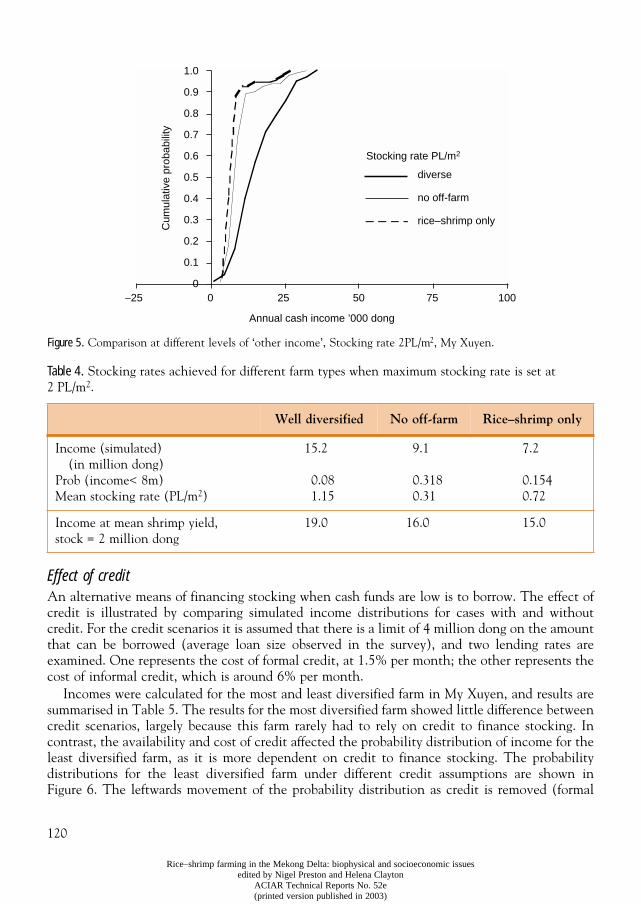
120
Rice–shrimp farming in the Mekong Delta: biophysical and socioeconomic issuesedited by Nigel Preston and Helena Clayton
ACIAR Technical Reports No. 52e(printed version published in 2003)
Figure 5.
Comparison at different levels of ‘other income’, Stocking rate 2PL/m
2
, My Xuyen.
Table 4.
Stocking rates achieved for different farm types when maximum stocking rate is set at 2 PL/m
2
.
Effect of credit
An alternative means of financing stocking when cash funds are low is to borrow. The effect ofcredit is illustrated by comparing simulated income distributions for cases with and withoutcredit. For the credit scenarios it is assumed that there is a limit of 4 million dong on the amountthat can be borrowed (average loan size observed in the survey), and two lending rates areexamined. One represents the cost of formal credit, at 1.5% per month; the other represents thecost of informal credit, which is around 6% per month.
Incomes were calculated for the most and least diversified farm in My Xuyen, and results aresummarised in Table 5. The results for the most diversified farm showed little difference betweencredit scenarios, largely because this farm rarely had to rely on credit to finance stocking. Incontrast, the availability and cost of credit affected the probability distribution of income for theleast diversified farm, as it is more dependent on credit to finance stocking. The probabilitydistributions for the least diversified farm under different credit assumptions are shown inFigure 6. The leftwards movement of the probability distribution as credit is removed (formal
Well diversified No off-farm Rice–shrimp only
Income (simulated) (in million dong)
Prob (income< 8m)Mean stocking rate (PL/m
2
)
15.2
0.081.15
9.1
0.3180.31
7.2
0.1540.72
Income at mean shrimp yield, stock = 2 million dong
19.0 16.0 15.0
Stocking rate PL/m2
diverse
no off-farm
rice–shrimp only
Annual cash income ’000 dong
−25 0 25 50 75 100
Cum
ulat
ive
prob
abili
ty
1.0
0.9
0.8
0.7
0.6
0.5
0.4
0.3
0.2
0.1
0
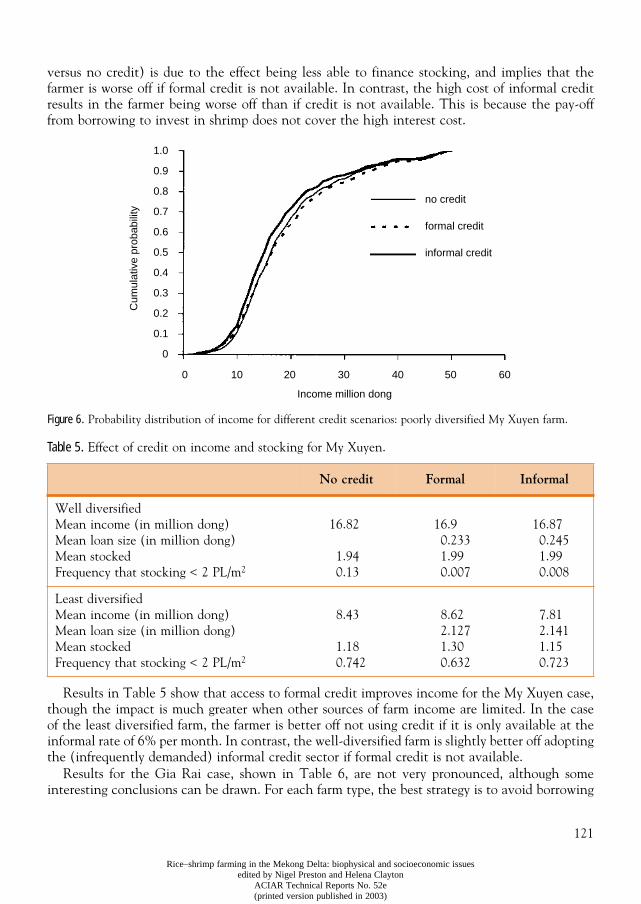
121
Rice–shrimp farming in the Mekong Delta: biophysical and socioeconomic issuesedited by Nigel Preston and Helena Clayton
ACIAR Technical Reports No. 52e(printed version published in 2003)
versus no credit) is due to the effect being less able to finance stocking, and implies that thefarmer is worse off if formal credit is not available. In contrast, the high cost of informal creditresults in the farmer being worse off than if credit is not available. This is because the pay-offfrom borrowing to invest in shrimp does not cover the high interest cost.
Figure 6.
Probability distribution of income for different credit scenarios: poorly diversified My Xuyen farm.
Table 5.
Effect of credit on income and stocking for My Xuyen.
Results in Table 5 show that access to formal credit improves income for the My Xuyen case,though the impact is much greater when other sources of farm income are limited. In the caseof the least diversified farm, the farmer is better off not using credit if it is only available at theinformal rate of 6% per month. In contrast, the well-diversified farm is slightly better off adoptingthe (infrequently demanded) informal credit sector if formal credit is not available.
Results for the Gia Rai case, shown in Table 6, are not very pronounced, although someinteresting conclusions can be drawn. For each farm type, the best strategy is to avoid borrowing
No credit Formal Informal
Well diversifiedMean income (in million dong)Mean loan size (in million dong)Mean stockedFrequency that stocking < 2 PL/m
2
16.82
1.940.13
16.90.2331.990.007
16.870.2451.990.008
Least diversifiedMean income (in million dong)Mean loan size (in million dong)Mean stockedFrequency that stocking < 2 PL/m
2
8.43
1.180.742
8.622.1271.300.632
7.812.1411.150.723
no credit
formal credit
informal credit
Cum
ulat
ive
prob
abili
ty
Income million dong
0 10 20 30 40 50 60
1.0
0.9
0.8
0.7
0.6
0.5
0.4
0.3
0.2
0.1
0
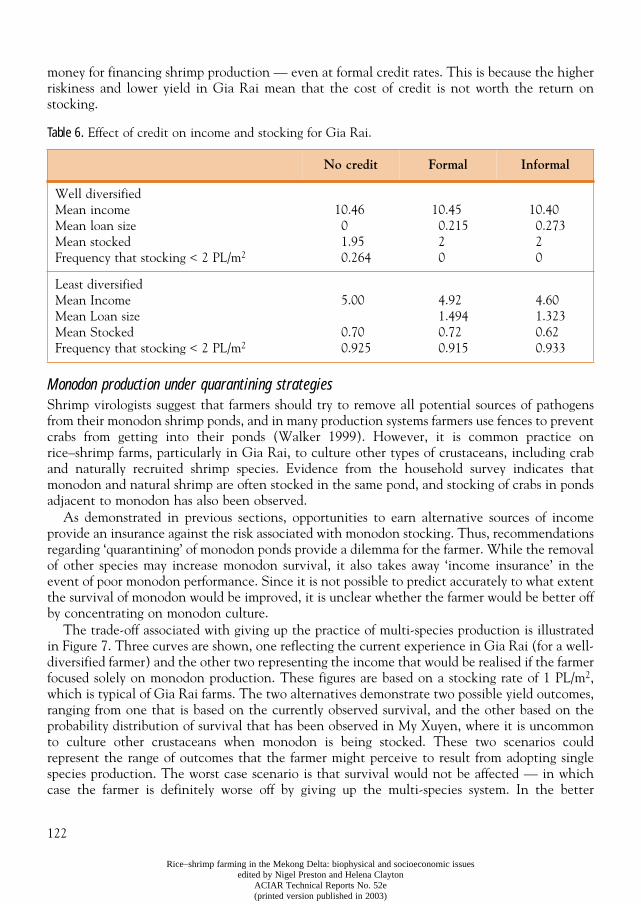
122
Rice–shrimp farming in the Mekong Delta: biophysical and socioeconomic issuesedited by Nigel Preston and Helena Clayton
ACIAR Technical Reports No. 52e(printed version published in 2003)
money for financing shrimp production — even at formal credit rates. This is because the higherriskiness and lower yield in Gia Rai mean that the cost of credit is not worth the return onstocking.
Table 6.
Effect of credit on income and stocking for Gia Rai.
Monodon production under quarantining strategiesShrimp virologists suggest that farmers should try to remove all potential sources of pathogensfrom their monodon shrimp ponds, and in many production systems farmers use fences to preventcrabs from getting into their ponds (Walker 1999). However, it is common practice onrice–shrimp farms, particularly in Gia Rai, to culture other types of crustaceans, including craband naturally recruited shrimp species. Evidence from the household survey indicates thatmonodon and natural shrimp are often stocked in the same pond, and stocking of crabs in pondsadjacent to monodon has also been observed.
As demonstrated in previous sections, opportunities to earn alternative sources of incomeprovide an insurance against the risk associated with monodon stocking. Thus, recommendationsregarding ‘quarantining’ of monodon ponds provide a dilemma for the farmer. While the removalof other species may increase monodon survival, it also takes away ‘income insurance’ in theevent of poor monodon performance. Since it is not possible to predict accurately to what extentthe survival of monodon would be improved, it is unclear whether the farmer would be better offby concentrating on monodon culture.
The trade-off associated with giving up the practice of multi-species production is illustratedin Figure 7. Three curves are shown, one reflecting the current experience in Gia Rai (for a well-diversified farmer) and the other two representing the income that would be realised if the farmerfocused solely on monodon production. These figures are based on a stocking rate of 1 PL/m2,which is typical of Gia Rai farms. The two alternatives demonstrate two possible yield outcomes,ranging from one that is based on the currently observed survival, and the other based on theprobability distribution of survival that has been observed in My Xuyen, where it is uncommonto culture other crustaceans when monodon is being stocked. These two scenarios couldrepresent the range of outcomes that the farmer might perceive to result from adopting singlespecies production. The worst case scenario is that survival would not be affected — in whichcase the farmer is definitely worse off by giving up the multi-species system. In the better
No credit Formal Informal
Well diversifiedMean incomeMean loan sizeMean stockedFrequency that stocking < 2 PL/m2
10.4601.950.264
10.450.21520
10.400.27320
Least diversifiedMean IncomeMean Loan sizeMean StockedFrequency that stocking < 2 PL/m2
5.00
0.700.925
4.921.4940.720.915
4.601.3230.620.933
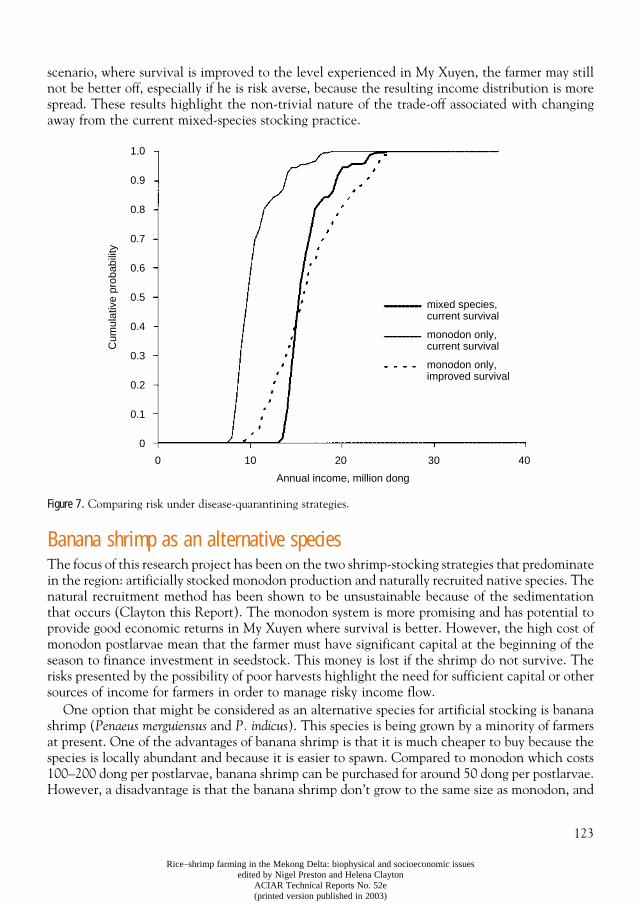
123
Rice–shrimp farming in the Mekong Delta: biophysical and socioeconomic issuesedited by Nigel Preston and Helena Clayton
ACIAR Technical Reports No. 52e(printed version published in 2003)
scenario, where survival is improved to the level experienced in My Xuyen, the farmer may stillnot be better off, especially if he is risk averse, because the resulting income distribution is morespread. These results highlight the non-trivial nature of the trade-off associated with changingaway from the current mixed-species stocking practice.
Figure 7. Comparing risk under disease-quarantining strategies.
Banana shrimp as an alternative speciesThe focus of this research project has been on the two shrimp-stocking strategies that predominatein the region: artificially stocked monodon production and naturally recruited native species. Thenatural recruitment method has been shown to be unsustainable because of the sedimentationthat occurs (Clayton this Report). The monodon system is more promising and has potential toprovide good economic returns in My Xuyen where survival is better. However, the high cost ofmonodon postlarvae mean that the farmer must have significant capital at the beginning of theseason to finance investment in seedstock. This money is lost if the shrimp do not survive. Therisks presented by the possibility of poor harvests highlight the need for sufficient capital or othersources of income for farmers in order to manage risky income flow.
One option that might be considered as an alternative species for artificial stocking is bananashrimp (Penaeus merguiensus and P. indicus). This species is being grown by a minority of farmersat present. One of the advantages of banana shrimp is that it is much cheaper to buy because thespecies is locally abundant and because it is easier to spawn. Compared to monodon which costs100–200 dong per postlarvae, banana shrimp can be purchased for around 50 dong per postlarvae.However, a disadvantage is that the banana shrimp don’t grow to the same size as monodon, and
mixed species,current survival
monodon only,current survival
monodon only,improved survival
Annual income, million dong
0 10 20 30 40
Cum
ulat
ive
prob
abili
ty
1.0
0.9
0.8
0.7
0.6
0.5
0.4
0.3
0.2
0.1
0
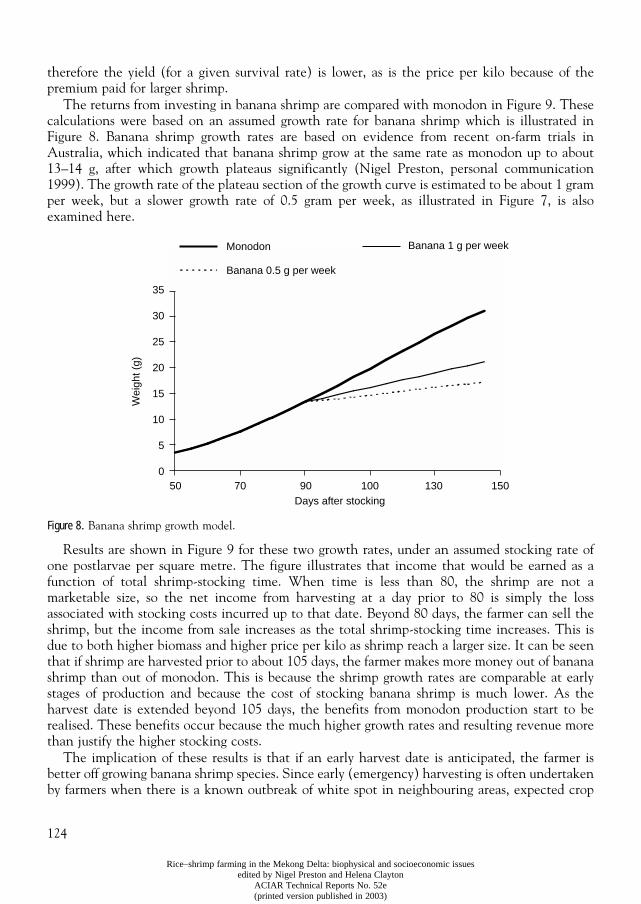
124
Rice–shrimp farming in the Mekong Delta: biophysical and socioeconomic issuesedited by Nigel Preston and Helena Clayton
ACIAR Technical Reports No. 52e(printed version published in 2003)
therefore the yield (for a given survival rate) is lower, as is the price per kilo because of thepremium paid for larger shrimp.
The returns from investing in banana shrimp are compared with monodon in Figure 9. Thesecalculations were based on an assumed growth rate for banana shrimp which is illustrated inFigure 8. Banana shrimp growth rates are based on evidence from recent on-farm trials inAustralia, which indicated that banana shrimp grow at the same rate as monodon up to about13–14 g, after which growth plateaus significantly (Nigel Preston, personal communication1999). The growth rate of the plateau section of the growth curve is estimated to be about 1 gramper week, but a slower growth rate of 0.5 gram per week, as illustrated in Figure 7, is alsoexamined here.
Figure 8. Banana shrimp growth model.
Results are shown in Figure 9 for these two growth rates, under an assumed stocking rate ofone postlarvae per square metre. The figure illustrates that income that would be earned as afunction of total shrimp-stocking time. When time is less than 80, the shrimp are not amarketable size, so the net income from harvesting at a day prior to 80 is simply the lossassociated with stocking costs incurred up to that date. Beyond 80 days, the farmer can sell theshrimp, but the income from sale increases as the total shrimp-stocking time increases. This isdue to both higher biomass and higher price per kilo as shrimp reach a larger size. It can be seenthat if shrimp are harvested prior to about 105 days, the farmer makes more money out of bananashrimp than out of monodon. This is because the shrimp growth rates are comparable at earlystages of production and because the cost of stocking banana shrimp is much lower. As theharvest date is extended beyond 105 days, the benefits from monodon production start to berealised. These benefits occur because the much higher growth rates and resulting revenue morethan justify the higher stocking costs.
The implication of these results is that if an early harvest date is anticipated, the farmer isbetter off growing banana shrimp species. Since early (emergency) harvesting is often undertakenby farmers when there is a known outbreak of white spot in neighbouring areas, expected crop
Monodon Banana 1 g per week
Banana 0.5 g per week
Days after stocking
Wei
ght (
g)
50 70 90 100 130 150
35
30
25
20
15
10
5
0
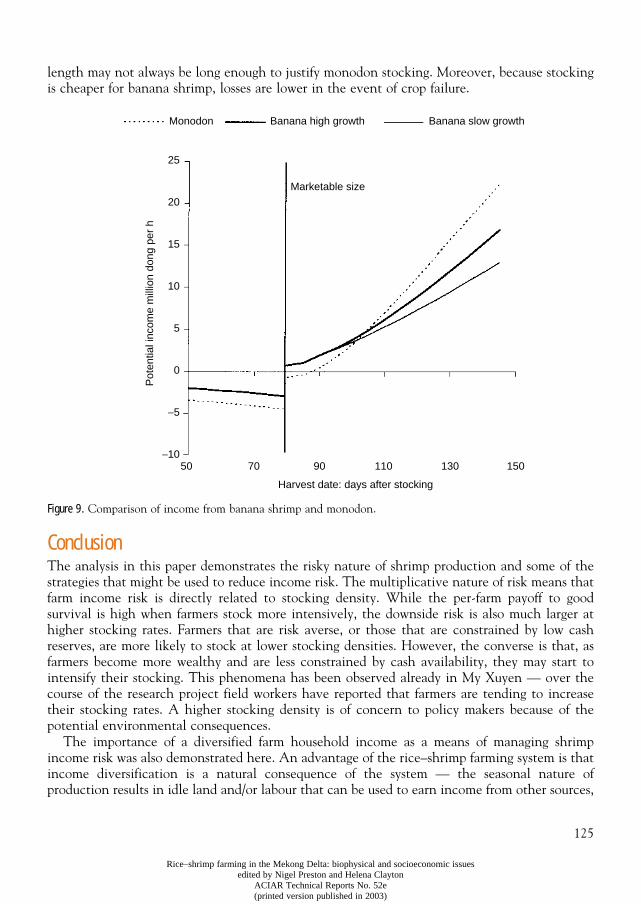
125
Rice–shrimp farming in the Mekong Delta: biophysical and socioeconomic issuesedited by Nigel Preston and Helena Clayton
ACIAR Technical Reports No. 52e(printed version published in 2003)
length may not always be long enough to justify monodon stocking. Moreover, because stockingis cheaper for banana shrimp, losses are lower in the event of crop failure.
Figure 9. Comparison of income from banana shrimp and monodon.
ConclusionThe analysis in this paper demonstrates the risky nature of shrimp production and some of thestrategies that might be used to reduce income risk. The multiplicative nature of risk means thatfarm income risk is directly related to stocking density. While the per-farm payoff to goodsurvival is high when farmers stock more intensively, the downside risk is also much larger athigher stocking rates. Farmers that are risk averse, or those that are constrained by low cashreserves, are more likely to stock at lower stocking densities. However, the converse is that, asfarmers become more wealthy and are less constrained by cash availability, they may start tointensify their stocking. This phenomena has been observed already in My Xuyen — over thecourse of the research project field workers have reported that farmers are tending to increasetheir stocking rates. A higher stocking density is of concern to policy makers because of thepotential environmental consequences.
The importance of a diversified farm household income as a means of managing shrimpincome risk was also demonstrated here. An advantage of the rice–shrimp farming system is thatincome diversification is a natural consequence of the system — the seasonal nature ofproduction results in idle land and/or labour that can be used to earn income from other sources,
Monodon Banana high growth Banana slow growth
Marketable size
Harvest date: days after stocking
50 70 90 110 130 150
Pot
entia
l inc
ome
mill
ion
dong
per
h25
20
15
10
5
0
−5
−10
126
Rice–shrimp farming in the Mekong Delta: biophysical and socioeconomic issuesedited by Nigel Preston and Helena Clayton
ACIAR Technical Reports No. 52e(printed version published in 2003)
including agricultural and off-farm income. The rice production results in a staple food supply inthe event of a poor shrimp crop. This in-kind income is less likely to be ‘gambled away’ in shrimpproduction, providing food security for the household.
The analysis showed how the cost of credit and the expected survival of shrimp are critical indetermining whether or not farmers should use credit to source shrimp postlarvae. If shrimpsurvival is expected to be as good as has been observed in My Xuyen, then the expected returnfrom shrimp stocking is high enough to justify using credit, even at informal credit rates.However, if shrimp survival is as poor as it is in Gia Rai, then farmers are better off not borrowingmoney to stock, even if they can access the cheaper formal credit.
The importance of farm income diversification as a means of managing risk implies thatfarmers may not be willing to adopt the ‘quarantining’ strategies that have been recommendedin other shrimp-producing regions. This may create difficulties in coming years as the technologyfor producing pathogen-free postlarvae reaches the Mekong Delta. Those farmers that are ableto access pathogen-free stock are likely to want to follow a ‘monodon only’ stocking strategy,while their poorer neighbours may wish to cultivate mixed species systems, thus providing anunwanted potential viral source to their neighbours’ ponds.
Finally, it should be noted that as long as it remains difficult to source an adequate supply ofhigh health monodon postlarvae, it might be worthwhile investing research funds intoalternative species. The analysis of banana shrimp presented here indicates that in somesituations banana shrimp may be a better investment than monodon.
ReferencesAdams C., Griffin, W., Nichols, J.P. and Brick, R.E. 1980. Application of a bio-economic-engineering model for
shrimp mariculture systems. Southern Journal of Agricultural Economics, 12(1), 135–41.Brennan, D. 2002. Savings and technology choice for risk averse farmers. Australian Journal of Agricultural
Economics. (In press).Brennan, D., Clayton, H., Tran Thanh Be and Tran The Nhu Hiep. 1999. Economic and social characteristics
and farm management practices of farms in the brackish water region of Soc Trang and Bac Lieu provinces,Mekong Delta, Vietnam: Results of a 1997 survey. www.reap.com.au/riceshrimpsurvey97.pdf
Brennan, D.C., Clayton, H. and Tran, T.B. 2000. Economic characteristics of rice shrimp farms in the MekongDelta, Vietnam. Journal of Aquaculture Economics and Management, 4 (3–4), 127–39.
Griffin, W., Grant, W., Brick, R.W. and Hanson, J.S. 1984. Bioeconomic model of shrimp mariculture systemsin the USA. Ecological modeling, 25, 47–68.
Hardaker, J.B., Huirne, R.B.M. and Anderson, J.R. 1997. Coping with Risk in Agriculture. Oxford, UK, CABInternational.
Jackson, C. and Wang, L. 1998. Modeling growth rate of Penaeus monodon in intensively managed pond: effectsof temperature, pond age and stocking density. Aquaculture research, 29(1), 27–36.
Walker, P. 1999. Oral presentation on white spot management at 1999 project workshop.Withyachumnarnkul, B. 1999. Results from black tiger shrimp Penaeus monodon culture ponds stocked with
postlarvae PCR-positive or -negative for white spot syndrome virus (WSSV). Disease of Aquatic Organisms,39, 21–27.
127
Rice–shrimp farming in the Mekong Delta: biophysical and socioeconomic issuesedited by Nigel Preston and Helena Clayton
ACIAR Technical Reports No. 52e(printed version published in 2003)
CHAPTER 11
Bioeconomic factors in sedimentation related land lossin the natural rice–shrimp system
Helena Clayton
1
1
Department of Agric. and Resource Econ, University of Sydney.Email: [email protected]
I would like to acknowledge the research contribution from Donna Brennan and Tran Thanh Be in the development and analysis of the conceptual and empirical model presented in this paper — Helena Clayton
Abstract
This paper is concerned with land degradation in the rice–shrimp system arising from the loss ofland from the build up of sediment over time. The land loss is primarily associated with systemsreliant on high water exchange for natural recruitment of shrimp seed. Alternative low land-degrading (low water-exchange) rice–shrimp technology is available in the Mekong Delta;however, the high capital outlay and risks associated with such technology may constrain theability for poorer farmers to adopt it. The aim of the paper was to evaluate the economicimplications of the land loss and explore some of the economic factors that might explain whyit has occurred. A bioeconomic spreadsheet-based model was developed to evaluate the netbenefits of alternative production scenarios which have different implications for land loss. Thenet benefits of the alternative scenarios were simulated under different assumptions about timepreference and farm planning horizons. The results indicate that there are limited incentives fornatural rice–shrimp farmers to move away from production choices that lead to land loss. Theeconomic dimensions of this result were discussed in the paper with reference to technologicalchange, policy and farm extension implications.
T
HE
LAND
LOSS
arising from sedimentation in rice–shrimp systems is the subject of this paper.The loss of productive land primarily arises in systems reliant on tidal recruitment of naturalshrimp rather than the systems based on stocking of hatchery-purchased postlarvae.
2
This isbecause tidal recruitment requires high-water exchange rates. The frequency of water exchangeis a significant factor in land loss as it is through the exchange and inundation of turbid waterthroughout the shrimp-raising season that suspended sediment settles to the floor of therice–shrimp polder. The bioeconomic dimensions of the resultant land loss arising from suchsedimentation are described in the following section. Throughout this paper, rice–shrimp systemsbased on tidal recruitment of natural shrimp are referred to as the ‘natural rice–shrimp system’.
While the natural rice–shrimp system has provided households in the Mekong Delta with low-input and low-risk opportunities for increasing income and accumulating capital over time, thegrowing scale of land loss raises questions about the long-term sustainability of the system. Thispaper:• investigates the economic nature of land loss in the natural rice–shrimp system and explores
the relevant economic policy issues;
2
See Chapter 1 (this Report
)
for an overview of the different rice–shrimp systems in the Mekong Delta
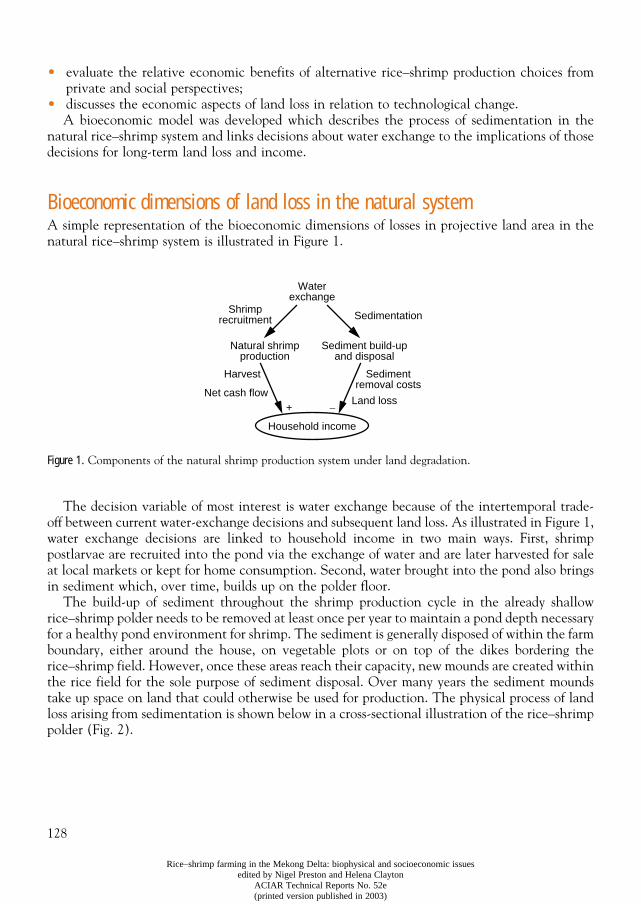
128
Rice–shrimp farming in the Mekong Delta: biophysical and socioeconomic issuesedited by Nigel Preston and Helena Clayton
ACIAR Technical Reports No. 52e(printed version published in 2003)
• evaluate the relative economic benefits of alternative rice–shrimp production choices fromprivate and social perspectives;
• discusses the economic aspects of land loss in relation to technological change. A bioeconomic model was developed which describes the process of sedimentation in the
natural rice–shrimp system and links decisions about water exchange to the implications of thosedecisions for long-term land loss and income.
Bioeconomic dimensions of land loss in the natural system
A simple representation of the bioeconomic dimensions of losses in projective land area in thenatural rice–shrimp system is illustrated in Figure 1.
Figure 1.
Components of the natural shrimp production system under land degradation.
The decision variable of most interest is water exchange because of the intertemporal trade-off between current water-exchange decisions and subsequent land loss. As illustrated in Figure 1,water exchange decisions are linked to household income in two main ways. First, shrimppostlarvae are recruited into the pond via the exchange of water and are later harvested for saleat local markets or kept for home consumption. Second, water brought into the pond also bringsin sediment which, over time, builds up on the polder floor.
The build-up of sediment throughout the shrimp production cycle in the already shallowrice–shrimp polder needs to be removed at least once per year to maintain a pond depth necessaryfor a healthy pond environment for shrimp. The sediment is generally disposed of within the farmboundary, either around the house, on vegetable plots or on top of the dikes bordering therice–shrimp field. However, once these areas reach their capacity, new mounds are created withinthe rice field for the sole purpose of sediment disposal. Over many years the sediment moundstake up space on land that could otherwise be used for production. The physical process of landloss arising from sedimentation is shown below in a cross-sectional illustration of the rice–shrimppolder (Fig. 2).
Waterexchange
Shrimprecruitment Sedimentation
Natural shrimpproduction
Sediment build-upand disposal
Harvest
Net cash flowLand loss
Sedimentremoval costs
−+
Household income
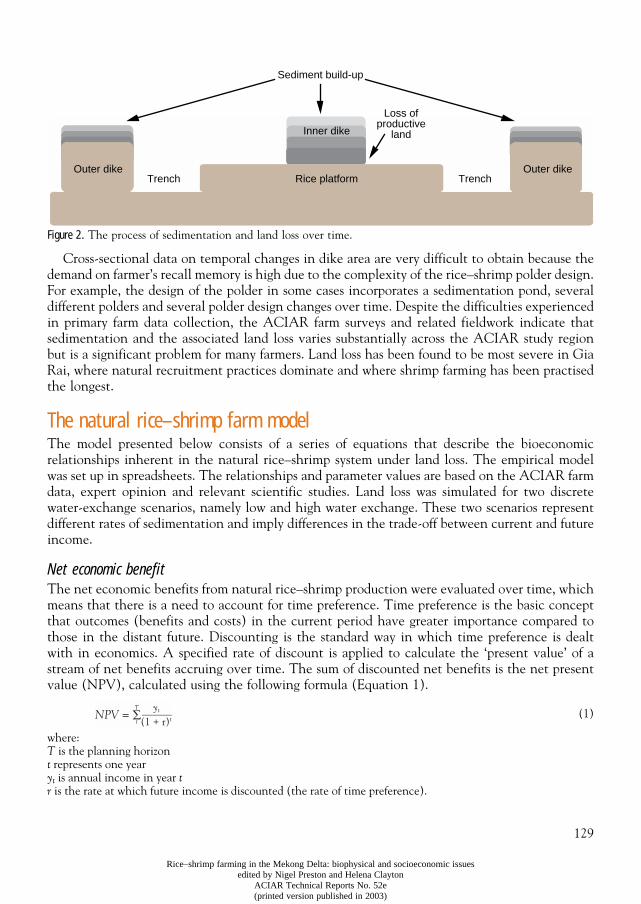
129
Rice–shrimp farming in the Mekong Delta: biophysical and socioeconomic issuesedited by Nigel Preston and Helena Clayton
ACIAR Technical Reports No. 52e(printed version published in 2003)
Figure 2.
The process of sedimentation and land loss over time.
Cross-sectional data on temporal changes in dike area are very difficult to obtain because thedemand on farmer’s recall memory is high due to the complexity of the rice–shrimp polder design.For example, the design of the polder in some cases incorporates a sedimentation pond, severaldifferent polders and several polder design changes over time. Despite the difficulties experiencedin primary farm data collection, the ACIAR farm surveys and related fieldwork indicate thatsedimentation and the associated land loss varies substantially across the ACIAR study regionbut is a significant problem for many farmers. Land loss has been found to be most severe in GiaRai, where natural recruitment practices dominate and where shrimp farming has been practisedthe longest.
The natural rice–shrimp farm model
The model presented below consists of a series of equations that describe the bioeconomicrelationships inherent in the natural rice–shrimp system under land loss. The empirical modelwas set up in spreadsheets. The relationships and parameter values are based on the ACIAR farmdata, expert opinion and relevant scientific studies. Land loss was simulated for two discretewater-exchange scenarios, namely low and high water exchange. These two scenarios representdifferent rates of sedimentation and imply differences in the trade-off between current and futureincome.
Net economic benefit
The net economic benefits from natural rice–shrimp production were evaluated over time, whichmeans that there is a need to account for time preference. Time preference is the basic conceptthat outcomes (benefits and costs) in the current period have greater importance compared tothose in the distant future. Discounting is the standard way in which time preference is dealtwith in economics. A specified rate of discount is applied to calculate the ‘present value’ of astream of net benefits accruing over time. The sum of discounted net benefits is the net presentvalue (NPV), calculated using the following formula (Equation 1).
(1)
where:
T
is the planning horizon
t
represents one year
y
t
is annual income in year
tr
is the rate at which future income is discounted (the rate of time preference).
Sediment build-up
Outer dikeTrench Rice platform
Inner dike
Outer dikeTrench
Loss ofproductive
land
NPV =yt_____
(1 + r)t∑T
t
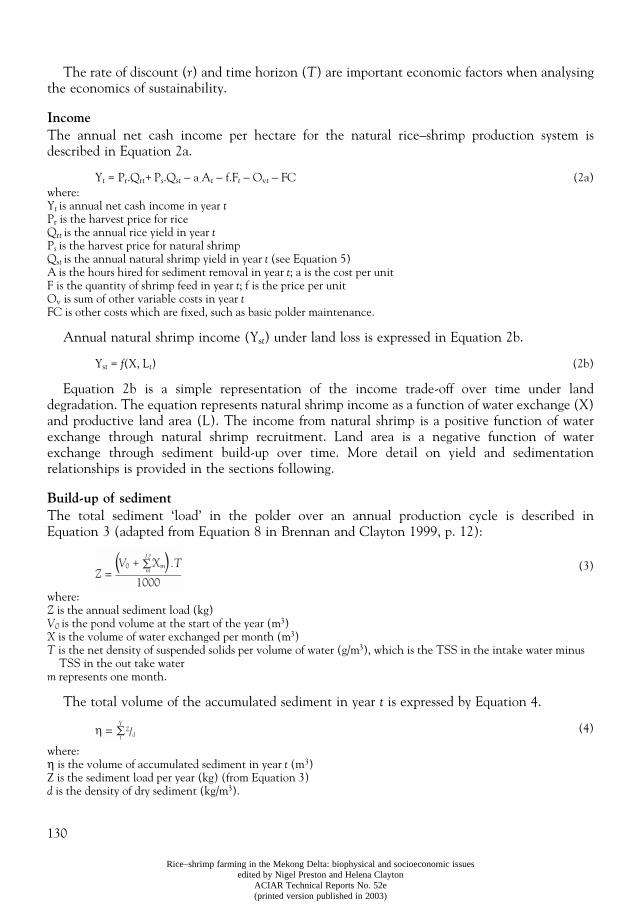
130
Rice–shrimp farming in the Mekong Delta: biophysical and socioeconomic issuesedited by Nigel Preston and Helena Clayton
ACIAR Technical Reports No. 52e(printed version published in 2003)
The rate of discount (
r
) and time horizon (
T
) are important economic factors when analysingthe economics of sustainability.
Income
The annual net cash income per hectare for the natural rice–shrimp production system isdescribed in Equation 2a.
Y
t
= P
r
.Q
r
t
+
P
s
.Q
s
t
−
a
.
A
t
−
f.F
t
−
O
v
t
−
FC (2a)where:Y
t
is annual net cash income in year
t
P
r
is the harvest price for riceQ
r
t
is the annual rice yield in year
t
P
s
is the harvest price for natural shrimpQ
s
t
is the annual natural shrimp yield in year
t
(see Equation 5)A
is the hours hired for sediment removal in year
t
; a is the cost per unitF is the quantity of shrimp feed in year
t
; f is the price per unitO
v
is sum of other variable costs in year
t
FC is other costs which are fixed, such as basic polder maintenance.
Annual natural shrimp income (Y
s
t
) under land loss is expressed in Equation 2b.
Y
s
t
=
f
(X, L
t
) (2b)
Equation 2b is a simple representation of the income trade-off over time under landdegradation. The equation represents natural shrimp income as a function of water exchange (X)and productive land area (L). The income from natural shrimp is a positive function of waterexchange through natural shrimp recruitment. Land area is a negative function of waterexchange through sediment build-up over time. More detail on yield and sedimentationrelationships is provided in the sections following.
Build-up of sediment
The total sediment ‘load’ in the polder over an annual production cycle is described inEquation 3 (adapted from Equation 8 in Brennan and Clayton 1999, p. 12):
(3)
where:
Z
is the annual sediment load (kg)
V
0
is the pond volume at the start of the year (m
3
)
X
is the volume of water exchanged per month (m
3
)
T
is the net density of suspended solids per volume of water (g/m
3
), which is the TSS in the intake water minus TSS in the out take water
m
represents one month.
The total volume of the accumulated sediment in year
t
is expressed by Equation 4.
(4)
where:
η
is the volume of accumulated sediment in year
t
(m
3
)Z is the sediment load per year (kg) (from Equation 3)
d
is the density of dry sediment (kg/m
3
).
Z = ___________( ∑12
mV0 + Xm).T
1000
η = ∑Y
tZ/d
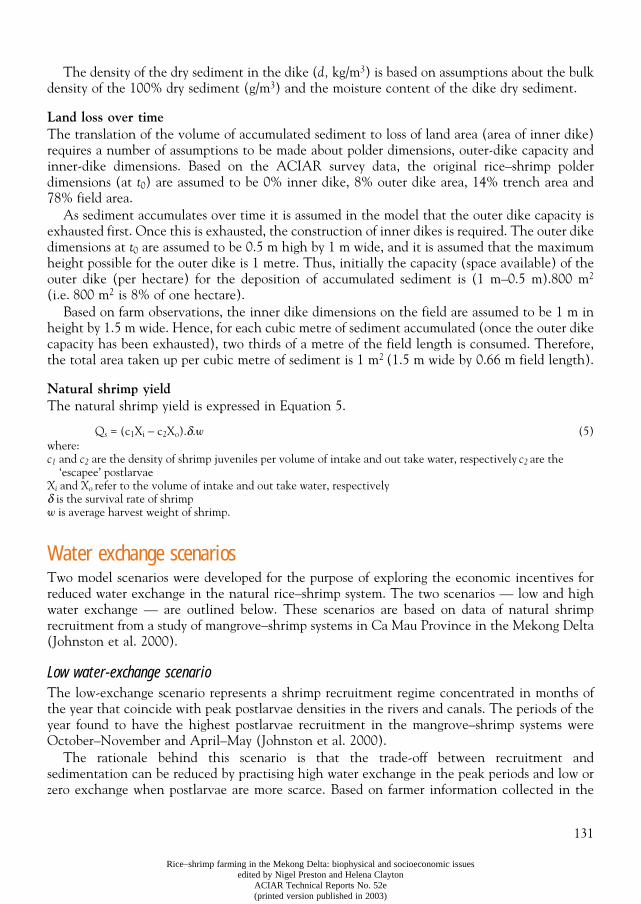
131
Rice–shrimp farming in the Mekong Delta: biophysical and socioeconomic issuesedited by Nigel Preston and Helena Clayton
ACIAR Technical Reports No. 52e(printed version published in 2003)
The density of the dry sediment in the dike (
d,
kg/m
3
) is based on assumptions about the bulkdensity of the 100% dry sediment (g/m
3
) and the moisture content of the dike dry sediment.
Land loss over time
The translation of the volume of accumulated sediment to loss of land area (area of inner dike)requires a number of assumptions to be made about polder dimensions, outer-dike capacity andinner-dike dimensions. Based on the ACIAR survey data, the original rice–shrimp polderdimensions (at
t
0
) are assumed to be 0% inner dike, 8% outer dike area, 14% trench area and78% field area.
As sediment accumulates over time it is assumed in the model that the outer dike capacity isexhausted first. Once this is exhausted, the construction of inner dikes is required. The outer dikedimensions at
t
0
are assumed to be 0.5 m high by 1 m wide, and it is assumed that the maximumheight possible for the outer dike is 1 metre. Thus, initially the capacity (space available) of theouter dike (per hectare) for the deposition of accumulated sediment is (1 m–0.5 m).800 m
2
(i.e. 800 m
2
is 8% of one hectare). Based on farm observations, the inner dike dimensions on the field are assumed to be 1 m in
height by 1.5 m wide. Hence, for each cubic metre of sediment accumulated (once the outer dikecapacity has been exhausted), two thirds of a metre of the field length is consumed. Therefore,the total area taken up per cubic metre of sediment is 1 m
2
(1.5 m wide by 0.66 m field length).
Natural shrimp yield
The natural shrimp yield is expressed in Equation 5.
Q
s
= (c
1
X
i
−
c2Xo).δ.w (5)where: c1 and c2 are the density of shrimp juveniles per volume of intake and out take water, respectively c2 are the
‘escapee’ postlarvaeXi and Xo refer to the volume of intake and out take water, respectivelyδ is the survival rate of shrimpw is average harvest weight of shrimp.
Water exchange scenariosTwo model scenarios were developed for the purpose of exploring the economic incentives forreduced water exchange in the natural rice–shrimp system. The two scenarios — low and highwater exchange — are outlined below. These scenarios are based on data of natural shrimprecruitment from a study of mangrove–shrimp systems in Ca Mau Province in the Mekong Delta(Johnston et al. 2000).
Low water-exchange scenarioThe low-exchange scenario represents a shrimp recruitment regime concentrated in months ofthe year that coincide with peak postlarvae densities in the rivers and canals. The periods of theyear found to have the highest postlarvae recruitment in the mangrove–shrimp systems wereOctober–November and April–May (Johnston et al. 2000).
The rationale behind this scenario is that the trade-off between recruitment andsedimentation can be reduced by practising high water exchange in the peak periods and low orzero exchange when postlarvae are more scarce. Based on farmer information collected in the
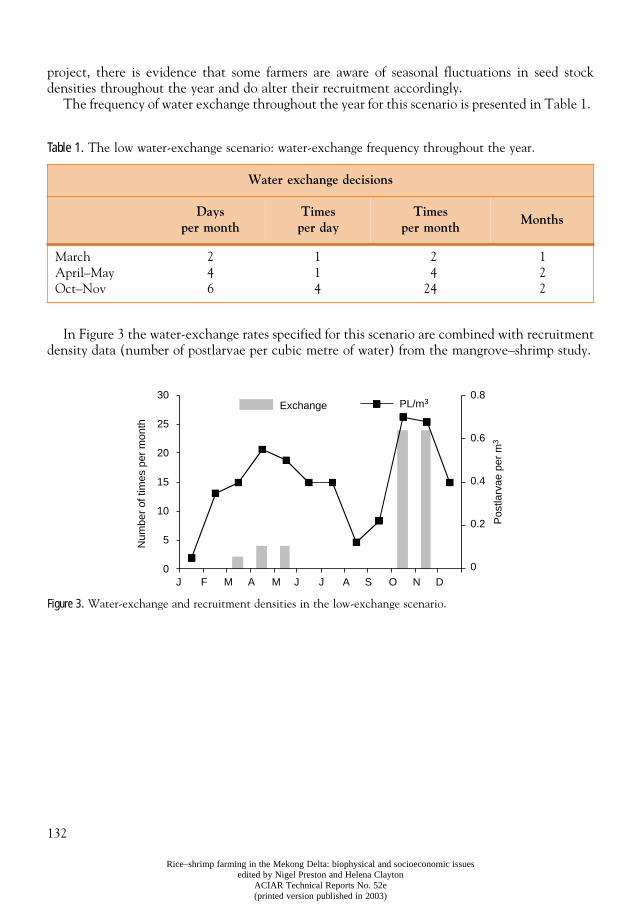
132
Rice–shrimp farming in the Mekong Delta: biophysical and socioeconomic issuesedited by Nigel Preston and Helena Clayton
ACIAR Technical Reports No. 52e(printed version published in 2003)
project, there is evidence that some farmers are aware of seasonal fluctuations in seed stockdensities throughout the year and do alter their recruitment accordingly.
The frequency of water exchange throughout the year for this scenario is presented in Table 1.
Table 1. The low water-exchange scenario: water-exchange frequency throughout the year.
In Figure 3 the water-exchange rates specified for this scenario are combined with recruitmentdensity data (number of postlarvae per cubic metre of water) from the mangrove–shrimp study.
Figure 3. Water-exchange and recruitment densities in the low-exchange scenario.
Water exchange decisions
Days per month
Times per day
Times per month
Months
MarchApril–MayOct–Nov
246
114
24
24
122
Exchange PL/m3
Num
ber
of ti
mes
per
mon
th
Pos
tlarv
ae p
er m
3
30
25
20
15
10
5
0J F M A M J J A S O N D
0.8
0.6
0.4
0.2
0
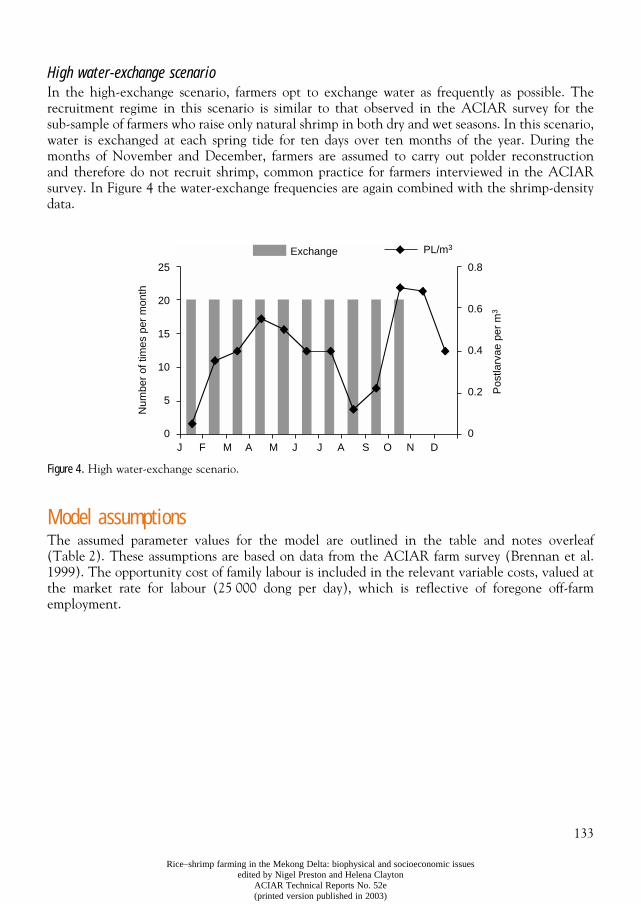
133
Rice–shrimp farming in the Mekong Delta: biophysical and socioeconomic issuesedited by Nigel Preston and Helena Clayton
ACIAR Technical Reports No. 52e(printed version published in 2003)
High water-exchange scenarioIn the high-exchange scenario, farmers opt to exchange water as frequently as possible. Therecruitment regime in this scenario is similar to that observed in the ACIAR survey for thesub-sample of farmers who raise only natural shrimp in both dry and wet seasons. In this scenario,water is exchanged at each spring tide for ten days over ten months of the year. During themonths of November and December, farmers are assumed to carry out polder reconstructionand therefore do not recruit shrimp, common practice for farmers interviewed in the ACIARsurvey. In Figure 4 the water-exchange frequencies are again combined with the shrimp-densitydata.
Figure 4. High water-exchange scenario.
Model assumptionsThe assumed parameter values for the model are outlined in the table and notes overleaf(Table 2). These assumptions are based on data from the ACIAR farm survey (Brennan et al.1999). The opportunity cost of family labour is included in the relevant variable costs, valued atthe market rate for labour (25 000 dong per day), which is reflective of foregone off-farmemployment.
Exchange PL/m3
Num
ber
of ti
mes
per
mon
th
Pos
tlarv
ae p
er m
3
25
20
15
10
5
0J F M A M J J A S O N D
0.8
0.6
0.4
0.2
0
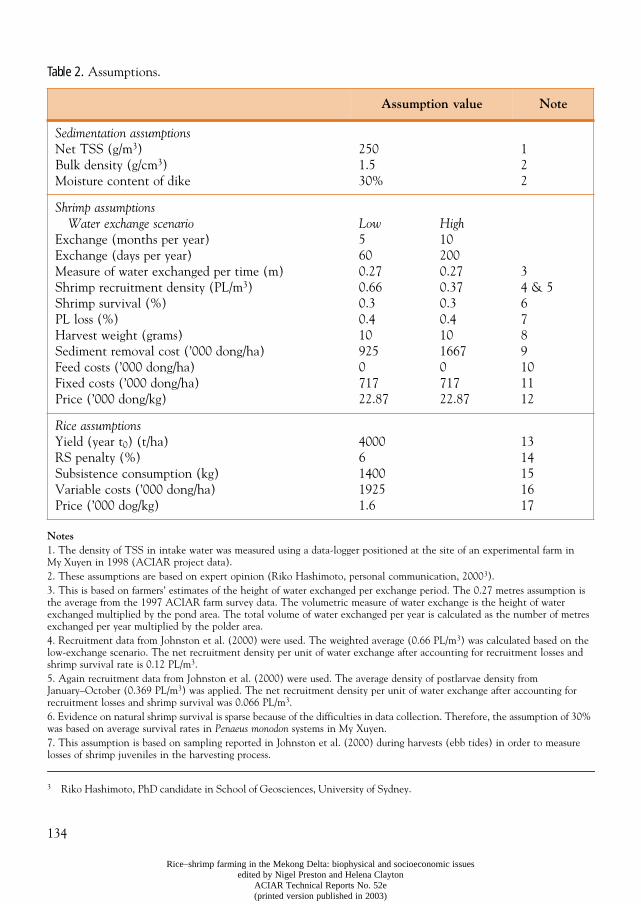
134
Rice–shrimp farming in the Mekong Delta: biophysical and socioeconomic issuesedited by Nigel Preston and Helena Clayton
ACIAR Technical Reports No. 52e(printed version published in 2003)
Table 2. Assumptions.
Notes1. The density of TSS in intake water was measured using a data-logger positioned at the site of an experimental farm in My Xuyen in 1998 (ACIAR project data).2. These assumptions are based on expert opinion (Riko Hashimoto, personal communication, 20003).3. This is based on farmers’ estimates of the height of water exchanged per exchange period. The 0.27 metres assumption is the average from the 1997 ACIAR farm survey data. The volumetric measure of water exchange is the height of water exchanged multiplied by the pond area. The total volume of water exchanged per year is calculated as the number of metres exchanged per year multiplied by the polder area. 4. Recruitment data from Johnston et al. (2000) were used. The weighted average (0.66 PL/m3) was calculated based on the low-exchange scenario. The net recruitment density per unit of water exchange after accounting for recruitment losses and shrimp survival rate is 0.12 PL/m3. 5. Again recruitment data from Johnston et al. (2000) were used. The average density of postlarvae density from January–October (0.369 PL/m3) was applied. The net recruitment density per unit of water exchange after accounting for recruitment losses and shrimp survival was 0.066 PL/m3.6. Evidence on natural shrimp survival is sparse because of the difficulties in data collection. Therefore, the assumption of 30% was based on average survival rates in Penaeus monodon systems in My Xuyen. 7. This assumption is based on sampling reported in Johnston et al. (2000) during harvests (ebb tides) in order to measure losses of shrimp juveniles in the harvesting process.
Assumption value Note
Sedimentation assumptionsNet TSS (g/m3)Bulk density (g/cm3)Moisture content of dike
2501.530%
122
Shrimp assumptionsWater exchange scenario
Exchange (months per year)Exchange (days per year)Measure of water exchanged per time (m)Shrimp recruitment density (PL/m3)Shrimp survival (%)PL loss (%)Harvest weight (grams)Sediment removal cost (’000 dong/ha)Feed costs (’000 dong/ha)Fixed costs (’000 dong/ha)Price (’000 dong/kg)
Low5600.270.660.30.410925071722.87
High102000.270.370.30.4101667071722.87
34 & 56789101112
Rice assumptionsYield (year t0) (t/ha)RS penalty (%)Subsistence consumption (kg)Variable costs (’000 dong/ha)Price (’000 dog/kg)
40006140019251.6
1314151617
3 Riko Hashimoto, PhD candidate in School of Geosciences, University of Sydney.
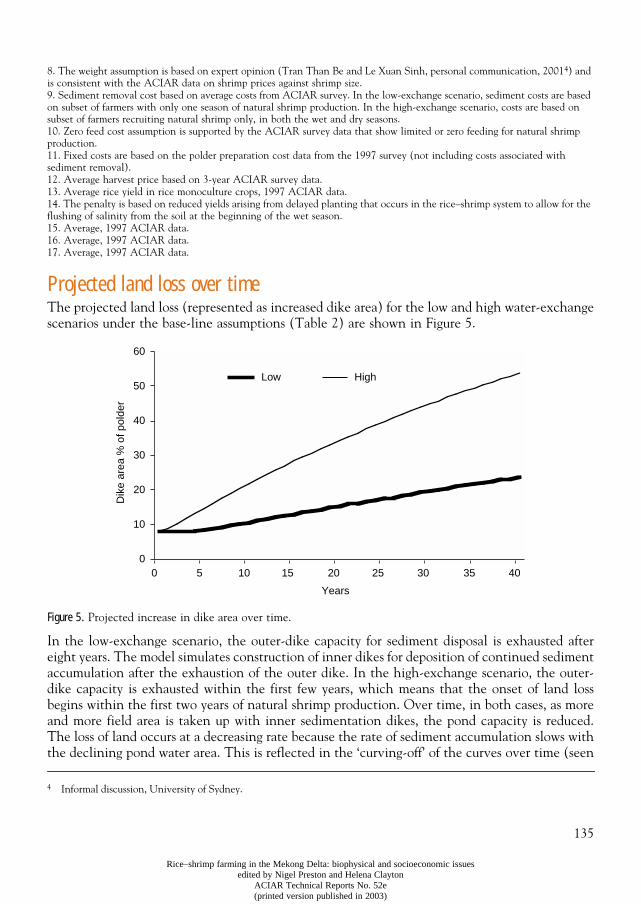
135
Rice–shrimp farming in the Mekong Delta: biophysical and socioeconomic issuesedited by Nigel Preston and Helena Clayton
ACIAR Technical Reports No. 52e(printed version published in 2003)
8. The weight assumption is based on expert opinion (Tran Than Be and Le Xuan Sinh, personal communication, 20014) and is consistent with the ACIAR data on shrimp prices against shrimp size. 9. Sediment removal cost based on average costs from ACIAR survey. In the low-exchange scenario, sediment costs are based on subset of farmers with only one season of natural shrimp production. In the high-exchange scenario, costs are based on subset of farmers recruiting natural shrimp only, in both the wet and dry seasons.10. Zero feed cost assumption is supported by the ACIAR survey data that show limited or zero feeding for natural shrimp production. 11. Fixed costs are based on the polder preparation cost data from the 1997 survey (not including costs associated with sediment removal). 12. Average harvest price based on 3-year ACIAR survey data.13. Average rice yield in rice monoculture crops, 1997 ACIAR data.14. The penalty is based on reduced yields arising from delayed planting that occurs in the rice–shrimp system to allow for the flushing of salinity from the soil at the beginning of the wet season. 15. Average, 1997 ACIAR data.16. Average, 1997 ACIAR data.17. Average, 1997 ACIAR data.
Projected land loss over timeThe projected land loss (represented as increased dike area) for the low and high water-exchangescenarios under the base-line assumptions (Table 2) are shown in Figure 5.
Figure 5. Projected increase in dike area over time.
In the low-exchange scenario, the outer-dike capacity for sediment disposal is exhausted aftereight years. The model simulates construction of inner dikes for deposition of continued sedimentaccumulation after the exhaustion of the outer dike. In the high-exchange scenario, the outer-dike capacity is exhausted within the first few years, which means that the onset of land lossbegins within the first two years of natural shrimp production. Over time, in both cases, as moreand more field area is taken up with inner sedimentation dikes, the pond capacity is reduced.The loss of land occurs at a decreasing rate because the rate of sediment accumulation slows withthe declining pond water area. This is reflected in the ‘curving-off’ of the curves over time (seen
4 Informal discussion, University of Sydney.
Low High
0 5 10 15 20 25 30 35 40
Years
Dik
e ar
ea %
of p
olde
r
60
50
40
30
20
10
0
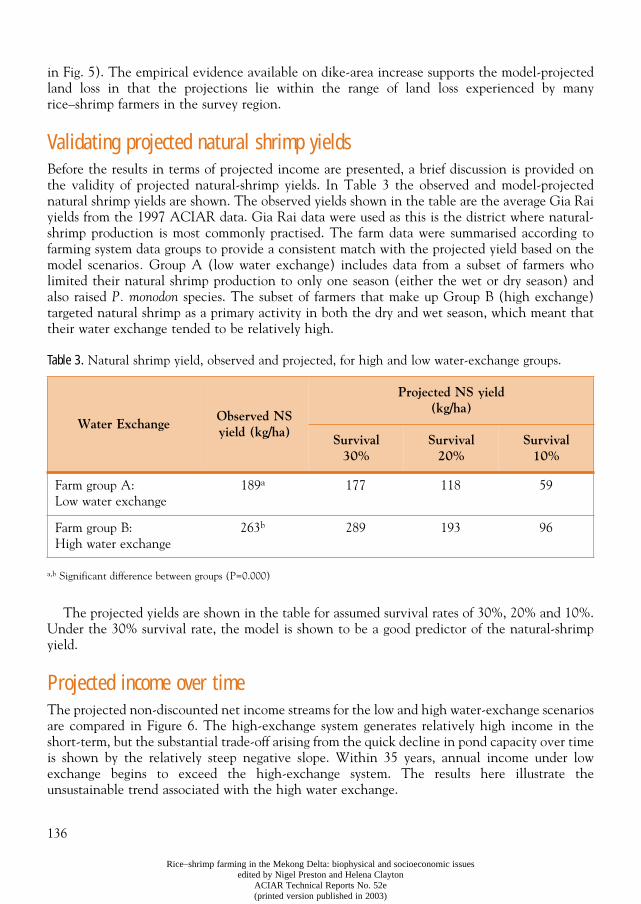
136
Rice–shrimp farming in the Mekong Delta: biophysical and socioeconomic issuesedited by Nigel Preston and Helena Clayton
ACIAR Technical Reports No. 52e(printed version published in 2003)
in Fig. 5). The empirical evidence available on dike-area increase supports the model-projectedland loss in that the projections lie within the range of land loss experienced by manyrice–shrimp farmers in the survey region.
Validating projected natural shrimp yields Before the results in terms of projected income are presented, a brief discussion is provided onthe validity of projected natural-shrimp yields. In Table 3 the observed and model-projectednatural shrimp yields are shown. The observed yields shown in the table are the average Gia Raiyields from the 1997 ACIAR data. Gia Rai data were used as this is the district where natural-shrimp production is most commonly practised. The farm data were summarised according tofarming system data groups to provide a consistent match with the projected yield based on themodel scenarios. Group A (low water exchange) includes data from a subset of farmers wholimited their natural shrimp production to only one season (either the wet or dry season) andalso raised P. monodon species. The subset of farmers that make up Group B (high exchange)targeted natural shrimp as a primary activity in both the dry and wet season, which meant thattheir water exchange tended to be relatively high.
Table 3. Natural shrimp yield, observed and projected, for high and low water-exchange groups.
a,b Significant difference between groups (P=0.000)
The projected yields are shown in the table for assumed survival rates of 30%, 20% and 10%.Under the 30% survival rate, the model is shown to be a good predictor of the natural-shrimpyield.
Projected income over timeThe projected non-discounted net income streams for the low and high water-exchange scenariosare compared in Figure 6. The high-exchange system generates relatively high income in theshort-term, but the substantial trade-off arising from the quick decline in pond capacity over timeis shown by the relatively steep negative slope. Within 35 years, annual income under lowexchange begins to exceed the high-exchange system. The results here illustrate theunsustainable trend associated with the high water exchange.
Water ExchangeObserved NS yield (kg/ha)
Projected NS yield(kg/ha)
Survival30%
Survival20%
Survival10%
Farm group A:Low water exchange
189a 177 118 59
Farm group B:High water exchange
263b 289 193 96
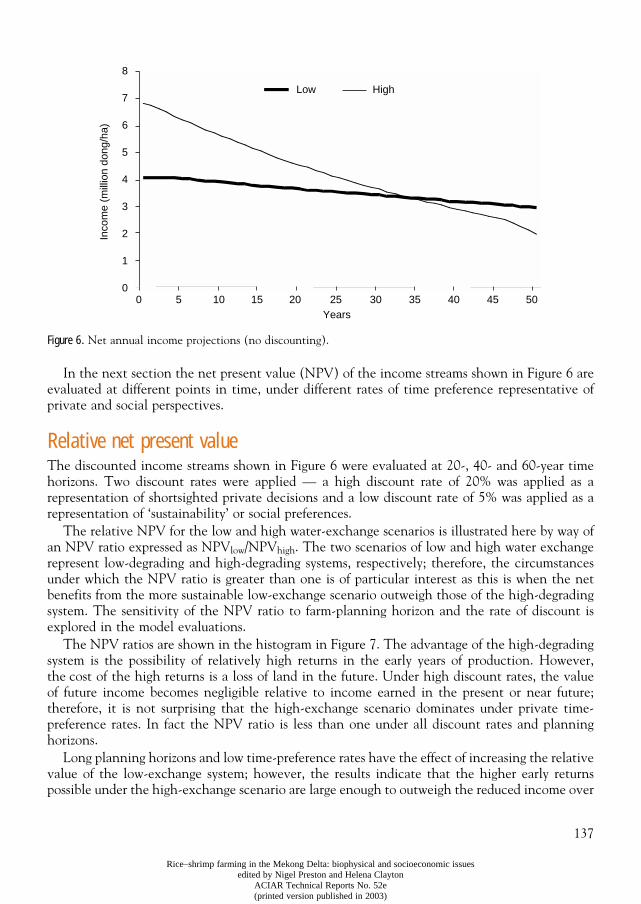
137
Rice–shrimp farming in the Mekong Delta: biophysical and socioeconomic issuesedited by Nigel Preston and Helena Clayton
ACIAR Technical Reports No. 52e(printed version published in 2003)
Figure 6. Net annual income projections (no discounting).
In the next section the net present value (NPV) of the income streams shown in Figure 6 areevaluated at different points in time, under different rates of time preference representative ofprivate and social perspectives.
Relative net present value The discounted income streams shown in Figure 6 were evaluated at 20-, 40- and 60-year timehorizons. Two discount rates were applied — a high discount rate of 20% was applied as arepresentation of shortsighted private decisions and a low discount rate of 5% was applied as arepresentation of ‘sustainability’ or social preferences.
The relative NPV for the low and high water-exchange scenarios is illustrated here by way ofan NPV ratio expressed as NPVlow/NPVhigh. The two scenarios of low and high water exchangerepresent low-degrading and high-degrading systems, respectively; therefore, the circumstancesunder which the NPV ratio is greater than one is of particular interest as this is when the netbenefits from the more sustainable low-exchange scenario outweigh those of the high-degradingsystem. The sensitivity of the NPV ratio to farm-planning horizon and the rate of discount isexplored in the model evaluations.
The NPV ratios are shown in the histogram in Figure 7. The advantage of the high-degradingsystem is the possibility of relatively high returns in the early years of production. However,the cost of the high returns is a loss of land in the future. Under high discount rates, the valueof future income becomes negligible relative to income earned in the present or near future;therefore, it is not surprising that the high-exchange scenario dominates under private time-preference rates. In fact the NPV ratio is less than one under all discount rates and planninghorizons.
Long planning horizons and low time-preference rates have the effect of increasing the relativevalue of the low-exchange system; however, the results indicate that the higher early returnspossible under the high-exchange scenario are large enough to outweigh the reduced income over
Years
Low High
0 5 10 15 20 25 30 35 40 45 50
Inco
me
(mill
ion
dong
/ha)
8
7
6
5
4
3
2
1
0
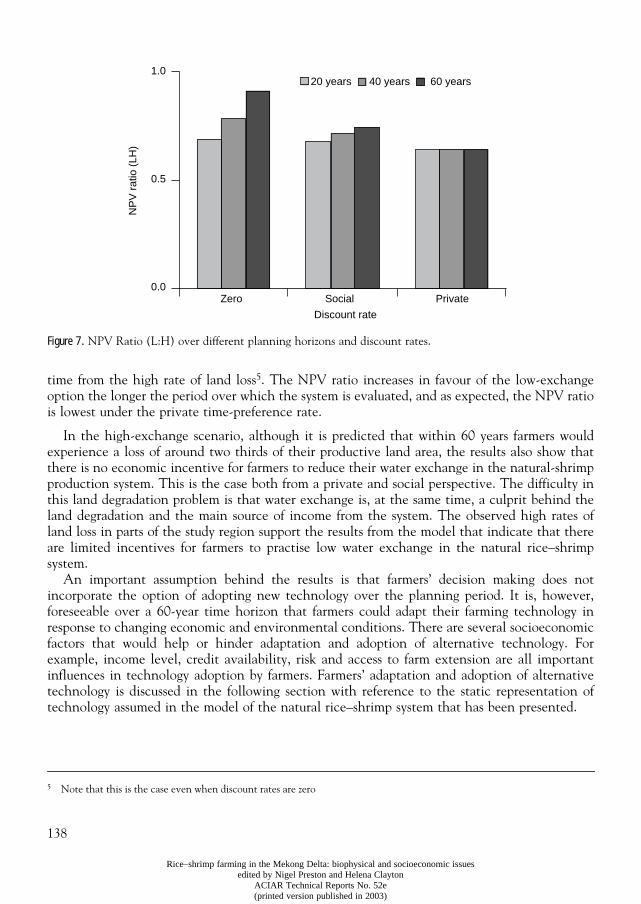
138
Rice–shrimp farming in the Mekong Delta: biophysical and socioeconomic issuesedited by Nigel Preston and Helena Clayton
ACIAR Technical Reports No. 52e(printed version published in 2003)
time from the high rate of land loss5. The NPV ratio increases in favour of the low-exchangeoption the longer the period over which the system is evaluated, and as expected, the NPV ratiois lowest under the private time-preference rate.
In the high-exchange scenario, although it is predicted that within 60 years farmers wouldexperience a loss of around two thirds of their productive land area, the results also show thatthere is no economic incentive for farmers to reduce their water exchange in the natural-shrimpproduction system. This is the case both from a private and social perspective. The difficulty inthis land degradation problem is that water exchange is, at the same time, a culprit behind theland degradation and the main source of income from the system. The observed high rates ofland loss in parts of the study region support the results from the model that indicate that thereare limited incentives for farmers to practise low water exchange in the natural rice–shrimpsystem.
An important assumption behind the results is that farmers’ decision making does notincorporate the option of adopting new technology over the planning period. It is, however,foreseeable over a 60-year time horizon that farmers could adapt their farming technology inresponse to changing economic and environmental conditions. There are several socioeconomicfactors that would help or hinder adaptation and adoption of alternative technology. Forexample, income level, credit availability, risk and access to farm extension are all importantinfluences in technology adoption by farmers. Farmers’ adaptation and adoption of alternativetechnology is discussed in the following section with reference to the static representation oftechnology assumed in the model of the natural rice–shrimp system that has been presented.
5 Note that this is the case even when discount rates are zero
Figure 7. NPV Ratio (L:H) over different planning horizons and discount rates.
20 years 40 years 60 years
Discount rate
Zero Social Private
NP
V r
atio
(LH
)
1.0
0.5
0.0
139
Rice–shrimp farming in the Mekong Delta: biophysical and socioeconomic issuesedited by Nigel Preston and Helena Clayton
ACIAR Technical Reports No. 52e(printed version published in 2003)
Alternative rice–shrimp technology and land loss In some cases a static representation of technology may be an appropriate and realisticrepresentation of the land degradation problem. However, in other cases a static view of farmtechnology misrepresents the dynamic nature of rural development in which new technology canemerge as a result of farm-based trial and error, research and farm extension.
Currently in the project study area, some farmers have adopted rice–shrimp systems based onhatchery stocking of P. monodon shrimp rather than tidal recruitment of natural shrimp. It hasbeen through farmers’ trial-and-error, local extension activity and research activity of localuniversities and government departments in the Mekong Delta that P. monodon rice–shrimptechnology has become a production option for farmers. This alternative technology has someadvantages in the context of land loss because the system does not require high rates of waterexchange; however, the practice of P. monodon rice–shrimp systems in the Delta has not beenwithout its own sustainability problems. Uncertain and low shrimp survival is a problem ofcrucial concern with P. monodon technology because of the effects that risky survival can haveon economic viability and farm income risk (see Brennan this Report).
In Clayton (2002), the net benefits of the high water-exchange scenario and the P. monodon-based system were compared. The results challenge the conclusions drawn from the analysis ofland loss under a scenario of no technological change. With the introduction of alternativetechnology into the analysis, the high land-degrading scenario was found not to dominate underall circumstances. However, survival rates of at least 30% were found to be necessary forP. monodon to become an economically feasible option for farmers currently practising the highwater exchange rice–shrimp system. This result suggests that, to the extent that the technologicalenvironment is dynamic and adoption of low-risk and good-survival P. monodon technology ispossible, the long-run opportunity costs of land loss are underestimated under a staticrepresentation of technological change.
The results in Clayton (2002) indicate that there are potentially significant social benefits tobe gained from research and farm extension that work toward achieving high and stableP. monodon survival. Further discussion of the opportunities and constraints associated with theP. monodon rice–shrimp system is provided in a discussion of the policy implications below.
Policy implications and conclusions Under the implicit assumption that farmers do not have access to alternative production options,it was concluded that the high-exchange (high-degrading) system, is preferred under both short-and long-term evaluations. This was an expected result for the evaluation under short timehorizons and private discount rates. However, based on long time horizons (60 years) and lowdiscount rates (zero and 5%) these results were contrary to expectations. Nevertheless, the resultssuggest that the apparent problem of land degradation is not a social problem, and hence thereis not sufficient justification for policy or institutional intervention.
Despite these conclusions, the land degradation observed in the study area remains a concernfor local and provincial government officers and local farmers. The results from extended analysisreported on in this paper which incorporated alternative P. monodon technology suggests thatthere is a situation where it is socially and privately optimal not to degrade the land. The survivalrates of P. monodon, however, are pivotal in this, as under low survival rates the high-degradingnatural-shrimp system remains economically favourable from both private and social
140
Rice–shrimp farming in the Mekong Delta: biophysical and socioeconomic issuesedited by Nigel Preston and Helena Clayton
ACIAR Technical Reports No. 52e(printed version published in 2003)
perspectives. The shrimp survival rate continues to be one of the most contentious and difficultfactors in the sustainability of P. monodon-based technology.
The survival rates of P. monodon in the Gia Rai District are particularly low. Based on theresults discussed in this paper, it is not surprising that the continued practice of the naturalrice–shrimp system (i.e. the static view of technological change) is observed despite the land lossproblems encountered with sedimentation. To the extent that there is potential for survival toimprove in the longer term through technological and institutional development, the analysisdoes indicate that ‘market failure’ is likely to be a problem. Therefore, there is a case for publicinvestment into achieving improved shrimp survival. This will provide improved access forfarmers to economically sensible alternative rice–shrimp technology.
Credit policy is another area of concern in relation to the accessibility of alternativetechnology. Even if improved P. monodon technology (higher survival) were available, the poorlyfunctioning formal credit market in the Delta presents constraints for natural rice–shrimp farmersin adopting the alternative technology. Improved access to formal credit for rice–shrimp farmershas been an important policy consideration of the provincial and district Departments ofAgriculture and Rural Development in the study area.
Credit policy, however, is a complex policy area because of concerns about risk and farmindebtedness. In local credit policy in the study area, there is an expectation that loans beprovided to rice–shrimp farmers only as supplementary capital. The rationale for this is in partto limit the risk exposure of farmers raising P. monodon. Moreover, in some parts of the studyarea, mainly in My Xuyen, policy makers are currently grappling with growing concerns aboutthe intensification of shrimp production in the Delta by farmers either practising higher stockingrates or abandoning rice–shrimp systems and instead practising double shrimp-cropping systems.Credit policy will have an important role to play, socially and environmentally, in controllingintensification to manageable levels.
Overall, one of the main advantages of the tidal-recruitment rice–shrimp system is that verylittle cash outlay is required, making it a low-risk and accessible technology for the poorer farmersin the saline-affected agricultural areas in the Mekong Delta. However, the long-term land lossraises concern about the sustainability of the system. The opportunity costs of the land loss arehighlighted in the context of technological development. This paper argues that the economicproblem of land loss is strongly connected to problems of accessibility to non–land degradingtechnology that is economic for poorer farmers who are dependent on the tidal recruitment ofnatural shrimp. The survival rates of P. monodon and associated risk are areas of particularconcern in providing a viable alternative for farmers. Research evaluating the risks in theP. monodon system and farm management risk-spreading options (see Brennan this Report) fornatural rice–shrimp farmers wanting to adopt the P. monodon technology could provide animportant contribution in finding a solution to the land-loss problem addressed in this paper.Other technology options apart from the P. monodon-based systems are also important toconsider as an alternative to the high water-exchange natural system, which may provide thesame low water-exchange (non–land degrading) benefit as P. monodon technology but at lowerincome risk for farmers.
141
Rice–shrimp farming in the Mekong Delta: biophysical and socioeconomic issuesedited by Nigel Preston and Helena Clayton
ACIAR Technical Reports No. 52e(printed version published in 2003)
ReferencesBrennan, D. and Clayton, H. 1999. Bioeconomic modelling of shrimp farming practices in the rice–shrimp
system. Paper presented at the ACIAR Rice–Shrimp Workshop, Can Tho University, Can Tho,20–22 September 1999.
Brennan, D., Clayton, H., Tran Thanh Be and Tran The Nhu Hiep. 1999. Economic and social characteristicsand farm management practices of farms in the brackish water region of Soc Trang and Bac Lieu Provinces,Mekong Delta, Vietnam: results of a 1997 survey. ACIAR Rice–Shrimp Project Report.
Clayton, H. 2002. The economics of land degradation in the rice–shrimp system in the Mekong Delta, Vietnam.Unpublished Masters of Agricultural Economics Thesis, Department of Agricultural and ResourceEconomics, University of Sydney.
Johnston, D., Nguyen Van Trong, Truong Tran Tuan, Tran Thanh Xuan. 2000. Shrimp seed recruitment inmixed shrimp and mangrove forestry farms in Ca Mau Province, southern Vietnam. Aquaculture, 184(1–2),89–104.
142
Rice–shrimp farming in the Mekong Delta: biophysical and socioeconomic issuesedited by Nigel Preston and Helena Clayton
ACIAR Technical Reports No. 52e(printed version published in 2003)
CHAPTER 12
Land evaluation and land use planning of the area for rice–shrimp systems, Gia Rai District of Bac Lieu Province
Le Quang Tri
1
, Vo Quang Minh
1
and Vo Tong Xuan
2
1
Soil sciences and Land Management Department, College of Agriculture, Can Tho University,
2
An Giang University/Farming System Research and Development Institute, Can Tho UniversityEmail Le Quang Tri: [email protected]
Abstract
The study area is situated in the southern part of National Highway No. 1 in Gia Rai District(Bac Lieu Province) where farmers have traditionally practised rain-fed rice cultivation.However, in the last five years the high profits possible from shrimp production have led manyfarmers in the study area to convert their rice fields to shrimp production. This has occurred withlimited land use planning from government. In this study the suitability of land under differentfarming practices (in particular rice–shrimp farming) is assessed and recommendations are madefor land use planning. These recommendations incorporated government objectives and theneeds of local farmers. The study involved both soil and household surveys where a total of 249soil observation points were made and a total of 264 households were interviewed aboutsocioeconomic concerns. Land mapping units (LMU) were employed as a basis for the landevaluation. The land mapping units were identified on the basis of combinations of climatic, soiland hydrological characteristics — each of the 22 LMUs identified can be described in terms ofsoil type, rainfall, length of rainy period, maximum inundation depth, length of inundationperiod, tidal magnitude and present land use. The biophysical qualities of each LMU werecombined with information about the required land qualities of four key land use types (LUT)to provide insights for land use planning in the study region. The land use types included in thestudy were double rice cropping (LUT1), rice–shrimp (LUT2), improved–extensive shrimp(LUT3), and extensive shrimp (LUT4). The results showed that only LUT3 and LUT4 werehighly and moderately suitable for all LMUs, indicating that there is potential for fisherydevelopment in the study area. In several of the LMUs, however, LUT1 was found to be highlysuitable and LUT3 and LUT4 only moderately to marginally suitable. The results from theassessment of land suitability were used to evaluate three land-use planning scenarios. Thesescenarios were: 1. maximise rice area; 2. maximise shrimp area; 3. develop separate zones forintensive rice cultivation and shrimp-based systems prioritising rice–shrimp systems. The localgovernment objectives are most supportive of scenario 3; therefore, in this paper only the resultsfor this scenario are shown
3
.
O
NE
ISSUE
THAT
has been raised in studies on the agricultural development in the Mekong Deltaover the last decade is protection of rice land in the coastal area of the Mekong Delta (Xuan andMatsui 1998). The rice area in the coastal zone is under severe pressure from rapidly increasing
3
The results for scenarios 1 and 2 are found in the paper presented at the final ACIAR workshop, December 2000, Can Tho University, Vietnam.
143
Rice–shrimp farming in the Mekong Delta: biophysical and socioeconomic issuesedited by Nigel Preston and Helena Clayton
ACIAR Technical Reports No. 52e(printed version published in 2003)
human population and conversion of rice fields into aquaculture farms. The high profits fromshrimp production and the natural saline conditions have been a strong stimulus to theconversion to shrimp production.
Several sustainability issues have been associated with the fast-changing development inaquaculture production, including water pollution, shrimp disease and soil salinisation.Salinisation impacts arising from shrimp cultivation have meant that agricultural production inthe coastal area has become very complicated and unstable. The very limited application of landuse planning in the development of aquaculture systems in the coastal agricultural zone of theMekong Delta has, in part, contributed to the sustainability problems that have been arising. Thepurpose of the research presented in this paper is to assist local government in Gia Rai to developland use plans for the integration of shrimp-based systems, particularly rice–shrimp systems, inthe study area.
The study was undertaken in the area situated south of National Highway No. 1 of Gia RaiDistrict. Land evaluation techniques were drawn upon to assess the capacity and suitability ofland in the study area for selected land use practices. The basis of the land evaluation wasidentification of land mapping units, each defined on the basis of combinations of climatic, soiland hydrological characteristics. The suitability of different land use types, particularlyrice–shrimp systems, was assessed for each of the land map units. The study was conductedbetween October 1999 and July 2000 and involved a study team of scientists from the SoilScience and Land Management Department and the Farming System Research andDevelopment Institute at Can Tho University. This paper is a summary of a larger research reportpresented at the final workshop of the ACIAR rice–shrimp project at Can Tho University inDecember 2000.
In addition to this study, a broader land evaluation study was also conducted as part of theACIAR rice–shrimp project (Vo Quang Minh and Le Quang Tri 2000). In this broader studythe land suitability was assessed for seven promising land use types across the ACIAR studyregion of My Xuyen and Gia Rai districts. The land use types considered in the study were:traditional rice and upland cropping (1); summer–autumn modern rice followed by copping oftraditional rice (2); upland cropping (3); autumn–winter modern rice–shrimp/crab (4); shrimponly (5); salt pan and artemia (6); and forest and shrimp (7). The results from the land suitabilityevaluation indicated that land use types 3, 4 and 5 were the most suitable land uses in theACIAR study area and that land use type 4 (rice–shrimp farming) was highly suited to more than50% of the total area of the study region.
Land Use Planning
General overview
Land use planning is the systematic assessment of land and water potential, alternatives for landuse, and economic and social conditions in order to select and adopt the best land use options(FAO 1993). Its purpose is to select and put into practice those land uses that will best meet theneeds of the people while safeguarding resources for the future. The driving force in planning isthe need for change, the need for improved management or the need for a quite different patternof land use dictated by changing circumstances. Two conditions must be met if planning is to beuseful: the need for change in land use or action to prevent some unwanted change must be
144
Rice–shrimp farming in the Mekong Delta: biophysical and socioeconomic issuesedited by Nigel Preston and Helena Clayton
ACIAR Technical Reports No. 52e(printed version published in 2003)
accepted by the people involved, and there must be the political will and ability to put the planinto effect.
Land use planning for rice–shrimp system
Planning to make the best use of land is not a new idea in the Mekong Delta, particularly in GiaRai. Over the years, farmers have made plans season after season, making decisions on what togrow and where to grow it. Their decisions have been made according to their own needs, theirknowledge of the land and technology, and labour and capital available. As size of the area, thenumber of people involved and the complexity of the problem increase, so does the need forinformation and rigorous methods of analysis and planning. Land use planning recommendationsare presented in this study. These recommendations are based on results from the land evaluationand incorporate objectives of local government, including the identification of the areas mostsuited to rice–shrimp farming.
Land use planning objectives
The land use planning objectives for local government in Gia Rai identified in this study areoutlined below:• keeping rice production for food security • overcoming production restrictions arising from saline intrusion and implementing land use
planning to take advantage of saline conditions, such as production of shrimp for the exportmarket
• identifying land areas with potential for aquaculture production, particularly shrimpcultivation
• increasing areas of rice–shrimp and shrimp systems• establishing two production areas, one for rice and rice–shrimp, and another for shrimp
production only• increasing farmer income.
Physical conditions in the study area
General information on the study area
The research area in this study was made up of around 50 000 ha in Gia Rai District (Bac LieuProvince) located south of the National Highway No. 1 and consisted of seven villages and threetowns. The area is affected by saline water intrusion in the dry season. In the rainy season,flooding affects the area.
The total population in Gia Rai District was estimated at 240 339 people in 1999. Themajority of the population is made up of Kinh people, although in 1999 around 9411 Khmerpeople were living in the district. The average population density of the district is about 294people/km
2
, with about 5.1 people per household. The distribution of people in the district is notthe same for each village — most of people are concentrated along the canal and along the road,and the population becomes more scattered in the inland areas.
Climatic conditions
Climatic conditions of Bac Lieu Province (rainfall distribution, length of rain-fed season,temperature, air humidity and evaporation) are generally the same as Mekong Delta conditions,with dry and wet seasons during the years.
145
Rice–shrimp farming in the Mekong Delta: biophysical and socioeconomic issuesedited by Nigel Preston and Helena Clayton
ACIAR Technical Reports No. 52e(printed version published in 2003)
Temperature (
o
C)
Average air temperature of different months change from 25
o
C to 28.4
o
C, highest in April andlowest in January.
Rainfall distribution
Total average rainfall in the year is about 1800 mm, concentrated mostly in the rainy season.About 90% falls from May to November, with highest levels recorded in September (249 mm)and October (295 mm). Based on data collected and crop water requirements, the total rainfallduring this rainy season is just enough for two rice crops in the case of rain-fed cultivation.
Evaporation
The average monthly evaporation in several years of the research area changes from 48 mm inJuly to 111 mm in March. In the research area, the highest evaporation occurs in the dry seasonfrom December to March.
Hydrological conditions
Gia Rai District, located along the coast, is subject to salt-water intrusion from the sea duringthe dry season. Therefore, all canal and river systems are affected by the semi-tidal regime of theEast Sea through Ganh Hao River and Ho Phong-Ganh Hao Dinh. The salinity-control sluicegate system on the northern side of Highway No. 1 distributes to most canals south of thehighway. Tidal fluctuation is very high, especially near the sluice gates, eg. in Ganh Hao theaverage tidal fluctuation is 2.85 m. Saline water intrusion is the major problem for agriculture inthe district, especially in the southern part of National Road No.1 of district which is affectedby tidal movement.
Soil
Soils in Gia Rai District generally, and in the study area particularly, change greatly withlandform differences from inland to the coast; they also have different soil developmentprocesses. The soils located in the high topography (inland) were developed with the presenceof B horizon in the profile. In contrast, near the coast the soils are still young and less developedbecause of the daily tidal-flooding effect.
Based on the soil map of Gia Rai District, 1/25.000 compiled by the National Institute forAgricultural Planning and Projection (NIAPP), 20 transects were made for the soil survey tocorrect the existing map. The survey results obtained for the study area can be shown throughthe soil map at the scale of 1:25 000 (NIAPP 1995). Generally, all soils within the study areaderived from a unique parent material of recent alluvial deposits, with an age less than 10 000years (late Holocene). Soil processes are mainly alluvial accumulation from marine origin. In thisstudy, three major soil groups with eleven soil types were found. These are outlined in Table 1.
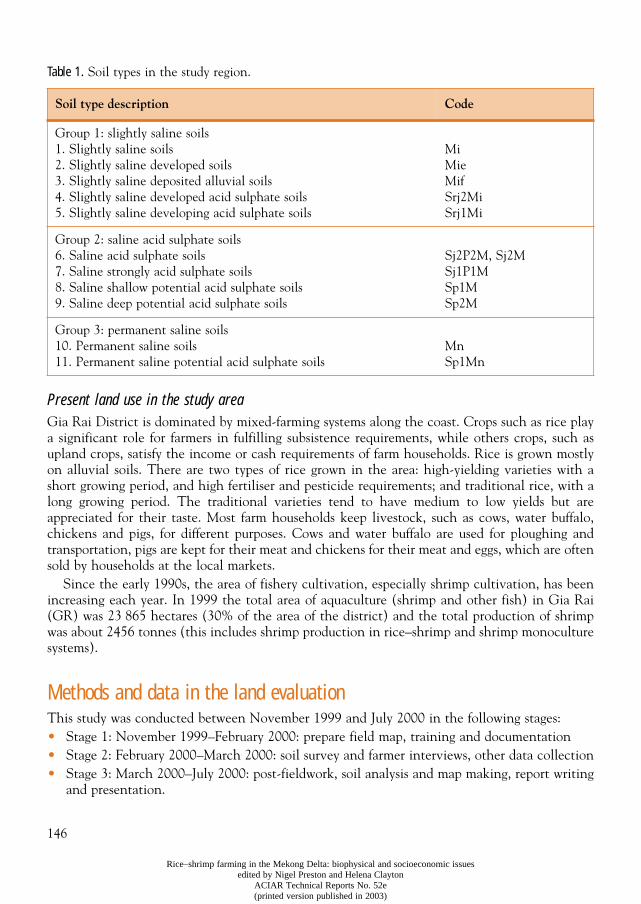
146
Rice–shrimp farming in the Mekong Delta: biophysical and socioeconomic issuesedited by Nigel Preston and Helena Clayton
ACIAR Technical Reports No. 52e(printed version published in 2003)
Table 1.
Soil types in the study region.
Present land use in the study area
Gia Rai District is dominated by mixed-farming systems along the coast. Crops such as rice playa significant role for farmers in fulfilling subsistence requirements, while others crops, such asupland crops, satisfy the income or cash requirements of farm households. Rice is grown mostlyon alluvial soils. There are two types of rice grown in the area: high-yielding varieties with ashort growing period, and high fertiliser and pesticide requirements; and traditional rice, with along growing period. The traditional varieties tend to have medium to low yields but areappreciated for their taste. Most farm households keep livestock, such as cows, water buffalo,chickens and pigs, for different purposes. Cows and water buffalo are used for ploughing andtransportation, pigs are kept for their meat and chickens for their meat and eggs, which are oftensold by households at the local markets.
Since the early 1990s, the area of fishery cultivation, especially shrimp cultivation, has beenincreasing each year. In 1999 the total area of aquaculture (shrimp and other fish) in Gia Rai(GR) was 23 865 hectares (30% of the area of the district) and the total production of shrimpwas about 2456 tonnes (this includes shrimp production in rice–shrimp and shrimp monoculturesystems).
Methods and data in the land evaluation
This study was conducted between November 1999 and July 2000 in the following stages:• Stage 1: November 1999–February 2000: prepare field map, training and documentation• Stage 2: February 2000–March 2000: soil survey and farmer interviews, other data collection• Stage 3: March 2000–July 2000: post-fieldwork, soil analysis and map making, report writing
and presentation.
Soil type description Code
Group 1: slightly saline soils1. Slightly saline soils2. Slightly saline developed soils3. Slightly saline deposited alluvial soils4. Slightly saline developed acid sulphate soils5. Slightly saline developing acid sulphate soils
MiMieMifSrj2MiSrj1Mi
Group 2: saline acid sulphate soils6. Saline acid sulphate soils7. Saline strongly acid sulphate soils8. Saline shallow potential acid sulphate soils9. Saline deep potential acid sulphate soils
Sj2P2M, Sj2MSj1P1MSp1MSp2M
Group 3: permanent saline soils10. Permanent saline soils11. Permanent saline potential acid sulphate soils
MnSp1Mn
147
Rice–shrimp farming in the Mekong Delta: biophysical and socioeconomic issuesedited by Nigel Preston and Helena Clayton
ACIAR Technical Reports No. 52e(printed version published in 2003)
Surveys and data
Monthly climatic data from the last ten years (1989–1999) were collected at the nearestmeteorology station (Bac Lieu Station). Data and maps of hydrology were also collected. Thesedata were used to evaluate the effect of climate and hydrology on crop cultivation and croppingsystems in the area. In the research area, besides soil survey and field data collection, data onmaximum inundation depth, length of flooding, and the saline water situation were collected forhydrological evaluation.
The precise area and administration map for the study area was obtained from the Cadastraldata of Gia Rai District (at scale 1:25 000). In total, 249 survey locations were identified throughthe 20 transect walks that crossed over the study area.
The soil survey activity was conducted from February to March 2000. Three survey groupswere formed and the survey performed on the basis of the predefined observation points and fieldtruth measurements.
Socio-economic survey
Present land use systems, cultural practices and related socioeconomic dimensions wereinvestigated through farmer interviews. A total 264 households were interviewed in thesocioeconomic survey by questionnaire. The main contents of questionnaire were:• household-farm resources• farm activities and farm inputs • on-farm, non-farm and off-farm income• farm household expenditures• other economic factors important to land use: credit, marketing, agricultural services• farmers’ problems: physical, biological and socio-economic • farmer suggestions.
Land evaluation procedure
The land evaluation procedure involved matching land quality characteristics in defined landmapping units (LMU) with the land quality requirements of specified land use types. Throughsuch a matching, the land suitability can be evaluated for different land use types for each of theLMUs evaluated in the study (FAO 1976).
Details of the land evaluation procedure and land use planning are shown in Figure 1. Thepurpose of the land evaluation is to assess the suitability of different land use types given the landqualities in the study area. The land evaluation results can then be used in combination withdevelopment objectives to conduct land use planning. Each step in the land evaluation in thisstudy is described below.
Step 1. Define the land mapping units.
The LMUs are based on combinations of climatic, soil and hydrological characteristics. TwentyLMUs were identified in this study. The characteristics of each LMU are described in terms ofsoil type, rainfall, length of rainy period, maximum inundation depth, length of inundationperiod, tidal magnitude and present land use. Classes for each of the physical characteristics areshown in Table 2.
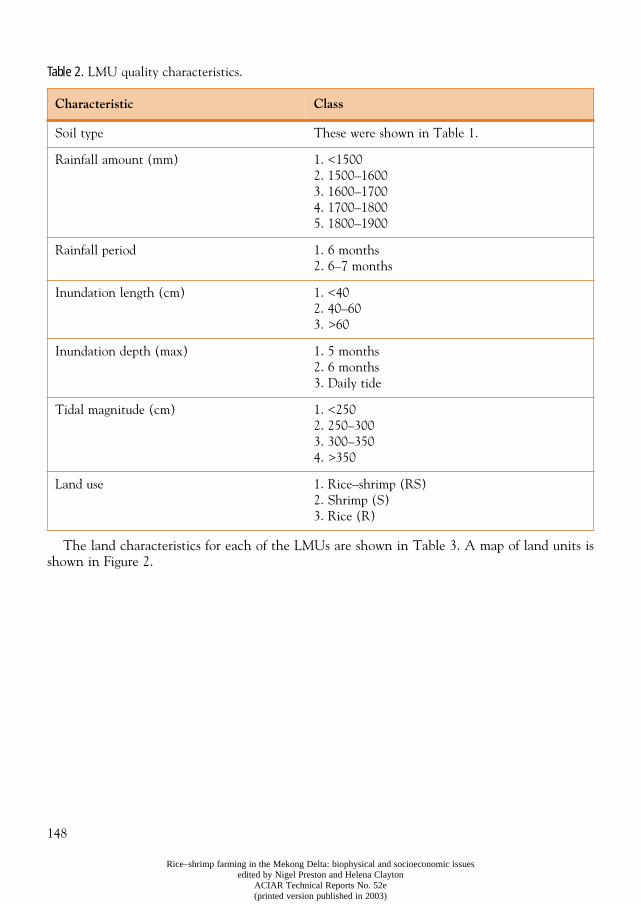
148
Rice–shrimp farming in the Mekong Delta: biophysical and socioeconomic issuesedited by Nigel Preston and Helena Clayton
ACIAR Technical Reports No. 52e(printed version published in 2003)
Table 2.
LMU quality characteristics.
The land characteristics for each of the LMUs are shown in Table 3. A map of land units isshown in Figure 2.
Characteristic Class
Soil type These were shown in Table 1.
Rainfall amount (mm) 1. <15002. 1500–16003. 1600–17004. 1700–18005. 1800–1900
Rainfall period 1. 6 months2. 6–7 months
Inundation length (cm) 1. <402. 40–603. >60
Inundation depth (max) 1. 5 months2. 6 months3. Daily tide
Tidal magnitude (cm) 1. <2502. 250–3003. 300–3504. >350
Land use 1. Rice–shrimp (RS)2. Shrimp (S)3. Rice (R)
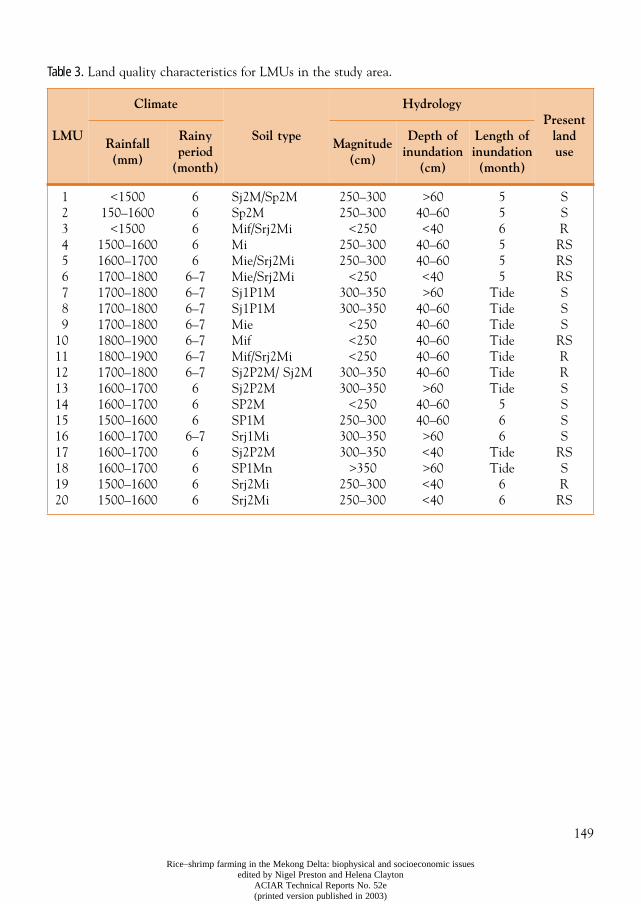
149
Rice–shrimp farming in the Mekong Delta: biophysical and socioeconomic issuesedited by Nigel Preston and Helena Clayton
ACIAR Technical Reports No. 52e(printed version published in 2003)
Table 3.
Land quality characteristics for LMUs in the study area.
LMU
Climate
Soil type
HydrologyPresent
land use
Rainfall (mm)
Rainy period
(month)
Magnitude (cm)
Depth of inundation
(cm)
Length of inundation (month)
123456789
1011121314151617181920
<1500150–1600
<15001500–16001600–17001700–18001700–18001700–18001700–18001800–19001800–19001700–18001600–17001600–17001500–16001600–17001600–17001600–17001500–16001500–1600
66666
6–76–76–76–76–76–76–7666
6–76666
Sj2M/Sp2MSp2MMif/Srj2MiMiMie/Srj2MiMie/Srj2MiSj1P1MSj1P1MMieMifMif/Srj2MiSj2P2M/ Sj2MSj2P2MSP2MSP1MSrj1MiSj2P2MSP1MnSrj2MiSrj2Mi
250–300250–300
<250250–300250–300
<250300–350300–350
<250<250<250
300–350300–350
<250250–300300–350300–350
>350250–300250–300
>6040–60<40
40–6040–60<40>60
40–6040–6040–6040–6040–60>60
40–6040–60>60<40>60<40<40
556555
TideTideTideTideTideTideTide
566
TideTide
66
SSR
RSRSRSSSS
RSRRSSSS
RSSR
RS
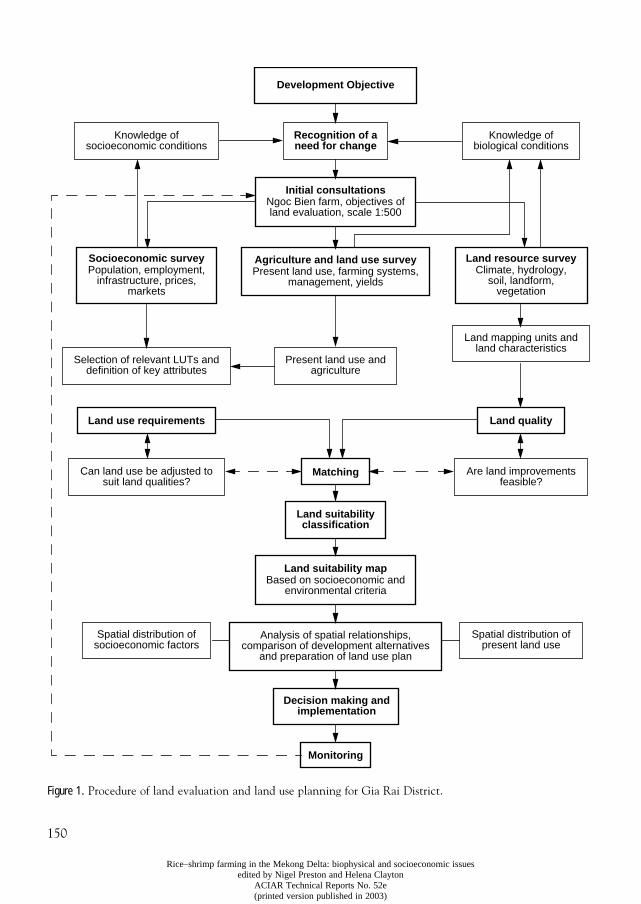
150
Rice–shrimp farming in the Mekong Delta: biophysical and socioeconomic issuesedited by Nigel Preston and Helena Clayton
ACIAR Technical Reports No. 52e(printed version published in 2003)
Figure 1.
Procedure of land evaluation and land use planning for Gia Rai District.
Development Objective
Knowledge ofsocioeconomic conditions
Recognition of aneed for change
Initial consultations
Knowledge ofbiological conditions
Ngoc Bien farm, objectives ofland evaluation, scale 1:500
Socioeconomic surveyPopulation, employment,
infrastructure, prices,markets
Agriculture and land use surveyPresent land use, farming systems,
management, yields
Land resource surveyClimate, hydrology,
soil, landform,vegetation
Selection of relevant LUTs anddefinition of key attributes
Present land use andagriculture
Land mapping units andland characteristics
Land use requirements Land quality
Can land use be adjusted tosuit land qualities?
Matching Are land improvementsfeasible?
Land suitabilityclassification
Land suitability mapBased on socioeconomic and
environmental criteria
Spatial distribution ofsocioeconomic factors
Analysis of spatial relationships,comparison of development alternatives
and preparation of land use plan
Spatial distribution ofpresent land use
Decision making andimplementation
Monitoring
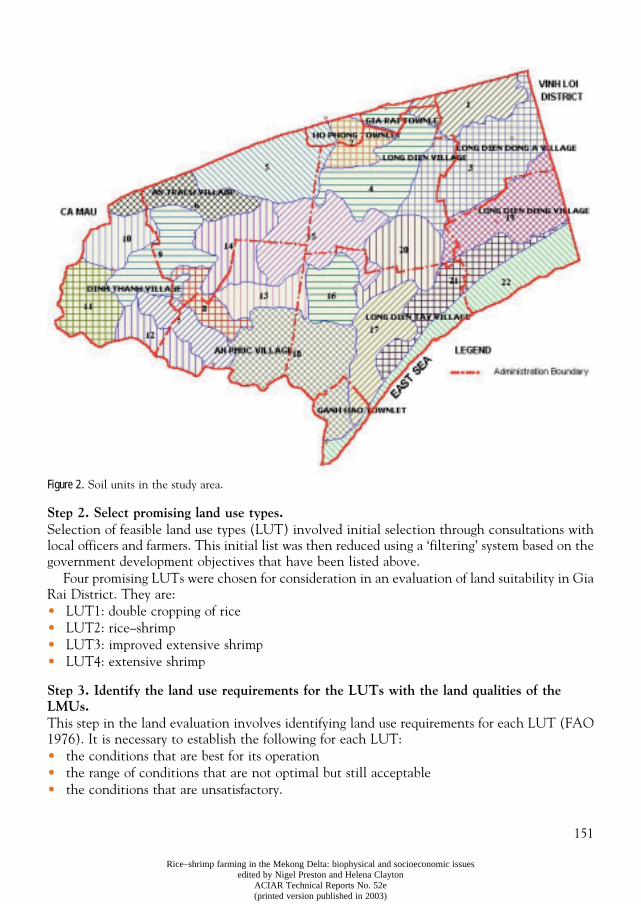
151
Rice–shrimp farming in the Mekong Delta: biophysical and socioeconomic issuesedited by Nigel Preston and Helena Clayton
ACIAR Technical Reports No. 52e(printed version published in 2003)
Figure 2.
Soil units in the study area.
Step 2. Select promising land use types.
Selection of feasible land use types (LUT) involved initial selection through consultations withlocal officers and farmers. This initial list was then reduced using a ‘filtering’ system based on thegovernment development objectives that have been listed above.
Four promising LUTs were chosen for consideration in an evaluation of land suitability in GiaRai District. They are:• LUT1: double cropping of rice• LUT2: rice–shrimp • LUT3: improved extensive shrimp• LUT4: extensive shrimp
Step 3. Identify the land use requirements for the LUTs with the land qualities of the LMUs.
This step in the land evaluation involves identifying land use requirements for each LUT (FAO1976). It is necessary to establish the following for each LUT:• the conditions that are best for its operation• the range of conditions that are not optimal but still acceptable• the conditions that are unsatisfactory.
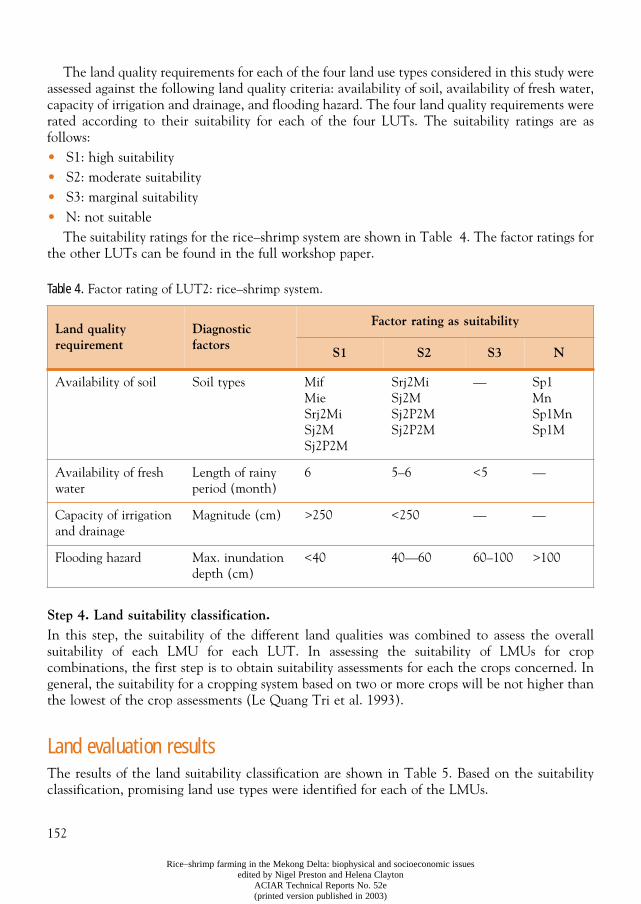
152
Rice–shrimp farming in the Mekong Delta: biophysical and socioeconomic issuesedited by Nigel Preston and Helena Clayton
ACIAR Technical Reports No. 52e(printed version published in 2003)
The land quality requirements for each of the four land use types considered in this study wereassessed against the following land quality criteria: availability of soil, availability of fresh water,capacity of irrigation and drainage, and flooding hazard. The four land quality requirements wererated according to their suitability for each of the four LUTs. The suitability ratings are asfollows:• S1: high suitability• S2: moderate suitability• S3: marginal suitability• N: not suitable
The suitability ratings for the rice–shrimp system are shown in Table 4. The factor ratings forthe other LUTs can be found in the full workshop paper.
Table 4.
Factor rating of LUT2: rice–shrimp system.
Step 4. Land suitability classification.
In this step, the suitability of the different land qualities was combined to assess the overallsuitability of each LMU for each LUT. In assessing the suitability of LMUs for cropcombinations, the first step is to obtain suitability assessments for each the crops concerned. Ingeneral, the suitability for a cropping system based on two or more crops will be not higher thanthe lowest of the crop assessments (Le Quang Tri et al. 1993).
Land evaluation results
The results of the land suitability classification are shown in Table 5. Based on the suitabilityclassification, promising land use types were identified for each of the LMUs.
Land quality requirement
Diagnostic factors
Factor rating as suitability
S1 S2 S3 N
Availability of soil Soil types MifMieSrj2MiSj2MSj2P2M
Srj2MiSj2MSj2P2MSj2P2M
— Sp1Mn Sp1MnSp1M
Availability of fresh water
Length of rainy period (month)
6 5–6 <5 —
Capacity of irrigation and drainage
Magnitude (cm) >250 <250 — —
Flooding hazard Max. inundation depth (cm)
<40 40—60 60–100 >100
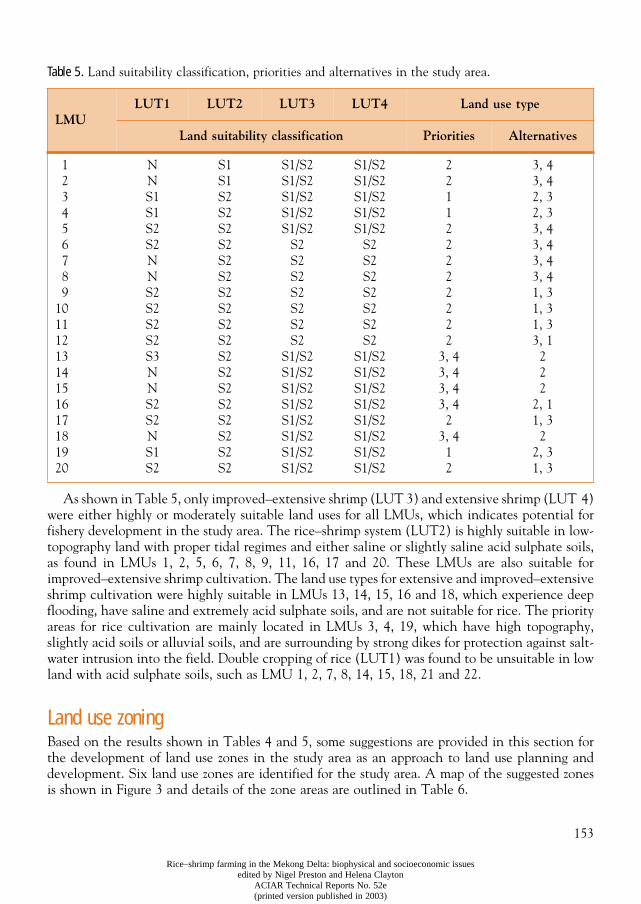
153
Rice–shrimp farming in the Mekong Delta: biophysical and socioeconomic issuesedited by Nigel Preston and Helena Clayton
ACIAR Technical Reports No. 52e(printed version published in 2003)
Table 5.
Land suitability classification, priorities and alternatives in the study area.
As shown in Table 5, only improved–extensive shrimp (LUT 3) and extensive shrimp (LUT 4)were either highly or moderately suitable land uses for all LMUs, which indicates potential forfishery development in the study area. The rice–shrimp system (LUT2) is highly suitable in low-topography land with proper tidal regimes and either saline or slightly saline acid sulphate soils,as found in LMUs 1, 2, 5, 6, 7, 8, 9, 11, 16, 17 and 20. These LMUs are also suitable forimproved–extensive shrimp cultivation. The land use types for extensive and improved–extensiveshrimp cultivation were highly suitable in LMUs 13, 14, 15, 16 and 18, which experience deepflooding, have saline and extremely acid sulphate soils, and are not suitable for rice. The priorityareas for rice cultivation are mainly located in LMUs 3, 4, 19, which have high topography,slightly acid soils or alluvial soils, and are surrounding by strong dikes for protection against salt-water intrusion into the field. Double cropping of rice (LUT1) was found to be unsuitable in lowland with acid sulphate soils, such as LMU 1, 2, 7, 8, 14, 15, 18, 21 and 22.
Land use zoning
Based on the results shown in Tables 4 and 5, some suggestions are provided in this section forthe development of land use zones in the study area as an approach to land use planning anddevelopment. Six land use zones are identified for the study area. A map of the suggested zonesis shown in Figure 3 and details of the zone areas are outlined in Table 6.
LMULUT1 LUT2 LUT3 LUT4 Land use type
Land suitability classification Priorities Alternatives
123456789
1011121314151617181920
NNS1S1S2S2NNS2S2S2S2S3NNS2S2NS1S2
S1S1S2S2S2S2S2S2S2S2S2S2S2S2S2S2S2S2S2S2
S1/S2S1/S2S1/S2S1/S2S1/S2
S2S2S2S2S2S2S2
S1/S2S1/S2S1/S2S1/S2S1/S2S1/S2S1/S2S1/S2
S1/S2S1/S2S1/S2S1/S2S1/S2
S2S2S2S2S2S2S2
S1/S2S1/S2S1/S2S1/S2S1/S2S1/S2S1/S2S1/S2
221122222222
3, 43, 43, 43, 4
23, 4
12
3, 43, 42, 32, 33, 43, 43, 43, 41, 31, 31, 33, 1
222
2, 11, 3
22, 31, 3
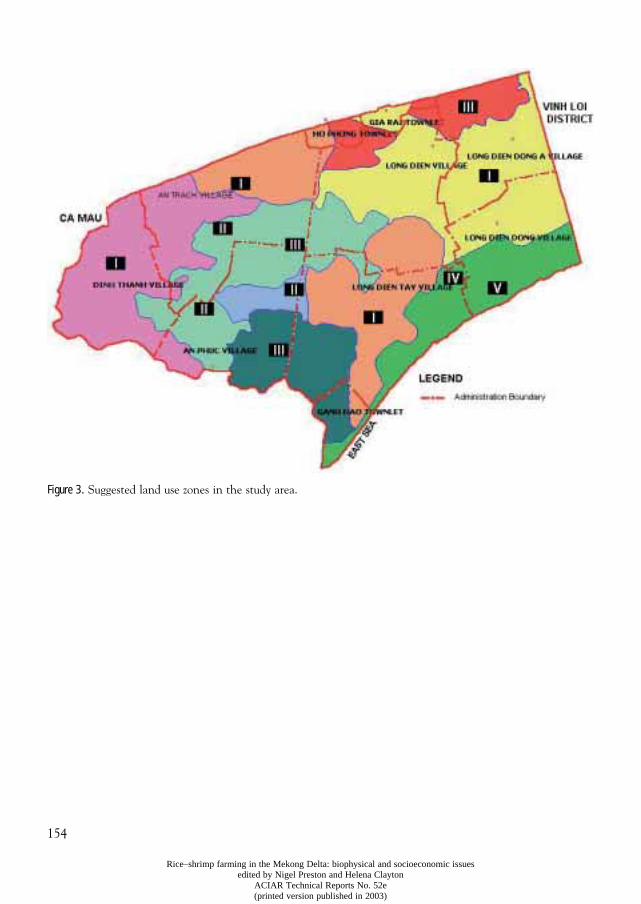
154
Rice–shrimp farming in the Mekong Delta: biophysical and socioeconomic issuesedited by Nigel Preston and Helena Clayton
ACIAR Technical Reports No. 52e(printed version published in 2003)
Figure 3.
Suggested land use zones in the study area.
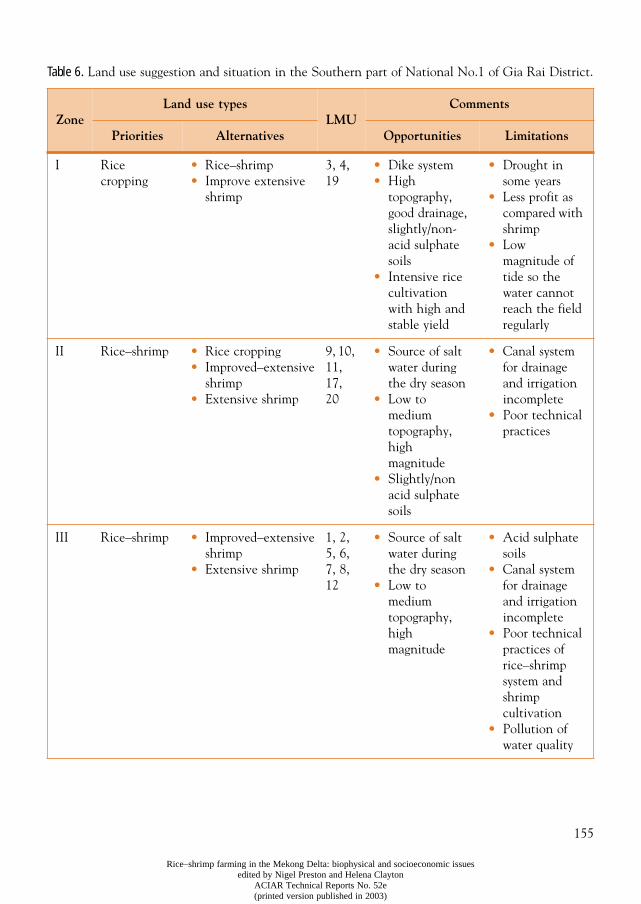
155
Rice–shrimp farming in the Mekong Delta: biophysical and socioeconomic issuesedited by Nigel Preston and Helena Clayton
ACIAR Technical Reports No. 52e(printed version published in 2003)
Table 6.
Land use suggestion and situation in the Southern part of National No.1 of Gia Rai District.
ZoneLand use types
LMUComments
Priorities Alternatives Opportunities Limitations
I Rice cropping
• Rice–shrimp• Improve extensive
shrimp
3, 4, 19
• Dike system• High
topography, good drainage, slightly/non-acid sulphate soils
• Intensive rice cultivation with high and stable yield
• Drought in some years
• Less profit as compared with shrimp
• Low magnitude of tide so the water cannot reach the field regularly
II Rice–shrimp • Rice cropping• Improved–extensive
shrimp • Extensive shrimp
9, 10, 11, 17, 20
• Source of salt water during the dry season
• Low to medium topography, high magnitude
• Slightly/non acid sulphate soils
• Canal system for drainage and irrigation incomplete
• Poor technical practices
III Rice–shrimp • Improved–extensive shrimp
• Extensive shrimp
1, 2, 5, 6, 7, 8, 12
• Source of salt water during the dry season
• Low to medium topography, high magnitude
• Acid sulphate soils
• Canal system for drainage and irrigation incomplete
• Poor technical practices of rice–shrimp system and shrimp cultivation
• Pollution of water quality
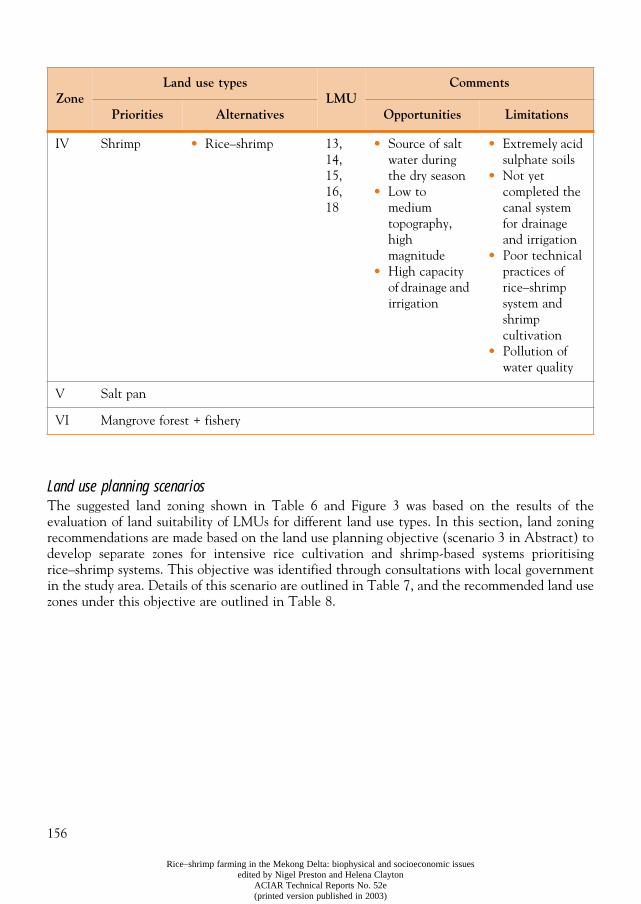
156
Rice–shrimp farming in the Mekong Delta: biophysical and socioeconomic issuesedited by Nigel Preston and Helena Clayton
ACIAR Technical Reports No. 52e(printed version published in 2003)
Land use planning scenarios
The suggested land zoning shown in Table 6 and Figure 3 was based on the results of theevaluation of land suitability of LMUs for different land use types. In this section, land zoningrecommendations are made based on the land use planning objective (scenario 3 in Abstract) todevelop separate zones for intensive rice cultivation and shrimp-based systems prioritisingrice–shrimp systems. This objective was identified through consultations with local governmentin the study area. Details of this scenario are outlined in Table 7, and the recommended land usezones under this objective are outlined in Table 8.
IV Shrimp • Rice–shrimp 13, 14, 15, 16, 18
• Source of salt water during the dry season
• Low to medium topography, high magnitude
• High capacity of drainage and irrigation
• Extremely acid sulphate soils
• Not yet completed the canal system for drainage and irrigation
• Poor technical practices of rice–shrimp system and shrimp cultivation
• Pollution of water quality
V Salt pan
VI Mangrove forest + fishery
ZoneLand use types
LMUComments
Priorities Alternatives Opportunities Limitations
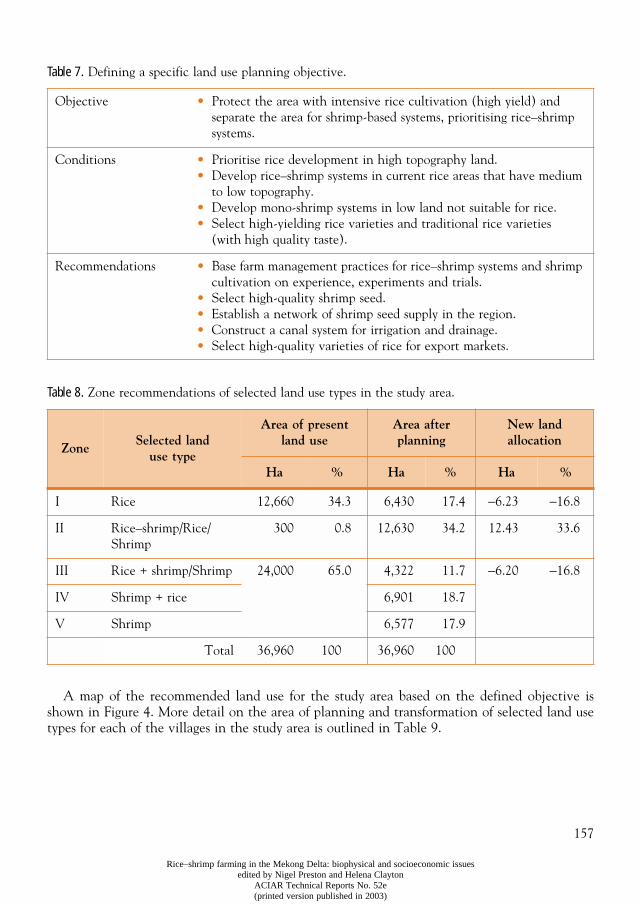
157
Rice–shrimp farming in the Mekong Delta: biophysical and socioeconomic issuesedited by Nigel Preston and Helena Clayton
ACIAR Technical Reports No. 52e(printed version published in 2003)
Table 7.
Defining a specific land use planning objective.
Table 8.
Zone recommendations of selected land use types in the study area.
A map of the recommended land use for the study area based on the defined objective isshown in Figure 4. More detail on the area of planning and transformation of selected land usetypes for each of the villages in the study area is outlined in Table 9.
Objective • Protect the area with intensive rice cultivation (high yield) and separate the area for shrimp-based systems, prioritising rice–shrimp systems.
Conditions • Prioritise rice development in high topography land.• Develop rice–shrimp systems in current rice areas that have medium
to low topography. • Develop mono-shrimp systems in low land not suitable for rice. • Select high-yielding rice varieties and traditional rice varieties
(with high quality taste).
Recommendations • Base farm management practices for rice–shrimp systems and shrimp cultivation on experience, experiments and trials.
• Select high-quality shrimp seed.• Establish a network of shrimp seed supply in the region.• Construct a canal system for irrigation and drainage.• Select high-quality varieties of rice for export markets.
ZoneSelected land
use type
Area of present land use
Area after planning
New land allocation
Ha % Ha % Ha %
I Rice 12,660 34.3 6,430 17.4
−
6.23
−
16.8
II Rice–shrimp/Rice/Shrimp
300 0.8 12,630 34.2 12.43 33.6
III Rice + shrimp/Shrimp 24,000 65.0 4,322 11.7
−
6.20
−
16.8
IV Shrimp + rice 6,901 18.7
V Shrimp 6,577 17.9
Total 36,960 100 36,960 100
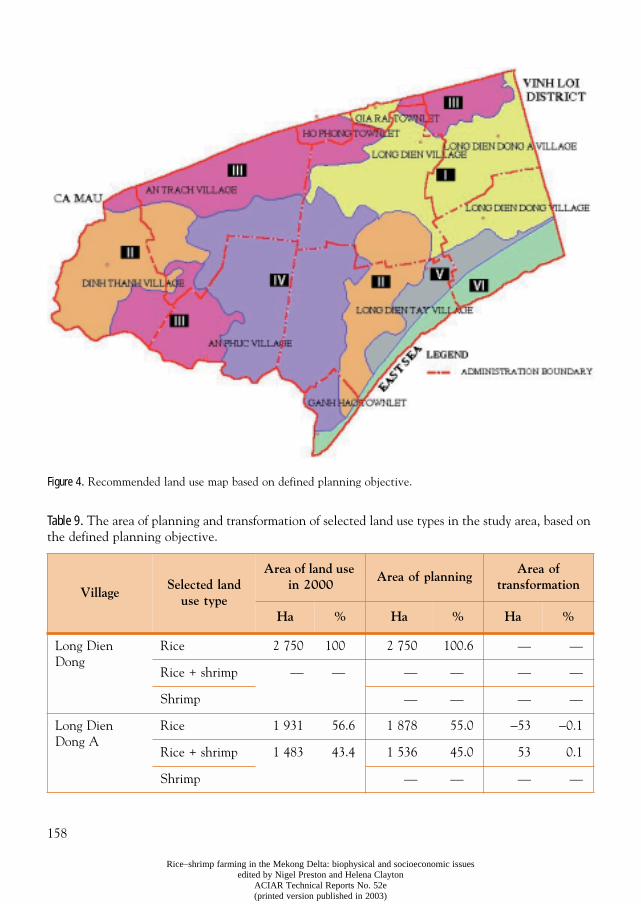
158
Rice–shrimp farming in the Mekong Delta: biophysical and socioeconomic issuesedited by Nigel Preston and Helena Clayton
ACIAR Technical Reports No. 52e(printed version published in 2003)
Figure 4.
Recommended land use map based on defined planning objective.
Table 9.
The area of planning and transformation of selected land use types in the study area, based on the defined planning objective.
VillageSelected land
use type
Area of land use in 2000
Area of planningArea of
transformation
Ha % Ha % Ha %
Long Dien Dong
Rice 2 750 100 2 750 100.6 — —
Rice + shrimp — — — — — —
Shrimp — — — —
Long Dien Dong A
Rice 1 931 56.6 1 878 55.0
−
53
−
0.1
Rice + shrimp 1 483 43.4 1 536 45.0 53 0.1
Shrimp — — — —
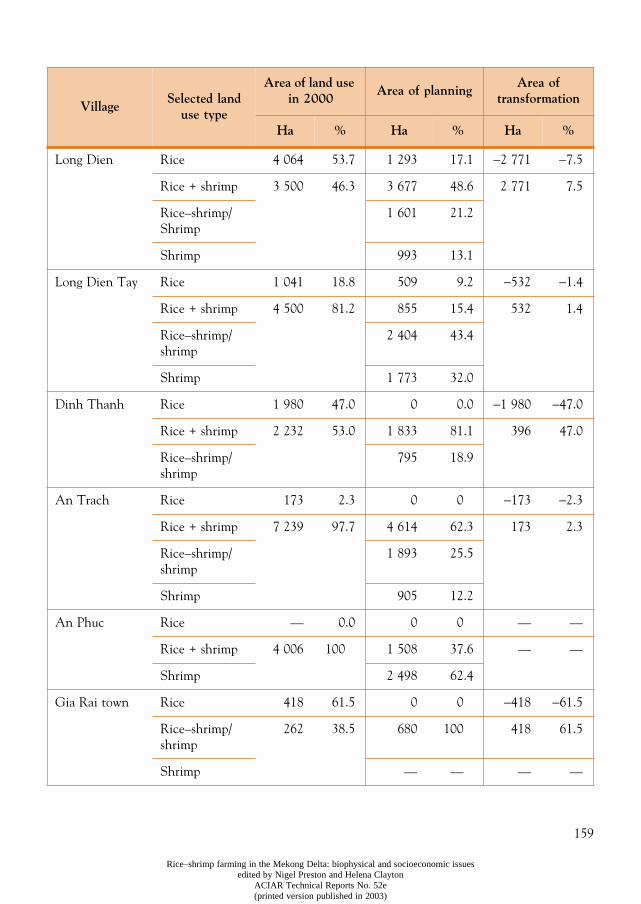
159
Rice–shrimp farming in the Mekong Delta: biophysical and socioeconomic issuesedited by Nigel Preston and Helena Clayton
ACIAR Technical Reports No. 52e(printed version published in 2003)
Long Dien Rice 4 064 53.7 1 293 17.1 −2 771 −7.5
Rice + shrimp 3 500 46.3 3 677 48.6 2 771 7.5
Rice–shrimp/ Shrimp
1 601 21.2
Shrimp 993 13.1
Long Dien Tay Rice 1 041 18.8 509 9.2 −532 −1.4
Rice + shrimp 4 500 81.2 855 15.4 532 1.4
Rice–shrimp/ shrimp
2 404 43.4
Shrimp 1 773 32.0
Dinh Thanh Rice 1 980 47.0 0 0.0 −1 980 −47.0
Rice + shrimp 2 232 53.0 1 833 81.1 396 47.0
Rice–shrimp/ shrimp
795 18.9
An Trach Rice 173 2.3 0 0 −173 −2.3
Rice + shrimp 7 239 97.7 4 614 62.3 173 2.3
Rice–shrimp/ shrimp
1 893 25.5
Shrimp 905 12.2
An Phuc Rice — 0.0 0 0 — —
Rice + shrimp 4 006 100 1 508 37.6 — —
Shrimp 2 498 62.4
Gia Rai town Rice 418 61.5 0 0 −418 −61.5
Rice–shrimp/ shrimp
262 38.5 680 100 418 61.5
Shrimp — — — —
VillageSelected land
use type
Area of land use in 2000
Area of planningArea of
transformation
Ha % Ha % Ha %
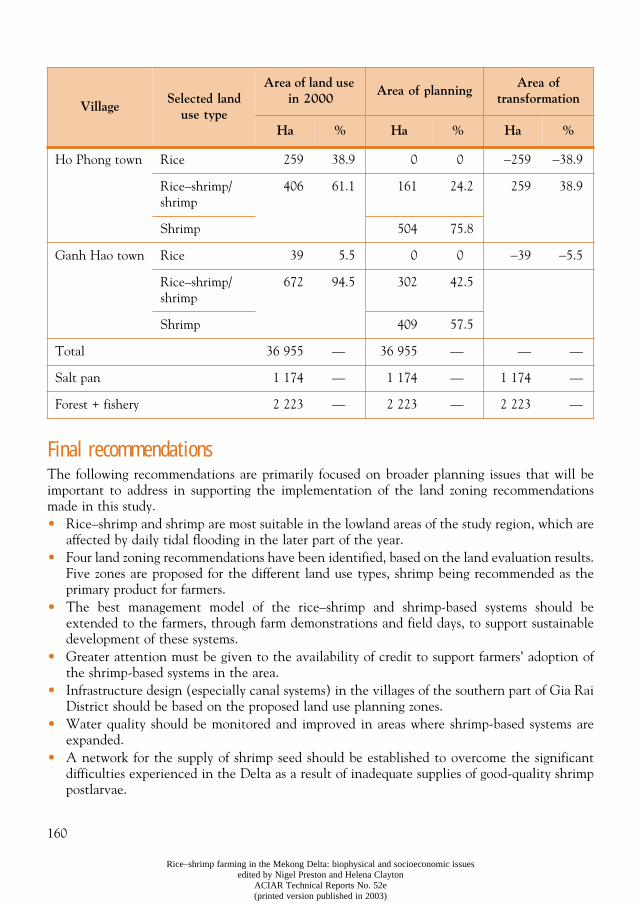
160
Rice–shrimp farming in the Mekong Delta: biophysical and socioeconomic issuesedited by Nigel Preston and Helena Clayton
ACIAR Technical Reports No. 52e(printed version published in 2003)
Final recommendations The following recommendations are primarily focused on broader planning issues that will beimportant to address in supporting the implementation of the land zoning recommendationsmade in this study. • Rice–shrimp and shrimp are most suitable in the lowland areas of the study region, which are
affected by daily tidal flooding in the later part of the year.• Four land zoning recommendations have been identified, based on the land evaluation results.
Five zones are proposed for the different land use types, shrimp being recommended as theprimary product for farmers.
• The best management model of the rice–shrimp and shrimp-based systems should beextended to the farmers, through farm demonstrations and field days, to support sustainabledevelopment of these systems.
• Greater attention must be given to the availability of credit to support farmers’ adoption ofthe shrimp-based systems in the area.
• Infrastructure design (especially canal systems) in the villages of the southern part of Gia RaiDistrict should be based on the proposed land use planning zones.
• Water quality should be monitored and improved in areas where shrimp-based systems areexpanded.
• A network for the supply of shrimp seed should be established to overcome the significantdifficulties experienced in the Delta as a result of inadequate supplies of good-quality shrimppostlarvae.
Ho Phong town Rice 259 38.9 0 0 −259 −38.9
Rice–shrimp/ shrimp
406 61.1 161 24.2 259 38.9
Shrimp 504 75.8
Ganh Hao town Rice 39 5.5 0 0 −39 −5.5
Rice–shrimp/ shrimp
672 94.5 302 42.5
Shrimp 409 57.5
Total 36 955 — 36 955 — — —
Salt pan 1 174 — 1 174 — 1 174 —
Forest + fishery 2 223 — 2 223 — 2 223 —
VillageSelected land
use type
Area of land use in 2000
Area of planningArea of
transformation
Ha % Ha % Ha %
161
Rice–shrimp farming in the Mekong Delta: biophysical and socioeconomic issuesedited by Nigel Preston and Helena Clayton
ACIAR Technical Reports No. 52e(printed version published in 2003)
• High-quality varieties of rice should be selected for export.• Market improvement for rice should be addressed in order to stimulate farmers’ investment
in land improvements for food security objectives.
References FAO 1976. A framework for land evaluation. FAO Soil Bulletin 32, FAO, Rome. 1976FAO 1993. Guidelines for land use planning. Development series No.1 FAO. RomeLe Quang Tri, Nhan, N.V., Huizing, H. and Van Mensvoort, M. 1993. Present land use as basis for land
evaluation in two Mekong Delta districts. In: Dent, D.L. and van Mensvoort, M.E.F., ed., Papers of theFourth International Symposium on Acid Sulphate Soils, Ho Chi Minh City, March 2–6, 1992. Wageningen,The Netherlands, ILRI Publish. No. 53, 299–320.
NIAPP (National Institute for Agricultural Planning and Projection) 1995. Soil map of Gia Rai District,1/25.000. Agriculture Publishing House, Hanoi.
Vo Quang Minh and Le Quang Tri. 2000. ACIAR research area characterization and technology extrapolation.ACIAR Rice–shrimp final workshop papers.
Xuan, V.T. and Matsui, S., eds. 1998. Development of farming systems in the Mekong Delta of Vietnam.JIRCAS, CTU & CLRRI, Ho Chi Minh City, Vietnam.
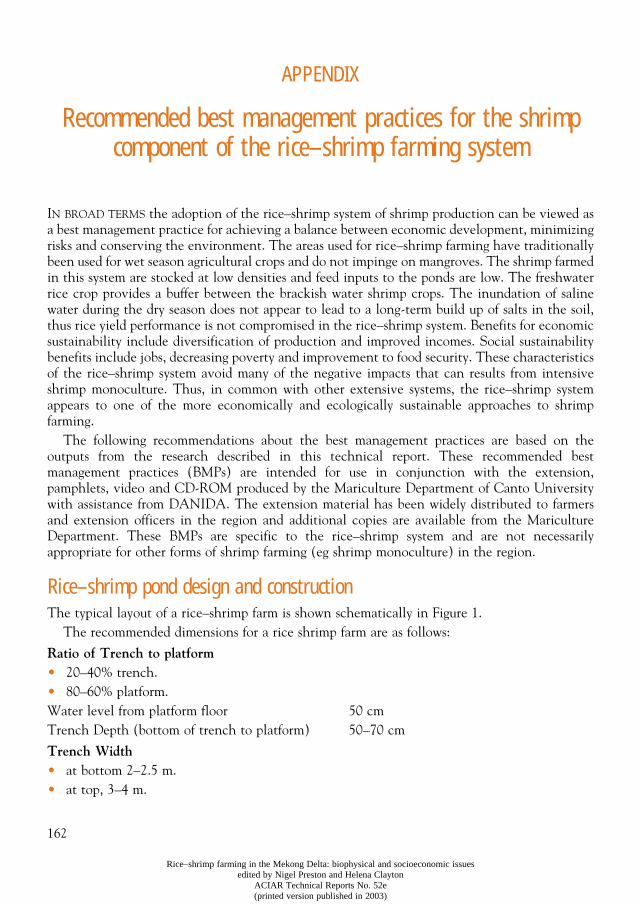
162
Rice–shrimp farming in the Mekong Delta: biophysical and socioeconomic issuesedited by Nigel Preston and Helena Clayton
ACIAR Technical Reports No. 52e(printed version published in 2003)
APPENDIX
Recommended best management practices for the shrimp component of the rice–shrimp farming system
I
N
BROAD
TERMS
the adoption of the rice–shrimp system of shrimp production can be viewed asa best management practice for achieving a balance between economic development, minimizingrisks and conserving the environment. The areas used for rice–shrimp farming have traditionallybeen used for wet season agricultural crops and do not impinge on mangroves. The shrimp farmedin this system are stocked at low densities and feed inputs to the ponds are low. The freshwaterrice crop provides a buffer between the brackish water shrimp crops. The inundation of salinewater during the dry season does not appear to lead to a long-term build up of salts in the soil,thus rice yield performance is not compromised in the rice–shrimp system. Benefits for economicsustainability include diversification of production and improved incomes. Social sustainabilitybenefits include jobs, decreasing poverty and improvement to food security. These characteristicsof the rice–shrimp system avoid many of the negative impacts that can results from intensiveshrimp monoculture. Thus, in common with other extensive systems, the rice–shrimp systemappears to one of the more economically and ecologically sustainable approaches to shrimpfarming.
The following recommendations about the best management practices are based on theoutputs from the research described in this technical report. These recommended bestmanagement practices (BMPs) are intended for use in conjunction with the extension,pamphlets, video and CD-ROM produced by the Mariculture Department of Canto Universitywith assistance from DANIDA. The extension material has been widely distributed to farmersand extension officers in the region and additional copies are available from the MaricultureDepartment. These BMPs are specific to the rice–shrimp system and are not necessarilyappropriate for other forms of shrimp farming (eg shrimp monoculture) in the region.
Rice–shrimp pond design and construction
The typical layout of a rice–shrimp farm is shown schematically in Figure 1. The recommended dimensions for a rice shrimp farm are as follows:
Ratio of Trench to platform
• 20–40% trench.• 80–60% platform.Water level from platform floor 50 cmTrench Depth (bottom of trench to platform) 50–70 cm
Trench Width
• at bottom 2–2.5 m.• at top, 3–4 m.
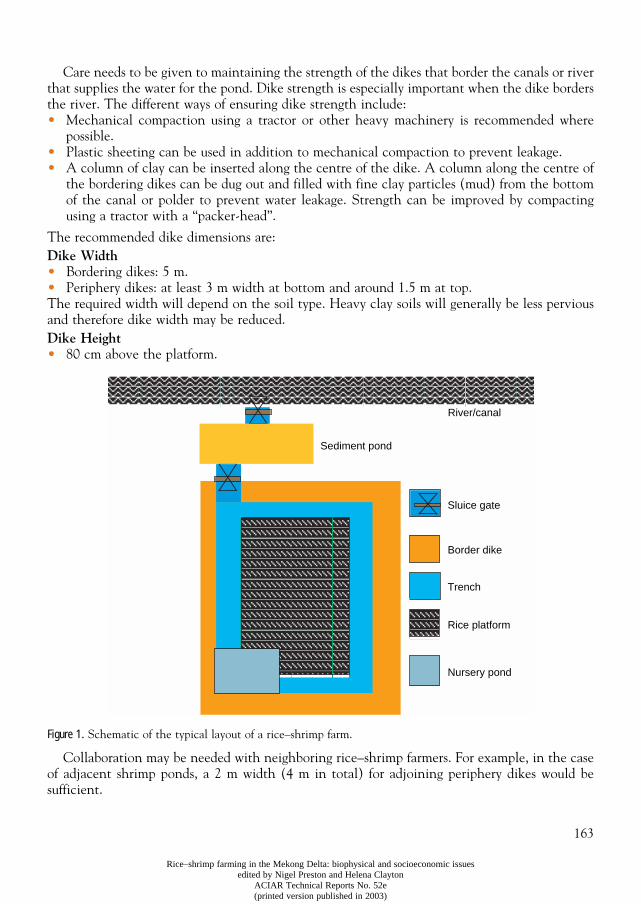
163
Rice–shrimp farming in the Mekong Delta: biophysical and socioeconomic issuesedited by Nigel Preston and Helena Clayton
ACIAR Technical Reports No. 52e(printed version published in 2003)
Care needs to be given to maintaining the strength of the dikes that border the canals or riverthat supplies the water for the pond. Dike strength is especially important when the dike bordersthe river. The different ways of ensuring dike strength include:• Mechanical compaction using a tractor or other heavy machinery is recommended where
possible.• Plastic sheeting can be used in addition to mechanical compaction to prevent leakage.• A column of clay can be inserted along the centre of the dike. A column along the centre of
the bordering dikes can be dug out and filled with fine clay particles (mud) from the bottomof the canal or polder to prevent water leakage. Strength can be improved by compactingusing a tractor with a “packer-head”.
The recommended dike dimensions are:
Dike Width
• Bordering dikes: 5 m.• Periphery dikes: at least 3 m width at bottom and around 1.5 m at top. The required width will depend on the soil type. Heavy clay soils will generally be less perviousand therefore dike width may be reduced.
Dike Height
• 80 cm above the platform.
Figure 1.
Schematic of the typical layout of a rice–shrimp farm.
Collaboration may be needed with neighboring rice–shrimp farmers. For example, in the caseof adjacent shrimp ponds, a 2 m width (4 m in total) for adjoining periphery dikes would besufficient.
Sluice gate
Border dike
Trench
Rice platform
Nursery pond
River/canal
Sediment pond
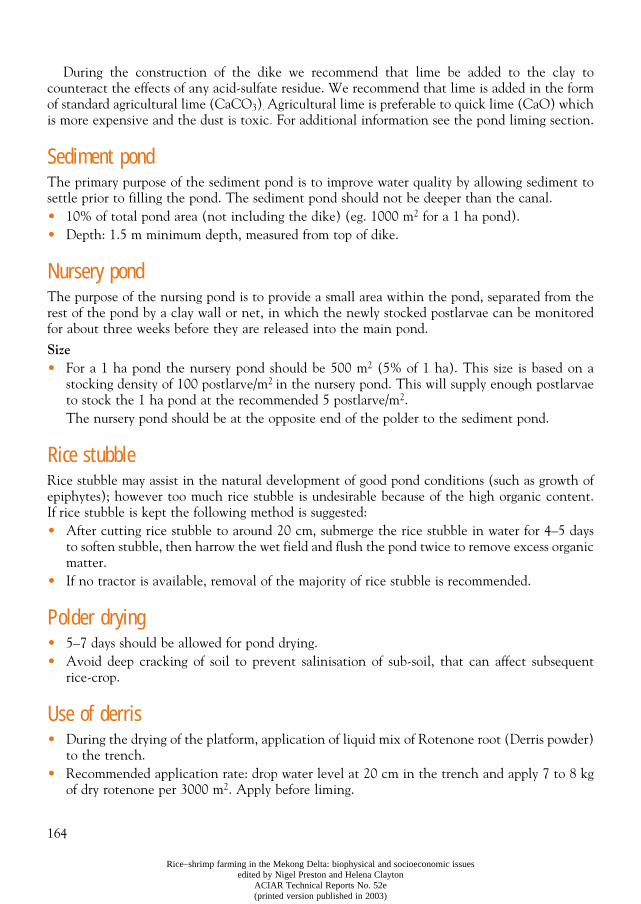
164
Rice–shrimp farming in the Mekong Delta: biophysical and socioeconomic issuesedited by Nigel Preston and Helena Clayton
ACIAR Technical Reports No. 52e(printed version published in 2003)
During the construction of the dike we recommend that lime be added to the clay tocounteract the effects of any acid-sulfate residue. We recommend that lime is added in the formof standard agricultural lime (CaCO
3
)
.
Agricultural lime is preferable to quick lime (CaO) whichis more expensive and the dust is toxic. For additional information see the pond liming section.
Sediment pond
The primary purpose of the sediment pond is to improve water quality by allowing sediment tosettle prior to filling the pond. The sediment pond should not be deeper than the canal.• 10% of total pond area (not including the dike) (eg. 1000 m
2
for a 1 ha pond).• Depth: 1.5 m minimum depth, measured from top of dike.
Nursery pond
The purpose of the nursing pond is to provide a small area within the pond, separated from therest of the pond by a clay wall or net, in which the newly stocked postlarvae can be monitoredfor about three weeks before they are released into the main pond.
Size
• For a 1 ha pond the nursery pond should be 500 m
2
(5% of 1 ha). This size is based on astocking density of 100 postlarve/m
2
in the nursery pond. This will supply enough postlarvaeto stock the 1 ha pond at the recommended 5 postlarve/m
2
.The nursery pond should be at the opposite end of the polder to the sediment pond.
Rice stubble
Rice stubble may assist in the natural development of good pond conditions (such as growth ofepiphytes); however too much rice stubble is undesirable because of the high organic content.If rice stubble is kept the following method is suggested: • After cutting rice stubble to around 20 cm, submerge the rice stubble in water for 4–5 days
to soften stubble, then harrow the wet field and flush the pond twice to remove excess organicmatter.
• If no tractor is available, removal of the majority of rice stubble is recommended.
Polder drying
• 5–7 days should be allowed for pond drying.• Avoid deep cracking of soil to prevent salinisation of sub-soil, that can affect subsequent
rice-crop.
Use of derris
• During the drying of the platform, application of liquid mix of Rotenone root (Derris powder)to the trench.
• Recommended application rate: drop water level at 20 cm in the trench and apply 7 to 8 kgof dry rotenone per 3000 m
2
. Apply before liming.
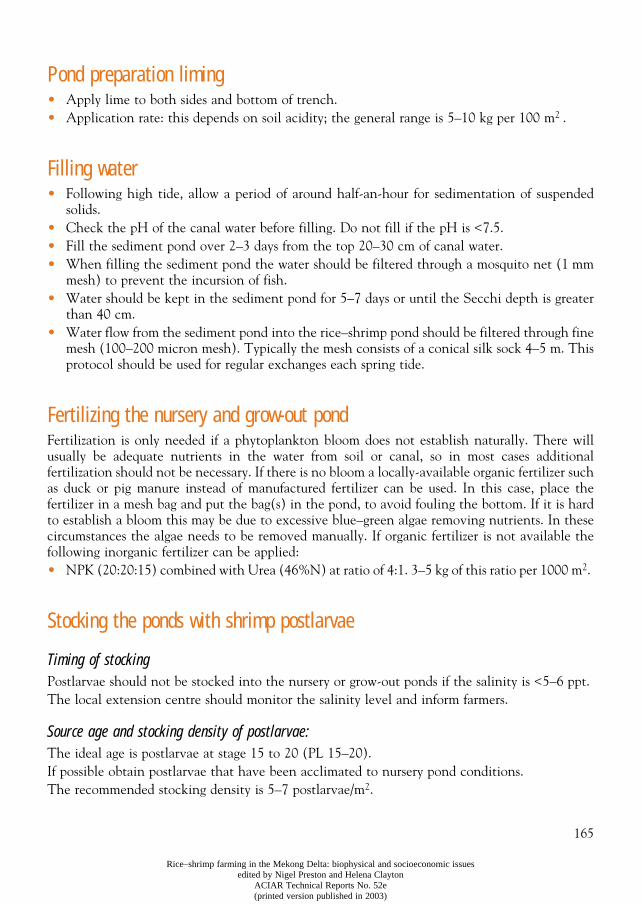
165
Rice–shrimp farming in the Mekong Delta: biophysical and socioeconomic issuesedited by Nigel Preston and Helena Clayton
ACIAR Technical Reports No. 52e(printed version published in 2003)
Pond preparation liming
• Apply lime to both sides and bottom of trench.• Application rate: this depends on soil acidity; the general range is 5–10 kg per 100 m
2
.
Filling water
• Following high tide, allow a period of around half-an-hour for sedimentation of suspendedsolids.
• Check the pH of the canal water before filling. Do not fill if the pH is <7.5. • Fill the sediment pond over 2–3 days from the top 20–30 cm of canal water. • When filling the sediment pond the water should be filtered through a mosquito net (1 mm
mesh) to prevent the incursion of fish. • Water should be kept in the sediment pond for 5–7 days or until the Secchi depth is greater
than 40 cm. • Water flow from the sediment pond into the rice–shrimp pond should be filtered through fine
mesh (100–200 micron mesh). Typically the mesh consists of a conical silk sock 4–5 m. Thisprotocol should be used for regular exchanges each spring tide.
Fertilizing the nursery and grow-out pond
Fertilization is only needed if a phytoplankton bloom does not establish naturally. There willusually be adequate nutrients in the water from soil or canal, so in most cases additionalfertilization should not be necessary. If there is no bloom a locally-available organic fertilizer suchas duck or pig manure instead of manufactured fertilizer can be used. In this case, place thefertilizer in a mesh bag and put the bag(s) in the pond, to avoid fouling the bottom. If it is hardto establish a bloom this may be due to excessive blue–green algae removing nutrients. In thesecircumstances the algae needs to be removed manually. If organic fertilizer is not available thefollowing inorganic fertilizer can be applied: • NPK (20:20:15) combined with Urea (46%N) at ratio of 4:1. 3–5 kg of this ratio per 1000 m
2
.
Stocking the ponds with shrimp postlarvae
Timing of stocking
Postlarvae should not be stocked into the nursery or grow-out ponds if the salinity is <5–6 ppt. The local extension centre should monitor the salinity level and inform farmers.
Source age and stocking density of postlarvae:
The ideal age is postlarvae at stage 15 to 20 (PL 15–20).If possible obtain postlarvae that have been acclimated to nursery pond conditions.The recommended stocking density is 5–7 postlarvae/m
2
.
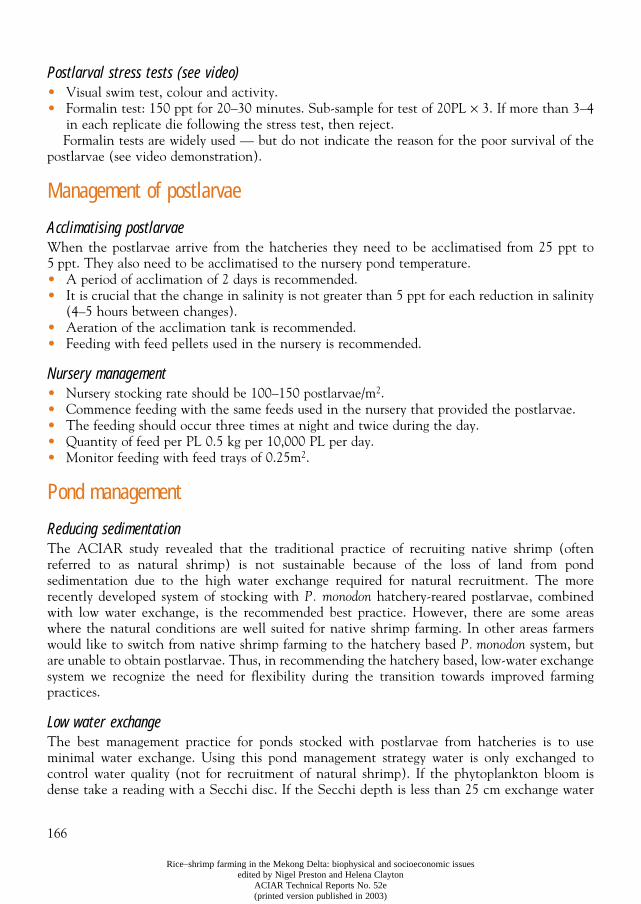
166
Rice–shrimp farming in the Mekong Delta: biophysical and socioeconomic issuesedited by Nigel Preston and Helena Clayton
ACIAR Technical Reports No. 52e(printed version published in 2003)
Postlarval stress tests (see video)
• Visual swim test, colour and activity. • Formalin test: 150 ppt for 20–30 minutes. Sub-sample for test of 20PL
×
3. If more than 3–4in each replicate die following the stress test, then reject. Formalin tests are widely used — but do not indicate the reason for the poor survival of the
postlarvae (see video demonstration).
Management of postlarvae
Acclimatising postlarvae
When the postlarvae arrive from the hatcheries they need to be acclimatised from 25 ppt to5 ppt. They also need to be acclimatised to the nursery pond temperature. • A period of acclimation of 2 days is recommended.• It is crucial that the change in salinity is not greater than 5 ppt for each reduction in salinity
(4–5 hours between changes). • Aeration of the acclimation tank is recommended.• Feeding with feed pellets used in the nursery is recommended.
Nursery management
• Nursery stocking rate should be 100–150 postlarvae/m
2
.• Commence feeding with the same feeds used in the nursery that provided the postlarvae.• The feeding should occur three times at night and twice during the day.• Quantity of feed per PL 0.5 kg per 10,000 PL per day.• Monitor feeding with feed trays of 0.25m
2
.
Pond management
Reducing sedimentation
The ACIAR study revealed that the traditional practice of recruiting native shrimp (oftenreferred to as natural shrimp) is not sustainable because of the loss of land from pondsedimentation due to the high water exchange required for natural recruitment. The morerecently developed system of stocking with
P. monodon
hatchery-reared postlarvae, combinedwith low water exchange, is the recommended best practice. However, there are some areaswhere the natural conditions are well suited for native shrimp farming. In other areas farmerswould like to switch from native shrimp farming to the hatchery based
P. monodon
system, butare unable to obtain postlarvae. Thus, in recommending the hatchery based, low-water exchangesystem we recognize the need for flexibility during the transition towards improved farmingpractices.
Low water exchange
The best management practice for ponds stocked with postlarvae from hatcheries is to useminimal water exchange. Using this pond management strategy water is only exchanged tocontrol water quality (not for recruitment of natural shrimp). If the phytoplankton bloom isdense take a reading with a Secchi disc. If the Secchi depth is less than 25 cm exchange water
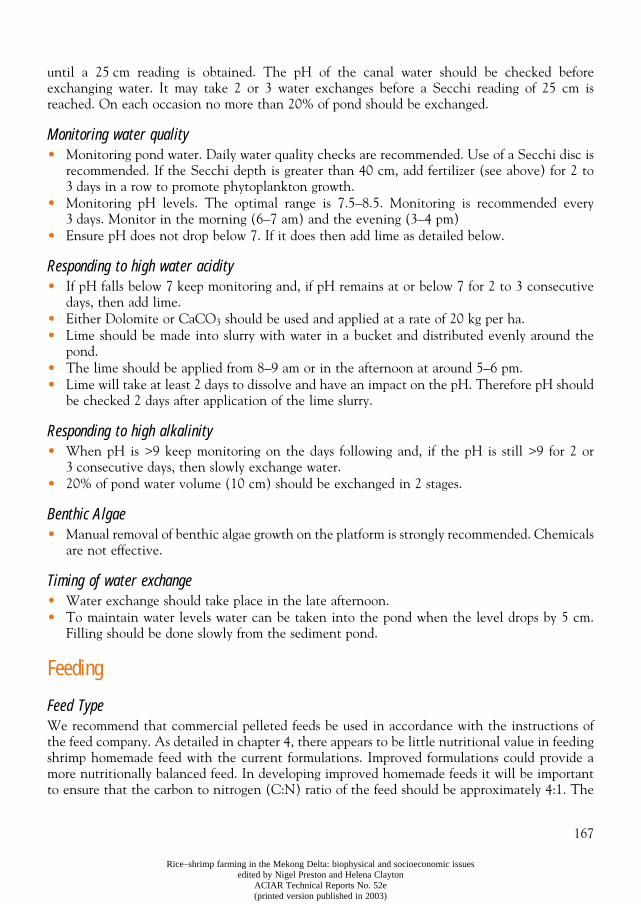
167
Rice–shrimp farming in the Mekong Delta: biophysical and socioeconomic issuesedited by Nigel Preston and Helena Clayton
ACIAR Technical Reports No. 52e(printed version published in 2003)
until a 25 cm reading is obtained. The pH of the canal water should be checked beforeexchanging water. It may take 2 or 3 water exchanges before a Secchi reading of 25 cm isreached. On each occasion no more than 20% of pond should be exchanged.
Monitoring water quality
• Monitoring pond water. Daily water quality checks are recommended. Use of a Secchi disc isrecommended. If the Secchi depth is greater than 40 cm, add fertilizer (see above) for 2 to3 days in a row to promote phytoplankton growth.
• Monitoring pH levels. The optimal range is 7.5–8.5. Monitoring is recommended every3 days. Monitor in the morning (6–7 am) and the evening (3–4 pm)
• Ensure pH does not drop below 7. If it does then add lime as detailed below.
Responding to high water acidity
• If pH falls below 7 keep monitoring and, if pH remains at or below 7 for 2 to 3 consecutivedays, then add lime.
• Either Dolomite or CaCO
3
should be used and applied at a rate of 20 kg per ha. • Lime should be made into slurry with water in a bucket and distributed evenly around the
pond. • The lime should be applied from 8–9 am or in the afternoon at around 5–6 pm.• Lime will take at least 2 days to dissolve and have an impact on the pH. Therefore pH should
be checked 2 days after application of the lime slurry.
Responding to high alkalinity
• When pH is >9 keep monitoring on the days following and, if the pH is still >9 for 2 or3 consecutive days, then slowly exchange water.
• 20% of pond water volume (10 cm) should be exchanged in 2 stages.
Benthic Algae
• Manual removal of benthic algae growth on the platform is strongly recommended. Chemicalsare not effective.
Timing of water exchange
• Water exchange should take place in the late afternoon.• To maintain water levels water can be taken into the pond when the level drops by 5 cm.
Filling should be done slowly from the sediment pond.
Feeding
Feed Type
We recommend that commercial pelleted feeds be used in accordance with the instructions ofthe feed company. As detailed in chapter 4, there appears to be little nutritional value in feedingshrimp homemade feed with the current formulations. Improved formulations could provide amore nutritionally balanced feed. In developing improved homemade feeds it will be importantto ensure that the carbon to nitrogen (C:N) ratio of the feed should be approximately 4:1. The
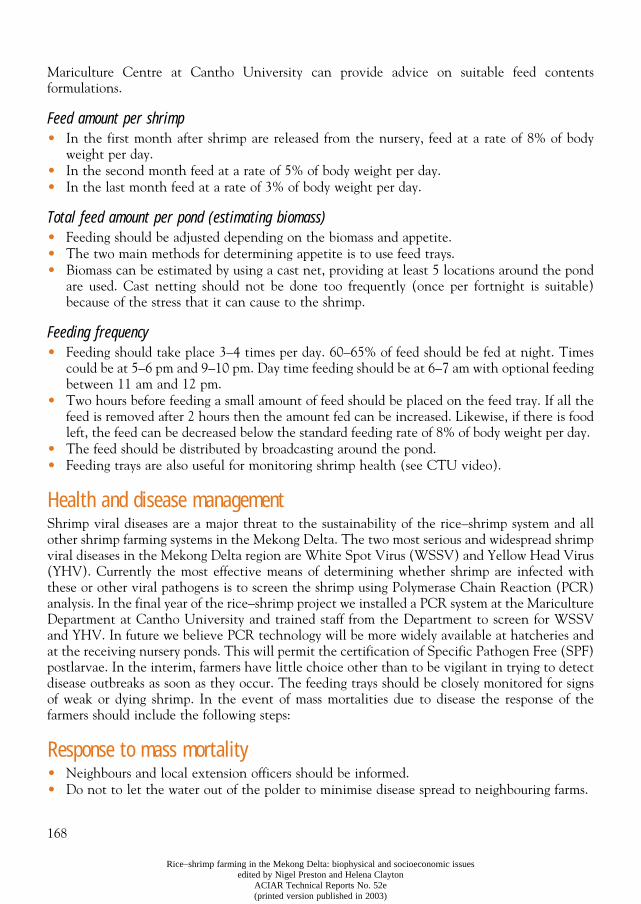
168
Rice–shrimp farming in the Mekong Delta: biophysical and socioeconomic issuesedited by Nigel Preston and Helena Clayton
ACIAR Technical Reports No. 52e(printed version published in 2003)
Mariculture Centre at Cantho University can provide advice on suitable feed contentsformulations.
Feed amount per shrimp
• In the first month after shrimp are released from the nursery, feed at a rate of 8% of bodyweight per day.
• In the second month feed at a rate of 5% of body weight per day.• In the last month feed at a rate of 3% of body weight per day.
Total feed amount per pond (estimating biomass)
• Feeding should be adjusted depending on the biomass and appetite.• The two main methods for determining appetite is to use feed trays.• Biomass can be estimated by using a cast net, providing at least 5 locations around the pond
are used. Cast netting should not be done too frequently (once per fortnight is suitable)because of the stress that it can cause to the shrimp.
Feeding frequency
• Feeding should take place 3–4 times per day. 60–65% of feed should be fed at night. Timescould be at 5–6 pm and 9–10 pm. Day time feeding should be at 6–7 am with optional feedingbetween 11 am and 12 pm.
• Two hours before feeding a small amount of feed should be placed on the feed tray. If all thefeed is removed after 2 hours then the amount fed can be increased. Likewise, if there is foodleft, the feed can be decreased below the standard feeding rate of 8% of body weight per day.
• The feed should be distributed by broadcasting around the pond.• Feeding trays are also useful for monitoring shrimp health (see CTU video).
Health and disease management
Shrimp viral diseases are a major threat to the sustainability of the rice–shrimp system and allother shrimp farming systems in the Mekong Delta. The two most serious and widespread shrimpviral diseases in the Mekong Delta region are White Spot Virus (WSSV) and Yellow Head Virus(YHV). Currently the most effective means of determining whether shrimp are infected withthese or other viral pathogens is to screen the shrimp using Polymerase Chain Reaction (PCR)analysis. In the final year of the rice–shrimp project we installed a PCR system at the MaricultureDepartment at Cantho University and trained staff from the Department to screen for WSSVand YHV. In future we believe PCR technology will be more widely available at hatcheries andat the receiving nursery ponds. This will permit the certification of Specific Pathogen Free (SPF)postlarvae. In the interim, farmers have little choice other than to be vigilant in trying to detectdisease outbreaks as soon as they occur. The feeding trays should be closely monitored for signsof weak or dying shrimp. In the event of mass mortalities due to disease the response of thefarmers should include the following steps:
Response to mass mortality
• Neighbours and local extension officers should be informed.• Do not to let the water out of the polder to minimise disease spread to neighbouring farms.
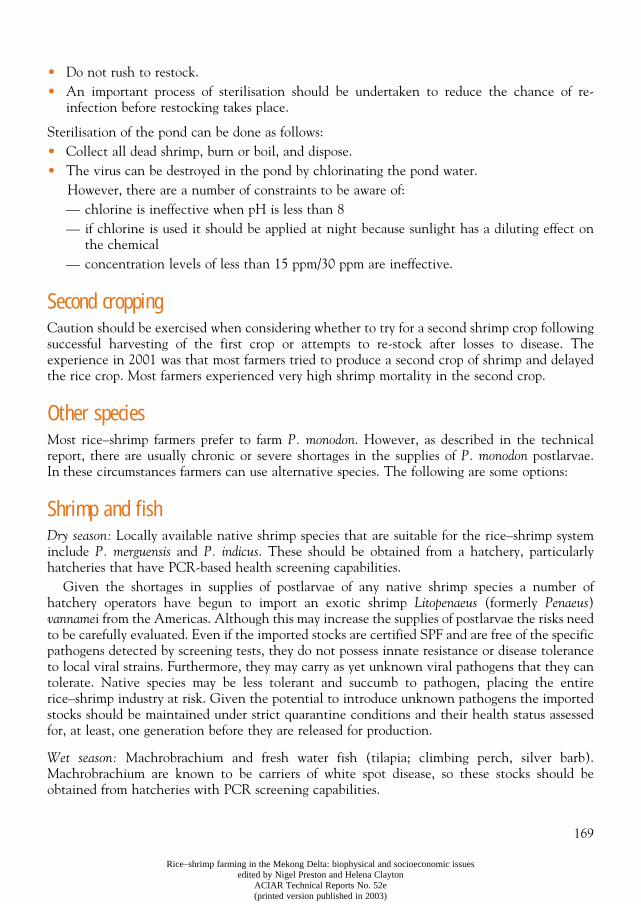
169
Rice–shrimp farming in the Mekong Delta: biophysical and socioeconomic issuesedited by Nigel Preston and Helena Clayton
ACIAR Technical Reports No. 52e(printed version published in 2003)
• Do not rush to restock. • An important process of sterilisation should be undertaken to reduce the chance of re-
infection before restocking takes place.
Sterilisation of the pond can be done as follows: • Collect all dead shrimp, burn or boil, and dispose.• The virus can be destroyed in the pond by chlorinating the pond water.
However, there are a number of constraints to be aware of: — chlorine is ineffective when pH is less than 8— if chlorine is used it should be applied at night because sunlight has a diluting effect on
the chemical— concentration levels of less than 15 ppm/30 ppm are ineffective.
Second cropping
Caution should be exercised when considering whether to try for a second shrimp crop followingsuccessful harvesting of the first crop or attempts to re-stock after losses to disease. Theexperience in 2001 was that most farmers tried to produce a second crop of shrimp and delayedthe rice crop. Most farmers experienced very high shrimp mortality in the second crop.
Other species
Most rice–shrimp farmers prefer to farm
P. monodon
. However, as described in the technicalreport, there are usually chronic or severe shortages in the supplies of
P. monodon
postlarvae.In these circumstances farmers can use alternative species. The following are some options:
Shrimp and fish
Dry season:
Locally available native shrimp species that are suitable for the rice–shrimp systeminclude
P. merguensis
and
P. indicus
. These should be obtained from a hatchery, particularlyhatcheries that have PCR-based health screening capabilities.
Given the shortages in supplies of postlarvae of any native shrimp species a number ofhatchery operators have begun to import an exotic shrimp
Litopenaeus
(formerly
Penaeus
)
vanname
i from the Americas. Although this may increase the supplies of postlarvae the risks needto be carefully evaluated. Even if the imported stocks are certified SPF and are free of the specificpathogens detected by screening tests, they do not possess innate resistance or disease toleranceto local viral strains. Furthermore, they may carry as yet unknown viral pathogens that they cantolerate. Native species may be less tolerant and succumb to pathogen, placing the entirerice–shrimp industry at risk. Given the potential to introduce unknown pathogens the importedstocks should be maintained under strict quarantine conditions and their health status assessedfor, at least, one generation before they are released for production.
Wet season:
Machrobrachium and fresh water fish (tilapia; climbing perch, silver barb).Machrobrachium are known to be carriers of white spot disease, so these stocks should beobtained from hatcheries with PCR screening capabilities.
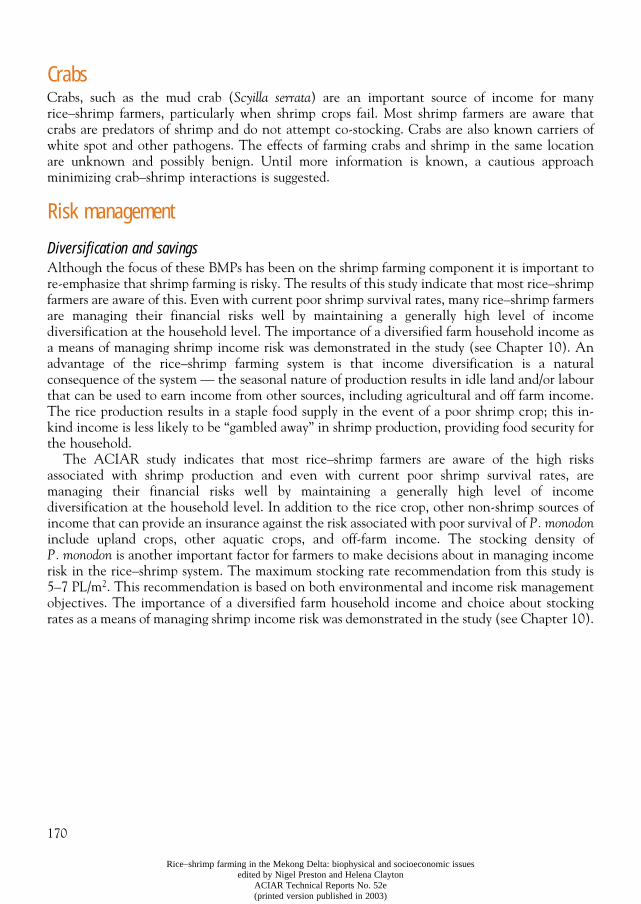
170
Rice–shrimp farming in the Mekong Delta: biophysical and socioeconomic issuesedited by Nigel Preston and Helena Clayton
ACIAR Technical Reports No. 52e(printed version published in 2003)
Crabs
Crabs, such as the mud crab (
Scyilla serrata
) are an important source of income for manyrice–shrimp farmers, particularly when shrimp crops fail. Most shrimp farmers are aware thatcrabs are predators of shrimp and do not attempt co-stocking. Crabs are also known carriers ofwhite spot and other pathogens. The effects of farming crabs and shrimp in the same locationare unknown and possibly benign. Until more information is known, a cautious approachminimizing crab–shrimp interactions is suggested.
Risk management
Diversification and savings
Although the focus of these BMPs has been on the shrimp farming component it is important tore-emphasize that shrimp farming is risky. The results of this study indicate that most rice–shrimpfarmers are aware of this. Even with current poor shrimp survival rates, many rice–shrimp farmersare managing their financial risks well by maintaining a generally high level of incomediversification at the household level. The importance of a diversified farm household income asa means of managing shrimp income risk was demonstrated in the study (see Chapter 10). Anadvantage of the rice–shrimp farming system is that income diversification is a naturalconsequence of the system — the seasonal nature of production results in idle land and/or labourthat can be used to earn income from other sources, including agricultural and off farm income.The rice production results in a staple food supply in the event of a poor shrimp crop; this in-kind income is less likely to be “gambled away” in shrimp production, providing food security forthe household.
The ACIAR study indicates that most rice–shrimp farmers are aware of the high risksassociated with shrimp production and even with current poor shrimp survival rates, aremanaging their financial risks well by maintaining a generally high level of incomediversification at the household level. In addition to the rice crop, other non-shrimp sources ofincome that can provide an insurance against the risk associated with poor survival of
P. monodon
include upland crops, other aquatic crops, and off-farm income. The stocking density of
P. monodon
is another important factor for farmers to make decisions about in managing incomerisk in the rice–shrimp system. The maximum stocking rate recommendation from this study is5–7 PL/m
2
. This recommendation is based on both environmental and income risk managementobjectives. The importance of a diversified farm household income and choice about stockingrates as a means of managing shrimp income risk was demonstrated in the study (see Chapter 10).
Related Documents