Rice seed chain in India: does exportable surplus of rice seeds exist? Dr Debdutt Behura Department of Agribusiness Management Orissa University of Agriculture and Technology, Bhubaneswar

Rice seed chain in India: does exportable surplus of rice seeds exist? Dr Debdutt Behura Department of Agribusiness Management Orissa University of Agriculture.
Dec 25, 2015
Welcome message from author
This document is posted to help you gain knowledge. Please leave a comment to let me know what you think about it! Share it to your friends and learn new things together.
Transcript

Rice seedchain in India: does exportable surplus
of rice seeds exist?
Dr Debdutt BehuraDepartment of Agribusiness Management
Orissa University of Agriculture and Technology, Bhubaneswar

1970
-71
1972
-73
1974
-75
1976
-77
1978
-79
1980
-81
1982
-83
1984
-85
1986
-87
1988
-89
1990
-91
1992
-93
1994
-95
1996
-97
1998
-99
2000
-01
2002
-03
2004
-05
2006
-07
2008
-09
2010
-11
2012
-13
20
40
60
80
100
120
140
160
1.0
1.5
2.0
2.5
3.0
3.5
4.0
Year
Are
a (m
illio
n ha
), Pr
od (m
illio
n to
n)
Yiel
d (t
on/h
a)
Area
Yield
Prod
Trend in rice area, production and yield in India

Rice seed system in India
• Heavy involvement of public sector in R &D, production and distribution of inbred seeds and to a limited scale in hybrid seeds
• Private sector mainly involved in limited scale R & D mainly in hybrid and research seeds and their production and marketing. It is also engaged in production and marketing of publicly released notified inbred seeds.

Organized Rice seed production and supply system in India
Source: www.seednet.govt.in

Indent and requirement of breeder seeds of rice in India in quintal
Year Indent Production
2001-02 863 1229
2002-03 931 1766
2003-04 867 1518
2004-05 1199 2572
2005-06 1575 2850
2006-07 2076 3405
2007-08 2491 3923
2008-09 3028 4333
2009-10 3880 5387
2010-11 4604 6095
2011-12 5772 6828

Requirement and availability of Certified / Quality seeds of rice in India in lakh quintals
Year Requirement Availability Supplied
2000-01 27.07 31.26 N.A.
2005-06 N.A. 36.70 32.41
2006-07 N.A. 40.35 43.51
2007-08 N.A. 53.54 48.93
2008-09 N.A. 66.14 58.18
2009-10 65.65 73.41 60.95
2010-11 71.67 86.29 69.34
2011-12 82.56 91.60 74.41
2012-13 78.10 80.32 72.27
2013(Kharif) 62.54 69.23 N.A.
2014(Kharif) 64.73 72.53 N.A.

State wise requirement & availability of rice seed during Kharif, 2013 in quintals
State Requirement Availability Surplus/DeficitAndhra Pradesh 1171509 1261668 90159
Assam 563200 563200 0
Bihar 424400 482860 58460
Chattisgarh 600000 778794 178794
Haryana 67100 183163 116063
Jharkhand 167000 216354 49354
Karnataka 249473 292044 42571
Madhya Pradesh 194339 145895 -48444
Odisha 667876 681075 13199
Punjab 167400 211269 43869
Tamil Nadu 211500 211500 0
Uttar Pradesh 797000 609263 -187737
West Bengal 451500 756210 304710
India 6254264 6923320 669056

Ratio of Supply and Demand of Quality/Certified Seeds in major rice-growing states
Andhra Prad
esh
Assam
Bihar
Chhattisga
rh
Haryan
a
Jharkhan
d
Karnata
ka
Madhya
Pradesh
Odisha
Punjab
Tamil N
adu
Uttar Prad
esh
West
Benga
lIndia
0.6
0.7
0.8
0.9
1.0
1.1
1.2
1.3
1.4
1.5
1.6
2009-10 2013-14
Supp
ly/D
eman
d Ra
tio

India’s exports in Rice Seeds(MT) Country/Year 2005 2010 2011 2013
Vietnam 11 3673 2118 155
Indonesia 7 818 1617 371
Philippines 178 3743 1296 2476
Nepal 9518 2041 2569 1535
Bangladesh 8 291 171 129
Ghana 2080
Benin 2193
Qatar 22 73 48 142
UAE 137 52 48 403
Total exports 10346 10912 9114 10210
India exported rice seed to 25 countries during 2013
Source: International Trade Centre, Trade Map database(2014)

Percentage share of private sector in supply of certified/quality seeds in India, 2013-14
States Percentage share to total
supply
States Percentage share to total
supplyAndhra Pradesh 47.5 Madhya Pradesh 49.4
Assam 68.6 Odisha 0
Bihar 49.2 Punjab 83.7
Chhattisgarh 20.9 Tamil Nadu 59.3
Haryana 70.3 Uttar Pradesh 58.1
Jharkhand 0 West Bengal 63.2
Karnataka 54.2 India 51.7

SRR• Certified/quality seeds itself increases the yield by
15 to 20%. Seed replacement rate(SRR), defined as the proportion of a crop area planted with certified or quality seeds(as opposed to farm-kept seeds), is an indicator of the effectiveness of seed systems in supplying high quality seeds to farmers. Accordingly the SRR for rice in India and various states of India has increased in recent years. Ideally for self pollinated crops like rice SRR should be 35%.

State-wise SRR of rice in major rice-growing states
Andhra Prad
esh
Assam
Bihar
Chattisga
rh
Haryan
a
Jharkhan
d
Karnata
ka
Madhya
Pradesh
Odisha
Punjab
Tamil N
adu
Uttar Prad
esh
West
Benga
l India
0
10
20
30
40
50
60
70
80
90
100
2005 2011Se
ed re
plac
emen
t rat
e

The Case of Odisha

Trend in area, production, yield and area under HYV rice in Odisha
19711973
19751977
19791981
19831985
19871989
19911993
19951997
19992001
20032005
20072009
20110
2000
4000
6000
8000
10000
12000
0.0
0.5
1.0
1.5
2.0
2.5
3.0
AreaProdHYV areaYield
Are
a (0
00 h
a), P
rod
(000
t)
Yiel
d (t
/ha)

Seed Replacement Rate (SRR) of Rice in Odisha
2000-01 2001-02 2002-03 2003-04 2004-05 2005-06 2006-07 2007-08 2008-09 2009-10 2010-11 2011-12 0
5
10
15
20
25
30
35
Kharif Rabi Total
SRR

Area certified under rice seed production in Odisha
2001-02 2002-03 2003-04 2004-05 2005-06 2006-07 2007-08 2008-09 2009-10 2010-11 2011-12 2012-13 0
5000
10000
15000
20000
25000
30000
35000
Kharif Rabi Total
Area
in h
a

Seed area registered during Kharif, 2013 by agency in Odisha
Agency Area registered ShareOSSC 13768.79 35.5NFSM 9344.8 24.1Private 8447.91 21.8SVS 2272.45 5.9BGREI 2148.6 5.5OAIC 1208.6 3.1GOVT. 867.69 2.2OUAT 254.6 0.7GOI 227 0.6NSC 174.4 0.4SQSPP 30 0.1CRRI 11.648 0.0Total 38756.49 100.0

Percentage share of each seed source in certification of total quantity of Foundation rice seeds in Odisha(Kharif)
2001-022005-062008-092010-11 2012-13
Dept. Farms 46 16 31 25 22
O.S.S.C. LTD. 11 12 12 12 5
O.U.A.T. 22 37 14 12 8
PRIVATE 21 35 43 51 30
N.S.C 0.2 0.1 0.5
SVS 33
OAIC 2
NFSM 0.03
BGREI 0
NGO 0
Total (tons) 2036 1857 3136 3297 7727 2001-02
2005-06
2008-09
2010-11
2012-13
0
20
40
60
80
100
Foundation seedsNGO
BGREI
NFSM
OAIC
SVS
N.S.C
PRIVATE
O.U.A.T.
O.S.S.C.LTD.
Dept. Farms
Shar
e in
tota
l (%
)

Percentage share of each seed source in certification of total quantity of Certified rice seeds in Odisha(Kharif)
2001-02 2005-06 2008-09 2010-11 2012-13
Dept. Farms 8 12 3 2 0.4
O.S.S.C.LTD. 82 67 76 64 69
O.U.A.T. 1 0.3 0.05 0.3 0
PRIVATE 9 19 15 28 22
N.S.C 1 4 5 0.3
SVS 1 0.1 0.01
OAIC 1
NFSM 8
BGREI 0.02
NGO 0.01
Total (tons) 16033 14439 39673 41968 49897 2001-02 2005-06 2008-09 2010-11 2012-130
20
40
60
80
100
Certified seedsNGO
BGREI
NFSM
OAIC
SVS
N.S.C
PRIVATE
O.U.A.T.
O.S.S.C.LTD.
Dept. Farms
Shar
e in
tota
l (%
)

Percentage share of each seed source in certification of total quantity of rice seeds in Odisha(Kharif)
2001-02 2005-06 2008-09 2010-11 2012-13
Dept. Farms 13 13 5 4 3
O.S.S.C.LTD. 74 61 72 60 60
O.U.A.T. 4 4 1 1 1
PRIVATE 10 21 17 30 23
N.S.C 1 3 5 0.3
SVS 1 0.06 4
OAIC 1
NFSM 7
BGREI 0.02
NGO 0.005
Total (tons) 18069 16296 42808 45266 57624 2001-02 2005-06 2008-09 2010-11 2012-130
20
40
60
80
100
Total seed productionNGO
BGREI
NFSM
OAIC
SVS
N.S.C
PRIVATE
O.U.A.T.
O.S.S.C.LTD.
Dept. Farms
Shar
e in
tota
l (%
)
Percentage share in total seed supply/sold by major varieties during kharif season
Seed supply/sale by major varieties during kharif season.
Percentage share in total seed supply/sold 2001 2005 2010 2011 2013MTU-1001 13 16 17 18 27Swarna 33 31 33 32 22Pooja 0 11 14 16 18MTU-1010 0 0 6 8 8Lalat 14 8 7 4 4Khandagiri 5 3 4 2 3CR-1018 5 4 2 2 1Surendra 2 6 2 1 1CR-1009 16 3 1 1 0BPT-5204 5 4 1 7 1Others 9 14 14 10 15 Total seed supplied/sold (Qtss) 241441 136095 471678 487221 512143 2001 2005 2010 2011 2013
0
100000
200000
300000
400000
500000
600000
Others
BPT-5204
CR-1009
Surendra
CR-1018
Khandagiri
Lalat
MTU-1010
Pooja
Swarna
MTU-1001Se
ed s
uppl
y (0
00 to
ns)

% of responsesSources of seeds
Own 57Gov't Seed Sale Center 31Other farmers 7Seed trader 4Others 1
Sources of informationOther farmers 76Extension officers 21Seed trader 2Others 2
Sources of seeds and varietal information(2010)

Actors/Stakeholders in rice seed value chain in Odisha
• DAC-Seed Division, GOI• Research Institutes/SAUs- CRRI, OUAT, ANGRAU, IGKV, BCKV, DRR etc• OSSOPCA, OSSC Ltd, OAIC, NSC, SFCI, State Government Farms(57)• Private seed entrepreneurs( more than 50 MOU farms)• Registered seed growers of OSSC Ltd(5000 nos)• Organizers & Contract seed growers of Private seed entrepreneurs• Govt. Schemes- NFSM, SVS, BGREI• Farmers’ Organizations & SHGs (NABARD as well as Word Bank
assisted)• MNCs/National Seed Companies• NGO• Seed dealers of OSSC ltd and OAIC, PACS, Wholesalers/distributors of
inputs both inside as well as outside the state, Input retailers both inside as well as outside the state, SHGs
• Farmers

Flow chart of inbred rice seed production and distribution in OdishaDAC/Seed Division, GOI, NSP
Research institutes within & outside the state
BS
Private Farms (MOU-more than 50 Nos)
OSSC farms/ Seed growers
DAFP govt farms (57)
CRRI-ICAR (NSP) OUAT (NSP)
TL
OAIC
TRIPTI(WB)
Private Farms(MOU-more than 50 Nos)
Contract seed growers
OSSC farms
SVS(GOI)
Registered seed growers (5000)
CRRI Outlet/Schemes
Pvt. Firms through OAIC
OSSCOAIC/OSSC/Schemes
Pvt. firms/ Rice farmers
CS
OAIC dealers(644 Nos.)
Seed distributors/Input dealers
DDA-DAFP (Schemes)
DDA-DAFP(Schemes)
Storage facility (70), 2.60lakh qts
PACS(878)/OSSC dealers (3225)
OAIC dealers(644 nod.)
OUAT Outlet/ Schemes
Rice Farmers
FSFS FS FS
CS CS CS CS
FS

CONCLUSIONS• India has surplus production of breeder as well as certified rice seeds.• There is oversupply in some states and some are deficient• SRR of rice doubled from 21% to 40% during 2005 to 2011• SRR in some of the eastern Indian states of Odisha, Jharkhand and Chattisgarh is low as
compared to the other major rice producing states though there is surplus availability. Timely availability of desired variety is a constraint.
• In the near future low SRR states will certainly try to increase SRR. So internal demand will increase. Still India has sufficient capacity to increase the production base
• Role of private seed entrepreneurs have increased significantly in production & marketing of Certified seeds
• Area under rice seed production has increased significantly over the years and is stated to reach a higher front in the near future thereby increasing the possibility of higher SRR as well as increased potential for export to neighbouring countries like Bangladesh, Nepal etc.
• The export potential of inbred rice seed will mainly concentrate on specific rice varieties.• However, quality is a major concern. • Other major challenges are IPR, quarantine, sanitary and phytosanitary issues,
harmonization of seed certification standards, infrastructure bottlenecks
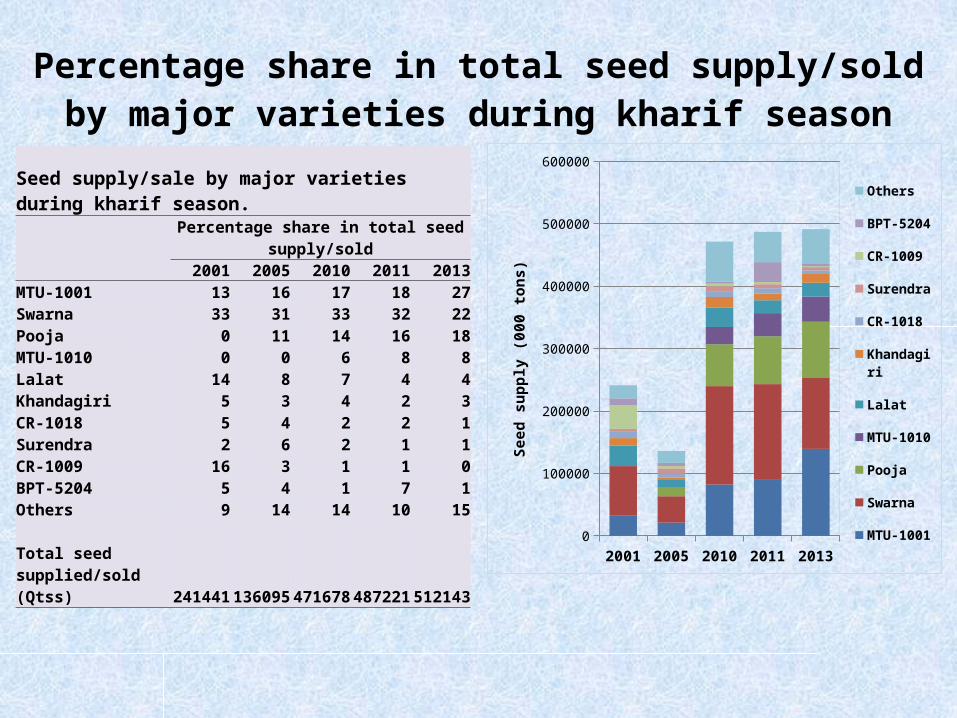
Policy Options•Policy to decide what type of seeds i.e., whether to export Breeder or Certified seeds •If Breeder seeds, who to export and pricing issues in export of BS•If Certified seeds, private sector or public sector?•If public sector, then SSC or NSC?•The State Seed Corporations along with the Certifying Agencies who are the controlling authority in production and certification of seeds are highly understaffed. Infrastructure facilities at their steps are too little and inadequate to produce and maintain quality standards of that enormous quantity of rice seeds. Immediate measures need to be taken to increase the production units under different seeds corporations as well as certification centres with sufficient staff.•Godown facility to store paddy seeds is low. There is urgent need to increase the storage capacity to keep the seeds in sound condition.

Policy options (Cont.)•Seed Testing Laboratories are quite inadequate to check the large quantities of seed lots being sent for testing. • Technical Training: The seed industry stretches all the
way from genetic research, through varietal development, bulking up, certification, registration, production and marketing. Many of these topics are highly technical, and it need well trained seed scientists and technologists. So training is an essential element for successful implementation of quality seed production, processing, storage and marketing.

Policy options (Cont.)• Demand estimation of varieties in the importing
countries• Ensuring regular supply• Streamline the quarantine aspect by vigorous
checking and testing at each stage of production, processing, grading, packaging etc
• Ensure maintaining sanitary and phytosanitary requirements
• Harmonizing of seed laws and regulations

Thank you
Related Documents