Rice husk ash as an effective adsorbent: Evaluation of adsorptive characteristics for Indigo Carmine dye Uma R. Lakshmi, Vimal Chandra Srivastava, Indra Deo Mall * , Dilip H. Lataye Department of Chemical Engineering, Indian Institute of Technology Roorkee, Roorkee 247667, India Received 26 February 2007; received in revised form 25 October 2007; accepted 4 January 2008 Available online 4 March 2008 Abstract Present study explored the adsorptive characteristics of Indigo Carmine (IC) dye from aqueous solution onto rice husk ash (RHA). Batch experiments were carried out to determine the influence of parameters like initial pH (pH 0 ), contact time (t), adsorbent dose (m) and initial con- centration (C 0 ) on the removal of IC. The optimum conditions were found to be: pH 0 ¼ 5.4, t ¼ 8 h and m ¼ 10.0 g/l. The pseudo-second-order kinetic model represented the adsorption kinetics of IC on to RHA. Equilibrium isotherms were analyzed by Freundlich, Langmuir, Temkin and RedlichePeterson models using a non-linear regression technique. Adsorption of IC on RHA was favorably influenced by an increase in the temperature of the operation. The positive values of the change in entropy (DS 0 ) and heat of adsorption (DH 0 ); and the negative value of change in Gibbs free energy (DG 0 ) indicate feasible and spontaneous adsorption of IC on to RHA. Ó 2008 Elsevier Ltd. All rights reserved. Keywords: Indigo Carmine; Rice husk ash; Adsorption kinetics; Isotherms; Adsorption thermodynamics 1. Introduction Several textile and food dyes, and dye intermediates like benzidines, have been linked to carcinogenicity. Moreover, the wasted dyes and colour released in the effluent interfere with the transmission of light in the water bodies that receive the effluent. This in turn inhibits the photosynthesis activity of aquatic biota besides direct toxic effects on biota. Indigo Carmine (IC), a blue synthetic dye, is used in textile industry for dyeing of clothes (blue jeans) and other blue denim, in food industry (typical products include milk desserts, sweets, biscuits), cosmetics industries, as a diagnostic aid (e.g. in kidney function tests) and it has also been employed as redox indicator in analytical chemistry and as a microscopic stain in biology (Othman et al., 2006). IC is also used as a photo- metric detector. However, IC dye causes irritation to the gastrointestinal tract leading to nausea, vomiting and diarrhea. It may also cause irritation to the respiratory tract. Symptoms may include coughing and shortness of breath. IC containing effluents are generated from textiles, printing and dyeing, pa- per, cosmetics, plastics industries, etc. (Porter et al., 1999). Various researches have been performed to develop effective treatment technologies for wastewaters containing dyes, however, no single solution has been satisfactory for remediating the broad diversity of textile wastes. Different physico-chemical processes like electro-kinetic coagulation, ion-exchange, membrane filtration, electrochemical oxidation, and photo-catalytic degradation process have shown consider- able success in treating these wastewaters (Laszlo, 1996; Ge- mea et al., 2003; Grimau and Gutierrez, 2006; Hachem et al., 2001; Cisneros et al., 2002), however, there are certain short comings. Coagulation process produces large amount of sludge leading to high disposal costs. Ion-exchange process has no loss of adsorbent on regeneration, however, it cannot accommodate wide range of dyes, and is expensive. Mem- brane separation process is also effective in removal of dyes, however, due to relatively high investment and membrane * Corresponding author. Tel.: þ91 1332 285319 (O), þ91 1332 285106 (R); fax: þ91 1332 276535, þ91 1332 273560. E-mail addresses: [email protected] (V.C. Srivastava), id_mall2000@ yahoo.co.in (I.D. Mall). 0301-4797/$ - see front matter Ó 2008 Elsevier Ltd. All rights reserved. doi:10.1016/j.jenvman.2008.01.002 Journal of Environmental Management 90 (2009) 710e720 www.elsevier.com/locate/jenvman

Welcome message from author
This document is posted to help you gain knowledge. Please leave a comment to let me know what you think about it! Share it to your friends and learn new things together.
Transcript
Journal of Environmental Management 90 (2009) 710e720www.elsevier.com/locate/jenvman
Rice husk ash as an effective adsorbent: Evaluation of adsorptivecharacteristics for Indigo Carmine dye
Uma R. Lakshmi, Vimal Chandra Srivastava, Indra Deo Mall*, Dilip H. Lataye
Department of Chemical Engineering, Indian Institute of Technology Roorkee, Roorkee 247667, India
Received 26 February 2007; received in revised form 25 October 2007; accepted 4 January 2008
Available online 4 March 2008
Abstract
Present study explored the adsorptive characteristics of Indigo Carmine (IC) dye from aqueous solution onto rice husk ash (RHA). Batchexperiments were carried out to determine the influence of parameters like initial pH (pH0), contact time (t), adsorbent dose (m) and initial con-centration (C0) on the removal of IC. The optimum conditions were found to be: pH0¼ 5.4, t¼ 8 h and m¼ 10.0 g/l. The pseudo-second-orderkinetic model represented the adsorption kinetics of IC on to RHA. Equilibrium isotherms were analyzed by Freundlich, Langmuir, Temkin andRedlichePeterson models using a non-linear regression technique. Adsorption of IC on RHA was favorably influenced by an increase in thetemperature of the operation. The positive values of the change in entropy (DS0) and heat of adsorption (DH0); and the negative value of changein Gibbs free energy (DG0) indicate feasible and spontaneous adsorption of IC on to RHA.� 2008 Elsevier Ltd. All rights reserved.
Keywords: Indigo Carmine; Rice husk ash; Adsorption kinetics; Isotherms; Adsorption thermodynamics
1. Introduction
Several textile and food dyes, and dye intermediates likebenzidines, have been linked to carcinogenicity. Moreover,the wasted dyes and colour released in the effluent interferewith the transmission of light in the water bodies that receivethe effluent. This in turn inhibits the photosynthesis activity ofaquatic biota besides direct toxic effects on biota. IndigoCarmine (IC), a blue synthetic dye, is used in textile industryfor dyeing of clothes (blue jeans) and other blue denim, infood industry (typical products include milk desserts, sweets,biscuits), cosmetics industries, as a diagnostic aid (e.g. inkidney function tests) and it has also been employed as redoxindicator in analytical chemistry and as a microscopic stainin biology (Othman et al., 2006). IC is also used as a photo-metric detector. However, IC dye causes irritation to the
* Corresponding author. Tel.: þ91 1332 285319 (O), þ91 1332 285106 (R);
fax: þ91 1332 276535, þ91 1332 273560.
E-mail addresses: [email protected] (V.C. Srivastava), id_mall2000@
yahoo.co.in (I.D. Mall).
0301-4797/$ - see front matter � 2008 Elsevier Ltd. All rights reserved.
doi:10.1016/j.jenvman.2008.01.002
gastrointestinal tract leading to nausea, vomiting and diarrhea.It may also cause irritation to the respiratory tract. Symptomsmay include coughing and shortness of breath. IC containingeffluents are generated from textiles, printing and dyeing, pa-per, cosmetics, plastics industries, etc. (Porter et al., 1999).
Various researches have been performed to developeffective treatment technologies for wastewaters containingdyes, however, no single solution has been satisfactory forremediating the broad diversity of textile wastes. Differentphysico-chemical processes like electro-kinetic coagulation,ion-exchange, membrane filtration, electrochemical oxidation,and photo-catalytic degradation process have shown consider-able success in treating these wastewaters (Laszlo, 1996; Ge-mea et al., 2003; Grimau and Gutierrez, 2006; Hachemet al., 2001; Cisneros et al., 2002), however, there are certainshort comings. Coagulation process produces large amount ofsludge leading to high disposal costs. Ion-exchange processhas no loss of adsorbent on regeneration, however, it cannotaccommodate wide range of dyes, and is expensive. Mem-brane separation process is also effective in removal of dyes,however, due to relatively high investment and membrane
Nomenclature
1/n heterogeneity factor, dimensionlessaR constant of RedlichePeterson isotherm, l/mgC0 initial concentration of adsorbate in
solution, mg/lCe equilibrium liquid phase concentration, mg/l
h initial sorption rate, mg/g min
I constant that gives idea about the thicknessof boundary layer, mg/g
kf rate constant of pseudo-first-orderadsorption model, min�1
kid intra-particle diffusion rate constant,mg/g min1/2
kS rate constant of pseudo-second-orderadsorption model, g/mg min
KF constant of Freundlich isotherm,(mg/g)/(l/mg)1/n
KL constant of Langmuir isotherm, l/mgKR constant of RedlichePeterson isotherm, l/gn number of data pointsp number of parametersqe equilibrium solid phase concentration, mg/gqe,cal calculated value of solid phase concentration
of adsorbate at equilibrium, mg/gqe,exp experimental value of solid phase
concentration of adsorbate atequilibrium, mg/g
qm maximum adsorption capacity ofadsorbent, mg/g
qt amount of adsorbate adsorbed byadsorbent at time t, mg/g
R universal gas constant, 8.314 J/K molt time, minT absolute temperature, KDG0 Gibbs free energy of adsorption, kJ/molDH0 enthalpy of adsorption, kJ/molDS0 entropy of adsorption, J/K mol
711U.R. Lakshmi et al. / Journal of Environmental Management 90 (2009) 710e720
fouling problem, its application is restricted. As there is a widerange in pH and dyes are difficult to decompose biologically,conventional biological methods are not effective to treat dyebearing wastewaters. Moreover, all these processes are costlyand cannot be used by small industries to treat the wide rangeof dye wastewater.
The adsorption process provides an attractive alternativetreatment, especially if the adsorbent is inexpensive andreadily available. This process is becoming an attractive andpromising technology because of its simplicity, ease of opera-tion and handling, sludge free operation, and regenerationcapacity. Adsorption produces a high quality product, and isa process which is economically feasible (Choy et al., 1999).Almost complete removal of impurities with negligible sideeffects explains its wide application for the treatment of dyebearing wastewaters. Activated carbon (AC) is the most
popular adsorbent, which has been used with great success.However, AC is expensive and its regeneration and reusemake it more costly. Consequently, many investigators havestudied the feasibility of using low-cost substances for theremoval of various dyes and pollutants from wastewaters(Othman et al., 2006; Porter et al., 1999; Choy et al., 1999;Weng, 2002; Weng and Pan, 2006). Various researchers haveutilized adsorption technique for the removal of toxic IC dyefrom water and wastewater (Othman et al., 2006; Pradoet al., 2003, 2004; Mittal et al., 2006; dos Anjos et al., 2002).
Rice husk is an agricultural waste, obtained from the ricemills after the separation of rice from paddy. It is mostlyused as a fuel in the boiler furnaces of industries like sugar,paper, etc. to produce steam. The rice husk ash (RHA) iscollected from the particulate collection equipment attachedupstream to the stack of the rice husk-fired boilers. RHA isavailable in plenty and almost free of cost. RHA has goodadsorptive properties and has been used for the removal ofvarious dyes (Rahman et al., 2005; Mane et al., 2007), heavymetals (Nakbanpote et al., 2000; Khalid et al., 2000; Kumarand Bandyopadhyay, 2006; Srivastava et al., 2006a, 2007),and other compounds like chlorinated hydrocarbons (Imagawaet al., 2000), palmytic acid (Adam and Chua, 2004), etc. Thisstudy is an attempt to explore the possibility of using RHA forthe removal of IC from aqueous solution by performing batchstudies. The effect of such factors as the initial pH (pH0), ad-sorbent dose (m), initial IC concentration (C0) and contacttime (t) on the adsorption efficiency of IC on RHA has beeninvestigated.
2. Materials and methods
2.1. RHA
RHA was used as obtained from a nearby paper mill (Bar-nala paper mill, Punjab, India) as such without any pretreat-ment for the removal of IC from synthetic aqueous solutionsin a batch treatment process. Detailed physico-chemical char-acteristics of the RHA have already been presented elsewhere(Srivastava et al., 2006a, 2007).
Average particle size of RHA was 150.47 mm. Bulk densityand heating value of RHA were found to be 104.9 kg/m3 and9.68 MJ/kg, respectively. Proximate analysis showed thepresence of 0.73% moisture, 5.37% volatile matter, 88.0%ash and 5.90% fixed carbon in RHA. High amount of ashindicates that RHA is basically inorganic in nature. Elementalanalyses showed 7.424% carbon, 0.061% hydrogen, 0.846%nitrogen, and rest others. The heating of rice husk at differenttemperatures produces RHA containing different contents ofcarbon and silicon dioxide. Nakbanpote et al. (2000) reportedthat the RHA heated at higher temperatures had reducedpercentages of carbon but an increased proportion of silicondioxide. Almost all of the carbon was lost when heated attemperatures �400 �C. In the paper mills, rice husk is heatedat temperatures �700 �C to generate steam. Therefore, it isexpected that the amount of carbon will be very small in RHA.
712 U.R. Lakshmi et al. / Journal of Environmental Management 90 (2009) 710e720
The d-spacing values provided by the XRD spectra of RHAreflected the presence of Cristobalite (SiO2), Margaritasite((Cs,K,H3O)2(UO2)2V2O8$(H2O)) and Macedonite (PbTiO3).The BrunauereEmmetteTeller (BET) surface area of RHAis 36.44 m2/g, whereas BarretteJoynereHanlenda (BJH) ad-sorption/desorption surface area of pores is 27.45/22.18 m2/g. The analysis of the BJH adsorption pore distribution showsthat the micropores (d< 20 A) have a total pore area of about20%, mesopores account for about 78% and that the macro-pores about 2%. The desorption pore distribution shows thatthe mesopores account for 99% of the pore area. The averagepore diameter by BET method is found to be 42.603 A. TheRHA, thus, is found to consist of mesopores predominantly.This is what is desirable for the liquid phase adsorptiveremoval of IC dye. The 99% pore area attributed to mesoporesduring desorption indicates the predominance of mesopores inadsorption process. The Fourier Transform Infra Red (FTIR)spectra of the blank RHA indicated the presence of eCOe,eOH, eSieOH, eSieH and eCeOH groups on the surfaceof RHA.
2.2. Adsorbate
The adsorbate, IC dye (C.I.¼ 73015, chemical formu-la¼ C16H8N2O8S2Na2, M.W¼ 466.35; anionic dye) wassupplied by HiMedia Laboratories Pvt. Limited, India. Thedye was of analytical reagent grade, and of >99% purity.The structure of IC is illustrated in Fig. 1. Stock solution(1000 mg/l) of dye was prepared by dissolving an accuratelyweighed quantity of dye in double-distilled water. Experimen-tal solutions of the desired concentrations were then obtainedby successive dilutions with distilled water.
2.3. Analytical measurements
A double beam UV/vis spectrophotometer (PerkineElmer,Lambda 35) was used to determine the concentration of dyesamples by finding out the absorbance at the characteristicwavelength. The wavelength corresponding to maximumabsorbance (lmax) as determined from this plot was 610 nm.This wavelength was used for preparing the calibration curvesbetween absorbance and the concentration of the dye solution.The calibration plot of absorbance versus concentration for ICshowed a linear variation up to 100 mg/l concentration.Therefore, the samples with higher concentration of IC(>100 mg/l) were diluted with distilled water, whenevernecessary, to make the concentration less than 100 mg/l, for
NH
HN
O
O
NaO3S
SO3Na
Fig. 1. Molecular structure of Indigo Carmine.
the accurate determination of the IC concentration with thehelp of the linear portion of the calibration curve.
2.4. Batch experimental programme
Batch experiments were conducted at 303� 1 K toexamine the effect of important parameters like pH0, m, C0
and t on the adsorptive removal of IC. For each experimentalrun, 100 ml of IC solution of known concentration, pH0 anda known adsorbent dose were taken in a 250 ml stopperedconical flask. This mixture was agitated in a temperature-controlled orbital shaker at a constant speed of 150 rpm at303� 1 K. Samples were withdrawn at appropriate timeintervals. All the samples were then centrifuged (ResearchCentrifuge, Remi scientific works, Mumbai) at 8000 rpm for10 min to remove the suspended RHA particles, and the super-natant liquid was analyzed for the residual dye concentration.The effect of pH0 on dye removal was studied over a pH0
range of 2e10. The pH0 was adjusted by adding dilute aque-ous solutions of H2SO4 or NaOH (0.10 M). To find theoptimum adsorbent dose, a 100 ml dye solution wascontacted with different amounts of RHA till equilibriumwas attained. The adsorption kinetics was determined byanalyzing adsorptive uptake of the dye from the aqueous solu-tion at different time intervals. For adsorption isotherms, ICsolution of different concentrations was agitated with theknown amount of adsorbent till the equilibrium was achieved.The effect of temperature on the sorption characteristics wasinvestigated by determining the adsorption isotherms at 293,303, 313 and 323 K. C0 was varied from 20 to 1000 mg/l.Blank experimental runs, with only the adsorbent in 100 mlof double-distilled water, were conducted simultaneously atsimilar conditions to account for any colour leached by theadsorbent and glass containers.
3. Result and discussion
3.1. Effect of initial pH (pH0)
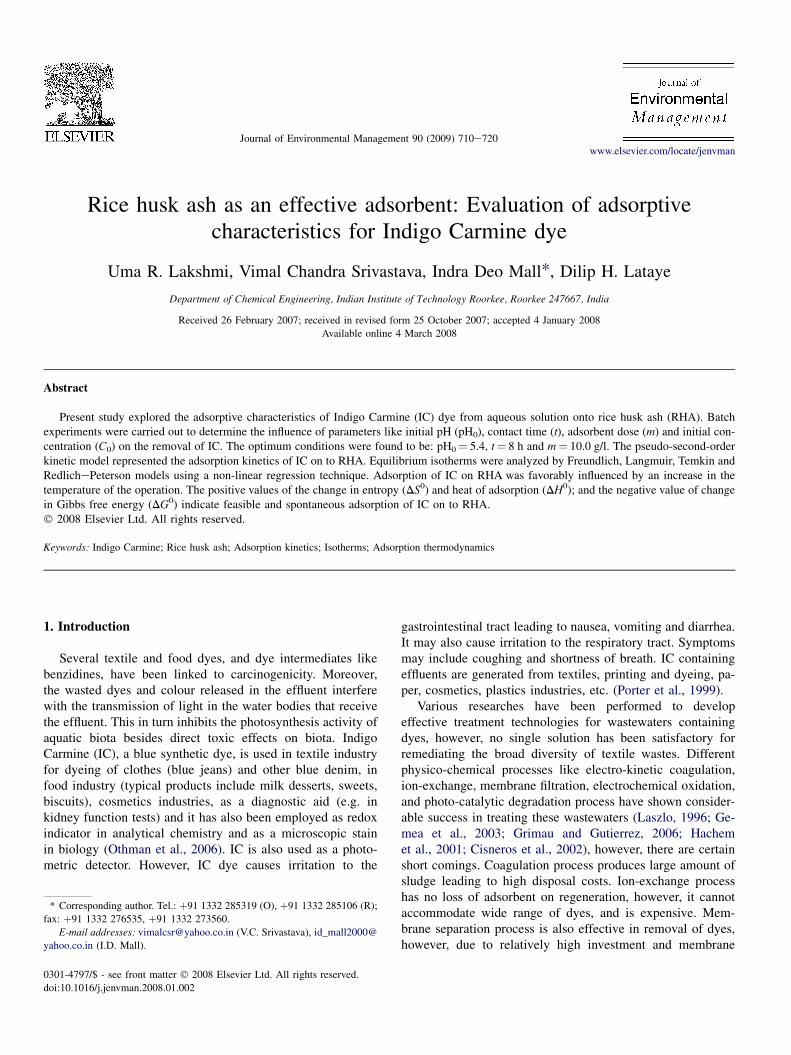
The effect of pH0 was studied over a pH0 range of 2e10with IC solutions of C0¼ 50 mg/l having natural pH0 of 5.4.Fig. 2 shows the dye removal with RHA dose of 10 g/l andt¼ 4 h. It can be inferred that the dye removal due ismaximum and constant for pH0 greater than or equal to 4.0.
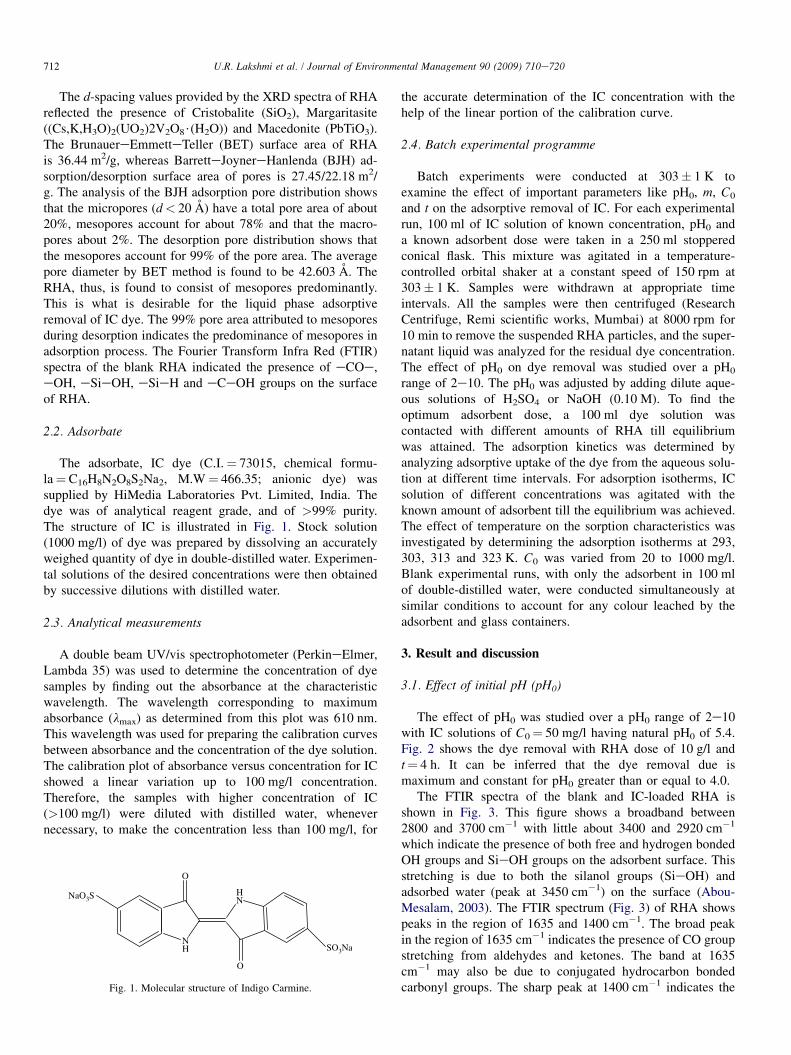
The FTIR spectra of the blank and IC-loaded RHA isshown in Fig. 3. This figure shows a broadband between2800 and 3700 cm�1 with little about 3400 and 2920 cm�1
which indicate the presence of both free and hydrogen bondedOH groups and SieOH groups on the adsorbent surface. Thisstretching is due to both the silanol groups (SieOH) andadsorbed water (peak at 3450 cm�1) on the surface (Abou-Mesalam, 2003). The FTIR spectrum (Fig. 3) of RHA showspeaks in the region of 1635 and 1400 cm�1. The broad peakin the region of 1635 cm�1 indicates the presence of CO groupstretching from aldehydes and ketones. The band at 1635cm�1 may also be due to conjugated hydrocarbon bondedcarbonyl groups. The sharp peak at 1400 cm�1 indicates the
10
11
12
13
14
15
2 4 6 8 10
pH0
qt (
mg/
g)
2
4
6
8
10
pHf
Fig. 2. Effect of pH0 on the adsorption of IC by RHA, and the variation in sys-
tem pHf with pH0 during the adsorption of IC by RHA (T¼ 303 K, t¼ 4 h,
C0¼ 50 mg/l, m¼ 10 g/l).
713U.R. Lakshmi et al. / Journal of Environmental Management 90 (2009) 710e720
presence of primary amides and signifies CeN stretching andNeH in-plane bending. The peak at 1400 cm�1 may also bedue to the eNO2 group symmetric stretching. The bandaround w1400 cm�1 in RHA may also be attributed to thecarboxylecarbonate structures (Ricordel et al., 2001). Thepeaks at about 570 cm�1 indicate the presence of SieH.With the loading of IC the shifting of the peaks is seen fromabout 3440, 1635, 1400 and 570 cm�1. The shifting occursboth to higher and lower wave numbers. The FTIR spectrafor IC-loaded RHA show the disappearance of bonds around
Fig. 3. FTIR spectra of RHA before a
3140 cm�1 and fading of peak around 1400 cm�1. Thisincrease signifies the reduction in the amount of functionalgroup at this wave number, indicating the participation ofthis functional group during the sorption process.
There are two possible mechanisms for the effect of pH onadsorption of dyes on any adsorbent: (a) electrostatic interac-tion between the protonated groups of carbon and acidic dye,and (b) the chemical reaction between the adsorbate and theadsorbent (Namasivayam and Kavitha, 2002). RHA particlescontain a large number of functional groups eCOe, eOH,eSieOH, eSieH, eCeOH, etc. Dye molecules may interactwith these functional groups via extremely complicatedpathways. Also, there may be weak electrostatic interactionbetween the dye molecules and the electron-deficient siteson the surface of the RHA particles. However, for this study,the extent of IC adsorption onto RHA remained constant inthe pH0 range of 4.0e9.0. This may be attributed to secondmechanism of weak electrostatic interaction (Bhattacharyyaand Sharma, 2004).
To understand the adsorption mechanism, it is necessary todetermine the point of zero charge (pHPZC) of the adsorbent.Adsorption of cations is favored at pH> pHPZC, while theadsorption of anions is favored at pH< pHPZC. The pHPZC
of RHA was 8.3 (Srivastava et al., 2006a,b,c). RHA is posi-tively charged for pH0< 8.3, and an electrostatic attractionexists between the positively charged surface of the RHAand anionic dye, and thus, favours the adsorption of anionicIC dye in the pH range of 0e8.3 via following reaction:
Adþ þDye�#Ad�Dye
where Ad stands for RHA surface.
nd after the adsorption of IC dye.
714 U.R. Lakshmi et al. / Journal of Environmental Management 90 (2009) 710e720
This is also supported by thermodynamic considerations(given in later section). DG0 values for the sorption of IConto RHA are in the range of �6.5 to �5.5 kcal/mol indicatingthat the sorption process is mainly due to electrostaticinteraction, and partly due to chemisorption.
The system pH changes during the adsorption process.Fig. 2 shows the final pH values (pHf) as a function of pH0
in Fig. 2. The pHf values are higher than the pH0 values forpH0< 8.0 for C0¼ 100 mg/l. Although the IC removalincreases sharply with an increase in pH0, the pHf valueswere almost constant for 6.5� pH0� 9.3. The pHf valuesare, therefore, considered to indicate the equilibrium pHvalues (Kwon et al., 2005). The increase in pH of the solutionduring sorption process appears to be due to the adsorption ofHþ ions onto RHA (Srivastava et al., 2006b,c), and thehydrolysis of RHA to release basic cations in solution. The de-gree of pH variation was small in higher pH0 solutions becauseof their higher buffering capacities (Dimitrova and Mehandg-iev, 1998).
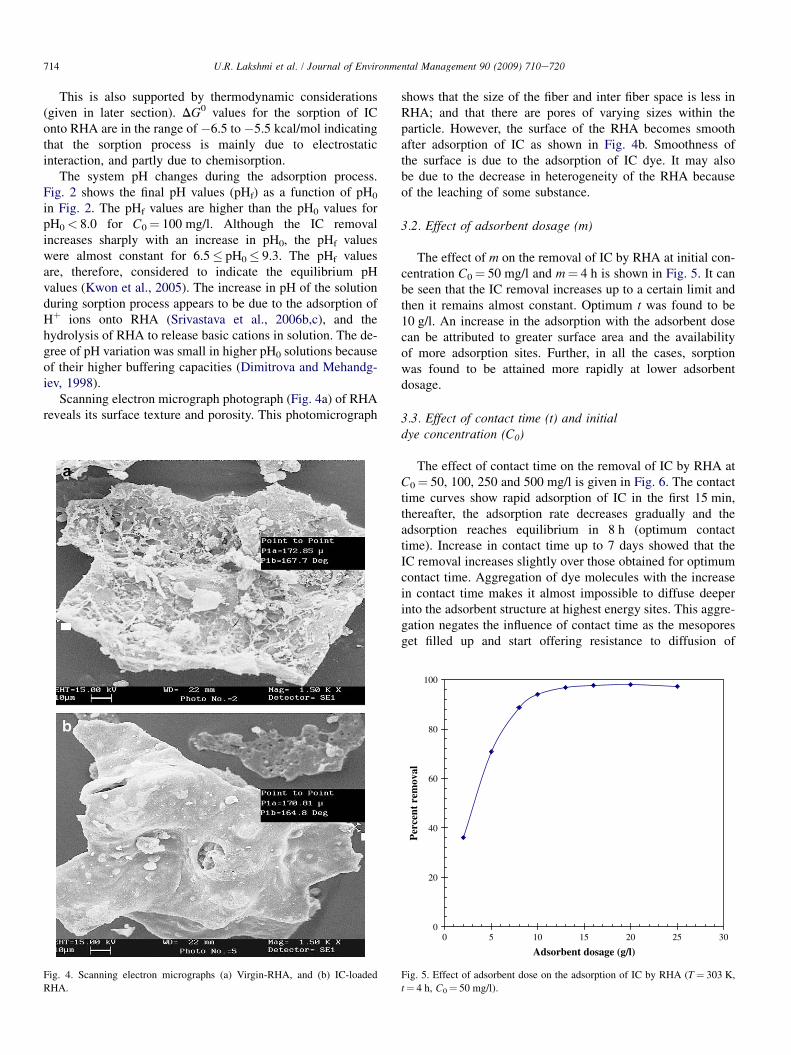
Scanning electron micrograph photograph (Fig. 4a) of RHAreveals its surface texture and porosity. This photomicrograph
Fig. 4. Scanning electron micrographs (a) Virgin-RHA, and (b) IC-loaded
RHA.
shows that the size of the fiber and inter fiber space is less inRHA; and that there are pores of varying sizes within theparticle. However, the surface of the RHA becomes smoothafter adsorption of IC as shown in Fig. 4b. Smoothness ofthe surface is due to the adsorption of IC dye. It may alsobe due to the decrease in heterogeneity of the RHA becauseof the leaching of some substance.
3.2. Effect of adsorbent dosage (m)
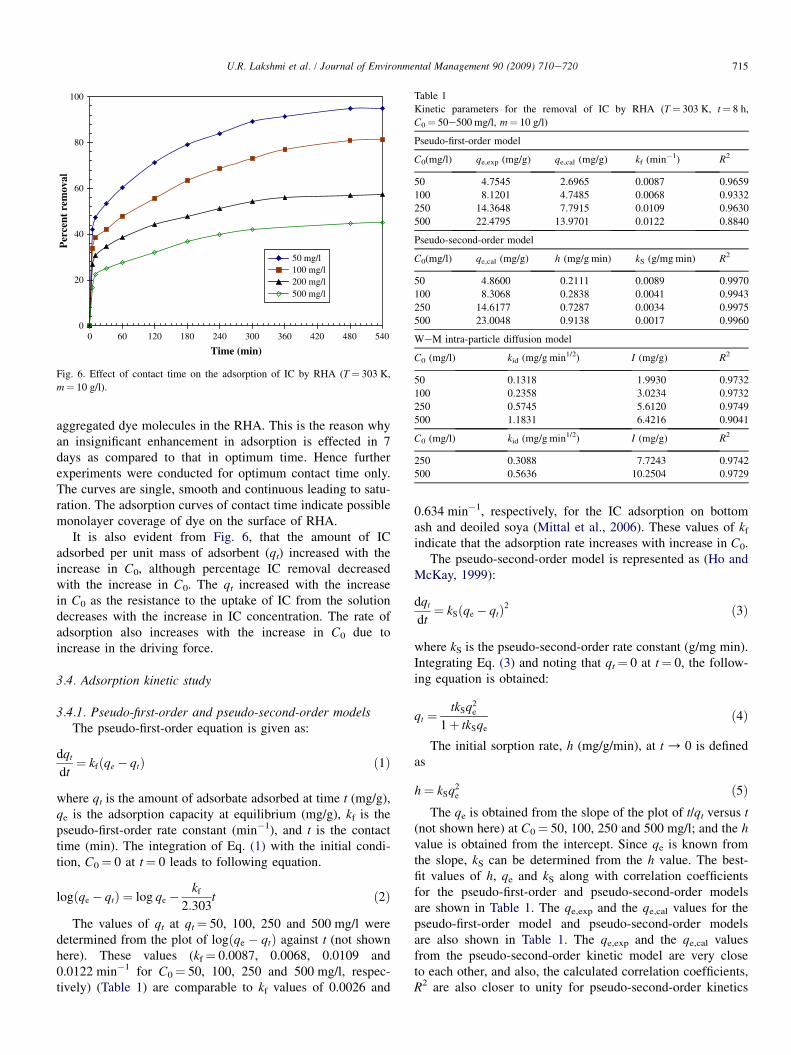
The effect of m on the removal of IC by RHA at initial con-centration C0¼ 50 mg/l and m¼ 4 h is shown in Fig. 5. It canbe seen that the IC removal increases up to a certain limit andthen it remains almost constant. Optimum t was found to be10 g/l. An increase in the adsorption with the adsorbent dosecan be attributed to greater surface area and the availabilityof more adsorption sites. Further, in all the cases, sorptionwas found to be attained more rapidly at lower adsorbentdosage.
3.3. Effect of contact time (t) and initialdye concentration (C0)
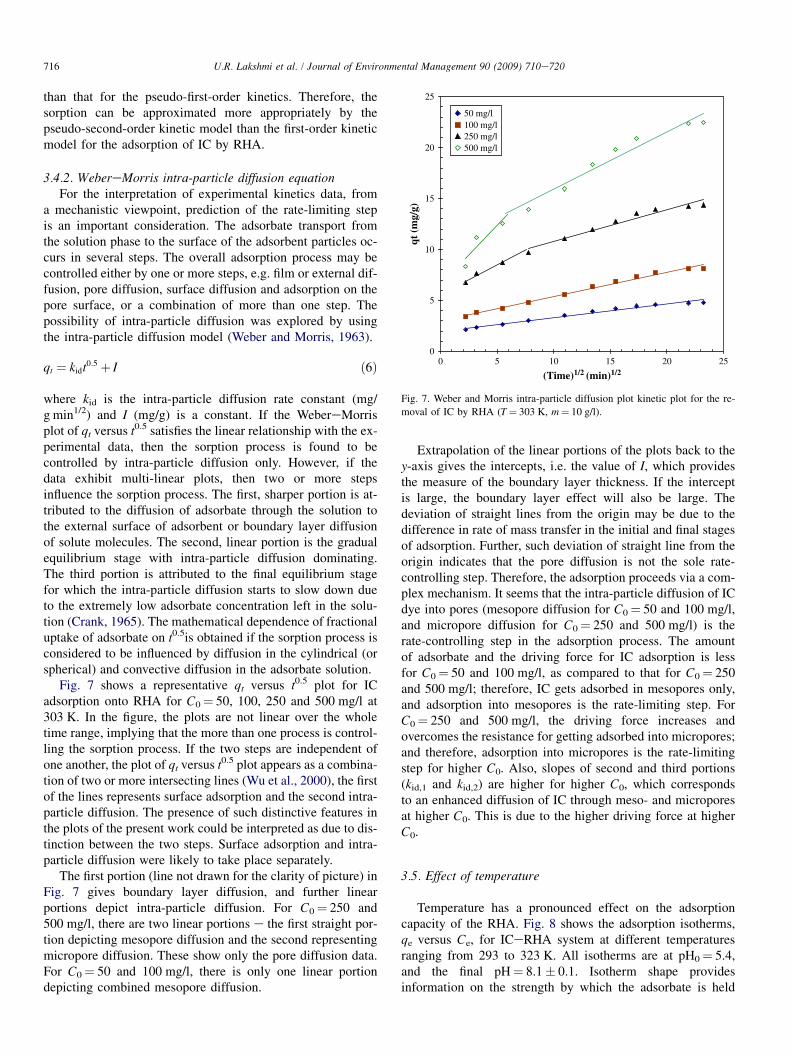
The effect of contact time on the removal of IC by RHA atC0¼ 50, 100, 250 and 500 mg/l is given in Fig. 6. The contacttime curves show rapid adsorption of IC in the first 15 min,thereafter, the adsorption rate decreases gradually and theadsorption reaches equilibrium in 8 h (optimum contacttime). Increase in contact time up to 7 days showed that theIC removal increases slightly over those obtained for optimumcontact time. Aggregation of dye molecules with the increasein contact time makes it almost impossible to diffuse deeperinto the adsorbent structure at highest energy sites. This aggre-gation negates the influence of contact time as the mesoporesget filled up and start offering resistance to diffusion of
0
20
40
60
80
100
0 10 15 20 25 30
Adsorbent dosage (g/l)
Per
cent
rem
oval
5
Fig. 5. Effect of adsorbent dose on the adsorption of IC by RHA (T¼ 303 K,
t¼ 4 h, C0¼ 50 mg/l).
0
20
40
60
80
100
0 60 120 180 240 300 360 420 480 540
Time (min)
Per
cent
rem
oval
50 mg/l 100 mg/l 200 mg/l 500 mg/l
Fig. 6. Effect of contact time on the adsorption of IC by RHA (T¼ 303 K,
m¼ 10 g/l).
Table 1
Kinetic parameters for the removal of IC by RHA (T¼ 303 K, t¼ 8 h,
C0¼ 50e500 mg/l, m¼ 10 g/l)
Pseudo-first-order model
C0(mg/l) qe,exp (mg/g) qe,cal (mg/g) kf (min�1) R2
50 4.7545 2.6965 0.0087 0.9659
100 8.1201 4.7485 0.0068 0.9332
250 14.3648 7.7915 0.0109 0.9630
500 22.4795 13.9701 0.0122 0.8840
Pseudo-second-order model
C0(mg/l) qe,cal (mg/g) h (mg/g min) kS (g/mg min) R2
50 4.8600 0.2111 0.0089 0.9970
100 8.3068 0.2838 0.0041 0.9943
250 14.6177 0.7287 0.0034 0.9975
500 23.0048 0.9138 0.0017 0.9960
WeM intra-particle diffusion model
C0 (mg/l) kid (mg/g min1/2) I (mg/g) R2
50 0.1318 1.9930 0.9732
100 0.2358 3.0234 0.9732
250 0.5745 5.6120 0.9749
500 1.1831 6.4216 0.9041
C0 (mg/l) kid (mg/g min1/2) I (mg/g) R2
250 0.3088 7.7243 0.9742
500 0.5636 10.2504 0.9729
715U.R. Lakshmi et al. / Journal of Environmental Management 90 (2009) 710e720
aggregated dye molecules in the RHA. This is the reason whyan insignificant enhancement in adsorption is effected in 7days as compared to that in optimum time. Hence furtherexperiments were conducted for optimum contact time only.The curves are single, smooth and continuous leading to satu-ration. The adsorption curves of contact time indicate possiblemonolayer coverage of dye on the surface of RHA.
It is also evident from Fig. 6, that the amount of ICadsorbed per unit mass of adsorbent (qt) increased with theincrease in C0, although percentage IC removal decreasedwith the increase in C0. The qt increased with the increasein C0 as the resistance to the uptake of IC from the solutiondecreases with the increase in IC concentration. The rate ofadsorption also increases with the increase in C0 due toincrease in the driving force.
3.4. Adsorption kinetic study
3.4.1. Pseudo-first-order and pseudo-second-order modelsThe pseudo-first-order equation is given as:
dqt
dt¼ kfðqe� qtÞ ð1Þ
where qt is the amount of adsorbate adsorbed at time t (mg/g),qe is the adsorption capacity at equilibrium (mg/g), kf is thepseudo-first-order rate constant (min�1), and t is the contacttime (min). The integration of Eq. (1) with the initial condi-tion, C0¼ 0 at t¼ 0 leads to following equation.
logðqe � qtÞ ¼ log qe �kf
2:303t ð2Þ
The values of qt at qt¼ 50, 100, 250 and 500 mg/l weredetermined from the plot of logðqe � qtÞ against t (not shownhere). These values (kf¼ 0.0087, 0.0068, 0.0109 and0.0122 min�1 for C0¼ 50, 100, 250 and 500 mg/l, respec-tively) (Table 1) are comparable to kf values of 0.0026 and
0.634 min�1, respectively, for the IC adsorption on bottomash and deoiled soya (Mittal et al., 2006). These values of kf
indicate that the adsorption rate increases with increase in C0.The pseudo-second-order model is represented as (Ho and
McKay, 1999):
dqt
dt¼ kSðqe� qtÞ2 ð3Þ
where kS is the pseudo-second-order rate constant (g/mg min).Integrating Eq. (3) and noting that qt¼ 0 at t¼ 0, the follow-ing equation is obtained:
qt ¼tkSq2
e
1þ tkSqe
ð4Þ
The initial sorption rate, h (mg/g/min), at t / 0 is definedas
h¼ kSq2e ð5Þ
The qe is obtained from the slope of the plot of t/qt versus t(not shown here) at C0¼ 50, 100, 250 and 500 mg/l; and the hvalue is obtained from the intercept. Since qe is known fromthe slope, kS can be determined from the h value. The best-fit values of h, qe and kS along with correlation coefficientsfor the pseudo-first-order and pseudo-second-order modelsare shown in Table 1. The qe,exp and the qe,cal values for thepseudo-first-order model and pseudo-second-order modelsare also shown in Table 1. The qe,exp and the qe,cal valuesfrom the pseudo-second-order kinetic model are very closeto each other, and also, the calculated correlation coefficients,R2 are also closer to unity for pseudo-second-order kinetics
0
5
10
15
20
25
0 5 10 15 20 25
qt (
mg/
g)
50 mg/l 100 mg/l 250 mg/l 500 mg/l
(Time)1/2 (min)1/2
Fig. 7. Weber and Morris intra-particle diffusion plot kinetic plot for the re-
moval of IC by RHA (T¼ 303 K, m¼ 10 g/l).
716 U.R. Lakshmi et al. / Journal of Environmental Management 90 (2009) 710e720
than that for the pseudo-first-order kinetics. Therefore, thesorption can be approximated more appropriately by thepseudo-second-order kinetic model than the first-order kineticmodel for the adsorption of IC by RHA.
3.4.2. WebereMorris intra-particle diffusion equationFor the interpretation of experimental kinetics data, from
a mechanistic viewpoint, prediction of the rate-limiting stepis an important consideration. The adsorbate transport fromthe solution phase to the surface of the adsorbent particles oc-curs in several steps. The overall adsorption process may becontrolled either by one or more steps, e.g. film or external dif-fusion, pore diffusion, surface diffusion and adsorption on thepore surface, or a combination of more than one step. Thepossibility of intra-particle diffusion was explored by usingthe intra-particle diffusion model (Weber and Morris, 1963).
qt ¼ kidt0:5þ I ð6Þ
where kid is the intra-particle diffusion rate constant (mg/g min1/2) and I (mg/g) is a constant. If the WebereMorrisplot of qt versus t0.5 satisfies the linear relationship with the ex-perimental data, then the sorption process is found to becontrolled by intra-particle diffusion only. However, if thedata exhibit multi-linear plots, then two or more stepsinfluence the sorption process. The first, sharper portion is at-tributed to the diffusion of adsorbate through the solution tothe external surface of adsorbent or boundary layer diffusionof solute molecules. The second, linear portion is the gradualequilibrium stage with intra-particle diffusion dominating.The third portion is attributed to the final equilibrium stagefor which the intra-particle diffusion starts to slow down dueto the extremely low adsorbate concentration left in the solu-tion (Crank, 1965). The mathematical dependence of fractionaluptake of adsorbate on t0.5is obtained if the sorption process isconsidered to be influenced by diffusion in the cylindrical (orspherical) and convective diffusion in the adsorbate solution.
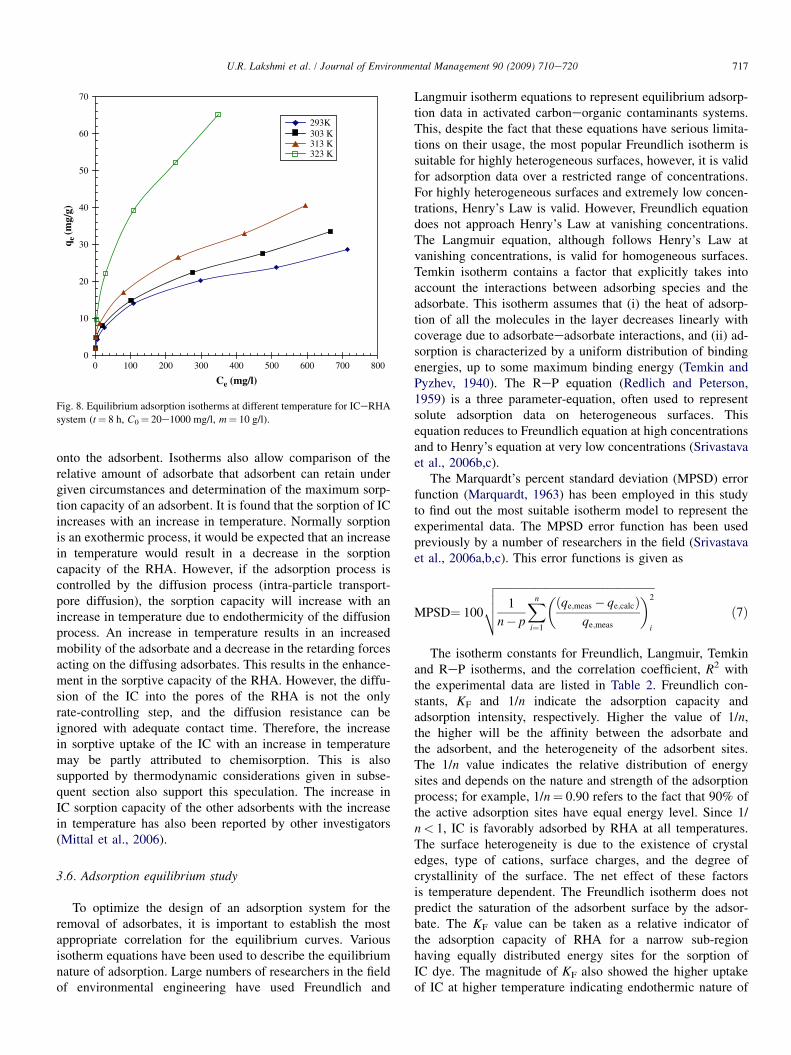
Fig. 7 shows a representative qt versus t0.5 plot for ICadsorption onto RHA for C0¼ 50, 100, 250 and 500 mg/l at303 K. In the figure, the plots are not linear over the wholetime range, implying that the more than one process is control-ling the sorption process. If the two steps are independent ofone another, the plot of qt versus t0.5 plot appears as a combina-tion of two or more intersecting lines (Wu et al., 2000), the firstof the lines represents surface adsorption and the second intra-particle diffusion. The presence of such distinctive features inthe plots of the present work could be interpreted as due to dis-tinction between the two steps. Surface adsorption and intra-particle diffusion were likely to take place separately.
The first portion (line not drawn for the clarity of picture) inFig. 7 gives boundary layer diffusion, and further linearportions depict intra-particle diffusion. For C0¼ 250 and500 mg/l, there are two linear portions e the first straight por-tion depicting mesopore diffusion and the second representingmicropore diffusion. These show only the pore diffusion data.For C0¼ 50 and 100 mg/l, there is only one linear portiondepicting combined mesopore diffusion.
Extrapolation of the linear portions of the plots back to they-axis gives the intercepts, i.e. the value of I, which providesthe measure of the boundary layer thickness. If the interceptis large, the boundary layer effect will also be large. Thedeviation of straight lines from the origin may be due to thedifference in rate of mass transfer in the initial and final stagesof adsorption. Further, such deviation of straight line from theorigin indicates that the pore diffusion is not the sole rate-controlling step. Therefore, the adsorption proceeds via a com-plex mechanism. It seems that the intra-particle diffusion of ICdye into pores (mesopore diffusion for C0¼ 50 and 100 mg/l,and micropore diffusion for C0¼ 250 and 500 mg/l) is therate-controlling step in the adsorption process. The amountof adsorbate and the driving force for IC adsorption is lessfor C0¼ 50 and 100 mg/l, as compared to that for C0¼ 250and 500 mg/l; therefore, IC gets adsorbed in mesopores only,and adsorption into mesopores is the rate-limiting step. ForC0¼ 250 and 500 mg/l, the driving force increases andovercomes the resistance for getting adsorbed into micropores;and therefore, adsorption into micropores is the rate-limitingstep for higher C0. Also, slopes of second and third portions(kid,1 and kid,2) are higher for higher C0, which correspondsto an enhanced diffusion of IC through meso- and microporesat higher C0. This is due to the higher driving force at higherC0.
3.5. Effect of temperature
Temperature has a pronounced effect on the adsorptioncapacity of the RHA. Fig. 8 shows the adsorption isotherms,qe versus Ce, for ICeRHA system at different temperaturesranging from 293 to 323 K. All isotherms are at pH0¼ 5.4,and the final pH¼ 8.1� 0.1. Isotherm shape providesinformation on the strength by which the adsorbate is held
0
10
20
30
40
50
60
70
0 100 200 300 400 500 600 700 800
Ce (mg/l)
q e (m
g/g)
293K 303 K 313 K 323 K
Fig. 8. Equilibrium adsorption isotherms at different temperature for ICeRHA
system (t¼ 8 h, C0¼ 20e1000 mg/l, m¼ 10 g/l).
717U.R. Lakshmi et al. / Journal of Environmental Management 90 (2009) 710e720
onto the adsorbent. Isotherms also allow comparison of therelative amount of adsorbate that adsorbent can retain undergiven circumstances and determination of the maximum sorp-tion capacity of an adsorbent. It is found that the sorption of ICincreases with an increase in temperature. Normally sorptionis an exothermic process, it would be expected that an increasein temperature would result in a decrease in the sorptioncapacity of the RHA. However, if the adsorption process iscontrolled by the diffusion process (intra-particle transport-pore diffusion), the sorption capacity will increase with anincrease in temperature due to endothermicity of the diffusionprocess. An increase in temperature results in an increasedmobility of the adsorbate and a decrease in the retarding forcesacting on the diffusing adsorbates. This results in the enhance-ment in the sorptive capacity of the RHA. However, the diffu-sion of the IC into the pores of the RHA is not the onlyrate-controlling step, and the diffusion resistance can beignored with adequate contact time. Therefore, the increasein sorptive uptake of the IC with an increase in temperaturemay be partly attributed to chemisorption. This is alsosupported by thermodynamic considerations given in subse-quent section also support this speculation. The increase inIC sorption capacity of the other adsorbents with the increasein temperature has also been reported by other investigators(Mittal et al., 2006).
3.6. Adsorption equilibrium study
To optimize the design of an adsorption system for theremoval of adsorbates, it is important to establish the mostappropriate correlation for the equilibrium curves. Variousisotherm equations have been used to describe the equilibriumnature of adsorption. Large numbers of researchers in the fieldof environmental engineering have used Freundlich and
Langmuir isotherm equations to represent equilibrium adsorp-tion data in activated carboneorganic contaminants systems.This, despite the fact that these equations have serious limita-tions on their usage, the most popular Freundlich isotherm issuitable for highly heterogeneous surfaces, however, it is validfor adsorption data over a restricted range of concentrations.For highly heterogeneous surfaces and extremely low concen-trations, Henry’s Law is valid. However, Freundlich equationdoes not approach Henry’s Law at vanishing concentrations.The Langmuir equation, although follows Henry’s Law atvanishing concentrations, is valid for homogeneous surfaces.Temkin isotherm contains a factor that explicitly takes intoaccount the interactions between adsorbing species and theadsorbate. This isotherm assumes that (i) the heat of adsorp-tion of all the molecules in the layer decreases linearly withcoverage due to adsorbateeadsorbate interactions, and (ii) ad-sorption is characterized by a uniform distribution of bindingenergies, up to some maximum binding energy (Temkin andPyzhev, 1940). The ReP equation (Redlich and Peterson,1959) is a three parameter-equation, often used to representsolute adsorption data on heterogeneous surfaces. Thisequation reduces to Freundlich equation at high concentrationsand to Henry’s equation at very low concentrations (Srivastavaet al., 2006b,c).
The Marquardt’s percent standard deviation (MPSD) errorfunction (Marquardt, 1963) has been employed in this studyto find out the most suitable isotherm model to represent theexperimental data. The MPSD error function has been usedpreviously by a number of researchers in the field (Srivastavaet al., 2006a,b,c). This error functions is given as
MPSD¼ 100
ffiffiffiffiffiffiffiffiffiffiffiffiffiffiffiffiffiffiffiffiffiffiffiffiffiffiffiffiffiffiffiffiffiffiffiffiffiffiffiffiffiffiffiffiffiffiffiffiffiffiffiffiffiffiffiffiffi1
n� p
Xn
i¼1
�ðqe;meas � qe;calcÞqe;meas
�2
i
vuut ð7Þ
The isotherm constants for Freundlich, Langmuir, Temkinand ReP isotherms, and the correlation coefficient, R2 withthe experimental data are listed in Table 2. Freundlich con-stants, KF and 1/n indicate the adsorption capacity andadsorption intensity, respectively. Higher the value of 1/n,the higher will be the affinity between the adsorbate andthe adsorbent, and the heterogeneity of the adsorbent sites.The 1/n value indicates the relative distribution of energysites and depends on the nature and strength of the adsorptionprocess; for example, 1/n¼ 0.90 refers to the fact that 90% ofthe active adsorption sites have equal energy level. Since 1/n< 1, IC is favorably adsorbed by RHA at all temperatures.The surface heterogeneity is due to the existence of crystaledges, type of cations, surface charges, and the degree ofcrystallinity of the surface. The net effect of these factorsis temperature dependent. The Freundlich isotherm does notpredict the saturation of the adsorbent surface by the adsor-bate. The KF value can be taken as a relative indicator ofthe adsorption capacity of RHA for a narrow sub-regionhaving equally distributed energy sites for the sorption ofIC dye. The magnitude of KF also showed the higher uptakeof IC at higher temperature indicating endothermic nature of
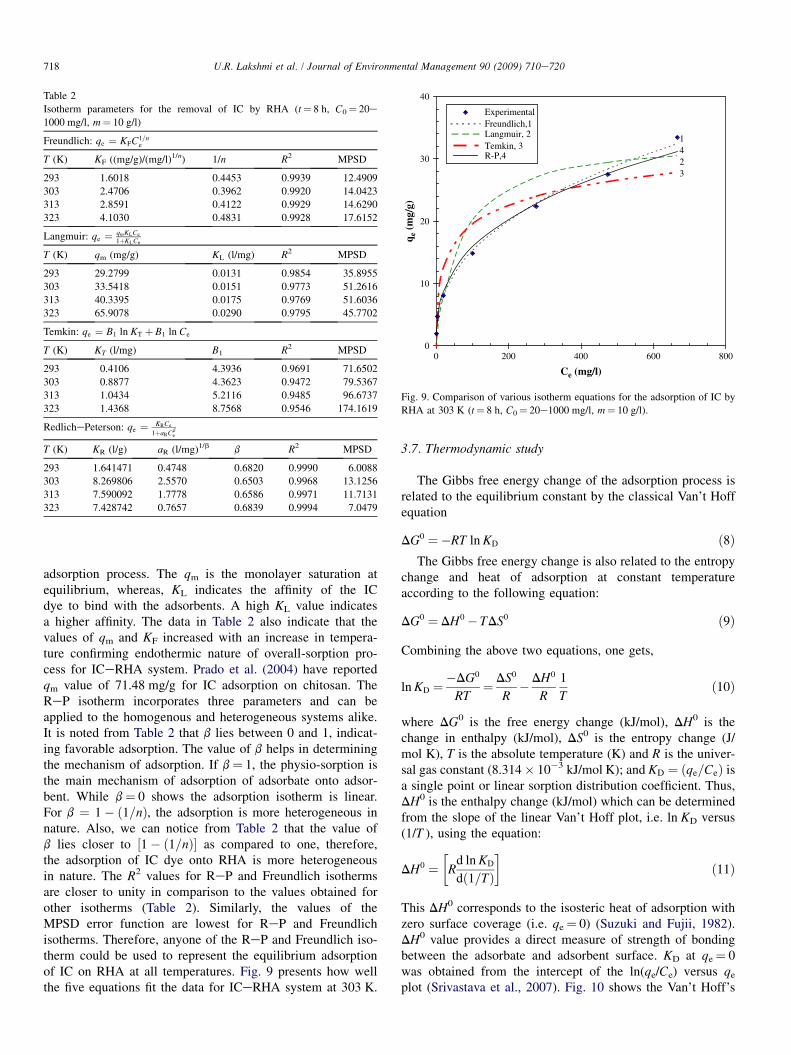
Table 2
Isotherm parameters for the removal of IC by RHA (t¼ 8 h, C0¼ 20e
1000 mg/l, m¼ 10 g/l)
Freundlich: qe ¼ KFC1=ne
T (K) KF ((mg/g)/(mg/l)1/n) 1/n R2 MPSD
293 1.6018 0.4453 0.9939 12.4909
303 2.4706 0.3962 0.9920 14.0423
313 2.8591 0.4122 0.9929 14.6290
323 4.1030 0.4831 0.9928 17.6152
Langmuir: qe ¼ qmKLCe
1þKLCe
T (K) qm (mg/g) KL (l/mg) R2 MPSD
293 29.2799 0.0131 0.9854 35.8955
303 33.5418 0.0151 0.9773 51.2616
313 40.3395 0.0175 0.9769 51.6036
323 65.9078 0.0290 0.9795 45.7702
Temkin: qe ¼ B1 ln KT þ B1 ln Ce
T (K) KT (l/mg) B1 R2 MPSD
293 0.4106 4.3936 0.9691 71.6502
303 0.8877 4.3623 0.9472 79.5367
313 1.0434 5.2116 0.9485 96.6737
323 1.4368 8.7568 0.9546 174.1619
RedlichePeterson: qe ¼ KRCe
1þaRCbe
T (K) KR (l/g) aR (l/mg)1/b b R2 MPSD
293 1.641471 0.4748 0.6820 0.9990 6.0088
303 8.269806 2.5570 0.6503 0.9968 13.1256
313 7.590092 1.7778 0.6586 0.9971 11.7131
323 7.428742 0.7657 0.6839 0.9994 7.0479
0
10
20
30
40
0 200 400 600 800
Ce (mg/l)
q e (
mg/
g)
ExperimentalFreundlich,1Langmuir, 2Temkin, 3R-P,4
1423
Fig. 9. Comparison of various isotherm equations for the adsorption of IC by
RHA at 303 K (t¼ 8 h, C0¼ 20e1000 mg/l, m¼ 10 g/l).
718 U.R. Lakshmi et al. / Journal of Environmental Management 90 (2009) 710e720
adsorption process. The qm is the monolayer saturation atequilibrium, whereas, KL indicates the affinity of the ICdye to bind with the adsorbents. A high KL value indicatesa higher affinity. The data in Table 2 also indicate that thevalues of qm and KF increased with an increase in tempera-ture confirming endothermic nature of overall-sorption pro-cess for ICeRHA system. Prado et al. (2004) have reportedqm value of 71.48 mg/g for IC adsorption on chitosan. TheReP isotherm incorporates three parameters and can beapplied to the homogenous and heterogeneous systems alike.It is noted from Table 2 that b lies between 0 and 1, indicat-ing favorable adsorption. The value of b helps in determiningthe mechanism of adsorption. If b¼ 1, the physio-sorption isthe main mechanism of adsorption of adsorbate onto adsor-bent. While b¼ 0 shows the adsorption isotherm is linear.For b ¼ 1� ð1=nÞ, the adsorption is more heterogeneous innature. Also, we can notice from Table 2 that the value ofb lies closer to ½1� ð1=nÞ� as compared to one, therefore,the adsorption of IC dye onto RHA is more heterogeneousin nature. The R2 values for ReP and Freundlich isothermsare closer to unity in comparison to the values obtained forother isotherms (Table 2). Similarly, the values of theMPSD error function are lowest for ReP and Freundlichisotherms. Therefore, anyone of the ReP and Freundlich iso-therm could be used to represent the equilibrium adsorptionof IC on RHA at all temperatures. Fig. 9 presents how wellthe five equations fit the data for ICeRHA system at 303 K.
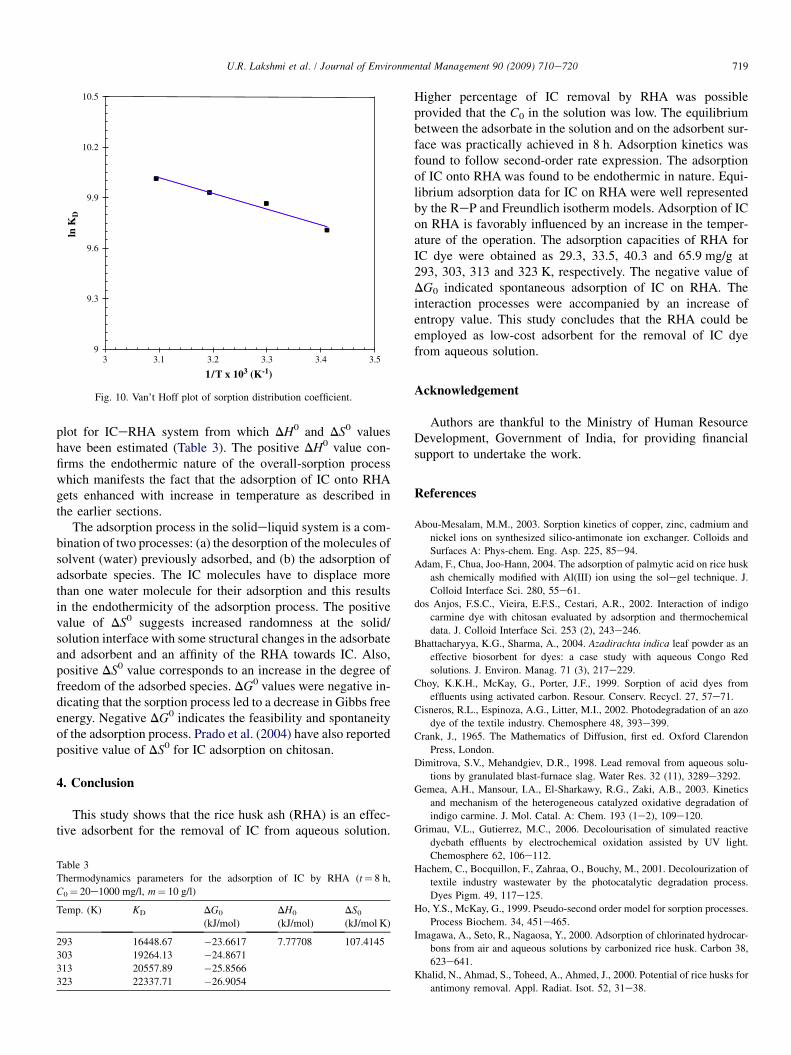
3.7. Thermodynamic study
The Gibbs free energy change of the adsorption process isrelated to the equilibrium constant by the classical Van’t Hoffequation
DG0 ¼�RT ln KD ð8ÞThe Gibbs free energy change is also related to the entropy
change and heat of adsorption at constant temperatureaccording to the following equation:
DG0 ¼ DH0� TDS0 ð9Þ
Combining the above two equations, one gets,
ln KD ¼�DG0
RT¼ DS0
R�DH0
R
1
Tð10Þ
where DG0 is the free energy change (kJ/mol), DH0 is thechange in enthalpy (kJ/mol), DS0 is the entropy change (J/mol K), T is the absolute temperature (K) and R is the univer-sal gas constant (8.314� 10�3 kJ/mol K); and KD ¼ ðqe=CeÞ isa single point or linear sorption distribution coefficient. Thus,DH0 is the enthalpy change (kJ/mol) which can be determinedfrom the slope of the linear Van’t Hoff plot, i.e. ln KD versus(1/T ), using the equation:
DH0 ¼�
Rd ln KD
dð1=TÞ
�ð11Þ
This DH0 corresponds to the isosteric heat of adsorption withzero surface coverage (i.e. qe¼ 0) (Suzuki and Fujii, 1982).DH0 value provides a direct measure of strength of bondingbetween the adsorbate and adsorbent surface. KD at qe¼ 0was obtained from the intercept of the ln(qe/Ce) versus qe
plot (Srivastava et al., 2007). Fig. 10 shows the Van’t Hoff’s
9
9.3
9.6
9.9
10.2
10.5
3 3.1 3.2 3.3 3.4 3.5
1/T x 103 (K-1)
ln K
D
Fig. 10. Van’t Hoff plot of sorption distribution coefficient.
719U.R. Lakshmi et al. / Journal of Environmental Management 90 (2009) 710e720
plot for ICeRHA system from which DH0 and DS0 valueshave been estimated (Table 3). The positive DH0 value con-firms the endothermic nature of the overall-sorption processwhich manifests the fact that the adsorption of IC onto RHAgets enhanced with increase in temperature as described inthe earlier sections.
The adsorption process in the solideliquid system is a com-bination of two processes: (a) the desorption of the molecules ofsolvent (water) previously adsorbed, and (b) the adsorption ofadsorbate species. The IC molecules have to displace morethan one water molecule for their adsorption and this resultsin the endothermicity of the adsorption process. The positivevalue of DS0 suggests increased randomness at the solid/solution interface with some structural changes in the adsorbateand adsorbent and an affinity of the RHA towards IC. Also,positive DS0 value corresponds to an increase in the degree offreedom of the adsorbed species. DG0 values were negative in-dicating that the sorption process led to a decrease in Gibbs freeenergy. Negative DG0 indicates the feasibility and spontaneityof the adsorption process. Prado et al. (2004) have also reportedpositive value of DS0 for IC adsorption on chitosan.
4. Conclusion
This study shows that the rice husk ash (RHA) is an effec-tive adsorbent for the removal of IC from aqueous solution.
Table 3
Thermodynamics parameters for the adsorption of IC by RHA (t¼ 8 h,
C0¼ 20e1000 mg/l, m¼ 10 g/l)
Temp. (K) KD DG0
(kJ/mol)
DH0
(kJ/mol)
DS0
(kJ/mol K)
293 16448.67 �23.6617 7.77708 107.4145
303 19264.13 �24.8671
313 20557.89 �25.8566
323 22337.71 �26.9054
Higher percentage of IC removal by RHA was possibleprovided that the C0 in the solution was low. The equilibriumbetween the adsorbate in the solution and on the adsorbent sur-face was practically achieved in 8 h. Adsorption kinetics wasfound to follow second-order rate expression. The adsorptionof IC onto RHA was found to be endothermic in nature. Equi-librium adsorption data for IC on RHA were well representedby the ReP and Freundlich isotherm models. Adsorption of ICon RHA is favorably influenced by an increase in the temper-ature of the operation. The adsorption capacities of RHA forIC dye were obtained as 29.3, 33.5, 40.3 and 65.9 mg/g at293, 303, 313 and 323 K, respectively. The negative value ofDG0 indicated spontaneous adsorption of IC on RHA. Theinteraction processes were accompanied by an increase ofentropy value. This study concludes that the RHA could beemployed as low-cost adsorbent for the removal of IC dyefrom aqueous solution.
Acknowledgement
Authors are thankful to the Ministry of Human ResourceDevelopment, Government of India, for providing financialsupport to undertake the work.
References
Abou-Mesalam, M.M., 2003. Sorption kinetics of copper, zinc, cadmium and
nickel ions on synthesized silico-antimonate ion exchanger. Colloids and
Surfaces A: Phys-chem. Eng. Asp. 225, 85e94.
Adam, F., Chua, Joo-Hann, 2004. The adsorption of palmytic acid on rice husk
ash chemically modified with Al(III) ion using the solegel technique. J.
Colloid Interface Sci. 280, 55e61.
dos Anjos, F.S.C., Vieira, E.F.S., Cestari, A.R., 2002. Interaction of indigo
carmine dye with chitosan evaluated by adsorption and thermochemical
data. J. Colloid Interface Sci. 253 (2), 243e246.
Bhattacharyya, K.G., Sharma, A., 2004. Azadirachta indica leaf powder as an
effective biosorbent for dyes: a case study with aqueous Congo Red
solutions. J. Environ. Manag. 71 (3), 217e229.
Choy, K.K.H., McKay, G., Porter, J.F., 1999. Sorption of acid dyes from
effluents using activated carbon. Resour. Conserv. Recycl. 27, 57e71.
Cisneros, R.L., Espinoza, A.G., Litter, M.I., 2002. Photodegradation of an azo
dye of the textile industry. Chemosphere 48, 393e399.
Crank, J., 1965. The Mathematics of Diffusion, first ed. Oxford Clarendon
Press, London.
Dimitrova, S.V., Mehandgiev, D.R., 1998. Lead removal from aqueous solu-
tions by granulated blast-furnace slag. Water Res. 32 (11), 3289e3292.
Gemea, A.H., Mansour, I.A., El-Sharkawy, R.G., Zaki, A.B., 2003. Kinetics
and mechanism of the heterogeneous catalyzed oxidative degradation of
indigo carmine. J. Mol. Catal. A: Chem. 193 (1e2), 109e120.
Grimau, V.L., Gutierrez, M.C., 2006. Decolourisation of simulated reactive
dyebath effluents by electrochemical oxidation assisted by UV light.
Chemosphere 62, 106e112.
Hachem, C., Bocquillon, F., Zahraa, O., Bouchy, M., 2001. Decolourization of
textile industry wastewater by the photocatalytic degradation process.
Dyes Pigm. 49, 117e125.
Ho, Y.S., McKay, G., 1999. Pseudo-second order model for sorption processes.
Process Biochem. 34, 451e465.
Imagawa, A., Seto, R., Nagaosa, Y., 2000. Adsorption of chlorinated hydrocar-
bons from air and aqueous solutions by carbonized rice husk. Carbon 38,
623e641.
Khalid, N., Ahmad, S., Toheed, A., Ahmed, J., 2000. Potential of rice husks for
antimony removal. Appl. Radiat. Isot. 52, 31e38.
720 U.R. Lakshmi et al. / Journal of Environmental Management 90 (2009) 710e720
Kumar, U., Bandyopadhyay, M., 2006. Fixed bed column study for Cd(II)
removal from wastewater using treated rice husk. J. Hazard. Mater.
B129, 253e259.
Kwon, J.S., Yun, S.T., Kim, S.O., Hutcheon, B.M.I., 2005. Sorption of Zn(II)
in aqueous solutions by scoria. Chemosphere 60 (10), 1416e1426.
Laszlo, J.A., 1996. Preparing an ion exchange resin from sugarcane bagasse to
remove reactive dye from wastewater. Text. Chem. Colorist 28 (5), 13e17.
Mane, V., Mall, I.D., Srivastava, V.C., 2007. Kinetic and equilibrium isotherm
studies for the adsorptive removal of brilliant green dye from aqueous
solution by rice husk ash. J. Environ. Manag. 84, 390e400.
Marquardt, D.W., 1963. An algorithm for least-squares estimation of nonlinear
parameters. J. Soc. Ind. Appl. Math. 11, 431e441.
Mittal, A., Mittal, J., Kurup, L., 2006. Batch and bulk removal of hazardous
dye, indigo carmine from wastewater through adsorption. J. Hazard. Mater.
137 (1), 591e602.
Nakbanpote, W., Thiraveetyan, P., Kalambaheti, C., 2000. Preconcentration of
gold by rice husk ash. Miner. Eng. 13 (4), 391e400.
Namasivayam, C., Kavitha, D., 2002. Removal of Congo red from water by
adsorption onto activated carbon prepared from coir pith, an agricultural
solid waste. Dyes Pigm. 54, 47e58.
Othman, I., Mohamed, R.M., Ibrahim, I.A., Mohamed, M.M., 2006. Synthesis
and modification of ZSM-5 with manganese and lanthanum and their
effects on decolorization of indigo carmine dye. Appl. Catal. A: Gen.
299, 95e102.
Porter, J.F., McKay, G., Choy, K.H., 1999. The prediction of sorption from
a binary mixture of acidic dyes using single- and mixed-isotherm variants
of the ideal adsorbed solute theory. Chem. Eng. Sci. 54 (24), 5863e5885.
Prado, A.G.S., Miranda, B.S., Jacintho, G.V.M., 2003. Interaction of indigo
carmine dye with silica modified with humic acids at solid/liquid interface.
Surf. Sci. 542 (3), 276e282.
Prado, A.G.S., Torres, J.D., Faria, E.A., Dias, S.C.L., 2004. Comparative
adsorption studies of indigo carmine dye on chitin and chitosan. J. Colloid
Interface Sci. 277 (1), 43e47.
Rahman, I.A., Saad, B., Shaidan, S., Sya Rizal, E.S., 2005. Adsorption
characteristics of malachite green on activated carbon derived from rice
husks produced by chemicalethermal process. Bioresour. Technol. 96,
1578e1583.
Redlich, O., Peterson, D.L., 1959. A useful adsorption isotherm. J. Phys.
Chem. 63, 1024e1026.
Ricordel, S., Taha, S., Cisse, I., Dorange, G., 2001. Heavy metals removal by
adsorption onto peanut husks carbon: characterization, kinetic study and
modeling. Sep. Purif. Technol. 24, 389e401.
Srivastava, V.C., Mall, I.D., Mishra, I.M., 2006a. Characterization of mesopo-
rous rice husk ash (RHA) and adsorption kinetics of metal ions from
aqueous solution onto RHA. J. Hazard. Mater B134, 257e267.
Srivastava, V.C., Swamy, M.M., Mall, I.D., Prasad, B., Mishra, I.M., 2006b.
Adsorptive removal of phenol by bagasse fly ash and activated carbon:
equilibrium, kinetics and thermodynamics. Colloid Surface A: Phys-
chem. Eng. Asp. 272, 89e104.
Srivastava, V.C., Mall, I.D., Mishra, I.M., 2006c. Modelling individual and
competitive adsorption of cadmium(II) and zinc(II) metal ions from
aqueous solution onto bagasse fly ash. Sep. Sci. Technol. 41, 2685e2710.
Srivastava, V.C., Mall, I.D., Mishra, I.M., 2007. Adsorption thermodynamics
and isosteric heat of adsorption of toxic metal ions onto bagasse fly ash
(BFA) and rice husk ash (RHA). Chem. Eng. J. 132 (1e3), 267e278.
Suzuki, M., Fujii, T., 1982. Concentration dependence of surface diffusion
coefficient of propionic acid in activated carbon particles. AIChE J. 28,
380e385.
Temkin, M.I., Pyzhev, V., 1940. Kinetics of ammonia synthesis on promoted
iron catalysts. Acta Physiochim. URSS 12, 327e356.
Weng, C.H., 2002. Adsorption characteristics of new coccine dye on to sludge
ash. Adsorp. Sci. Technol. 20 (7), 669e681.
Weng, C.H., Pan, Y.F., 2006. Adsorption characteristics of methyleneblue from
aqueous solution by sludge ash. Colloid Surface A: Phys-chem. Eng. Asp.
274, 154e162.
Weber Jr., W.J., Morris, J.C., 1963. Kinetics of adsorption on carbon from
solution. J. Sanit. Eng. Div. ASCE 89 (SA2), 31e59.
Wu, F.C., Tseng, R.L., Juang, R.S., 2000. Comparative adsorption of metal and
dye on flake-and bead-types of chitosans prepared from fishery wastes. J.
Hazard. Mater. B73, 63e75.
Related Documents